enhancing the voltage profile of 330 kv nigeria
TRANSCRIPT

e-ISSN: 2582-5208 International Research Journal of Modernization in Engineering Technology and Science
Volume:02/Issue:12/December -2020 Impact Factor- 5.354 www.irjmets.com
www.irjmets.com @International Research Journal of Modernization in Engineering, Technology and Science
[1099]
ENHANCING THE VOLTAGE PROFILE OF 330 KV NIGERIA TRANSMISSION
NETWORK SYSTEMS
Anyanor, K. I. *1, Atuchukwu, A. J *2, Okonkwo, I. I.*3
*1 PG Scholar, Dept. of Electrical/Electronic Engineering, Chukwuemeka Odumegwu Ojukwu
University, Uli, Nigeria.
*2 Associate - Professor, Dept. of Electrical/Electronic Engineering, Chukwuemeka Odumegwu
Ojukwu University, Uli, Nigeria
*3 Lecturer, Dept. of Electrical/Electronic Engineering, Chukwuemeka Odumegwu Ojukwu University,
Uli, Nigeria.
ABSTRACT
The research studied the enhancement of the bus voltage profile of 54 buses, 330kV Nigeria transmission
network system using Static Synchronous Compensator (STATCOM). Industrial development and population
increase have led to Nigeria power generation not being able to meet up with requisite reactive power
demands and these have resulted in bus voltage violation in some parts of the Nigeria national grid system.
This research solved the problem of low bus voltages in study system using STATCOM, as it is a very easy,
cheaper and fast way of injecting reactive power system. The simulation of study system was done in power
system tool (PSAT) in Matlab environment. The optimum position placement for STATCOM was identified as
Maiduguri using special method of combining voltage stability indices to select the candidate buses for ultimate
optimal weak bus identification. The research identified eight (8) voltage violated buses whose were Kano
0.9381 pu, Jos 0.9452 pu, Gombe 0.9272 pu, Damaturu 0.9262 pu, Yola 0.9302 pu, Jalingo 0.09291 pu, Makurdi
0.9457 pu and Maiduguri 0.9182 pu, and upon insertion of STATCOM all these violated bus voltages rose to
statutory level of between 0.95 to 1.05 pu. These results showed that STATCOM could inject reactive power.
Keywords: Bus voltage, reactive power, simulation, transmission and STATCOM.
I. INTRODUCTION
The transmission system worldwide are undergoing continuous changes and restructuring because of
exponential increase in the electricity demand and competition in energy market. This has led to the line
becoming more heavily loaded and as such, the power transmission systems have been facing many problems
like voltage deviations, increase in line losses and transmission line congestion. This may led to loss of voltage
stability and reduction of the power system efficiency. The voltage deviation due to load variation, reactive
power unbalances and power transfer limitation has drawn attention for better use of the existing line. The
continual increase in demand for electric energy with its associated problems if unmonitored and controlled
may also led to overload of some lines located in some paths. Due to the overloaded conditions, the
transmission line may be driven close to or even beyond their power transfer capabilities.
Technically, the limitation on power transfer capacity on a transmission line may be removed by addition of
new transmission capacity, but the economic, political and environmental considerations in building of new
transmission facilities have made this option not always desirable. Therefore, there is every need for power
compensation of the existing 330kv Nigerian power system for efficient power delivery. Compensation is the
utilization of reactive power to improve voltage profile and power factor and reduce power losses. Load
compensation thus refers to improving power quality of which there are many ways to achieve that can result
in enhancement of electric power transmission efficiency.
Several methods which could be used to enhance the performances of transmission lines according to which
include [1]: Installation of New Transmission Line, Reconductoring Transmission Line/Terminal Equipment
Replacements, Voltage Upgrade, Conversion from single circuit to double circuit, Phase Shifting and Reactive
Power Compensation.
Installation of New Transmission Line is usually the first option that comes to mind whenever a transmission
line is limited for power it can transmit, is to alleviate overloading by providing additional paths for power flow.

e-ISSN: 2582-5208 International Research Journal of Modernization in Engineering Technology and Science
Volume:02/Issue:12/December -2020 Impact Factor- 5.354 www.irjmets.com
www.irjmets.com @International Research Journal of Modernization in Engineering, Technology and Science
[1100]
It is beneficial by increasing the reliability of the transmission system. However, it has to pass through
economic, political and environmental hurdles.
A line can be re-conductored with a larger conductor with more power-carrying capability if the original
transmission line conductor is inadequate to carry expected power flows, provided that the transmission line
towers do not need to be significantly altered to support the heavier conductor. In addition, some terminal
equipment may need to be upgraded to match the desired rating. The main advantages of reconfiguration are
service restoration during feeder faults, network maintenance through outages planning, network overload
relief, bus voltage improvement, and loss minimization.
Another option is to increase the operating voltage of the transmission line, such as upgrading the voltage from
132 kV to 330 kV. In this instance, for example, the nominal rating of the line maybe drastically increased while
using the same conductor. This type of improvement may require upgrading the transmission towers to meet
National Electric Safety Code (NESC) clearance levels. In addition, the switching stations and substations must
also be upgraded with higher voltage circuit breakers, switches, transformers, and other related equipment.
Addition of reactive power compensation devices (especially Flexible Alternating Current Transmission System
(FACTS) devices) in the form of series compensation, shunt compensation or the combination of the two,
(depending on the nature of the line and its identified deficiency and the need) to the transmission line is also
another means of enhancing the performances of a transmission line. The addition of compensation modifies
the electrical impedance of the line and therefore increases the power flows across the line, minimizes power
loss along the line, increase voltage profile and voltage stability. This can be an effective and economical means
of increasing the transmission capability as a whole when transmission lines that are not loaded to their
thermal limits.
The term Flexible Alternating Current Transmission System (FACTS) devices describes a wide range of high
voltage, large power electronic converters that can increase the flexibility of power systems to enhance AC
system controllability, stability and increase power transfer capability. FACTS devices stabilize transmission
systems with increased transfer capability and reduced risk of line trips. Other benefits attributed to FACTS
devices are additional energy sales due to increased transmission capability, reduced wheeling charges due to
increased transmission capability and due to delay in investment of high voltage transmission lines or even
new power generation facilities. These devices stabilize transmission systems with increased transfer
capability and reduced risk of line trips [2]. The major problem in power system is upholding steady acceptable
system parameters like bus voltage, reactive power and active power under normal operating and anomalous
conditions. This is usually system regulation problem and regaining synchronism after a major fault is critical
for this phenomenon. Faults can cause loss of synchronism. System disturbances have led to the introduction of
FACTS devices such as Voltage Sourced Converter (VSC), Static Synchronous Series Compensator (SSSC), Static
Synchronous Compensator (STATCOM), Unified Power Flow Controller (UPFC) and Interline Power Flow
Controller (IPFC) [3 – 4]. In stable power systems, when synchronous machines are disturbed, synchronism will
either go back to their original state if there is no net change of power or will reach a new state without loss of
synchronism and when there is net change in power; synchronism is lost [5]. In power system practice and
taking Nigeria as an example, there exist parameter uncertainty problems in the plant modeling and since it is
large, complex, geographically widely distributed, and may be affected by unexpected events, the conventional
controllers often perform satisfactorily over a rather limited range of operation. These reasons also make
global control very difficult.
Application of STATCOM to enhance Nigerian330kV transmission system has been attempted by several
researchers using different bus systems [6 – 9]. Nigerian 28-bus system were investigated in [6, 8, 9], while in
[7] the Nigerian North-East 330kV transmission line was used as test case system and [10] researched on 32-
bus system. This paper proposes using STATCOM to improve the voltage profile of 54-bus system of Nigeria
330kVnetwork.
a) Static Synchronous Compensator (STATCOM)
Static synchronous compensators (STATCOM) are a solution for voltage regulation by controlling and supplying
the reactive power at the load connection point [11]. The STATCOM is a FACTS controller based on voltage
sourced converter (VSC). A VSC generate a synchronous voltage of fundamental frequency, controllable

e-ISSN: 2582-5208 International Research Journal of Modernization in Engineering Technology and Science
Volume:02/Issue:12/December -2020 Impact Factor- 5.354 www.irjmets.com
www.irjmets.com @International Research Journal of Modernization in Engineering, Technology and Science
[1101]
magnitude and phase angle. If a VSC is shunt-connected to a system via a coupling transformer, the resulting
STATCOM can inject or absorb reactive power to or from the bus to which it is connected and thus regulates the
bus voltage magnitude [12]. This STATCOM model is known as power injection model (PM) or Voltage Source
Model (VSM).
II. MODELING OF POWER FLOW IN TRANSMISSION LINE
Consider an electrical transmission system with n – buses shown in figure 1.
If the current flowing in bus i-th term is given by
Fig.-1: A simplified i – th bus model of a power system
(1)
Equation (1) can be expressed as
∑ (2)
The expression for the complex is given in [13 – 14] as
(3)
Where Si = apparent power injected at bus i
Pi = real power injected at bus i
Qi = reactive power injected at bus i
= complex conjugate of bus i power
From equation (1) and (2) we
∑
, (4)
Solving for in equation (4) we obtain
[
∑
], (5)
Also, by decoupling equation (4) into real and imaginary parts and expressing the components parts in polar
form, we obtain equations
∑
(6)
Thus ∑
= real ∑
∑
(7)
And also ∑
= imaginary ∑
(8)
∑
(9)

e-ISSN: 2582-5208 International Research Journal of Modernization in Engineering Technology and Science
Volume:02/Issue:12/December -2020 Impact Factor- 5.354 www.irjmets.com
www.irjmets.com @International Research Journal of Modernization in Engineering, Technology and Science
[1102]
For i =2, 3, 4…n because 1 is slack bus
[
] [
] [
] (10)
Now the linear equation in polar from becomes
Where J1, J2, J3 and J4 are the element of Jacobian matrix and can be determined from power equations (7) and
(9) as follows:
The off-diagonal and diagonal elements of J1 are
(11)
∑
(12)
The off diagonal and diagonal elements of J2 are
(13)
∑
(14)
The off diagonal and diagonal elements of J2 are
(15)
∑
(16)
The off diagonal and diagonal elements of J4 are
(17)
∑
(18)
The elements of Jacobian matrix are computed with the latest voltage estimate and computed
power. Hence, the objective of any load-flow analysis is to produce the voltage magnitude and phase angle at
each bus, reactive and reactive power flowing in each element and reactive power loading on each generators.
a) Solution to Load Flow Equations
The power flow problem may be solved by using Newton-Raphson. Among the numerous
solution methods available for power flow analysis, the Newton-Raphson method is
considered to be the most sophisticated and important.
Gauss-Seidel (G-S) is a simple iterative method of solving n number load flow equations by
iterative method. It does not require partial derivatives. Newton-Raphson method is based on
Taylor’s series and partial derivatives.
Convergence can be considerably speeded up by performing the first iteration through the G-S method and using
the values of voltages so obtained for starting the N-R iterations. These voltages are used to compute active
power P at every bus except the swing bus and also reactive power Q wherever reactive power is specified.
The difference between the specified and calculated values is used to determine the correction of bus
voltages. The process of iteration is continued till the difference in the specified and calculated values of P, Q
and V are within the given permissible limit.
III. OPTIMAL PLACEMENT OF SHUNT FACTS DEVICES
For optimal loss minimization and voltage improvement, the fact device must be placed in optimal position that
will realize such aim. Nodal voltage stability indices and special indices may be applied in predicting the
optimal position of shunt FACTS devices. Some of these indices are dicussed as follows.
a) Nodal voltage indices
Some of the nodal voltage indices are presented as follows,

e-ISSN: 2582-5208 International Research Journal of Modernization in Engineering Technology and Science
Volume:02/Issue:12/December -2020 Impact Factor- 5.354 www.irjmets.com
www.irjmets.com @International Research Journal of Modernization in Engineering, Technology and Science
[1103]
1. Predicting the Voltage Collapse Index (V/Vo)
In [15] a simple (V/Vo) index is proposed. Voltage magnitude (V) is obtained from the load flow for the
operating point of the system. Here, Vo (no load voltage) is a new value at the system no load condition. This
index indicates an overall picture of a power system’s stability state. The smallest index value indicates the
most sensitive (weak) bus in a system. This index can be used for online applications. With respect to change in
loading parameters, this index shows a nonlinear profile. The V/Vo index may be poor in terms of its
computational cost, accuracy of collapse point prediction, and adequacy in nonlinear performances.
2. Voltage Deviation Index (VDI)
In [16] this index defines an absolute value of bus voltage deviation compared to 1 per unit. This index is
generalized in terms of an N-bus system based on the sum of N voltage deviations, calculated separately for
each bus in all systems as given in Equation (19), and generalized in Equation (20):
| | (19)
∑ | | (20)
where N is the number of buses under study and Vj is the target value for index calculation.
3. Continuation Power Flow Method
The computation of the PV and QV curves based on system by varying the loading parameter λ may be able to
predict the voltage sability limit however, this approach fails when the set of parameterized power flow
equations approaches its bifurcation point. Thus, voltage collapse is associated with fold bifurcations resulting
from a loss of stability in the parameterized nonlinear equations. At the voltage stability limit the Jacobian
matrix of the set of parameterized power flow equations becomes singular. The continuation power flow
analysis overcomes this problem by reformulating the power flow equations so that they remain well-
conditioned at all possible loading points.
Continuation load flow analysis suitably modifies conventional load flow equations to become stable also in the
singular point of the V-P curve and therefore to be capable to calculate both upper and lower part of the V-P
curve [17]. Continuation power flow finds successive load flow solutions according to a load scenario. For this,
it uses the two-step predictor/corrector algorithms along with single new unknown state variable (so-called
continuation parameter). The predictor estimates approximate state variable values in the new step (close to
the V-P curve) while the corrector makes the corrections of new state variable values to suit the load flow
equations. Moreover, the corrector step then determines the exact solution using Newton-Raphson technique
employed by a conventional power flow. After that, a new prediction is made for a specified increase in load
based upon the new tangent vector. Then corrector step is applied. This process goes until critical point is
reached. The critical point is the point where the tangent vector is zero.
4. Modal Analysis
Gao et al [18] proposed a method that computes the smallest eigenvalue and associated eigenvectors of the
reduced Jacobian matrix of the power system based on the steady state system model. The eigenvalues are
associated with a mode of voltage and reactive power variation. If all the eigenvalues are positive, the system is
considered to be voltage stable. If one of the eigenvalues is negative, the system is considered to be voltage
unstable. A zero eigenvalue of the reduced Jacobian matrix means that the system is on the border of voltage
instability. The potential voltage collapse situation of a stable system can be predicted through the evaluation of
the minimum positive eigenvalues. The magnitude of each minimum eigenvalue provides a measure to know
how close the system is to voltage collapse. By using the bus participation factor, the weakest bus can be
determined, which is the greatest contributing factor for a system to reach voltage collapse situation.
5. P-V and Q-V Curves
In static voltage stability, slowly developing changes in the power system occur that eventually lead to a
shortage of reactive power and declining voltage [19]. This phenomenon can be observed by a plot of real
power transferred versus receiving end voltage (P-V curve). The P-V curves are the most used method of
predicting voltage security. They are used to determine the loading margin of a power system. The power
system load is gradually increased and, at each increment, is necessary to recompute power flows until the nose

e-ISSN: 2582-5208 International Research Journal of Modernization in Engineering Technology and Science
Volume:02/Issue:12/December -2020 Impact Factor- 5.354 www.irjmets.com
www.irjmets.com @International Research Journal of Modernization in Engineering, Technology and Science
[1104]
of the PV curve is reached. The margin between the voltage collapse point and the current operating point is
used as voltage stability criterion [20].
With Q-V curve is possible, for the operators to know the maximum reactive power that can be achieved or
added to the weakest bus before reaching minimum voltage limit. The reactive power margin is the MVar
distance from the operating point to the bottom of the Q-V curve. The Q-V curve can be used as an index for
voltage instability. The point where dQ/dV is zero is the point of voltage stability limit [21].
IV. PERFORMANCE EVALUATION INDICES
The performance evaluation indices used in this research to access the performances of STATCOM in the
candidature position for bus voltage profile improvement and thereby predicting the optimal positions
placement for these FACTS. The evaluation indices used is the voltage evaluation index .
a) Voltage evaluation index (VI)
The voltage evaluation index was used to determine the deviation of the bus voltage from the target. The
voltage evaluation index were given in [22] as,
∑ ( )
(21)
Where is the desired voltage value at the bus (usually 1 pu) and is the bus voltage upon the insertion of
facts devices.
V. METHODOLOGY
The methods used in achieving voltage profile enhancement were in the following steps,
1. Characterizing and modeling the 54 buses, 330 kV Nigeria transmission system for load flow simulation
2. Identifying the weak buses of the system using load flow method.
3. Use at least three voltage indices to rank the position of STATCOM for optimal voltage profile improvement
using. From the three-ranked bus voltage indices select five (5) candidate buses that will be investigated
for ultimate optimum bus position for STATCOM placement. The details of candidate buses selection are
presented in section V. a..
4. Model FACTS devices (STATCOM) and simulate the study system by inserting the facts devices in
appropriate candidature positions as realized in step 3 using load flow method.
5. Realize the optimum position STATCOM for voltage profile improvement using voltage evaluation index of
section IV.
6. Analyze all the result/ performance of STATCOM in its optimal positions of step 4 and step 5 and conclude.
a) Criteria and Methodology for STATCOM Placement for Bus Voltage Profile Enhancement
The STATCOM is shunt device that its optimum placement in power system network for bus voltage profile
improvement depends on the bus voltage stability indices. The optimum placement of STATCOM for
voltage profile enhancement is as follows;
1 Perform line voltage sensitivity indices using continuation power flow (CPF), Voltage deviation index
(VDI) and Predicting the Voltage Collapse Index (V/Vo). Rank the results of the simulation bus
sensitivity indices according to their vulnerability to voltage collapse ranking.
2 Select five (5) vulnerable buses to voltage collapse from the ranked indices of step one (1) above with
the following criteria.
(i) Form the top rank vulnerable buses of the three voltage sensitivity indices simulated; select the
three buses as the candidate buses for optimum placement investigation if the three buses are
different. If two of these buses are the same then, two candidate buses are selected the common bus
and the one that is different, if the three most ranked buses of the simulated three voltage
sensitivity indices are the same, then one bus is selected.
(ii) The procedure of step 2(i) is repeated to select more candidate buses for optimum placement
investigation until five (5) candidate buses are completed; otherwise the next ranking is examined.

e-ISSN: 2582-5208 International Research Journal of Modernization in Engineering Technology and Science
Volume:02/Issue:12/December -2020 Impact Factor- 5.354 www.irjmets.com
www.irjmets.com @International Research Journal of Modernization in Engineering, Technology and Science
[1105]
VI. RESEARCH SYSTEM MATERIALS
The research, technical losses mitigation of Nigeria transmission system is carried on 54 buses 330kV Nigeria
transmission system. The single line diagram of the case study is show in figure 2, while the 54 busses of this
study system are listed in table 1.
The input data for the research system which are; Generators output power, maximum and minimum reactive
power limit of the generator, MW and MVAR peak loads, Impedance of the lines, transmission line sizes, voltage
and power ratings of the lines, the nominal and critical voltages of each of the buses are all shown in tables 2
and table 3.
line sizes are shown in table 3.
Fig.-2: One-line diagram of the improved 54-bus, 330kV Nigerian transmission network
Table-1: Bus Names of the 54 buses, 330 kV Nigeria Integrated Network
Bus Number Bus Name Bus Number Bus Name Bus Number Bus Name
1 Birini-Kebbi 19 Geregu 37 AES
2 Kanji 20 Omotosho 38 Okpai
3 Kaduna 21 New haven 39 Papalanto
4 Kano 22 New Haven South 40 Sapele
5 Gombe 23 Onitsha 41 Delta PS
6 Damaturu 24 Benin 42 Aladja
7 Maiduguri 25 Owerri 43 Afam
8 Yola 26 Egbema 44 Ikot-Abasi
9 Jos 27 Omoku 45 Port Harcourt
10 Shiroro 28 Aiyede 46 Alaoji
11 Jebba TX 29 Erunkan 47 Benin North
12 Jebba GS 30 Jalingo 48 Makurdi
Kaduna TSKano TSKanji GSB-Kebbi TS
Jebba TS Gwagwalada TS lokoja TSJebba GS shiroro GS
Ayede TS Oshogbo TS Ganmo TS Katempe Ts Ajokuta TS
Geregu GS
Omotosho GS Okpai GS
Onitsha TSBenin TS
Ikeja west TS Delta GS
Sapele TSSakete TS
Akangba TS Erunkan TS
Aja TS Egbin GS AES GS Alaja TS
Eyean
Benin North
Alaoji GSAfam GS
G G
G G
Ihovbor NIPP
G
G
G
G
G
G
G
G
G
G
N. Haven TS New Haven South
Maiduguri TSDamaturu TSGombe TSJos TS
Yola TSMakurdi TS
G
Lekki TS
Alagbon TS
Port Harcourt GS
G
Egbema GS
Owerri
Omoku GS
Ikot Abasi Calabar
Ikot Ekpene
G
G
G
Aliade
Jalingo TS
Papalanto

e-ISSN: 2582-5208 International Research Journal of Modernization in Engineering Technology and Science
Volume:02/Issue:12/December -2020 Impact Factor- 5.354 www.irjmets.com
www.irjmets.com @International Research Journal of Modernization in Engineering, Technology and Science
[1106]
13 Oshogbo 31 Eyean 49 Aliade
14 Ganmo 32 Akangba 50 Ikot-Ekene
15 Katampe(Abuja) 33 Ikeja west 51 Calabar
16 Gwagwalada 34 Sakete 52 Alagbon
17 Lokoja 35 Aja 53 Ihovbor
18 Ajaokuta 36 Egbin ps 54 Lekki
Table-2: Generation Data of Nigeria 54 Buses, 330 kV Transmission System Network
S/N
GENERATOR NAME
BUS
NO
OPERATING
GEN. CAP
(MW)
VOLTAGE
MAG.
(P.U.)
MVAR LIMITS
MIN. MW MAX. MW
1 KAINJI 2 292 0.970 16 158
2 SHIRORO 10 300 1 12 115
7 JEBBA 12 403 1 19 190
4 GEREGURU 19 485 0.985 22 230
5 OMOTOSHO 20 165.5 I.006 7 73
3 EGBEMA 26 250 1 15 140
6 OMOKU 27 44.8 1 2 20
8 EGBIN 36 513 1.033 0 0
9 AES 37 245.2 1 20 195
10 OKPAI 38 466 1 20 200
11 PAPALANTO 39 204 0.973 12.4 124
12 SAPELE 40 345 1 7.9 79
13 DELTA 41 341 1.003 12 115
14 AFAM 43 720 1 51 435
15 PORT HARCOURT 45 178 1 8 77
16 ALAOJI 46 250 1 12 117
17 CALABAR 51 618 1 38 350
18 IHOVBOR (NIPP) 53 116.6 1 7 71
Table-3: List of Nigeria 54 Buses Transmission Line Parameters
No Bus Bus To Bus D(Km) Number of
circuits R (Ω) L(H) B(mho)
1 1 – 2 Birini-Kebbi – Kanji 310 Single 12.09 0.3266 1.72
2 3 – 4 Kaduna – Kano 230 Single 8.97 0.2423 1.28
3 11 – 10 Jebba TX – Shiroro 244 Single 9.516 0.2571 1.35
4 22 – 50 New Haven South – Ikot- 143 Double 6.8792 0.1684 0.50

e-ISSN: 2582-5208 International Research Journal of Modernization in Engineering Technology and Science
Volume:02/Issue:12/December -2020 Impact Factor- 5.354 www.irjmets.com
www.irjmets.com @International Research Journal of Modernization in Engineering, Technology and Science
[1107]
Ekene
5 3 – 10 Kaduna – Shiroro 95 Single 3.744 0.1011 0.53
6 10 – 16 Shiroro – Gwagwalada 144 Double 5.7521 0.1408 0.89
7 3 – 9 Kaduna – Jos 144 Single 5.7521 0.1408 0.89
8 9 – 5 Jos – Gombe 265 Single 10.296 0.2782 1.47
9 16 – 17 Gwagwalada – Lokoja 140 Double 6.8792 0.1684 1.06
10 11 – 14 Jebba TX – Ganmo 70 Single 4.2896 0.0463 0.61
11 13 – 14 Oshogbo – Ganmo 87 Single 1.8332 0.0495 0.26
12 11 – 13 Jebba TX – Oshogbo 157 Single 6.123 0.1654 0.87
13 5 – 8 Gombe – Yola 240 Single 9.36 0.2529 1.33
14 53 - 24 Ihovbor – Benin 20 Single 0.979 0.0264 0.14
15 16 – 15 Gwagwalada – Katampe 60 Single 2.8368 0.0695 0.44
16 10 – 15 Shiroro – Katampe 144 Double 8.5892 0.2103 1.32
17 17 – 18 Lokoja – Ajaokuta 38 Double 1.8676 0.0457 0.29
18 43 – 50 Afam – Ikot-Ekene 90 Double 1.4434 0.0303 0.20
19 50 – 51 Ikot-Ekene – Calabar 72 Double 4.2896 0.0463 0.28
20 18 – 19 Ajaokuta – Geregu 65 Double 0.0588 0.0018 0.00
21 21 – 23 New haven – Onitsha 96 Single 3.744 0.1011 0.53
22 5 – 6 Gombe – Damaturu 160 Single 7.0197 0.1585 1.00
23 21 – 22 New haven – New Haven
South 6.5 Double 0.2755 0.0068 0.04
24 18 – 24 Ajaokuta – Benin 195 Single 7.683 0.1881 1.18
25 13 - 53 Oshogbo – Ihorbov 231 Single 9.789 0.2645 1.39
26 52 – 35 Alagbon – Aja 21 Double 0.7024 0.019 0.78
27 24 – 20 Benin – Omotosho 110 Single 1.9889 0.0537 0.28
28 28 – 13 Aiyede – Oshogbo 119 Single 4.485 0.1212 0.64
29 6 – 7 Damaturu – Maiduguri 260 Single 10.1397 0.2739 1.44
30 33 – 29 Ikeja west – Erunkan 32 Single 0.7024 0.019 0.10
31 29 – 36 Erunkan – Egbin ps 30 Single 0.7024 0.019 0.10
32 28 – 39 Aiyede – Papalanto 60 Single 2.8368 0.0695 0.66
33 39 – 33 Papalanto – Ikeja west 30 Single 2.8368 0.009 0.78
34 28 – 33 Aiyede – Ikeja west 137 Single 5.343 0.1443 0.86
35 13 – 33 Oshogbo – Ikeja west 235 Single 9.75 0.2634 1.39
36 20 – 33 Omotosho – Ikeja west 160 Single 3.1189 0.0843 0.44
37 32 – 33 Akangba - Ikeja west 18 Single 0.6698 0.0164 0.10
38 54 - 35 Lekki – Aja 5.5 Double 0.7024 0.019 0.78
39 34 – 33 Sakete – Ikeja west 70 Single 2.73 0.0738 0.39
40 2 – 11 Kanji – Jebba TX 81 Double 4.248 0.0853 0.45
41 24 – 33 Benin – Ikeja west 280 Double 10.296 0.2782 0.60
42 35 – 36 Aja – Egbin ps 14 Double 0.546 0.0148 0.08
43 47 – 31 Benin North – Eyean 5 Double 0.3147 0.0077 0.60

e-ISSN: 2582-5208 International Research Journal of Modernization in Engineering Technology and Science
Volume:02/Issue:12/December -2020 Impact Factor- 5.354 www.irjmets.com
www.irjmets.com @International Research Journal of Modernization in Engineering, Technology and Science
[1108]
44 33 – 36 Ikeja west – E gbin ps 62 Single 0.7024 0.019 0.10
45 24 – 36 Benin – Egbin ps 218 Single 7.8 0.2107 1.11
46 36 – 37 Egbin ps – AES 9 Double 7.8 0.2107 1.11
47 12 – 11 Jebba GS – Jebba TX 8 Double 0.3147 0.0077 0.05
48 24 – 23 Benin – Onitsha 137 Single 5.343 0.1443 0.76
49 38 – 23 Okpai – Onitsha 56 Double 2.364 0.0579 0.36
50 24 – 40 Benin – Sapele 40 Double 1.97 0.0482 0.30
51 24 – 47 Benin – Benin North 20 Single 0.6698 0.0164 0.60
52 8 – 30 Yola – Jalingo 132 Single 5.343 0.1443 0.35
53 24 – 41 Benin – Delta PS 107 Single 1.599 0.0432 0.23
54 41 – 42 Delta PS – Aladja 30 Single 1.248 0.0337 0.18
55 40 – 42 Sapele – Aladja 83 Single 2.457 0.0664 0.35
56 44 – 50 Ikot-Abasi – Ikot-Ekene 75 Double 2.457 0.0664 0.46
57 43 – 45 Afam – Port Harcourt 45 Double 1.97 0.0482 0.15
58 23 – 46 Onitsha – Alaoji 138 Single 5.3821 0.1454 0.77
59 46 – 25 Alaoji – Owerri 60 Double 2.8368 0.0695 0.18
60 43 – 46 Afam – Alaoji 15 Double 0.5698 0.0241 0.14
61 9 – 48 Jos – Makurdi 275 Double 8.97 0.2423 1.32
62 49 – 22 Aliade – New Haven South 150 Double 6.123 0.1654 0.87
63 23 – 25 Onitsha – Owerri 137 Double 5.343 0.1443 0.8
64 26 – 25 Egbema – Owerri 30 Double 0.7024 0.019 0.12
65 27 – 26 Omoku – Egbema 30 Double 0.7024 0.019 0.12
66 46 – 50 Alaoji – Ikot-Ekene 38 Double 1.4434 0.0303 0.20
67 48 – 49 Makurdi – Aliade 50 Double 1.7522 0.0451 0.68
VII. THE SIMULATIONS OF 54 BUSES, 330KV NIGERIA TRANSMISSION NETWORK
The simulations of 54 buses, 330kV Nigeria transmission line were done in PAST 2.1.10 in matlab 2018a
environment. Newton – Raphson power flow method is used for the analysis. The steps in section V were also
simulated for the optimal position placement prediction of STATCOM for voltages profile enhancement. The
optimally placed of STATCOM in the study system were simulated and result recorded and analyses.
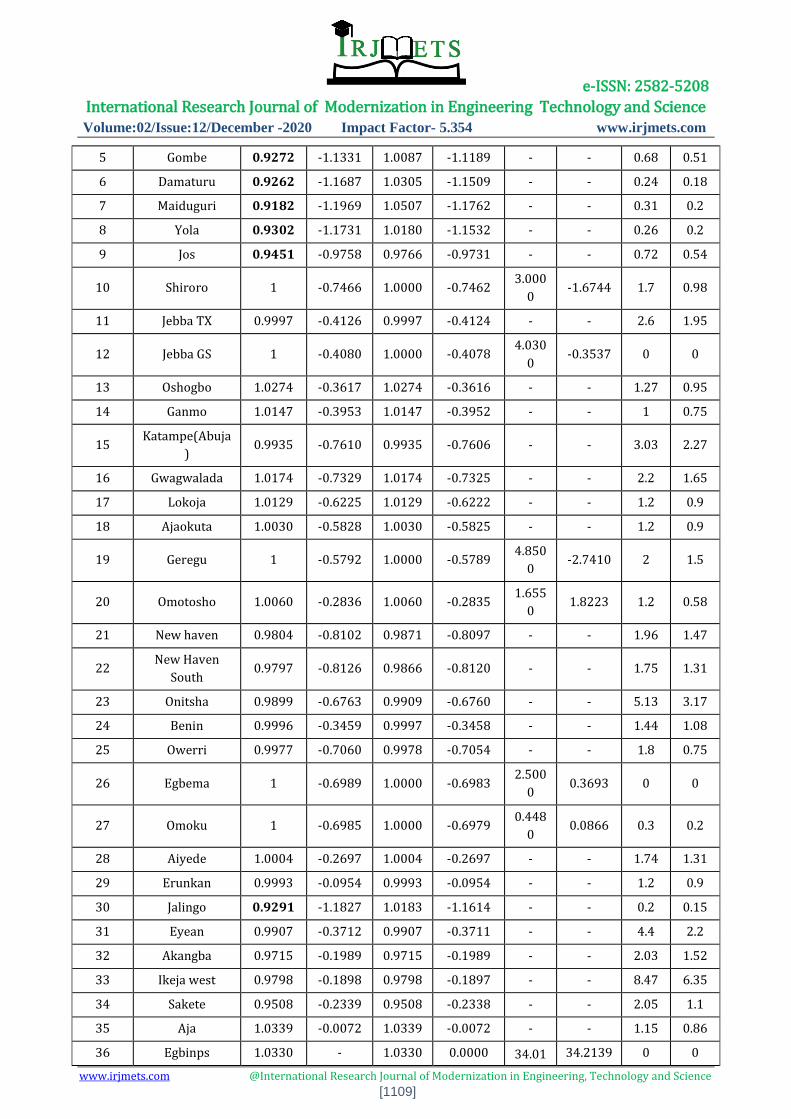
Table-4: PSAT Simulation Result of 54 Buses, 330 kV Nigeria Transmission Network
Bus
Number Bus Name
V
[p.u.]
phase
[rad]
V
[p.u.]
STATC
OM
phase
[rad]
STATCO
M
P gen
[p.u.]
Q gen
[p.u.]
P
load
[p.u.]
Q
load
[p.u.]
1 Birini-Kebbi 0.9797 -0.5694 0.9797 -0.5692 - - 1.62 1.22
2 Kanji 0.9700 -0.4030 0.9700 -0.4028 2.920
0 -4.3474 0.89 0.67
3 Kaduna 0.9793 -0.8904 0.9919 -0.8895 - - 1.43 0.98
4 Kano 0.9381 -1.0369 0.9551 -1.0319 - - 1.94 1.46
e-ISSN: 2582-5208 International Research Journal of Modernization in Engineering Technology and Science
Volume:02/Issue:12/December -2020 Impact Factor- 5.354 www.irjmets.com
www.irjmets.com @International Research Journal of Modernization in Engineering, Technology and Science
[1109]
5 Gombe 0.9272 -1.1331 1.0087 -1.1189 - - 0.68 0.51
6 Damaturu 0.9262 -1.1687 1.0305 -1.1509 - - 0.24 0.18
7 Maiduguri 0.9182 -1.1969 1.0507 -1.1762 - - 0.31 0.2
8 Yola 0.9302 -1.1731 1.0180 -1.1532 - - 0.26 0.2
9 Jos 0.9451 -0.9758 0.9766 -0.9731 - - 0.72 0.54
10 Shiroro 1 -0.7466 1.0000 -0.7462 3.000
0 -1.6744 1.7 0.98
11 Jebba TX 0.9997 -0.4126 0.9997 -0.4124 - - 2.6 1.95
12 Jebba GS 1 -0.4080 1.0000 -0.4078 4.030
0 -0.3537 0 0
13 Oshogbo 1.0274 -0.3617 1.0274 -0.3616 - - 1.27 0.95
14 Ganmo 1.0147 -0.3953 1.0147 -0.3952 - - 1 0.75
15 Katampe(Abuja
) 0.9935 -0.7610 0.9935 -0.7606 - - 3.03 2.27
16 Gwagwalada 1.0174 -0.7329 1.0174 -0.7325 - - 2.2 1.65
17 Lokoja 1.0129 -0.6225 1.0129 -0.6222 - - 1.2 0.9
18 Ajaokuta 1.0030 -0.5828 1.0030 -0.5825 - - 1.2 0.9
19 Geregu 1 -0.5792 1.0000 -0.5789 4.850
0 -2.7410 2 1.5
20 Omotosho 1.0060 -0.2836 1.0060 -0.2835 1.655
0 1.8223 1.2 0.58
21 New haven 0.9804 -0.8102 0.9871 -0.8097 - - 1.96 1.47
22 New Haven
South 0.9797 -0.8126 0.9866 -0.8120 - - 1.75 1.31
23 Onitsha 0.9899 -0.6763 0.9909 -0.6760 - - 5.13 3.17
24 Benin 0.9996 -0.3459 0.9997 -0.3458 - - 1.44 1.08
25 Owerri 0.9977 -0.7060 0.9978 -0.7054 - - 1.8 0.75
26 Egbema 1 -0.6989 1.0000 -0.6983 2.500
0 0.3693 0 0
27 Omoku 1 -0.6985 1.0000 -0.6979 0.448
0 0.0866 0.3 0.2
28 Aiyede 1.0004 -0.2697 1.0004 -0.2697 - - 1.74 1.31
29 Erunkan 0.9993 -0.0954 0.9993 -0.0954 - - 1.2 0.9
30 Jalingo 0.9291 -1.1827 1.0183 -1.1614 - - 0.2 0.15
31 Eyean 0.9907 -0.3712 0.9907 -0.3711 - - 4.4 2.2
32 Akangba 0.9715 -0.1989 0.9715 -0.1989 - - 2.03 1.52
33 Ikeja west 0.9798 -0.1898 0.9798 -0.1897 - - 8.47 6.35
34 Sakete 0.9508 -0.2339 0.9508 -0.2338 - - 2.05 1.1
35 Aja 1.0339 -0.0072 1.0339 -0.0072 - - 1.15 0.86
36 Egbinps 1.0330 - 1.0330 0.0000 34.01 34.2139 0 0

e-ISSN: 2582-5208 International Research Journal of Modernization in Engineering Technology and Science
Volume:02/Issue:12/December -2020 Impact Factor- 5.354 www.irjmets.com
www.irjmets.com @International Research Journal of Modernization in Engineering, Technology and Science
[1110]
88
37 AES 1 0.0068 1.0000 0.0068 2.452
0
-
32.1126 0 0
38 Okpai 1 -0.6378 1.0000 -0.6374 4.660
0 -0.2323 0 0
39 Papalanto 1.0030 -0.2183 1.0030 -0.2183 2.040
0 1.0643 0.71 0.58
40 Sapele 1 -0.3306 1.0000 -0.3305 3.452
0 -0.2569 1 0.77
41 Delta PS 1.0030 -0.3264 1.0030 -0.3262 3.410
0 0.6263 0 0
42 Aladja 0.9967 -0.3357 0.9967 -0.3356 - - 2.1 1.58
43 Afam 1 -0.7300 1.0000 -0.7294 7.200
0 4.1415 5.34 4.01
44 Ikot-Abasi 0.9762 -0.7514 0.9768 -0.7508 - - 2.27 1.7
45 Port Harcourt 1 -0.7453 1.0000 -0.7447 1 1.7817 3.16 1.58
46 Alaoji 1 -0.7286 1.0000 -0.7280 2.500
0 3.6216 4.67 2.7
47 Benin North 0.9931 -0.3665 0.9932 -0.3664 - - 0 0
48 Makurdi 0.9457 -0.9327 0.9647 -0.9306 - - 1.85 0.65
49 Aliade 0.9508 -0.9111 0.9673 -0.9094 - - 0.95 0.56
50 Ikot-Ekene 0.9939 -0.7307 0.9944 -0.7302 - - 1.4 0.5
51 Calabar 1 -0.6877 1.0000 -0.6870 6.180
0 -0.9702 0 0
52 Alagbon 1.0334 -0.0102 1.0334 -0.0102 - - 1.2 0.9
53 Ihovbor 1 -0.3390 1.0000 -0.3389 1.166
0 -1.9732 0 0
54 Lekki 1.0335 -0.0101 1.0335 -0.0101 - - 1.15 0.86

e-ISSN: 2582-5208 International Research Journal of Modernization in Engineering Technology and Science
Volume:02/Issue:12/December -2020 Impact Factor- 5.354 www.irjmets.com
www.irjmets.com @International Research Journal of Modernization in Engineering, Technology and Science
[1111]
Fig.-3: PSAT Simulation Model of the Study System Inserted with STATCOM in Maiduguri Substation (Bus 7)

e-ISSN: 2582-5208 International Research Journal of Modernization in Engineering Technology and Science
Volume:02/Issue:12/December -2020 Impact Factor- 5.354 www.irjmets.com
www.irjmets.com @International Research Journal of Modernization in Engineering, Technology and Science
[1112]
Fig.-4: Bar Representation of Bus Voltage without FACTS Device and with STATCOM Inserted at Maiduguri
Substation (Bus 7)
0
0.05
0.1
0.15
0.2
0.25
0.3
0.35
0.4
0.45
0.5
0.55
0.6
0.65
0.7
0.75
0.8
0.85
0.9
0.95
1
1.05
1.1
Bus1
Bus3
Bus5
Bus7
Bus9
Bus11
Bus13
Bus15
Bus17
Bus19
Bus21
Bus23
Bus25
Bus27
Bus29
Bus31
Bus33
Bus35
Bus37
Bus39
Bus41
Bus43
Bus45
Bus47
Bus49
Bus51
Bus53
Bu
s V
olt
age
Pro
file
wit
h a
nd
wit
ho
ut
STA
TCO
M
Bus Name
NO FACTS STATCOM
e-ISSN: 2582-5208 International Research Journal of Modernization in Engineering Technology and Science
Volume:02/Issue:12/December -2020 Impact Factor- 5.354 www.irjmets.com
www.irjmets.com @International Research Journal of Modernization in Engineering, Technology and Science
[1113]
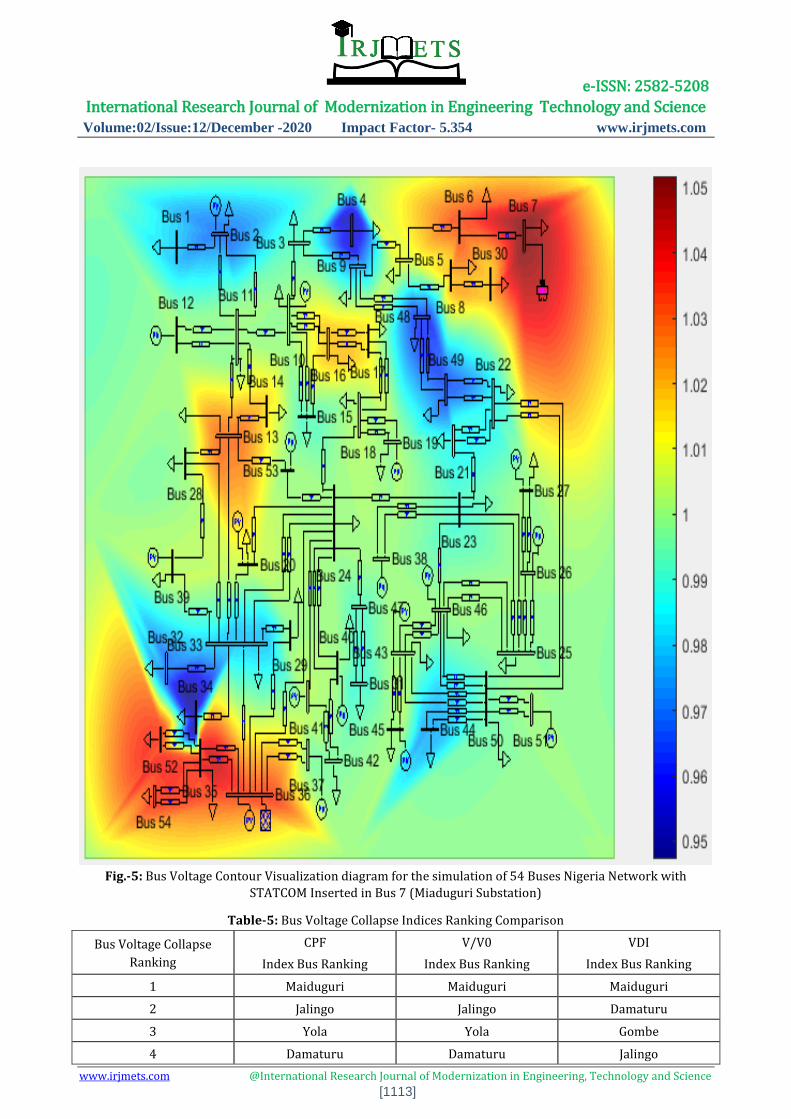
Fig.-5: Bus Voltage Contour Visualization diagram for the simulation of 54 Buses Nigeria Network with
STATCOM Inserted in Bus 7 (Miaduguri Substation)
Table-5: Bus Voltage Collapse Indices Ranking Comparison
Bus Voltage Collapse
Ranking
CPF
Index Bus Ranking
V/V0
Index Bus Ranking
VDI
Index Bus Ranking
1 Maiduguri Maiduguri Maiduguri
2 Jalingo Jalingo Damaturu
3 Yola Yola Gombe
4 Damaturu Damaturu Jalingo

e-ISSN: 2582-5208 International Research Journal of Modernization in Engineering Technology and Science
Volume:02/Issue:12/December -2020 Impact Factor- 5.354 www.irjmets.com
www.irjmets.com @International Research Journal of Modernization in Engineering, Technology and Science
[1114]
5 Gombe Gombe Yola
6 Jos Kano Kano
7 Kano Jos Jos
8 Makurdi Makurdi Makurdi
9 Aliade Birini-Kebbi Aliade
10 Kaduna Aliade Sakete
Table-6: Five (5) Candidate Buses for Investigation of Optimal Placement of STATCOM for Voltage Profile
Enhancement
Bus Candidate Choice
Number Bus Name
Voltage Evaluation Index
V0 = 0.95pu
STATCOM optimal position for Voltage
profile improvement
1 Maiduguri 0.1525
2 Jalingo 0.1506
3 Damaturu 0.1464
4 Yola 0.1498
5 Gombe 0.1393
VIII. ANALYSIS OF RESULT AND SUMMARY
The result of the simulation the 54 buses, 330 kV Nigeria network system is presented in table 4. The result
showed that the voltage violated buses were Kano 0.9381 pu, Jos 0.9452 pu, Gombe 0.9272 pu, Damaturu
0.9262 pu, Yola 0.9302 pu, Jalingo 0.09291 pu, Makurdi 0.9457 and the Maiduguri 0.9182 pu which showed to
be the weakest buses of the study system, table 4 column 3.
Three indices namely, continuation power flow (CPF), voltage deviation index (VDI), and predicting the voltage
collapse index (V/V0) were simulated (see result in table 5) that were used to make up five (5) choices of
candidate buses that would be used to evaluate the actual optimal position placement of STATCOM for voltage
profile improvement. The list of the of the selected five (5) candidate busses were shown in table 6 column 2
and the buses were Maiduguri, Jalingo, Damaturu, Yola, and Gombe. The results of the simulation of voltage
evaluation index shown in table 6 columns 3 and 4, which showed that the optimal position of the STATCOM for
voltage profile enhancement was the Maiduguri substation. The three voltage collapse indices used (CPF, VDI,
and V/V0) also agreed that the most vulnerable bus to voltage collapse is the Maiduguri substation see table 5
row 2.
When STATCOM was inserted optimally in Maiduguri bus for the voltage violation correction. The result of the
STATCOM insertion simulation was recorded in table 4 column 5 and shown diagrammatically in figure 3 to
figure 5. The result showed that all the voltage violated buses had been corrected; the extent of correction of
the bus voltages is shown in the contour network visualization diagram, see figure 5. For STATCOM
performance when STATCOM was inserted in Maiduguri bus. Table 4 column 3 and 5, figure 3 and figure 4
showed that the most violated bus, Maiduguri that was violated to tone of 0.9182 pu was enhanced to value of
1.05 pu.
IX. CONCLUSION
The enhancement of the voltage profile of 54 buses, 330kV Nigeria transmission network system has been
achieved with the STATCOM optimally placed at Maiduguri substation. Eight identified voltage violated buses
were cleared by insertion of STATCOM in the optimal position for voltage profile enhancement. STATCOM as a
shunt compensator showed to possess wide performance reach and had overall system voltage profile
enhancing capability. Further research recommendation is suggested on a similar research with SVC and other
shunt compensator.
X. REFERENCES [1] Ali, A. (2012). “Steady-State Performance of a New Model for UPFC Applied to Multi-Machines System
with nonlinear Load”. World Academy of Science Engineering and Technology.

e-ISSN: 2582-5208 International Research Journal of Modernization in Engineering Technology and Science
Volume:02/Issue:12/December -2020 Impact Factor- 5.354 www.irjmets.com
www.irjmets.com @International Research Journal of Modernization in Engineering, Technology and Science
[1115]
[2] Kumar, A., & Dubey, S. B. (2013). Enhancement of transient stability in transmission line using SVC
facts controller. International Journal of Recent Technology and Engineering, 2(2), 56-60.
[3] Karthik, M., & Arul, P. (2013). Optimal Power Flow Control Using FACTS Devices. International Journal
of Emerging Science and Engineering (IJESE) ISSN: 2319, 6378
[4] Makkar, C. R., & Dewan, L. (2010). Transient Stability Enhancement using Robust FACTS Controllers-A
Brief Tour. Canadian Journal on Electrical & Electronics Engineering, 1(7), 150-154.
[5] Satheesh A and Manigandan T(2013), “Maintaining power system stability with FACTS Science
Invention, vol. 3, pp. 55-59,
[6] Eseosa, O. and Odiase, F.O., (2012). Efficiency improvement of Nigeria 330kV network using flexible
alternating current transmission system (FACTS) devices. International Journal of Advances in
Engineering & Technology, 4(1), 26-41.
[7] Aribi, F., Nwohu, M. N., Sadiq, A. A., and Ambafi, J. G. (2015). Voltage profile enhancement of the
Nigerian NorthEast 330kV power network using STATCOM. International Journal of Advanced
Research in Science, Engineering and Technology, 2(1), pp. 330- 337.
[8] Aborisade, D. O., Adebayo, I. G. and Oyesina, K.A., (2014). A comparison of the voltage enhancement and
loss reduction capabilities of STATCOM and SSSC FACTS controllers. American Journal of Engineering
Research, 3(1): 96-105.
[9] Jokojeje, R. A., Adejumobi, I. A., Mustapha A. O., and Adebisi, O. I. (2015). Application of static
synchronous compensator (STATCOM) in improving power system performance: a case study of
Nigerian 330kV electricity grid. Nigerian Journal of Technology, 34(3): 564 – 572.
[10] Okakwu, I. K., Olabode, E. O., & Okundamiya, M. S. (2018). Voltage profile improvement of the Nigerian
330-kV transmission network using statcom. J. Eng. Sci. Applica, 11(1), 19-27.
[11] Stanelyte, D., & Radziukynas, V. (2019). Review of voltage and reactive power control algorithms in
electrical distribution networks. Energies, 13(1), 1-26.
[12] Venkateswarlu, C. and Sai, B, (2011). Analysis and Enhancement of Transient Stability using shunt
controlled FACTS Controler.” Internation Journal of engineering Sciences Research.
[13] Pabla, A. S. (2012). Electric power distribution. Tata McGraw-Hill Education.
[14] Gupta B.J (2009), Power, System Analysis and Design, S. Chand and Company LTD, INDIA.
[15] Hatziargyriou, N. D., & Van Cutsem, T. (1994). Indices predicting voltage collapse including dynamic
phenomena. CIGRE Task Force, 38(11).
[16] Yang, C. F., Lai, G. G., Lee, C. H., Su, C. T., & Chang, G. W. (2012). Optimal setting of reactive compensation
devices with an improved voltage stability index for voltage stability enhancement. International
Journal of Electrical Power & Energy Systems, 37(1), 50-57.
[17] Choubey, A., & Singh, G. (2016). Steady State Voltage Stability Improvement by Determination of best
Location of STATCOM with Minimum Losses. International journal of scientific research in science,
engineering and technology, IJSRSET. 2(4), 430 – 434.
[18] Gao, B., Morison, G. K., & Kundur, P. (1992). Voltage stability evaluation using modal analysis. IEEE
transactions on power systems, 7(4), 1529-1542.
[19] Chayapathi, V., Sharath, B., & Anitha, G. S. (2013). Voltage collapse mitigation by reactive power
compensation at the load side. International Journal of Research in Engineering and Technology, e-
ISSN: 2319-1163| p-ISSN: 2321, 7308.
[20] Canizares, C. A. (2002). Voltage stability assessment: concepts, practices and tools. IEEE/PES power
system stability subcommittee special publication, (SP101PSS).
[21] Kundur, P (1994). Power system stability and control (Vol. 7). New York: McGraw-hill.
[22] Phanikumar, M. S. V., & Rao, P. K. (2016). Comparison of voltage stability and loss reduction by Modal
analysis and Sensitivity methods. Journal of electrical engineering, 16.