entrepreneurial ecosystems elements - uu
TRANSCRIPT
Entrepreneurial Ecosystems Elements
Erik StamAndrew van de Ven
Working Paper Series nr: 19-07

Utrecht University School of Economics (U.S.E.) is part of the faculty of Law, Economics and Governance at Utrecht University. The U.S.E. Research Institute focuses on high quality research in economics and business, with special attention to a multidisciplinary approach. In the working papers series the U.S.E. Research Institute publishes preliminary results of ongoing research for early dissemination, to enhance discussion with the academic community and with society at large.
The research findings reported in this paper are the result of the independent research of the author(s) and do not necessarily reflect the position of U.S.E. or Utrecht University in general.
U.S.E. Research Institute Kriekenpitplein 21-22, 3584 EC Utrecht, The
Netherlands Tel: +31 30 253 9800, e-mail: [email protected] www.uu.nl/use/research
U.S.E. Research Institute Working Paper Series 19-07
Entrepreneurial Ecosystems Elements
Erik Stam Utrecht School of Economics
Utrecht University
Andrew van de Ven Carlson School of the University of Minnesota
June 2019
Abstract There is growing interest in ecosystems as an approach for understanding the
context of entrepreneurship at the macro level of an organizational community. It consists of all the interdependent actors and factors that enable and constrain entrepreneurship within a particular territory. Although growing in popularity, the entrepreneurial ecosystem concept remains loosely defined and measured. This paper shows the value of taking a systems view of the context of entrepreneurship: understanding entrepreneurial economies from a systems perspective. We use a systems framework for studying entrepreneurial ecosystems, develop a measurement instrument of its elements, and use this to compose an entrepreneurial ecosystem index to examine the quality of entrepreneurial ecosystems in the Netherlands. We find that the prevalence of high-growth firms in a region is strongly related to the quality of its entrepreneurial ecosystem. Strong interrelationships among the ecosystem elements reveal their interdependence.
Keywords: entrepreneurial ecosystem elements, regional entrepreneurial ecosystems, entrepreneurial economy, entrepreneurship, high-growth firms, systems analysis
JEL classification: D2, E02, L26, M13, O43, P00, R1, R58 Acknowledgements: The authors would like to thank Bilgehan Uzunca and Friedeman Polzin and the participants of the Oxford University School of Geography and Environment seminar (Oxford, 2017), the Congrès des Économistes Belges, Université Libre de Bruxelles (Brussels, 2017), the IFN Stockholm Conference (Vaxholm, 2018), the Uddevalla Symposium (Luleå, 2018), the Forum Institut fur Mittelstandforschung seminar (Bonn, 2018), National Institute of Science and Technology Policy, Seminar on Entrepreneurship and Innovation (Tokyo, 2018), the University of Pecs - Regional Innovation and Entrepreneurship Research Center seminar (Pecs, 2019), and the University of Torino Seminar in Economics of Innovation and Knowledge (Turin, 2019) for their helpful comments and constructive feedback on earlier versions of this paper.
Comments welcomed to: [email protected]
1
Entrepreneurial Ecosystems Elements
1. Introduction
Scholars and practitioners alike are concerned with the quantity and quality of entrepreneurial
activity in a society. For example, scholars involved in the Global Entrepreneurship Monitor have
documented the prevalence of various forms of entrepreneurial activity across countries and
regions (Reynolds et al. 2005; Stam et al. 2011). In addition, policymakers concerned with
economic development have sought to identify policy “levers” with which to encourage higher
levels of entrepreneurial activity resulting in economic growth and job creation (Audretsch and
Link 2012). Borrowing from biology, the metaphor of an entrepreneurial ‘ecosystem’ is
increasingly used by scholars (Stam 2015; Spigel 2017; Acs et al. 2017) and practitioners (Feld
2012; Isenberg 2010) for understanding the context for entrepreneurship in particular territories
(countries, regions, cities). The entrepreneurial ecosystem comprises a set of interdependent
actors and factors that are governed in such a way that they enable productive entrepreneurship
(Stam 2015). As applied to entrepreneurship in a region, the metaphor is loosely defined, highly
undertheorized, and not adequately measured (Stam 2015). The purpose of this paper is to
develop an operational definition and an empirical model for measuring entrepreneurial
ecosystem elements and the quality of regional entrepreneurial ecosystems. The model is
informed by and extends previous conceptual and empirical work on the functional attributes or
indicators of entrepreneurial ecosystems. Using this conceptual framework, we introduce a
methodology for measuring entrepreneurial ecosystem elements and the quality of regional
entrepreneurial ecosystems and present empirical findings from a study of entrepreneurship in
twelve regions of the Netherlands. The paper concludes by discussing the implications of this
entrepreneurial framework for advancing theory and policy practice, and how the measurement
instrument can be applied in other territories.
2. The emerging literature on entrepreneurial ecosystems
The fundamental ideas behind entrepreneurial ecosystems emerged in the 1980s and 1990s as
part of a shift in entrepreneurship studies away from individualistic, personality-based research
towards a broader community perspective that incorporates the role of social, cultural, and
economic forces in the entrepreneurship process (Aldrich 1990; Nijkamp 2003; Steyaert and Katz
2004). Van de Ven (1993), for example, argued that individual entrepreneurs cannot command all
the resources, institutions, markets, and business functions that are required to develop and
commercialize their entrepreneurial ventures. Popular folklore notwithstanding, entrepreneurship
is a collective achievement that resides not only in the behaviours of individual entrepreneurs, but
requires key roles from numerous entrepreneurs in both the public and private sectors to develop
an industrial infrastructure that facilitates and constrains innovation.
There is a long legacy of studies on the ‘entrepreneurial infrastructure’ explaining the
influence of regional economic and social factors have over the entrepreneurship process
(Pennings (1982), Dubini (1989), Gnyawali and Fogel (1994), Van de Ven (1993), Bahrami and
Evans (1995)). Building on previous movements that decentred the individual entrepreneur as the
sole locus of value creation, the new contextual turn emphasizes the importance of situating the
entrepreneurial phenomenon in a broader context that incorporates temporal, spatial, social,
organizational, and market dimensions of context (Zahra 2007; Zahra et al. 2014; Woolley 2017).
2
While work on entrepreneurial ecosystems is still in its infancy, there are already several
empirical studies showing how a rich entrepreneurial ecosystem enables entrepreneurship and
subsequent value creation at the regional level (Fritsch 2013; Tsvetkova 2015; Autio et al. 2014).
For example, Mack and Mayer (2016) explore how early entrepreneurial successes in Phoenix,
Arizona has contributed to a persistently strong entrepreneurial ecosystem based on visible
success stories, a strong entrepreneurial culture and supportive public policies. Similarly, Spigel’s
(2017) study of entrepreneurial ecosystems in Waterloo and Calgary, Canada suggests that while
ecosystems can have different structures and origins, their success lies in their ability to create a
cohesive social and economic system that supports the creation and growth of new ventures.
Other work on regions such as Silicon Valley and Route 128 (Saxenian 1994; Kenney and Von
Burg 1999), Washington DC (Feldman 2001) and Kyoto (Aoyama 2009) – even if not using the
precise term ‘entrepreneurial ecosystem’ – described how contexts influence entrepreneurial
success. Works such as Acs et al. (2014) have employed large-scale quantitative methods, rather
than qualitative case studies, to identify strong entrepreneurial ecosystems at the national level.
While appealing, the entrepreneurial ecosystem concept is problematic, and the rush to
employ it has run ahead of answering several fundamental conceptual, theoretical, and empirical
questions. The phenomenon at first appears rather tautological: entrepreneurial ecosystems are
systems that produce successful entrepreneurship, and where there is a lot of successful
entrepreneurship there is apparently a good entrepreneurial ecosystem. Such tautological
reasoning ultimately offers little insight for research or public policy. Secondly, the approach as
yet provides only laundry lists of relevant factors without clear reasoning of their cause and
effect, nor how they are tied to specific place-based histories. While these factors provide some
focus, they offer no consistent explanation of their interdependent effects on entrepreneurship –
and, ultimately, on aggregate welfare. The World Economic Forum (2013) study, for example,
concludes that access to markets, human capital and finance are most important for the growth of
entrepreneurial companies. But these can best be seen as proximate causes, not as the
fundamental causes for the success of ecosystems (Acemoglu et al. 2005). An adequate
explanation should distinguish between the necessary and contingent conditions of an ecosystem
and clearly define the role of the government and other institutions. This has not yet been
accomplished. And third, it is not clear what is the appropriate level of analysis of an
entrepreneurial ecosystem (Malecki 2018). Geographically, it could be a city, a region or a
country. It can also be other systems less strictly defined in space, such as sectors or technologies,
which create opportunities for firm creation and growth. For most system elements it seems
possible to demarcate them at a regional (sub-national) level (e.g. regional labour markets), while
the conditions can be designed on both regional and national level (e.g. national laws and
regulations) (cf. Stam and Bosma 2015). In addition, entrepreneurs of high-growth firms and
especially entrepreneurial employees in large established firms could act as ecosystem connectors
on a global scale, connecting distinct regional entrepreneurial ecosystems in their role as
knowledge integrators (Sternberg 2007; Malecki 2011).
3
3. The entrepreneurial ecosystem defined
There is not yet a widely shared definition of entrepreneurial ecosystems among researchers or
practitioners. The first component of the term is entrepreneurial: a process in which opportunities
for creating new goods and services are explored, evaluated, and exploited (Schumpeter 1934;
Shane and Venkataraman 2000). The entrepreneurial ecosystem approach often narrows this
entrepreneurship down to ‘high-growth start-ups’ or ‘scale-ups’, claiming that this type of
entrepreneurship is an important source of innovation, productivity growth and employment
(World Economic Forum 2013; Mason and Brown 2014). Empirically, this claim seems too
exclusive: networks of innovative start-ups or entrepreneurial employees can also be forms of
productive entrepreneurship (Baumol 1993), even failed ventures can be productive for society
(Davidsson 2004). However, innovative and growth-oriented entrepreneurship appears to be
increasingly emphasized in the entrepreneurship literature (Shane 2009; Stam et al. 2012; Mason
and Brown 2013; Henrekson and Sanandaji 2014).
The second component of the term ecosystem borrows from biology, where ecosystem
(‘ecological system’) has been defined as “a biotic community, its physical environment, and all
the interactions possible in the complex of living and nonliving components” (Tansley 1935).
When applying the metaphor to an organizational community ecology, Hawley (1950) adopted
three core features of ecosystems: co-evolution and mutualistic interdependence among a
complex nested system of diverse organizations and actors. As in biological ecology, a
community ecology perspective focuses on the co-evolutionary rise and fall of many diverse
organizations and institutions that are mutualistically related and perform differentiated but
complementary roles that enable emergence, growth and survival as elements of a broader system
of community evolution (Astley and Van de Ven 1983; Astley 1985; Freeman and Audia 2006).
This mutualistic interdependence includes both cooperative and competitive relationships among
partisan, distributed, and embedded actors pursuing their own interests in the ecosystem, all of
which contribute to the complexity of the system. For example, to start new businesses in a
particular region, entrepreneurs develop mutualistic interdependencies for knowledge with
scientific communities, for financial resources from venture capitalists and investors, for
competent human resources from universities and training institutes, for regulatory approval and
licensing from various government departments, for parts and distribution from supply chains,
and product sales from informed consumers. Entrepreneurs are not only dependent on these
elements; these elements are also dependent on entrepreneurs. All of these actors involved in
these elements perform crucial roles in developing and sustaining an entrepreneurial ecosystem.
For organizational ecologists, a recognizable community emerges only when the
population in a region develops an identifiable cohesion that derives from the mutualistic
interdependence among symbiotically-related actors with complementary differences (Astley and
Van de Ven 1983, p. 258). This necessitates a methodology for studying entrepreneurial
ecosystems as a branch of a broader set of complex systems; notably artificial as distinguished
from natural systems (Simon 1962). Being human artificial constructions, entrepreneurial
ecosystems emphasize the distinct roles of agency and institutions.
The evolutionary process in which actors become engaged in the development of an
entrepreneurial ecosystem can begin any number of ways. It varies with the business and
technology being developed (Woolley 2017). For example, it can begin with purposeful
intentions and inventive ideas of entrepreneurs, who undertake a stream of activities to gain the
resources, competence, and endorsements necessary to develop an economically viable
4
enterprise. As they undertake these activities, the paths of independent entrepreneurs, acting out
their own diverse intentions and ideas, intersect. These intersections provide occasions for
interaction and recognizing areas for establishing cooperative and competitive relationships
(Garud 1994). Sometimes these interactions may be triggered by an ecosystem leader (Nambisan
and Baron 2013), and sometimes they emerge through a process of partisan mutual adjustment
among partisan and distributed actors who become embedded in the ecosystem as it develops
over time (Van de Ven and Garud 1993). Partisan mutual adjustment is a form of coordination of
people (a) without anybody coordinating them, (b) without a dominant common purpose, and (c)
without rules that fully prescribe their relations to one another (Lindblom 1965).
Cooperative relationships emerge among the actors who can achieve complementary
benefits by integrating their functional specializations. Competitive relationships emerge as
alternative business paths become evident and different entrepreneurs “place their bets on” and
pursue alternative paths. We must emphasize that during the initial period of industry emergence,
applied research and development is highly uncertain and often dependent on basic science and
technology. Depending on the technological alternative chosen by an entrepreneurial individual
or firm, it becomes highly dependent on different clusters of basic research institutes, such as
universities, laboratories, disciplines, that have been producing and directing the accumulation of
basic knowledge, techniques, and experience associated with a given technological alternative.
As the number of organizational units and actors gains a critical mass, a complex network
of cooperative and competitive relationships begins to accumulate. This network itself becomes
recognized as a new field, and takes the form of a hierarchical, loosely coupled system. Of
course, hierarchy in an ecosystem is a matter of degree, and some ecosystem components may be
only minimally, if at all, hierarchical. Hierarchy is often a consequence of institutional constraints
imposed by political and governmental regulatory bodies. Hierarchy also emerges in relationships
with key linking-pin organizations who either become dominant industry leaders or control
access to critical resources (money, competence, technology) needed by other firms in the
ecosystem.
Loose coupling promotes both flexibility and stability to the ecosystem. Links between
component subsystems are only as rich or tight as is necessary to ensure the survival of the
system (Aldrich and Fiol 1994). In his architecture of complexity Simon (1962) discussed how a
loosely joined system provides short-run independence of subsystems and long-run aggregate
dependence. The overall system can be fairly stable, due to the absence of strong ties or links
between elements and subsystems, but individual subsystems can be free to adapt quickly to local
environmental conditions. Thus, in a complex, heterogeneous, and changing environment, a
loosely joined ecosystem is highly adaptive.
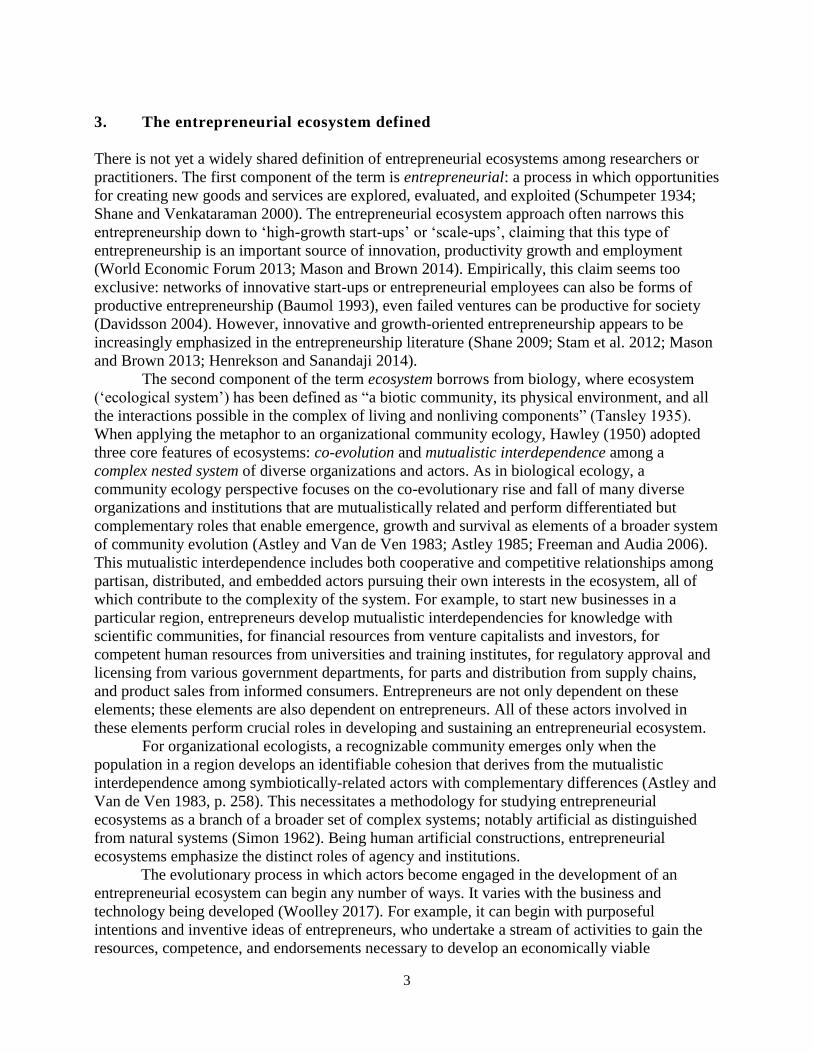
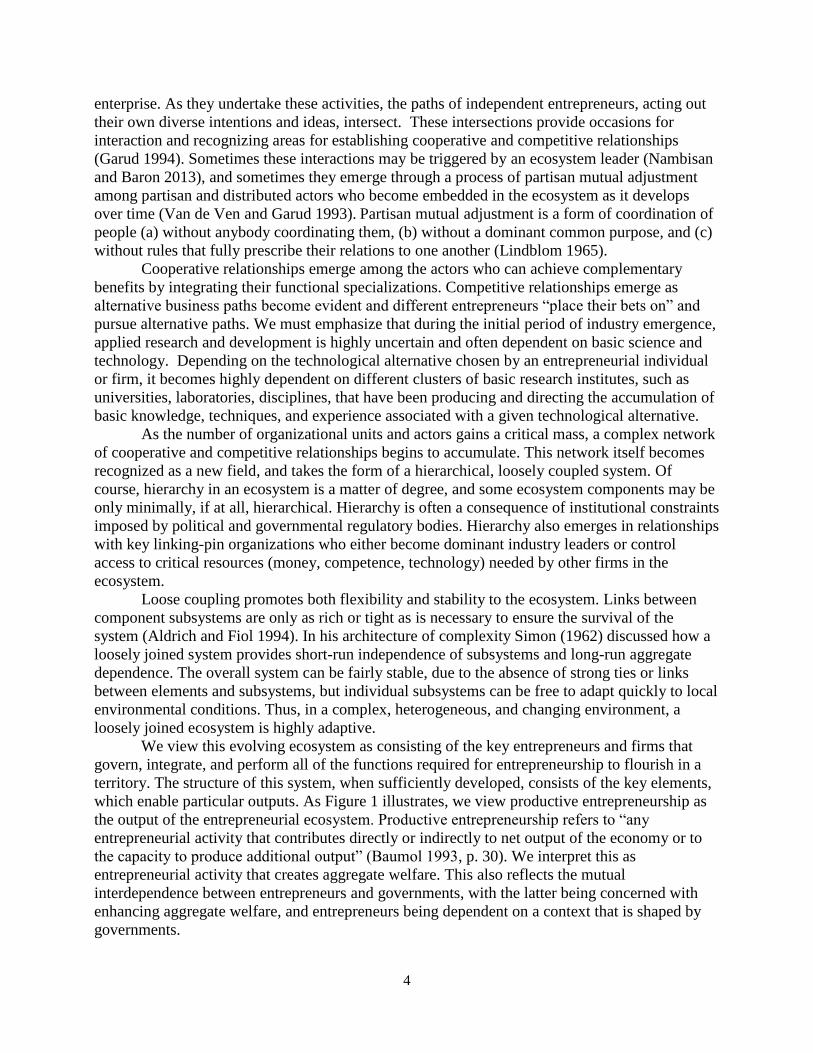
We view this evolving ecosystem as consisting of the key entrepreneurs and firms that
govern, integrate, and perform all of the functions required for entrepreneurship to flourish in a
territory. The structure of this system, when sufficiently developed, consists of the key elements,
which enable particular outputs. As Figure 1 illustrates, we view productive entrepreneurship as
the output of the entrepreneurial ecosystem. Productive entrepreneurship refers to “any
entrepreneurial activity that contributes directly or indirectly to net output of the economy or to
the capacity to produce additional output” (Baumol 1993, p. 30). We interpret this as
entrepreneurial activity that creates aggregate welfare. This also reflects the mutual
interdependence between entrepreneurs and governments, with the latter being concerned with
enhancing aggregate welfare, and entrepreneurs being dependent on a context that is shaped by
governments.
5
Figure 1 Elements and outputs of the entrepreneurial ecosystem
4. Entrepreneurial ecosystem model
As just discussed, an entrepreneurial ecosystem consists of all the elements that are required to
sustain entrepreneurship in a particular territory. Van de Ven (1993) was one of the first to
propose four broad components of an ecosystem (or what he termed an ‘infrastructure’) for
entrepreneurship, including: (1) institutional arrangements that legitimate, regulate, and
incentivise entrepreneurship, (2) public resource endowments of basic scientific knowledge,
financing mechanisms, and pools of competent labor, (3) market demand of informed consumers
for the products and services offered by entrepreneurs, and of course, (4) proprietary business
activities that private entrepreneurs provide through R&D, manufacturing, marketing, and
distribution functions (Van de Ven 1993).
Woolley (2017) discusses how scholars have subsequently elaborated and expanded on
these elements of an entrepreneurial ecosystem. Feld (2012) for example, emphasized the
interaction between the players in the ecosystem (with high network density, many connecting
events, and large companies collaborating with local start-ups) and access to all kinds of relevant
resources (talent, services, capital), with an enabling role of government in the background.
Isenberg (2010) formulated six distinct domains of an ecosystem: policy, finance, culture,
support, human capital and markets. This largely elaborates Van de Ven’s (1993) infrastructure
components, as well as eight pillars proposed by the World Economic Forum (2013, p. 6–7) for a
successful ecosystem. These pillars focus on the presence of key factors (resources) like human
capital, finance and services; the actors involved in this (talent, investors, mentors/advisors,
entrepreneurial peers); the formal (‘government and regulatory framework’) and informal
institutions (‘cultural support’) enabling entrepreneurship; and finally, access to customers in
domestic and foreign markets.
Building on these studies and prior academic studies (see Stam 2015; Stam and Spigel
2018), we propose an integrative model of entrepreneurial ecosystems consisting of ten elements
and entrepreneurial outputs (see Figure 1). The ten elements, are operational constructs of the
broader concepts of institutions and resources of an entrepreneurial ecosystem. We base our
conceptualization on the so-called infrastructure for entrepreneurship (Van de Ven 1993), which
is based on a social system framework. Our entrepreneurial ecosystem includes the institutional
6
arrangements and resource endowment components of the infrastructure. The institutional
arrangements component is captured by the formal institutions, culture and network elements.
The resource endowment component is captured by the physical infrastructure, finance,
leadership, talent, knowledge, intermediate services, and demand elements. The third component
of the infrastructure, proprietary functions, consists of the entrepreneurial firms commercializing
innovations. This component is regarded to be the output of the entrepreneurial ecosystem,
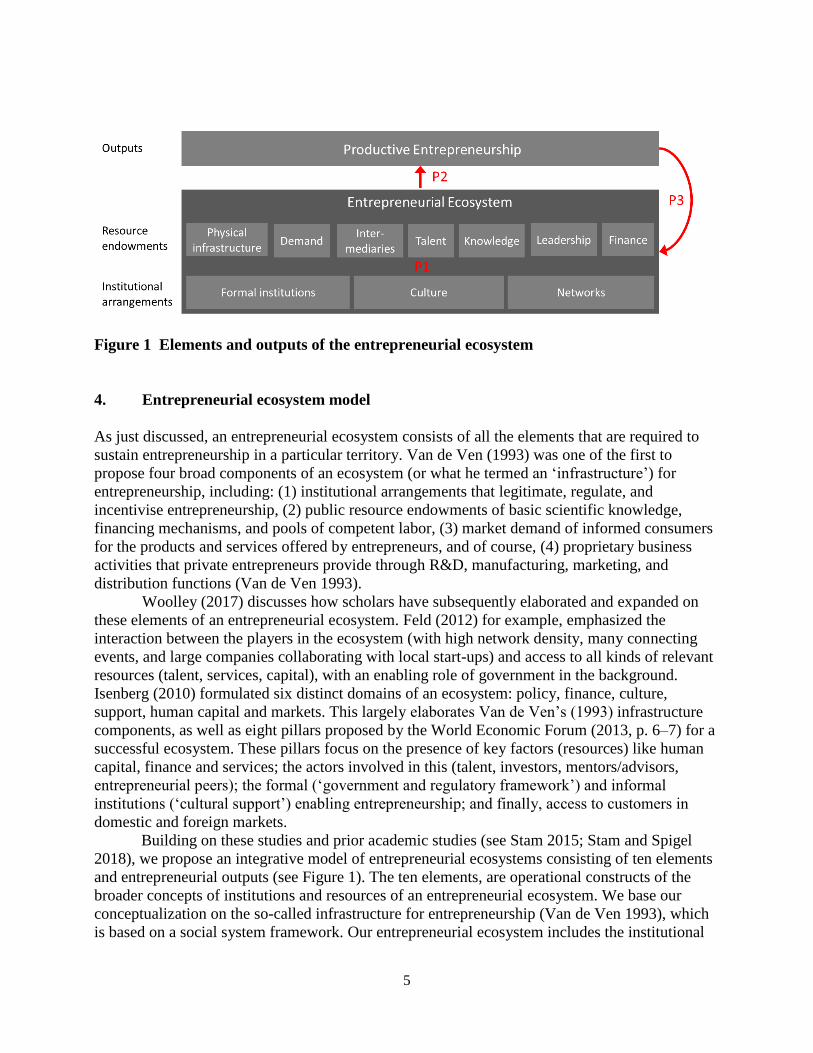
conceptualized as new value creation and captured by productive entrepreneurship. Table 1
summarizes and relates these concepts, constructs, and elements of entrepreneurial ecosystems.
Table 1 Constructs of entrepreneurial ecosystem elements and outputs
Concept Construct Definition Element
Institutions Formal institutions The rules of the game in society Formal institutions
Informal
institutions
Cultural context Culture
Social networks The social context of actors,
especially the degree to which they
are socially connected
Networks
Resources Physical resources The physical context of actors that
enables them to meet other actors in
physical proximity
Physical infrastructure
Financial resources The presence of financial means to
invest in activities that do not yet
deliver financial means
Finance
Leadership Leadership that provides guidance
for, and direction of, collective action
Leadership
Human capital The skills, knowledge, and
experience possessed by individuals
Talent
Knowledge Investments in (scientific and
technological) knowledge creation
Knowledge
Means of
consumption
The presence of financial means in
the population to purchase goods and
services
Demand
Producer services The intermediate service inputs into
proprietary functions
Intermediate services
New value
creation
Productive
entrepreneurship
Any entrepreneurial activity that
contributes (in)directly to net output
of the economy or to the capacity to
produce additional output
Productive
entrepreneurship
The presence of these elements and the interdependence between them are crucial for the
success of the ecosystem (Woolley 2017). Institutions provide the fundamental preconditions for
economic action to take place (Granovetter 1992) and for resources to be used productively
(Acemoglu et al. 2005). Institutions are not only a precondition for economic action to take place,
they also affect the way entrepreneurship is pursued and the welfare consequences of
entrepreneurship (Baumol 1990). Networks of entrepreneurs provide an information flow,
enabling an effective distribution of knowledge, labour and capital (Malecki 1997).
A highly developed physical infrastructure is a key element of the context to enable
economic interaction and entrepreneurship in particular (Audretsch et al. 2015). Access to
7
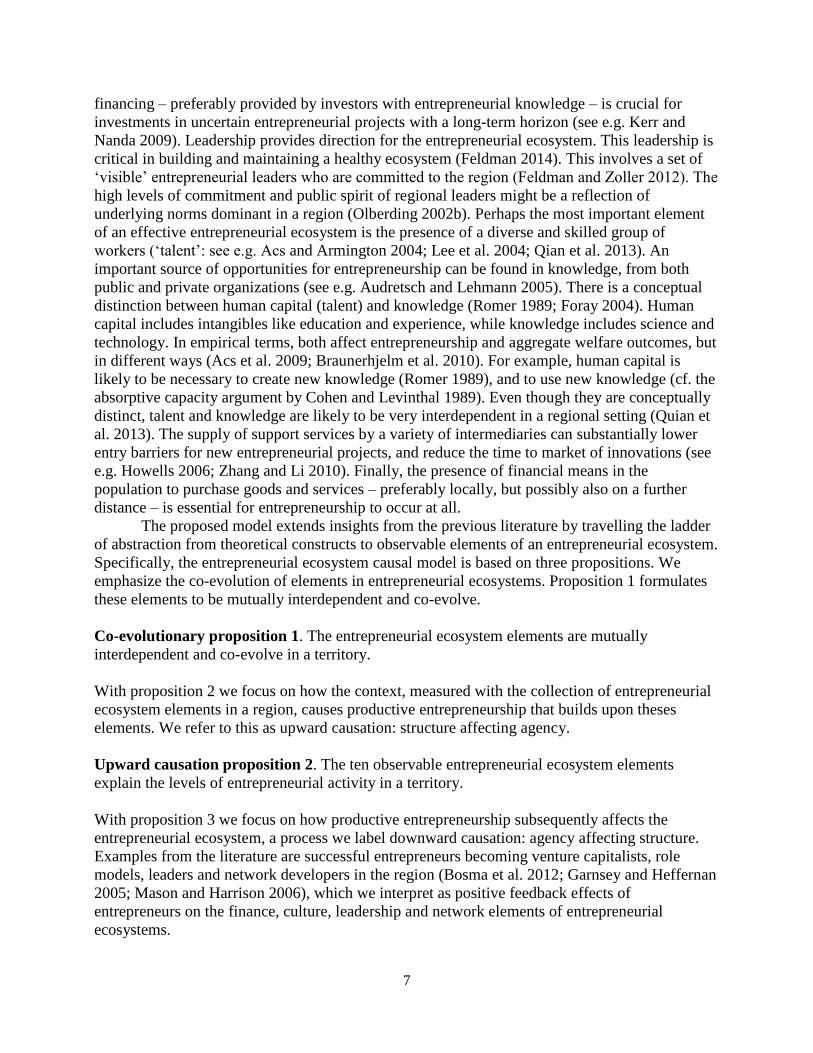
financing – preferably provided by investors with entrepreneurial knowledge – is crucial for
investments in uncertain entrepreneurial projects with a long-term horizon (see e.g. Kerr and
Nanda 2009). Leadership provides direction for the entrepreneurial ecosystem. This leadership is
critical in building and maintaining a healthy ecosystem (Feldman 2014). This involves a set of
‘visible’ entrepreneurial leaders who are committed to the region (Feldman and Zoller 2012). The
high levels of commitment and public spirit of regional leaders might be a reflection of
underlying norms dominant in a region (Olberding 2002b). Perhaps the most important element
of an effective entrepreneurial ecosystem is the presence of a diverse and skilled group of
workers (‘talent’: see e.g. Acs and Armington 2004; Lee et al. 2004; Qian et al. 2013). An
important source of opportunities for entrepreneurship can be found in knowledge, from both
public and private organizations (see e.g. Audretsch and Lehmann 2005). There is a conceptual
distinction between human capital (talent) and knowledge (Romer 1989; Foray 2004). Human
capital includes intangibles like education and experience, while knowledge includes science and
technology. In empirical terms, both affect entrepreneurship and aggregate welfare outcomes, but
in different ways (Acs et al. 2009; Braunerhjelm et al. 2010). For example, human capital is
likely to be necessary to create new knowledge (Romer 1989), and to use new knowledge (cf. the
absorptive capacity argument by Cohen and Levinthal 1989). Even though they are conceptually
distinct, talent and knowledge are likely to be very interdependent in a regional setting (Quian et
al. 2013). The supply of support services by a variety of intermediaries can substantially lower
entry barriers for new entrepreneurial projects, and reduce the time to market of innovations (see
e.g. Howells 2006; Zhang and Li 2010). Finally, the presence of financial means in the
population to purchase goods and services – preferably locally, but possibly also on a further
distance – is essential for entrepreneurship to occur at all.
The proposed model extends insights from the previous literature by travelling the ladder
of abstraction from theoretical constructs to observable elements of an entrepreneurial ecosystem.
Specifically, the entrepreneurial ecosystem causal model is based on three propositions. We
emphasize the co-evolution of elements in entrepreneurial ecosystems. Proposition 1 formulates
these elements to be mutually interdependent and co-evolve.
Co-evolutionary proposition 1. The entrepreneurial ecosystem elements are mutually
interdependent and co-evolve in a territory.
With proposition 2 we focus on how the context, measured with the collection of entrepreneurial
ecosystem elements in a region, causes productive entrepreneurship that builds upon theses
elements. We refer to this as upward causation: structure affecting agency.
Upward causation proposition 2. The ten observable entrepreneurial ecosystem elements
explain the levels of entrepreneurial activity in a territory.
With proposition 3 we focus on how productive entrepreneurship subsequently affects the
entrepreneurial ecosystem, a process we label downward causation: agency affecting structure.
Examples from the literature are successful entrepreneurs becoming venture capitalists, role
models, leaders and network developers in the region (Bosma et al. 2012; Garnsey and Heffernan
2005; Mason and Harrison 2006), which we interpret as positive feedback effects of
entrepreneurs on the finance, culture, leadership and network elements of entrepreneurial
ecosystems.
8
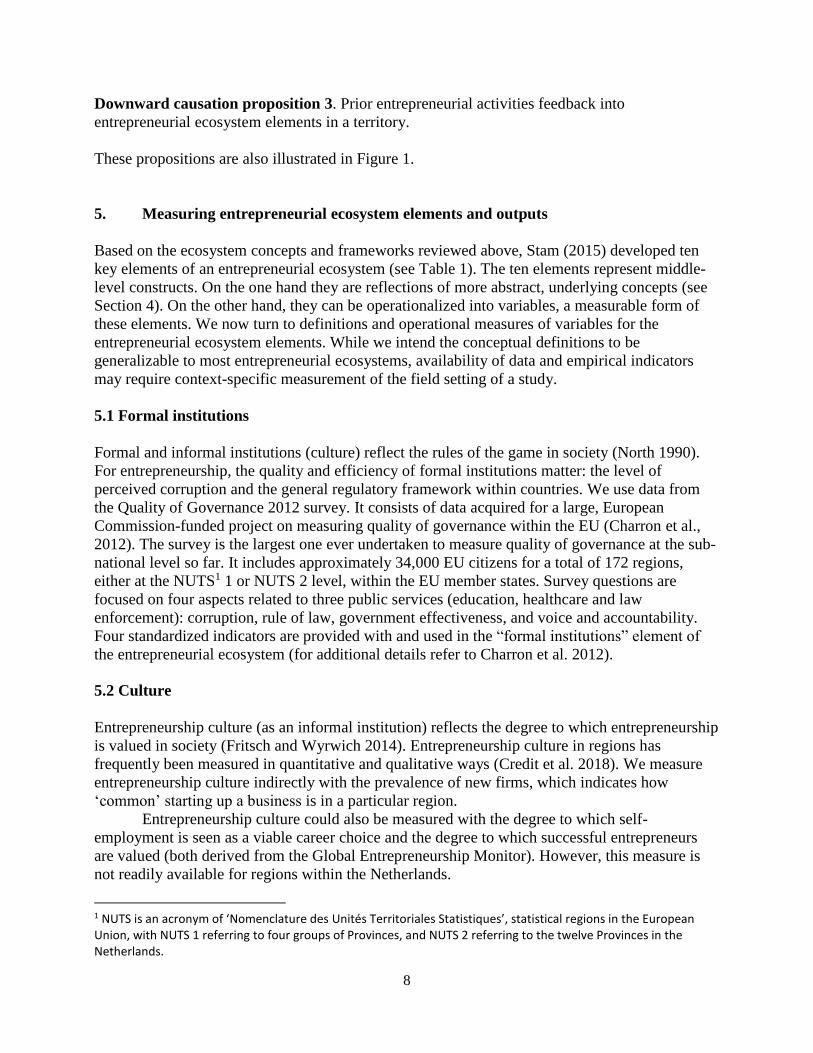
Downward causation proposition 3. Prior entrepreneurial activities feedback into
entrepreneurial ecosystem elements in a territory.
These propositions are also illustrated in Figure 1.
5. Measuring entrepreneurial ecosystem elements and outputs
Based on the ecosystem concepts and frameworks reviewed above, Stam (2015) developed ten
key elements of an entrepreneurial ecosystem (see Table 1). The ten elements represent middle-
level constructs. On the one hand they are reflections of more abstract, underlying concepts (see
Section 4). On the other hand, they can be operationalized into variables, a measurable form of
these elements. We now turn to definitions and operational measures of variables for the
entrepreneurial ecosystem elements. While we intend the conceptual definitions to be
generalizable to most entrepreneurial ecosystems, availability of data and empirical indicators
may require context-specific measurement of the field setting of a study.
5.1 Formal institutions
Formal and informal institutions (culture) reflect the rules of the game in society (North 1990).
For entrepreneurship, the quality and efficiency of formal institutions matter: the level of
perceived corruption and the general regulatory framework within countries. We use data from
the Quality of Governance 2012 survey. It consists of data acquired for a large, European
Commission-funded project on measuring quality of governance within the EU (Charron et al.,
2012). The survey is the largest one ever undertaken to measure quality of governance at the sub-
national level so far. It includes approximately 34,000 EU citizens for a total of 172 regions,
either at the NUTS1 1 or NUTS 2 level, within the EU member states. Survey questions are
focused on four aspects related to three public services (education, healthcare and law
enforcement): corruption, rule of law, government effectiveness, and voice and accountability.
Four standardized indicators are provided with and used in the “formal institutions” element of
the entrepreneurial ecosystem (for additional details refer to Charron et al. 2012).
5.2 Culture
Entrepreneurship culture (as an informal institution) reflects the degree to which entrepreneurship
is valued in society (Fritsch and Wyrwich 2014). Entrepreneurship culture in regions has
frequently been measured in quantitative and qualitative ways (Credit et al. 2018). We measure
entrepreneurship culture indirectly with the prevalence of new firms, which indicates how
‘common’ starting up a business is in a particular region.
Entrepreneurship culture could also be measured with the degree to which self-
employment is seen as a viable career choice and the degree to which successful entrepreneurs
are valued (both derived from the Global Entrepreneurship Monitor). However, this measure is
not readily available for regions within the Netherlands.
1 NUTS is an acronym of ‘Nomenclature des Unités Territoriales Statistiques’, statistical regions in the European Union, with NUTS 1 referring to four groups of Provinces, and NUTS 2 referring to the twelve Provinces in the Netherlands.
9
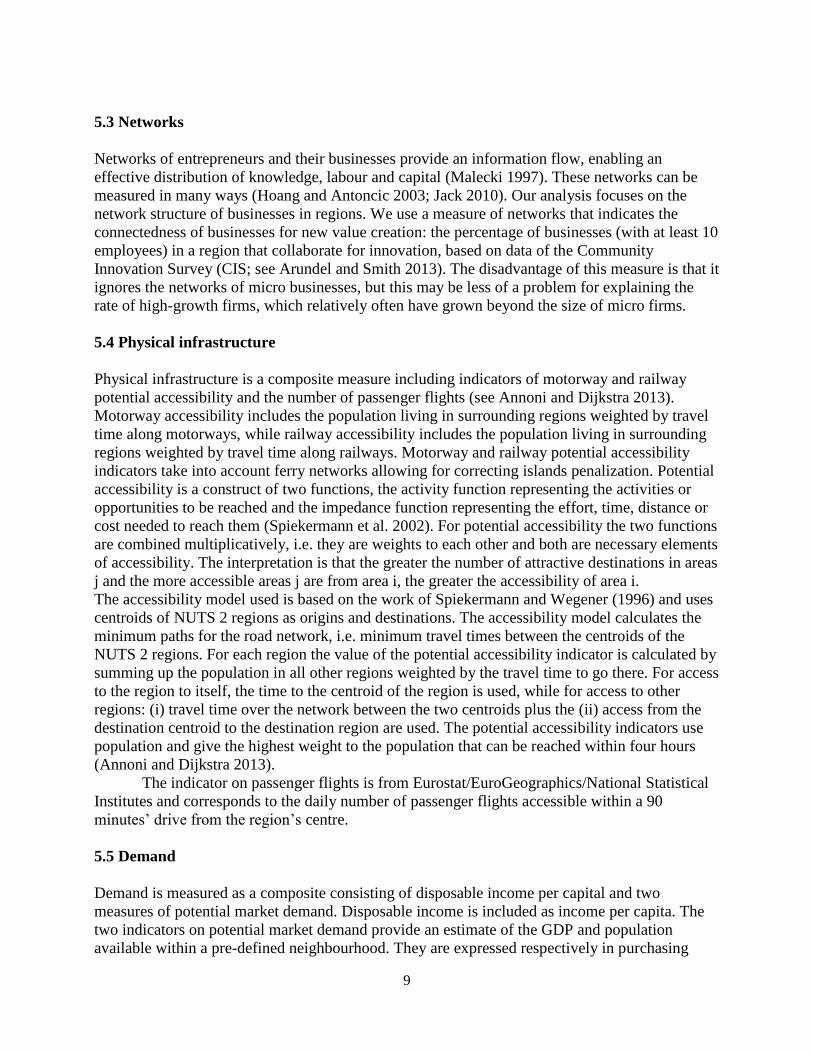
5.3 Networks
Networks of entrepreneurs and their businesses provide an information flow, enabling an
effective distribution of knowledge, labour and capital (Malecki 1997). These networks can be
measured in many ways (Hoang and Antoncic 2003; Jack 2010). Our analysis focuses on the
network structure of businesses in regions. We use a measure of networks that indicates the
connectedness of businesses for new value creation: the percentage of businesses (with at least 10
employees) in a region that collaborate for innovation, based on data of the Community
Innovation Survey (CIS; see Arundel and Smith 2013). The disadvantage of this measure is that it
ignores the networks of micro businesses, but this may be less of a problem for explaining the
rate of high-growth firms, which relatively often have grown beyond the size of micro firms.
5.4 Physical infrastructure
Physical infrastructure is a composite measure including indicators of motorway and railway
potential accessibility and the number of passenger flights (see Annoni and Dijkstra 2013).
Motorway accessibility includes the population living in surrounding regions weighted by travel
time along motorways, while railway accessibility includes the population living in surrounding
regions weighted by travel time along railways. Motorway and railway potential accessibility
indicators take into account ferry networks allowing for correcting islands penalization. Potential
accessibility is a construct of two functions, the activity function representing the activities or
opportunities to be reached and the impedance function representing the effort, time, distance or
cost needed to reach them (Spiekermann et al. 2002). For potential accessibility the two functions
are combined multiplicatively, i.e. they are weights to each other and both are necessary elements
of accessibility. The interpretation is that the greater the number of attractive destinations in areas
j and the more accessible areas j are from area i, the greater the accessibility of area i.
The accessibility model used is based on the work of Spiekermann and Wegener (1996) and uses
centroids of NUTS 2 regions as origins and destinations. The accessibility model calculates the
minimum paths for the road network, i.e. minimum travel times between the centroids of the
NUTS 2 regions. For each region the value of the potential accessibility indicator is calculated by
summing up the population in all other regions weighted by the travel time to go there. For access
to the region to itself, the time to the centroid of the region is used, while for access to other
regions: (i) travel time over the network between the two centroids plus the (ii) access from the
destination centroid to the destination region are used. The potential accessibility indicators use
population and give the highest weight to the population that can be reached within four hours
(Annoni and Dijkstra 2013).
The indicator on passenger flights is from Eurostat/EuroGeographics/National Statistical
Institutes and corresponds to the daily number of passenger flights accessible within a 90
minutes’ drive from the region’s centre.
5.5 Demand
Demand is measured as a composite consisting of disposable income per capital and two
measures of potential market demand. Disposable income is included as income per capita. The
two indicators on potential market demand provide an estimate of the GDP and population
available within a pre-defined neighbourhood. They are expressed respectively in purchasing

10
power standards and population size (EU average set to 100). See Annoni and Kozovska (2010)
for details on the computation of potential market demand indicators. Demand might be the
element with the least spatial bounds, especially for high-growth firms, which are likely to serve
markets beyond the home-region.
5.6 Leadership
Leadership provides guidance for and direction of collective action. Conceptually and empirically
rigorous studies on leadership in regions is still sparse (Sotarauta et al. 2017). Empirically,
leadership can be measured with the presence of visible (singular) leaders, but also with more
distributed forms of leadership, including the prevalence of privately organized interest groups
and (public-private) partnerships for economic development (Olberding 2002a). Leadership is
measured with the prevalence of innovation project leaders. We have constructed a database with
information on all the innovation projects in the Netherlands that received (Dutch or European)
public subsidies in the period 2010-2013 (see Stam et al. 2016). We selected projects with at least
two participating organizations (2231 projects). The geographical origin of these projects is
established by taking the province of the main applicant or principal firm. This allowed us to
measure the prevalence of innovation project leaders per 1000 businesses in each region.
5.7 Talent
Human capital and more broadly talent for (productive) entrepreneurship is multifaceted and can
be measured in many ways, entrepreneurship specific (see Stam and Spigel 2018) and more
generic (Unger et al. 2011). We take the best available generic measure of talent: the prevalence
of individuals with high levels of (generic) human capital. This is measured with the share of the
population aged 15-65 years with a higher education degree. Talent could also be measured with
the share of the labour force with at least secondary education, but we have chosen for the more
general, population-based indicator.
5.8 Finance
The supply and accessibility of finance for new and small firms is an important condition for
their growth and survival. We use the amount of venture capital (start-up and growth) invested in
the region as an indicator for the finance element. This measure is based on data of the National
Association for Private Equity, which registers all private equity deals in the Netherlands. We
only use the data on the start-up and growth segments (and not on buy-outs, and management
buy-ins), because these are most closely related to the envisaged output of the ecosystem: high-
growth firms. Because the annual data on venture capital investments is highly volatile and for
some regions based on a very small number of deals, we take a 3-year lagged average per year.
Finance can be traced in many other ways: for example with the ease of access to loans
(see Stam 2018), the prevalence of informal investors (Global Entrepreneurship Monitor), and
crowdfunding. Data for these measures is available at the national, but not at the regional level, or
just for a few years.
5.9 Knowledge
11
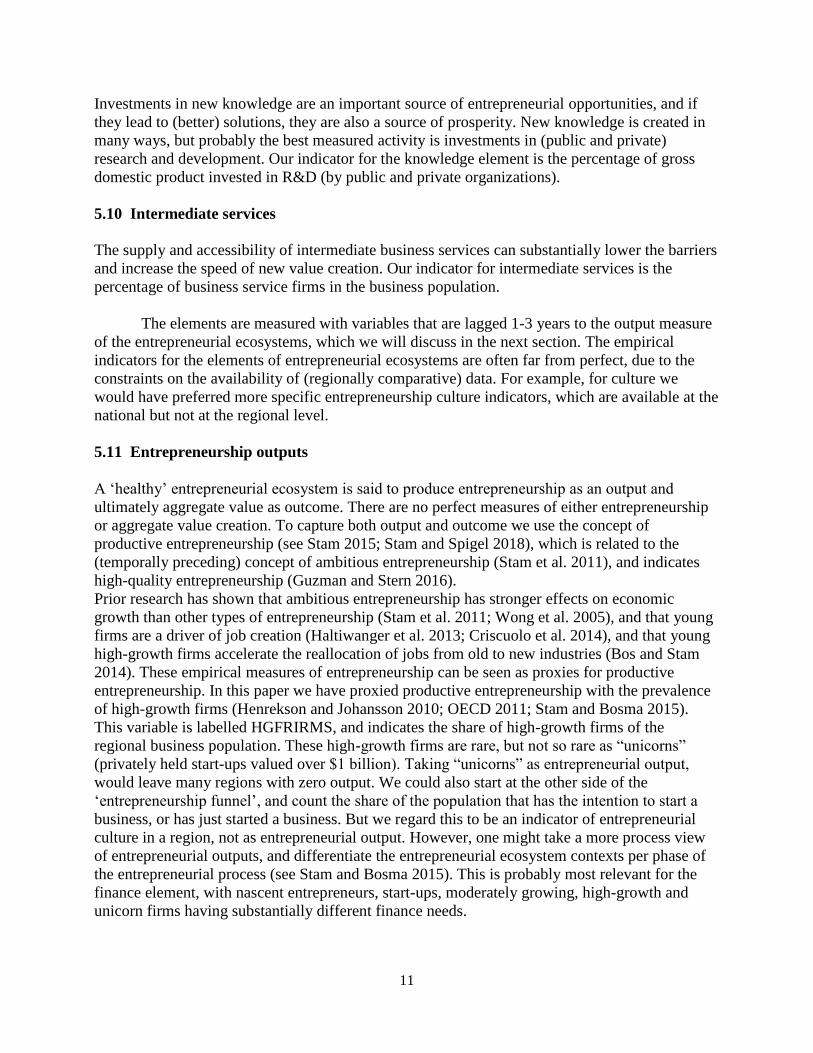
Investments in new knowledge are an important source of entrepreneurial opportunities, and if
they lead to (better) solutions, they are also a source of prosperity. New knowledge is created in
many ways, but probably the best measured activity is investments in (public and private)
research and development. Our indicator for the knowledge element is the percentage of gross
domestic product invested in R&D (by public and private organizations).
5.10 Intermediate services
The supply and accessibility of intermediate business services can substantially lower the barriers
and increase the speed of new value creation. Our indicator for intermediate services is the
percentage of business service firms in the business population.
The elements are measured with variables that are lagged 1-3 years to the output measure
of the entrepreneurial ecosystems, which we will discuss in the next section. The empirical
indicators for the elements of entrepreneurial ecosystems are often far from perfect, due to the
constraints on the availability of (regionally comparative) data. For example, for culture we
would have preferred more specific entrepreneurship culture indicators, which are available at the
national but not at the regional level.
5.11 Entrepreneurship outputs
A ‘healthy’ entrepreneurial ecosystem is said to produce entrepreneurship as an output and
ultimately aggregate value as outcome. There are no perfect measures of either entrepreneurship
or aggregate value creation. To capture both output and outcome we use the concept of
productive entrepreneurship (see Stam 2015; Stam and Spigel 2018), which is related to the
(temporally preceding) concept of ambitious entrepreneurship (Stam et al. 2011), and indicates
high-quality entrepreneurship (Guzman and Stern 2016).
Prior research has shown that ambitious entrepreneurship has stronger effects on economic
growth than other types of entrepreneurship (Stam et al. 2011; Wong et al. 2005), and that young
firms are a driver of job creation (Haltiwanger et al. 2013; Criscuolo et al. 2014), and that young
high-growth firms accelerate the reallocation of jobs from old to new industries (Bos and Stam
2014). These empirical measures of entrepreneurship can be seen as proxies for productive
entrepreneurship. In this paper we have proxied productive entrepreneurship with the prevalence
of high-growth firms (Henrekson and Johansson 2010; OECD 2011; Stam and Bosma 2015).
This variable is labelled HGFRIRMS, and indicates the share of high-growth firms of the
regional business population. These high-growth firms are rare, but not so rare as “unicorns”
(privately held start-ups valued over $1 billion). Taking “unicorns” as entrepreneurial output,
would leave many regions with zero output. We could also start at the other side of the
‘entrepreneurship funnel’, and count the share of the population that has the intention to start a
business, or has just started a business. But we regard this to be an indicator of entrepreneurial
culture in a region, not as entrepreneurial output. However, one might take a more process view
of entrepreneurial outputs, and differentiate the entrepreneurial ecosystem contexts per phase of
the entrepreneurial process (see Stam and Bosma 2015). This is probably most relevant for the
finance element, with nascent entrepreneurs, start-ups, moderately growing, high-growth and
unicorn firms having substantially different finance needs.
12
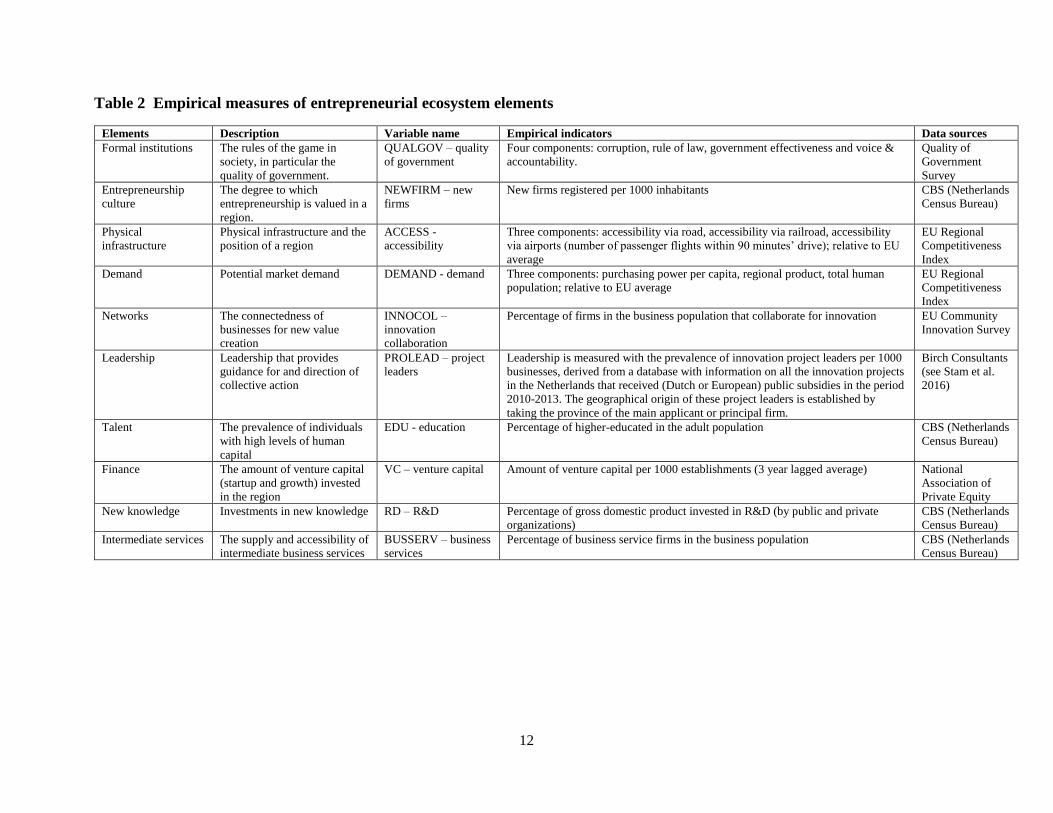
Table 2 Empirical measures of entrepreneurial ecosystem elements
Elements Description Variable name Empirical indicators Data sources
Formal institutions The rules of the game in
society, in particular the
quality of government.
QUALGOV – quality
of government
Four components: corruption, rule of law, government effectiveness and voice &
accountability.
Quality of
Government
Survey
Entrepreneurship
culture
The degree to which
entrepreneurship is valued in a
region.
NEWFIRM – new
firms
New firms registered per 1000 inhabitants
CBS (Netherlands
Census Bureau)
Physical
infrastructure
Physical infrastructure and the
position of a region
ACCESS -
accessibility
Three components: accessibility via road, accessibility via railroad, accessibility
via airports (number of passenger flights within 90 minutes’ drive); relative to EU
average
EU Regional
Competitiveness
Index
Demand Potential market demand DEMAND - demand Three components: purchasing power per capita, regional product, total human
population; relative to EU average
EU Regional
Competitiveness
Index
Networks The connectedness of
businesses for new value
creation
INNOCOL –
innovation
collaboration
Percentage of firms in the business population that collaborate for innovation EU Community
Innovation Survey
Leadership Leadership that provides
guidance for and direction of
collective action
PROLEAD – project
leaders
Leadership is measured with the prevalence of innovation project leaders per 1000
businesses, derived from a database with information on all the innovation projects
in the Netherlands that received (Dutch or European) public subsidies in the period
2010-2013. The geographical origin of these project leaders is established by
taking the province of the main applicant or principal firm.
Birch Consultants
(see Stam et al.
2016)
Talent The prevalence of individuals
with high levels of human
capital
EDU - education Percentage of higher-educated in the adult population CBS (Netherlands
Census Bureau)
Finance The amount of venture capital
(startup and growth) invested
in the region
VC – venture capital Amount of venture capital per 1000 establishments (3 year lagged average) National
Association of
Private Equity
New knowledge Investments in new knowledge RD – R&D Percentage of gross domestic product invested in R&D (by public and private
organizations)
CBS (Netherlands
Census Bureau)
Intermediate services The supply and accessibility of
intermediate business services
BUSSERV – business
services
Percentage of business service firms in the business population CBS (Netherlands
Census Bureau)
13
The Dutch Financial Times (Financieele Dagblad), in collaboration with the Chambers of
Commerce, has developed a somewhat more selective measure of high-growth firms in the
Netherlands: the number of independent firms with a profitable growth in turnover of at least
20% per year over three years (i.e. at least 72.8 % over the full three-year period). The selection
logic for the 2013 sample is as follows (Financieele Dagblad 2013):
1. There are about 2 million registered firms in the Netherlands
2. 825,000 of these firms are obliged to publish their annual financial details
3. 11,400 of these firms have published annual financial reports
4. Only 1750 of these firms had an average turnover growth of at least 20 % over the
last three years
5. 784 of these also fulfilled the following requirements: profitable, financial position,
payment behaviour.
6. After a quality check, 394 high-growth firms remained (in 2014: 331).
There are huge differences across regions, even within a small country like the Netherlands: in
2014 the absolute number of high-growth firms ranges from 1 to 75, but even in relative terms
there is a 15-fold difference between the lowest ranked region 0.003% and the highest ranked
region 0.045%.
5.12 Research Context
These measures, of course, are inevitably influenced by the local context being examined. For
this paper the local context can be characterized as a North-Western European, advanced
capitalist economy. More in particular, our research context consists of entrepreneurial
ecosystems in twelve regions (provinces: NUTS 2 in European Union terms) of the Netherlands.
We have taken the province as the unit of analysis for measuring entrepreneurial ecosystems. It
may be debated whether the provincial border provides the most adequate boundary of
entrepreneurial ecosystems. The boundaries are almost always arbitrary, most likely somewhere
in between the municipality and the national level. Is the province the best unit of analysis, or
should entrepreneurial ecosystems perhaps be analysed in a more nested or polycentric (Ostrom
2010) way, further problematizing the territorial view ‘borrowed’ from the ecological analogy? If
we take the openness of the system serious this also opens ‘explanatory power’ of events and
elements outside the current regional boundary, affecting the prevalence of entrepreneurship
beyond regional boundaries.
6. Results
6.1 Descriptive Statistics
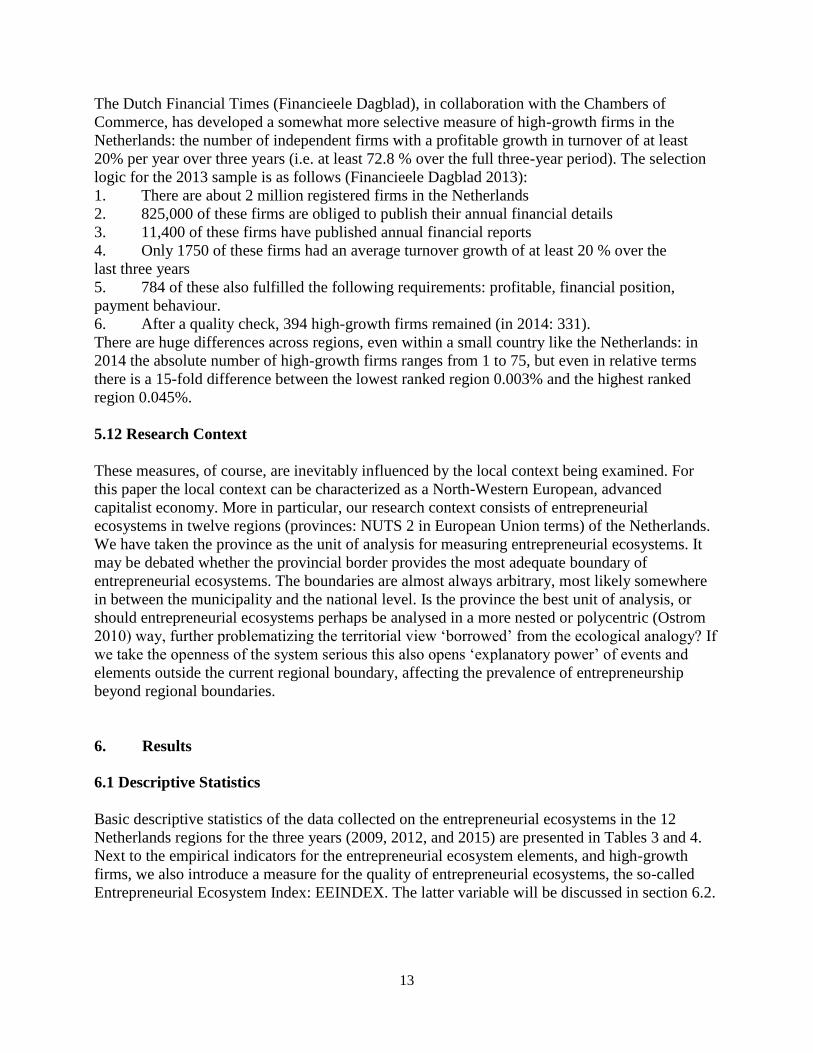
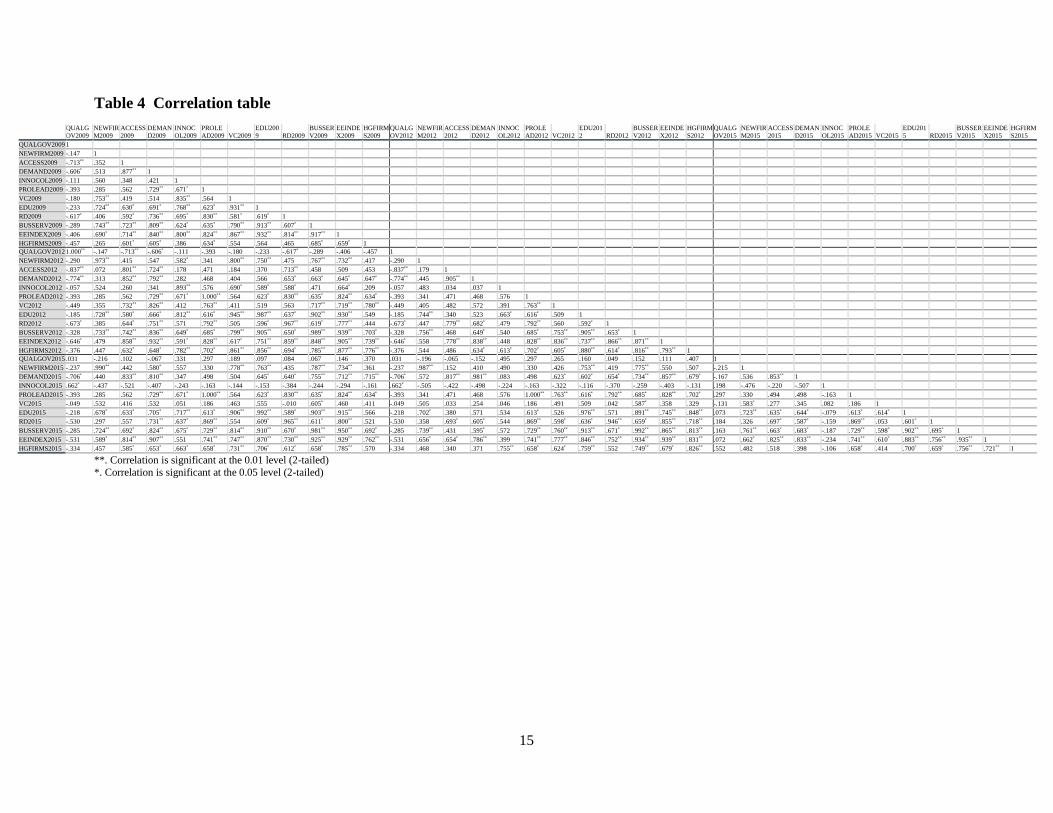
Basic descriptive statistics of the data collected on the entrepreneurial ecosystems in the 12
Netherlands regions for the three years (2009, 2012, and 2015) are presented in Tables 3 and 4.
Next to the empirical indicators for the entrepreneurial ecosystem elements, and high-growth
firms, we also introduce a measure for the quality of entrepreneurial ecosystems, the so-called
Entrepreneurial Ecosystem Index: EEINDEX. The latter variable will be discussed in section 6.2.
14
Table 3 Mean, minima, maxima, and standard deviation (normalized values)
Minimum Maximum Mean
Standard
Deviation
2009
Quality of government .7970 1.2750 .999917 .1762263
New firms .7750 1.2950 .951583 .1502861
Accessibility .5470 1.3730 .999667 .2844888
Demand .2740 1.1910 .651167 .3416790
Innovation collaboration .8858 1.0864 1.000000 .0604002
Project leaders .1900 1.4340 .779583 .4364244
Venture capital .1019 2.1916 .829715 .6351865
Education .7470 1.3140 .943917 .1615687
R&D .2200 1.3200 .850833 .3397180
Business services .5600 1.3490 .891250 .2312594
Entrepreneurial ecosystem index 5.99 12.42 8.8985 2.11997
High-growth firms .000313742 .000849968 .00054353350 .000160467163
2012
Quality of government .80 1.28 .9999 .17623
New firms .74 1.31 .9400 .18742
Accessibility .23 1.95 1.0001 .60954
Demand .33 1.78 1.0002 .48622
Innovation collaboration .86 1.09 .9999 .06954
Project leaders .19 1.43 .7796 .43642
Venture capital .01 2.33 .6678 .64806
Education .73 1.31 .9461 .16056
R&D .28 1.32 .8458 .32332
Business services .57 1.30 .8834 .22500
Entrepreneurial ecosystem index 5.67 12.67 9.0628 2.40051
High-growth firms .000074757 .000488885 .00023600192 .000107054815
2015
Quality of government .94 1.15 1.0000 .06112
New firms .72 1.37 .9274 .19820
Accessibility .29 2.02 1.0000 .52935
Demand .39 1.79 1.0002 .45831
Innovation collaboration .96 1.07 .9999 .03257
Project leaders .19 1.43 .7796 .43642
Venture capital .10 1.87 .7489 .62425
Education .75 1.32 .9417 .16239
R&D .29 1.36 .8450 .32798
Business services .57 1.25 .8914 .20267
Entrepreneurial ecosystem index 5.86 13.06 9.1334 2.23085
High-growth firms .000075339 .000474515 .00028787025 .000135948113
15
Table 4 Correlation table
QUALG
OV2009
NEWFIR
M2009
ACCESS
2009
DEMAN
D2009
INNOC
OL2009
PROLE
AD2009 VC2009
EDU200
9 RD2009
BUSSER
V2009
EEINDE
X2009
HGFIRM
S2009
QUALG
OV2012
NEWFIR
M2012
ACCESS
2012
DEMAN
D2012
INNOC
OL2012
PROLE
AD2012 VC2012
EDU201
2 RD2012
BUSSER
V2012
EEINDE
X2012
HGFIRM
S2012
QUALG
OV2015
NEWFIR
M2015
ACCESS
2015
DEMAN
D2015
INNOC
OL2015
PROLE
AD2015 VC2015
EDU201
5 RD2015
BUSSER
V2015
EEINDE
X2015
HGFIRM
S2015
QUALGOV2009 1
NEWFIRM2009 -.147 1
ACCESS2009 -.713** .352 1
DEMAND2009 -.606* .513 .877** 1
INNOCOL2009 -.111 .560 .348 .421 1
PROLEAD2009 -.393 .285 .562 .729** .671* 1
VC2009 -.180 .753** .419 .514 .835** .564 1
EDU2009 -.233 .724** .630* .691* .768** .623* .931** 1
RD2009 -.617* .406 .592* .736** .695* .830** .581* .619* 1
BUSSERV2009 -.289 .743** .723** .809** .624* .635* .790** .913** .607* 1
EEINDEX2009 -.406 .690* .714** .840** .800** .824** .867** .932** .814** .917** 1
HGFIRMS2009 -.457 .265 .601* .605* .386 .634* .554 .564 .465 .685* .659* 1
QUALGOV2012 1.000** -.147 -.713** -.606* -.111 -.393 -.180 -.233 -.617* -.289 -.406 -.457 1
NEWFIRM2012 -.290 .973** .415 .547 .582* .341 .800** .750** .475 .767** .732** .417 -.290 1
ACCESS2012 -.837** .072 .801** .724** .178 .471 .184 .370 .713** .458 .509 .453 -.837** .179 1
DEMAND2012 -.774** .313 .852** .792** .282 .468 .404 .566 .653* .663* .645* .647* -.774** .445 .905** 1
INNOCOL2012 -.057 .524 .260 .341 .893** .576 .690* .589* .588* .471 .664* .209 -.057 .483 .034 .037 1
PROLEAD2012 -.393 .285 .562 .729** .671* 1.000** .564 .623* .830** .635* .824** .634* -.393 .341 .471 .468 .576 1
VC2012 -.449 .355 .732** .826** .412 .763** .411 .519 .563 .717** .719** .780** -.449 .405 .482 .572 .391 .763** 1
EDU2012 -.185 .728** .580* .666* .812** .616* .945** .987** .637* .902** .930** .549 -.185 .744** .340 .523 .663* .616* .509 1
RD2012 -.673* .385 .644* .751** .571 .792** .505 .596* .967** .619* .777** .444 -.673* .447 .779** .682* .479 .792** .560 .592* 1
BUSSERV2012 -.328 .733** .742** .836** .649* .685* .799** .905** .650* .989** .939** .703* -.328 .756** .468 .649* .540 .685* .753** .905** .653* 1
EEINDEX2012 -.646* .479 .858** .932** .591* .828** .617* .751** .859** .848** .905** .739** -.646* .558 .778** .838** .448 .828** .836** .737** .866** .871** 1
HGFIRMS2012 -.376 .447 .632* .648* .782** .702* .861** .856** .694* .785** .877** .776** -.376 .544 .486 .634* .613* .702* .605* .880** .614* .816** .793** 1
QUALGOV2015 .031 -.216 .102 -.067 .331 .297 .189 .097 .084 .067 .146 .370 .031 -.196 -.065 -.152 .495 .297 .265 .160 .049 .152 .111 .407 1
NEWFIRM2015 -.237 .990** .442 .580* .557 .330 .778** .763** .435 .787** .734** .361 -.237 .987** .152 .410 .490 .330 .426 .753** .419 .775** .550 .507 -.215 1
DEMAND2015 -.706* .440 .833** .810** .347 .498 .504 .645* .640* .755** .712** .715** -.706* .572 .817** .981** .083 .498 .623* .602* .654* .734** .857** .679* -.167 .536 .853** 1
INNOCOL2015 .662* -.437 -.521 -.407 -.243 -.163 -.144 -.153 -.384 -.244 -.294 -.161 .662* -.505 -.422 -.498 -.224 -.163 -.322 -.116 -.370 -.259 -.403 -.131 .198 -.476 -.220 -.507 1
PROLEAD2015 -.393 .285 .562 .729** .671* 1.000** .564 .623* .830** .635* .824** .634* -.393 .341 .471 .468 .576 1.000** .763** .616* .792** .685* .828** .702* .297 .330 .494 .498 -.163 1
VC2015 -.049 .532 .416 .532 .051 .186 .463 .555 -.010 .605* .460 .411 -.049 .505 .033 .254 .046 .186 .491 .509 .042 .587* .358 .329 -.131 .583* .277 .345 .082 .186 1
EDU2015 -.218 .678* .633* .705* .717** .613* .906** .992** .589* .903** .915** .566 -.218 .702* .380 .571 .534 .613* .526 .976** .571 .891** .745** .848** .073 .723** .635* .644* -.079 .613* .614* 1
RD2015 -.530 .297 .557 .731** .637* .869** .554 .609* .965** .611* .800** .521 -.530 .358 .693* .605* .544 .869** .598* .636* .946** .659* .855** .718** .184 .326 .697* .587* -.159 .869** .053 .601* 1
BUSSERV2015 -.285 .724** .692* .824** .675* .729** .814** .910** .670* .981** .950** .692* -.285 .739** .431 .595* .572 .729** .760** .913** .671* .992** .865** .813** .163 .761** .663* .683* -.187 .729** .598* .902** .695* 1
EEINDEX2015 -.531 .589* .814** .907** .551 .741** .747** .870** .730** .925** .929** .762** -.531 .656* .654* .786** .399 .741** .777** .846** .752** .934** .939** .831** .072 .662* .825** .833** -.234 .741** .610* .883** .756** .935** 1
HGFIRMS2015 -.334 .457 .585* .653* .663* .658* .731** .706* .612* .658* .785** .570 -.334 .468 .340 .371 .755** .658* .624* .759** .552 .749** .679* .826** .552 .482 .518 .398 -.106 .658* .414 .700* .659* .756** .721** 1
**. Correlation is significant at the 0.01 level (2-tailed)
*. Correlation is significant at the 0.05 level (2-tailed)
16
Table 3 shows the means, minimum and maximum values, and standard deviations of the
entrepreneurial ecosystem elements and outputs in 2009, 2012, and 2015. There is substantial
variation in the values of the different entrepreneurial ecosystem elements, even within a small
country like the Netherlands. Very often the highest ranked region has an absolute value that is
more than double the absolute value of the lowest ranked region. There is also a fifteen-fold
difference in the rate of high-growth firms between regions within the Netherlands. This regional
heterogeneity in the prevalence of high-growth firms is much more substantial than the
heterogeneity in the prevalence of start-ups, as captured with the entrepreneurship culture
element (cf. Stam 2005).
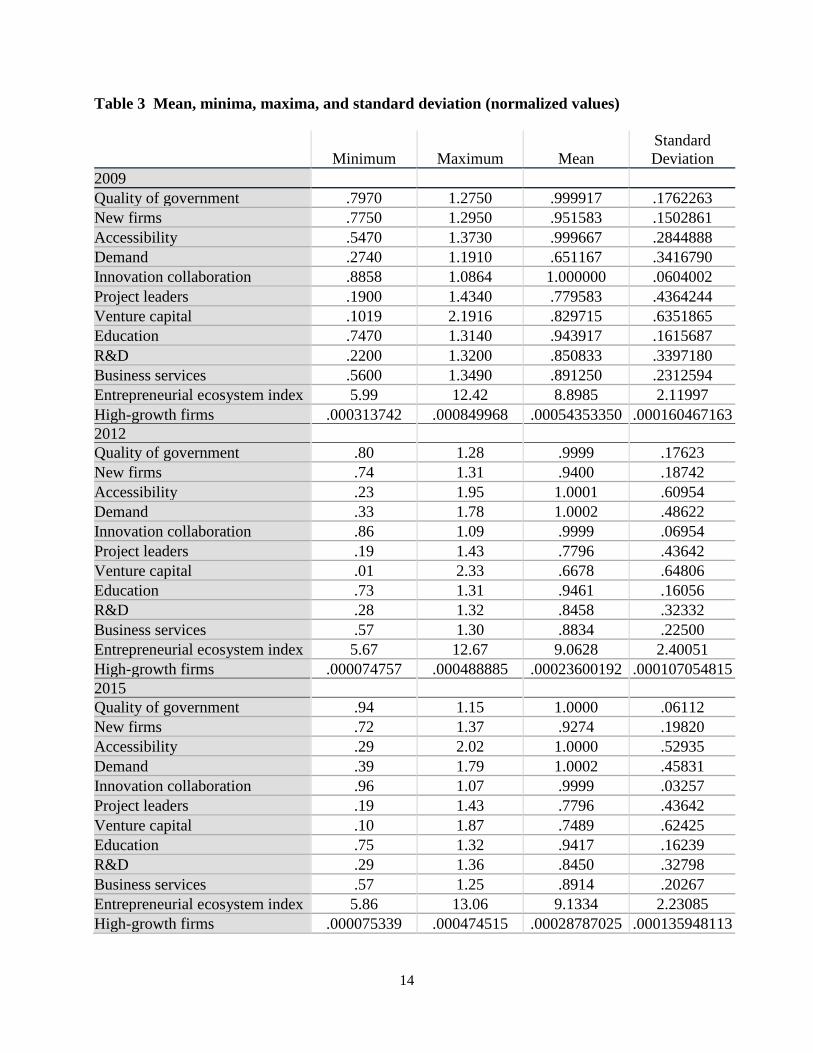
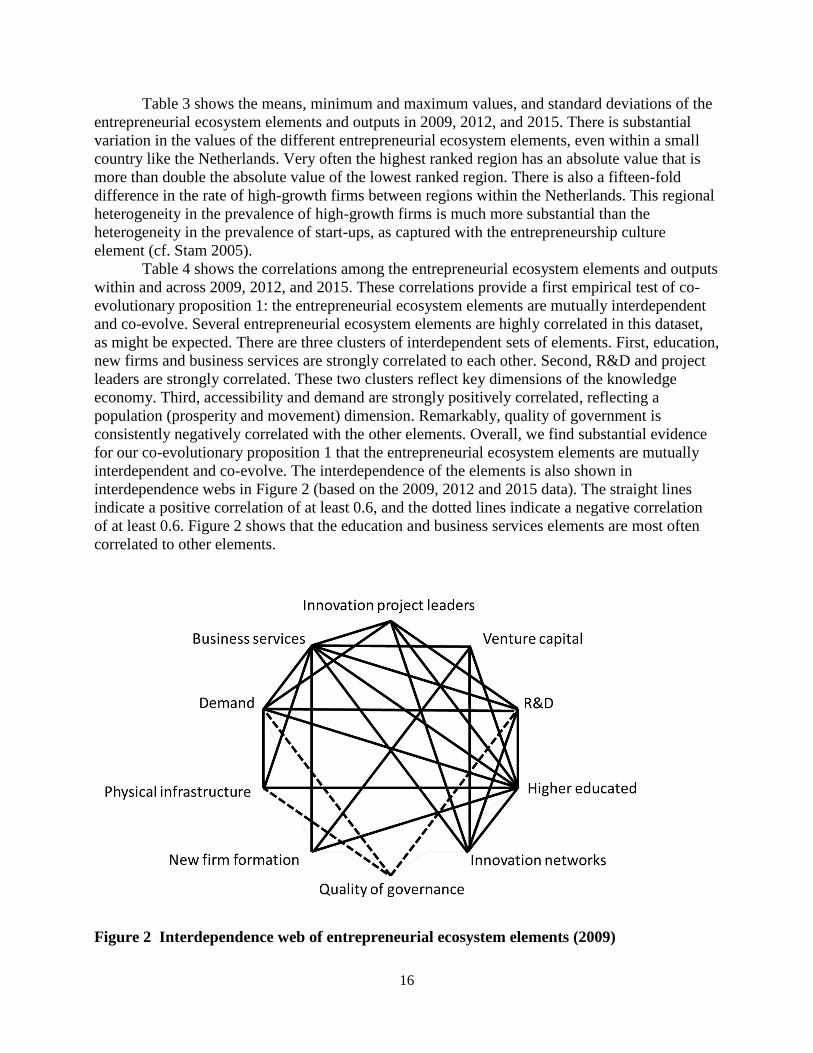
Table 4 shows the correlations among the entrepreneurial ecosystem elements and outputs
within and across 2009, 2012, and 2015. These correlations provide a first empirical test of co-
evolutionary proposition 1: the entrepreneurial ecosystem elements are mutually interdependent
and co-evolve. Several entrepreneurial ecosystem elements are highly correlated in this dataset,
as might be expected. There are three clusters of interdependent sets of elements. First, education,
new firms and business services are strongly correlated to each other. Second, R&D and project
leaders are strongly correlated. These two clusters reflect key dimensions of the knowledge
economy. Third, accessibility and demand are strongly positively correlated, reflecting a
population (prosperity and movement) dimension. Remarkably, quality of government is
consistently negatively correlated with the other elements. Overall, we find substantial evidence
for our co-evolutionary proposition 1 that the entrepreneurial ecosystem elements are mutually
interdependent and co-evolve. The interdependence of the elements is also shown in
interdependence webs in Figure 2 (based on the 2009, 2012 and 2015 data). The straight lines
indicate a positive correlation of at least 0.6, and the dotted lines indicate a negative correlation
of at least 0.6. Figure 2 shows that the education and business services elements are most often
correlated to other elements.
Figure 2 Interdependence web of entrepreneurial ecosystem elements (2009)
17
We performed principal component analyses to uncover dimensions underlying the ten
elements (results available upon request). These analyses revealed the dominance of one
dimension which covered all elements, but formal institutions, in 2009 and 2012, and all
elements, but formal institutions and networks in 2015.
The correlations in Table 4 show that only one of the elements is consistently (positively)
statistically related to subsequent prevalence of high-growth firms, namely business services. We
will more extensively analyse upward causation proposition 2 below, but first focus on the
downward causation proposition 3: prior entrepreneurial activities feedback to increase
entrepreneurial ecosystem elements in a territory. The correlations in Table 4 reveal some
evidence for downward causation as formulated in proposition 3. We find positive feedback
effects of the prevalence of high-growth firms on most of the subsequent values of the ecosystem
elements, although not consistently in all the periods. The prevalence of high-growth firms is
consistently correlated with subsequent levels of demand, prevalence of project leadership, and of
business services. We also find strong positive correlations between the rates of high-growth
firms in 2009-2012 and 2012-2015.
The established empirical literature on the geography of entrepreneurship and economic
development has revealed several factors to be of relevance in explaining the spatial
heterogeneity in entrepreneurship (see Fritsch 2013, Sternberg 2009, Stam 2010; Stam and Spigel
2018). This suggests that there is a limited set of factors, or elements that affects the prevalence
of entrepreneurship in a region. The ‘standard’ methodological procedure in social science for
tracing the effects of individual independent variables, controlling for the effects of the other
independent variables, is a multivariate regression model. However, because of its inherent
connectivity, nonlinearity and openness, a complex system affords limited functional
decomposability (Martin and Sunley 2007), which suggests that the overall functioning of the
entrepreneurial ecosystem cannot be deduced from knowledge of the function of its elements.
Decomposing the entrepreneurial ecosystem into a set of elements and then regressing these on
the output of the entrepreneurial ecosystem, is not adequate for both substantive and statistical
reasons. The substantive reason is that the entrepreneurial ecosystem should be treated as one
system, not as set of independent elements. In an ecosystem there are no direct, one-to-one
relationships. The statistical reason comprises the multicollinearity between the individual
elements (see Table 4 and Figure 2). By constructing an index value, also by multiplying the
composing elements (see Figure 3), we do more justice to the systemic nature of the ecosystem
than can be done with traditional multivariate regressions.
In the next section we will take a systems analytical strategy, and analyse how the
prevalence of high-growth firms relates to the entrepreneurial ecosystem index.
6.2 Entrepreneurial Ecosystem Index
On the basis of existing geography of entrepreneurship studies (see Stam 2010; 2015; Stam and
Spigel 2018), an entrepreneurial ecosystem index is constructed based on ten elements. The
elements that are foundational to the entrepreneurial ecosystem index are listed in Tables 1 and
Table 2. The index compresses a large amount of data: the Dutch entrepreneurial ecosystem
index, with twelve regions (units), is based on ten thousands of data points (for example the value
of the leadership element is based on 2231 innovation projects). For mapping the quality of
entrepreneurial ecosystems, we have constructed an entrepreneurial ecosystem index. The index
is created to compare different spatial units and a rank in terms of multiple features (elements).
18
The spatial unit may be regions or countries, depending on the (policy) audience to which it is
targeted and/or which spatial unit of analysis most adequately covers the relevant mechanisms in
the context of entrepreneurship. Since one unit is stronger in one particular feature and the other
in another feature, it is necessary to find a universal way to compare and summarize them in one
index.
The ten elements of the entrepreneurial ecosystem can be quantified, and be given a
comparable value. This is done by normalizing the average value of each element to 1 and then
let all deviations be relative to one: with elements in regions performing less than the average
having a value below 1, and elements in regions performing better than the average having a
value above 1. The advantage is that this allows us to compose an index value, and compare the
quality of different entrepreneurial ecosystems. This index value is computed in an additive way
(E1+E2+…En). The elements of the index all get the same weight. In a later research phase other
weighting techniques than the equal weighting methodology may be applied, based on either the
opinion of experts or based on statistical properties of the data. The elements are here summed
into one index value, which moves around 10, with regions performing on the average for all
elements scoring an index value of 10, while regions performing above the average for all
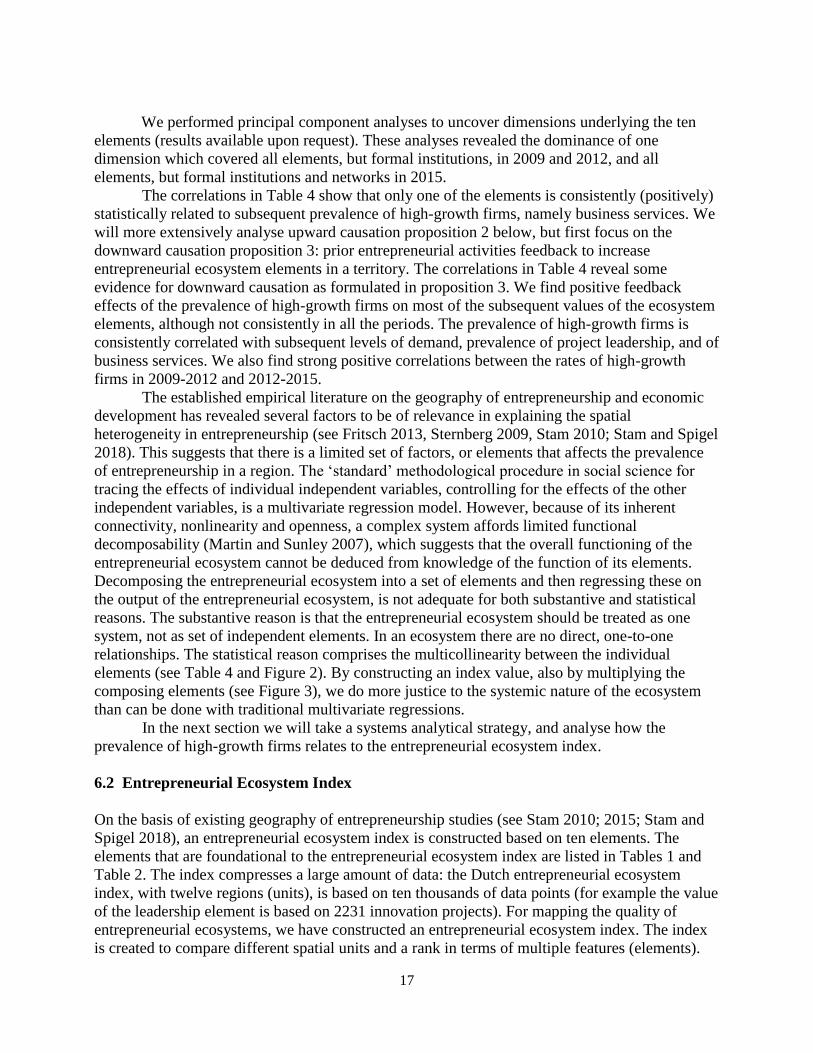
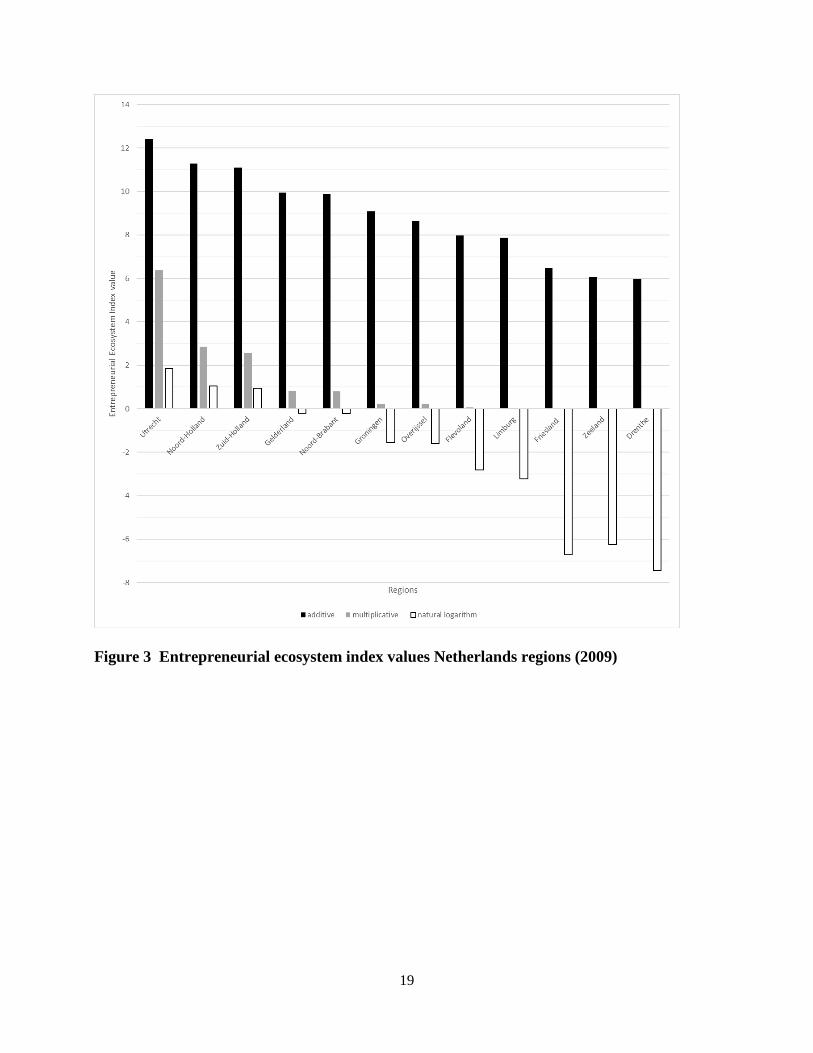
elements scoring an index value higher than 10. This is shown in Figure 3 for provinces in the
Netherlands (2009 data), revealing variation from 12.42 (Utrecht) to 5.99 (Drenthe).
The essence of ecosystems is the interaction among its elements. This interaction is not
adequately covered when an index is constructed as a sum of its elements. If we take the
interactive nature of the system seriously, and the resulting non-linear relations, the index should
be constructed differently. For this we compute an index that is not additive (E1+E2+…En) but
multiplicative (E1*E2*…En). This leads to index values with much larger variation, as the effect
of deviations of the average is now much more substantial. The index values now vary between
0.001 (Drenthe) and 6.376 (Utrecht) (see Figure 3). This leads to substantially more variation in
the index value: the bottom region Drenthe has an index value that is less than 0.01% of the value
of the top performing region Utrecht. This variation is much larger than the 15-fold difference in
the prevalence of high-growth firms in the lowest ranked region 0.003% and the highest ranked
region 0.045%. Even though the multiplicative index better captures the interactive nature of the
system, its external validity seems to be insufficient.
19
Figure 3 Entrepreneurial ecosystem index values Netherlands regions (2009)
20
The disadvantage of this index construction is that elements with above average value
(ranging from 1 to infinity) can have a stronger effect on the index than elements with below
average value (ranging from 0 to 1). To solve this, we take the natural logarithm of the elements,
so that these symmetrically oscillate around 0, with negative values for regions below average,
and positive values for regions above average. This also means that the total index value
oscillates around 0 and not around 10 (see Figure 3). The index values now vary between -2.52
(Drenthe) and 0.67 (Utrecht). Figure 3 indicates that the five lagging regions deviate the most –
negatively – with respect to the quality of their entrepreneurial ecosystem.
We also computed the Z-scores for the individual elements to compose an index value.
The index value based on the Z-scores led to a similar ranking of the regions as the other index
values. Whatever index measure one uses, the rank order of provinces remains largely the same
(results available from the authors upon request). We also performed the same analysis with the
2012 and 2015 data revealing qualitatively similar outcomes.
In addition, we executed several robustness checks on the composition of the index: we
repeated index calculations with nine elements, to see whether this affected the quality rankings
of the entrepreneurial ecosystems. This also did not substantially change the rank orders of the
regions (results available from the authors upon request).
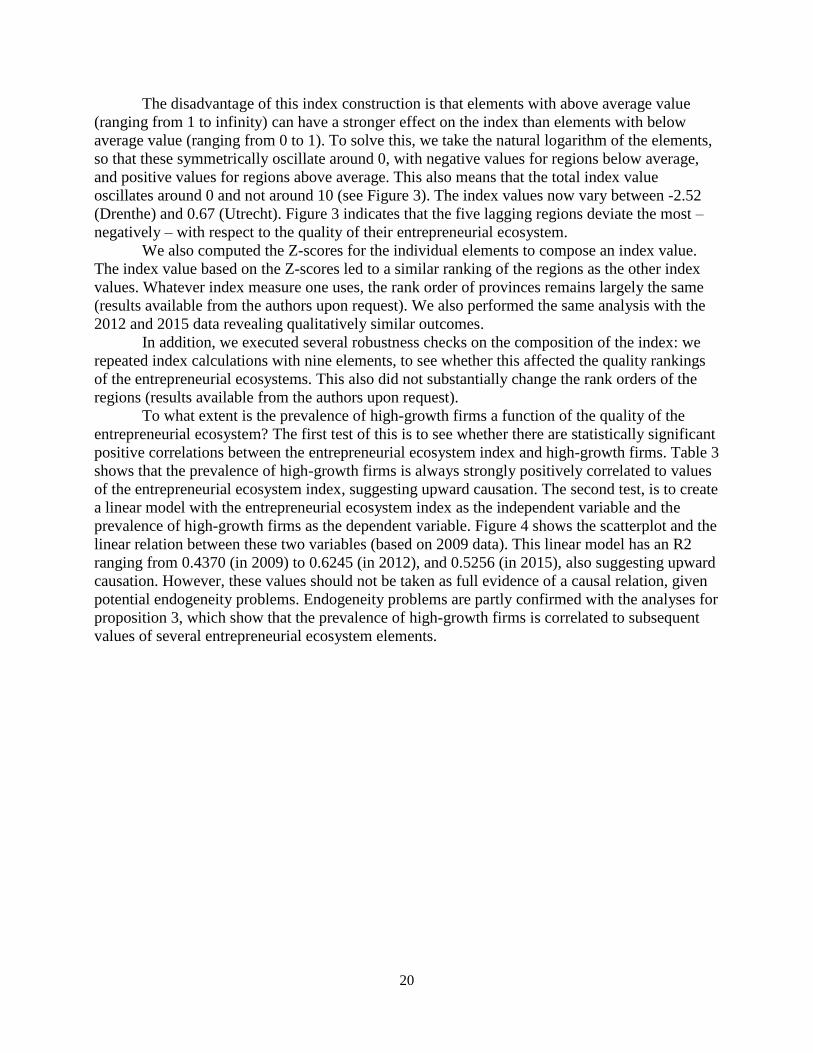
To what extent is the prevalence of high-growth firms a function of the quality of the
entrepreneurial ecosystem? The first test of this is to see whether there are statistically significant
positive correlations between the entrepreneurial ecosystem index and high-growth firms. Table 3
shows that the prevalence of high-growth firms is always strongly positively correlated to values
of the entrepreneurial ecosystem index, suggesting upward causation. The second test, is to create
a linear model with the entrepreneurial ecosystem index as the independent variable and the
prevalence of high-growth firms as the dependent variable. Figure 4 shows the scatterplot and the
linear relation between these two variables (based on 2009 data). This linear model has an R2
ranging from 0.4370 (in 2009) to 0.6245 (in 2012), and 0.5256 (in 2015), also suggesting upward
causation. However, these values should not be taken as full evidence of a causal relation, given
potential endogeneity problems. Endogeneity problems are partly confirmed with the analyses for
proposition 3, which show that the prevalence of high-growth firms is correlated to subsequent
values of several entrepreneurial ecosystem elements.
21
Figure 4 Entrepreneurial ecosystem index and the prevalence of high-growth firms in
Netherlands regions (2009)
7. Discussion
The aim of our entrepreneurial ecosystem model is not to predict, but to better understand how
(entrepreneurial) economies function (Thurik et al., 2013) and in particular how they ‘produce’
entrepreneurship as an emerging property of the system (Arthur, 2013).
7.1 Propositions
We find substantial evidence for our evolutionary proposition 1 that the entrepreneurial
ecosystem elements are mutually interdependent and co-evolve in a territory. There is strong
interdependence in general, and in three clusters of elements in particular. Talent, entrepreneurial
culture and support services are strongly correlated, both simultaneously and over time. The same
counts for knowledge and leadership (in innovation projects), also reflecting interdependencies in
the knowledge economy. We also find strong interdependencies, both simultaneous and over
time, between physical infrastructure and demand. In general, we find very strong positive
22
intertemporal correlations of the values of the individual elements, suggesting strong path
dependence in the evolution of entrepreneurial ecosystems.
Our analyses reveal evidence for the upward causation as spelled out in proposition 2: The
ten entrepreneurial ecosystem elements (combined in one index value) are strongly related to
subsequent levels of entrepreneurial activity in a territory. The ecosystem should be treated as a
whole system: its overall quality is positively related to entrepreneurial output; it should not be
decomposed in ten elements for explaining the relative influence of different elements of the
system.
Finally, our analyses reveal evidence for downward causation as formulated in
proposition 3: Prior entrepreneurial activities feedback into entrepreneurial ecosystem elements
in a territory. We find positive feedback effects of the prevalence of high-growth firms on most
of the subsequent values of the ecosystem elements, although not consistently in all the periods.
We also find strong positive correlations between the rate of high-growth firms at T0 and the rate
at T3. The lack of consistent evidence for temporal feedback might be related to our crude,
relatively short term (3 year lagged) analysis of the presumed feedback effects. More refined in-
depth qualitative research might reveal that founders of high-growth firms, later in life become
active as leader or venture capitalist in their region, which is not captured in our data.
The tests of our propositions should not be seen as direct tests of causal mechanisms, but
as indications of tendencies, derived from a very specific setting in time and space.
7.2 A systems perspective
As noted before, most studies of the context of entrepreneurship have been qualitative case
studies that provide rich descriptions of entrepreneurial ecosystem constructs and elements, but
do not provide information about how these constructs and elements are related to each other and
to entrepreneurial outcomes. This study took a quantitative approach to empirically defining and
measuring how these elements are statistically related. In doing so we found that the empirical
indicators of ten ecosystem elements are very highly correlated and that a combined index of
these elements statistically explain large variations in entrepreneurial outcomes in Dutch regions.
Indeed, these high correlations provide strong evidence for the value of a systemic approach to
understanding entrepreneurial ecosystems.
Such a systems approach goes back to Simon (1962) who described complex
organizational systems as (nearly) decomposable into subsystems in which a limited number of
elements interact more directly with one another than they do with other elements of the system
beyond the boundaries of the subsystem concerned. A systems approach focuses on the
emergence of effects at the level of the entire system, and looks at the relative performance
outcomes of entire sets of multiple elements (Drazin and Van de Ven 1985). The focus is on the
working of the entire system of factors.
With the construction of an entrepreneurial ecosystem index we have quantitatively
captured the systemic nature of entrepreneurial ecosystems. This quantitative approach provides a
complement to qualitative approaches that identify and describe entrepreneurial ecosystems as
sets of multiple characteristics (Mack and Mayer 2016; Spigel 2017). In the future, studies could
identify whether a particular number, proportion, or combination of factors is in place, and use
Boolean comparative analysis (Ragin 1987; Mahoney, 2003) to trace causal relations in the
evolution of entrepreneurial ecosystems. One recent example of this, applying fuzzy-set
qualitative comparative analysis is Vedula and Fitza (2019), revealing the configurations of
23
regional factors associated with high levels of (venture-backed) entrepreneurial activity in U.S.
regions.
The systems model of an entrepreneurial ecosystem developed in this paper has important
implications for entrepreneurship theory and practice. First, it requires scholars and policy
makers to become more sensitive to the macro context of entrepreneurship; too often context has
been treated as ‘exogenous’ where it is not included in the conceptual framework, but ‘taken for
granted, its influence underappreciated or … controlled away’ (Welter 2011, p. 173–4). As a
result, previous work in entrepreneurship has tended to overlook the role of context in order to
produce generalizable models of entrepreneurial activity when instead context should be the
specific focus of investigation. A context such as location should not be treated as a simple
control variable or proxy; a deeper examination is required of how cultural, social, political, and
economic structures and processes associated with a region influence all aspects of the
entrepreneurial ecosystem.
Second, the ecosystem concept emphasizes that entrepreneurship is not limited to the for-
profit sector; numerous entrepreneurial actors in the public and not-for-profit sectors play crucial
roles in facilitating or constraining elements of an ecosystem. By understanding the roles of
diverse actors and how they interact to develop an entrepreneurial ecosystem, future research on
the micro-foundations of entrepreneurship can begin to study how the risk, time, and cost to an
individual entrepreneur are significantly influenced by developments in the ecosystem.
Third, the systems framework has important implications for individual entrepreneurs. It
emphasizes that any given entrepreneurial firm is but one actor, able to perform only a limited set
of roles, and dependent on many other actors to accomplish all the functions or elements for an
ecosystem to thrive. As a consequence, an individual entrepreneur must make strategic choices
concerning the kinds of proprietary resource endowments and institutional functions in which it
will participate and what other actors it will engage to achieve self-interest and collective
objectives. These strategic choices make clear that the ways entrepreneurial firms choose to
allocate their efforts are variables and that the lines separating the firm from its entrepreneurial
community are not sharply drawn but are fluid and change frequently over time. These choices
and transactions evolve over time, not only as a result of individual firm behavior but just as
importantly by the interdependencies that accumulate among firms engaged in numerous
components of the emerging ecosystem.
7.3 Limitations.
Our study of entrepreneurial ecosystems in twelve Netherlands regions explored how elements of
entrepreneurial ecosystems can be measured and related to their outputs. Although limited to
three data collection waves we also examined temporal developments in ecosystems over time.
In doing so, we moved from the ecosystem metaphor to a complex system model of the
entrepreneurial economy, at least from an epistemological point of view (Martin and Sunley
2007). Our analysis is based on a small sample (twelve regions in three points in time, totalling
36 observations) in one specific country (The Netherlands). To arrive at more robust findings,
this analysis should be repeated in other regions (for example city-regions in larger European
countries, the USA or China) and multiple periods (preferably ten years or more, to trace long-
term dynamics). This would also allow for feedback effects of the entrepreneurial output on the
entrepreneurial ecosystem. The analyses should also be repeated in other contexts, potentially
revealing different relations between the entrepreneurial ecosystem and its output.
24
We also noted that while the conceptual definitions of constructs and elements to be
generalizable to most entrepreneurial ecosystems, availability of data and empirical indicators
may require context-specific measurement in the field setting of a study. Some of the measures of
ecosystem elements in Dutch regions may not be available in other regions, or better measures
might be available in other regions. Hence, at the level of measurement researchers will need to
identify and adopt indigenous indicators of entrepreneurial ecosystem elements and constructs.
Finally, future research should study entrepreneurial ecosystems over a longer period to
time than the three data collection waves over a six-year period in this study. The high inter-
temporal autocorrelations found in this study indicate longer time periods are needed to examine
changes in entrepreneurial ecosystem elements. By doing so we may find that elements of an
ecosystem develop and change unevenly over time. As a result, uneven temporal developments of
ecosystem elements may act as bottle-necks inhibiting entrepreneurship in a region (Szerb and
Acs 2011). Moreover, the very ecosystem elements that are created to facilitate the emergence of
entrepreneurship in one area may hinder subsequent development in other areas. This generative
process has a dynamic history of creative destruction (Schumpeter 1934) that is important to
study if we are to understand entrepreneurship and economic development.
25
References
Acemoglu, D., Johnson, S., & Robinson, J.A. (2005). Institutions as a Fundamental Cause of
Long-Run Growth. In: Aghion, P. & Durlauf, S. (ed) Handbook of Economic Growth.
Amsterdam: Elsevier.
Acs, Z.J. & Armington, C. (2004). The impact of geographic differences in human capital on
service firm formation rates. Journal of Urban Economics, 56(2), 244–278.
Acs Z.J., Autio, E., Szerb, L. (2014). National Systems of Entrepreneurship: Measurement Issues
and Policy Implications. Research Policy, 43(3), 476–449.
Acs, Z.J., Braunerhjelm, P., Audretsch, D.B., & Carlsson, B. (2009). The knowledge spillover
theory of entrepreneurship. Small Business Economics, 32(1), 15-30.
Acs, Z. J., Stam, E., Audretsch, D. B., & O’Connor, A. (2017). The lineages of the
entrepreneurial ecosystem approach. Small Business Economics, 49(1), 1–10.
Aldrich, H.E. (1990). Using Ecological Perspective to Study Organizational Founding Rates.
Entrepreneurship Theory and Practice, 14(3), 7-24.
Aldrich, H.E. & Fiol, C.M. (1994). Fools rush in? The institutional context of industry creation.
Academy of Management Review, 19(4), 645-670.
Annoni, P. & Kozovska, K. (2010). EU Regional Competitiveness Index 2010. Brussels:
European Commission, Joint Research Centre.
Annoni, P. & Dijkstra, L. (2013). EU Regional Competitiveness Index RCI 2013. Brussels:
European Commission: Brussels.
Aoyama, Y. (2009). Entrepreneurship and regional culture: the case of Hamamtsu and Kyoto,
Japan. Regional Studies, 43(3), 495–512.
Arthur, W.B. (2013). Complexity Economics: A Different Framework for Economic Thought.
Santa Fe Institute Working Paper.
Arundel, A. & Smith, K. (2013). History of the community innovation survey. In Gault, F. (ed.).
Handbook of innovation indicators and measurement. Cheltenham: Edward Elgar, pp.60-
87.
Astley, W.G. (1985). The two ecologies: population and community perspectives on
organizational evolution. Administrative Science Quarterly, 30, 224-241.
Astley, W.G. & Van de Ven, A.H. (1983). Central perspectives and debates in organization
theory. Administrative Science Quarterly, 28, 245-273.
Audretsch D.B. & Lehmann, E.E. (2005). Does the knowledge spillover theory of
entrepreneurship hold for regions? Research Policy, 34(8), 1191-1202.
Audretsch, D. & Link, A. (2012). Entrepreneurship and innovation: Public policy frameworks.
Journal of Technology Transfer, 37, 1-17.
Audretsch, D., Heger, D. & Veith, T. (2015). Infrastructure and entrepreneurship. Small Business
Economics, 44(2), 219-230.
Autio, E., Kenny, M., Mustar, P., Siegel, D. & Wright, M. (2014). Entrepreneurial innovation:
The importance of context. Research Policy, 43, 1097-1108.
Bahrami, H., & Evans, S. (1995). Flexible re-cycling and high-technology entrepreneurship.
California Management Review, 37, 62–89.
Baumol, W.J. (1990). Entrepreneurship: Productive, Unproductive, and Destructive. Journal of
Political Economy, 98(5), 893-921.
Baumol, W.J. (1993) Entrepreneurship, Management and the Structure of Payoffs. London: MIT
Press.
26
Bos J.W., & Stam, E. (2014). Gazelles and industry growth: a study of young high-growth firms
in The Netherlands. Industrial and Corporate Change, 23(1), 145-169.
Bosma, N., Hessels, J., Schutjens, V., Van Praag, M., & Verheul, I. (2012). Entrepreneurship and
role models. Journal of Economic Psychology, 33(2), 410-424.
Braunerhjelm, P., Acs, Z. J., Audretsch, D. B., & Carlsson, B. (2010). The missing link:
knowledge diffusion and entrepreneurship in endogenous growth. Small Business
Economics, 34(2), 105-125.
Charron, N., Lapuente, V. & Dijkstra, L. (2012). Regional governance matters: A study on
regional variation in quality of government within the EU. Brussels: DG Regional Policy
Working papers WP01/2012.
Cohen, W. M., & Levinthal, D. A. (1989). Innovation and learning: the two faces of R & D. The
Economic Journal, 99(397), 569-596.
Credit, K., Mack, E. A., & Mayer, H. (2018). State of the field: Data and metrics for geographic
analyses of entrepreneurial ecosystems. Geography Compass, 12(9), e12380.
Criscuolo, C., Gal, P.N. & Menon, C. (2014). The dynamics of employment growth. Paris:
OECD.
Davidsson, P. (2004). Researching entrepreneurship. New York: Springer.
Dijkstra, L., Annoni, P. & Kozovska, K. (2011). A New Regional Competitiveness Index: Theory,
Methods and Findings. Brussels: European Union.
Dubini, P. (1989). The influence of motivations and environment on business start-ups: some
hints for public policies. Journal of Business Venturing, 4(1), 11–26.
Financieele Dagblad (2013). Gazellen. Amsterdam: FD Media Group
Feld, B. (2012). Startup Communities: Building an Entrepreneurial Ecosystem in Your City. New
York: Wiley.
Feldman, M.P. (2001). The entrepreneurial event revisited: firm formation in a regional context.
Industrial and Corporate Change, 10(4), 861–891.
Feldman, M.P. (2014). The character of innovative places: entrepreneurial strategy, economic
development, and prosperity. Small Business Economics, 43, 9–20.
Feldman, M. & Zoller, T.D. (2012). Dealmakers in place: social capital connections in regional
entrepreneurial economies. Regional Studies, 46(1), 23–37.
Foray, D. (2004). Economics of knowledge. Boston: MIT press.
Freeman, J.H. & Audia, P.G. (2006) Community ecology and the sociology of organizations.
Annual Review of Sociology, 32, 145-169.
Fritsch, M. (2013). New business formation and regional development – A Survey and
Assessment of the Evidence. Foundations and Trends in Entrepreneurship 9, 249–364.
Fritsch, M., & Wyrwich, M. (2014). The long persistence of regional levels of entrepreneurship:
Germany, 1925–2005. Regional Studies, 48(6), 955-973.
Gnyawali, D.R., & Fogel, D.S. (1994). Environments for entrepreneurship development: Key
dimensions and research implications. Entrepreneurship Theory and Practice, 18(4), 43–
63.
Granovetter, M. (1992). Economic institutions as social constructions: a framework for analysis.
Acta Sociologica, 35(1), 3-11.
Guzman, J., & Stern, S. (2016). The state of American entrepreneurship: New estimates of the
quantity and quality of entrepreneurship for 15 US states, 1988-2014. Cambridge, Mass:
National Bureau of Economic Research. (No. w22095).
Haltiwanger, J., Jarmin, R.S. & Miranda, J. (2013). Who creates jobs? Small versus large versus
young. Review of Economics and Statistics, 95(2), 347-361.
27
Hawley, A. (1950). Human ecology: A theory of community structure. New York: Ronald Press.
Henrekson, M. & Johansson, D. (2010). Gazelles as job creators: a survey and interpretation of
the evidence. Small Business Economics, 35(2), 227-244.
Henrekson, M. & Sanandaji, T. (2014). Small business activity does not measure
entrepreneurship. Proceedings of the National Academy of Sciences, 111(5), 1760–1765.
Hoang, H., & Antoncic, B. (2003). Network-based research in entrepreneurship: A critical
review. Journal of Business Venturing, 18(2), 165-187.
Howells, J. (2006). Intermediation and the role of intermediaries in innovation. Research Policy,
35(5), 715-728.
Isenberg D.J. (2010). How to Start an Entrepreneurial Revolution. Harvard Business Review,
88(6), 41-50.
Jack, S. L. (2010). Approaches to studying networks: Implications and outcomes. Journal of
Business Venturing, 25(1), 120-137.
Kerr, W.R. & Nanda, R. (2009). Democratizing entry: Banking deregulations, financing
constraints, and entrepreneurship. Journal of Financial Economics 94(1), 124-149.
Lee, S.Y., Florida, R. & Acs, Z.J. (2004). Creativity and entrepreneurship: a regional analysis of
new firm formation. Regional Studies, 38(8), 879–891.
Lindblom, C.E. (1965). The Intelligence of Democracy: Decision Making Through Mutual
Adjustment. New York: The Free Press.
Mack, E. & Mayer, H. (2016). The evolutionary dynamics of entrepreneurial ecosystems. Urban
Studies, 53(10), 2118–2133.
Mahoney, J. (2003). Strategies of causal assessment in comparative historical analysis. In:
Mahoney, J., & Rueschemeyer, D. (eds.). Comparative historical analysis in the social
sciences. Cambridge: Cambridge University Press. pp. 337-72.
Malecki, E.J. (1997). Entrepreneurs, networks, and economic development: a review of recent
research. In Katz, J.A. (ed.), Advances in Entrepreneurship, Firm Emergence, and Growth,
Vol. 3, pp. 57–118. Greenwich, CT: JAI Press.
Malecki, E.J. (2011). Connecting local entrepreneurial ecosystems to global innovation networks:
open innovation, double networks and knowledge integration. International Journal of
Entrepreneurship and Innovation Management, 14(1), 36–59.
Malecki, E. J. (2018). Entrepreneurship and entrepreneurial ecosystems. Geography Compass,
12(3), e12359.
Mason, C. M., & Harrison, R. T. (2006). After the exit: Acquisitions, entrepreneurial recycling
and regional economic development. Regional Studies, 40(1), 55-73.
Martin, R. & Sunley, P. (2007). Complexity thinking and evolutionary economic geography.
Journal of Economic Geography, 7(5), 573-601.
Mattsson, L.G. (1987). Management of strategic change in a “markets-as-networks” perspective.
In A. Pettigrew (Ed.), The strategic management of change. London: Basil Blackwell.
Nambisan, S. Baron, R.A. (2013). Entrepreneurship in innovation ecosystems: Entrepreneurs’
self-regulatory processes and their implications for new venture success. Entrepreneurship
Theory & Practice, 37(5), 1071-1097.
North, D.C. (1990). Institutions, Institutional Change and Economic Performance. New York:
Cambridge University Press.
Nijkamp, P. (2003). Entrepreneurship in a modern network economy. Regional Studies, 37(4),
395–405.
OECD (2011). Entrepreneurship at a Glance 2011. Paris: OECD Publishing.
http://dx.doi.org/10.1787/9789264097711-en
28
Olberding, J. C. (2002a). Diving into the “third waves” of regional governance and economic
development strategies: A study of regional partnerships for economic development in US
metropolitan areas. Economic Development Quarterly, 16(3), 251-272.
Olberding, J. C. (2002b). Does regionalism beget regionalism? The relationship between norms
and regional partnerships for economic development. Public Administration Review, 62(4),
480-491.
Ostrom, E. (2010). Beyond Markets and States: Polycentric Governance of Complex Economic
Systems. American Economic Review, 100(3), 641-72.
Kenney, M., & Von Burg, U. (1999). Technology, entrepreneurship and path dependence:
industrial clustering in Silicon Valley and Route 128. Industrial and Corporate Change,
8(1), 67-103.
Pennings, J.M. (1982). The urban quality of life and entrepreneurship. Academy of Management
Journal, 25(1), 63–79.
Qian, H., Acs, Z.J. & Stough, R.R. (2013). Regional systems of entrepreneurship: the nexus of
human capital, knowledge and new firm formation. Journal of Economic Geography,
13(4), 559-587.
Ragin, C.C. (1987). The comparative method: moving beyond qualitative and quantitative
strategies. Berkeley: University of California Press.
Reynolds, P., Bosma, N., Autio, E., Hunt, S., De Bono, N., Servais, I., Lopez-Garcia, P. & Chin,
N. (2005). Global entrepreneurship monitor: Data collection design and implementation
1998–2003. Small Business Economics, 24(3), 205-231.
Romer, P.M. (1989). Human capital and growth: theory and evidence. National Bureau of
Economic Research. Working paper 3173
Saxenian, A. (1994). Regional Advantage: Culture and Competition in Silicon Valley and Route
128. Cambridge, MA: Harvard University Press.
Schumpeter, J.A. (1934). The Theory of Economic Development. Cambridge MA: Harvard
University Press.
Shane, S. (2009). Why encouraging more people to become entrepreneurs is bad public policy.
Small Business Economics, 33(2), 141–149.
Shane, S. & Venkataraman, S. (2000). The promise of entrepreneurship as a field of research.
Academy of Management Review, 25(1), 217–226.
Simon, H.A. (1962). The architecture of complexity. Proceedings of the American Philosophical
Society, 106, 467-482.
Sotarauta, M., Beer, A., & Gibney, J. (2017). Making sense of leadership in urban and regional
development. Regional Studies, 51(2), 187-193
Spiekermann, K. & Wegener, M. (1996). Trans-European Networks and unequal accessibility in
Europe. European Journal of Regional Development, 4, 35–42.
Spiekermann, K., Wegener, M. & Copus, A. (2002). Review of Peripherality Indices and
Identification of ’Baseline Indicator: Deliverable 1 of AsPIRE – Aspatial Peripherality,
Innovation, and the Rural Economy. Dortmund/Aberdeen: S&W, IRPUD, SAC.
Spigel, B. (2017). The Relational Organization of Entrepreneurial Ecosystems. Entrepreneurship
Theory and Practice, 41, 49–72.
Stam, E. (2005). The geography of gazelles in the Netherlands. Tijdschrift voor Economische en
Sociale Geografie, 96(1), 121-127.
Stam, E. (2010). Entrepreneurship, evolution and geography. In: Boschma, R. & Martin, R.L.
(eds) The Handbook of Evolutionary Economic Geography. Cheltenham: Edward Elgar. pp.
307-348.
29
Stam, E. (2015). Entrepreneurial Ecosystems and Regional Policy: A Sympathetic Critique.
European Planning Studies, 23(9), 1759-1769.
Stam, E. & Bosma, N.S. (2015). Local policies for high-growth firms. In: Audretsch, D., Link, A.
& Walshok, A. (eds) The Oxford Handbook of Local Competitiveness. Oxford: Oxford
University Press, pp. 286-305.
Stam. E., Bosma, N., Van Witteloostuijn, A., De Jong, J., Bogaert, S., Edwards, N., Jaspers, F.
(2012). Ambitious Entrepreneurship. A review of the academic literature and new
directions for public policy. The Hague: Advisory Council for Science and Technology
Policy (AWT).
Stam, E., Hartog, C., Van Stel, A. & Thurik, R. (2011). Ambitious Entrepreneurship and Macro-
Economic growth. In: Minniti, M. (ed.) The Dynamics of Entrepreneurship. Evidence from
the Global Entrepreneurship Monitor Data. Oxford: Oxford University Press, pp. 231-249.
Stam, E., Romme, A.G.L., Roso, M., Van den Toren, J.P. & Van der Starre, B.T. (2016)
Knowledge Triangles in the Netherlands. An entrepreneurial ecosystem approach. Report
for the OECD Technology and Innovation Policy Working Group.
Stam, E. & Spigel, B. (2018). Entrepreneurial Ecosystems. In: Blackburn, R., De Clercq, D., &
Heinonen, J. (eds) The SAGE Handbook of Small Business and Entrepreneurship. London:
SAGE, pp. 407-422.
Stam, E. & Van Stel, A. (2011). Types of Entrepreneurship and Economic Growth. In: Goedhuys,
M., Naudé, W. & Szirmai, E. (eds) Innovation, Entrepreneurship and Economic
Development. Oxford: Oxford University Press, pp. 78-95.
Sternberg, R. (2007). Entrepreneurship, proximity and regional innovation systems. Tijdschrift
voor Economische en Sociale Geografie, 98(5), 652–666.
Sternberg, R. (2009). Regional Dimensions of Entrepreneurship, Foundations and Trends® in
Entrepreneurship, 5(4), pp. 211-340.
Steyaert, C. & Katz, J. (2004). Reclaiming the space of entrepreneurship in society: geographical,
discursive and social dimensions. Entrepreneurship and Regional Development, 16(3),
179–196.
Szerb, L. & Acs, Z.J. (2011). The Global Entrepreneurship and Development Index methodology.
Tansley, A. J. (1935). The use and abuse of vegetational concepts and terms. Ecology, 16, 284-
307.
Thurik, R., Stam, E. & Audretsch, D. (2013). The Rise of the Entrepreneurial Economy and the
Future of Dynamic Capitalism. Technovation, 33(8-9), 302-310.
Tsvetkova, A. (2015). Innovation, entrepreneurship, and metropolitan economic performance:
empirical test of recent theoretical propositions. Economic Development Quarterly, 29(4),
299–316.
Unger, J. M., Rauch, A., Frese, M., & Rosenbusch, N. (2011). Human capital and entrepreneurial
success: A meta-analytical review. Journal of Business Venturing, 26(3), 341-358.
Van de Ven, A.H. (1993). The development of an infrastructure for entrepreneurship. Journal of
Business Venturing, 8, 211-230.
Van de Ven, A.H. & Garud, R. (1993) Innovation and industry development: The case of
cochlear implants. In R. Burgelman & R. Rosenbloom (eds.) Research on Technological
Innovation, Management and Policy (vol. 5, pp. 1-46) Greenwich, CT: JAI Press.
Van de Ven, A.H., Polley, D., Garud, R. & Venkataraman, S. (1999). The Innovation Journey.
New York: Oxford University Press.
30
Vedula, S., & Fitza, M. (2019) Regional Recipes: A Configurational Analysis of the Regional
Entrepreneurial Ecosystem for US Venture Capital-Backed Startups. Strategy Science, 4(1),
4-24.
Welter, F. (2011), Contextualizing entrepreneurship – conceptual challenges and ways forward.
Entrepreneurship Theory and Practice, 35, 165–184.
Woolley, J. (2017), Infrastructure for Entrepreneurship. Oxford Research Encyclopedia of
Business and Management. Oxford: Oxford University Press.
Wong P.K., Ho, Y.P. & Autio, E. (2005). Entrepreneurship, innovation and economic growth:
Evidence from GEM data. Small Business Economics, 24(3), 335-350.
World Economic Forum (2013). Entrepreneurial Ecosystems Around the Globe and Company
Growth Dynamics. Davos: World Economic Forum.
Zahra, S.A. (2007). Contextualizing theory building in entrepreneurship research. Journal of
Business Venturing, 22(3), 443–452.
Zahra, S.A., Wright, M. & Abdelgawad, S.G. (2014). Contextualization and the advancement of
entrepreneurship research. International Small Business Journal, 32(5), 479–500.
Zhang, Y. & Li, H. (2010). Innovation search of new ventures in a technology cluster: the role of
ties with service intermediaries. Strategic Management Journal, 31(1), 88-109.