environmental and csi reporting in south african mncs
TRANSCRIPT

Environmental and CSI Reporting in South African MNCs
A review of company reporting practices with regards to Corporate Social Responsibility and
the Environment. The review is conducted for 16 companies of varied sectors for the 2011
and 2012 financial year.
Labour Research Service
http://www.lrs.org.za
Lawule Shumane and Michelle Taal
November 2013
Contents Introduction ............................................................................................................................................ 1
Objective ............................................................................................................................................. 1
Overview ............................................................................................................................................. 1
Methodology ....................................................................................................................................... 3
Corporate Social Responsibility (CSR) Reporting .................................................................................... 4
CSR Spend ........................................................................................................................................... 4
CSR Spend Proportions by Companies in the sample ......................................................................... 5
Community Involvement .................................................................................................................... 9
Labour Relations ............................................................................................................................... 10
Labour Rights .................................................................................................................................... 13
Environmental Reporting ...................................................................................................................... 13
Environmental Reporting Practices .................................................................................................. 14
Environmental Impact Indicators ...................................................................................................... 18
Recommendations ................................................................................................................................ 19
CSR reporting: ............................................................................................................................... 19
Environmental Reporting: ............................................................................................................. 21
Conclusions ........................................................................................................................................... 21
References ............................................................................................................................................ 22

1
Introduction Sustainability has been defined as the practices which meet the needs of the present
generation without compromising the ability of future generations to meet their own needs
(ERIS, 2013). The sustainability of business operations has increasingly come to include both
social and environment components. In this way, companies are encouraged to
acknowledge their impact on the communities of their employees and the environment in
which they operate.
Objective
As a first report based on information from the South African Multinational Company
Database, the objective is to provide a partial trend analysis of the reporting practices of 16
JSE listed South African Multinational Companies as previously selected by the Global
Unions as being of particular interest. A partial trend analysis is provided due to the fact that
there are only two periods of observations for each company analysed. This first report
forms a baseline study for future annual reporting and analysis. The aim is to provide
knowledge such that stakeholders, particularly unions, can engage with companies and
sectors on broader issues and in solidarity with other broader civil society organisations.
Overview
Trade between countries, and certainly at levels of business interactions between countries,
can be understood according to global value chains (GVCs). These global chains describe all
the activities involved in the production of goods and services from their conception to their
end use1. As countries begin to source more of their inputs from varied locations and
operate across the borders of different nations, it has become important to analyse and
understand value chains due to their impact workers and the environment (UNCTAD, 2013).
For the purposes of this report, however, the understanding of value chains is limited only
to the transnational operations of companies and its implications on the social and
environmental conditions of the countries in which these multinationals operate – even
considering the importance of supply chain interactions in company reporting patterns.
1 http://www.globalvaluechains.org/concepts.html

2
The 2013 World Investment Report notes that participation in GVCs tends to exert a
downward pricing pressure on operations. This, in turn, has a negative effect on social and
environmental compliance by companies (UNCTAD, 2013). Cost cutting strategies have
particularly devastating effects for developing countries as these countries are home to the
majority of the world’s marginalised populations.
Developing countries are believed to have more lenient social and environmental standards
making it easier for multinational companies operating there not comply with
internationally desirable environmental and social standards without censure (UNCTAD,
2013). In countries where this is the case, companies have little incentive to comply with the
standards established in the developed world which they view as a further cost to doing
business. Global reporting guidelines like the OECD Guidelines for Multinationals (2011) do
encourage companies to behave responsibly in all their operations.
Beyond avoiding the obvious negative impacts they may make on societies by breaking
international standards of corporate behaviour, companies are understood to have possible
positive impacts on the locations in which they establish operations, providing jobs, the
advancement of skills, access to communications and the like. Companies that limit their
engagement with communities and the environment in which they operate may also limit
the developmental capacity in these locations as community development is widely
considered to be driven also by the private sector. If companies do not invest in the
communities of their employees in the countries in which they operate, this will ultimately
slow down the development. It is essential for affected stakeholders to demand that
multinational enterprises and the companies in their value chains comply with international
requirements and where possible to advance on these standards.
International standards developed by the United Nations Global Compact (2013) promote a
precautionary approach to the environment and encourage the diffusion of environmentally
friendly technologies into company operations. In this way, companies are able to tie their
approach to sustainable development in to their core competencies and business activities.
National standards advanced by the King III Reporting Standards require that companies
report on all the impacts of doing business as well as their perceived and known effects on
communities and the environment. In reporting for their operations in South Africa, King III

3
also requires that companies report on how they support social transformation. In this way
companies are required to disclose how they advance previously disadvantaged employees
(King III, 2009).
In reviewing the company’s social responsibility, the Global Reporting Initiative encourages
companies to also disclose their labour practices in all operations (GRI, 2013). This
requirement is also supported by the Johannesburg Stock Exchange Social Reporting Index
(JSE SRI) (JSE SRI, 2012). This includes how well companies adhere to the standards of
“decent work2” and their investment in their workers through human capital development.
When companies develop the skills of their employees, they also invest in the growth of the
nations’ economy.
The JSE SRI affirms that company reporting on social, environmental and good governance
criteria must be done for the whole group (JSE SRI, 2012). In this way, South African listed
companies should adhere to global standards for reporting on all performance indicators
(social and environmental included) and conform to national requirements in cases specific
to that countries operations (for instance, South Africa requires reporting on
transformation).
Methodology
This report reviews 16 South African companies which have operations in other countries in
Africa. These companies form part of the LRS/FES Multinational Company Database,
http://www.lrs.org.za/mnc.
An assessment of the companies’ reporting on corporate social responsibility (CSR) and
environmental performance was made from a set of indicators defined by the database. For
CSR reporting an assessment of the company’s involvement in the community and the
investment in human capital was conducted. For environmental reporting the focus was on
the reporting standards of the company as well as the major environmental factors that
affect company operations.
2 Concept of decent work has been advanced by the International Labour Organisation and requires that workers have
opportunities for work that is productive and delivers a fair income, security in the workplace and social protection for families, better prospects for personal development and social integration, freedom for people to express their concerns, organize and participate in the decisions that affect their lives and equality of opportunity and treatment for all women and men. http://www.ilo.org/global/topics/decent-work/lang--en/index.htm

4
Table 1: South African MNCs included in the Report
Corporate Social Responsibility (CSR) Reporting
CSR Spend
In 2011, the 16 companies under review reported spending a total of 228 million USD
towards corporate social investment. In 2012, CSR contributions increased by 22.2 per cent.
Though the increases are nominal, they remain above the levels of inflation in South Africa5.
The 16 companies contributed more to the CSR spend even they were on average less
profitable by 8.4 per cent in 2011. One would expect that company profitability would be 3 Latest year-end with used in for the analysis.
4 SABMiller recognises 13 operations in Africa (including South Africa) and has an additional 20 countries where it has
associate operations. www.sabmiller.com 5 In 2012, annual inflation in South Africa was recorded at 5.71%, Stats SA, 2013.
Company Name Sector Company Latest Year-end3
Number of Operations in Africa
Standard Bank Banking & Financial Services
31-Dec-12 18
WBHO Construction 30-Jun-12 7
Illovo Food & Beverage 31-Mar-12 6
SABMiller4 Food & Beverage 31-Mar-12 13
Network Healthcare Holdings
Health 30-Sep-12 2
Sun International Hospitality 30-Jun-12 7
Eskom Holdings Limited Industrial 31-Mar-12 5
AngloGold Ashanti Mining 31-Dec-12 6
De Beers Family of Companies
Mining 31-Dec-12 3
Gold Fields Mining 31-Dec-12 2
Sappi Paper & Packaging 30-Sep-12 1
Massmart / Walmart Retail 30-Jun-12 12
Pick n Pay Retail 28-Feb-12 9
Shoprite Checkers Retail 30-Jun-12 17
MTN Group Technology & Telecoms 31-Dec-12 16
Vodacom Group Limited Technology & Telecoms 31-Mar-12 5

5
directly proportional to the level of CSR spend. It is possible that there is a lag in the
response of company CSR spend to changes in profitability. It would, therefore, be
interesting to see if the contributions to CSR in 2013 are affected by the levels of
profitability reported in 2012.
There is likely to be a strong relationship between CSR spending and profitability for those
companies that explicitly stipulate such a policy. Shoprite is one such company which
contributes 1 per cent of profit to CSR spending annually. In 2012, Sappi and Massmart
reported spending 1.2 per cent and 3.1 per cent of after tax profits on CSR respectively.
Massmart increased their contributions to CSR by 1.1 percent; the company contributed 2.0
per cent of after tax profits towards CSR initiatives in 2011.
Figure 1.1: Company Corporate Social Investment Spend for the sample companies
CSR Spend Proportions by Companies in the sample
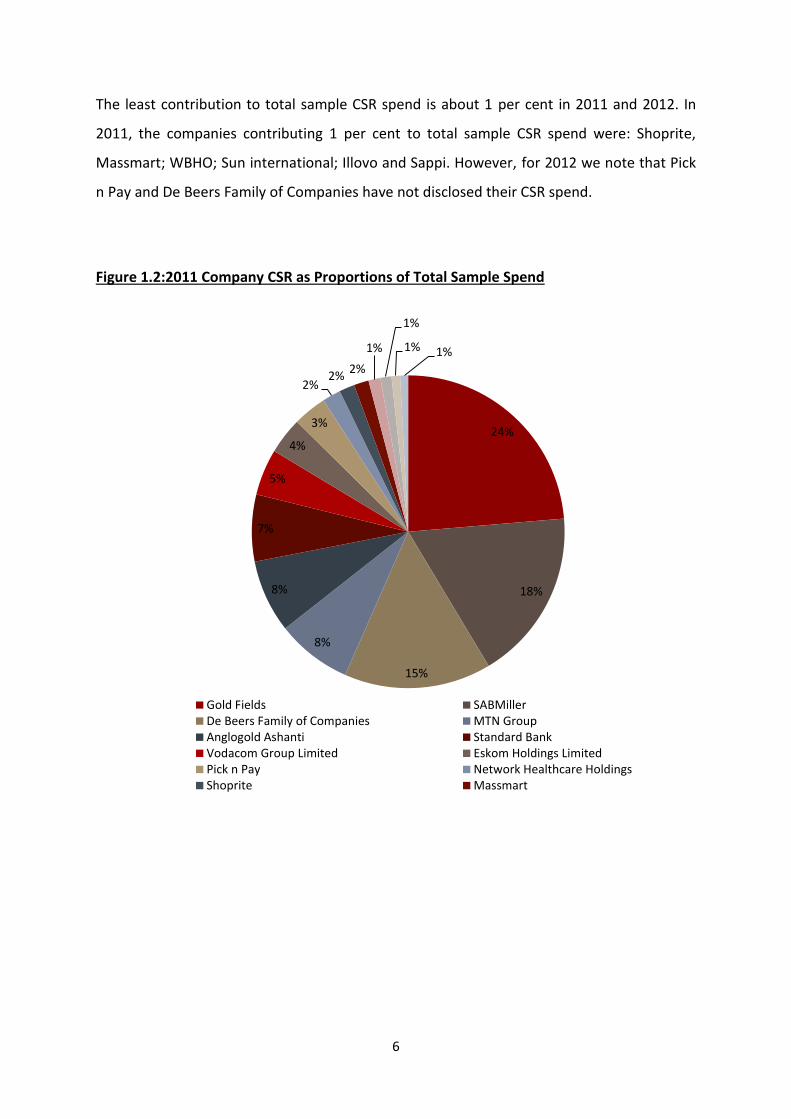
In 2011, Gold Fields contributed 24 per cent of the total CSR spend of the 16 companies
under review. Their CSR contribution in 2012 increased to 49 per cent of the whole.
However, this value included operation and maintenance costs, in addition to spending on
community development (referred to below). Gold Fields CSR spend also includes
contributions to infrastructure development in the regions in which they operate.
In 2011, SABMiller contributed 18 per cent of the total CSR spend in the sample. In 2011,
SABMiller’s contribution declined to 12 per cent.
228.27
278.85
2011 2012
Mill
ion
USD
6
The least contribution to total sample CSR spend is about 1 per cent in 2011 and 2012. In
2011, the companies contributing 1 per cent to total sample CSR spend were: Shoprite,
Massmart; WBHO; Sun international; Illovo and Sappi. However, for 2012 we note that Pick
n Pay and De Beers Family of Companies have not disclosed their CSR spend.
Figure 1.2:2011 Company CSR as Proportions of Total Sample Spend
24%
18%
15%
8%
8%
7%
5%
4%
3%
2% 2%
2%
1%
1%
1% 1%
Gold Fields SABMillerDe Beers Family of Companies MTN GroupAnglogold Ashanti Standard BankVodacom Group Limited Eskom Holdings LimitedPick n Pay Network Healthcare HoldingsShoprite Massmart

7
Figure 1.3: 2012 Company CSR Spend6 as Proportions of the Total Sample Spend
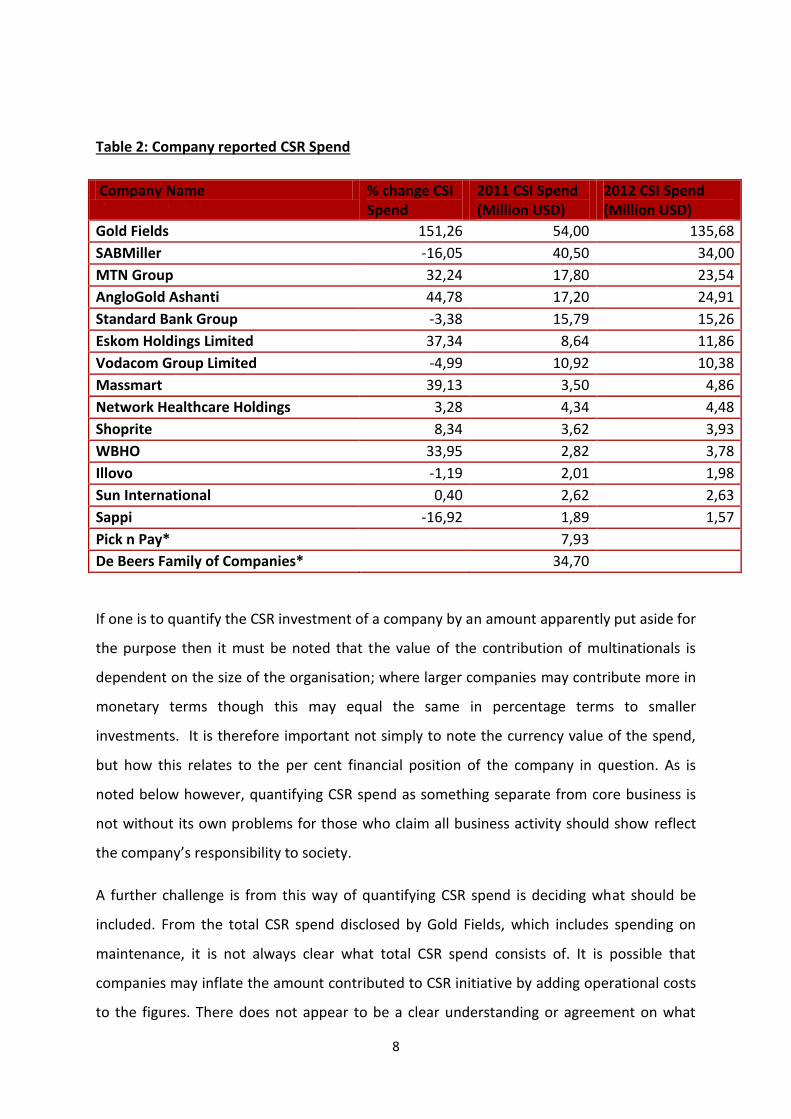
Looking at the individual company values of CSR spend, we note that 5 of the 14 companies
with data for both periods have shown a decline in CSR contributions. The largest decline is
seen for Sappi and SABMiller. These companies spent 16.92 per cent and 16.05 per cent
less on CSR activities in 2012 respectively.
Gold Fields had the greatest increase in CSR expenditure; however, as noted above, this
value includes operation and maintenance costs as mentioned. Multinationals such as
Anglogold Ashanti (44.8 per cent), Massmart (39.1 per cent) Eskom (37.3 per cent), WBHO
(34.0 per cent) and MTN Group (32.2 per cent) increased CSR contributions by more than
30%.
6 Gold Fields CSI spend includes maintenance provision and operating costs. This is why the stated value is
much higher than last year’s value.
49%
12%
8%
9%
5%
4%
4%
2% 2% 1%
1% 1% 1% 1%
Gold Fields SABMiller MTN Group
Anglogold Ashanti Standard Eskom Holdings Limited
Vodacom Group Limited Massmart Network Healthcare Holdings
Shoprite WBHO Illovo
Sun International Sappi Pick n Pay
De Beers Family of Companies
8
Table 2: Company reported CSR Spend
Company Name % change CSI Spend
2011 CSI Spend (Million USD)
2012 CSI Spend (Million USD)
Gold Fields 151,26 54,00 135,68
SABMiller -16,05 40,50 34,00
MTN Group 32,24 17,80 23,54
AngloGold Ashanti 44,78 17,20 24,91
Standard Bank Group -3,38 15,79 15,26
Eskom Holdings Limited 37,34 8,64 11,86
Vodacom Group Limited -4,99 10,92 10,38
Massmart 39,13 3,50 4,86
Network Healthcare Holdings 3,28 4,34 4,48
Shoprite 8,34 3,62 3,93
WBHO 33,95 2,82 3,78
Illovo -1,19 2,01 1,98
Sun International 0,40 2,62 2,63
Sappi -16,92 1,89 1,57
Pick n Pay* 7,93
De Beers Family of Companies* 34,70
If one is to quantify the CSR investment of a company by an amount apparently put aside for
the purpose then it must be noted that the value of the contribution of multinationals is
dependent on the size of the organisation; where larger companies may contribute more in
monetary terms though this may equal the same in percentage terms to smaller
investments. It is therefore important not simply to note the currency value of the spend,
but how this relates to the per cent financial position of the company in question. As is
noted below however, quantifying CSR spend as something separate from core business is
not without its own problems for those who claim all business activity should show reflect
the company’s responsibility to society.
A further challenge is from this way of quantifying CSR spend is deciding what should be
included. From the total CSR spend disclosed by Gold Fields, which includes spending on
maintenance, it is not always clear what total CSR spend consists of. It is possible that
companies may inflate the amount contributed to CSR initiative by adding operational costs
to the figures. There does not appear to be a clear understanding or agreement on what
9
exactly CSR must and must not include; no strict criteria as to what can be included in their
reported CSR spend. In order to both compare the investments of companies and to
analyse trends in companies and sectors, such clarity would be useful.
The whole area of CSR as separate from core company business remains contentious as it
may be argued that the way that a company is governed and plans its key business
operations should always incorporate the understanding of a responsibility for the
stakeholders affected by such operations. In this view CSR spend is criticised as a marketing
and public relations charity spend after the fact of poor business practices, low wages and
environmental degradation.
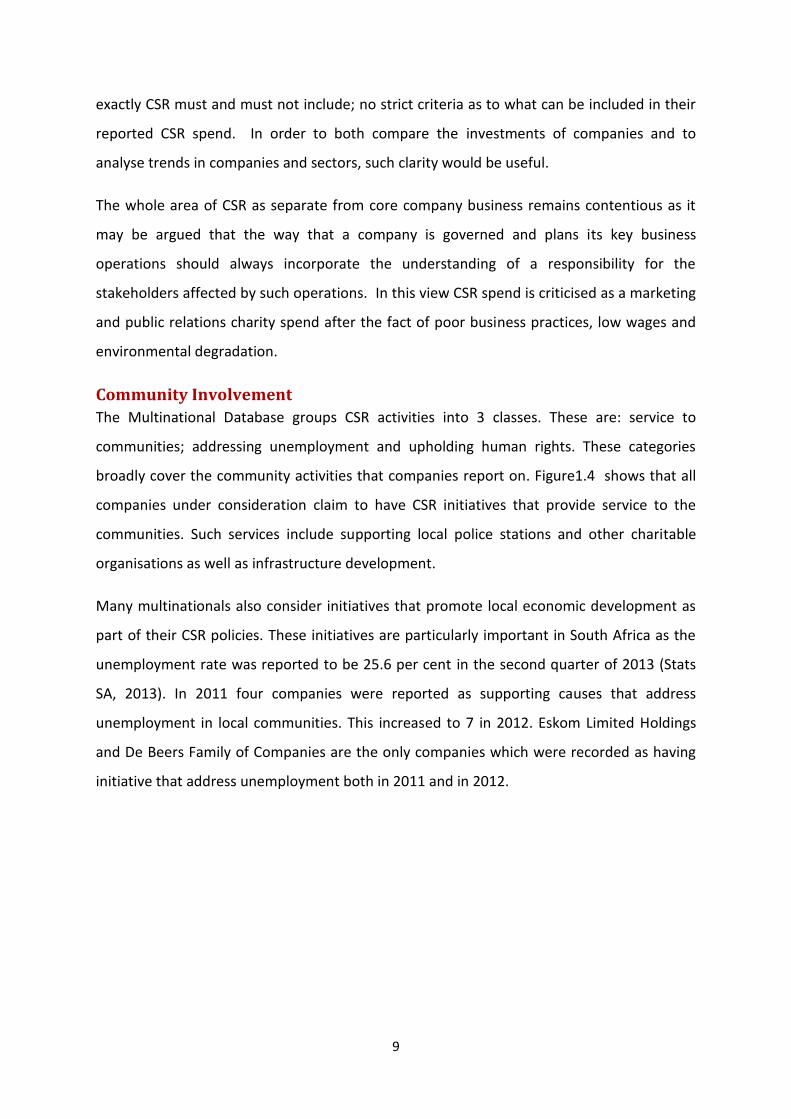
Community Involvement
The Multinational Database groups CSR activities into 3 classes. These are: service to
communities; addressing unemployment and upholding human rights. These categories
broadly cover the community activities that companies report on. Figure1.4 shows that all
companies under consideration claim to have CSR initiatives that provide service to the
communities. Such services include supporting local police stations and other charitable
organisations as well as infrastructure development.
Many multinationals also consider initiatives that promote local economic development as
part of their CSR policies. These initiatives are particularly important in South Africa as the
unemployment rate was reported to be 25.6 per cent in the second quarter of 2013 (Stats
SA, 2013). In 2011 four companies were reported as supporting causes that address
unemployment in local communities. This increased to 7 in 2012. Eskom Limited Holdings
and De Beers Family of Companies are the only companies which were recorded as having
initiative that address unemployment both in 2011 and in 2012.

10
Figure 1.4: Company Reporting on Community Involvement
Of the companies under review, only 8 reported on having CSR initiatives outside of South
Africa in 2011. This increased to 10 in 2012. 7 of the 16 multinationals have reported as
having CSR initiatives outside of the country both in 2011 and 2012. These are from varied
sectors and they are: Anglogold Ashanti, Gold Fields, Illovo, MTN Groups, SABMiller, Sappi
and the Standard Bank Group.
Five companies have not disclosed having any CSR initiatives in countries apart from South
Africa. This is in spite of having operations in numerous locations across Africa. It is,
therefore, important for unions in different countries to engage with these companies such
that similar treatment is given to workers and communities across borders while also
acknowledging differences across operations in these countries. If in fact such initiatives are
carried out, it is important that they are reported on.
Labour Relations
This section of the report considers how companies in our sample have elected to report on
their investment in their employees or human capital, as they are sometimes labelled. The
selected indicators include: company investment in employee skills development;
Occupational Health and Safety (OHS); employee relations regarding HIV/AIDS; Employee
0
2
4
6
8
10
12
14
16
18
Service to Communities Addressing Unemployment Upholding Human Rights
Nu
mb
er
of
Co
mp
anie
s
2011 2012

11
Stock Ownership Plans and Broad-based Black Economic Empowerment (with regards to
South Africa).
Figure 1.5:Company Reporting on Labour Relations
All the companies in our sample report investing in their employees. The development of
employee skills is said to support the growth of the organisation which provides an incentive
for companies to continue to invest in their employees. Limited information is provided on
the degree to which companies invest in their employees across Africa outside of South
Africa. There is also less information about how this compares to the human capital
investment in the home country – South Africa – bearing in mind the differences in size of
the labour force and the scale of the operations.
In reporting on skills development, the companies in our sample display 2 dominant trends.
Companies often report on investment and training in reference to: i) employee retention
and ii) spending on the skills development of previously disadvantaged employees.
Companies are said to invest in the health of their employees in order to further enhance
their overall well-being and maintain their levels of productivity. Eleven companies explicitly
reported on having policies with regards to OHS in 2011; this number increased to 14 in
2012. Vodacom and Pick n Pay are the only multinationals which have not explicitly
reported on their OHS policy in both 2011 and 2012. Other companies in our sample that
0
2
4
6
8
10
12
14
16
18
Skills development OHS HIV/AIDS ESOP BBBEE
Nu
mb
er
of
Co
map
anie
s
2011 2012

12
belong to their sectors (telecoms and retail) have reported on their OHS policies. For
companies belonging to the retail sector have (Shoprite and Massmart), reports on their
OHS policies have been noted only for 2012.
Sub-Saharan Africa is severely and disproportionately affected by the HIV/AIDS pandemic in
relation to the rest of the world. The World Health Organisation (WHO) reports that in 2007
67 per cent of all individuals infected with HIV were in Sub-Saharan Africa7. In addition to
the adverse health effects that result from the prevalence of HIV, HIV prevalence has
negative effects on the productivity of the work force and it has a grave effect on an
employees’ livelihood. It is for these reasons that companies should engage with their staff
and provide the necessary reforms to address HIV/AIDS in the workplace.
Of our sample, 13 companies explicitly reported having HIV/AIDS policies in 2011. This
number decreased to 10 in 2012. Many of the companies that report on their HIV/AIDS
policies note the importance of having such policies for the overall well-being of the
employee. The database does not analyse the content of such policies, which can vary
widely.
The HIV/AIDS pandemic has differing levels of urgency in countries across Africa. Other
diseases like Malaria have been noted by Anglogold Ashanti as a more urgent need in their
Ghana operations. It is important for companies to know the most urgent needs of their
workers in all of their operations such that they are able to address them appropriately.
In relation to the other indicators, few companies report on having ESOP policies for
qualifying staff. Six companies reported on having the share option plan for the employees
in 2011 and 2012. The companies have not disclosed on whether the ESOP policy is across
all their operations or just limited to the home country – South Africa.
All companies report on complying with the requirements of Broad-Based Black Economic
Empowerment (to varying degrees). Some reported initiatives include the support of
businesses and the sale of stocks to enterprises owned by previously disadvantage
individuals.
7 World Health Organisation, 2013. http://www.afro.who.int/en/clusters-a-programmes/dpc/acquired-
immune-deficiency-syndrome/overview.html
13
Labour Rights
The ILO principles of decent work require that workers be employed in jobs where they will
not face discrimination, and will enjoy the rights to freedom of association and collective
bargaining, freedom from child labour and forced labour practices as well as a diverse work
environment with equal opportunity.
Companies generally acknowledge complying with the universal principles of decent work.
However, companies that explicitly note compliance with all requirements do so at the
request of the reporting code they comply with. The Global Reporting Initiative requires this
compliance from member companies. Further, two of the companies in the sample,
AngloGold Ashanti and Shoprite Checkers have signed Global Agreements with the Global
Unions. These agreements have at their heart an agreement to comply with the four core
labour rights.
Environmental Reporting Reporting on the environmental impact and management of companies has evolved over
time. It began as a voluntary activity by companies and is now supported by legislation
(DEAT, 2005; King III, 2009). In addition to complying with national (and international)
requirements on environmental protection; multinational environmental reports inform
stakeholders (government, employees, shareholders, consumers) on an organisation’s
treatment of the environment. By so doing, company environmental reporting should allow
stakeholders to make an informed decision about the company’s corporate citizenship in
this regard.
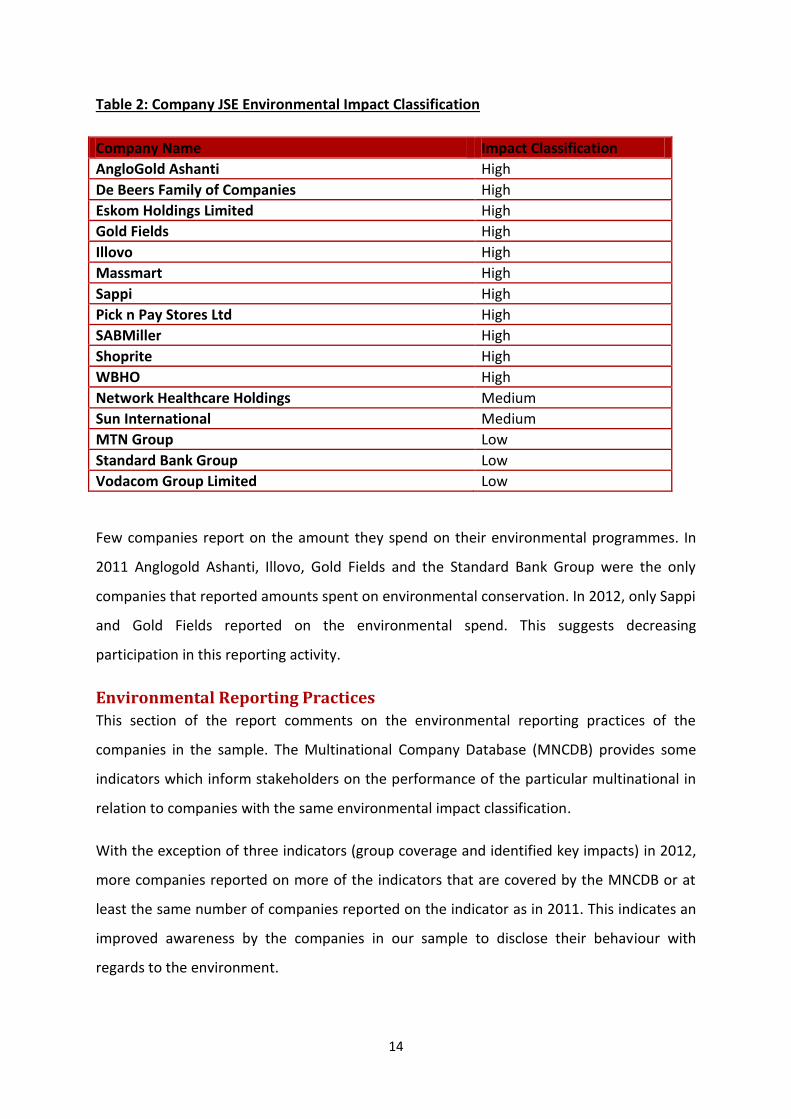
Of the sample, 11 companies are considered to have a high impact on the environment
according to the JSE Social Responsibility Index. These companies belong to the mining
industrial, paper and packaging, construction and retail sectors. Organisations belonging to
the finance and the telecoms sector are classified as having a low impact on the
environment.
14
Table 2: Company JSE Environmental Impact Classification
Company Name Impact Classification
AngloGold Ashanti High
De Beers Family of Companies High
Eskom Holdings Limited High
Gold Fields High
Illovo High
Massmart High
Sappi High
Pick n Pay Stores Ltd High
SABMiller High
Shoprite High
WBHO High
Network Healthcare Holdings Medium
Sun International Medium
MTN Group Low
Standard Bank Group Low
Vodacom Group Limited Low
Few companies report on the amount they spend on their environmental programmes. In
2011 Anglogold Ashanti, Illovo, Gold Fields and the Standard Bank Group were the only
companies that reported amounts spent on environmental conservation. In 2012, only Sappi
and Gold Fields reported on the environmental spend. This suggests decreasing
participation in this reporting activity.
Environmental Reporting Practices
This section of the report comments on the environmental reporting practices of the
companies in the sample. The Multinational Company Database (MNCDB) provides some
indicators which inform stakeholders on the performance of the particular multinational in
relation to companies with the same environmental impact classification.
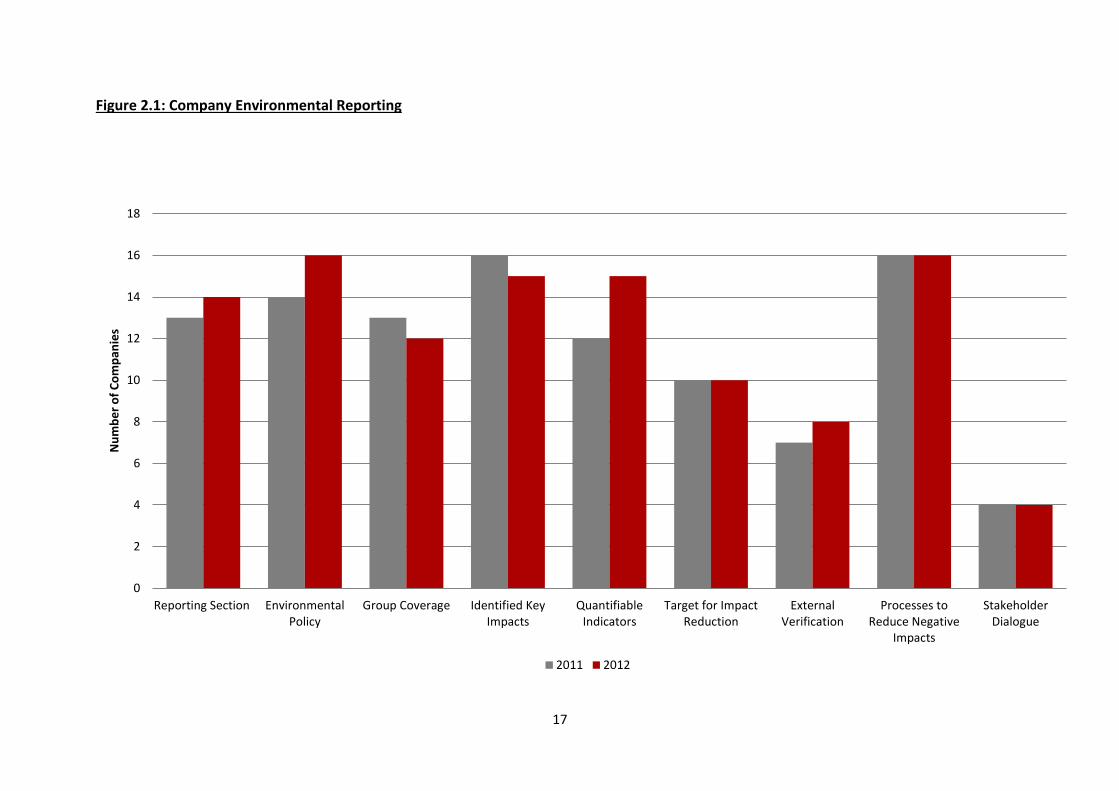
With the exception of three indicators (group coverage and identified key impacts) in 2012,
more companies reported on more of the indicators that are covered by the MNCDB or at
least the same number of companies reported on the indicator as in 2011. This indicates an
improved awareness by the companies in our sample to disclose their behaviour with
regards to the environment.

15
All the companies reported on their environmental policy in 2012. This improves on 2011
when only 14 companies reported on their environmental policy. For both periods under
review, all companies in the sample indicated having processes in place that would reduce
negative impacts on the environment. Even with this result, not all the companies explicitly
account for their environmental reporting to be for the whole group. Therefore, workers
must engage with their employers to ensure that all operations in all countries are privy to
the reforms in environmental practices.
There is significant room for improvement in reporting on stakeholder engagement; that is
consulting and discussing these issues with people who are affected by the company’s
impact on the environment. Only 25 per cent of companies reported on stakeholder
engagement in both periods. Stakeholder engagement is important as it promotes
transparency in organisational operations. For workers, the access to vital company
information may promote more meaningful dialogue.
In complying with stakeholder engagement Vodacom noted strategies that promote a
reduction in the carbon footprint of their consumers across all their operations.
It is also important for companies to properly report on their key impacts on the
environment so that stakeholders can assess whether they have properly identified impacts
and so that mitigating actions can be measured. Between 2011 and 2012, only 10
companies identified impacts that they deemed possible to ameliorate.
Being able to also quantify a change in behaviour is important as this allows improvements
to be analysed and compared. In 2012, 15 companies reported on quantifiable indicators.
This shows an improvement of 18.8 per cent from 2011.
In 2012, the JSE SRI (2012) named three of the companies in the sample as part of the top
10 performers in overall sustainability8 reporting. Sappi, Massmart and the Standard Bank
Group were recognised for their compliance to the standards set for sustainability reporting
by JSE listed companies. According to the MNCDB, the Standard Bank Group has
consistently performed well with regards to environmental reporting. The Group has
8 Best performers are companies that meet the thresholds for best performance in relation to environment
and climate change, as well as all relevant core indicators in relation to both Society and Governance & related sustainability concerns, including independent chairperson.

16
reported on all identified indicators. Massmart and Sappi have reported improved
performance in 2012 as the multinationals have increased their reporting coverage from 4
and 5 indicators to 5 and 8 indicators respectively.
17
Figure 2.1: Company Environmental Reporting
0
2
4
6
8
10
12
14
16
18
Reporting Section EnvironmentalPolicy
Group Coverage Identified KeyImpacts
QuantifiableIndicators
Target for ImpactReduction
ExternalVerification
Processes toReduce Negative
Impacts
StakeholderDialogue
Nu
mb
er
of
Co
mp
anie
s
2011 2012

18
Environmental Impact Indicators
In descending order, the major identified impacts in company environmental performance
were: energy use, waste management; raw materials and water, and product planning.
Energy use appears to be the greatest environmental impact indicator; 14 (2011) and 15
(2012) companies acknowledged that energy use is among their impacts on the
environment. One would expect more companies to report on their energy use as all
companies are subject to using energy in some way.
Some companies report on investment in research that will enable them to reduce their
environmental impact. Such companies included Pick n Pay and Eskom. In 2011 and 2012,
Eskom invested R199.5 million and R187.7 million, respectively, on research of renewable
forms of energy. Eskom has a significant impact on the environment and if fruitful, their
research into renewable forms of energy will reduce the carbon footprint of the enterprise.
More companies have also increased their reporting on waste management. Waste
management provides another avenue for workers to engage with employers for an
inclusive approach in caring for the environment.
Figure 2.2: Environmental Impact Indicators – Areas Covered in the Report
As enterprises that have a high impact on the environment, mining companies and Illovo are
the only multinationals that have reported on the way that they deal with accidents. There
has been no change in the reporting patterns of this indicator in 2011 and 2012.
0
2
4
6
8
10
12
14
16
Energy Use Raw Materialsand Water
ProductPlanning
WasteManagement
Dealing withAccident
EnvironmentalProtection and
Personnel
CarbonFootprint &Biodiversity
Nu
mb
er
of
Co
mp
anie
s
2011 2012

19
Reporting on environmental protection and personnel has increased in 2012. This indicator
provides scope for the multinationals to engage with the community in which they operate
and the consumers of their products.
In contrast, reporting on biodiversity and carbon footprint has declined in 2012. Reporting
on biodiversity has been characteristic of mining companies (De Beers and Gold Fields) and
Sun International (belonging to the hospitality sector) in our sample. This is because of the
large dependence (in the case of Sun International) on biodiversity in its operations; and the
large negative impact on the natural landscape (in the case of mining companies). Sappi also
reports on their commitment to biodiversity in 2012.
Recommendations
Overall, companies in the sample have shown increased support for sustainability reporting
with regards to the environment and community responsibility. This is implied by the
increased commitment to community involvement and environmental indicators.
There is much room for improvement however in both the reporting formats and content.
Further, this first report for the MNCDB reveals some shortcomings in the data captured
which could be remedied with updates to the system.
CSR reporting:
Impact
The impact of company initiatives within the communities in which they operate needs to
be noted in a quantifiable way. Companies should be aware of and report on the impact of
their CSR initiatives in order to ensure sustainability and quality of the initiatives. This
information might also enable unions to identify the quality of CSR initiatives.
Commitment to stakeholder dialogue
“Failure to identify and engage with stakeholders is likely to result in reports that are not
suitable, and therefore not fully credible, to all stakeholders. In contrast, systematic
stakeholder engagement enhances stakeholder receptivity and the usefulness of the report”
(GRI, 2011, p.10).

20
One important part of corporate social responsibility is stakeholder engagement. Hence,
further interrogation of this aspect of CSR could be interrogated by the database. If the
company states that they are involved and cooperating with stakeholders, then which
stakeholders and how often (NGOs, community, unions etc.). For instance, similar questions
to the following questions could be included:
- According to the report, has the company contacted different stakeholders to
discuss their CSR initiatives? (if not CSR initiatives, maybe community involvement)
- Which actors have the company identified as stakeholders?
- Does the company report how they are engaging with stakeholders?
- Does the report show evidence of stakeholder engagement?
Significant scope exists for reforms to include the opinions and participation of workers,
particularly those outside of South Africa, in formulating the goals and processes of
community and environmental involvement. This recommendation extends to the reporting
of the company’s commitment to their own workers. The MNCDB does not yet record the
company’s position on various policies concerned with the well-being of their workers.
Policies might be a way of revealing social corporate responsibility plans of companies. One
suggestion is therefore to include companies’ policies on critical social responsibility issues.
The questions could include:
- Has the company an anti-discrimination policy?
- Has the company a HIV and aids policy?
- Has the company a BBE policy?
- Has the company a gender policy?
- Has the company a health and safety policy?
- Has the company have a skill and training policy?
- Has the company a policy for stakeholder engagement?
CSR spending and economic sustainability
The indices of CSR spending will be useful for unions and other actors, especially if the main
purpose of the report and database is to enable monitoring of CSR commitments. For a
long-term use of the database it might be important to have an extensive definition of the

21
concept and produce a database that might enable unions to identify the quality of the CSR
section. The database has the potential of revealing if companies CSR initiatives are an extra
cost for companies and for instance established at the expense of living wages.
The CSR spend might be more complicated than what companies have included “CSR” or
“sustainability” as a spending. For instance, has the company specified what is included in
their CSR or CSI spend? What areas are included in the CSR spending? (Education, health,
skills development and training, development program, art, sports etc.).
Tax
A further interesting area to cover, which is discussed by GRI, is “the organization’s
contribution to the sustainability of a larger economic system”. Hence, it might be valuable
to reveal how much tax companies pay.
Environmental Reporting:
Overall there is scant reporting on community and in particular environmental responsibility
by companies in their operations outside of South Africa. Companies must remain aware of
their commitment to their operations in other states and their employees in those states.
This commitment could be demonstrated by increased reporting on sustainability in
operations outside South Africa.
Conclusions
Corporate citizenship concerns far more than money put aside for charitable works or even
processes to mitigate a company’s negative impact on the environment. It is not to be
confused with charity, even though many companies seem to make this mistake. The UN
Global Compact argues that “CSR is not a charitable add-on but should be integrated as core
business activity” (UNGC). It is no longer ‘if’ but ‘how’ companies report on their
responsibility to the communities, countries and environments in which they work and
which afford them locations and markets which is fundamental to perhaps seeing why so
few of them understand this responsibility as key to their business.

22
References DEAT (2005), Environmental Reporting, Integrated Environmental Management Information Series
17, Department of Environmental Affairs and Tourism, Pretoria
EIRIS (2013), ERISIS Sustainable Report 2013 – Risky Business, A Global Spotlight on Corporate
Sustainability http://www.eiris.org/wpcontent/uploads/2013/06/Sust_ratings_paper_2013_v9_low-
res1.pdf (accessed 23 October 2013)
Global Compact (2013), Global Corporate Sustainability Report 2012, United Nations, New York
GRI (2013), Global Reporting Initiative – Reporting Principles and Standard Disclosures
https://www.globalreporting.org/resourcelibrary/GRIG4-Part1-Reporting-Principles-and-Standard-
Disclosures.pdf (accessed 23 October 2013)
Institute of Directors in Southern Africa (2009), King Code of Governance for South Africa 2009
http://www.ecgi.org/codes/documents/king3.pdf (accessed 23 October 2013)
JSE SRI (2012), SRI Best Performers 2012 http://www.jse.co.za/About-Us/SRI/2012-Results.aspx
(accessed 14 November 2013)
JSE SRI (2013), JSE SRI Background and Selection Criteria. http://www.jse.co.za/About-
Us/SRI/Criteria.aspx (accessed 23 October 2013)
OECD (2011), OECD Guidelines for Multinational Enterprises, OECD Publishing.
http://dx.doi.org/10.1787/9789264115415-en (accessed 23 October 2013)
Stats SA (2013), Latest Key Indicators, http://www.statssa.gov.za/keyindicators/keyindicators.asp
(accessed 4 November 2013)
UNCTAD (2013), World Investment Report 2013: Global Value Chains: Investment and Trade for
Development, Switzerland