environmental and social performance indicators for ... · environmental and social performance...
TRANSCRIPT

0
Environmental and Social
Performance Indicators for Natural Gas Production Natural Gas Supply Collaborative ▪ October 2017

1
Environmental and Social Performance Indicators for Natural Gas Production
Natural Gas Supply Collaborative
October 2017

2
Acknowledgments This report is the product of a collaborative effort among Austin Energy, Calpine Corporation, Consolidated
Edison Company of New York, Los Angeles Department of Water and Power, National Grid, NRG Energy,
NW Natural, Pacific Gas and Electric Company, and Xcel Energy. We would also like to acknowledge the
valuable insights provided by outside reviewers who offered feedback on our public review draft, including
natural gas producers, environmental organizations, and think tanks. Their input was immensely helpful to the
development of the performance indicators.
M.J. Bradley & Associates LLC (MJB&A) convenes and manages the collaborative, overseeing development
and release of all work products.
REPORT AUTHORS
Robert LaCount, MJB&A
Tom Curry, MJB&A
Clement Russell, MJB&A
REPORT DESIGN
Christopher E. Van Atten, MJB&A
MJB&A, founded in 1994, is a strategic consulting firm focused on energy and environmental issues. The firm
includes a multi-disciplinary team of experts with backgrounds in economics, law, engineering, and policy. The
company works with private companies, public agencies, and non-profit organizations to understand and
evaluate environmental regulations and policy, facilitate multi-stakeholder initiatives, shape business strategies,
and deploy clean energy technologies.
For questions or comments about this report, please contact: [email protected]
© 2017 M.J. Bradley & Associates, LLC. All rights reserved.

1
Introduction The Natural Gas Supply Collaborative (NGSC) is a voluntary collaborative of natural gas purchasers that are
promoting safe and responsible practices for natural gas supply.* NGSC participants are some of the largest
natural gas purchasers in the country. Collectively, NGSC participants deliver enough natural gas to meet the
needs of more than 36 million U.S. households, and, as part of a portfolio of resources, generate enough
electricity from natural gas to power almost 17 million U.S. households.†
This report identifies 14 key environmental and social performance indicators for natural gas production.
These non-financial performance indicators respond to stakeholder questions and highlight leading practices
producers use to protect the environment and local communities. NGSC participants are committed to
engaging natural gas producers and other stakeholders to support more robust voluntary reporting on the
information identified in the performance indicators.
* NGSC participants include: Austin Energy, Calpine Corporation, Consolidated Edison Company of New York, Los
Angeles Department of Water and Power, National Grid, NRG Energy, NW Natural, Pacific Gas and Electric Company,
and Xcel Energy. † Estimates based on MJB&A calculations using U.S. Energy Information Administration data for 2015.
Natural gas plays a vital role in the U.S. energy mix, meeting 30 percent of U.S. energy needs in 2016. The abundant domestic resource currently provides significant economic and environmental benefits to customers in the electric power, residential, industrial and commercial sectors and across the U.S. economy. In many parts of the country natural gas has helped enable an on-going transition to a lower-carbon energy supply. Indeed, the rise in U.S. production over the past ten years due to advances in technology has coincided with a fall in U.S. carbon dioxide emissions. Natural gas has contributed to this trend as natural gas-fired power plants have displaced higher emitting plants. The rise in U.S. natural gas production has also coincided with more stakeholders requesting information about practices used in production. Operating at the intersection of the natural gas supply chain and end-use customers, NGSC participants are increasingly being asked to address questions concerning natural gas production.
2
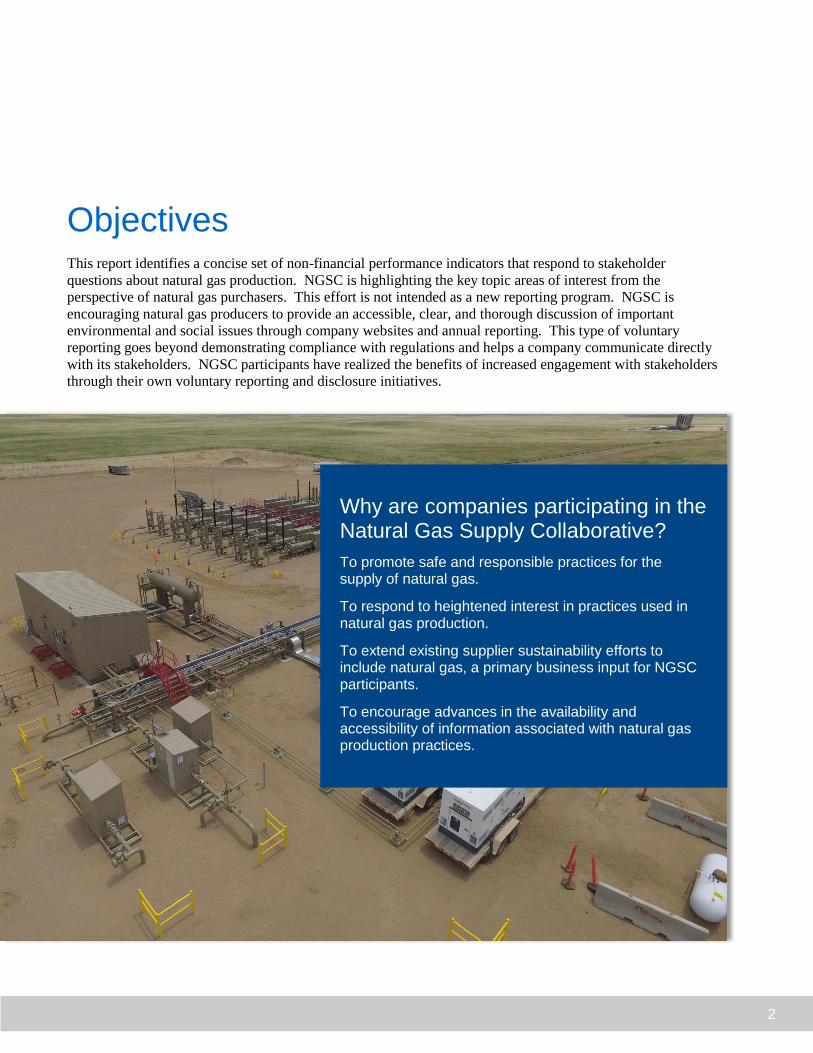
Objectives This report identifies a concise set of non-financial performance indicators that respond to stakeholder
questions about natural gas production. NGSC is highlighting the key topic areas of interest from the
perspective of natural gas purchasers. This effort is not intended as a new reporting program. NGSC is
encouraging natural gas producers to provide an accessible, clear, and thorough discussion of important
environmental and social issues through company websites and annual reporting. This type of voluntary
reporting goes beyond demonstrating compliance with regulations and helps a company communicate directly
with its stakeholders. NGSC participants have realized the benefits of increased engagement with stakeholders
through their own voluntary reporting and disclosure initiatives.
Why are companies participating in the Natural Gas Supply Collaborative?
To promote safe and responsible practices for the supply of natural gas.
To respond to heightened interest in practices used in natural gas production.
To extend existing supplier sustainability efforts to include natural gas, a primary business input for NGSC participants.
To encourage advances in the availability and accessibility of information associated with natural gas production practices.

3
Natural gas producers continue to advance techniques for managing environmental, health, safety, and
sustainability issues. Broader information sharing supports a virtuous cycle where companies highlight their
approaches to managing natural gas development, companies and stakeholders benefit from having more
information on leading practices, and stakeholders and the public gain greater insights into how companies are
protecting the environment and local communities. In recent years, a number of leading companies have
expanded their public disclosure to cover a wide range of stakeholder concerns, including those covered by the
NGSC performance indicators.
NGSC recognizes that it takes time to develop the systems and processes needed to collect and report
information related to environmental and social practices. Companies that are in the early stages of reporting
can use the performance indicators to inform the development of voluntary disclosures and improve their
reporting over time. Companies with established programs can use the performance indicators to strengthen
their reporting.
Through engagement with natural gas producers and other stakeholders, NGSC participants intend to support
more robust voluntary reporting, to promote and leverage the use of the performance indicators identified in
this report, and to advance additional opportunities to promote safe and responsible practices for natural gas
supply.
Benefits of Reporting As key parts of the natural gas value chain, both producers and purchasers benefit from robust voluntary reporting on natural gas production practices.
Robust voluntary reporting offers important benefits to natural gas producers:
Improving Performance. Metrics tracked through the reporting process help companies assess their operations and identify opportunities to reduce costs and improve operations.
Communicating Accurate Information. Voluntary reporting provides the opportunity for companies to directly communicate with the public and educate stakeholders about corporate priorities and sustainability practices.
Building Transparency and Trust with Stakeholders. Companies can strengthen their social license to operate by engaging with and responding to stakeholders.
More information on responsible practices in natural gas production will help NGSC participants address important business needs, including:
Increasing Understanding of Natural Gas Supply. NGSC participants engage a wide variety of suppliers to better understand the inputs to their business and want to extend engagement to natural gas suppliers.
Addressing Stakeholder Questions. Access to more information will help NGSC participants respond to stakeholder questions and concerns.
Supporting Corporate Sustainability Goals. Greater visibility in the supply chain helps
companies meet sustainability goals.
4
Overview of Performance Indicators The performance indicators outlined in this document (summarized in Table 1) reflect the perspectives of
NGSC participants and are guided by the interests of the participants’ customers and stakeholders. They are
not intended as a comprehensive set of performance indicators but represent high priority topics for
participants.
After reviewing existing reporting frameworks and interviewing outside experts, NGSC developed a draft list
of performance indicators spanning four major topics areas.† NGSC released the draft performance indicators
in a public white paper to solicit feedback. The final set of 14 performance indicators incorporates this
feedback.
†Additional details on the process to identify performance indicators are available in the technical supplement. The
existing frameworks reviewed included CDP’s Climate and Water Questionnaires and Oil and Gas Sector Module;
Disclosing the Facts; GRI Oil and Gas Sector Disclosures; IPIECA, API, IOGP Oil and Gas Industry Guidance on
Voluntary Sustainability Reporting and IPIECA’s Pilot Climate Change Reporting Framework; and Sustainability
Accounting Standards Board (SASB) Oil and Gas Exploration and Production Sustainability Accounting Standard.

5
Table 1. Environmental and Social Performance Indicator Categories for Natural Gas Production
Topic Area Performance Indicators
Quantitative Management Strategy
01 Methane and Air Emissions
Methane Emissions (Total and Intensity)
Overall Methane Strategy
02 Water Water Use (Total and
Freshwater Intensity)
Water Testing
Spill Reporting
Freshwater Use Strategy
Well Planning and Integrity Strategy
Wastewater Management Strategy
03 Chemical Use Chemical Stewardship Chemical Management
Strategy
04 Community and Safety
Measuring Community Engagement
Safety Incident Rates
Community Engagement Strategy
Contractor Performance Strategy
6
Topic Areas Reflecting the areas of greatest interest to the participating companies and their stakeholders, NGSC identified
four categories of performance indicators: (1) methane and air emissions, (2) water, (3) chemical use, and (4)
community impacts and workforce safety. This section provides background on each of these categories
before discussing the performance indicators.
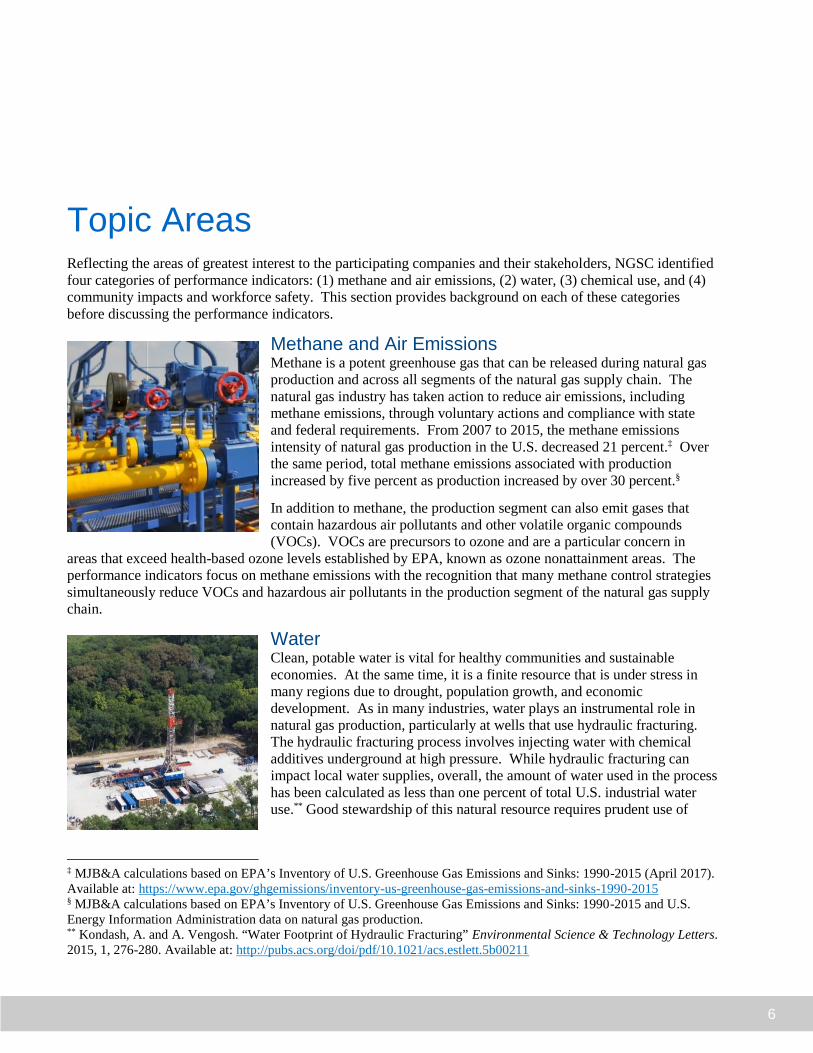
Methane and Air Emissions Methane is a potent greenhouse gas that can be released during natural gas
production and across all segments of the natural gas supply chain. The
natural gas industry has taken action to reduce air emissions, including
methane emissions, through voluntary actions and compliance with state
and federal requirements. From 2007 to 2015, the methane emissions
intensity of natural gas production in the U.S. decreased 21 percent.‡ Over
the same period, total methane emissions associated with production
increased by five percent as production increased by over 30 percent.§
In addition to methane, the production segment can also emit gases that
contain hazardous air pollutants and other volatile organic compounds
(VOCs). VOCs are precursors to ozone and are a particular concern in
areas that exceed health-based ozone levels established by EPA, known as ozone nonattainment areas. The
performance indicators focus on methane emissions with the recognition that many methane control strategies
simultaneously reduce VOCs and hazardous air pollutants in the production segment of the natural gas supply
chain.
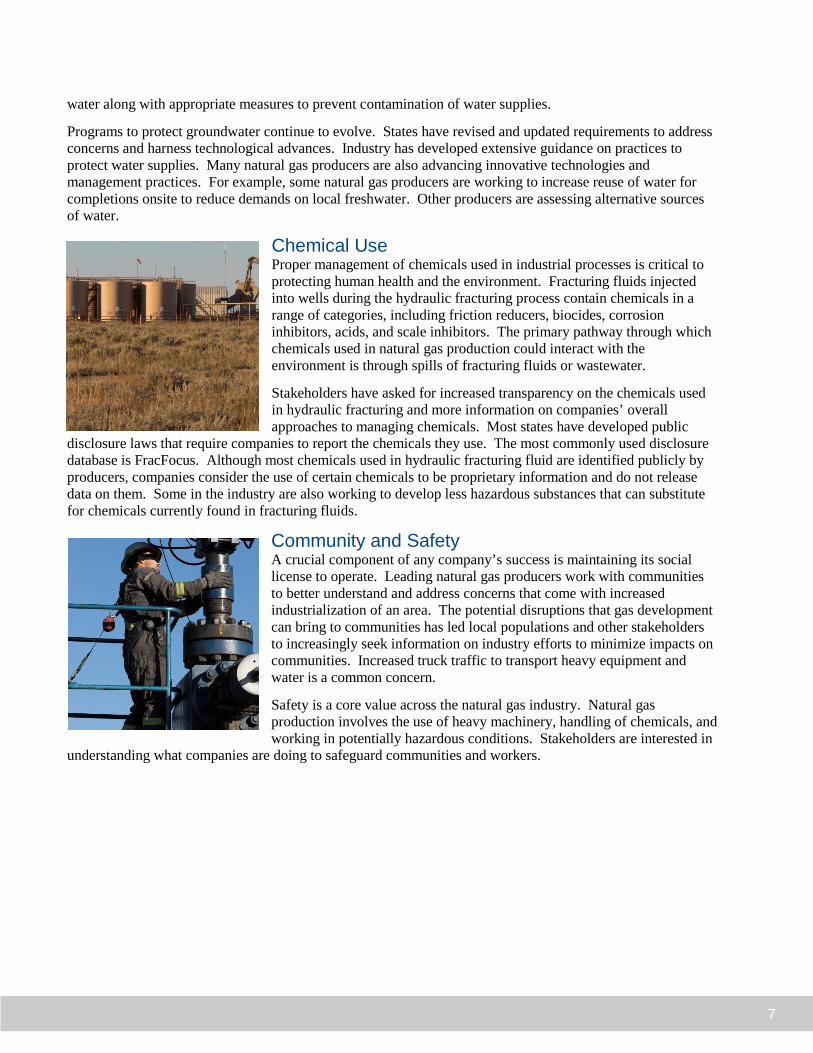
Water Clean, potable water is vital for healthy communities and sustainable
economies. At the same time, it is a finite resource that is under stress in
many regions due to drought, population growth, and economic
development. As in many industries, water plays an instrumental role in
natural gas production, particularly at wells that use hydraulic fracturing.
The hydraulic fracturing process involves injecting water with chemical
additives underground at high pressure. While hydraulic fracturing can
impact local water supplies, overall, the amount of water used in the process
has been calculated as less than one percent of total U.S. industrial water
use.** Good stewardship of this natural resource requires prudent use of
‡ MJB&A calculations based on EPA’s Inventory of U.S. Greenhouse Gas Emissions and Sinks: 1990-2015 (April 2017).
Available at: https://www.epa.gov/ghgemissions/inventory-us-greenhouse-gas-emissions-and-sinks-1990-2015 § MJB&A calculations based on EPA’s Inventory of U.S. Greenhouse Gas Emissions and Sinks: 1990-2015 and U.S.
Energy Information Administration data on natural gas production. ** Kondash, A. and A. Vengosh. “Water Footprint of Hydraulic Fracturing” Environmental Science & Technology Letters.
2015, 1, 276-280. Available at: http://pubs.acs.org/doi/pdf/10.1021/acs.estlett.5b00211
7
water along with appropriate measures to prevent contamination of water supplies.
Programs to protect groundwater continue to evolve. States have revised and updated requirements to address
concerns and harness technological advances. Industry has developed extensive guidance on practices to
protect water supplies. Many natural gas producers are also advancing innovative technologies and
management practices. For example, some natural gas producers are working to increase reuse of water for
completions onsite to reduce demands on local freshwater. Other producers are assessing alternative sources
of water.
Chemical Use Proper management of chemicals used in industrial processes is critical to
protecting human health and the environment. Fracturing fluids injected
into wells during the hydraulic fracturing process contain chemicals in a
range of categories, including friction reducers, biocides, corrosion
inhibitors, acids, and scale inhibitors. The primary pathway through which
chemicals used in natural gas production could interact with the
environment is through spills of fracturing fluids or wastewater.
Stakeholders have asked for increased transparency on the chemicals used
in hydraulic fracturing and more information on companies’ overall
approaches to managing chemicals. Most states have developed public
disclosure laws that require companies to report the chemicals they use. The most commonly used disclosure
database is FracFocus. Although most chemicals used in hydraulic fracturing fluid are identified publicly by
producers, companies consider the use of certain chemicals to be proprietary information and do not release
data on them. Some in the industry are also working to develop less hazardous substances that can substitute
for chemicals currently found in fracturing fluids.
Community and Safety A crucial component of any company’s success is maintaining its social
license to operate. Leading natural gas producers work with communities
to better understand and address concerns that come with increased
industrialization of an area. The potential disruptions that gas development
can bring to communities has led local populations and other stakeholders
to increasingly seek information on industry efforts to minimize impacts on
communities. Increased truck traffic to transport heavy equipment and
water is a common concern.
Safety is a core value across the natural gas industry. Natural gas
production involves the use of heavy machinery, handling of chemicals, and
working in potentially hazardous conditions. Stakeholders are interested in
understanding what companies are doing to safeguard communities and workers.

8
Structure The performance indicators are structured as quantitative indicators and management strategy indicators that
could be reported on annually to provide greater insight into how natural gas producers are managing the
potential impacts of natural gas development. The performance indicators are drawn from existing reporting
programs (see technical supplement for more detail on the methodology, including the use of existing
programs).
Quantitative Indicators Quantitative indicators seek measurable data that can be used to better understand and manage a topic. The
data could be used to measure the success of management strategies or to provide objective information into
how companies are limiting impacts. When reported over multiple years, quantitative indicators can be used
to understand changes in operations and trends. NGSC participants are particularly interested in quantitative
information on a regional or basin level reflecting the market areas from which they draw gas and recognizing
stakeholder interest in local and regional information.
NGSC encourages the use of standard industry protocols to measure and report data where possible, but
recognizes that many important metrics are not standardized at this time. For this reason, it is important to
provide context for data so that it is clearly understood by stakeholders. The descriptions of quantitative
indicators highlight areas where producers might want to provide expanded context, such as thresholds for
reporting spills, methodologies for estimating emissions, differences between regions, and helpful points of
comparison. Where appropriate, the quantitative indicators also request data be presented on a total basis (i.e.,
tons of methane released) and on a production-normalized, or intensity, basis (i.e., tons of methane per cubic
feet of natural gas produced). Intensity-based data can provide helpful context for interpreting the
information.
Management Strategy Indicators The management strategy performance indicators are mostly qualitative and encourage information on how
companies are systematically managing key issues across their operations. The indicators seek information on
comprehensive strategies rather than isolating individual measures. In this way, the indicators are intended to
provide insight on performance-based outcomes as opposed to creating a checklist of specific measures. This
approach recognizes that not all measures may be appropriate in all situations.
Examples of leading practices are included with each management strategy performance indicator. The
examples are intended to highlight the kind of detailed information on management strategies that NGSC
participants would encourage natural gas producers to provide in an accessible form. Comprehensive
information on management strategies would include:
1. clearly defined corporate goals and the practices or, where appropriate, the decision-making process for
choosing among different practices based on location-specific criteria;
2. identification of actions that are taken to comply with regulations versus actions that go beyond existing
requirements; and
3. clearly defined geographic coverage for a company’s management strategy (e.g., identification of
substantive differences that may apply across a company’s different production areas).
9
01 Methane and Air Emissions

10
Reporting Guidance
Report total methane emissions (i.e., metric tons of methane) from drilling, completion, and natural gas production operations (e.g., process and fugitive emissions) for each calendar year.
Report total volume of methane emitted per volume of natural production (methane released to the atmosphere as a percentage of total natural gas produced) for each calendar year, including the emissions (i.e., volume of methane emitted from drilling, completion, and production) and natural gas production (i.e., total volume of natural gas produced) figures used to calculate intensity.
Provide a breakdown of emissions intensity by area of operations in addition to a company-wide figure.
The Greenhouse Gas Reporting Program (GHGRP) maintained by EPA provides a standardized approach to reporting greenhouse gas emissions. Methane emissions reported to the GHGRP could provide the basis for estimates of methane emitted during natural gas drilling, completion, and production. To the extent a company follows a different approach, it should explain its methodology.
Performance Indicators
What are the total methane emissions of your operations?
What is the methane emissions intensity of your operations?
01 METHANE AND AIR EMISSIONS
Quantitative Indicator: Methane Emissions
While a producer may have reasons to report annual greenhouse gas emissions, including carbon dioxide from combustion, it is important to understand methane emissions associated with natural gas production. This includes both the total methane emissions as well as the methane emissions intensity during drilling, completion, and production operations. Where possible, it is useful for producers to report information each year on a play-by-play or other geographically relevant basis in addition to a consolidated company metric. A regional breakdown of emissions intensity not only provides stakeholders with additional information, but it gives producers the opportunity to elaborate on varying practices and operational requirements. When reporting emissions, it is also important to provide information on the methodology behind estimated emissions. Stakeholders are interested in understanding where direct measurement of emissions is being used and where emission factors are necessary.
Examples of Leading Practices Many leading natural gas producers report their total emissions and emissions intensity for each calendar year on their websites or in their annual sustainability reports. Information reported by companies in response to a number of existing reporting frameworks would be consistent with the information requested by this performance indicator, including CDP, DTF, GRI, and IPIECA. Table 1 in this paper’s technical supplement provides a list of the questions in existing frameworks that are consistent with this performance indicator. Data related to this indicator may also be reported under state and local regulatory regimes, but may not be publicly available or easily accessible.
11
Reporting Guidance
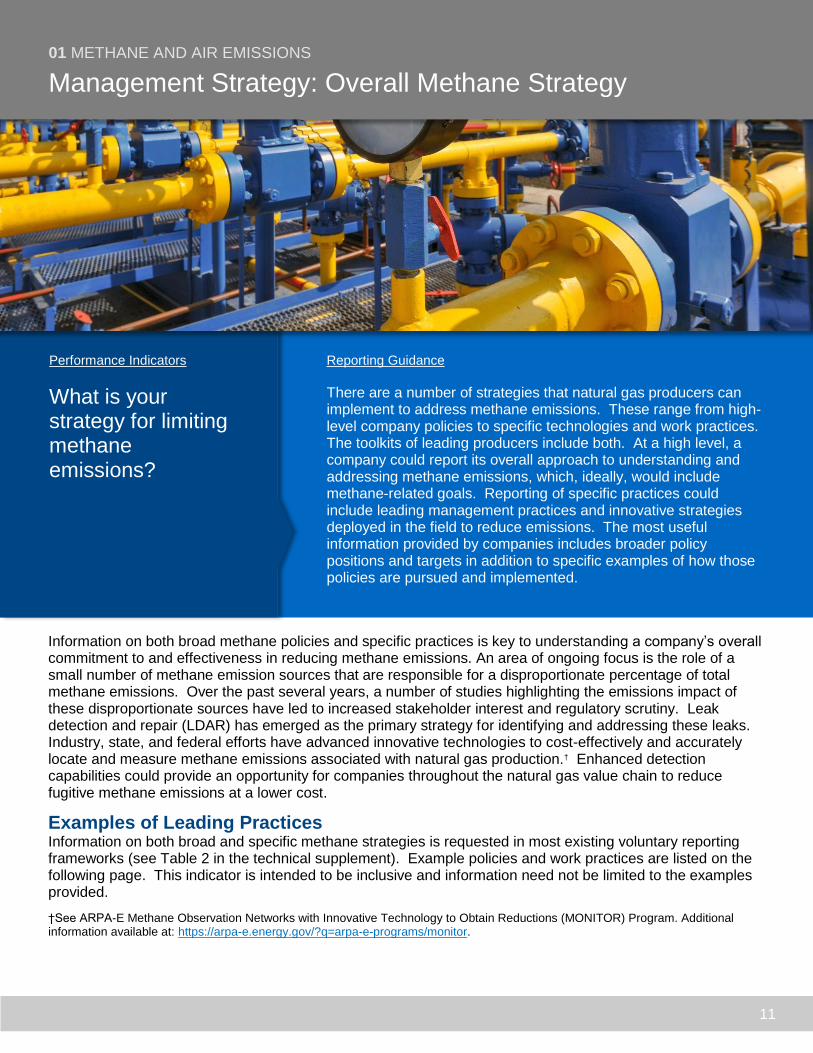
There are a number of strategies that natural gas producers can implement to address methane emissions. These range from high-level company policies to specific technologies and work practices. The toolkits of leading producers include both. At a high level, a company could report its overall approach to understanding and addressing methane emissions, which, ideally, would include methane-related goals. Reporting of specific practices could include leading management practices and innovative strategies deployed in the field to reduce emissions. The most useful information provided by companies includes broader policy positions and targets in addition to specific examples of how those policies are pursued and implemented.
Performance Indicators
What is your strategy for limiting methane emissions?
Information on both broad methane policies and specific practices is key to understanding a company’s overall commitment to and effectiveness in reducing methane emissions. An area of ongoing focus is the role of a small number of methane emission sources that are responsible for a disproportionate percentage of total methane emissions. Over the past several years, a number of studies highlighting the emissions impact of these disproportionate sources have led to increased stakeholder interest and regulatory scrutiny. Leak detection and repair (LDAR) has emerged as the primary strategy for identifying and addressing these leaks. Industry, state, and federal efforts have advanced innovative technologies to cost-effectively and accurately locate and measure methane emissions associated with natural gas production.† Enhanced detection capabilities could provide an opportunity for companies throughout the natural gas value chain to reduce fugitive methane emissions at a lower cost.
Examples of Leading Practices Information on both broad and specific methane strategies is requested in most existing voluntary reporting frameworks (see Table 2 in the technical supplement). Example policies and work practices are listed on the following page. This indicator is intended to be inclusive and information need not be limited to the examples provided.
†See ARPA-E Methane Observation Networks with Innovative Technology to Obtain Reductions (MONITOR) Program. Additional information available at: https://arpa-e.energy.gov/?q=arpa-e-programs/monitor.
01 METHANE AND AIR EMISSIONS
Management Strategy: Overall Methane Strategy
12
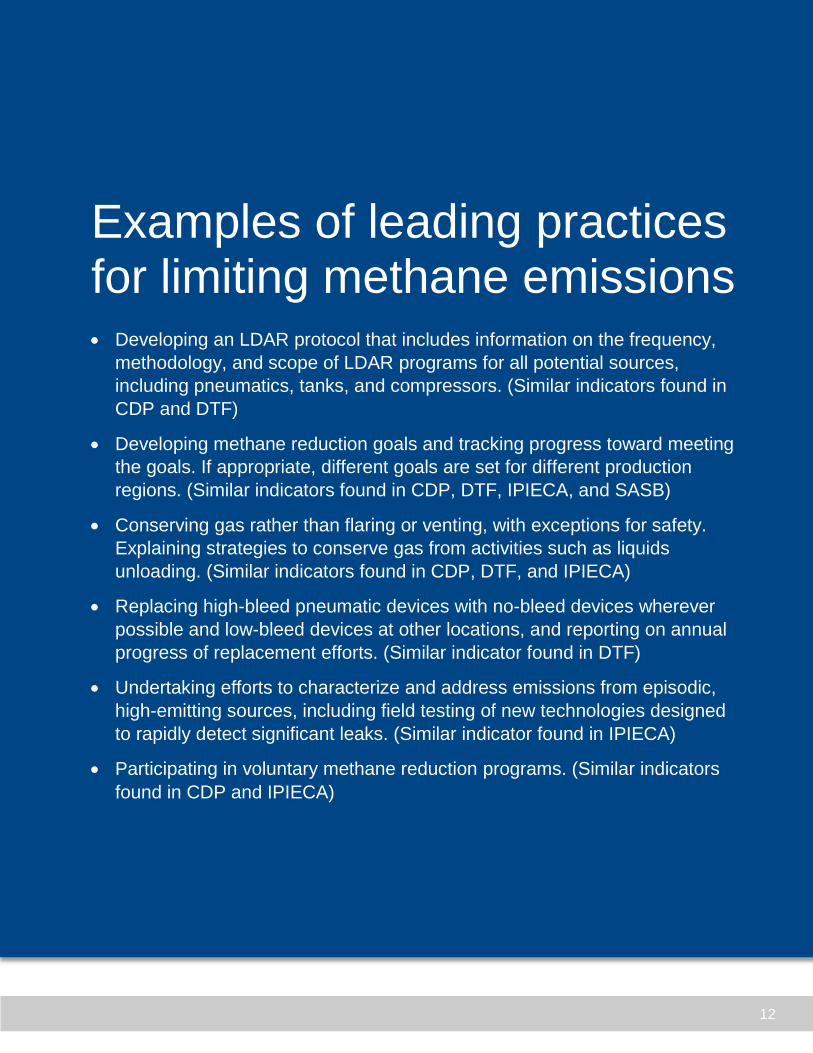
Examples of leading practices for limiting methane emissions
Developing an LDAR protocol that includes information on the frequency,
methodology, and scope of LDAR programs for all potential sources,
including pneumatics, tanks, and compressors. (Similar indicators found in
CDP and DTF)
Developing methane reduction goals and tracking progress toward meeting
the goals. If appropriate, different goals are set for different production
regions. (Similar indicators found in CDP, DTF, IPIECA, and SASB)
Conserving gas rather than flaring or venting, with exceptions for safety.
Explaining strategies to conserve gas from activities such as liquids
unloading. (Similar indicators found in CDP, DTF, and IPIECA)
Replacing high-bleed pneumatic devices with no-bleed devices wherever
possible and low-bleed devices at other locations, and reporting on annual
progress of replacement efforts. (Similar indicator found in DTF)
Undertaking efforts to characterize and address emissions from episodic,
high-emitting sources, including field testing of new technologies designed
to rapidly detect significant leaks. (Similar indicator found in IPIECA)
Participating in voluntary methane reduction programs. (Similar indicators
found in CDP and IPIECA)

13
02 Water

14
Reporting Guidance
Report total water used onsite each year for completions (hydraulic fracturing) related to natural gas production, by source of water (i.e., gallons and percentage of total).
Report total freshwater used each year for completions (hydraulic fracturing) per unit of natural gas production (e.g., gallons per mcf or mmBtu), including the freshwater used (i.e., gallons) and natural gas production (i.e., total volume of natural gas produced) figures used to calculate intensity.
Provide a breakdown of freshwater intensity by area of operations in addition to a company-wide figure.
The definition of freshwater may vary across states and areas of operations. Clearly defining freshwater is important to allow for tracking both across multiple areas of operation within a company and across different natural gas producers.
Performance Indicators
What are the sources of water for completions (hydraulic fracturing) at your operations by volume and percentage of total volume?
For freshwater, what is the intensity of use?
02 WATER
Quantitative Indicator: Water Use
Stakeholders are interested in annual data on a producer’s total water use for hydraulic fracturing activities, the sourcing of water, and the intensity of freshwater to gain perspective on operator performance and better understand the potential impact of freshwater use reduction efforts. While freshwater use intensity provides the clearest insight on performance, stakeholders remain interested in gross water use data given the potential impact on localized areas, especially in areas where water is scarce or stressed. A regional breakdown of water use and freshwater use intensity can be useful for fully understanding operations and allowing producers to explain how regional, geologic, and hydrocarbon differences impact freshwater use.
Examples of Existing Reporting Water use and freshwater intensity are provided in annual reports and on websites developed by leading natural gas producers. Companies may already disclose the data requested by this indicator in response to other reporting frameworks, including DTF, GRI, and IPIECA. Table 1 in this paper’s technical supplement provides a list of the questions in existing frameworks that are consistent with this performance indicator. Natural gas producers may report similar information to state or local regulators, but such information may not be available to stakeholders in an accessible form.

15
Reporting Guidance
Report frequency of pre- and post-drilling water testing by area of operations.
Report location of water testing, including distance from well sites and proximity to surface impoundments.
Leading practices may include the sampling of potentially affected water sources for as long as there is active production in the area, given the long periods of time that it may require for fluids and gas to migrate through underground formations.
Performance Indicators
Do you conduct pre- and post-drill groundwater testing?
What is the frequency and location?
Careful planning and management ensures that groundwater supplies are protected from potential spills and well failures. However, groundwater may contain naturally occurring methane and other compounds associated with the natural gas industry. Additionally, in some areas, legacy production may have caused water contamination. Testing water before drilling can help natural gas producers and communities understand the potential contribution of natural gas production to water contamination in the event of infiltration. Baseline readings can be compared to water samples taken after well completion and during the production stage.
Examples of Existing Reporting Companies may already report appropriate responses to this indicator each year consistent with other reporting frameworks, including DTF and SASB. Table 1 in this paper’s technical supplement provides a list of the questions in existing frameworks that are consistent with this performance indicator. Additionally, state and local regulations may require companies to conduct water testing and report the results. While such data would satisfy this indicator, is it not always made publicly available by natural gas producers.
02 WATER
Quantitative Indicator: Water Testing

16
Reporting Guidance
Report total number, location, and volume of hydrocarbon and non-hydrocarbon spills to groundwater, surface water, and soil each calendar year.
Given the potential for different definitions across companies and regions, natural gas producers reporting spill data should include the criteria used to define what constitutes a spill.
This indicator only requests disclosure on spills to soil and water, and would not include releases that are captured in containment structures or otherwise prevented from reaching the environment.
Some states require producers to report spills. To the extent producers do so, they could provide the same information in an accessible format along with the definition of a spill.
Performance Indicators
What were the number and volume of hydrocarbon and non-hydrocarbon spills to soil and water from your operations?
Natural gas producers deploy a range of strategies to avoid spills and, when they occur, prevent spills from reaching groundwater, surface water, or the soil. Data on spills, including the location, volume, and the type of spill can be used by the industry to assist in mitigating any impacts and avoiding similar spills in the future. Data on spills along with context about the extent of potential impacts can help stakeholders understand the risks associated with a spill. Given the ranges of liquids and materials at natural gas production sites, producers should provide information on both hydrocarbon and non-hydrocarbon spills each year.
Examples of Existing Reporting Natural gas producers may already disclose information related to this indicator in response to other existing requests, including those by GRI, IPIECA, and SASB (see Table 1 in the technical supplement). Further, many states require reporting of spills to local regulators (although this information may not be readily accessible to the public). Leading companies are currently reporting spill data on their websites alongside information that provides context on spills and measures to prevent them.
02 WATER
Quantitative Indicator: Spill Reporting

17
Reporting Guidance
Management strategies related to freshwater used for hydraulic fracturing include high-level company policies as well as specific technologies and work practices. As part of reporting, companies could report their overall approach to freshwater use, including any targets. Reporting of specific practices could include technologies and best management practices deployed in the field to reduce water use. One approach companies may find useful is highlighting broader policy positions and targets and then providing specific examples of how those policies are pursued and implemented.
Performance Indicators
What is your strategy for managing freshwater use?
02 WATER
Management Strategy: Freshwater Use Strategy
There are a range of options that companies can employ to reduce the amount of freshwater they use during the hydraulic fracturing process. While specific options will depend on local resources, companies may look for non-potable water sources or they may treat and recycle water onsite. Leading gas producers clearly explain policies on freshwater usage and detail efforts to reduce the volume of freshwater used in operations. These disclosures are essential to understanding a company’s approach to managing freshwater. The use of freshwater for gas production is of particular concern in areas of water scarcity, especially when it competes with other uses such as public supply and agriculture. Stakeholders expect producers to take steps to reduce their freshwater use and clearly articulate related policies and strategies to the public.
Examples of Leading Practices Information on both broad and specific freshwater management strategies is requested in most existing voluntary reporting frameworks (see Table 2 in the technical supplement). Example policies and work practices are listed below. This indicator is intended to be inclusive and disclosure should not be restricted to the examples provided.
Establishing production-based freshwater use intensity targets. (Similar indicator found in CDP)
Reducing freshwater use through efforts such as wastewater recycling, use of brackish water, and operational improvements. (Similar indicators found in DTF and IPIECA)
Not using local freshwater resources that directly compete with and negatively impact other local uses, such as agriculture and drinking supplies. (Similar indicators found in DTF and IPIECA)
Reporting on efforts to limit or reduce freshwater use in water-stressed areas. (Similar indicators found in DTF and IPIECA)

18
Reporting Guidance
There are a number of steps natural gas producers can take to ensure well integrity. These include planning and surveys that begin before drilling starts, followed by a range of testing and monitoring methods during and after well construction. Different practices may be appropriate in different situations and producers are encouraged to share information on all of their strategies, including the risk assessment process used to determine which strategy to implement.
Performance Indicators
What is your approach to well planning and strategy for maintaining well integrity?
02 WATER
Management Strategy: Well Planning and Integrity Strategy
Well planning and integrity are critical to the success of natural gas producers. Appropriately constructed wellbores keep product in the pipeline, protecting workers as well as the environment. Without proper planning and commitment to well integrity, producers risk creating safety hazards and contaminating water supplies. With the increase in hydraulic fracturing, well planning and integrity has taken on additional importance, as developers must ensure horizontal wellbores and fractures do not intersect with existing manmade and natural pathways, and that wells are able to withstand high-pressure injections.
While natural gas companies have long prioritized well planning and integrity and built the concept of safe operations into their corporate cultures, these topics remain high priorities for stakeholders. It remains important for companies to communicate what policies and practices they implement to prevent well failures and other well-related contamination pathways.
Examples of Leading Practices All natural gas producers work to ensure well integrity because it is key to successful gas production. Many industry-sponsored best management practices encourage implementation of strategies that could be reported under this indicator. However, not all companies report on their policies and the specific actions they take. Example policies and work practices are listed below, including relevant API practices and standards. Table 2 in the technical supplement provides a list of where this information is requested in existing reporting frameworks. This indicator is intended to be inclusive and disclosure should not be restricted to the examples.
19
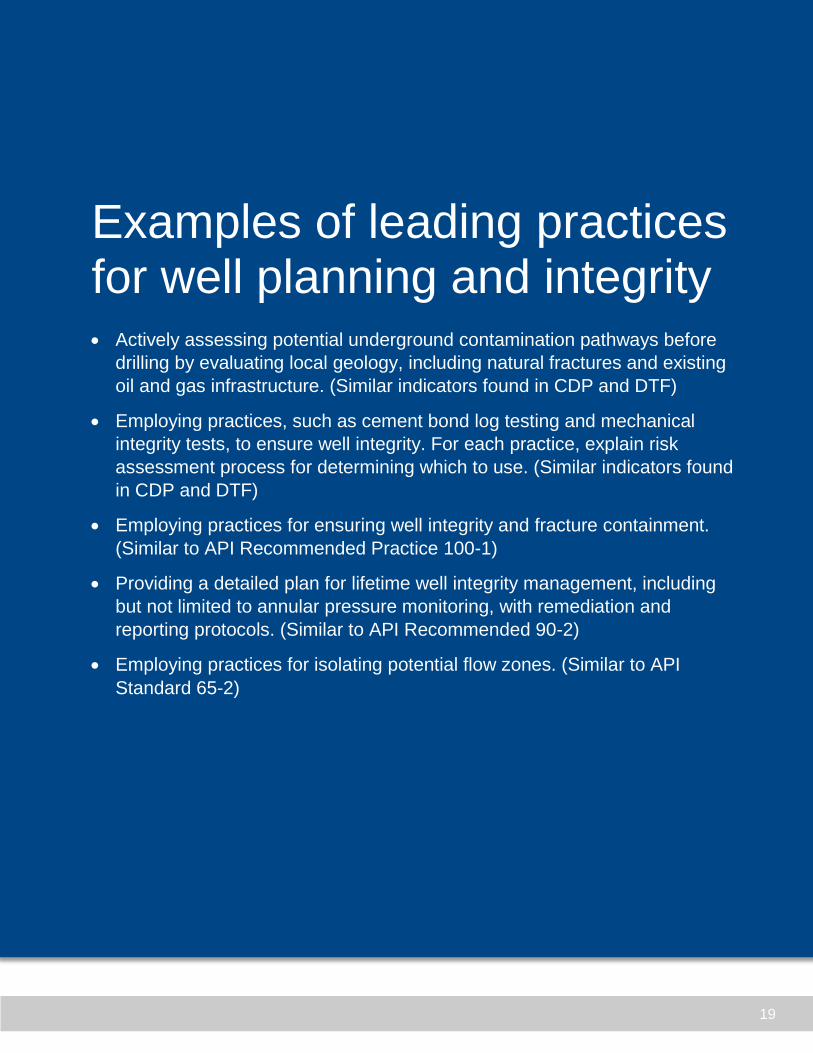
Examples of leading practices for well planning and integrity
Actively assessing potential underground contamination pathways before
drilling by evaluating local geology, including natural fractures and existing
oil and gas infrastructure. (Similar indicators found in CDP and DTF)
Employing practices, such as cement bond log testing and mechanical
integrity tests, to ensure well integrity. For each practice, explain risk
assessment process for determining which to use. (Similar indicators found
in CDP and DTF)
Employing practices for ensuring well integrity and fracture containment.
(Similar to API Recommended Practice 100-1)
Providing a detailed plan for lifetime well integrity management, including
but not limited to annular pressure monitoring, with remediation and
reporting protocols. (Similar to API Recommended 90-2)
Employing practices for isolating potential flow zones. (Similar to API
Standard 65-2)

20
Reporting Guidance
Natural gas companies have many options for how they store, transport, treat, and dispose of wastewater from their operations. These include company-wide policies and specific technologies. This is an area of ongoing research, and company disclosure is not intended to be restricted to specific technologies and work practices.
Performance Indicator
What is your strategy for managing water onsite and wastewater?
02 WATER
Management Strategy: Wastewater Management Strategy
Stakeholders are interested in a range of topics related to wastewater, which includes produced water, flowback, drilling mud, and other water managed onsite. After hydraulic fracturing, significant volumes of the injected fluids and water from the formation can rise up the wellbore. Natural gas producers deploy safeguards to manage these fluids and prevent unauthorized discharges, spills during transport, leaks from storage facilities, and accumulations in residuals near treatment facilities (and properly dispose of any residuals).
Beyond storage and transport, stakeholders are interested in how producers reuse and dispose of fluids. Treating wastewater for reuse in further gas production can reduce freshwater use. With proper siting and management, wastewater can also be safely injected and permanently sequestered in underground formations. However, in certain regions, these disposal wells have been associated with an increase in seismic activity, leading to increased scrutiny.
Examples of Leading Practices With the surge in the development of unconventional gas resources over the past decade, the industry’s approach to flowback and wastewater management has been of particular concern to stakeholders. As such, many companies already voluntarily report information on their practices (see Table 2 in the technical supplement). Example policies and work practices are listed below. This indicator is intended to be inclusive and disclosure should not be restricted to the examples provided.

21
Examples of leading practices for wastewater management
Employing practices to avoid seismic activity when operating deep disposal
wells or require such practices of wastewater disposal well companies.
(Similar indicator found in DTF)
Employing risk assessment processes when determining what type of
treatment and storage systems to deploy. (Similar indicator found in DTF)
Reducing wastewater volumes by managing wastewater via in-field
recycling. (Similar indicator found in IPIECA)
Describing how wastewater is handled and the ultimate disposition of
wastewater. (Similar indicators found in GRI and IPIECA)
Prior to reuse of produced water offsite, participating in research to better
understand opportunities for reuse outside the field and the health and
environmental risks associated with reuse, especially for agriculture.
(Similar indicators found in CDP and IPIECA)
22
03 Chemical Use

23
Reporting Guidance
Describe stewardship activities related to hydraulic fracturing chemicals.
Report quantitative data each year that the company uses to measure progress related to chemical stewardship for chemicals used for hydraulic fracturing.
As appropriate, provide a breakdown by area of operations in addition to a company-wide figure.
Performance Indicators
How do you measure progress on stewardship activities for hydraulic fracturing chemicals? Provide quantitative data.
03 CHEMICAL USE
Quantitative Indicator: Chemical Stewardship
Chemical use in hydraulic fracturing fluid is a topic of interest for stakeholders. Understanding chemical use provides context for the potential impacts of spills and for tracing potential infiltration to groundwater or surface water. Voluntary industry initiatives such as the FracFocus database have significantly improved transparency on chemical use, but exceptions for proprietary information still hamper full disclosure. Stakeholders are interested in annual quantitative information that provides a broad perspective on the actions companies have undertaken to assess progress made on chemical stewardship activities. This information might include the number of product assessments of potential impacts undertaken or reductions in total chemical use on a volumetric or percentage basis.
A challenge to reporting on progress made on chemical stewardship is that third party contractors frequently provide the hydraulic fracturing fluid to natural gas producers. Despite this limitation, providing stakeholders with a way to understand actions related to chemical stewardship helps provide context to the detailed information reported at a well-by-well level through FracFocus.
Examples of Existing Reporting A number of existing reporting frameworks request information that would satisfy this indicator, including DTF, GRI, and IPIECA (see Table 1 in the technical supplement). Further, leading natural gas producers provide information on efforts to reduce the risks associated with fracturing fluids in their annual reporting and on their websites.
24
Reporting Guidance
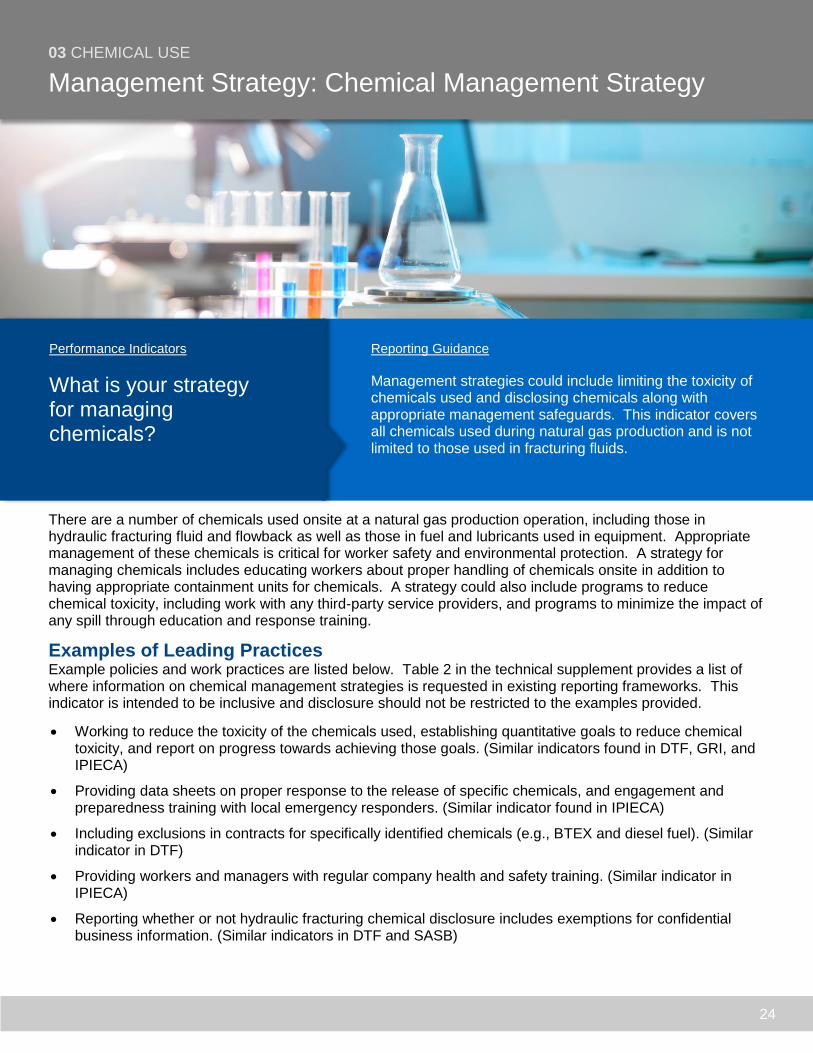
Management strategies could include limiting the toxicity of chemicals used and disclosing chemicals along with appropriate management safeguards. This indicator covers all chemicals used during natural gas production and is not limited to those used in fracturing fluids.
Performance Indicators
What is your strategy for managing chemicals?
03 CHEMICAL USE
Management Strategy: Chemical Management Strategy
There are a number of chemicals used onsite at a natural gas production operation, including those in hydraulic fracturing fluid and flowback as well as those in fuel and lubricants used in equipment. Appropriate management of these chemicals is critical for worker safety and environmental protection. A strategy for managing chemicals includes educating workers about proper handling of chemicals onsite in addition to having appropriate containment units for chemicals. A strategy could also include programs to reduce chemical toxicity, including work with any third-party service providers, and programs to minimize the impact of any spill through education and response training.
Examples of Leading Practices Example policies and work practices are listed below. Table 2 in the technical supplement provides a list of where information on chemical management strategies is requested in existing reporting frameworks. This indicator is intended to be inclusive and disclosure should not be restricted to the examples provided.
Working to reduce the toxicity of the chemicals used, establishing quantitative goals to reduce chemical toxicity, and report on progress towards achieving those goals. (Similar indicators found in DTF, GRI, and IPIECA)
Providing data sheets on proper response to the release of specific chemicals, and engagement and preparedness training with local emergency responders. (Similar indicator found in IPIECA)
Including exclusions in contracts for specifically identified chemicals (e.g., BTEX and diesel fuel). (Similar indicator in DTF)
Providing workers and managers with regular company health and safety training. (Similar indicator in IPIECA)
Reporting whether or not hydraulic fracturing chemical disclosure includes exemptions for confidential business information. (Similar indicators in DTF and SASB)

25
04 Community and Safety
26
Reporting Guidance
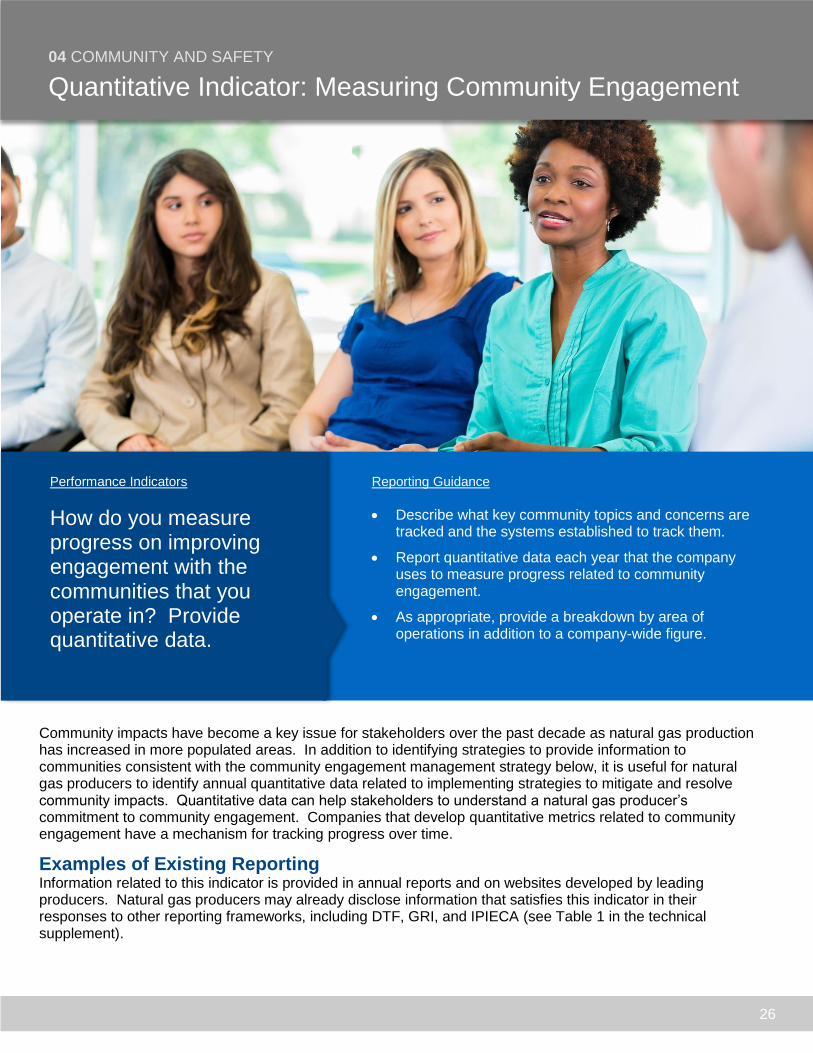
Describe what key community topics and concerns are tracked and the systems established to track them.
Report quantitative data each year that the company uses to measure progress related to community engagement.
As appropriate, provide a breakdown by area of operations in addition to a company-wide figure.
Performance Indicators
How do you measure progress on improving engagement with the communities that you operate in? Provide quantitative data.
04 COMMUNITY AND SAFETY
Quantitative Indicator: Measuring Community Engagement
Community impacts have become a key issue for stakeholders over the past decade as natural gas production has increased in more populated areas. In addition to identifying strategies to provide information to communities consistent with the community engagement management strategy below, it is useful for natural gas producers to identify annual quantitative data related to implementing strategies to mitigate and resolve community impacts. Quantitative data can help stakeholders to understand a natural gas producer’s commitment to community engagement. Companies that develop quantitative metrics related to community engagement have a mechanism for tracking progress over time.
Examples of Existing Reporting Information related to this indicator is provided in annual reports and on websites developed by leading producers. Natural gas producers may already disclose information that satisfies this indicator in their responses to other reporting frameworks, including DTF, GRI, and IPIECA (see Table 1 in the technical supplement).
27
Reporting Guidance
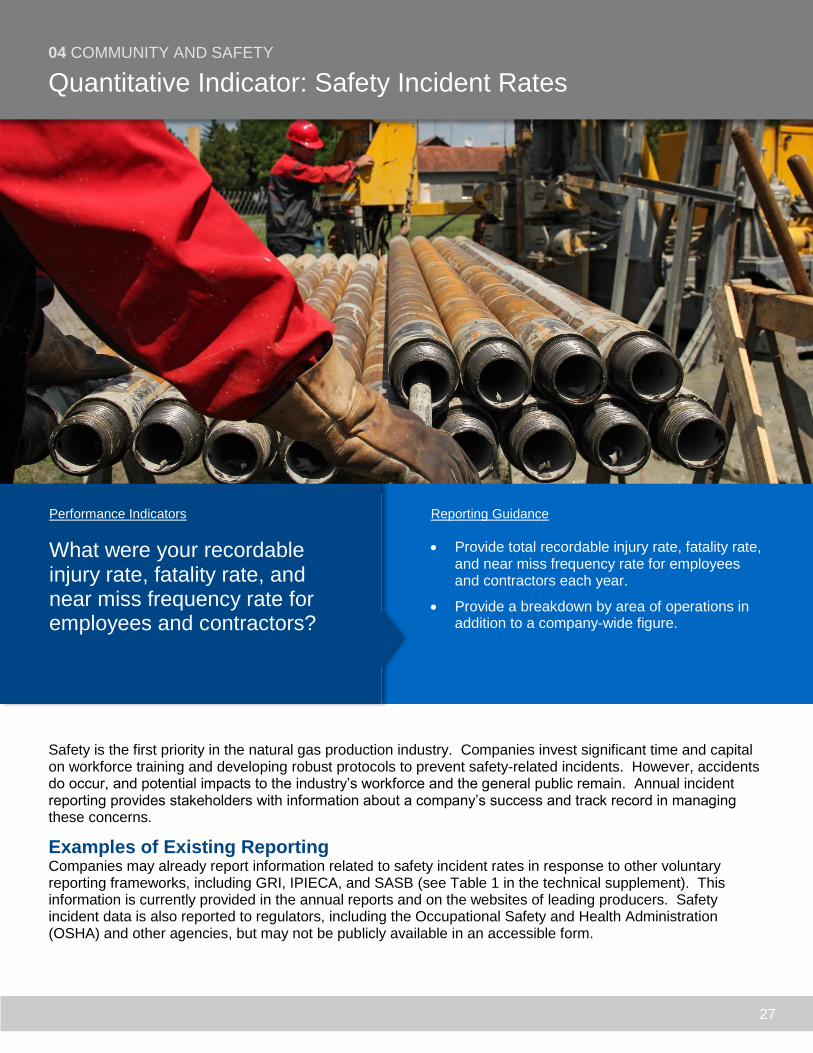
Provide total recordable injury rate, fatality rate, and near miss frequency rate for employees and contractors each year.
Provide a breakdown by area of operations in addition to a company-wide figure.
Performance Indicators
What were your recordable injury rate, fatality rate, and near miss frequency rate for employees and contractors?
04 COMMUNITY AND SAFETY
Quantitative Indicator: Safety Incident Rates
Safety is the first priority in the natural gas production industry. Companies invest significant time and capital on workforce training and developing robust protocols to prevent safety-related incidents. However, accidents do occur, and potential impacts to the industry’s workforce and the general public remain. Annual incident reporting provides stakeholders with information about a company’s success and track record in managing these concerns.
Examples of Existing Reporting Companies may already report information related to safety incident rates in response to other voluntary reporting frameworks, including GRI, IPIECA, and SASB (see Table 1 in the technical supplement). This information is currently provided in the annual reports and on the websites of leading producers. Safety incident data is also reported to regulators, including the Occupational Safety and Health Administration (OSHA) and other agencies, but may not be publicly available in an accessible form.
28
Reporting Guidance
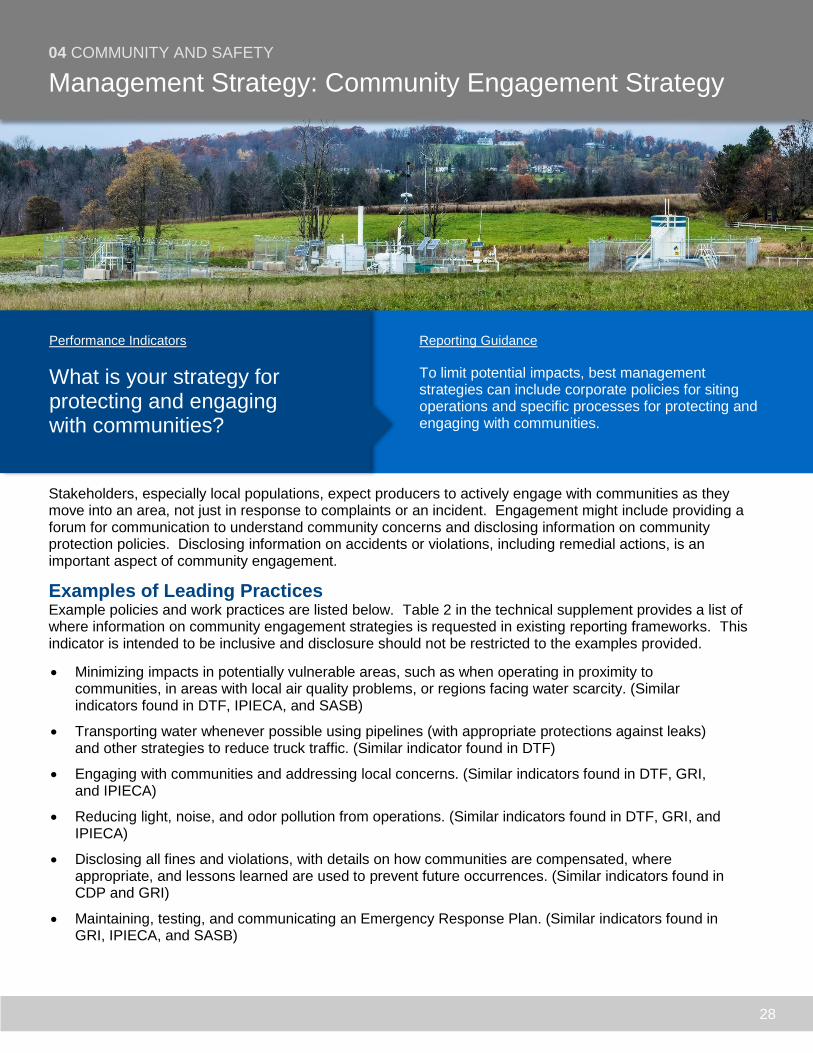
To limit potential impacts, best management strategies can include corporate policies for siting operations and specific processes for protecting and engaging with communities.
Performance Indicators
What is your strategy for protecting and engaging with communities?
04 COMMUNITY AND SAFETY
Management Strategy: Community Engagement Strategy
Stakeholders, especially local populations, expect producers to actively engage with communities as they move into an area, not just in response to complaints or an incident. Engagement might include providing a forum for communication to understand community concerns and disclosing information on community protection policies. Disclosing information on accidents or violations, including remedial actions, is an important aspect of community engagement.
Examples of Leading Practices Example policies and work practices are listed below. Table 2 in the technical supplement provides a list of where information on community engagement strategies is requested in existing reporting frameworks. This indicator is intended to be inclusive and disclosure should not be restricted to the examples provided.
Minimizing impacts in potentially vulnerable areas, such as when operating in proximity to communities, in areas with local air quality problems, or regions facing water scarcity. (Similar indicators found in DTF, IPIECA, and SASB)
Transporting water whenever possible using pipelines (with appropriate protections against leaks) and other strategies to reduce truck traffic. (Similar indicator found in DTF)
Engaging with communities and addressing local concerns. (Similar indicators found in DTF, GRI, and IPIECA)
Reducing light, noise, and odor pollution from operations. (Similar indicators found in DTF, GRI, and IPIECA)
Disclosing all fines and violations, with details on how communities are compensated, where appropriate, and lessons learned are used to prevent future occurrences. (Similar indicators found in CDP and GRI)
Maintaining, testing, and communicating an Emergency Response Plan. (Similar indicators found in GRI, IPIECA, and SASB)

29
Reporting Guidance
Leading strategies include corporate policies to ensure that contractors are thoroughly vetted prior to hiring and that they understand and fully comply with their corporate health, safety, and environmental policies.
Performance Indicators
What is your strategy for ensuring contractor health, safety, and environmental performance?
A significant amount of the work supporting production operations is performed by contractors not directly employed by natural gas companies. Because producers are ultimately responsible for the work carried out by contractors, stakeholders expect producers to ensure that the companies they hire have good track records and fully comply with company policies and standards. Leading companies implement a range of policies to help ensure contractor performance, including screening contractors before hiring and requiring contractors to meet the same standards as company employees. Properly managing contractors reduces the risk of environmental and/or safety incidents caused by third parties that have the potential to harm company reputation and threaten the social license to operate.
Examples of Leading Practices Example policies and work practices are listed below. Table 2 in the technical supplement provides a list of where information on contractor performance strategies is requested in existing reporting frameworks. This indicator is intended to be inclusive and disclosure should not be restricted to the examples provided.
Using third-party databases to screen contractors on environmental and safety metrics before hiring. (Similar indicator found in DTF)
Establishing contractor performance standards on metrics related to safety and community impacts (e.g., spills, traffic accidents). (Similar indicators found in DTF and GRI)
Establishing a code of conduct for contractors to communicate expected business conduct. (Similar indicator found in GRI)
Requiring contractors to meet the same training and safety levels required for employees. (Similar indicators found in GRI, IPIECA, and SASB)
04 COMMUNITY AND SAFETY
Management Strategy: Contractor Performance Strategy
30
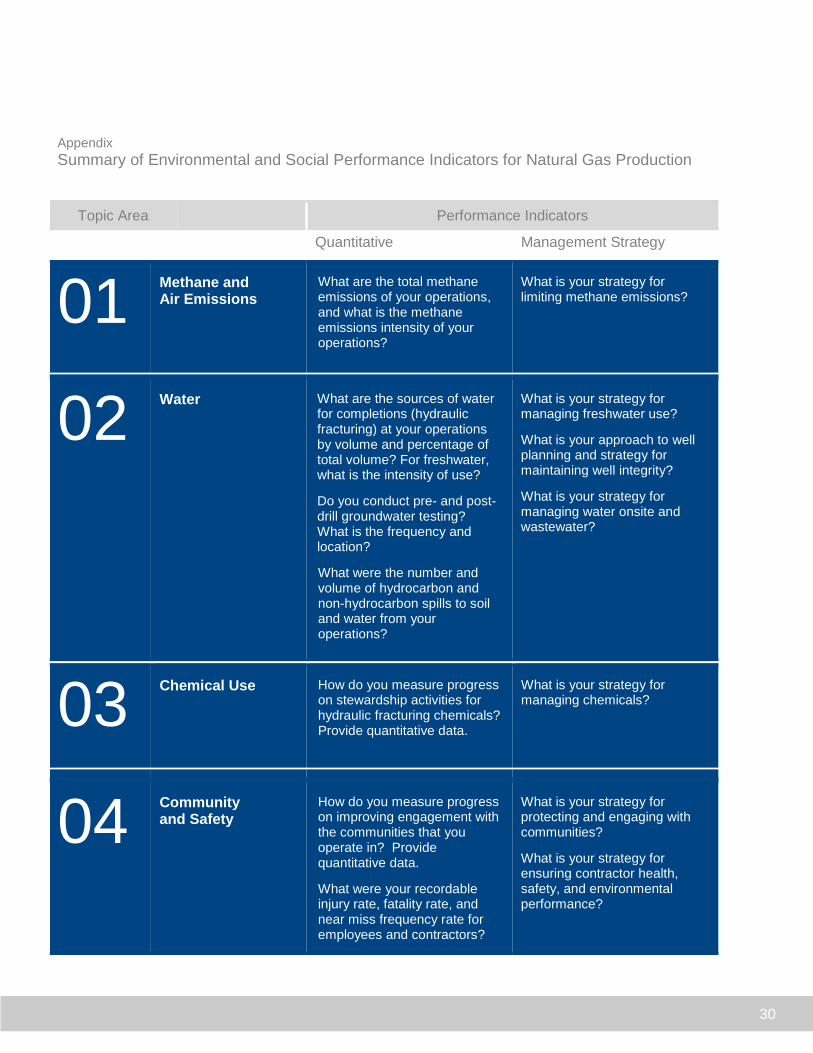
Appendix
Summary of Environmental and Social Performance Indicators for Natural Gas Production
Topic Area Performance Indicators
Quantitative Management Strategy
01 Methane and Air Emissions
What are the total methane emissions of your operations, and what is the methane emissions intensity of your operations?
What is your strategy for limiting methane emissions?
02 Water What are the sources of water
for completions (hydraulic fracturing) at your operations by volume and percentage of total volume? For freshwater, what is the intensity of use?
Do you conduct pre- and post-drill groundwater testing? What is the frequency and location?
What were the number and volume of hydrocarbon and non-hydrocarbon spills to soil and water from your operations?
What is your strategy for managing freshwater use?
What is your approach to well planning and strategy for maintaining well integrity?
What is your strategy for managing water onsite and wastewater?
03 Chemical Use How do you measure progress
on stewardship activities for hydraulic fracturing chemicals? Provide quantitative data.
What is your strategy for managing chemicals?
04 Community and Safety
How do you measure progress on improving engagement with the communities that you operate in? Provide quantitative data.
What were your recordable injury rate, fatality rate, and near miss frequency rate for employees and contractors?
What is your strategy for protecting and engaging with communities?
What is your strategy for ensuring contractor health, safety, and environmental performance?

31