environmental impact assessment project report for …
TRANSCRIPT

ENVIRONMENTAL IMPACT ASSESSMENT PROJECT REPORT
FOR THE PROPOSED BOREHOLE DRILLING FOR
HASS PETROLEUM
ON L.R NO:
IN
INDUSTRIAL AREA OF NAIROBI COUNTY
Submitted to the National Environmental Management Authority (NEMA) in conformity with the
The Environmental Management and Coordination Act (EMCA ACT) Cap 387
Proponent/ owner:
HASS PETROLEUM
P.O. BOX,
.
JANUARY, 2021

i
EXPERT AND PROPONENT DETAILS
PROPONENT:
HASS PETROLEUM
P.O. BOX,
.
Signature…………………………………… Date: …………………………..
LEAD EXPERT
GREEN HEALTH AND SAFE ENVIRONS LTD
P.O BOX 12035- 00400,
NAIROBI.
Reg. No. 10732.
Name: ……………………………………………..
Signature: ……………………………………….... Date: ……………………………….
(Lead Expert)
Disclaimer:
This environmental impact assessment project report is based on the information made available
by the proponent to the consultant and findings from the field assessment. It is strictly confidential
to the proponent and any materials thereof should strictly be in accordance with the agreement
from the proponent. It is however, subject to conditions in the Environmental, (Impact Assessment
and Audit) Regulations, 2003

ii
ACCRONYMS
EMCA Environmental management Coordination Act
EIA Environmental impact assessment
EA Environmental Audit
DTH Down the hole Hammer
WRA Water Resource Authority
NEMA National Environmental Management Authority
EMP Environmental management plan
PPE Personal Protective Equipment
TDS Total dissolved solutes
NCG Nairobi County Government
m bgl Metre below ground level
KM Kilometers
mm Millimeter
0C Degrees centigrade
N North
S South
E East
W West

iii
TABLE OF CONTENTS
ACCRONYMS ............................................................................................................................. i
TABLE OF CONTENTS ........................................................................................................... iii
LIST OF FIGURES ................................................................................................................... iv
LIST OF TABLES ..................................................................................................................... iv
1 CHAPTER ONE: BASELINE INFORMATION ON THE AREA ................................... 1
1.1 Project Background ......................................................................................................... 1
1.2 Project Site Location ....................................................................................................... 1
1.3 Project Activities ............................................................................................................. 2
1.4 Climate ........................................................................................................................... 2
2 CHAPTER TWO: PROJECT ALTERNATIVES ............................................................. 3
2.1 Alternative Water Sources ............................................................................................... 3
2.2 Alternative Site ............................................................................................................... 3
3 CHAPTER THREE: PROJECT JUSTIFICATION ......................................................... 5
4 CHAPTER FOUR: ENVIRONMENTAL AND SOCIAL IMPACTS OF THE
PROPOSED PROJECT .............................................................................................................. 6
4.1 Environmental Impacts ................................................................................................... 6
4.1.1 Underground water depletion ................................................................................... 6
4.1.2 Reduced surface-water flows ................................................................................... 6
4.1.3 Soil Compaction ...................................................................................................... 7
4.1.4 Soil pollution ........................................................................................................... 7
4.1.5 Oil pollution............................................................................................................. 7
4.1.6 Soil Erosion ............................................................................................................. 7
4.1.7 Loss of biodiversity.................................................................................................. 8
4.1.8 Noise pollution ........................................................................................................ 8
4.1.9 Air quality/particulate matter (dust).......................................................................... 8

iv
4.2 SOCIAL IMPACTS ........................................................................................................ 9
4.2.1 Water supply ............................................................................................................ 9
4.2.2 Hazard ..................................................................................................................... 9
4.2.3 Contamination ......................................................................................................... 9
4.2.3.1 Testing Well Water for Microbiological Contamination .................................... 9
4.2.3.2 Borehole Maintenance .................................................................................... 10
4.2.4 Safety (worker exposure, safety impacts) ............................................................... 10
4.2.5 Creation of employment especially during drilling ................................................. 10
4.2.6 Promotion of secondary development..................................................................... 10
5 CHAPTER FIVE: POTENTIAL NEGATIVE IMPACTS AND MITIGATION
MEASURES .............................................................................................................................. 11
6 CHAPTER SIX: COMPLIANCE TO THE RELEVANT REGULATIONS AND
REQUIREMENTS .................................................................................................................... 12
7 CHAPTER SEVEN: CONCLUSION .............................................................................. xiii
REFERENCES ......................................................................................................................... xiii
APPENDICES .......................................................................................................................... xiv
LIST OF FIGURES
Figure 1.1: Satellite extract showing the general proposed borehole location ............................... 1
Figure 1.2: Annual climate graph of Nairobi Area ........................................................................ 2
LIST OF TABLES
Table 5.1: Potential Negative Impacts and Mitigation Measures ................................................. 11

1
1 CHAPTER ONE: BASELINE INFORMATION ON THE AREA
1.1 Project Background
Industrial Area is in Nairobi County, Kenya. The area is located about 500 meters off Lunga
Lunga Road. The project site is located within Viwandani village of Nairobi. Access to the site
from Nairobi CBD is a left exit on Lunga Lunga Road towards Donholm on L.R. No:. The
proponent land area generally has inadequate water supply thus prompting the proponent to sink
the proposed replacement borehole in order to establish a reliable water supply source. The project
area is not connected to a public water supply system so the community relies on private
boreholes and water vendors. Chronic water shortages have driven the client to think of drilling
a borehole to act as the main water supply within this area for domestic and supply purposes. If
the client won’t be authorized to sink a borehole at the site, they will rely on water vendors which
are expensive and unreliable.
1.2 Project Site Location
The site is situated in Industrial area of Nairobi County. It lies within the Survey of Kenya
topographic sheets for Nairobi (No. 148/4). The site can be accessed through Lang’ata Road on
L.R. No:. Its defining coordinates are Zone 37M, 0264109 and UTM 9856050.
Figure 1.1: Satellite extract showing the general proposed borehole location

2
1.3 Project Activities
The proponent HASS PETROLEUM wishes to drill a replacement borehole to abstract water for
domestic and supplies use on L.R. No:. The borehole will be drilled with a truck mounted drill
and a compressor. The borehole will later be equipped with a pump either powered by solar
panels or an electricity source. The estimated water requirement is 35.0m3/day. The most
reliable water supply for the proponent is from ground water resources. This resource is renewable
and gets replenished naturally. Sustainable management is however recommended for longevity.
1.4 Climate
The climate is warm and temperate in Nairobi. In winter, there is much less rainfall in Nairobi than
in summer. The temperature here averages 19.0 °C. The average annual rainfall is 869 mm. The
driest month is July, with 14 mm of rainfall. With an average of 191 mm, the most precipitation
falls in April. The warmest month of the year is March, with an average temperature of 20.7 °C.
July has the lowest average temperature of the year. It is 16.7 °C. The difference in precipitation
between the driest month and the wettest month is 177 mm. During the year, the average
temperatures vary by 4.0 °C.
Figure 1.2: Annual climate graph of Nairobi Area

3
2 CHAPTER TWO: PROJECT ALTERNATIVES
Several alternatives to the project including water sources, site and drilling technology were
considered during the EIA process. The alternatives given here below:
2.1 Alternative Water Sources
The supply is currently from roof catchments, private borehole and the water vendors in the area.
However, the sources are insufficient and cannot sustain the proposed domestic water supply.
This problem worsens during prolonged dry spells and water rationing. Thus the proposed
borehole is expected to serve as an alternative to this source and ensure that the project has
enough and reliable water supply. The other alternative water sources are from nearby private
boreholes and water vendors whose price is high.
2.2 Alternative Site
The following project alternatives to the proposed water project were considered and their
advantages and disadvantages outlined.
1. No Project option
This alternative would mean that the project does not proceed.
Advantages
The proposed site will remain as it is without disturbance
There wouldn’t be ground compaction as a result of heavy machinery use
There would be no soil or water contamination from the alien materials that will be
introduced in the earth’s system
Air pollution from dust as a result of the drilling process will not occur
Disadvantages
The proponent will not have reliable water supply for domestic use
There will be no creation of employment across the project cycle
The expected income to the developer and the economy will not be realized
The value of land might improve but it will remain underdeveloped
There will continue to be a water shortage especially when the rains fail
2. Underground water abstraction
Advantages
It will provide reliable water supply to the proponent.

4
Operational and maintenance costs are low
Plans and designs have already been done for the proposed project
Less time will be used for drilling
It will utilize a small section of the total land area
Disadvantages
It is expensive to drill the borehole
This will translate to lower income for the project proponent or developers
Underground water utilization will not be optimized sustainably
3. Rainwater harvesting
Advantages:
It is cheaper than the proposed project
Encourages water storage and conservation
It will be easier to construct and manage
It will serve individual users directly
It is water of good quality if harnessed properly.
Disadvantages:
Water harvesting is limited to the rainy season therefore they are an unreliable source of
water supply to the proponent.
Rainwater collected would not be sufficient
There will be no saving of money and water will have to be bought from water vendors
after much deliberation, alternative 2 was found to be the superior alternative and was
therefore adopted.
The proposed drill sites have already been identified by the hydrogeologist.
5
3 CHAPTER THREE: PROJECT JUSTIFICATION
Water scarcity in Kenya has been an issue for decades, as only a small percentage of the country's
land is optimal for agriculture, and the year-round climate is predominantly arid. Rapid
urbanization has also pushed urban dwellers away from the city, where there is no sufficient water
supply.
Therefore the major objectives of the project include:
Provision of adequate water supply for the proponent for domestic and supply use.
Curbing the problem of water shortage especially during the dry seasons.
Currently, the population living in this area gets water from the private boreholes, water vendors
and roof catchment, but the supply is insufficient for the client’s needs. Water from the proposed
borehole will be used for domestic and supply purposes within and around the plot. Water demand
is estimated at 30.00m³/day.

6
4 CHAPTER FOUR: ENVIRONMENTAL AND SOCIAL IMPACTS OF THE
PROPOSED PROJECT
4.1 Environmental Impacts
4.1.1 Underground water depletion
Ground-water depletion is primarily caused by un-sustained ground-water pumping. Some of the
negative effects of ground-water depletion include increased pumping costs, deterioration of water
quality, reduction of water in streams and lakes, or land subsidence. Such effects, while variable,
happen to some degree with any ground-water use. Ground water can be recharged (deposited) by
infiltration from precipitation, surface water, or applied irrigation water; it can be kept in storage
(saved); and it can be discharged naturally to streams, springs, or seeps, or transpired by plants
(withdrawn).
Mitigation measures:
1. Proper monitoring of number of boreholes being authorized by the Water Resources
Management Authority within the proposed area.
2. The project proponent should not exceed the water usage limit per day.
3. Alternate water usage with rain water when available.
4. Encourage rain water harvesting and use that water for non-domestic uses like cleaning
floors and watering flowers. Store the rain water in tanks for future use.
5. Monitor and meter the water system to determine the largest water consumption areas;
monitoring also can help detect leaks in water systems (this step is more relevant to
industrial water users).
6. Community service participation like tree planting.
4.1.2 Reduced surface-water flows
In most areas, the surface- and ground-water systems are intimately linked. Ground-water pumping
can alter how water moves between an aquifer and a stream, lake, or wetland by either intercepting
ground-water flow that discharges into the surface-water body under natural conditions, or by
increasing the rate of water movement from the surface-water body into an aquifer. In either case,
the net result is a reduction of flow to surface water, though the full effect may take many years to
develop.
7
Mitigation measure:
Proper management and conservation of the catchment zones through tree planting.
4.1.3 Soil Compaction
Soil compaction will be minimal as the drilling will only take place within a 3 day period.
Mitigation:
1. The contractor will always use a predetermined route to the site.
2. Unnecessary heavy machines will be avoided.
3. Operations will be timed to take place during the dry season when the soils are dry to
reduce the risk of soil compaction.
4.1.4 Soil pollution
Soil pollution may arise due to spillages of oil/grease and construction materials during
construction, operation or decommissioning stage.
Mitigation:
1. Spillages will be minimized by using right machinery that is regularly serviced and
operators who are qualified following the operations instructions strictly.
2. In case of accidental spillages, the leaking fluid should be tapped into a container and later
dumped in a safe manner.
3. The contractor and the management will ensure effective wastewater management.
4. Foreign material will be removed from the site as soon drilling is complete.
4.1.5 Oil pollution
Oil pollution may occur during the drilling and in the operation phase.
Mitigation:
1. Proper storage, handling and disposal of oil and oil wastes.
2. Maintain machinery and equipment to avoid leaks.
3. Maintenance of drilling vehicles will be carried out in the contractor’s yard.
4.1.6 Soil Erosion
Soil erosion may occur during the drilling phase. During drilling, the site will be dug out and top
soil exposed. Erosion would probably be minor for this project due to the flat terrain, permeable
soils and lack of proximity to surface water drainages.

8
Mitigation:
1. Control earthworks especially if works begin in the rainy season.
2. Loose soils will be compacted when necessary.
3. The contractor will ensure management of excavation activities.
4. Activities will be controlled especially if drilling will take place during rainy conditions.
5. Provide soil erosion control structures on the steep sides during drilling.
4.1.7 Loss of biodiversity
No vegetation will be cleared to pave way for the drilling.
Mitigation:
1. Access to the site should be via a designated route for the rigs and other vehicles.
2. No unnecessary cutting of vegetation should be done at the site.
4.1.8 Noise pollution
Mitigation:
1. Keep members of the public away from the drilling site during drilling.
2. Warn the sensitive neighboring establishment 5 days before drilling commences.
3. Maintain plant equipment to avoid annoying noises.
4. Construction activities to be restricted to daytime.
5. Workers in the vicinity of high-level noise to wear safety and protective gears.
4.1.9 Air quality/particulate matter (dust)
Vehicular/equipment engine exhaust emissions will be minor and temporary during construction.
Air quality impacts will be temporary during construction. The project will not generate significant
vehicle trips to the area. Vehicular and equipment exhaust emissions during project operations
will, thus, have a minor incremental/cumulative impact locally and regionally.
Particulate matter (dust) would be generated by excavation and the movement of construction
vehicles. It is not possible to accurately estimate the particulate concentration that might occur at
the site because it is dependent on meteorological conditions and soil moisture.
Mitigation:
1. Discourage idling of vehicles i.e. vehicle and equipment engines will be turned off when
not in direct use to reduce exhaust emissions.
2. Regular maintenance drilling plant and equipment

9
3. Engage sensitive drilling workers
4. Provide Personal protective Equipment such as nose masks to the workers on site
5. The contractor will water the site with exposed soil surfaces twice each day during dry
weather.
4.2 SOCIAL IMPACTS
4.2.1 Water supply
Safe, reliable and cheap water supply for domestic use by the proponent
4.2.2 Hazard
Hazards due to falls are not possible as the borehole diameter is 8” in length. Hazards due to
electric shocks are possible during pump installation.
Mitigation measures:
1. The management will ensure that electric wiring is checked and that shocks are prevented
at all costs
2. Underage children and unauthorized person will not be allowed near the borehole vicinity
as it will be cordoned off.
4.2.3 Contamination
Typically, groundwater is naturally clean and safe for consumption. Because the overlying soil acts
as a filter, groundwater is usually free of disease-causing microorganisms. However,
contamination may occur following improper installation of well casings or caps, after a break in
the casing or as a result of contaminated surface water entering the well. Contamination can also
occur if boreholes are drilled in fractured bedrock without an adequate layer of protective soil and
with less than the recommended minimum casing length.
Mitigation measures:
1. Sealing off of upper aquifer to avoid contamination caused by seepage from pit latrines and
septic tanks.
2. Construction of well head slab to avoid surface run-off in to the borehole.
3. Ensure proper installation of borehole casing avoiding breakages.
4.2.3.1 Testing Well Water for Microbiological Contamination
New boreholes should be disinfected by the borehole driller at the time of construction to eliminate
any microbiological contamination that may have occurred during drilling. This should be done
before collecting a sample for microbiological testing. Existing boreholes should be tested two or

10
three times a year. The best time to sample the borehole water is when the probability of
contamination is greatest. This is likely to be after an extended dry spell, following heavy rains or
after lengthy periods of non-use.
4.2.3.2 Borehole Maintenance
Proper siting, location, construction and maintenance of the borehole will help to minimize the
likelihood of contamination. The well cap should be checked regularly to ensure that it is securely
in place and watertight. Joints, cracks and connections in the borehole casing should be sealed.
Pumps and pipes should also be checked on a regular basis, and any changes in water quality
should be investigated.
4.2.4 Safety (worker exposure, safety impacts)
Hazards generally comparable to conventional drilling methods, with special provisions
anticipated for high noise levels and site-specific contamination issues.
Mitigation measures:
1. Worksite monitoring and personal protective equipment (PPE) required, as appropriate, for
mechanical, noise, and potential contaminant exposure hazards. Typically 3-5 people
operate drilling equipment.
2. Standard risks associated with the use of heavy equipment and hydraulics. Prevented by
establishment of authorized/limited-access exclusion zones to be maintained during setup
and drilling process.
3. Risk levels typical of those associated with any mobile, truck-mounted heavy equipment.
Encourage employees to concentrate on their duties to avoid occupational accidents.
Employees should also be encouraged to avoid negligence while on duty
4.2.5 Creation of employment especially during drilling
The government’s policy is clear on the priority it gives enterprises keen on creating employment
to the citizens. The drilling of the borehole will create employment during the drilling.
4.2.6 Promotion of secondary development
Secondary developments come as a result of the existence or creation of a development project in a
given area. In this particular case, the project may lead the proponent getting more water both for
domestic and commercial use. This will eventually contribute positively to the local communities.

11
5 CHAPTER FIVE: POTENTIAL NEGATIVE IMPACTS AND MITIGATION MEASURES
Table 5.1: Potential Negative Impacts and Mitigation Measures
Aspect Possible Impacts Details Mitigation measures
Number
1 Occupational Construction phase: The residents and Provide the necessary PPEs
health and safety workers may be exposed to dust and Switch of the machines when not in operation
noise Communicate and Display emergency signs
Avoid working at night
Create awareness on safety and health of the
contract employees
2 Injuries/accidents Workers or the residents may be Erect a perimeter wall to keep off unauthorized
to workers. injured by the materials or equipment persons in the site.
working on the site. Provide PPEs and ensure that they are always worn
while workers are on site
Ensure that only trained workers run the machines
Provide First Aid facilities.
3 Air pollution Air may be polluted during Ensure that the engines are well maintained
construction phase due to the engines Only operate them when needed.
doing the work and dust Water the ground before drilling
4 Noise There will be noise from the machines
used for construction. within working hours (8-5pm)

12
6 CHAPTER SIX: COMPLIANCE TO THE RELEVANT REGULATIONS AND REQUIREMENTS
The proponent is committed to compliance with the relevant law and regulations. This is demonstrated by:
1. Carrying out Environmental Impact Assessment before commencement of the project as required by Environmental
(Impact and Audit) regulations, 2003.
2. He has also put measures in place to control noise pollution by, for example, only operating between 0800hrs to 17hrs and
using well maintained equipment during drilling. This is a requirement by the Noise and Vibration Control Act.
3. Obtaining of a Permit from WRA.
4. Committed to adhere to all the measures recommended under potential negative impacts and the EMP.

7 CHAPTER SEVEN: CONCLUSION
Long-term ground-water-level data from individual boreholes provide the information needed
to monitor ground-water depletion locally. Periodic assessments of changes in ground-water
storage could be made by measuring more boreholes over larger areas at 5- to 10-year
intervals. Such changes could be documented for major aquifers and then compiled into
regional and national assessments.
In order to preserve and optimize the use of our critical ground-water resources, science can
provide the information necessary to make informed choices on issues that have long-term
environmental and ecological effects. For many boreholes in Kenya, the basic data needed for
such assessments are not available, and hence our knowledge of the water budget for them is
limited.
Water Resource Authority (WRA) is given the task of monitoring the groundwater
abstraction hence ensuring that boreholes are drilled sustainably for now and the future
generations. The proponent has made all the necessary applications with WRA and this EIA
report is one of the requirements by the WRA before drilling commences.
The lead expert considers that the development will have an insignificant impact on the
environment and is unlikely to have a substantial influence on underground water, since
mitigation measures will be strictly adhered to by all the parties involved. Furthermore, the
lead expert considers that the counteractive measures as outlined in this document presented
by the developer can preclude noise and atmospheric pollution from the development from
having any severe effect on the neighboring establishments. No major impact on the
geological conservation value of the site is involved. Thus the lead expert concludes that the
development will not have any considerable impact on landforms, landscape and built up
environment.
REFERENCES
1. Republic of Kenya (1998). Laws of Kenya: The Local Government Act, Cap 265.
Government Printer, Nairobi.
2. Republic of Kenya (1998). Laws of Kenya: The Science and technology Act, Cap 250.
Government Printer, Nairobi.

xiv | P a g e
3. Republic of Kenya (1999). The Environmental Management and Co-ordination Act,
No. 8 of 1999. Government Printer, Nairobi.
4. Republic of Kenya (1999). The Environmental Management and Co-ordination Act,
No. 8 of 1999. The Environmental (Impact Assessment and Audit) (Amendment)
Regulations, 2009. Government Printer, Nairobi.
5. Republic of Kenya (2003). Legislative Supplement No. 31, Legal Notice No. 101: The
Environmental (Impact Assessment and Audit) Regulations, 2003. Government
Printer, Nairobi.
6. Republic of Kenya (2007). Laws of Kenya: The Occupational, Safety and Health Act,
2007. Government Printer, Nairobi.
7. Republic of Kenya. Physical Planning Act, CAP 286. Government Printer, Nairobi
APPENDICES
1. Questionnaires of public participation.
2. Land Title: L.R. NO:
3. Copy of the identification card of the proponent.
4. Copy of Authorization from Water Resources Authority (WRA).
5. Copy of the certificate of the lead expert.

xv | P a g e
HYDROGEOLOGICAL ASSESSMENT REPORT FOR
HASS PETROLEUM
P.O. BOX,
.
LOCATION:
INDUSTRIAL AREA –EMBAKASI WEST SUB COUNTY
L.R. NO:
Report Compiled by:
(Hydrogeologist)
Report Reviewed by:
(Registered Hydrogeologist)
JANUARY, 2021

i | P a g e
SUMMARY
This Report discusses the results of a geophysical site survey for one borehole for HASS
PETROLEUM which is situated within Industrial area. The proposed borehole site is in
Makadara Sub-County in Nairobi County.
The Project area is situated in a zone with low to moderate groundwater potential. A
borehole is recommended to be drilled at VES 1 position to maximum depth of 250m or
until the hard confining layer is struck. This will ensure that the existing indicated aquifer is
fully penetrated.
The surrounding older boreholes have varying yields that range between 11.18 –
24.0m3/hr. The yield of a borehole drilled at the recommended location is expected to be
within the above range or more, but careful construction and development will lead to
maximum borehole productivity, efficiency and long life.
It is thus recommended that:
i. The borehole should be drilled at the selected position to maximum depth of 250
metres.
ii. The borehole be installed with mild steel casings and plasma-cut slotted casings.
iii. The borehole hydraulical properties and aquifer characteristics should be determined
during a 24-hour constant discharge test.
iv. Samples taken during test pumping must be submitted to a recognized laboratory for
full physical, chemical and bacteriological analyses.
v. A monitoring tube and master meter should be installed in the borehole to be able to
monitor the water level and water consumption respectively.
With careful implementation of the project by adhering to the study’s findings and
recommendations and by following the Water Resources Authority’s (WRA)
Guidelines: Nairobi Sub-Region (found in the Authorization letter to Drill the Borehole),
the project will safely meet the clients’ objectives successfully without any impact to
groundwater abstraction trends in the area and surrounding boreholes.
The construction summary for the optimized drilling site is summarized in the
immediate table below.-
Construction Summary
GPS Coordinates Recommended
Depth
Construction
Requirements
Expected Yield
(m3/h)
37M
0264109.143, 9856050.165
Elev: 1646.34m
250 203/153mm 11.18 – 24 m3/hr

ii | P a g e
ABBREVIATIONS AND GLOSSARY OF TERMS
ABBREVIATIONS
(S.I. Units throughout, unless indicated otherwise)
agl above ground level
amsl above mean sea
level bgl below ground level
E East
EC electrical conductivity (S/cm)
Hr. hour
L liter
M meter
N North
NEMA National Environment Management Authority
PWL pumped water level
Q discharge (m3/hr.)
s drawdown (m)
S South
SWL static water level
T transmissivity (m2/day)
VES Vertical Electrical Sounding
W West
WAB Water Apportionment Board
WRA Water Resources Authority
WSL water struck level
S/cm micro-Siemens per centimetre: Unit for electrical conductivity
°C degrees Celsius: Unit for temperature
" Inch

iii | P a g e
GLOSSARY OF TERMS
Aquifer A geological formation or structure, which stores and transmits
water and which is able to supply water to wells, boreholes or
springs.
Conductivity Transmissivity per unit length (m/day)
Confined aquifer A formation in which the groundwater is isolated from the
atmosphere by impermeable geologic formations. Confined water is
generally at greater pressure than atmospheric, and will therefore
rise above the struck level in a borehole.
Development In borehole engineering, this is the general term for procedures
applied to repair the damage done to the formation during drilling.
Often the borehole walls are partially clogged by an impermeable
“wall cake”, consisting of fine debris crushed during drilling,
and clays from the penetrated formations. Well development
removes these clayey cakes, and increases the porosity and
permeability of the materials around the intake portion of the well.
As a result, a higher sustainable yield can be achieved.
Fault A larger fracture surface along which appreciable displacement has
taken place.
Gradient The rate of change in total head per unit of distance, which causes
flow in the direction of the lowest >head.
Hydraulic head Energy contained in a water mass, produced by elevation, pressure or
velocity.
Hydrogeological Those factors that deal with subsurface waters and related
geological aspects of surface waters.
Infiltration Process of water entering the soil through the ground surface.
Joint Fractures along which no significant displacement has taken place.
Percolation Process of water seeping through the unsaturated zone, generally
from a surface source to the saturated zone.
Old Land Surface Old Land Surface (OLS) is the term given to an ancient erosion
surface now covered by younger surface material. In hydrogeology,
OLS's frequently make good aquifers, especially where the erosion
debris left behind is coarse in nature. OLS's are a frequent
occurrence in the Nairobi Volcanic Suite.
Perched aquifer Unconfined groundwater separated from an underlying main
aquifer by an unsaturated zone. Downward percolation hindered by
an impermeable layer.
Permeability The capacity of a porous medium for transmitting fluid.
Piezometric level An imaginary water table, representing the total head in a

iv | P a g e
confined aquifer, and is defined by the level to which water would
rise in a well.
Porosity The portion of bulk volume in a rock or sediment that is occupied by
openings, whether isolated or connected.
Pyroclastic rocks Group of rocks consisting of volcanic dust, ashes, lapilli and
coarse lumps of lava (volcanic bombs), explosively thrown up in
molten condition, and deposited by gravity. Hardened masses of
dust, ashes and lapilli are known as tuff, while coarse, consolidated
pyroclastic debris is referred to as agglomerate.
Pumping test A test that is conducted to determine aquifer and/or well
characteristics.
Recharge General term applied to the passage of water from surface or
subsurface sources (e.g. rivers, rainfall, lateral groundwater flow) to
the aquifer zones.
Specific capacity The rate of discharge from a well per unit drawdown.
Static water level The level of water in a well that is not being affected by pumping.
(Also known as "rest water level")
Transmissivity A measure for the capacity of an aquifer to conduct water through its
saturated thickness (m2/day).
Unconfined Referring to an aquifer situation whereby the water table is exposed
to the atmosphere through openings in the overlying materials (as
opposed to >confined conditions).
Yield Volume of water discharged from a well.

1 NAME AND DETAILS OF APPLICANT
The Client (HASS PETROLEUM) as the proprietor of the land under investigation,
commissioned the present consultant to carry out a hydrogeological and geophysical
survey within a parcel of land belonging to them located in Makadara Sub County: Nairobi
County.
The hydrogeological survey was envisaged to determine the best location for drilling the
proposed borehole to supply water for minor industrial purposes within the piece of land.
The Clients’ contact details are as follows:
HASS PETROLEUM
P.O. BOX,
NAIROBI.
Figure 1.1: General view of the project area
The project area is not connected to any public water supply system. The clients depend on
rain water. For economic utilisation of this farm, a reliable water source is needed.
Currently, the clients have a moderate supply from the water vendors for minor industrial
use. The water shortages have driven the clients to contemplate of drilling a borehole to
augment the current untenable water source for better planning within the premise.
It is against this background that a detailed hydrogeological survey was envisaged to
determine groundwater potential within the plot and the possibility of sinking the
proposed borehole.
The hydrogeological assessment report gives the details of drilling depth, water quality
and estimated yields with relation to the existing older boreholes within the area. It also

ii
assists in registration of the borehole with the Water Resources Authority of the Ministry
(WRA) of Water and Irrigation.
Based on the recommendations of the report, the contractor can project cost estimates for
the drilling and construction works.
2 BACKGROUND INFORMATION
The investigated plot is located about 500m off Lunga Lunga Road. The proposed
borehole site is within the 1:50,000 Topographic Sheet 148/4: Nairobi, on Zone 37M,
0264109.143 and UTM 9856050.165 at an elevation of about 1646.3 metres above sea
level.
Figure 2.1: Satellite extract showing the proposed borehole location (Adapted from Google maps)
2.1 Climate
Precipitation 2.1.1
The climate of the project area is of the semi humid, cool temperate, tropical lower
highland type. The average annual rainfall figure for the area is approximately 1100
mm. i.e. slightly wetter than the southern and south eastern parts of Nairobi
(Sombroek, 1982). The rainfall pattern exhibits a bi modal distribution, with wet
seasons in March May and October December, corresponding to the "long" and
"short" rains, respectively and between 70 and 85% of precipitation falls during these
rainy seasons.

iii
Temperature 2.1.2
Average annual temperatures range from 16 to 18o
C, with average minima and
maxima of 10-12 and 22-24o
C, respectively. The warmest period occurs from January
to March. Average potential evaporation is between 1,450 and 2,200 mm per year.
Figure 2.2: Nairobi annual climate data (Adapted from Climatedata.org)
2.2 Physiography
The site lies at an altitude of about 1646.34m above mean sea level. The ground surface
at the site is gently sloping. The project area has good drainage conditions. The
drainage pattern in the locality is generally towards the North East characterized by
River Nairobi.
2.3 Water Demand
Water from the proposed borehole will be used for minor industrial purposes through a
properly laid pipping system within the area covered by the farm. Water requirement is
estimated to be about 35m³/day. It lies within the 1:50,000 Survey of Kenya topographic
sheet for Nairobi (No. 148/4).

iv
Figure 2.3: Scaled satellite Extract showing the specific location (Adapted from
google earth)
3 TERMS OF REFERENCE
Under the specific Terms of reference, The Client (HASS PETROLEUM) commissioned
the project consultant to undertake Hydro-geological assessments/ Borehole site
investigations aimed at developing one production borehole at a plot in Industrial area,
Makadara Sub County: Nairobi County.
The Consultants were thus commissioned by the clients to carry out the subject survey
of the project site and subsequently present a hydro-geological report under the
following Terms of Reference:
i) Carry out a reconnaissance survey at the project site and generate a datum
reference for the borehole site investigations; to conform to the WRA
requirements.
ii) Integrate reconnaissance survey data with Geophysical borehole data
obtained in the conduct of the surveys to define the recharge/discharge
boundaries for the project site. I.e. calibrate the exploration data against
known geological settings.
iii) Undertake comprehensive assessments of the existing borehole facilities
located in the neighbouring areas with a view to quantify their inherent
potential; and in addition use such data to define the operational aquifer
parameters.
iv) Compile all the additional available hydro-geological, geological,
geophysical, hydrological data for the project area.
v) Compute the hydraulic parameters of the aquifers in the general Industrial
area, the general Aquifer Transmissivities and the specific capacity of the
operational aquifer data.

v
vi) Analyse the above data in order to fully quantify the groundwater potential;
and subsequently provide a comprehensive report on the groundwater
exploration program.
vii) Optimize the drilling depth, and in addition re-evaluate the likely aquifer
performance in the proposed water supply borehole.
To achieve the specified Terms of Reference, the Consultant aimed at establishing and
optimizing the base line conditions of the groundwater flow patterns, using the following
conceptual approach.
3.1 Concept on the Anticipated Approach
The approach to this study is expected to apply the standard methods applied in the
determination of aquifer parameters in order to establish the baseline conditions in
aquifers underlying the project area.
Once these baseline conditions are established, the effects of both abstraction to adjacent
boreholes and the general impact on the regional and the localized effects on the aquifer
system can be evaluated.
3.2 Concept: - Anticipated Methodology
A review on the existing data and collating it with the field data will be encompassed in
this study.
The recommendations of the drilling procedure will lay emphasis on the construction
methodologies that will allow for the development and design of a highly efficient
system to meet the clients’ requirements.
To achieve these objectives, the Consultant proposes to undertake a detailed desk study
of the database inventory for boreholes located in the immediate vicinity of the project
site, for the purposes of statistical evaluation of the down-hole borehole data, and also to
define the general aquifer parameters and characteristics.
The results of the project findings need to be consolidated in this survey report in total
conformity to the WRA requirements.
The current study lays emphasis on the clients’ specific water requirements and is
geared towards development of a high capacity borehole system with an estimated
design flow of about 11.18 – 24.0m3/hr.

vi
4 GEOLOGICAL DETAILS
4.1 Regional Geology
The geology of Nairobi Area and its environs is comprehensively described in Saggerson
(1991). In the study area, the surface rocks comprise Tertiary volcanic rocks and some
Quaternary alluvium, clays and swamp soil. The intense tectonic activity associated
with the formation of the Great Rift Valley led to a series of widespread eruptions and
lava flows, which occurred from Mid-Miocene to Upper Pleistocene times. Subsequently
volcanicity continued intermittently until Recent time, the area being covered by lavas
and pyroclastics from fissure eruptions. The thick volcanic sheet is underlain at great
depths (probably more than 700 m) by metamorphic Basement Rocks (gneisses and
schists) of the Mozambican System. The crystalline rocks are rarely exposed but
occasionally fragments are found in agglomerates derived from the former Ngong
volcano.
A short description of the different geologic units is given below in order of geological
age (oldest rocks first).
Deep Seated Geology 4.1.1
4.1.1.1 Nairobi Phonolites
A dark Grey, porphyritic lava containing both feldspar and biotite insets, the Nairobi
Phonolites occurs as a number of distinct flows with phonolitic sands intercalated
between the various lava units. Such sands make good potential aquifers, given
adequate recharge conditions. Within the Karen area, the Nairobi Phonolites are
encountered overlying the Mbagathi Trachytes. Due to over-abstraction, the potentially
fair aquifers within the Nairobi Phonolites have gradually become less reliable.

vii
4.1.1.2 Nairobi Trachytes
This trachytic lava is a greenish-grey, occasionally porphyritic rock, with feldspar
phenocrysts in a fine-grained groundmass. Lamination and banding which are common
in the Nairobi Trachytes are due to flow-patterns and pressures, as well as differences
in viscosity.
In the Ongata Rongai area, shallow aquifers occur within the intercalated layers of
sands and associated material separating the various flows of the Nairobi Trachytes and
at the boundary between this formation and the underlying Mbagathi Phonolitic
Trachytes. These sediments are absent from the formation further to the east.
4.1.1.3 Kerichwa Valley Tuffs
The Kerichwa Valley Tuffs are well exposed in the Kerichwa stream that flowsthrough
Nairobi (Gregory, 1921p 164) and were designated by Shackleton (1945,table opp p 6)
to include a group of trachytic tuffs and agglomerates in the Nairobi area younger than
the Nairobi Trachyte. The pumice-rich formation is widespread and, from descriptions
in other geological reports, it is probable that the rocks extend as far north as Nyeri and
Nanyuki.
These ash and pumice flows termed froth flows by McCall (1964),occupy a considerable
volume and appear to be the result of explosive eruption over a short interval of time.
They cannot be traced to any volcanic vents however and it is probable that they are the
result of rapid pressure release along fissures following, Rift faulting and graben-
forming collapse. The tuffs are in turn affected by the later period of grid faulting.
Throughout the Nairobi County, the formation can be subdivided into three main
members that are recognised by their colour, texture, jointing, degree of welding and
distribution: These are Lower, Middle and Upper Tuffs.
Surficial Geology 4.1.2
4.1.2.1 Superficial Deposits
Superficial deposits of recent age include alluvia and conglomerates exposed in the
principal river courses. There are also black swamp soils and clays. The soils of the
Nairobi area are products of weathering of mainly volcanic rocks under relatively high
temperature, rainfall and good drainage.

viii
Figure 4.1: Geological map showing the proposed project area

ix
5 HYDROGEOLOGICAL DETAILS
5.1 Background
The hydrogeology of an area is determined by the nature of the parent rock, structural
features, weathering processes and precipitation patterns. Within volcanic rocks,
groundwater primarily occurs within fissure zones, fractures, sedimentary beds,
lithological contacts and Old Land Surfaces (OLS) which characterize periods of
erosion between volcanic eruptions and subsequent lava flows are potential aquifers.
These OLS's comprise soils, weathered rocks and water-lain erosional material of
volcanic origin. Lava flows rarely possess significant pores pace; instead, their porosity
is largely determined by secondary features, such as cracks. However, pyroclastic
deposits and especially sediments do have a primary porosity: the cavities between the
mineral grains or clasts are usually open and interconnected. Consequently, they can
contain and transmit water.
5.2 Hydrogeology of the Project Area
Within the phonolite lavas, weathered OLS, pyroclastic layers and bedding planes are
often water bearing. However, in most cases such aquifers are only a few metres thick,
and individual water bearing zones rarely produce yields in excess of 1-2 m3/hr.
Consequently, it may require several water strikes to obtain a reasonable yield. Higher
yields (say >5 m3/hr) can be achieved from boreholes located in "open" faults and
fissure zones
Although faults are often associated with water bearing zones, it should be noted that
they may also act as impermeable barrier zones ("closed faults"). In this case the
structure acts as a "groundwater dam" and significant storage may build up on its
upstream side. Drilling inside such a closed fault system, however, would in most cases
be futile.
Combined with the high transmissivity of the old land services intercalated with various
lava flows, a sustainable combined groundwater abstraction is plausible.
Groundwater of the project area thus occurs in:
a) Fault zones and fractured zones: These form good aquifers in
otherwise impermeable lava flows and other rock material.
b) Contact zones between lava flows. These aquifers are manly
confined.
c) Old land surface (OLS) layers sometimes consisting of gravels and
sands. These forms very good aquifer as the lateral extends of
these OLS materials is vast.
5.3 Existing boreholes
Some boreholes have been drilled in the project area. Available records were studied for
6 boreholes within a radius of about 1.5 km from the present site. Results of the data

x
inventory are presented in Table 5.1 while the approximate location of the boreholes
has been indicated in Figure 5.1.
Table 5.1: Boreholes in the Vicinity of the Site
BH C NO. OWNER Bearing TD WSL WRL Q PWL
Ref: HASS PETROLEUM’S Site
14951 MOMBASA MAIZE
MILLERS
1km/NNE 240 150, 200 128 12 129.56
21217 IBER AFRICA 0.5km/NE 295 150, 14 137.67 22.153 139.99
21260 AFRICA MERCHANT
ASSURANCE
1.7km/NW 220 175, 192 139.32 11.45 159.60
21465 ADIX PLASTICS LTD. 0.8km/SW 260 190,200,215 132.26 11.2 150.79
20207 PANKAS NATHANI
AND OTHEERS
1.5km/SW 245 150,200,217 136.1 11.18 139.05
19651 GREENSPAN
INVESTMENT LTD
1.7km/NE 220 105,159,205 95.25 24.0 103.26
Range 220 –
295
105 - 217 95.25 –
139.32
11.18 –
24.0
103.26 –
159.60
Key to figure 5.1:
TD = Total Borehole Depth
WSL = Water Struck Level
WRL = Water Rest Level
Q = Total Yield
PWL = Pumping Water Level

xi
Figure 5.1: Topographic Map extract showing the proposed Borehole site and the
surrounding boreholes (Topo sheet 148/4: Nairobi)
Borehole Data Analyses and Aquifer Outline of the Area 5.3.1
The available data indicates that various water struck levels occur within drilled depth
ranging between 105 - 217m below ground level.
Groundwater of the project area thus occurs in:
a. Contact zones between lava flows. These aquifers are manly confined.
b. Old land surface (OLS) layers sometimes consisting of gravels and sands.
These forms very good aquifer as the lateral extend of these OLS
materials is vast.
c. Fault zones and fractured zones: These form good aquifers in otherwise
impermeable lava flows and other rock material
The boreholes in this area have variable yields ranging between 11.18 – 24.0m3/hour. The
proposed borehole is expected to give reasonably high yields as long as deeper drilling depth,
sound drilling; borehole designing, construction and completion works are employed.

xii
Impacts to Abstraction Trends and Analyses of Boreholes within 800-m from the 5.3.2
Proposed Site
There are two boreholes within 800m radius. All aquifers encountered from ground
level down to a penetration depth of about 90m should be sealed off with plain casings
and bentonite cement to avoid any possible further depletion of these shallow
groundwater resources and in turn avoid any impact to any surrounding boreholes
abstracting water from this vulnerable level.
Thus there is no any foreseen interference with the existing boreholes or the
groundwater abstraction trends. The boreholes have good yields which is an indication
of underlying productive aquifers.
5.4 Recharge
The recharge mechanisms (and the rate of replenishment) of the local aquifers has not
been fully established. The two major processes are probably direct recharge at surface
(not necessarily local) and indirect recharge via faults and/or other aquifers.
Direct recharge is obtained through downward percolation of rainfall or river water
into aquifer. If the infiltration rate is low due to the presence of an aquiclude (such as
clay), the recharge to the aquifer is low. Percolation will depend on the soil structure,
vegetation cover and the state of erosion of the parent rock. Rocks weathering to clayey
soils naturally inhibit infiltration and downward percolation. Aquifers may also be
recharged laterally if the rock is permeable over a wide area.
Mean Annual Recharge 5.4.1
Although rainfall within the study area is low, regional recharge is of great essence in this area.
Much of regional recharge occurs within the eastern flanks of the rift valley followed by base
flow within the thick volcanic sheets and faults which characterise the region. However, this
recharge mechanism is mainly important for the replenishment of (regional) volcanic aquifers
and is what has been used to estimate the Mean Annul Recharge.
At the present location, water also percolates directly into the faults, fractures, local rivers and
streams (via fractures) thus deeper and adjacent units are recharged over time.
Mean Annual Recharge has therefore been estimated as follows:
The Recharge is estimated as 5% of the Mean Annual Rainfall of the recharge area
1100mm x 5%
Mean Annual Recharge = 55mm
However, this recharge amount is probably estimation due to the possibility of influent
local recharge through local rivers and rainwater percolation through faults into the
weathered/fractured volcanic rocks and overlaying OLS.

xiii
5.5 Discharge
Discharge from aquifers is either through natural processes as base-flow to streams and
springs, or artificial discharge through human activities. However considering the few
number of boreholes in the area this is form of discharge is not much pronounced.
The total effective discharge from the aquifers via either of the above means is not known,
and should in fact be studied. The main form of discharge is through flow along
formations and faults/ interconnected fractures.
5.6 Aquifer Properties
Estimation Aquifer Transmissivity 5.6.1
Thus, in absence of proper pump test data, the Logan method of approximation has
been employed (Logan, 1965). This method however has errors of 50% or more and is
thus used for estimation purpose only. The derivation of the aquifer properties is as
follows:
Aquifer Transmissivity (T) is thus estimated as follows:
T=1.22Q/∆S Where: Q = Yield per day
∆S = Draw down
T = = m2/day
Hydraulic Conductivity 5.6.2
The Hydraulic Conductivity (K) is estimated as follows:
K = T/Aquifer Thickness
Based on the geological logs of the boreholes in the area, the cumulative aquifer
thickness for the purpose of this calculation has been estimated at Xm. Thus,
K = m/X
K = m/day
Specific Capacity 5.6.3
The aquifer Specific Capacity (S) = Q/s.
Where: Q = Discharge (m3/day) = m
3/day
D = Drawdown (m).
S= m2/day

xiv
Groundwater Flux 5.6.4
The Groundwater Flux (F) is estimated based on boreholes which more or less share the
same aquifers. F = K.i.h.w Where K- Hydraulic Conductivity
i - Slope
h- Aquifer Thickness
w- Arbitrary distance
5.7 Water Quality
The water quality of the aquifers around the area is expected to be drawn from deeper
fracture systems. These aquifers are adequately recharged from the surface thus the
chemical characteristics of groundwater that is relatively young and potable is expected.
The water is likely to be a little mineralized and hard, but not brackish. Seasonal
changes may however occur, whereby an increase in salinity is experienced during the
dry season. Due to the nature of the surrounding Basement rocks, high levels of calcium
are envisaged, which may lead to encrustation of pipeworks. It is therefore
recommended to use uPVC casings and screens inside the borehole, and galvanized steel
mains (high quality – Class C) and collector pipes.W.H.O. and EC guideline
concentrations are included for reference in the appendix section.
5.8 Impacts of the Proposed Activity to Water Quality, Wetlands
The Proposed drill site and related works are expected to pose no impact on water
quality, either Surface or groundwater resources. There is no any surface water body
near the drill site that can be contaminated by waste waters generated during drilling.
The entire drilling, borehole construction, pump tests, and completion works will be
done under supervision to professional standards. Entry of any foreign material until
completion will be avoided to avoid any entry of foreign material into the borehole and
only inert materials will be used in construction. The borehole will be properly
developed to open up the aquifers and clean the borehole water. Monitoring of ec
during drilling will be done to detect and seal any aquifer with elevated mineralization.
The site is not located within a wetland and has no negative impacts on biodiversity.

xv
6 GEOPHYSICAL INVESTIGATION METHODS
A great variety of geophysical methods are available to assist in the assessment of
geological subsurface conditions. In the present survey resistivity (also known as the
geo-electrical method) has been used.
1.1 Resistivity Method
Vertical electrical soundings (VES) were carried out to probe the condition of the sub-
surface and to confirm the existence of deep groundwater. The VES investigates the
resistivity layering below the site of measurement. This technique is described below.
1.2 Basic Principles
The electrical properties of rocks in the upper part of the earth's crust are dependent upon
the lithology, porosity, and the degree of pore space saturation and the salinity of the pore
water. Saturated rocks have lower resistivity than unsaturated and dry rocks. The higher
the porosity of the saturated rock the lower its resistivity, and the higher the salinity of the
saturating fluids, the lower the resistivity. The presence of clays and conductive minerals
also reduces the resistivity of the rock.
The resistivity of earth materials can be studied by measuring the electrical potential
distribution produced at the earth's surface by an electric current that is passed through
the earth.
The resistance R of a certain material is directly proportional to its length L and
cross-sectional area A, expressed as:
R = Rs * L/A (Ohm) (1)
Where: Rs is known as the specific resistivity, characteristic of the material and
independent of its shape or size. With Ohm's Law,
R = dV/I (Ohm) (2)
Where: dV is the potential difference across the resistor and I is the electric current
through the resistor, the specific resistivity may be determined by:
Rs = (A/L) * (dV/I) (Ohm-m) (3)
1.3 Vertical Electrical Soundings (VES)
When carrying out a resistivity sounding, current is led into the ground by means of two
electrodes. With two other electrodes, situated near the Centre of the array, the potential
field generated by the current is measured. From the observations of the current strength

xvi
and the potential difference, and taking into account the electrode separations, the ground
resistivity can be determined.
While carrying out the resistivity sounding the separation between the electrodes is step-
wise increased (in what is known as a Schlumberger Array), thus causing the flow of
current to penetrate greater depths. When plotting the observed resistivity values against
depth on double logarithmic paper, a resistivity graph is formed, which depicts the
variation of resistivity with depth.
This graph can be interpreted with the aid of a computer, and the actual resistivity
layering of the subsoil is obtained. The depths and resistivity values provide the
hydrogeologist with information on the geological layering and thus the occurrence of
groundwater.
Figure 6.1: Examples of Schlumberger and Wenner Configurations for Resistivity
Measurements, where: AB = current electrodes; MN = potential electrodes
A series of measurements made with an expanding array of current electrodes
(Schlumberger Array) allows the flow of current to penetrate progressively greater depths.
The apparent resistivity as a function of the electrode separation AB provides
information on the vertical variation in resistivity. The depth of penetration varies
according to the electrode array, but is also affected by the nature of the material beneath
the array. The point at which a change in earth layering is observed depends on the
resistivity contrast, but is generally of the order of a quarter of the current electrode
spacing AB (Milsom 1989). By contrast, in a homogeneous medium the depth penetration
is of the order 0.12 AB (Roy & Apparao, 1971).
The calculated apparent resistivity is plotted against current electrode half separation on a
bi-logarithmic graph paper to constitute the so-called sounding curve. The curve depicts a
layered earth model composed of individual layers of specific thickness and resistivity.
Interpretation of field data can be done with hand-fitted curves, but this method is time
consuming, and practically limited to 3-layer solutions. Modern interpretation is
computer-aided, using a curve fitting procedure based on a mathematical convolution
method developed by Ghosh (1971).

xvii
While the resistivity method is a useful tool in groundwater investigations and
borehole site surveys, its applicability and reliability should not be overestimated. The
modelling of field data is often attended by problems of equivalence and suppression. Each
curve has an infinite number of possible solutions with different layer resistivity’s and
depths (this is known as equivalence).
Mathematical convolution can easily lead to a well-fitting solution, which nonetheless does
not correspond to reality. In general, the number of possible solutions is reduced by
mutual correlation of several sounding curves, knowledge of the local geology and drilling
data. When deposits with similar resistivities border each other, it is usually not possible to
make a differentiation. Intermediate layers, occurring between deposits of contrasting
conductivity, may go undetected, as they tend to be obscured within the rising or falling
limb of the sounding graph (suppression). Additional data, in the form of borehole
records, air photography and geological field observations, are required to produce a
realistic interpretation.
It should be noted that the layered earth model is very much a simplification of the many
different layers, which may be present. The various equivalent solutions, which can be
generated by a computer programme, should therefore be carefully analyzed. In general,
resistivity soundings should never be interpreted in isolation as this may lead to erroneous
results.
1.4 Geo-electrical Layer Response
Vertical electrical soundings (VES) provide quantitative information on electrical
resistivity as a function of depth. The computer-interpretation of the sounding data
produces a layered model of the underground. The derived resistivity layers are used to
infer the presence of water-bearing strata, their texture and salinity.
Water-bearing and/or weathered rocks have lower resistivities than unsaturated (dry)
and/or fresh rocks. The higher the porosity of the saturated rock, the lower its resistivity,
and the higher the salinity (or electrical conductivity EC) of the saturating fluids, the
lower the resistivity. In the presence of clays and conductive minerals the resistivity of
the rock is also reduced. The relation between the formation resistivity (ρ) and the salinity
is given by the “Formation Factor” (F):
ρ = F x ρ w = F x 10,000 / EC (μ S/cm), where: ρ w = resistivity of water In sediments or
unconsolidated layers produced by weathering, the formation factor varies between 1
(for sandy clays) and 7 (for coarse sands).
Example: If a certain aquifer is considered with an average formation factor of 3, then an
EC of 300 μ S/cm will give a formation resistivity of 100 μ m. The same material, when
containing water with an EC of 1,500 μ S/cm, will have a resistivity of only 20 ρ m.
Brackish water is marked by an EC of 2,000 to 10,000 μ S/cm, and a ρ w of 5 to 1.
Deposits containing brackish water will therefore in most cases adopt a low formation
resistivity (usually less than 10 μ m). Saline water with an EC of about 30,000 μ S/cm will
reduce the resistivity of a formation to about 2 Ohms.

xviii
Clayey formations with fresh water will respond similarly to deposits with brackish or
saline water: the fact that the same resistivity can be obtained for completely different
hydrogeological units is known as the “equivalence-problem”. Fresh and dry Basement
rocks are marked by very high resistivities, with a common range from 1,000 to 10,000
Ohms. Moderately to slightly weathered but dry layers are less resistive, and usually show
values between 100 and 500 Ohms, depending on the portion of clays, the degree of
weathering and the water content. The resistivity further decreases if the deposits are
water-bearing, to 20 to 200 μ m. The resistivity of impermeable clay layers (alluvial, or
produced by intensive weathering of clay-forming minerals) usually varies between 2
and 10Ohmm, while similar figures are recorded for aquifers with brackish to saline
water.
The greatest difficulty in the interpretation of resistivity measurements in Basement rocks
is formed by:
a) Equivalence: the similar geophysical properties of layers with contrasting Hydrogeological
characteristics (e.g. clay layers and layers with brackish water).
b) Absence of distinct layer boundaries: the decreasing degree of weathering with depth is usually
not well-defined, but gradual. This will result in a gradual increase in resistivity, and not in a
distinct set of geophysical layers.
c) Suppression #1: Potential aquifer layers of moderate thickness may fail to show a significant
response in the recorded resistivity data (especially where these are deep). Thin aquifers
embedded within a very thick deposit can easily remain undetected by surface geophysics.
They will however show up in down-hole geophysical logs.
d) Suppression #2: The resistivity contrast between the (clayey) weathered zone and the fresh
bedrock may be so high, that an intermediate saprock aquifer cannot be distinguished in the
graphic plot of the sounding.
Despite the problems of suppression attributed to the large resistivity contrast between
fresh and weathered basement (point d), this is also a favorable attribute. Because of the
large difference, the depth of weathering can be measured quite accurately. Considering
that aquifers often occur towards the boundary of the weathered zone and the bedrock,
the drilling depth can be determined, even if the actual aquifer does not show up as
distinct geophysical layer.

xix
7 FIELDWORK AND RESULTS
Field work was carried out on the 15th
of January, 2021. A proper VES was carried out
then analysis done. The aim of the VES was to determine the prevailing hydro-
stratigraphy, weathered zones, Fracture zones and any fault line at the selected area.
7.1 Results
VES 1 Results 7.1.1
Figure 7.1: VES I Sounding Curve, Geoelectrical model (Modelled in Gewin)
Main Aquifer Minor
Aquifer
xx
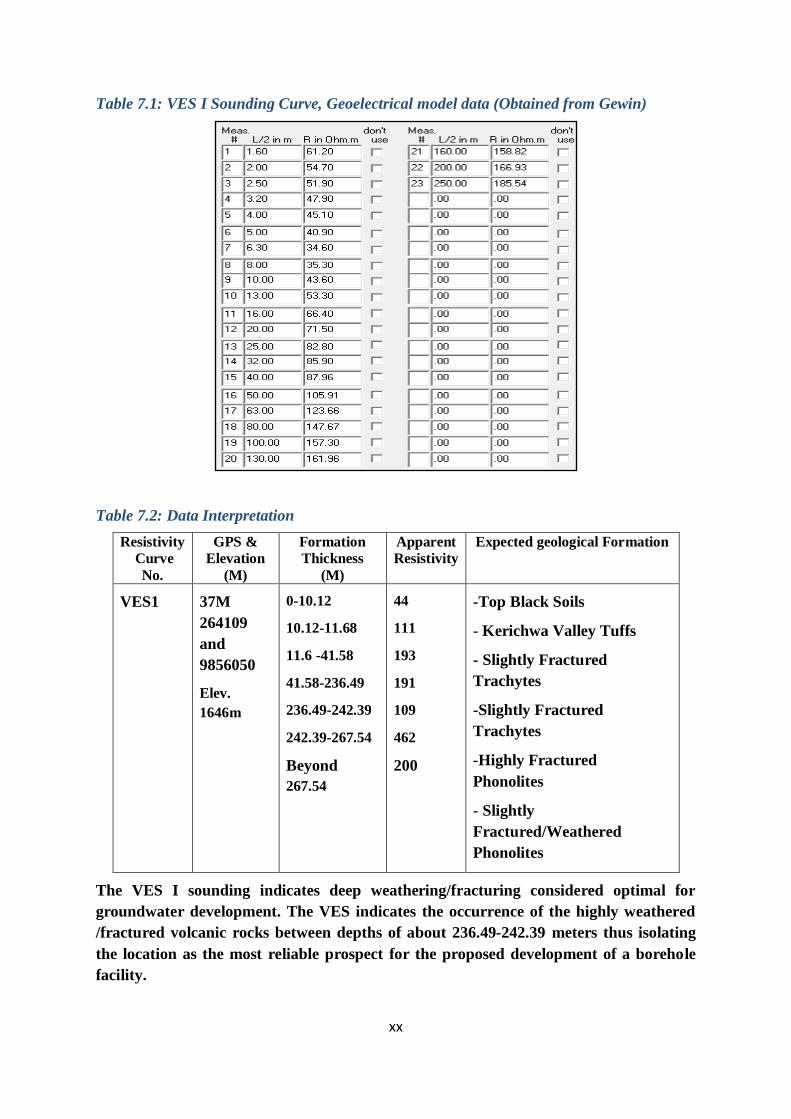
Table 7.1: VES I Sounding Curve, Geoelectrical model data (Obtained from Gewin)
Table 7.2: Data Interpretation
Resistivity
Curve
No.
GPS &
Elevation
(M)
Formation
Thickness
(M)
Apparent
Resistivity
Expected geological Formation
VES1 37M
264109
and
9856050
Elev.
1646m
0-10.12
10.12-11.68
11.6 -41.58
41.58-236.49
236.49-242.39
242.39-267.54
Beyond
267.54
44
111
193
191
109
462
200
-Top Black Soils
- Kerichwa Valley Tuffs
- Slightly Fractured
Trachytes
-Slightly Fractured
Trachytes
-Highly Fractured
Phonolites
- Slightly
Fractured/Weathered
Phonolites
The VES I sounding indicates deep weathering/fracturing considered optimal for
groundwater development. The VES indicates the occurrence of the highly weathered
/fractured volcanic rocks between depths of about 236.49-242.39 meters thus isolating
the location as the most reliable prospect for the proposed development of a borehole
facility.

xxi
Drilling is recommended at VES 1 Position to an ideal depth of about 250m or until enough
water has been struck.
7.2 Site Identification
The study thus recommends that the borehole be drilled at VES 1, to a depth of about 250
m. This site is well marked and well pegged on the ground at GPS 37M, 0264109 and UTM
9856050 and known to the clients and their representative.
Figure 7.2: Image showing the selected site location
8 CONCLUSIONS AND RECOMMENDATIONS
On the basis of all the information gathered in the field, geological and hydrogeological
evidence, it is concluded that the hydrogeological conditions and prospects for
groundwater are high and deeper aquifer levels. A borehole is recommended to be drilled
at the site of VES 1 to a depth of about 250 m below ground level. This will ensure that the
envisaged entire aquifer zone will be fully penetrated.
Boreholes drilled within the neighbourhood of the investigated area are quite productive and
have recorded yields ranging from 11.18 – 24.0m3/hr and the main aquifer is stable during
prolonged pumping. The yield of a borehole drilled at the plot is expected to be within the above
range, but careful construction and development will lead to maximum borehole productivity,
efficiency and long life.
The aquifer zones occur at:
o Fault zones and fractured zones: These form good aquifers in otherwise
impermeable lava flows and other rock material

xxii
o Old land surface (OLS) layers sometimes consisting of gravels and sands.
These forms very good aquifer as the lateral extent of these OLS
materials is vast.
o Contact zones between lava flows. These aquifers are manly confined.
It is thus recommended that:
The borehole should be drilled at VES I position at a minimum of 8
inch diameter and to a depth of about 250m. This will ensure that
the deeper aquifers will be fully penetrated.
To install the borehole with mild steel casings and gas-slotted
screens
The borehole hydraulic properties and aquifer characteristics
should be determined during a 24-hour constant discharge test.
Samples taken during test pumping must be submitted to a
recognized laboratory for full physical, chemical and
bacteriological analyses.
A monitoring tube and master meter should be installed in the
borehole to be able to monitor the water level and water
consumption respectively.
With careful implementation of the project by adhering to the study’s findings and
recommendations and by following the Water Resources Authority’s Guidelines (found
in the Authorization letter to Drill the Borehole), the project will safely meet the clients’
objectives successfully without any impact to groundwater abstraction trends in the
area and surrounding boreholes.
REFERENCES
Gevaerts E A L, (April 1970). Hydrogeology of the Nairobi Area (2nd ed.), Water
Development Division, Ministry of Agriculture.
Government of Kenya, (1975). Sheet 148/4 `Nairobi', 1: 50,000 Scale, Series Y731
(D.O.S. 423), Edition 8-D.O.S. 1975, Survey of Kenya.
Saggerson E P, (1991). Geological Map of the Nairobi Area, Scale 1: 125,000, Geological
Survey of Kenya.
Sombroek W.G; Braun H.M.H; and van der Pouw B.J.A, (1982). Exploratory Soil Map and
Agroclimatic Zone map of Kenya, 1980, Kenya Soil Survey.

xxiii
APPENDICES
APPENDIX I: Acceptable Ionic Concentration - Various Authorities
World Health Organization: European Community: 1983 1971 Int. EC Directive 1980 relating to the quality Guidelines; Standards; of water intended for human consumption: __ Substance or Guideline Upper limit Guide Level Max. Admissible Characteristic Value (GV) (HL), (tentative) (GL) Concentration (MAC) ______ Inorganic Constituents of health significance; Antimony Sb 0.01 Arsenic As 0.05 0.05 0.05 Cadmium Cd 0.005 0.01 0.005 Chromium Cr 0.05 0.05 Cyanide CN 0.10 0.05 0.05 Fluoride F 1.5 1.7 1.5 Lead Pb 0.05 0.10 0.05 Mercury Hg 0.001 0.001 0.001 Nickel Ni 0.05 Nitrates 10 (as N) 45 (as N03) 25 (as NO3) 50 (as NO3) Selenium Se 0.01 0.01 ____________________________________________________________________________________ Other Substances GV: Highest Maximum GV: MAC: Desirable Permissible Level: Level:

xxiv
Aluminium Al 0.20 0.05 0.20 Ammonium NH4 0.05 0.50 Barium Ba 0.10 Boron B 1.0 Calcium Ca 75 50 100 Chloride Cl 250 200 600 25 Copper Cu 0.05 0.10 Hydrogen Sulphide H2S ND ND Iron Fe 0.30 0.10 1.0 0.05 0.20 Magnesium Mg 0.10 30 150 30 50 Manganese Mn 0.10 0.05 0.50 0.02 0.05 Nitrite NO2 0.10 Potassium K 10 12 Silver Ag 0.01 Sodium Na 200 20 175 Sulphate SO4 400 200 400 25 250 Zinc Zn 5.0 15 0.10 Total Dissolved Solids 1000 500 1500 1500 Total Hardness as CaCO3 500 100 500
Colour oHazen 15 5 50 1 20 Odour Inoffensive Unobjectionable 2 or 3 TON Taste Inoffensive Unobjectionable 2 or 3 TON Turbidity (JTU) 5 5 25 0.4 4 pH 6.5 - 8.5 7.0 - 8.5 6.5 - 9.2 6.5 - 8.5 9.5 (max.)
Temperature oC 12 25 EC uS/cm 400 Notes ND - Not Detectable IO - Inoffensive GL - Guide Level UO - Unobjectionable ____________________________________________________________________________________ (Based on Table 6.1, in Twort, Law & Crowley, 1985 - Water Supply, Edward Anorld, London).
APPENDIX II: DRILLING CONSIDERATIONS
Introduction
Boreholes may be drilled with either percussion (cable-tool) or rotary plant: the former
have the advantage of lower cost, but the disadvantages of longer site time and less
flexibility in borehole development. In addition, there is a greater possibility that temporary
casing will be needed to hold back heaving or unstable formations.
Rotary plant is more expensive to use, but it is considerably faster. Rigs having a
compressor and mudpump allow a wider and more effective range of development (i.e.
jetting and air lifting) that percussion rigs cannot emulate. In addition, approximate yields
may be estimated during drilling, from the air-blown volume of water and cuttings (when
air rotary techniques are used).
Borehole Drilling, Completion and Maintenance
1. Drilling Technique and Diameter
Volcanic formations are most efficiently drilled using the air-hammer technique. In the
Nairobi area, the unconsolidated top layers are usually clayey and not collapsing: it is not
expected that more than 6 m of temporary casing may be required.

xxv
Drilling additives to be used (e.g. foam or polymer) must be non-toxic and bio-degradable.
The use of bentonite, or other clay-based additives, should not be acceptable: these may
plug the aquifer zones and are extremely difficult to remove during development.
The minimum casing diameter for a submersible pump with a capacity of 10 m3/hr at a
head of 150 m is 152 mm. The diameter should therefore be chosen so that it can easily
accommodate the 6” casings and screens used in installation. To allow for an annular of
1” for the insertion of gravelpack, drilling should be carried out at not less than 8”. The
final borehole width will depend on the drilling contractor selected to undertake the works,
the nature of the penetrated formations and aquifers, the available bit diameters, and the
type of casings to be installed.
The drilling rig engaged in the works should be able to drill to a depth of at least 250 m, at
the specified diameter. The rig and the drilling method adopted must be suitable for
drilling through both unconsolidated material, and very hard, compact rocks.
Geological rock samples should be collected at 2 metre intervals. Water struck and rest
levels should be carefully recorded, as well as water quality and estimates of the yield of
individual aquifers encountered.
Great care should be taken that the water quality of the different aquifers is accurately
determined. Upon the first strike, drilling fluids should be effectively flushed, and after
sufficient time, a water sample should be taken of the air-blown (rotary) or bailed
(percussion) yield. On-site analysis using an EC meter, and preferably a portable
laboratory, is recommended.
2. Borehole Design
If reasonable quantities of water are encountered in the borehole, and if the aquifer is
confined, a permanent design of the following type may be installed:
Base of hole to base + 6m 6 m plain casing with end cap (sediment trap)
Base + 6 to base + 48 m 42 m of screen
Base + 48 to base + 54 m 6 m of plain casing ("pump blank")
Base + 54 to base + 60 m 6 m of screen
1 m above first significant aquifer strike to surface plain cased throughout
Installation should preferably be undertaken with 6” Galvanised Steel casings and 6”
machine slotted screens. Alternatively, less expensive gas-or plasma-slotted Mild Steel
screens may be used. However, important disadvantages of the gas-slotted type include a
shorter lifespan (less corrosion resistive and therfore less durable) lower open area (about

xxvi
50% of the machine-slotted type), and a non-uniform slot-size. The finishing of plasma-cut
screens is much better, and approaches the machine-cut version.
It should be noted that the here mentioned design is strictly tentative. The final installation
should always depend on the formations encountered, water quality aspects, aquifer type,
and the good judgement of the driller or drilling engineer on site. In an unconfined
aquifer, for instance, screens should be placed towards the base of the water bearing zone,
and hydraulic continuity provided by the gravelpack.
3. Gravel Pack
Volcanic formations often incorporate unstable layers of pyroclastic rocks, ashes, Old
Land Surfaces, boulder beds, semi-consolidated sediments, etc. To avoid collapsing and
sediment intake into the completed well, the installation of a gravel pack is strongly
recommended. The filter material should consist of 4 to 6 mm diameter, washed, preferably
rounded, quartzose fragments. The gravel is installed either by tremie pipe or run in by
hand and washed down with copious amounts of water to prevent bridging.
The volume of pack to be inserted should be calculated on the basis of known annular
space, and the actual amount of pack installed should be measured. A physical check
should be made to ensure that the top of the gravel pack is at least 6 m above the top of the
upper-most screen, to allow for settlement during development.
4. Well and Aquifer Development
Development is the term used to describe the procedures designed to maximise well yield.
It has two broad objectives:
To repair the damage done to the aquifer material during drilling and restore the natural
hydraulic properties.
During drilling, the bit action chips and crushes the rock, and mixes it with water and
other fine material into a viscous mud. The pounding of the bit forces this slurry into the
openings in the wall of the borehole, thus blocking the pores and impeding the flow of
water from the aquifer. A thick "wallcake" may form, especially when clay additives (such
as bentonite) have been used during the drilling, or where natural clays occur in the
penetrated formations. This cake, if not removed, may virtually plug the borehole, and
significantly reduce the discharge. It should be noted that the maximum yield of a
formation can only be realised if all the fractures and crevices are unblocked and able to
supply water to the well.
Borehole development techniques are applied to break down and remove the impermeable
layer of clayey material from the borehole wall. Swabbing, wall-scratching, airlift
rawhiding and polyphosphate dosing are all borehole development techniques.
To alter the characteristics of the aquifer volume in the vicinity of the borehole, by
improving hydraulic contact between the aquifer and the hole. This is essentially aquifer
development, and is also known as aquifer stimulation.

xxvii
Polyphosphate dosing, hydrofracturing and acidizing are examples of aquifer stimulation
techniques.
Development with rotary plant: If a rotary rig equipped with a strong air compressor is
used, the following, highly effective development techniques should be applied:
Airlift rawhiding, into and through the screened sections. This should continue until the
water lifted is clean and clear, with electrical conductivity stable. Rawhiding comprises
cyclic airlifting: once the airlift has been established, air supply is cut off and water
allowed to cascade down the hole. This creates overpressures across the borehole wall,
which agitates the formation and enhances cleaning. The airlift is then started again and
the cycle repeated.
Water jetting with an on-wall velocity of 30 m/s: at least 0.3 m3 of fluid should be jetted per
linear metre of screen. Jetting should start from the top of the screen rotating downwards.
The water used must be absolutely free of particles; to increase the effectiveness of the
procedure, it is mixed with sodium hexametaphosphate and calcium hypochlorite.
Recommended concentrations are 3.8 kg/m3 of sodium hexametaphosphate (a locally
available, common food additive and clay disaggregant known under the trade names
“Calgon” or “SHMP”), and 1.5 kg/m3 of calcium hypochlorite. The jetting tool should be
so constructed that the jet openings are not more than 0.5” (13 mm) from the screen. After
the entire screen has been jetted, the hole should be left for at least 12 hours or overnight,
to allow the hexametaphosphate to work on the “wallcake” and any clays present in the
gravelpack and the aquifer astride the screens.
Airlift rawhiding again, from the bottom of the hole, until airlifted water is absolutely
clean and electrical conductivity stable.
During development, an estimate of the bailed or air-blown yield should be made. This
usually gives a fair indication of the final abstraction that can be expected from the
borehole.
5. Recommended Test Pumping
After development and confirmation of the approximate borehole yield, a step-drawdown
test should be carried out, followed by a 24-hour long-duration test at constant discharge
rate. The tests should be performed with a submersible pump, set within the blank casing
between the screened sections. The capacity of the test pump should be sufficient to provide
a minimum discharge of 15 m3/hr at a head of 150 metres.
The specific capacity and the efficiency of a borehole are determined during a step-
drawdown test. Simultaneously, target yields for the constant discharge test can be set. The
step-drawdown test usually comprises at least 4 stages of not less than 60 minutes each.
The pumping rates are increased in a step-by-step manner.
Recovery may be measured after the last step, but this is not really necessary if a constant
discharge test is also conducted. However, before starting the constant discharge test, 95%

xxviii
of the pumped drawdown must be recovered, or no increase in level must be observed for a
period of more than 4 hours. Alternatively, the constant discharge test may be conducted as
a direct extension of the step-drawdown test, without stopping the pump.
The constant discharge test allows calculation of specific aquifer parameters, such as
transmissivity, hydraulic conductivity and storage coefficient. The shape of the test
pumping curve will reveal the aquifer type: confined/unconfined, fracture,
heterogeneous/homogeneous, etc. In addition, the sustainable volume of abstraction, the
design drawdown and the final pump specification and setting can be determined. The
minimum duration of the test should be 12 hours, followed by 6 hours of recovery
observations, or alternatively until 95% of the total drawdown has been regained.
6. Drilling Records and Logs
Good drilling records are essential in evaluating the results of a borehole drilling exercise
(such as the reasons for success or failure). It is highly recommended to record, as a rule,
all the relevant borehole parameters: location sketch, depth, rate of penetration, water
struck level, static water level, air-blown yield during drilling, tested yield, test pumping
records, pumped water level, drawdown, sustainable yield, pump setting, water quality
(TDS or EC), and adequate and detailed geological logs. In addition, breakdowns, reasons
for stoppage, difficulties encountered during drilling, etc. should be documented.
7. Drilling Supervision
It is strongly recommended to engage the services of an experienced hydrogeologist during
the drilling, design, installation, and testing of the borehole. Apart from inspecting the
quality of materials and verifying the quantities of items billed by the Contractor, the main
tasks of the supervisor are:
To ensure that the borehole is completed according to the technical specifications,
and
To provide sound professional judgement on design aspects, required drilling depth,
sustainable yield and selection of the permanent pumping plant.
8. Borehole Maintenance
Boreholes, like any other structure, age with time. Ageing may take the form of corrosion
of installed ferrous metals (such as casing and screen, rising main, and pump), and in the
case of almost all boreholes there will be an inevitable decline in efficiency over time.
If boreholes are installed with mild steel casing and screens, chemical corrosion may occur
over the years. However, the lifespan of a borehole installed with GS machine-slotted
screens is expected to be more than 40 years.
If cyclic drawdown into the screens occurs frequently, deposition of insoluble bicarbonates
may take place. This, ultimately, will reduce the borehole efficiency by creating greater
well-entry losses (because of higher inflow velocities).

xxix
There are various ways of monitoring efficiency, but the most effective and certainly the
least equivocal is the repetition of step-drawdown tests at intervals in a borehole's life. As
the screens become progressively less efficient, the discharge-drawdown equation will
change, indicating greater drawdowns than hitherto for the same discharge.
Once this has declined to approximately 60 to 70% of original tested discharge for a given
drawdown, the borehole should be rehabilitated. This exercise should take the form of
airlift surging from the bottom of the hole, after treatment by jetting with a polyphosphate
solution. Jetting breaks down the bicarbonates, and strips out any decomposed feldspars,
or clays and other fines trapped in or near the screen and gravel pack. If the exercise is
undertaken correctly the borehole should be almost as efficient as it was when first
completed.
In extreme cases (as when an aquifer is contaminated with iron or sulphate bacteria, or
where groundwater chemistry deposits a persistent bicarbonate coating on screens), the
borehole may require acid treatment.
A crude measure of ageing, which can be calculated whenever both static and dynamic
water levels for a borehole have been collected, is specific capacity for a fixed discharge
value (specific capacity, Q/s, is the discharge divided by drawdown). If this ever changes
dramatically, it indicates that a significant change has occurred in the borehole. If this
kind of monitoring data exists it is a comparatively straightforward task for a
hydrogeologist to diagnose downhole problems.
9. Legal Requirements
It is a legislated condition imposed by the Water Resource Management Authority (WRA)
(through the Water Resource Management Rules,2007), that all boreholes in Kenya be
equipped with a flow meter and a means by which water levels can be measured. These
measures have been designed to allow the collection of data which will enable both the
authorities and the borehole operators to learn more about the reliability and limitations of
their groundwater resources.

xxx

xxxi
APPENDIX III: SKETCH MAP
Scaled satellite Extract showing the specific site location (Adapted from google earth)
Proposed
BH site