environmental payback periods of reusable alternatives to
TRANSCRIPT

Vol.:(0123456789)1 3
The International Journal of Life Cycle Assessment https://doi.org/10.1007/s11367-021-01946-6
CARBON FOOTPRINTING
Environmental payback periods of reusable alternatives to single‑use plastic kitchenware products
Hannah Fetner1 · Shelie A. Miller1,2
Received: 18 November 2020 / Accepted: 16 June 2021 © The Author(s), under exclusive licence to Springer-Verlag GmbH Germany, part of Springer Nature 2021
AbstractPurpose Many consumers are transitioning away from single-use plastic products and turning to reusable alternatives. Often-times, this change is being made with the assumption that these alternatives have fewer environmental impacts; however, reusable products are frequently made from more environmentally intensive materials and have use phase impacts. This study used LCA to examine the GWP, water consumption, and primary nonrenewable energy use associated with reusable alternatives for single-use plastic kitchenware products and determined environmental payback periods.Methods The environmental impacts for each reusable alternative are calculated on the functional units of 1 use, 1 year (5 uses/week), and 5 years (5 uses/week). Payback periods are calculated for each reusable alternative and defined as the number of times a consumer must reuse an alternative in order for the environmental impact per use to be equivalent to the environmental impact for the single-use product. The research explored the sensitivity of the results to different consumer washing and reuse behaviors, as well as local conditions such as overall transportation distances and the carbon intensity of different electricity grids. Product types studied included straws (4 reusable, 2 single-use), sandwich storage (2 reusable, 3 single-use), coffee cups (3 reusable, 2 single-use), and forks (1 single-use, 3 reusable).Results and discussion Environmental impacts associated with the reusable alternatives were highly dependent on the use phase due to dishwashing, making payback period sensitive to washing frequency and method, and for GWP, carbon inten-sity of the energy grid (used for water heating). For single-use products, the material/manufacturing phase was the largest contributor to overall impacts. It was found that nine of the twelve reusable alternatives were able to breakeven in all three environmental indicators. The coffee cup product type was the only product type to have one reusable alternative, the ceramic mug, and have the shortest payback period for all three impact categories. Both the bamboo straw and beeswax wrap were unable to breakeven in any scenario due to high use phase impacts from manual washing.Conclusions The research found that reusable alternatives can payback the environmental impacts of GWP, water consump-tion, and energy use associated with their more resource intensive materials, but it is dependent on number of uses, consumer behavior, and for GWP, carbon intensity of the energy grid. A key takeaway is that consumer behavior and use patterns influence the ultimate environmental impact of reusable kitchenware products.Recommendations Some recommendations for consumers looking to reduce the overall impact of kitchenware products include the following:
1) Not always assuming reusable is the best option.2) Extending product lifetime.3) Researching which reusable option has the lowest
impact.
4) Following best practice washing behaviors.5) Not washing products after every use.6) Advocating for integration of renewables into the local
energy grid.7) Reducing consumption of these product types (reusable
or single-use).Communicated by: Enrico Benetto
* Hannah Fetner [email protected]
1 Center for Sustainable Systems, School for Environment and Sustainability, University of Michigan, 440 Church Street, Ann Arbor, MI 48109, USA
2 Program in the Environment, University of Michigan, 440 Church Street, Ann Arbor, MI 48109, USA

The International Journal of Life Cycle Assessment
1 3
1 Introduction
Reusable alternatives have quickly become a popular solution for replacing single-use products and combat-ting the ubiquity of disposable plastic (European 2018; Schnurr et al. 2018; UNEP 2018; Godfrey 2019). Although reusable alternatives have the potential to reduce end-of-life waste, they also come with their own environmental impacts (Herberz et al. 2020), as reusable items can be made with more resource intensive materials and have use-phase impacts, such as water consumption and energy use, associated with washing (Blanca-Alcubilla et al. 2020; Milà‐i‐Canals et al. 2020). This study compares the use of reusable and single-use products and determines the number of reuses necessary to payback the environmental impacts associated with reusable alternatives.
Additionally, forecasted markets for alternatives to single-use plastic reflect this shift in consumer behav-ior. One study valued the market for sustainable packag-ing at ~ $225 billion in 2018 and forecasted a compound annual growth rate (CAGR) of 5.7% from 2019 to 2024 (Market Insights Report 2019). Another report looking at the drinking straw market also expects a CAGR of ~ 6%, with a shift in consumer preference for reusable or biode-gradable products (Insights Future Market 2019). Addition- ally, certain reusable products have gained increased media attention, such as straws, sandwich bags, and travel utensils (Ro 2020; Englishman 2020; Kitts and Conti 2020).
While many consumers are transitioning to reusable alter-natives with the hopes of being more sustainable, research has shown that consumer perception of what makes a prod-uct sustainable does not always reflect actual life cycle assessment (LCA) results (Boesen and Niero 2019; Steenis et al. 2017). This means some consumers might be inac-curately thinking that they are making the most sustainable choices when another alternative is environmentally prefera-ble. Currently, there are many LCA studies on everyday con-sumer products such as plastic carrier bags (Edwards 1998; Greene 2011; Kimmel et al. 2014; Bisinella et al. 2018), dis-posable cups (Openbare 2006; Ligthart and Ansems 2007; Van der Harst and Potting 2013; Cottafava et al. 2020), plates (Postacchini et al. 2016), milk bottles (Keoleian and Spitzley 1999), takeaway containers (Madival et al. 2009; Accorsi et al. 2014; Bortolini et al. 2018; Gallego-Schmidt et al. 2019), and other food packaging options (Franklin Associates 2018). These papers demonstrate the complex-ity of product sustainability, the nuances of the environmen-tal impact of reusable items, and the number of factors and behaviors results are dependent on. These contingencies for environmental favorability are further explored in recent research identifying common misperceptions associated with single-use plastic solutions (Miller 2020).
In order to better communicate the environmental impact per use of reusable products to consumers, this study looks at popular and highly advertised reusable alternatives and uses the concept of payback period to communicate the environmental impact. In this paper, payback period is defined as the number of uses required to have equivalent environmental impacts per use between the reusable and single-use products on a life cycle basis, which includes resource extraction, manufacturing, transportation, use, and disposal (Cherif and Belhadj 2018). Payback period is cal-culated as a ratio between overall emissions of single-use products versus a reusable alternative for the same number of uses. Some advantages of using payback period are that it is both easily understandable to the average consumer (Alton and Underwood 2003; Saoutert and Andreasen 2006) and provides a specific action that can be taken (Jensen and Schnack 1997; Breiting and Mogensen 1999; Robelia et al. 2011).
Payback period is commonly associated with a monetary calculation, but previous research has used environmental payback to optimize scenarios such as air conditioner, refrig-erator, freezer, and automobile replacement (De Kleine 2009; Horie 2004; Spitzley et al. 2005). Many of these studies have shown how environmental favorability is highly con-tingent on product lifetime, consumer behaviors, and local conditions. An example of the impact of consumer behavior on optimal replacement was presented in a 2006 study on washing machines where payback calculations resulted in recommendations on washer replacement that varied between replacing only once to three times within a 35-year period depending on the user’s choice to wash their clothes with cold or hot water, and the choice to hang-dry versus machine-dry (Bole 2006). A meta-analysis conducted by the UN Envi-ronment Programme showed that local conditions such as land-use change from production and extraction stages, and local waste management practices affected the environmental payback of reusable bags. The report found that GHG emis-sion payback period of a reusable polyethylene bag varied between 4 and 20 uses when compared to a traditional single-use plastic bag (UNEP 2020). With this in mind, the current study assesses how consumer behavior and local condition factors impact the number of uses before environmental pay-back for reusable products might occur.
The overall objectives of this research are the following:
(1) Identify the number of reuses necessary to payback the environmental impacts associated with reusable prod-ucts,
(2) Determine consumer behaviors and local conditions which impact payback period.

The International Journal of Life Cycle Assessment
1 3
Using LCA, this paper analyzes single-use and reusable alternatives for four common kitchenware product groups: drinking straws, sandwich storage, coffee cups, and uten-sils. These alternatives were selected due to media and con-sumer popularity (Brown 2019; Leighton 2019; Wells 2019). Although some LCA studies have been done on these prod-ucts (Razza et al. 2009; Takou et al. 2019; Chitaka et al. 2020), many are location-specific or evaluate few alterna-tives. This analysis compares a wide variety of products using the lens of environmental payback rather than stand-ard comparative LCA to help put environmental impacts of product alternatives into better context.
This study compares reusable and single-use products on the basis of global warming potential, water consumption, and primary nonrenewable energy use. Different scenarios are used to investigate how assumptions can impact the pay-back period for each product group. The payback period is determined for each reusable item, and sensitivity analysis is conducted with respect to changes in material emissions, transportation distance, and consumer behavior during the use phase, disposal scenarios, and local conditions such as carbon intensity of the energy grid and type of water heater in the home. In some scenarios, a payback period cannot be calculated since the environmental impacts of the reus-able item are unable to break even with the environmental impacts of a single-use item, which occurs when the use phase impacts associated with washing the reusable item are greater than the total life cycle impact of the single-use item.
2 Materials and methods
This study utilized an LCA framework and followed the standard four-step approach defined in ISO14040/14044 (International Organization for Standardization [ISO] 2006). SimaPro v9.1.0.11 was used to obtain inventory and impact assessment data, supplemented with literature data as appropriate. Specific assumptions and methodo-logical choices for each of the four stages of the LCA are detailed in each section.
2.1 Goal and scope definition
The goal of the study is to estimate the life cycle global warming potential (GWP), water consumption, and primary nonrenewable energy use associated with single-use kitchen-ware products and their reusable alternatives and determine the environmental payback period in each impact category for the reusable alternatives. Payback period is defined as the number of times a consumer must reuse an alternative in order for the environmental impact per use to be equiva-lent to the environmental impact for the single-use prod-uct. GWP, water consumption, and primary nonrenewable
energy use were selected as the most appropriate environ-mental indicators for this suite of products. It was decided that the calculation of environmental payback period would not be appropriate for impact categories where the type of impact is a significant issue for one product yet non-existent or negligible in others (i.e., land use in bio-based products, physical marine damage for plastics) since it can be assumed that no payback exists in these circumstances. In lieu of cal-culating a payback period for these impacts, inherent trade-offs of impact categories for different types of products are included in the discussion section.
The environmental impact of reusable products changes with respect to the number of uses, so for exam-ple with GWP, kg CO2-eq/one use is different than the kg CO2-eq/1000 uses. Although the purpose of the paper is to calculate the environmental payback period which identifies the number of uses for the reusable and single-use prod-ucts to have equivalent environmental impact, illustrative functional unit scenarios of 1 use, 1 year, and 5 years are calculated to demonstrate the general trend in results with increased number of uses. These scenarios correspond to using a product a single time, using it five times per week for a year, and using it five times per week for 5 years. The analysis also explores how different consumer behaviors may impact results.
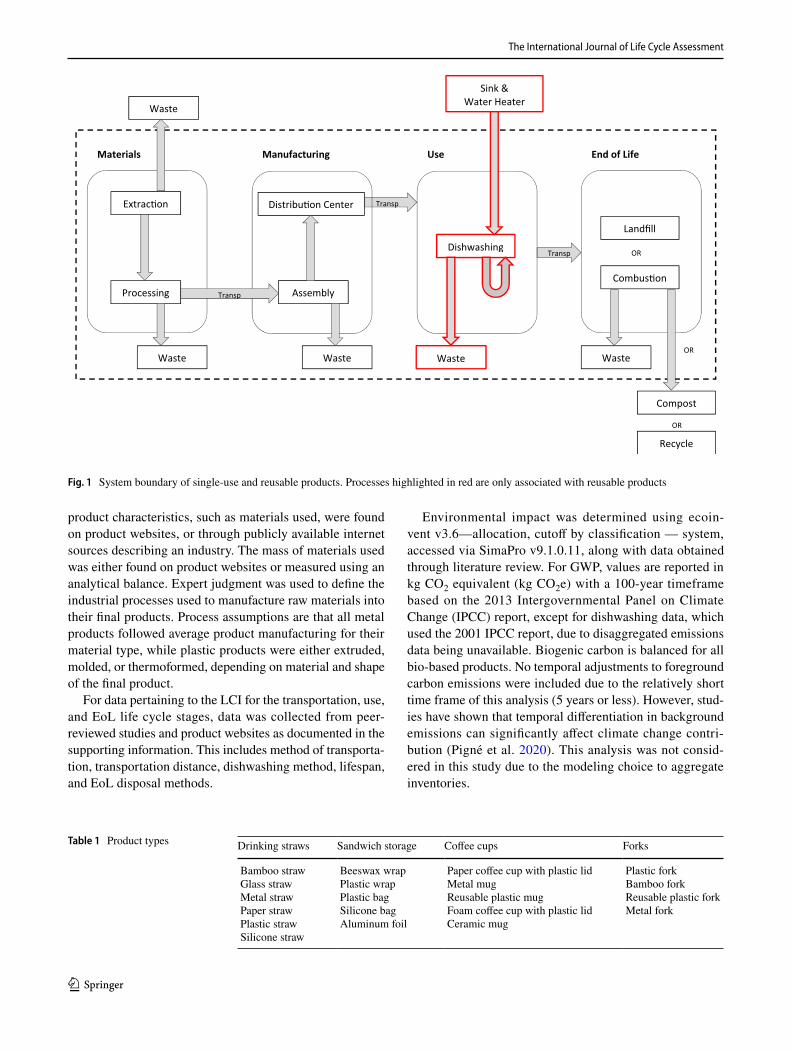
Figure 1 depicts a generic system boundary diagram for each of the products. Production and disposal of transporta-tion vehicles and other capital equipment are not included. For the use phase, dishwasher production, energy, deter-gent, and water consumed by washing reusable products are included in the analysis (Porras et al. 2020). Impacts asso-ciated with dishwasher disposal, sink, and water heater are excluded. Lastly, for the end-of-life phase, ecoinvent v3.6 system model—allocation cutoff by classification was fol-lowed (“allocation”).
2.2 Product selection
Four common consumer product categories were compared, each of which has commercial reusable alternatives avail-able: drinking straws (5 alternatives), sandwich storage (4 alternatives), coffee cups (4 alternatives), and forks (3 alter-natives). Product types are included in Table 1 below. Spe-cific brands or models used to calculate product characteris-tics, such as mass or surface area, are listed in supplemental material Table S1. Comparative analysis is conducted within each product type.
2.3 Life cycle inventory and impact assessment
The following section outlines the assumptions associated with the Life Cycle Inventory (LCI) and the Life Cycle Impact Assessment (LCIA). For the LCI, the majority of
The International Journal of Life Cycle Assessment
1 3
product characteristics, such as materials used, were found on product websites, or through publicly available internet sources describing an industry. The mass of materials used was either found on product websites or measured using an analytical balance. Expert judgment was used to define the industrial processes used to manufacture raw materials into their final products. Process assumptions are that all metal products followed average product manufacturing for their material type, while plastic products were either extruded, molded, or thermoformed, depending on material and shape of the final product.
For data pertaining to the LCI for the transportation, use, and EoL life cycle stages, data was collected from peer-reviewed studies and product websites as documented in the supporting information. This includes method of transporta-tion, transportation distance, dishwashing method, lifespan, and EoL disposal methods.
Environmental impact was determined using ecoin-vent v3.6—allocation, cutoff by classification — system, accessed via SimaPro v9.1.0.11, along with data obtained through literature review. For GWP, values are reported in kg CO2 equivalent (kg CO2e) with a 100-year timeframe based on the 2013 Intergovernmental Panel on Climate Change (IPCC) report, except for dishwashing data, which used the 2001 IPCC report, due to disaggregated emissions data being unavailable. Biogenic carbon is balanced for all bio-based products. No temporal adjustments to foreground carbon emissions were included due to the relatively short time frame of this analysis (5 years or less). However, stud-ies have shown that temporal differentiation in background emissions can significantly affect climate change contri-bution (Pigné et al. 2020). This analysis was not consid-ered in this study due to the modeling choice to aggregate inventories.
OR
OR
OR
Materials Manufacturing Use End of Life
Extrac�on
Processing Assembly
Distribu�on Center
Waste Waste Waste
Dishwashing
Landfill
Combus�on
Compost
Waste
Recycle
Waste
Transp
Transp
Transp
Sink & Water Heater
Fig. 1 System boundary of single-use and reusable products. Processes highlighted in red are only associated with reusable products
Table 1 Product types Drinking straws Sandwich storage Coffee cups Forks
Bamboo straw Glass straw Metal straw Paper straw Plastic straw Silicone straw
Beeswax wrap Plastic wrap Plastic bag Silicone bag Aluminum foil
Paper coffee cup with plastic lid Metal mug Reusable plastic mug Foam coffee cup with plastic lid Ceramic mug
Plastic fork Bamboo fork Reusable plastic fork Metal fork
The International Journal of Life Cycle Assessment
1 3
ReCiPe 2016 Midpoint (H) was used to calculate water consumption (Huijbregts et al. 2017), which is the amount of off stream water that is used and not returned (Owens 2001), and reported in m3 water-eq consumed. To keep the study generalizable, water consumption was not characterized with respect to regional scar-city. For modeling of primary nonrenewable energy use, IMPACT2002 + was used (Jolliet et al. 2003). In order to calculate payback period and perform sensitivity analysis, data from SimaPro was transferred to Microsoft Excel, where it was further analyzed.
2.3.1 Material and manufacturing
A summary of the materials and amounts used to model each product can be found in the supplemental material Table S3. For all products, dyes were not included due to insufficient data surrounding the type, amount, and envi-ronmental impact of the dye used during the specific manu-facturing process. Additional manufacturing process step(s) were incorporated for the majority of products and can also be found in the supplemental material Table S8. The average emissions, water consumption, and primary nonrenewable energy use factors associated with the majority of both the materials and manufacturing steps were quantified using ecoinvent v3.6, cutoff by classification system. Due to data availability, academic literature was used to supplement inventory data for bamboo culm and poles (Escamilla and Habert 2014), and the World Food Life Cycle Database was used to model honey. For both the bamboo and honey mod-els, inputs also came from ecoinvent, resulting in minimal systemic error in the context of other products in the study. Beeswax wrap was modeled using cotton, beeswax, resin, and jojoba oil, but due to lack of emission factors on these specific materials, the emissions factor for honey were used in place of beeswax, epoxy resin was used in place of resin, and cottonseed oil was used in place of jojoba oil as the clos-est reasonable proxies for which data were available.
2.3.2 Transportation
The researchers chose an average overall transportation dis-tance of 250 miles or 402.33 km using a transport, freight lorry > 32 metric ton for the base case scenarios. This dis-tance was selected based off of research showing that most goods in the US are transported less than 250 miles (U.S. DOT 2017). Trucking was selected as the transportation method in the model because it is responsible for mov-ing ~ 66% of goods in the US (U.S. DOT 2017). Environ-mental impact was estimated using the same Ecoinvent 3—allocation, cutoff by classification system.
2.3.3 Use
In order to estimate the environmental burden from washing reusable products, values from Porras et al. (2020) were used. The results of the study are based on primary data from the Whirlpool Corporation, with plant-level data coming from their Findlay, Ohio facility. System boundaries from Porras et al. (2020) are reflected in this study (Fig. 1) with the sink, water heater, and recycled material being outside the scope. Environmental impacts were reported with a functional unit of 2150 loads, but researchers of this study were able to cal-culate GWP, water consumption, and primary nonrenewable energy use for both machine dishwashing and manual wash-ing on a cm2 dish basis. With this allocation, the average GWP values of 2.5 × 10⁻⁵ kg CO2e/cm2 dish for dishwashers and 6.7 × 10⁻⁵ kg CO2e/cm2 dish for manual washing were found. Emission values from this study were consistent with other academic literature (Vivian et al. 2011). Values for water consumption and primary nonrenewable energy use for both machine dishwashing and manual washing can be found in supplemental material Table S15.
2.3.4 End‑of‑life
The EPA Advancing Sustainable Materials Management: 2017 Fact Sheet was used to determine the average disposal rates for material types (EPA 2019). The model bases the percentage of waste going toward each disposal method (sanitary landfill, combustion, compost, recycle) off of these figures. Ecoinvent v3.6 system model—allocation cutoff by classification was used for end-of-life modeling, meaning waste treatment such as landfill or combustion is included, but burdens or credits from the recycle or compost process that are attributed to the production of secondary material, not the primary (“allocation”).
2.4 Sensitivity and uncertainty analysis
A Monte Carlo simulation was conducted on the GWP results including relevant parameter distributions for manu-facturing emissions, transportation distances, dishwashing emissions, and product end-of-life, using triangular distribu-tions (Table 2). The majority of products in the analysis are comprised of one or two materials. Therefore, correlations within the inventories were not included due to the relative simplicity of the product inventories and lack of expected impact on results. Sensitivity analysis was confined to GWP due to lack of distribution data for the other impact catego-ries. The modeling approach did not allow for uncertainty in background datasets to be included and did not consider correlation in this background data. This could impact final uncertainty estimations.

The International Journal of Life Cycle Assessment
1 3
To supplement the Monte Carlo simulation, an additional one-at-a-time sensitivity analysis was conducted, and the material emission factor, manufacturing emission factor, transportation emission factor, transportation distance, dish-washing emission factor, and disposal emission factor were varied by + / − 50%.
For the Monte Carlo simulation, 10,000 trials were run. Table 2 shows the key parameters, their distribution types, and the ranges. Because ranges were not available for all materials and manufacturing processes, a range of + / − 10% was used for all materials/manufacturing in order to maintain uniformity between products. This is meant to account for some uncertainty and variability in the parameters. For transportation, a triangular dis-tribution was modeled and a range of 259–2590 km was used (U.S. DOT 2017). Changes in dishwashing emission factors reflect changes in carbon intensity of the grid, and the use of an electric versus natural gas water heater (Porras et al. 2020). Calculations for these different dish-washing emission factor scenarios can be found in sup-plemental material Table S18. Lastly, EoL models show disposal rates ranging from 0 to 100% for all applicable disposal scenarios per material (landfill, combustion, compost, recycle).
3 Results
Initial modeling of both the single-use and reusable prod-ucts looked at the resource intensity of the material and manufacturing phases. Results showed that, although in some instances, reusable products use more resource inten-sive materials (on a per kg basis) than single-use; this is not always the case. Looking specifically at straws in Table 3, the materials with the lowest GWP (bamboo), water con-sumption (glass), and primary nonrenewable energy use (bamboo) are all used for reusable products. On the other hand, plastic was the largest consumer of primary nonre-newable energy. This is due to the fact one of the main feed-stocks of polypropylene is crude oil or natural gas. There was no product type where materials for reusable or single-use products always fared better or worse than the other. For the coffee cups, ceramic had the lowest impacts in all three environmental indicators. This was the only instance where one material performed best in all three impact categories.
Next overall impacts, which include all life cycle phases, were analyzed. It was found different phases were respon-sible for the majority of impacts in single-use and reusable products. Figure 2 breaks down the overall impacts of each product into the four life cycle phases for two different use
Table 2 Monte Carlo parameters, distribution types, and ranges
Key parameters Distribution type Ranges
Material/manufacturing emission factor Triangular distribution + / − 10% for both material and manu-facturing emission factors
Transportation distance Most common 647.5 kmRange 259–2590 km
Use phase—machine dishwashing emission factor Most common 2.5 × 10⁻⁵
Range 1.7–4.6 × 10⁻⁵
(Unit kg CO2e/cm2 dish)Use phase—manual dishwashing emission factor Most common 6.6 × 10⁻⁵
Range 4.1 × 10⁻⁵–1.4 × 10⁻⁴
(Unit kg CO2e /cm2 dish)EoL disposal scenario percentage Most common: varied by material
Range 0–100% of each disposal scenario
Table 3 Comparison of the resource intensity of the material and manufacturing phase inputs on a per kg basis. Product types in the most category had the highest impact per kg material manufactured, whereas product types in the least category had the lowest impact per
kg material manufactured. This table does not reflect total impacts of the material and manufacturing phase for each product, rather the resource intensity of each on a per kg basis
Straws Sandwich bags Coffee cups Forks
Most Least Most Least Most Least Most Least
GWP Metal Bamboo Aluminum Plastic Metal Ceramic Metal BambooWater consumption Bamboo Glass Beeswax wrap Plastic Foam cup Ceramic Bamboo MetalEnergy use Plastic Bamboo Aluminum Silicone Reusable plastic Ceramic Plastic Bamboo

The International Journal of Life Cycle Assessment
1 3
scenarios, 1 use and 1 year. Average impact factors, dis-posal rates, and transportation distance were used in both use scenarios. Figure 2a shows the impacts using functional unit of one use for both the reusable and single-use options. Figure 2b depicts a functional unit of 1 Year, or 260 uses, which corresponds to 260 single-use products and reus-able products that are used 260 times, with the exception of the bamboo straw. Because the bamboo straw has a life expectancy of only 6 months or ~ 183 uses, Fig. 2b includes upstream emissions for 2 reusable bamboo straws.
It can be seen that, for single-use products, the material and manufacturing phase dominate impact regardless of number of uses. This is supported by another study which found the majority of impact to occur in the production stage for disposable items (Blanca-Albubilla et al. 2020).
The results of the Blanca-Albubilla study was found on average; 53% of the impact occurred during the production stage, which is slightly lower than results calculated in this study. This is partially because the Blanca-Albubilla study was specifically focusing on tableware used in the aviation sector and therefore incorporated impacts associated with airport transport and the flight.
On the other hand, the majority of reusable products are initially dominated by the material and manufacturing phase for the first use, but as they are used at a higher frequency, such as in the 1 year scenario, the upstream impacts become less of a factor, and the use phase quickly becomes the larg-est contributor. This is further supported by the 5-year sce-nario, found in supplemental material Table S28, which showed the use phase continuing to dominate. Multiple other
a.
0% 10% 20% 30% 40% 50% 60% 70% 80% 90% 100%
Bamboo StrawGlass Straw
Metal StrawSilicone Straw
Beeswax WrapSilicone Bag
Reusable Metal MugReusable Plas�c Mug
Ceramic MugBamboo Fork
Reusable Plas�c ForkMetal Fork
Paper StrawPlas�c StrawPlas�c Wrap
Plas�c BagAluminum Foil
Paper Coffee CupFoam Coffee Cup
Plas�c ForkBamboo Straw
Glass StrawMetal Straw
Silicone StrawBeeswax Wrap
Silicone BagReusable Metal MugReusable Plas�c Mug
Ceramic MugBamboo Fork
Reusable Plas�c ForkMetal Fork
Paper StrawPlas�c StrawPlas�c Wrap
Plas�c BagAluminum Foil
Paper Coffee CupFoam Coffee Cup
Plas�c ForkBamboo Straw
Glass StrawMetal Straw
Silicone StrawBeeswax Wrap
Silicone BagReusable Metal MugReusable Plas�c Mug
Ceramic MugBamboo Fork
Reusable Plas�c ForkMetal Fork
Paper StrawPlas�c StrawPlas�c Wrap
Plas�c BagAluminum Foil
Paper Coffee CupFoam Coffee Cup
Plas�c Fork
Reus
able
Single
-Use
Reus
able
Single
-Use
Reus
able
Single
-Use
esUygrenEelbawenernoNyra
mirPnoitp
musnoCretaW
PWG
Material Manufacturing Transporta�on Dishwashing Disposal b.
0% 10% 20% 30% 40% 50% 60% 70% 80% 90% 100%
Bamboo StrawGlass Straw
Metal StrawSilicone Straw
Beeswax WrapSilicone Bag
Reusable Metal MugReusable Plas�c Mug
Ceramic MugBamboo Fork
Reusable Plas�c ForkMetal Fork
Paper StrawPlas�c StrawPlas�c Wrap
Plas�c BagAluminum Foil
Paper Coffee CupFoam Coffee Cup
Plas�c ForkBamboo Straw
Glass StrawMetal Straw
Silicone StrawBeeswax Wrap
Silicone BagReusable Metal MugReusable Plas�c Mug
Ceramic MugBamboo Fork
Reusable Plas�c ForkMetal Fork
Paper StrawPlas�c StrawPlas�c Wrap
Plas�c BagAluminum Foil
Paper Coffee CupFoam Coffee Cup
Plas�c ForkBamboo Straw
Glass StrawMetal Straw
Silicone StrawBeeswax Wrap
Silicone BagReusable Metal MugReusable Plas�c Mug
Ceramic MugBamboo Fork
Reusable Plas�c ForkMetal Fork
Paper StrawPlas�c StrawPlas�c Wrap
Plas�c BagAluminum Foil
Paper Coffee CupFoam Coffee Cup
Plas�c Fork
Reus
able
Sing
le-U
seRe
usab
leSi
ngle
-Use
Reus
able
Sing
le-U
se
esUygrenE
elbawenernoN
yramirP
noitpmusnoCreta
WP
WG
Material Manufacturing Transporta�on Dishwashing Disposal
Fig. 2 Breakdown of percent contributed to overall impacts by each life cycle phase. a Functional unit: 1 use; b functional unit: 1 year (5 uses/week)

The International Journal of Life Cycle Assessment
1 3
studies have found similar results on the influence of dish-washing on the overall environmental impact (Ligthart and Ansems 2007; Woods and Bakshi 2014). A 2007 study on reusable cups concluded that as number of uses increased, the overall importance of washing also increases. The study also found that other life cycle stages were negligible com-pared to fabrication and washing of reusables (Garrido and del Castillo 2007).
The bamboo straw has a higher contribution to GWP and primary nonrenewable energy use from the use phase for the single-use scenario than the other reusable alternatives, because impacts from handwashing before using the first time are similar in scale to total material and manufacturing impacts of growing and processing the bamboo. All prod-ucts with stainless steel (metal straw, metal mug, metal fork) saw high contributions from the disposal phase for water consumption due to sanitary landfilling’s water consump-tion factor being an order of magnitude larger per kilogram material than the material/manufacturing phase.
To further demonstrate the effect of reusing products, Fig. 3 shows the data for straws in absolute terms of kg CO2e/use, m3/use, and MJ primary/use for scenarios of 1 use, 1 year, and 5 years. It is important to emphasize that because the y-axis unit for this graph is impact per use instead of total environmental impact, the single-use prod-uct’s impacts per use remain constant while the reusable product impact changes with the number of uses. If the graph were total overall impact, using 1300 (5-year sce-nario) plastic straws would have much higher impacts than using one plastic straw. Impact per use was selected as the most appropriate y-axis functional unit in order to show that as you use reusable products, even though total impacts increase due to washing, impacts per use decrease.
Before diving into individual results for each product type, it should be noted that these findings reflect typical washing behavior (Porras et al. 2020). If consumers were to follow washing best practices, payback periods for reusables would be reduced. In some instances, following washing best practices could make reusable alternatives that do not break-even in this study more favorable than single-use products.
Looking at Fig. 3a, which shows GWP per use for straws, the plastic straw was found to have the lowest GWP when used only once but is outperformed by the glass, metal, and silicone straws by the 1-year scenario. This means three of the four reusables are favorable in terms of GWP to the single-use plastic straw if used for 1 year. Emissions for the bamboo straws were unable to reach a payback period within 5 years because their use phase emissions in the average scenario increased more rapidly than the overall emissions of the plastic straw. In Fig. 3b, it can be seen that three of the reusable alternatives (glass, metal, and silicone) are break even by the 1-year scenario for water consumption, whereas bamboo does not reach a payback period due to higher water
consumption from hand washing. Lastly, in Fig. 3c, paper straws were found to have the lowest primary nonrenewable energy use per use. Similar to the results for GWP, the glass, metal, and silicone straws had lower primary nonrenewable energy use per use than the plastic straw by the 1-year sce-nario, whereas the bamboo straw was not able to reach a payback period.
Equivalent analysis and graphs for the three other product types can be found in the supplemental material Tables S29, S30, and S31. For the sandwich bag category, a few main takeaways were found. On the single-use side, aluminum foil had the largest impact in all three environmental cat-egories. When comparing the plastic bag and plastic wrap, it could be seen that results were mostly driven by mass. Because the mass of the plastic bag was two times that of plastic wrap, the impacts were also approximately double. Looking at the reusable sandwich bag alternatives, it could be seen that impacts were driven by high use phase impacts associated with large washing surface areas. This resulted in neither sandwich bag alternative reaching a payback period for GWP or primary energy use within the 5-year scenario. It is important to remember that washing impacts were allo-cated on an cm2 basis, and that environmental burden from this phase can be minimized with certain behavior changes such as using cold water or a two-basin washing technique.
Looking at the single-use coffee cup products, the foam cup had the lowest impacts for all three indicators. This is supported by other studies which also found foam cups to have lower impacts than paper cup variations (Franklin Associates 2011; Jung et al. 2011). The single-use paper cup was favorable to all reusable products when used only once, but by the 1-year scenario, all three reusable products had lower GWP per use and water consumption per use than the paper cup. By the 5-year scenario, all three reusable prod-ucts had lower primary nonrenewable energy use per use than the paper cup. Of the reusables, the ceramic mug had the lowest impacts for all scenarios and indicators, and the metal cup the highest.
Lastly, when looking at the fork products, the bamboo fork has lower GWP per use and primary nonrenewable energy use per use than the plastic fork with just a single use. The water consumption per use for the bamboo fork became less than the plastic fork by the 1-year scenario. Both the reusable plastic and metal forks become favorable to the plastic fork in GWP per use, water consumption per use, and primary nonrenewable energy use per use by the 1-year scenario.
Evaluating all of the single-use products shows that one of the key factors in overall impacts is the mass of the prod-uct. For the three product types with more than one single-use product (straws, sandwich bags, and coffee cups), the single-use product with the lower mass had lower GWP, water consumption, and primary nonrenewable energy use.

The International Journal of Life Cycle Assessment
1 3
a.
00.010.020.030.040.050.060.070.080.09
1 Use 1 Year 5 Years 1 Use 1 Year 5 Years 1 Use 1 Year 5 Years 1 Use 1 Year 5 Years
Plas�cStraw
PaperStraw
Bamboo Straw Glass Straw Metal Straw Silicone Straw
GWP
per u
se (k
g CO
2-eq/
use)
b.
0
0.001
0.002
0.003
0.004
0.005
0.006
0.007
0.008
1 Use 1 Year 5 Years 1 Use 1 Year 5 Years 1 Use 1 Year 5 Years 1 Use 1 Year 5 Years
Plas�cStraw
PaperStraw
Bamboo Straw Glass Straw Metal Straw Silicone Straw
Wat
er C
onsu
mpt
ion
per U
se
(m3
wat
er-e
q co
nsum
ed/ u
se)
c.
00.10.20.30.40.50.60.70.80.9
1
1 Use 1 Year 5 Years 1 Use 1 Year 5 Years 1 Use 1 Year 5 Years 1 Use 1 Year 5 Years
Plas�cStraw
PaperStraw
Bamboo Straw Glass Straw Metal Straw Silicone Straw
Prim
ary
Nonr
enew
able
Ene
rgy
Use
per U
se (M
J Tot
al P
rimar
y No
nren
ewab
le)
Fig. 3 Environmental impact per use for straw products at functional units of 1 use, 1 year (5 uses/week), and 5 years (5 uses/week). a GWP, b water consumption, c primary nonrenewable energy use

The International Journal of Life Cycle Assessment
1 3
The only exception to this was the plastic straw used more energy than the paper straw. A review of ten studies also found that the impact of disposable cups was highly influ-enced by cup mass (van der Harst and Potting 2013).
Key factors for reusable products are the cleaning surface area and the washing method (manual vs. auto). Products that had to be manually washed, such as the bamboo straw and beeswax wrap, had higher impacts than those that could be placed in a dishwasher. These results are supported by another study, which found for reusable cups, dishwashing was the highest contributor to overall impacts, whereas for disposable cups, impacts from production were one of the largest contributors (Ligthart and Ansems 2007).
Using base case values for impact factors, transportation distance and EoL disposal method percentages, initial results for payback period of each reusable product was calculated, shown in Table 4. It was found that 9 of the 12 reusable alternatives reached a payback period for all three environ-mental impact categories when typical washing behavior was used. The bamboo straw and beeswax wrap did not breakeven in any category, due to high washing emissions from either hand washing or large surface areas. The silicone bag reached a payback period for water consumption when compared to the plastic bag but did not break even in either GWP or energy use.
For the straws, the silicone straw had the shortest payback period for both GWP and primary nonrenewable energy use (70 and 16 uses, respectively), while the glass straw had the shortest payback period for water consumption (12 uses). The metal straw on the other hand had the longest payback period for all three impact categories.
The coffee cup product type was the only product type to have one alternative to dominate all three impact categories. The ceramic mug had a payback period of 16 uses for GWP, 4 uses for water consumption, and 32 uses for primary non-renewable energy use. The metal coffee cup had the longest payback periods for all three categories. All three products reached a payback period for all three impact categories.
This trend continued for the forks. The bamboo fork was more favorable than the plastic fork with just a single use for GWP and primary nonrenewable energy use but had to be used 34 times before it broke even for water consumption. The payback period for the reusable plastic fork was 4–5 uses for all three categories. Lastly, the metal fork broke even in 8 uses for GWP, 11 uses for water consumption, and 4 uses for primary nonrenewable energy use.
Analysis of these results showed a few interesting details. The authors hypothesized the payback periods for forks and straws would be similar, due to similar materials being used. In reality, the forks broke even much faster than the
Table 4 Payback period for GWP, water consumption, and primary nonrenewable energy use of reusable alternatives
Straws: compared to plastic straw
Bamboo Glass Metal Silicone
GWP Did not breakeven 163 229 70Water consumption Did not breakeven 12 93 34Energy use Did not breakeven 20 37 16
Sandwich bags: compared to plastic bag
Beeswax wrap Silicone
GWP Did not breakeven Did not breakevenWater consumption Did not breakeven 102Energy use Did not breakeven Did not breakeven
Coffee cups: compared to paper cup with plastic lid
Metal Reusable plastic Ceramic
GWP 111 43 16Water consumption 60 10 4Energy use 288 210 32
Forks: compared to plastic fork
Bamboo Reusable plastic Metal
GWP 1 4 8Water consumption 34 4 11Energy use 1 5 4

The International Journal of Life Cycle Assessment
1 3
straws, especially for GWP and energy use, because the ratio of mass between the single-use and reusable product was much lower. The reusable straws were 6.18–21.28 times the mass of the plastic straw, whereas the reusable forks were 1.75–4.75 times the mass of the plastic fork. Additionally, the results found that the metal reusable alternative of each product type (straw, coffee cup, and fork) had to be used the most in order to breakeven.
Other studies had varying results for payback periods of similar products. A recent study on straws in South Africa showed glass and metal reusable straws to have payback periods of 23 and 37 uses for GWP, respectively, when compared to a polypropylene straw produced in South Africa (Chitaka and von Blottnitz 2020). These results are considerably lower for two main reasons. The first is that polypropylene production in South Africa is significantly more carbon intensive than in North America and Europe. In South Africa, coal is the primary feedstock for polypro-pylene (9.67 kg CO2e/kg PP), whereas in North America and Europe, crude oil and natural gas are used (1.82–1.97 kg CO2e/kg PP) (Chitaka and von Blottnitz 2020). Secondly, the study assumed users were washing in cold water. The use of hot water saw a 38% and 42% increase in emissions for glass and steel straws, respectively (Chitaka and von Blottnitz 2020). This shows that there are many factors, including local conditions, that may impact payback period. These will be explored further in the sensitivity analysis.
4 Sensitivity and uncertainty analysis
Sensitivity analysis was conducted in order to determine the drivers of the overall impact and measure uncertainty. Due to limited data, the researchers chose to focus on GWP. Varia-bles that were considered include the transportation distance, and material, manufacturing, transportation, dishwashing, and disposal emission factor of the reusable product. Both the one-at-a-time analysis and Monte Carlo simulation were able to capture the model’s sensitivity to the aforementioned factors; however, only the Monte Carlo analysis assessed uncertainty plus variability. For the sensitivity measured, variations in the dishwashing emission factor reflect changes in the typical washing behavior system, such as grid carbon intensity and what energy source is being used for water heating. Further variations in the emission factor would be found if washing best practices were modeled and included.
4.1 Sensitivity analysis
Average results of the one-at-a-time analysis for both the reusable and single-use products can be seen in Fig. 4. Analysis was done on the 1-year (260 uses) scenario and showed that, on average, for the reusable product, GHG
emissions were highly sensitive to dishwasher emission factor, shown in Fig. 4a. This is consistent with results from Fig. 2, where the use phase was the highest contributor to overall emissions. Looking at individual products, it can be seen that, when the dishwashing emission factor was varied by + / − 50%, overall emissions were impacted by 25–50%. On the other hand, the model was not sensitive to either transportation emission factor, disposal emission factor, or distance transported. On average, when disposal emission factor was varied by + / − 50%, results were only impact by 0.3%. Emissions were even less sensitive to distance trans-ported, with a + / − 50% variance only resulting in an average change of 0.05%.
For the single-use products and a 1-year (260 products) scenario, shown in Fig. 4b, overall emissions were the most sensitive to the material emission factor, again consist-ent with findings from Fig. 2. When varied by + / − 50%, emissions for plastic single-use products were impacted by 28–48%. Single-use products were also fairly sensitive to manufacturing and disposal emission factor, with a + / − 50% change resulting in ~ 8% increase or decrease in emissions. The model was least sensitive to transportation emission fac-tor and distance transported, with an average change of only 0.47% when varied by 50%.
4.2 Uncertainty analysis
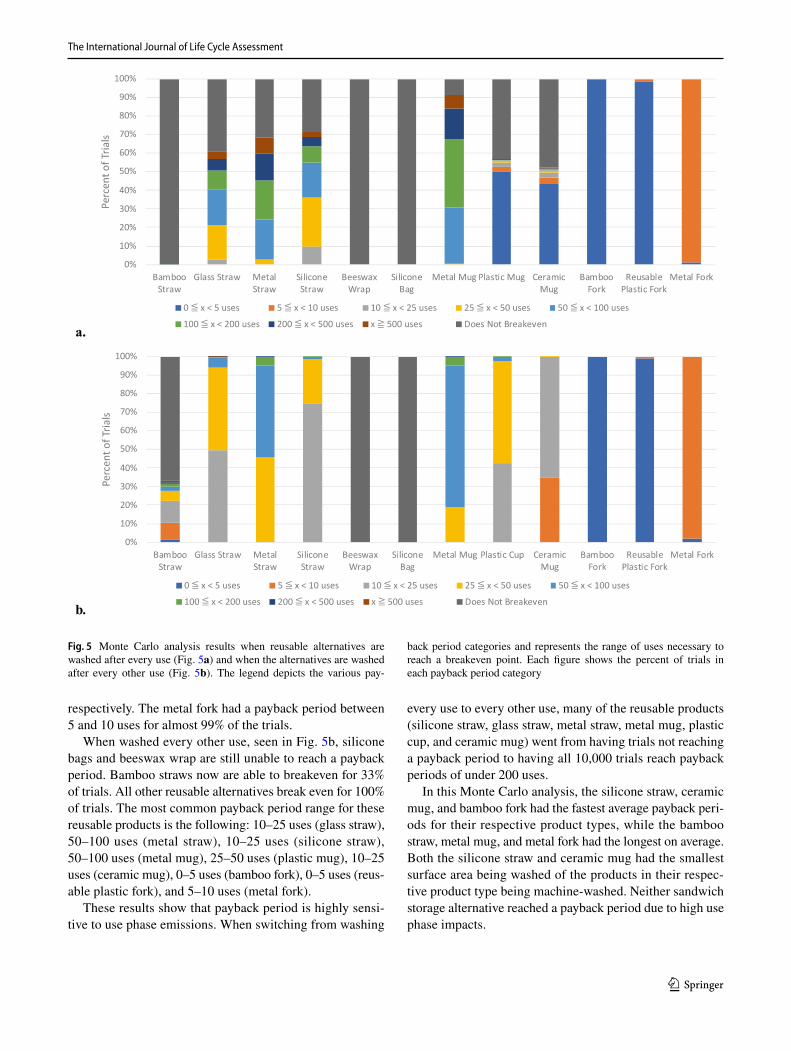
In addition, Monte Carlo analysis was completed in order to determine how varying a range of conditions at the same time influences the payback periods, with results reported in Fig. 5. The Monte Carlo simulation supplements the one-at-a-time analysis by providing insight on the uncertainty of the model on top of the variability.
For the Monte Carlo simulation, the reusable products were compared to the plastic straw, plastic bag, paper cup, and plastic fork, as the researchers determined that these were the most common single-use products in their area. In addition, for the straw and fork product types, the single-use product selected had the lowest emissions of all single-use options, which allows the more conservative breakeven sce-nario to be calculated.
As seen in Fig. 5a, when washed after every use, a pay-back period is unable to be calculated for the bamboo straw, silicone bag, and beeswax wrap since the GHG emissions during a single wash are greater than the total life cycle GHG emissions of the relevant disposable product. Products with large surface areas or that had to be manually washed were more likely to not breakeven. The silicone straw, glass straw, metal straw, metal mug, plastic cup, and ceramic mug all had trials where the reusable product did not break even. The reusable fork options always broke even, with the pay-back period for the bamboo fork and reusable plastic fork being between 0 and 5 uses for 100% and 98% of the trials,

The International Journal of Life Cycle Assessment
1 3
a.
b.
-50.0%
-40.0%
-30.0%
-20.0%
-10.0%
0.0%
10.0%
20.0%
30.0%
40.0%
50.0%
-50% -40% -30% -20% -10% 0% 10% 20% 30% 40% 50%
Perc
ent C
hang
e in
Ove
rall
GW
P
Percent Change in VariableMaterial Emission Factor Manufacturing Emission Factor Transporta�on Emission FactorTransporta�on Distance Dishwashing Emission Factor Disposal
-40.0%
-30.0%
-20.0%
-10.0%
0.0%
10.0%
20.0%
30.0%
40.0%
50.0%
-50% -40% -30% -20% -10% 0% 10% 20% 30% 40% 50%
Perc
ent C
hang
e in
Ove
rall
GW
P
Percent Change in Variable
Material Emission Factor Manufacturing Emission Factor Transporta�on Emission Factor
Transporta�on Distance Dishwashing Emission Factor Disposal
Fig. 4 One-at-a-time sensitivity analysis showing average percent changes in overall GWP for products in 1-year (260 use) scenario when vari-ables were ranged by + / − 50%. a) Reusable products, b) single-use products
The International Journal of Life Cycle Assessment
1 3
respectively. The metal fork had a payback period between 5 and 10 uses for almost 99% of the trials.
When washed every other use, seen in Fig. 5b, silicone bags and beeswax wrap are still unable to reach a payback period. Bamboo straws now are able to breakeven for 33% of trials. All other reusable alternatives break even for 100% of trials. The most common payback period range for these reusable products is the following: 10–25 uses (glass straw), 50–100 uses (metal straw), 10–25 uses (silicone straw), 50–100 uses (metal mug), 25–50 uses (plastic mug), 10–25 uses (ceramic mug), 0–5 uses (bamboo fork), 0–5 uses (reus-able plastic fork), and 5–10 uses (metal fork).
These results show that payback period is highly sensi-tive to use phase emissions. When switching from washing
every use to every other use, many of the reusable products (silicone straw, glass straw, metal straw, metal mug, plastic cup, and ceramic mug) went from having trials not reaching a payback period to having all 10,000 trials reach payback periods of under 200 uses.
In this Monte Carlo analysis, the silicone straw, ceramic mug, and bamboo fork had the fastest average payback peri-ods for their respective product types, while the bamboo straw, metal mug, and metal fork had the longest on average. Both the silicone straw and ceramic mug had the smallest surface area being washed of the products in their respec-tive product type being machine-washed. Neither sandwich storage alternative reached a payback period due to high use phase impacts.
a.
b.
Fig. 5 Monte Carlo analysis results when reusable alternatives are washed after every use (Fig. 5a) and when the alternatives are washed after every other use (Fig. 5b). The legend depicts the various pay-
back period categories and represents the range of uses necessary to reach a breakeven point. Each figure shows the percent of trials in each payback period category

The International Journal of Life Cycle Assessment
1 3
5 Discussion
Results from this study can impact how producers and con-sumers move forward and reduce the environmental impacts associated with these common kitchenware products. The findings of this research should be used to understand what variables drive overall impact for both reusable and single-use products, and how these variables can influence payback period for reusable alternatives. The goal of this study was not to determine if single-use or reusable products were bet-ter or worse and should not be used in this way. Reusable alternatives and single-use products both have their strengths and weaknesses, and in any situation, environmental trade-offs will have to be made.
This is also true when looking within the two catego-ries of reusable and single-use. Not all reusable and not all single-use goods are created equally. Some products out-performed others in different environmental categories. For many product types, tradeoffs would have to be made when selecting which product to use.
This study only calculates the environmental payback periods associated with GWP, primary energy use, and water consumption. Additional environmental impacts are associ-ated with the production and use of kitchenware products. Notably, concerns surrounding single-use plastic pollution are one of the main drivers associated with an increased emphasis on reusable kitchenware products. Incorporation of marine plastic pollution represents numerous challenges and impacts to the LCA community (Andrady 2011; Vince and Hardesty 2017), and the first methodological approach to including marine litter of microplastics into LCA is being developed (Saling et al. 2020). In the case of microplas-tic pollution, only plastic products are responsible for this particular impact, resulting in an inherent tradeoff between plastics and other materials with respect to physical dam-age to marine systems; therefore, attempts to calculate a payback period for microplastic pollution would be unpro-ductive since there will never be a breakeven point for this impact category, by definition. Similarly, for land-use, bio-based products such as paper straws or beeswax wrap would have disproportionally large payback periods compared to those made from other materials and calculation of payback period is not ultimately useful. The tradeoffs of these kinds of impacts must ultimately be evaluated against one another.
Future research should focus on modeling processes for dif-ferent environmental indicators, such as the amount of waste to landfill, ecotoxicity, eutrophication, and acidification poten-tial, in order to better understand the overall environmental impact. For consumers in water stressed regions, it may be desirable to include additional calculations of water availabil-ity and criticality, which will likely highlight the importance of dishwashing in the payback period of water impact.
For the single-use products, it can be seen that overall impacts, especially GWP, are sensitive to the material and manufacturing phase. For these products, a large part of sustainability efforts should be manufacturers focusing on optimization of the production process. After the material and manufacturing phase, the second largest contributor was EoL disposal. Improving this phase to minimize impacts will take a joint effort between producers and consum-ers. Producers should research which disposal option will reduce their product’s lifetime impact and then assure that this disposal method is accessible for consumers. It is then up to consumers to properly dispose of these products. This study did not consider leakage of products to the ecosystem, which can occur when locations do not have appropriate solid waste management infrastructure.
One of the main findings of this research is that the use phase is the key driver of overall impact of reusable alterna-tives, especially when discussing GWP. Producers of reus-able alternatives should advocate for integration of renewa-bles into the energy grid, and for innovation on efficiency of dishwashers in order to reduce their product’s lifetime impact. Throughout this study, typical washing behavior for both machine and manual washing was modeled. Other research has suggested that use phase impacts associated with dishwashing can be minimized by practicing optimal loading, using rinse aid and high-quality detergent packs, and cleaning the interior of the machine periodically. Best practices for manual washing include using a two-basin method, where dishes are soaked and scrubbed in hot water, then rinsed in cold water, and lastly air-dried (Porras et al. 2020). Producers should help to educate the public on the environmental impact of these behavior changes, while con-sumers should focus on adopting these best practices.
Additionally, results showed that not washing after every use can have a large impact on payback period and makes reusable alternatives more favorable. Although there might be hesitation due to societal perception of personal cleanliness of washing less frequently, a study actually found that average washing fre-quency in an office ranged from one to ten mug uses, with four uses being the average (Ligthart and Ansems 2007). This study did not explore hygienic implications of not washing products after every use but recognizes choosing not to wash is depend-ent on the amount of food particulate matter that is leftover on the product and therefore is not always feasible.
Similar logic can also be applied to the single-use prod-ucts. Reusing items intended for single-use without washing in between would effectively cut emissions per use in half. This would cause the payback period for reusable alterna-tives to significantly increase and would make it more dif-ficult for these alternative products to be favorable.
It is also important to point out that the study assumes that consumers use the product until the end of its useful life.

The International Journal of Life Cycle Assessment
1 3
If a consumer loses or replaces the reusable before the req-uisite number of uses to break even, this will also increase impact.
Consumers should also determine the actual need for the product. In terms of the 3Rs, with reduce being the most important, if a consumer can reduce overall consumption of a specific kind of product, they can also reduce overall envi-ronmental impacts. For example, while some people need and benefit from straws, other consumers could consider not using a straw whatsoever.
In terms of consumer choice between reusable and sin-gle uses, this research found that, although some reusable alternatives were able to have lower impacts per use than their single-use counterpart, not all broke even within their lifetime. As a consumer, this means reusable is not always the best option and that there is more nuance to single-use products than a default assumption that reusable is always better (Miller 2020). Doing research before you purchase a new alternative can reduce your personal environmental impact, though relative to food consumption choices, trans-portation emissions, and overall household energy use, the environmental impacts of the kitchenware products analyzed in this study are likely small.
Additionally, because the dishwashing emission factor was the largest driver of the GWP, it is important to rec-ognize that researchers of this study chose to model typical washing behavior and found allocation on an cm2 dish being washed to be the most representative. These assumptions inherently influence overall results. Other options for alloca-tion could be by mass, footprint in the dishwasher, or time it takes to wash. Each of these allocation factors might favor one product type. For example, both sandwich storage alter-natives had surface areas of over 1290 cm2, compared to the average coffee cup size of 877 cm2, average straw size of 82 cm2, and average fork size of 21 cm2. Both of these alterna-tives generally had the most difficulty reaching a payback period. Allocating on a different factor unit such as time to wash may reduce use phase impacts for sandwich stor-age but increase use phase impacts for straws, since it can be difficult to wash the inside. Future studies could explore how modeling best practices or changing allocation factor impact overall results.
6 Conclusion
Overall, the study concludes that reusable alternatives have the ability to pay back the environmental impacts associated with their more environmentally intensive materials and use phase impacts, but it is highly dependent on number of uses, consumer behavior, product material, and dishwash-ing. These results were consistently seen in initial impact calculations, the Monte Carlo Analysis and sensitivity
analysis, as well as supported by other peer-reviewed stud-ies. The findings from this study should be used to minimize environmental impacts associated with these product types.
For the single-use products, it was determined that the material and manufacturing phase was the largest contribu-tor to overall impact. Further analysis also showed that GWP specifically was the most sensitive to the material and man-ufacturing emission factor, followed by disposal emission factor. Other studies on single-use products have also found similar results on the factors that influence the GWP.
On the other hand, impacts for reusable products were initially dominated by the material and manufacturing phase, but after usage increased, the use phase quickly became the largest contributor. The large impact of the use phase could be seen when determining payback period for GWP, which was found to decrease significantly as frequency of washing was also decreased. Additionally, during the sensitivity anal-ysis, results showed that emissions for reusable products were highly sensitive to changes in dishwashing emission factor.
A key takeaway from this study is that consumer behavior does have an impact and can help minimize overall envi-ronmental impacts associated with kitchenware products. For reusable products, many of the most impactful behavior changes will occur in the use phase. The list below quickly summarizes actions consumers can take to reduce their foot-print associated with reusable products:
1) Do not always assume reusable is the best option. There is a great deal of nuance to the perception that reusable products have less impact than single-use products. In some cases, the impact of washing a reusable product is greater than the life cycle impacts of a single-use prod-uct.
2) For products that do break even, extend product lifetime. The more times you use a product, the smaller your foot-print.
3) Research products before purchase, since not all reusable alternatives are equal. Some have larger impacts than others.
4) In the case of typical washing behavior, give preference to machine washing over manual washing. Best practice behaviors that can reduce use phase impacts for machine washing include completely filling the dishwasher, buying energy efficient appliances, and not pre-rinsing dishes. For manually washing, try using a two-basin dishwashing method.
5) Try not to wash products after every use if practical. For example, if you are having plain black coffee or tea, do a quick rinse of your mug/cup and use again the next day.
6) Advocate for integration of renewables into your local energy grid. The lower the carbon intensity and primary nonrenewable energy use of the grid, the lower the envi-ronmental impact of dishwashing.

The International Journal of Life Cycle Assessment
1 3
And lastly, the best consumption is no consumption. Minimizing consumer purchasing minimizes overall envi-ronmental footprint.
Supplementary information The online version contains supplemen-tary material available at https:// doi. org/ 10. 1007/ s11367- 021- 01946-6.
Acknowledgements The authors would like to thank Geoffrey Lewis for his frequent guidance on LCA, Greg Keoleian, for his insight and feedback, along with everyone else at the Center for Sustainable Sys-tems for their support.
Data availability All data generated or analyzed during this study are included in this published article (and its supplementary information files).
References
Accorsi R, Cascini A, Cholette S, Manzini R, Mora C (2014) Eco-nomic and environmental assessment of reusable plastic con-tainers: a food catering supply chain case study. Int J Prod Econ 152:88–101
Allocation Cut-off by Classification. Cut-Off system model. www. ecoin vent. org/ datab ase/ system- models- in- ecoin vent-3/ cut- off- system- model/ alloc ation- cut- off- by- class ifica tion. html
Alton CC, Underwood PB (2003) Let us make impact assessment more accessible. Environ Impact Asses 23(2):141–153. https:// doi. org/ 10. 1016/ S0195- 9255(02) 00093-8
Andrady AL (2011) Microplastics in the marine environment. Mar Pollute Bull 62(8):1596–1605. https:// doi. org/ 10. 1016/j. marpo lbul. 2011. 05. 030
Bisinella V, Albizzati PF, Astrup TF, Damgaard A (2018) Life cycle assessment of grocery carrier bags. Danish Environmental Protec-tion Agency, Copenhagen
Blanca-Alcubilla G, Bala A, de Castro N, Colomé R, Fullana-i-Palmer P (2020) Is the reusable tableware the best option? Analysis of the aviation catering sector with a life cycle approach. Sci Total Envi-ron 708:135121. https:// doi. org/ 10. 1016/j. scito tenv. 2019. 135121
Boesen S, Bey N, Niero M (2019) Environmental sustainability of liquid food packaging: is there a gap between Danish consumers’ perception and learnings from life cycle assessment? J Clean Prod 210:1193–1206. https:// doi. org/ 10. 1016/j. jclep ro. 2018. 11. 055
Bole R (2006) Life cycle optimization of residential clothes washer replacements (doctoral dissertation). http:// hdl. handle. net/ 2027. 42/ 36308
Bortolini M, Galizia FG, Mora C, Botti L, Rosano M (2018) Bi-objective design of fresh food supply chain networks with reusable and dis-posable packaging containers. J Clean Prod 184:375–388
Breiting S, Mogensen F (1999) Action competence and environmental education. Camb J Educ 29(3):349–353. https:// doi. org/ 10. 1080/ 03057 64990 290305
Brown N (2019) 20 cheap products to replace a whole bunch of dispos-able plastic. BuzzFeed, BuzzFeed. www. buzzf eed. com/ natal iebro wn/ cheap- use- less- dispo sable- single- use- plast ic
Cherif H, Belhadj J (2018) Environmental life cycle analysis of water desalination processes. In Sustainable desalination handbook (pp. 527–559). Butterworth-Heinemann. https:// doi. org/ 10. 1016/ B978-0- 12- 809240- 8. 00015-0
Chitaka TY, Russo V, von Blottnitz H (2020) In pursuit of environ-mentally friendly straws: a comparative life cycle assessment of five straw material options in South Africa. Int J Life Cycle Ass 25(9):1818–1832. https:// doi. org/ 10. 1007/ s11367- 020- 01786-w
Cottafava D, Costamagna M, Baricco M, Corazza L, Miceli D, Riccardo LE (2020) Assessment of the environmental break-even point for deposit return systems through an LCA analysis of single-use and reusable cups. Sustainable Production and Con-sumption 27:228–241
De Kleine R (2009) Life cycle optimization of residential air condi-tioner replacement (doctoral dissertation). http:// hdl. handle. net/ 2027. 42/ 64483
Edwards DC (Environmental A. (1998) Life cycle assessment of supermarket carrier bags: a review of the bags available in 2006. J Photoc Photobio B (Vol. 46). https:// doi. org/ 10. 1016/ S1011- 1344(98) 00196-1
Englishman KO (2020) 10 plastic-free kitchen essentials to help you go zero waste on a budget. The Good Trade, The Good Trade. www. thego odtra de. com/ featu res/ plast ic- free- kitch en- essen tials- on-a- budget
EPA (2019) Advancing sustainable materials management: facts and figures report. United States Environmental Protection Agency, (November). Retrieved from https:// www. epa. gov/ facts- and- Figur es- about- mater ials- waste- and- recyc ling/ advan cing- susta inable- mater ials- manag ement% 0A https:// www. epa. gov/ smm/ advan cing- susta inable- mater ials- manag ement- facts- and- Figur eures- report
Escamilla EZ, Habert G (2014) Environmental impacts of bamboo-based construction materials representing global production diversity. J Clean Prod 69:117–127
European Commission (2018) A European strategy for plastics in a circu-lar economy. COM(2018) 28 Final, SWD(2018)(1), 1–18. Retrieved from https:// ec. europa. eu/ envir onment/ circu lar- econo my/ pdf/ plast ics- strat egy. pdf
Franklin Associates (2018) Life cycle impacts of plastic packaging compared to substitutes in the United States and Canada: theo- retical substitution analysis. https:// www. plast icpac kagin gfacts. org/ wp- conte nt/ uploa ds/ 2018/ 11/ Life- Cycle- Impac ts- of- Plast ic- Packa ging- Compa red- to- Subst itutes- in- the- United- States- and- Canada. pdf
Franklin Associates (2011) Life cycle inventory of foam polystyrene, paper-based, and PLA food service products. Retrieved from https:// www. plast icfoo dserv icefa cts. com/ wp- conte nt/ uploa ds/ 2017/ 12/ Peer_ Revie wed_ Foods ervice_ LCA_ Study- 2011. pdf
Gallego-Schmid A, Mendoza JMF, Azapagic A (2019) Environmental impacts of takeaway food containers. J Clean Prod 211:417–427
Garrido N, Del Castillo MDA (2007) Environmental evaluation of single-use and reusable cups. Int J Life Cycle Ass 12(4):252–256. https:// doi. org/ 10. 1065/ lca20 07. 05. 334
Godfrey L (2019) Waste plastic, the challenge facing developing coun-tries—ban it, change it, collect it? Recycl 4(1):3. https:// doi. org/ 10. 3390/ recyc ling4 010003
Greene J (2011) Life cycle assessment of reusable and single-use plastic bags in California. California State University. Retrieved from https:// www. resea rchga te. net/ profi le/ Joseph_ Green e2/ publi cation/ 26829 7813_ Life_ Cycle_ Asses sment_ of_ Reusa ble_ and_ Single- use_ Plast ic_ Bags_ in_ Cal i f or nia / l inks / 556cc a2408 aeccd 7773b e900/ Life- Cycle- Asses sment- of- Reusa ble- and- Single- use- Plast ic- Bags- in- Calif ornia. pdf
Herberz T, Barlow C, Finkbeiner M (2020) Sustainability assessment of a single-use plastics ban Sustainability 12, no. 9: 3746
Horie YA (2004) Life cycle optimization of household refrigerator-freezer replacement. Center for Sustainable Systems
Huijbregts MAJ, Steinmann ZJN, Elshout PMF et al (2017) ReC-iPe2016: a harmonised life cycle impact assessment method at midpoint and endpoint level. Int J Life Cycle Assess 22:138–147. https:// doi. org/ 10. 1007/ s11367- 016- 1246-y
Insights Future Market (2019) Straw market is estimated to expand at a CAGR of nearly 6% during 2019 to 2029 - future market insights. PR newswire: news distribution, targeting and moni- toring. https:// www. prnew swire. com/ news- relea ses/ straw- market- is-
The International Journal of Life Cycle Assessment
1 3
estim ated- to- expand- at-a- cagr- of- nearly- 6- during- 2019- to- 2029-- future- market- insig hts- 30085 4913. html
International Organization for Standardization (2006) Environmental management — life cycle assessment — principles and framework (ISO/DIS Standard No. 14040). Retrieved from https:// www. iso. org/ stand ard/ 37456. html
International Organization for Standardization (2006) Environmental management — life cycle assessment — requirements and guide-lines (ISO/DIS Standard No. 14044). Retrieved from https:// www. iso. org/ stand ard/ 38498. html
Jensen BB, Schnack K (1997) The action competence approach in envi-ronmental education. Environ Educ Res 3(2):163–178. https:// doi. org/ 10. 1080/ 13504 62970 030205
Jolliet O, Margni M, Charles R, Humbert S, Payet J, Rebitzer G, Rosenbaum R (2003) IMPACT 2002+: a new life cycle impact assessment methodology. Int J Life Cycle Assess 8(6):324–330
Jung LW, Al-Shehhi MR, Saffarini R, Warshay B, Arafat HA (2011) Paper or plastic? Clearing misconceptions on environmental impacts of cof-fee cups using life cycle assessment (LCA). on Water, Energy and Environment 563
Keoleian GA, Spitzley DV (1999) Guidance for improving life-cycle design and management of milk packaging. J Ind Ecol 3(1):111–126
Kimmel ScD, Robert M (2014) Life cycle assessment of grocery bags in common use in the United States. Environ Stud 6 https:// tiger prints. clems on. edu/ cudp_ envir onment/6
Kitts K, and Maria C (2020) 13 Zero-Waste Kitchen Buys Under $20. HGTV www. hgtv. com/ lifes tyle/ clean- and- organ ize/ reusa ble- home- produ cts
Leighton M (2019) 24 Cheap and easy replacements for plastic in your home and kitchen. Business Insider, Business Insider www. busin essin sider. com/ house hold- plast ic- alter nativ es- eco- frien dly- 2018-8# washa ble- mesh- produ ce- bags-1
Ligthart TN, Ansems AMM (2007) Single-use cups or reusable (coffee) drinking systems: an environmental comparison. TNO, Apeldoorn
Madival S, Auras R, Singh SP, Narayan R (2009) Assessment of the environmental profile of PLA, PET and PS clamshell containers using LCA methodology. J Clean Prod 17(13):1183–1194
Market Insights Reports (2019) Green packaging market - growth, trends, and forecasts (2019 - 2024). Retrieved from https:// www. marke tinsi ghtsr eports. com/ repor ts/ 04021 169060/ green- packa ging- market- growth- trends- and- forec asts- 2019- 2024
Milà‐i‐Canals L, Lewis Y, Notten P, Virdin J, Chiaroni-Clarke R, Gerrard J, Pye T (2020) Addressing single-use plastic products pollution using a life cycle approach. Life Cycle Initiative. https:// www. lifec yclei nitia tive. org/ wp- conte nt/ uploa ds/ 2020/ 10/ Webin ar- SUPP- Series- A- Webin ar-1- 6- Octob er. pdf
Miller SA (2020) Five misperceptions surrounding the environmental impacts of single-use plastic. Environ Sci Technol. https:// doi. org/ 10. 1021/ acs. est. 0c052 95
Openbare Afvalstoffenmaatschappij voor het Vlaamse Gewest (2006) Comparative LCA of 4 types of drinking cups used at events. Retrieved from https:// www. natur ework sllc. com/ ~/ media/ Files/ Natur eWorks/ What- is- Ingeo/ Why- it- Matte rs/ LCA/ OVAM_ Cup_ Compa rativ eLCA_ FullR eport_ 0206_ pdf. pdf
Owens JW (2001) Water resources in life-cycle impact assessment: considerations in choosing category indicators. J Ind Ecol 5(2):37–54
Pigné Y, Gutiérrez TN, Gibon T et al (2020) A tool to operational-ize dynamic LCA, including time differentiation on the complete background database. Int J Life Cycle Assess 25:267–279. https:// doi. org/ 10. 1007/ s11367- 019- 01696-6
Porras GY, Keoleian GA, Lewis GM, Seeba N (2020) A guide to household manual and machine dishwashing through a life cycle
perspective. Environ Res Commun 2(2):021004. https:// doi. org/ 10. 1088/ 2515- 7620/ ab716b
Postacchini L, Bevilacqua M, Paciarotti C, Mazzuto G (2016) LCA methodology applied to the realisation of a domestic plate: con-frontation among the use of three different raw materials. Int J Prod Qual Manag 18:325–346
Razza F, Fieschi M, Degli Innocenti F, Bastioli C (2009) Compostable cutlery and waste management: an LCA approach. Waste Manage 29(4):1424–1433
Ro L (2020) The best products for a sustainable kitchen, according to experts. The Strategist, The Strategist, nymag. com/ strat egist/ artic le/ best- eco- frien dly- susta inable- kitch en- items- reusa ble. html
Robelia BA, Greenhow C, Burton L (2011) Environmental learning in online social networks: adopting environmentally responsible behaviors. Environ Educ Res 17(4):553–575. https:// doi. org/ 10. 1080/ 13504 622. 2011. 565118
Saling P, Gyuzeleva L, Wittstock K, Wessolowski V, Griesshammer R (2020) Life cycle impact assessment of microplastics as one compo-nent of marine plastic debris. Int J Life Cycle Ass 25(10):2008–2026
Saouter E, Andreasent I (2006) Costs and benefits of communicating product safety information to the public via the internet. Itegr Envi-ron Asses 2(2):191–195. https:// doi. org/ 10. 1002/ ieam. 56300 20212
Schnurr RE, Alboiu V, Chaudhary M, Corbett RA, Quanz ME, Sankar K, Walker TR (2018) Reducing marine pollution from single-use plastics (SUPs): a review. Mar Pollut Bull 137:157–171. https:// doi. org/ 10. 1016/j. marpo lbul. 2018. 10. 001
Spitzley DV, Grande DE, Keoleian GA, Kim HC (2005) Life cycle opti-mization of ownership costs and emissions reduction in US vehi-cle retirement decisions. Transport Res D-Tr E 10(2):161–175. https:// doi. org/ 10. 1016/j. trd. 2004. 12. 003
Steenis ND, van Herpen E, van der Lans IA, Ligthart TN, van Trijp HC (2017) Consumer response to packaging design: the role of packaging materials and graphics in sustainability perceptions and product evaluations. J Clean Prod 162:286–298. https:// doi. org/ 10. 1016/j. jclep ro. 2017. 06. 036
Takou V, Boldrin A, Astrup TF, Damgaard A (2019) LCA of single use plastic products in Denmark
UNEP (2018) Single-use plastic: a roadmap for sustainability. United Nation Environment Programme
UNEP (2020) Single-use plastic bags and their alternatives. Recom-mendations from Life Cycle Assessments 76
U.S. Department of Transportation (DOT) & Bureau of Transportation Statistics (2017) Freight Facts and Figures
van der Harst E, Potting J (2013) A critical comparison of ten dispos-able cup LCAs. Environ Impact Asses 43:86–96. https:// doi. org/ 10. 1016/j. eiar. 2013. 06. 006
Vince J, Hardesty BD (2017) Plastic pollution challenges in marine and coastal environments: from local to global governance. Restor Ecol 25(1):123–128
Vivian S, Haslam K, Soldner M, Sangster M (2011). Assessment of European energy and carbon profiles of manual and automatic dishwashing. Int J Consum Stud, 35(2), 187–193
Wells K (2019) How to break your single-use plastics habit. The New York Times, The New York Times. www. nytim es. com/ 2019/ 04/ 16/ smart er- living/ wirec utter/ stop- using- single- use- plast ics. html
Woods L, Bakshi BR (2014) Reusable vs. disposable cups revisited: guidance in life cycle comparisons addressing scenario, model, and parameter uncertainties for the US consumer. Int J Life Cycle Ass, 19(4), 931–940. https:// doi. org/ 10. 1007/ s11367- 013- 0697-7
Publisher’s Note Springer Nature remains neutral with regard to jurisdictional claims in published maps and institutional affiliations.