epa virtual national biosolids meeting 2020
TRANSCRIPT

EPA VIRTUAL NATIONAL BIOSOLIDS MEETING 2020
December 8-10, 2020
1

Welcome to the EPA National Biosolids Meeting
2
Elizabeth Resek, EPA Biosolids Lead
Deborah Nagle, Office Director, EPA Office of
Science and Technology
Betsy Behl,Division Director, EPA Health
and Ecological Criteria Division

Participating Effectively via Teams
• To reduce background noise, please be on mute unless speaking
• If you would like to jump into the conversation, please let us know
by “raising your hand” or submitting a chat
• Please show your video when you are speaking
3
Raise your handOpen chatMute/unmute
Show your video

Before We Get Started…
• Please submit into the chat the name of the organization you are representing
• If you have never used MS Teams, please practice ‘raising your hand’ when you are done
4
Raise/Lower your handOpen chat

Participating Effectively via Teams
• Once the meeting has ended, the chat log will remain in your MS Teams interface. We will not be revisiting chat for follow-up questions.
• Please email any questions following the meeting to: [email protected]
• This meeting will not be recorded
5

How many years have you worked in the biosolids field?
• Less than 5 years
• 5 to 10 years
• 10 to 20 years
• 20 to 30 years
• More than 30 years
6

Looking at the participant list, how many names do you recognize?
• Less than 5
• 5 to 10
• 10 to 20
• 20 to 30
• More than 30
7

What are you hoping to learn/hear/get from this meeting?
Please enter your response via chat
8

Important Logistics for the 3 days of meetings
• 3 half day meetings with break. The first and third days will be plenary. Day 2 will be all in breakout sessions.
• You should have received a calendar invite from Heather Christopher from Ross Strategic. In the body of that email are the logistics for the meeting.
• You can always find the logistics for the meeting at: http://www.rossstrategic.com/nationalbiosolidsmeeting
• You will receive an email from me every evening with the link and the plan for the following day.
• Plan for today . . .
9

EPA BIOSOLIDS PROGRAM OVERVIEWELIZABETH RESEK, US EPA
TESS RICHMAN, US EPA
10

U.S. Environmental Protection Agency Biosolids Program
Elizabeth Resek, Biosolids Lead
Office of Water, Office of Science and Technology
Health and Ecological Criteria Division
December 2020 EPA National Biosolids Meeting 2020 11
Meeting CWA Requirements
December 2020 EPA National Biosolids Meeting 2020 12
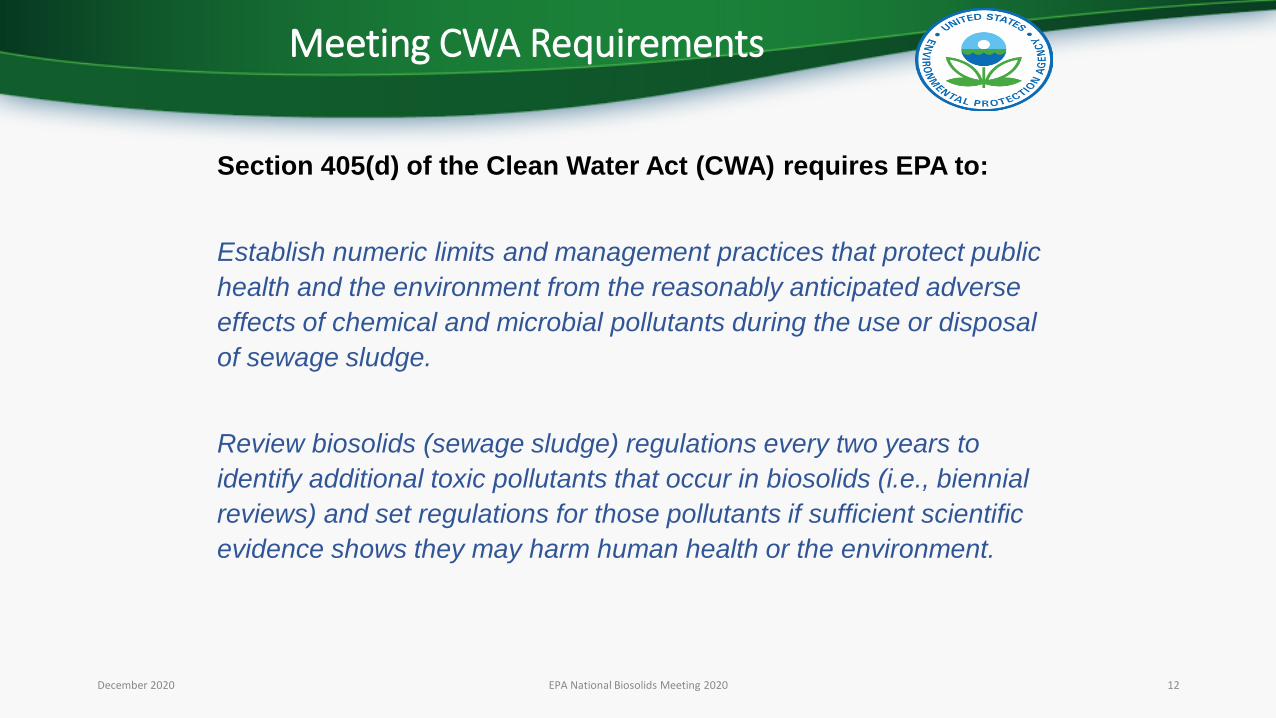
Section 405(d) of the Clean Water Act (CWA) requires EPA to:
Establish numeric limits and management practices that protect public
health and the environment from the reasonably anticipated adverse
effects of chemical and microbial pollutants during the use or disposal
of sewage sludge.
Review biosolids (sewage sludge) regulations every two years to
identify additional toxic pollutants that occur in biosolids (i.e., biennial
reviews) and set regulations for those pollutants if sufficient scientific
evidence shows they may harm human health or the environment.

Meeting CWA Requirements
Biennial Reviews
➢Review publicly available information on occurrence, fate and transport in the environment, human health and ecological effects, and other relevant information for pollutants found in biosolids.
➢Data may be used to conduct risk screens and refined risk assessments for pollutants found in biosolids.
➢Biosolids Biennial Report No.8 (reporting period 2018-2019) anticipated release end of 2020. https://www.epa.gov/biosolids/biennial-reviews-sewage-sludge-standards
December 2020 EPA National Biosolids Meeting 2020 13

Meeting CWA Requirements
Biosolids List in EPA’s CompTox Chemicals Dashboard
➢Biosolids List in EPA’s publicly available CompTox Chemicals Dashboardwas curated from past biennial reviews and sewage sludge surveys representing the Agency’s understanding of chemicals found in biosolids. https://comptox.epa.gov/dashboard/chemical_lists/BIOSOLIDS
➢CompTox Chemicals Dashboard primer videos: https://www.epa.gov/chemical-research/comptox-chemicals-dashboard-primer-videos
December 2020 EPA National Biosolids Meeting 2020 14

Meeting CWA Requirements
December 2020 EPA National Biosolids Meeting 2020 15

Stakeholder Engagement
Biosolids Webinar Series➢Kicked-off in Fall 2019.
➢Register for future webinars on EPA’s biosolids website: https://www.epa.gov/biosolids
EPA Biosolids Website➢Completely overhauled and launched in July 2020.
EPA Commitment to Continued Engagement➢Participation in stakeholder-led meetings and calls.
➢Follow-up to December 2020 meeting.
December 2020 EPA National Biosolids Meeting 2020 16

Additional Activities
National Defense Authorization Act Interim Guidance on Destruction and Disposal of PFAS and PFAS-Containing Materials➢EPA Biosolids Team participated on Agency-wide workgroup.
➢Effort led by EPA Office of Land and Emergency Management.
➢Due January 2021.
Resource Recovery➢A consistent process for evaluating products derived from sewage sludge
that are intended for land application is needed.
➢40 CFR Part 503 does not consider or anticipate current and future innovative resource recovery technologies and products.
➢Work in this area is ongoing.
December 2020 EPA National Biosolids Meeting 2020 17

COVID
EPA Statement on Biosolids Land Application (Spring 2020)
Existing requirements and guidance help ensure that biosolids are processed, handled, and land-applied in a manner than minimizes the risk of exposure to
pathogens, including viruses. We have no evidence that biosolids contain infectious SARS-CoV-2 virus when requirements under 40 CFR part 503 are met
for Class A biosolids. Generally, pathogens may exist when requirements are met under 40 CFR part 503 for Class B biosolids, which is why EPA’s site restrictions
that allow time for pathogen degredation should be followed for harvesting crops and turf, for grazing of animals, and public contact. All requirements under 40 CFR part 503 should continue to be met. Additionally, per CDC’s Guidance for
Controlling Potential Risks to Workers Exposed to Class B Biosolids, employers should prevent work-related illness by providing proper personal protective
equipment (PPE) and supporting other health and safety practices for persons hauling and land applying biosolids. While no additional COVID-19–specific protections are recommended for the land application of biosolids, consider
checking for advisories from your local health department.
December 2020 EPA National Biosolids Meeting 2020 18

Thank You!
Biosolids Team
Liz Resek, Lead [email protected]
Elyssa Arnold [email protected]
Tess Richman, ORISE Fellow [email protected]
Lauren Questell, ORISE Fellow [email protected]
December 2020 EPA National Biosolids Meeting 2020 19

UPCOMING RESEARCH SNAPSHOTS
Placeholder for instruction slides/session framing
21

Upcoming Research Snapshots
• EPA Office of Research and Development (Christopher Impellitteri, EPA ORD)
• Water Research Foundation (Ashwin Dhanasekar, WRF)
• NEBRA (Janine Burke-Wells, NEBRA)
• W4170 (Maria Lucia Silveira, UFL & Nicholas Basta, OSU)
22

Office of Research and Development
EPA-OST Virtual
Biosolids Workshop
December 8, 2020
Biosolids Research OverviewChristopher A. Impellitteri, EPA-ORD

Biosolids Research Projects
Inform the update to the “Environmental Regulations and Technology: Control of Pathogens and Vector Attraction in Sewage Sludge" report (EPA/625/R-92/013).
Pathogen
and Vector
Attraction
Reduction
Evaluate types and prevalence of antibiotic resistant bacteria (ARB) and antibiotic resistance genes (ARGs) in biosolids to inform management strategies.
ARBs
and ARGs
Application of non-targeted analysis to municipal wastewater and residuals and method development and evaluation of CECs in wastewater and biosolids.
Emerging
Contaminants
(CECs)24

Biosolids Research Projects
Development and validation of a PFAS isotope dilution method for biosolids.• Collaboration with DoD• 40 different PFAS• Single validation data collection is complete
PFAS
Analytical
Methods
Research on the occurrence, fate, and transport of PFAS in wastewater treatment plants and biosolids. Identify sources and evaluate pretreatment strategies.
PFAS
Prevalence
and
Pretreatment
Treatment strategies for biosolids, including incineration and pyrolysis.
Treatment
Strategies25
Biosolids Research Projects
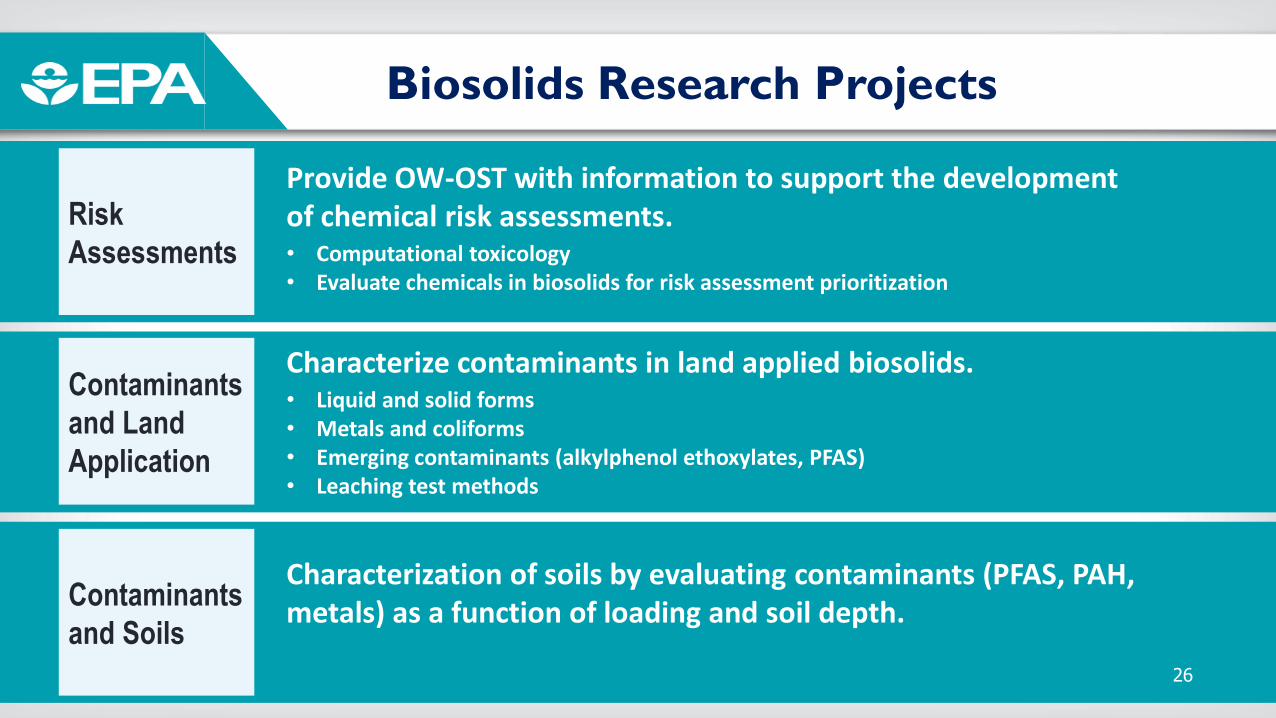
Provide OW-OST with information to support the development of chemical risk assessments.• Computational toxicology• Evaluate chemicals in biosolids for risk assessment prioritization
Risk
Assessments
Characterize contaminants in land applied biosolids.• Liquid and solid forms• Metals and coliforms• Emerging contaminants (alkylphenol ethoxylates, PFAS)• Leaching test methods
Contaminants
and Land
Application
Characterization of soils by evaluating contaminants (PFAS, PAH, metals) as a function of loading and soil depth.
Contaminants
and Soils
26

Biosolids-Related Research Grants
27
Open National Priorities RFA (Closes January 5, 2021): Evaluation of Pollutants in Biosolids
Awarded Grants: Practical Methods to Analyze and Treat Emerging Contaminants (PFAS) in Solid Waste, Landfills, Wastewater/Leachates, Soils, and Groundwater to Protect Human Health and the Environment
Awarded National Priorities Grants: Research on PFAS Impacts in Rural Communities and Agricultural Operations

Based on future occurrence evaluations, assess the fate and transport of emerging contaminants (including PFAS) in land-applied biosolids.
Examine the destruction of emerging contaminants in alternative biosolids management processes (e.g., thermal treatment).
Develop frameworks for emerging contaminant risk management in agriculture (e.g., reducing plant uptake).
Characterize biochar derived from the pyrolysis of biosolids and develop frameworks for beneficial use.
Compare/contrast pyrolysis and alternative technologies (e.g., E-Beam) with existing management strategies using lifecycle assessment approaches.
Assess microbial contamination of surface and groundwater after land application of biosolids.
Research Gaps
28

Contact
Chris Impellitteri, Ph. D.Associate National Program DirectorSafe and Sustainable Water Resources Research ProgramUS EPA Office of Research and Development 26 West Martin Luther King DriveCincinnati, OH 45268
[email protected](513) 487-2872
The views expressed in this presentation are those of the individual author and do not necessarily reflect the views and policies of the US EPA.
29

© 2020 The Water Research Foundation. ALL RIGHTS RESERVED. No part of this presentation may be copied, reproduced, or otherwise utilized without permission.
Biosolids: Upcoming Research Snapshot
Ashwin Dhanasekar

© 2020 The Water Research Foundation. ALL RIGHTS RESERVED. 31
MISSION
Advancing the science of water to improve the quality of life
VALUES
Integrity • Leadership • Respect
Innovation • Collaboration
ABOUT
VISION
To create the definitive research organization to advance the science of all things water to better meet the evolving needs of subscribers and the water sector

© 2020 The Water Research Foundation. ALL RIGHTS RESERVED. 32
WRFs research benefits all areas of the water sector, as well as agriculture, energy, watershed management, and other commercial industries.
One Water

© 2020 The Water Research Foundation. ALL RIGHTS RESERVED. 33
1034 UTILITIES 89 CONSULTANTS39 MANUFACTURERS
291Co-funded
projects
172Co-funders
IN
4Federal/State Grants
1Federal Contracts
$132 MillionContractually Funded Research
$78 millionCash
$54 millionCost Share
323Active Projects
SU
BS
CR
IB
ER
S
F U N D E D R E S E A R C H
R E S E A R C H P O R T F O L I O
The Water Research Foundation operates and affects change on 6 continents
RESEARCH PRIORITIES
Nutrients
Harmful Algal Blooms (HABs)
Integrated Water Management
Infrastructure
Resiliency
Lead & Copper
Energy Efficiency
PFAS & Constituents of Emerging Concern
Unsolicited Research
Grants/Awards
Facilitated Research
P R O G R A M S
Paul L. Busch Award
Research Priority
Tailored Collaboration
Emerging Opportunities
WRF AT A GLANCE

© 2020 The Water Research Foundation. ALL RIGHTS RESERVED. 34
WRF Research Programs

© 2020 The Water Research Foundation. ALL RIGHTS RESERVED. 35
Background
• The last Biosolids Research Summit was in 2003.
• There are tons of new advances in the world of Biosolids since then.
• EPA submitted a report in 2019 claiming a need for risk assessment on 352 constituents.
• This is/was impacting utilities and how they can use their biosolids.
• WRF has had bits and pieces of research covering Biosolids.
• WRF stepped up to hold a focused research summit to identify key research needs.

© 2020 The Water Research Foundation. ALL RIGHTS RESERVED. 36
Goals of the Summit
Develop a long term 5-year research plan
Prioritize research needs and develop project concepts
Identify research partners to provide in-kind support and/or funding
Identify volunteers to serve on the WRF Research Advisory Committee
Conclude with clear next steps

© 2020 The Water Research Foundation. ALL RIGHTS RESERVED. 37
WRF Biosolids Research Summit

© 2020 The Water Research Foundation. ALL RIGHTS RESERVED. 38
Research Needs

© 2020 The Water Research Foundation. ALL RIGHTS RESERVED. 39
Key Takeaways from Research Summit
Share the Knowledge
Better pooling of research to combat misinformation
Share, condense and disseminate
Keep the conversation going
Localize Research
Local research, outreach and support local gatekeepers
Buy-in and encourage staff pride for Biosolids products
Address CECs as a whole
Develop protocols/tools to address emerging contaminants as a whole

© 2020 The Water Research Foundation. ALL RIGHTS RESERVED. 40
Objectives
To improve the economic value and sustainability of products that represent 95% of our mass and a third of our cost for our community’s water and wastewater services.
Summarize known benefits and long-term successful reuse enterprises as case studies.
Quantify factors of interest that are currently lacking data (soil health, risk assessment of contaminants, customer demands/expectations).

© 2020 The Water Research Foundation. ALL RIGHTS RESERVED. 41
Next Steps
• The AC will keep prepping the Research Area for a 2021 launch.
• The project concepts will get ranked and prioritized based on current developments.
• Till the RAC approves the AC, staff will be pursuing other opportunities, if any, to continue research.

© 2020 The Water Research Foundation. ALL RIGHTS RESERVED. 42
Advisory Committee
• John Willis Brown & Caldwell (RAC Liaison)
• Karri Ving SFPUC
• Nick Basta OSU
• Patrick Dube WEF
• Matt Seib MMSD
• Joshua Cheng CUNY
• Greg Kester CASA
• Erica McKenzie Temple U
• Maile Lono-Batura NW Biosolids
WRF Staff
• Stephanie Fevig, Research Program Manager
• Ashwin Dhanasekar, Research Program Manager

nebiosolids.org
Research SnapshotsNorth East Biosolids & Residuals Association
Small non-profit created in 1997 with mission to cooperatively promote the
environmentally sound recycling or beneficial use of water, wastewater, and other
residuals in the Northeast, New England and eastern Canada
Other regional associations/collaborators include Northwest Biosolids Association,
Mid-Atlantic Biosolids Association, Virginia Biosolids Council and the newest South
East Biosolids Association; California Association of Sanitation Agencies
Research Committees – NWBA’s is the best! https://nwbiosolids.org/whats-
happening/resource-library
NEBRA can be nimble! https://www.nebiosolids.org/why-biosolids-organizations-are-
needed

nebiosolids.org
The National Biosolids Data Project 2018 data
The 2nd compilation of biosolids nationwide & by states; first compilation published in 2007 reporting 2004 data
Team includes NEBRA, CASA, NW Biosolids, BioCycle, MABA
Literature review & methods completed in spring, thanks to a cooperative agreement with EPA Region 4
Funding for current project from diverse organizations nationwide
Final report planned for end of March 2021; peer-review publication to follow
2 separate surveys: State Coordinators & WRRFs
The State Survey is here: https://www.surveymonkey.com/r/NBDPStateSurvey7Oct2020
The NBDP Webpage: https://www.nebiosolids.org/national-biosolids-survey-2018-data
nebiosolids.org
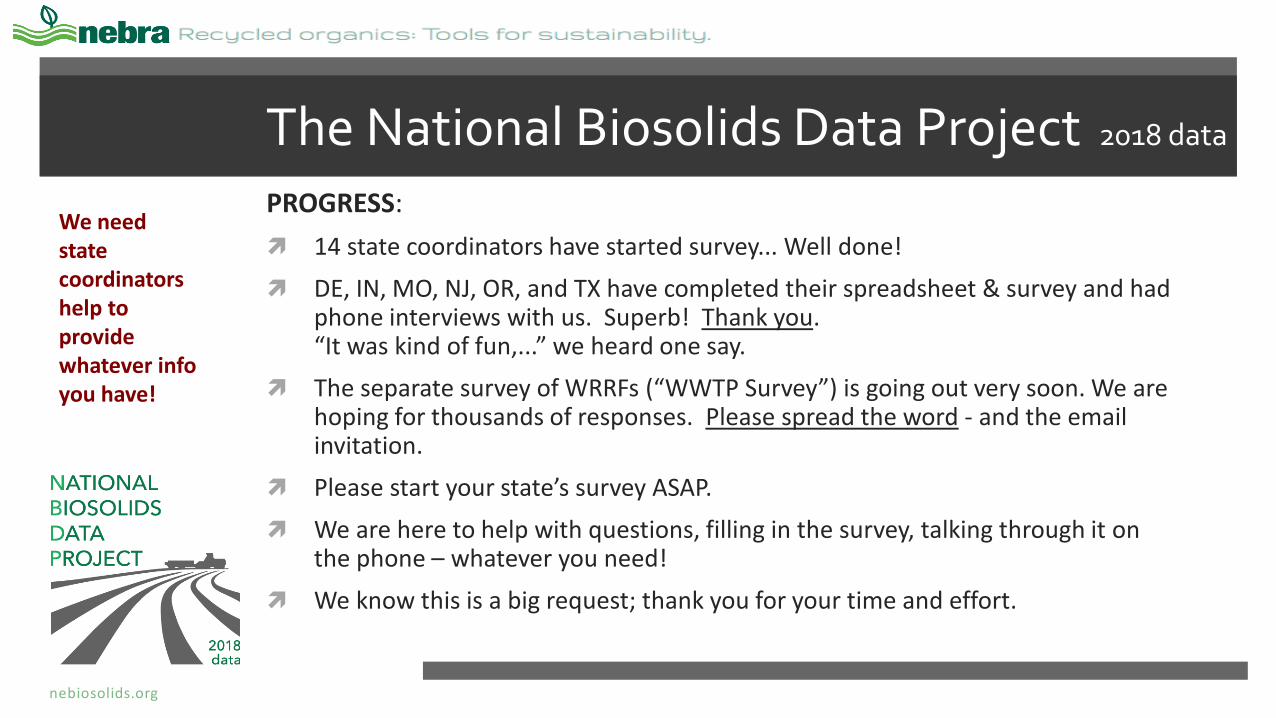
The National Biosolids Data Project 2018 data
PROGRESS:
14 state coordinators have started survey... Well done!
DE, IN, MO, NJ, OR, and TX have completed their spreadsheet & survey and had phone interviews with us. Superb! Thank you.“It was kind of fun,...” we heard one say.
The separate survey of WRRFs (“WWTP Survey”) is going out very soon. We are hoping for thousands of responses. Please spread the word - and the email invitation.
Please start your state’s survey ASAP.
We are here to help with questions, filling in the survey, talking through it on the phone – whatever you need!
We know this is a big request; thank you for your time and effort.
We need state coordinators help to provide whatever info you have!

nebiosolids.org
Support from biosolids leaders nationwide

nebiosolids.org
PFAS Cost Impacts on Utilities and Biosolids Management
Average biosolids management cost increased by 37%
Beneficial reuse programs experience the most significant cost impacts due to PFAS
29 entities surveyed; 9 detailed case studies
Chapter on emerging technologies
Available on WEF, NACWA, and NEBRA websites https://www.nebiosolids.org/pfas-biosolids

nebiosolids.org
Cost Study Qualitative Results on PFAS Challenges

nebiosolids.org
Member Research Interests and Other Initiatives
PFAS fate & transport modeling for Maine soils (Stone Environmental)
Webinars on innovative solids handling solutions for PFAS
NW Biosolids: GHG Calculator https://bggc.nwbiosolids.org/
CASA: restoring fire-ravaged land with biosolids https://casaweb.org/renewable-resources/biosolids/
Carbon sequestration in soils with biosolids
Nutrient recycling/recovery from wastewater
Reducing greenhouse gas emissions/
improving carbon sequestration using
biosolidsPFAS in wastewater and biosolids
Improving the quality of compost
and other agricultural soil
amendments using biosolids
Energy production/resource
recovery from wastewater solids
Research Topic of Most Interest to NEBRA Members10/29/20 survey

nebiosolids.org
Thank You for your Attention!
Questions?
Contact: [email protected]
(603) 323-7654http://www.nebiosolids.org

USDA NIFA Multistate Research Project
W4170- Beneficial Use of Residuals to Improve Soil Health and Protect Public, and
Ecosystem Health
EPA Virtual Biosolids Meeting
December 8, 2020
Maria Silveira –Professor of Soil and Water Science, Univ. of Florida
Nicholas Basta – Professor of Soil and Environmental Science, Ohio State Univ.

Multistate Research Project
The Land-Grant universities were established with passage of the Morrill Act in 1862
Research focus on agricultural and mechanical research but land-grant institutions now
address many academic fields (aquatic, urban, space, and sustainable energy research)
The Hatch Act of 1887 – Multistate Research Fund - provided the framework for funding
agricultural research at land-grant institutions. Led to establishment of State Agricultural
Experiment Stations (SAES) associated with 1862 Institutions
▪ Research focuses on a specific and important problem of concern to more than
one state
▪ Collaborative team effort in which the scientists are mutually responsible for
designing and conducting the research, and accomplishing the objectives
▪ Multiple disciplines participate in the research

W170 Regional Project Contribution to Biosolids Research
Timeline:
- Early 1970’s: a biosolids project started in the North Central Region (NC-118 “Utilization and disposal of municipal, industrial and agricultural processing wastes) to evaluate the agronomic impacts of land applying biosolids
- 1972: Western Region Project W-124 "Soil as a waste treatment system” focused on similar objectives
- 1977: the NC-118 and W-124 projects reorganized as W-124 “Optimum utilization of sewage sludge on land”
- 1985: the project it was renewed as W-170 “Chemistry and bioavailability of waste constituents in soils”
▪ A key study by this group was the regional experiment with Chicago biosolids that was replicated at several locations in the U.S.
▪ W170 provided research data and risk assessment support to develop risk based guidelines (Tables 2, 3, 4) in Part 503 1993 rule

W-170 Peer Review of the 503 Risk Assessment
and Draft Rules
A group of EPA, W-170 scientists, and other specialists engaged in
revision of the technical basis for the 503 rule
The focus of the review was the data sets and mathematical models
used to evaluate exposure pathways, most exposed individuals, and
health and environmental effects
The revised numbers were then submitted to the rule writers for their
consideration
The final rule was published on February 19, 1993

Timeline:
- 1985-1999: W-170 “Chemistry and bioavailability of waste constituents in soils”.
Renamed in 2004 (W-1170 “Chemistry, bioavailability, and toxicity of constituents in
residuals and residual-treated soils”
- 2009: W-2170 “Soil-based use of residuals, wastewater and reclaimed water”
- 2014: W-3170 “Beneficial reuse of residuals and reclaimed water: Impact on soil
ecosystem and human health”
- 2019: W-4170 “Beneficial Use of Residuals to Improve Soil Health and Protect
Public, and Ecosystem Health”
W170 Regional Project Contribution to Biosolids Research

W4170 Beneficial Use of Residuals to Improve Soil Health and
Protect Public, and Ecosystem Health▪ 50+ scientists from 30 states with extensive history on biosolids research
▪ USEPA Office of Water, Office of Research and Development
▪ USDA, ARS
▪ Biosolids Regional Groups (NW, NEBRA, CASA, MWRD, Mid Atlantic)
▪ Other biosolids stakeholders, industry representatives
▪ Research and extension activities to scientific community, federal, state, regional, and
local agencies, community and stakeholders
Diverse expertise with national and international recognition

https://www.nimss.org/projects/18624
W4170 Beneficial Use of Residuals to Improve Soil Health and
Protect Public, and Ecosystem Health


Objective 1. Evaluate the short- and long-term chemistry and bioavailability of emerging
contaminants (PFAS, microplastics, etc), pharmaceuticals and personal care products
(PPCPs), persistent organic contaminants, and pathogens in residuals, reclaimed water,
and amended soils in order to assess the environmental and human health risk-based
effects of their application at a watershed scale.
▪ Chemistry, bioavailability, fate, and transport of CECs/PPCPs: carbamazepine,
estrogens, sulfamethoxazole, trimethoprim, ofloxacin, ciprofloxacin and
azithromycin, caffeine, etc
▪ Antibiotic resistant microorganisms
▪ Perfluorochemicals (PFAS)
▪ Engineered nano-particles (ENP)
Research for this objective was conducted by members from PA, WA, IN, MA, FL, VA,
GA, MI, and KY
W4170 Research Focus

Objective 2. Evaluate the uses and associated environmental benefits for residuals and
wastewaters in various ecosystems (e.g., agricultural, urban, recreational, forest,
rangeland, mine-impacted, disturbed, degraded) with respect to changes in soil physical,
chemical, biological, nutrient, and trace/heavy metals with respect to soil quality/soil
health
▪ Assessment of benefits in agriculture and urban: food production, soil health,
etc
▪ Greenhouse gas balance, soil carbon
▪ Impacts on water quality
▪ Mined and disturbed lands mitigation
Research on this topic was conducted by members from PA, HA, CO, OH, WA, FL, MN,
VA, GA, NE and KS
W4170 Research Focus

Recent Accomplishment
https://www.nimss.org/system/ProjectAttachment/files/000/000/502/or
iginal/W4170%20Response%20to%20OIG%20Report%20July%2023%202020%2
0final.pdf
On November 15, 2018 the USEPA Office of Inspector General
(OIG) published “EPA Unable to Assess the Impact of Hundreds of
Unregulated Pollutants in Land-Applied Biosolids on Human
Health and the Environment,” Report No. 19-P-0002 (USEPA,
2018). The OIG report alleged that “…[EPA] lacked the data or
risk assessment tools needed to make a determination on the
safety of 352 pollutants found in biosolids…[including] 61
designated as acutely hazardous, hazardous or priority pollutants
in other programs.”

Response to OIG Report
The response from USEPA Office of Water, which has regulatory oversight of the national
biosolids program, in Appendix D stated “We are concerned about how the science is
presented in the OIG report. It is biased and raises alarm...and is taken out of context”
Concern from USEPA Office of Water and widespread concern from practitioners led to the
creation of this review and response
The objective was to provide a science-based review of chemicals of concern highlighted in
the OIG report
▪ Document shows that the OIG report did not consider the concentration of chemicals found
in the biosolids. Often, the bulk of human exposure to these chemicals is from domestic
use of consumer goods and only trace amounts are found in biosolids
▪ “Sufficient data and research are available to conclude that current biosolids
regulations are protective of human health and the environment. Of course, as with any
regulation intended to protect public health and the environment, they must always be
dynamic and evolve with updated science. That fact does not imply that they are not
protective while research is ongoing.”


BREAK
MEETING RESUMES AT: 2:30 PM

EPA’s PFOA & PFOS Biosolids Risk Assessment
EPA National Biosolids Meeting 2020
Elyssa Arnold
Biosolids Program
U.S. EPA Office of Water
65

Outline
• What is Risk Assessment?
• Why do we do Risk Assessment for Biosolids?
• EPA’s PFOA & PFOS Biosolids Risk Assessment
• Summary of the November Problem Formulation Meetings
• Next Steps
66
WHAT IS RISK ASSESSMENT?

What is Risk?
• EPA Definition: Risk is the chance of harmful effects to human health or to ecological systems resulting from exposure to an environmental stressor.
• A stressor is any physical, chemical, or biological entity that can induce an adverse response. Stressors may adversely affect specific natural resources or entire ecosystems, including plants and animals, as well as the environment with which they interact.
68

What is Risk Assessment?
• Risk Assessment is a scientific process.
• EPA uses risk assessment to characterize the nature and magnitude of health risks to humans and ecological receptors from chemical contaminants and other stressors that may be present in the environment.
• At EPA, risk assessment typically falls into one of two areas:
• Human health risk assessment
• Ecological risk assessment
69
What is Risk Assessment?
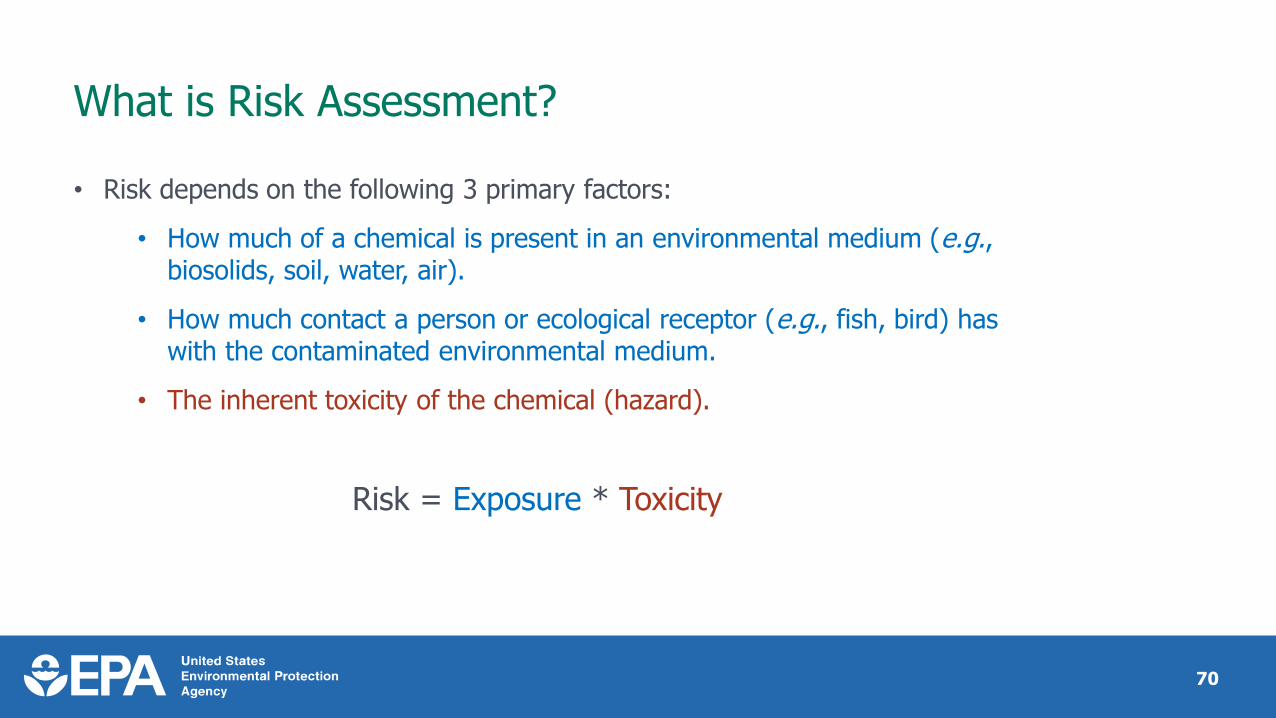
• Risk depends on the following 3 primary factors:
• How much of a chemical is present in an environmental medium (e.g., biosolids, soil, water, air).
• How much contact a person or ecological receptor (e.g., fish, bird) has with the contaminated environmental medium.
• The inherent toxicity of the chemical (hazard).
Risk = Exposure * Toxicity
70

Risk Assessment Terminology
71
RiskThe chance of harmful
effects to human health or to ecological systems.
VariabilityThe range of toxic response
or exposure.
UncertaintyOur inability to know for
sure, often due to incomplete data.

Types of Risk Assessment
• Deterministic risk assessment
• A technique that uses point values and simple models to produce a point estimate of exposure (either high-end or typical exposure). Deterministic assessments are simple to carry out, often use readily available data, and produce results that are straightforward to interpret.
• Probabilistic risk assessment
• A technique that utilizes the entire range of input data to develop a probability distribution of exposure or risk rather than a single point value. The input data can be measured values and/or estimated distributions.
72

Risk Assessment Framework
• Problem Formulation / Scoping
• Exposure
• Effects / Toxicity
• Risk Characterization
• Risk Management and Communication
73

Risk Assessment Framework
74
Human Health Risk Assessment
WHY WE DO RISK ASSESSMENT FOR BIOSOLIDS

Why do Risk Assessment for Biosolids?
Clean Water Act, Section 405 requires EPA:
➢ To establish numeric limits and management practices that protect public health and the environment from the effects of chemical and microbial pollutants during the use or disposal of sewage sludge.
➢ To review biosolids (sewage sludge) regulations every two years to identify additional toxic pollutants that occur in sewage sludge and set regulations for those pollutants if sufficient scientific evidence shows that they may harm human health or the environment.
76

The Biosolids Rule: 40 CFR Part 503
• Rule published in 1993 to protect human health and the environment from reasonably anticipated adverse effects of pollutants that may be present in biosolids that are used or disposed.
• Based on the results of risk assessments that were conducted to identify risks associated with the use or disposal of biosolids (land application, surface disposal or incineration).
• Informed by National Academy of Sciences 1983 procedures for risk assessment in the federal government.
• Analyzed risks to human, animals, plants, and soil organisms from exposure to pollutants in biosolids through 14 different exposure pathways.
77

40 CFR Part 503
78
Pollutant limits in 40 CFR part 503 are supported by risk assessment

EPA’S PFOA & PFOS BIOSOLIDS RISK ASSESSMENT

Biosolids Risk Assessment in the PFAS Action Plan
• Activity: Scoping biosolids risk assessment for PFOA/PFOS
• Purpose: EPA is in the early scoping stages of risk assessment
for PFOA and PFOS in biosolids to better understand the
implications of PFOA and PFOS in biosolids to determine if
there are any potential risks.
• Timeframe: 2020
https://www.epa.gov/pfas/epas-pfas-action-plan
80

Problem Formulation
Problem Formulation is the part of the risk assessment that:
• Articulates the purpose for the assessment
• Defines the problem
• Chemical sources and occurrence
• Fate and transport in the environment
• Toxicity endpoints
• Determines the conceptual models (sources and routes of exposure) for assessing adverse effects to human health and ecological receptors (e.g., birds, fish)
• Describes the analysis plan, documenting the approach for acquiring reliable data and the models and tools to be used in the analysis
• Includes engagement with states and tribes, risk managers, scientists, and members of the biosolids community to discuss foreseeable science and implementation issues.
81

PFOS and PFOA
82
Perfluorooctanesulfonic Acid (PFOS)C8HF17O3S
CASRN: 1763-23-1
Perfluorooctanoic Acid (PFOA)C8HF15O2
CASRN: 335-67-1

PFOS and PFOA Sources and Environmental Fate
• PFOS and PFOA are part of a larger group of chemicals called per- and polyfluoroalkyl substances (PFAS).
• PFAS are highly fluorinated aliphatic molecules that have been released to the environment through industrial manufacturing and through use and disposal of PFAS-containing products.
• While many PFASs have been found in biosolids, PFOS and PFOA are among the most abundant and have the largest data sets to support risk assessment.
• PFOS and PFOA do not readily degrade via aerobic or anaerobic processes.
• While PFOS and PFOA have largely been phased out of production in the United States, their resistance to environmental degradation causes a lingering concern for exposure. They can also be formed from precursors in the environment.
83

Concentrations of PFOA and PFOS in Biosolids
84
Year Sampled PFOA (ng/g dry wt) PFOS (ng/g dry wt) Reference
2001 12 - 70 308 - 618 Venkatesan, 2013
2004-2007 8 - 68 80 - 219 Sepulvado, 2011
2005 8.3 - 219 8.2 - 110 Loganathan 2007
2005 18 - 241 <10 - 65 Sinclair, 2006
2006 -- 81 - 160 Schultz, 2006
2006-2007 18 - 69 31 - 702 Yu, 2009
2007 20 -128 32 - 418 Yoo, 2009
2011 1 - 14 4 - 84 Navarro, 2016
2014 10 - 60 30 - 102 Mills, Dasu (in prep)
2018 1-11 2 – 1,100 EGLE, 2020

Toxicity Endpoints
• Human Health - Reference Dose (RfD) and Cancer Slope Factor (CSF)
• Human health effects data support both ambient water criteria for human health and Safe Drinking Water Act regulatory determinations.
• Health Effects Support Documents (HESDs) for PFOA and PFOS Health Advisories were published in 2016.
• Ongoing work to evaluate newer published literature.
• Ecological – survival, growth, and reproduction
• Relevant toxicity studies from peer-reviewed literature were identified through ECOTOX searches (https://cfpub.epa.gov/ecotox/) and reviewed for data quality.
• Aquatic life and aquatic-dependent wildlife effects data support ambient water criteria for aquatic life and aquatic-dependent wildlife
• Toxicity endpoints for non-aquatic dependent birds, mammals, terrestrial invertebrates, and terrestrial plants are currently being evaluated by the Biosolids Program
85

Biosolids Use and Disposal Pathways
1. Land Application
2. Surface Disposal
3. Incineration
40 CFR Part 503.1: “(a) Purpose. (1) This part establishes standards, which consist of general requirements, pollutant limits, management practices, and operational standards, for the final use or disposal of sewage sludge generated during the treatment of domestic sewage in a treatment works. Standards are included in this part for sewage sludge applied to the land, placed on a surface disposal site, or fired in a sewage sludge incinerator.”
86

87
Dashed arrows and box outlines indicate a pathway or route that has been added since 1993.
Conceptual Model for the Agricultural Land Application Scenario: Human Exposures
Source Release Mechanism Media Exposure Scenarios Exposure Routes Receptors Pathway Number
15
Agricultural
Field
Runoff and
erosion
Volatilization
Soil (buffer)
Air (vapors &
particulates)
Drinking water
Inhalation of
ambient air
Inhalation of
shower vapor
Adult farmer
Farm child
Adult farmer
Farm child
Adult farmerShower air
Windblown
particles
Surface water
(index res)
Surface water
(farm pond)
Leaching/
infiltrationGroundwater Drinking water
Ingestion of
drinking water
Adult farmer
Farm child
Fish Ingestion of fishAdult farmer
Farm child
Ingestion of
drinking water
Adult farmer
Farm child
Ingestion of soil
Adult farmer
Farm child
Soil/biosolids
(ag field)
Ingestion of
produce
Protected & root
crops
Exposed crops
Forage Beef & dairy
cattle
Adult farmer
Farm child
Ingestion of beef
& milk
1 & 2
4 & 5
11 & 13
3
12
12
14

Modeling Approach
• Currently under development for presentation to the Science Advisory Board in 2021
• Biosolids Screening Tool for deterministic, screening-level assessment
• Probabilistic Risk Assessment framework for chemicals that fail at the screening level
• Modeling for biosolids will be based on publicly available, previously peer-reviewed models for leaching, runoff, erosion, air dispersal, and plant uptake to the greatest extent possible
• Approach for PFAS will be consistent, to the extent appropriate, with all other chemical risk assessment for biosolids
88

November PF Meeting Input
• Data sharing – thank you!
• Methods – cost and availability
• Conceptual models
• Occupational exposure
• Precursors
• Big picture:
• Impacts on biosolids management
• Pre-treatment/source reduction
• Risks from biosolids relative to other exposure sources (e.g., household)
89

Next Steps
• Problem Formulation
• Meetings completed December 2020
• Draft document Spring 2021
• Science Advisory Board review of modeling approach – Spring 2021
• Risk Assessment – estimated completion in 2022 for internal review, followed by public comment
• If EPA determines that PFOA or PFOS in biosolids may adversely affect public health or the environment, risk managers will consider options for numerical limitations and best management practices for these compounds (as there are with current Part 503 pollutant limits).
• If regulatory limits are advised, they will go through a standard regulatory process including inter-Agency and OMB review as well as public comment.
90

Thank you
Elyssa Arnold
Risk Assessment Lead, EPA Biosolids Program
202-566-1189
91
9292
Michigan PFAS & Biosolids UpdateState Perspectives
Mike PersonMichigan Biosolids Program

9393
Michigan PFAS Action Response Team (MPART)
• Unique multi-agency approach
• Leads coordination and cooperation among all levels of government
• Directs implementation of state’s action strategy
• WRD -Member of Great Lakes PFAS Task Force
93

9494
Biosolids
Plans to amend the biosolids workgroup to include other beneficial
use programs
MPART Biosolids Workgroup
• Mission:
• Expand knowledge of PFAS and biosolids within wastewater collection and treatment systems to develop guidance to municipal Wastewater Treatment Plants (WWTPs), land application contractors, and farmers/landowners regarding land application of biosolids containing PFAS.
• Establish a durable process to evaluate biosolids land application sites.
• In conjunction with Industrial Pretreatment Program (IPP) Initiative efforts, reach equilibrium in program status that allows the majority of WWTPs to maintain the option to safely land apply biosolids. This is contingent on identifying and controlling sources within wastewater collection systems and on ability to develop guidance above.
EGLE WRD, RRD, MDARD, DHHS

9595
IPP PFAS Initiative• February 2018 – 95 WWTPs required to screen Industrial Users
– Evaluate Industrial Users as potential sources of PFAS
– Sample effluent if sources above screening criteria (12 ppt PFOS)
– Sample biosolids if PFOS > 50 ppt in effluent
– Source control/elimination of PFOS from sources
– Ongoing monitoring of sources & POTW effluent
– Status reports submitted to EGLE
Additional information on IPP PFAS Initiative:https://www.michigan.gov/pfasresponse/0,9038,7-365-86510---,00.html

9696
96
Municipal WWTP PFOS,
Effluent (ppt,
most
recent**)
PFOS Reduction in
Effluent (highest
to most recent)
Actions Taken to Reduce PFOS
Lapeer 17* 99% Treatment (GAC) at source (1)
Wixom 16* 99% Treatment (GAC) at source (1)
Ionia <8.49 98% Treatment (GAC) at source (1)
Port Huron 18* 99% Elimination of source PFOS (2)Howell 5.2 96% Treatment (GAC/resin) at source (1)
Bronson 10 96% Treatment (GAC) at source (1)
Kalamazoo 3.09 92% Treatment (GAC) at sources (2), change water supply
K I Sawyer 9.3 96% Eliminate leak AFFF, some cleaning
GLWA (Detroit) 9.8 74% Treatment (GAC) at sources (17)
Belding 9.4 32% Restricted landfill leachate quantity accepted
Substantial Reductions in PFOS Concentrations at WWTPs
*Greater than Water Quality Standards
**Data received as of November 27, 2020

9797
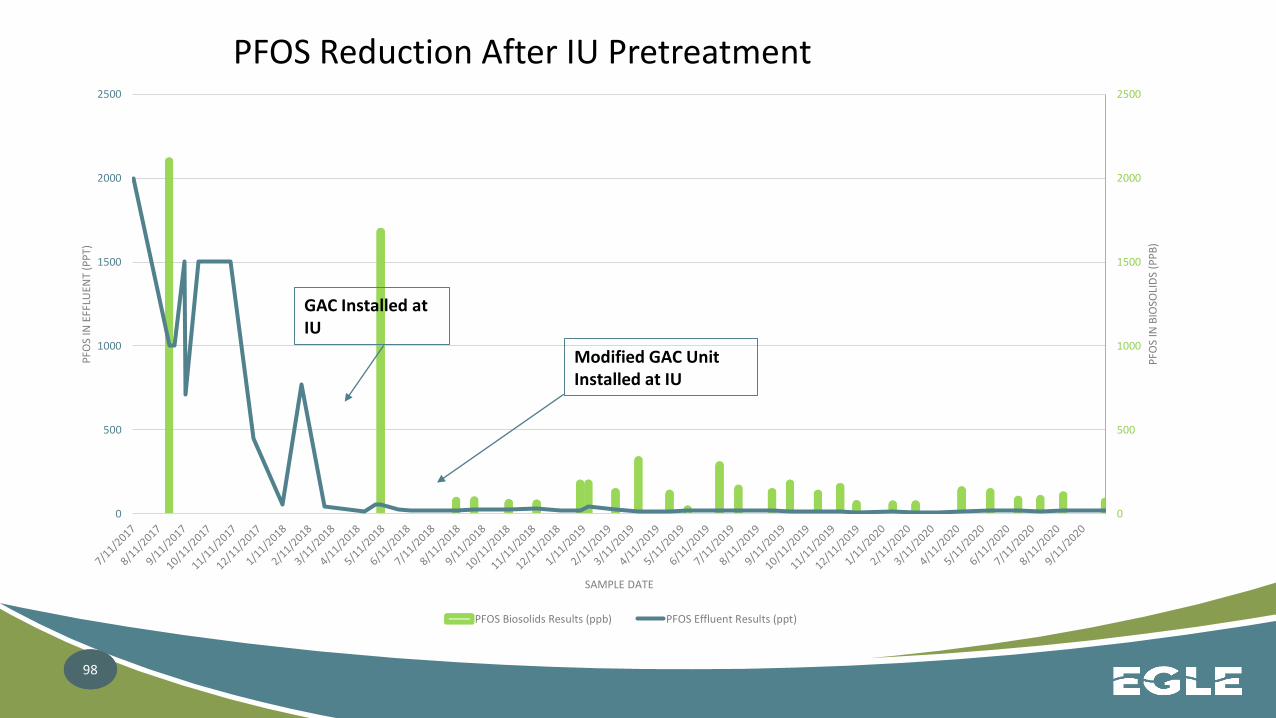
PFOS Reduction After IU Pretreatment
2000
1000
1500
710
1500 1500
450
57
770
46 15 54 26 20 18 23 23 23 29 21 46 24 170
200
400
600
800
1000
1200
1400
1600
1800
2000
2200
pp
t
Lapeer WWTP Effluent Results
GAC Installed at IU
Modified GAC Unit Installed at IU
9898
0
500
1000
1500
2000
2500
0
500
1000
1500
2000
2500
PFO
S IN
BIO
SOLI
DS
(PP
B)
PFO
S IN
EFF
LUEN
T(P
PT)
SAMPLE DATE
PFOS Biosolids Results (ppb) PFOS Effluent Results (ppt)
GAC Installed at IU
Modified GAC Unit Installed at IU
PFOS Reduction After IU Pretreatment

9999
Source Document
Evaluation and Identification of significant sources of PFOS to WWTPS in Michigan.
www.Michigan.gov/PfasResponse

100
100
Expanding upon the IPP initiative
• Non-IPP WWTPs: Landfill Leachate/Septage/ High Strength Waste
• Compliance Strategy Developed:
– Industrial Direct Discharges
– Industrial Stormwater Dischargeshttps://www.michigan.gov/documents/pfasresponse/Compliance_Strategy_for_Addressing_PFAS_PFOS-PFOA_from_Industrial_Direct_Discharges_and_Industrial_Storm_Water_Discharges_698878_7.pdf
• Municipal Groundwater Discharges
101
101
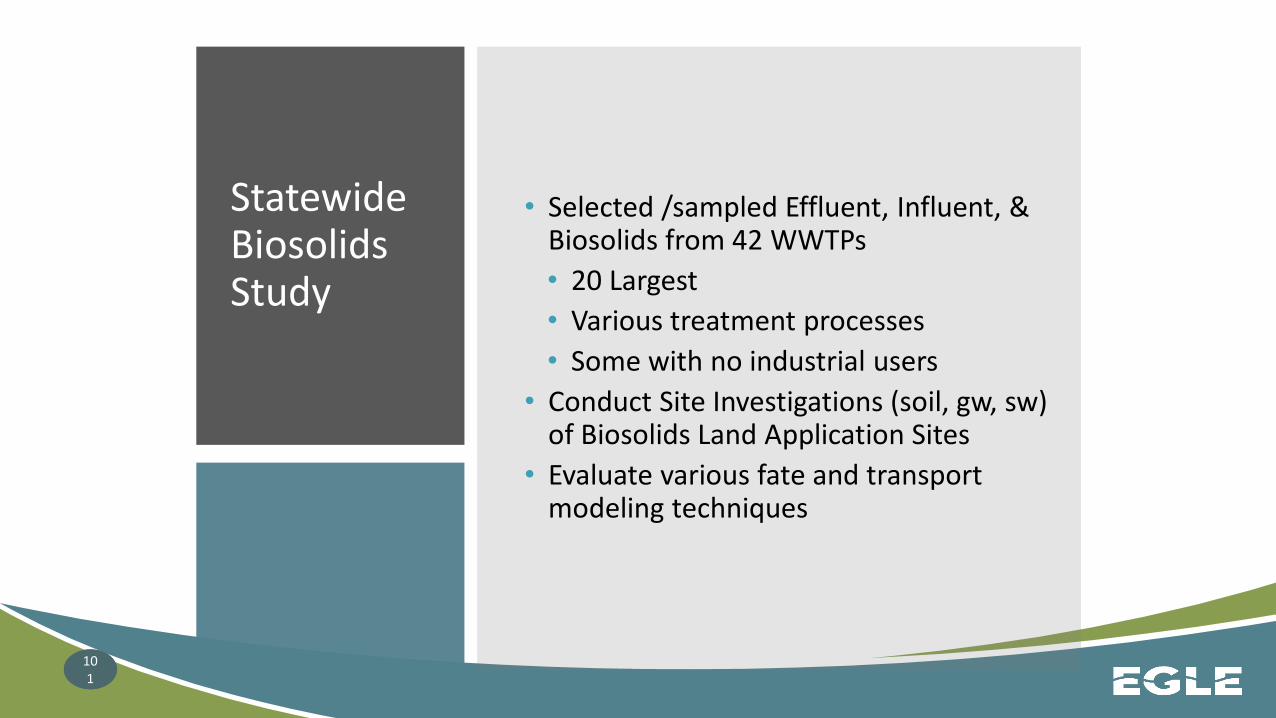
Statewide Biosolids Study
• Selected /sampled Effluent, Influent, & Biosolids from 42 WWTPs
• 20 Largest
• Various treatment processes
• Some with no industrial users
• Conduct Site Investigations (soil, gw, sw) of Biosolids Land Application Sites
• Evaluate various fate and transport modeling techniques

102
102
Statewide Biosolids
Study Locations
103
103
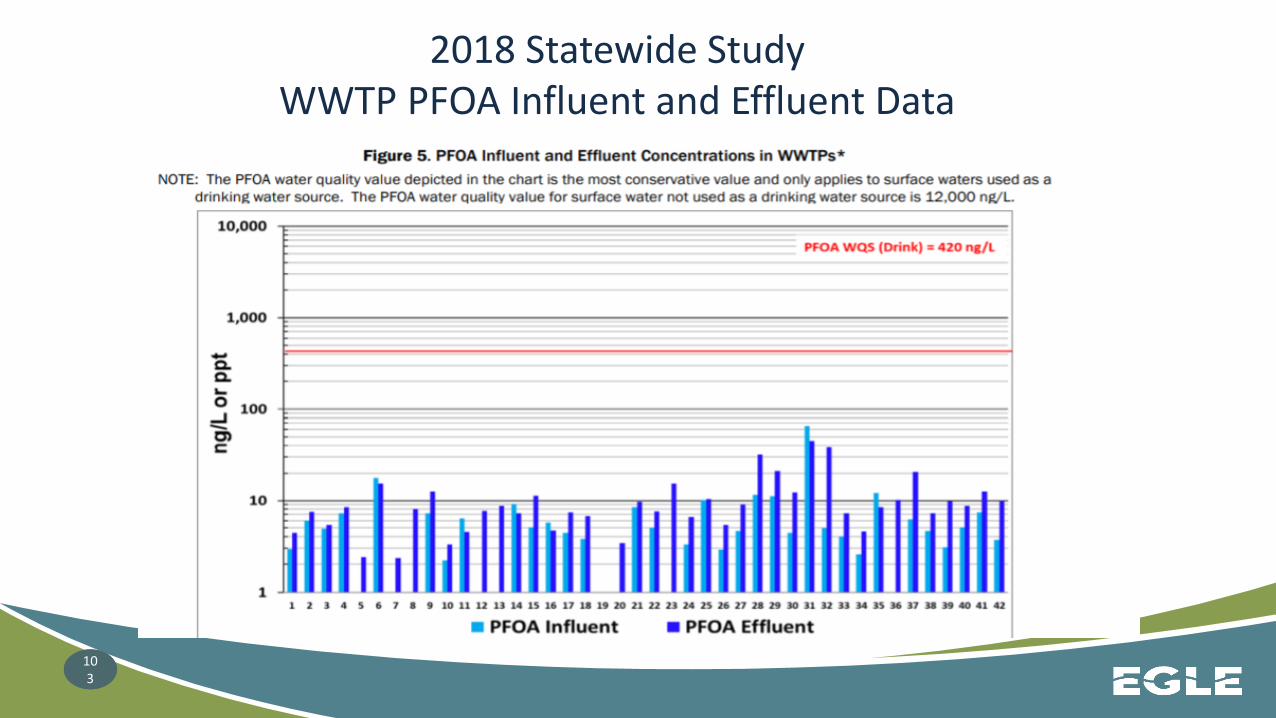
2018 Statewide StudyWWTP PFOA Influent and Effluent Data

104
104
2018 Statewide StudyWWTP PFOS Influent and Effluent Data
1
10
100
1000
1 2 3 4 5 6 7 8 9 10 11 12 13 14 15 16 17 18 19 20 21 22 23 24 25 26 27 28 29 30 31 32 33 34 35 36 37 38 39 40 41 42
PFOS Influent (ppt) PFOS Effluent (ppt) PFOS WQS (ppt)

105
105
Statewide Study - Sludge/Biosolids PFOS Results

106
106
Statewide Study - WWTP Stabilized Sludge/Biosolids PFOS Results

107
107
0 2 3 3 4 5 5 6 6 6 6 7 7 7 8 8 9 9 9 11 11 13 13 13 14 14 15 15 16 20 21 22 25 42 43 43 55 78 91160 161
387
9831,060
1,200
1,680
2,150
150.24
12.80
500
1000
1500
2000
2500
Industrially Impacted
150
PFOS concentrations in PPB
12.8
Statewide Study - WWTP Stabilized Sludge/Biosolids PFOS Results

108
108
PFAS in Sludge /Biosolids - When is it considered industrially impacted?
- Threshold level of 150 ppb is being used at the point at which biosolids is considered industrially impacted.
• Determination of “industrially impacted” is based on a number of factors including– Review of literature and land application studies with high PFAS concentrations (Decatur,
Alabama)– Results of Statewide Biosolids Study– Results of soil /gw sampling of land application sites in Michigan– Natural Break Point in results
**This is not a risk-based number. As more information about fate and transport of these chemicals becomes available, including the field study results, this level will be reevaluated as necessary
No Regulatory Limit - Looking to EPA to lead

109
109
Statewide Biosolids Study
Land Application Field Screening
22 Fields Screened from 8 WWTPS
– 3 WWTPs w/ PFOS > 1000 ppb
– 5 WWTPs w/ PFOS < 100 ppb
• Sampled: Soils, groundwater, tile drains, swales, ponding/perched waters and surface waters
• Developed field prioritization process to screen "worst case scenarios" for each facility
• Lapeer reports posted on MPART website
• Reports pending for remaining fields

110
110
Summary Report
Document
*Detailed Report expected late 2020

111
111
Strategy -Land
Application of Biosolids
Containing PFAS
• Strategy to assist with biosolids management decisions
– Draft Strategy Document expected January with implement for spring 2021.
– Present Study results and strategy at the next stakeholders meeting.
– Strategy will need to go through MPART review
– Webinar for WWTPs/ Contractors upon implementation

112
112
Strategy Components
- Land Application of Biosolids Containing
PFAS
Source Reduction - Continue aggressively identifying and reducing significant sources of PFAS in wastewater and biosolids.
Research –Continuing efforts with evaluation and study of PFAS in biosolids and land application sites.
- Continue supporting EPAs efforts to develop a biosolids standard for PFAS
Prevention - While continuing to drive PFAS biosolids concentrations lower through aggressive source reduction efforts work to identify /prevent industrially impacted biosolids from being land applied.
Sampling - Additional monitoring for PFAS of land applied biosolids.

113
113
Strategy Components
- Land Application of Biosolids Containing
PFAS
Communication / Transparency - Open dialogue between WWTPS / Contractors and landowners /farmers on PFAS in biosolids
Provide tools for disseminating information /analytical on PFAS in biosolids.
MWEA BS Committee -
- The PFAS and Biosolids Quick Facts for Landowners document
- Best Management Practices Document

114
114
Visit the MPART Biosolids Workgroup
www.Michigan.gov/PfasResponse
or search
MPART Biosolids Workgroup

115
115
116
116

117
117
Michigan Department of
Environment, Great Lakes, and Energy
800-662-9278www.Michigan.gov/EGLE
Sign up for email updates
Subscribe to our YouTube Channel
Follow us on Twitter @MichiganEGLE
MICHIGAN PFAS ACTION RESPONSE
www.Michigan.gov/PfasResponse

Impact of Past Biosolids Land Application on One Maine Farming
Community
Carla Hopkins, ESIV
Residuals Management Unit
MAINE DEPARTMENT OF ENVIRONMENTAL PROTECTION
Protecting Maine’s Air, Land and Water

MAINE DEPARTMENT OF ENVIRONMENTAL PROTECTION www.maine.gov/dep
• December 2016 elevated PFOS in milk from farm in southern Maine
• Farm had accepted Class B biosolids and paper mill residuals from 1980s to early 2000s
• PFOS in soil made its way into groundwater and then dairy cows
Background – Farm in Southern Maine
MAINE DEPARTMENT OF ENVIRONMENTAL PROTECTION www.maine.gov/dep
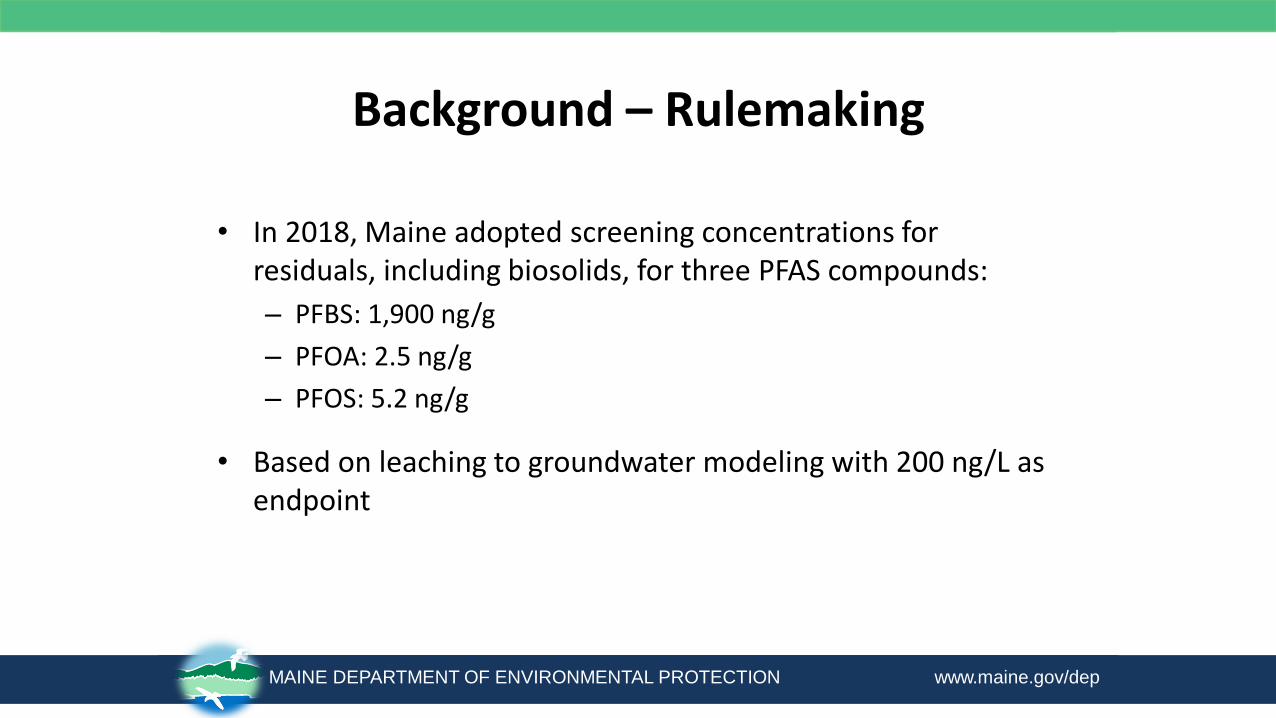
• In 2018, Maine adopted screening concentrations for residuals, including biosolids, for three PFAS compounds:
– PFBS: 1,900 ng/g
– PFOA: 2.5 ng/g
– PFOS: 5.2 ng/g
• Based on leaching to groundwater modeling with 200 ng/L as endpoint
Background – Rulemaking

MAINE DEPARTMENT OF ENVIRONMENTAL PROTECTION www.maine.gov/dep
• In March 2019, began requiring facilities that land-apply biosolids and biosolids-derived products to test for PFBS, PFOA and PFOS
– Class B programs
– Class A pellet programs
– Class A composters (includes WWTP sludge and dewatered septage)
• Ongoing testing required for these facilities February 2020
Background – Testing Requirements

MAINE DEPARTMENT OF ENVIRONMENTAL PROTECTION www.maine.gov/dep
• In March 2019, Governor forms PFAS task force to study the threats of PFAS contamination to public health and the environment
• Public health experts, DHHS, DEP, DACF, MEMA, industry experts, drinking water sector, environmental groups
• Final Report issued January 2020
• Two key recommendations relating to biosolids:
– Prioritize locations for sampling where biosolids were spread on fields that produce crops for human consumption or feed
– Greatly expand testing of agricultural produce and products grown and/or raised in soils where biosolids have been agronomically utilized
Background – PFAS Task Force

MAINE DEPARTMENT OF ENVIRONMENTAL PROTECTION www.maine.gov/dep
• Maine Department of Agriculture, Conservation and Forestry (DACF) off-the-shelf milk testing program in 2019 and 2020
• Sample over the detection limit prompted further testing
• June 2020 tested milk at contributing farms
• Results of 12,700 ppt, 14,400 ppt, 14,900 ppt and 32,200 ppt PFOS in milk
• Farm had accepted Class B biosolids ~1980-2003 (WWTP with significant contribution from industry) and Class A sludge-derived liming product ~2006-2015 and spread own manure
• DEP initiated an investigation in July 2020
Background – Central Maine Farm

MAINE DEPARTMENT OF ENVIRONMENTAL PROTECTION www.maine.gov/dep
• Matrices sampled June 2020 to present:
Sampling Activity
➢ Milk➢ Dairy Cow Manure➢ Beef Cow Manure➢ Hog Manure➢ Surface Water➢ Soil➢ Animal Drinking Water Source➢ Beef➢ Residential Drinking Water Wells➢ Spring (used as drinking water)➢ Eggs
➢ Hay➢ Haylage➢ Corn Silage➢ Fish Byproduct (used as feed)➢ “Green Chop”➢ Grass➢ Purchased Feed➢ Class A Liming Product➢ Produce (grown with farm
manure)➢ Groundwater

MAINE DEPARTMENT OF ENVIRONMENTAL PROTECTION www.maine.gov/dep
Farm Fields - Overview

MAINE DEPARTMENT OF ENVIRONMENTAL PROTECTION www.maine.gov/dep
Beef
Sample ID
Sample
Date
PFOS
(ng/g Dry)
Validation
Qual
PFOA
(ng/g Dry)
Validation
Qual
COW-GROUND BEEF 7/13/2020 20.9 ND
Milk and Beef ResultsMilk
Sample ID
Sample
Date
PFOS
(ng/L)
Validation
Qual
PFOA
(ng/L)
Validation
Qual
Milk Tank 6/24/20 12,700 31.9
Milk Tank (re-test) 6/24/20 14,400 38.5
Milk Tank (re-test) 6/24/20 14,900 52.9 J
Milk Tank 7/13/2020 32,200 46.5 J
“J” indicates an estimated value. This is commonly applied to values that are either very low or very high compared to the calibration range of a test. “ND” indicates that compound not detected in the sample.

MAINE DEPARTMENT OF ENVIRONMENTAL PROTECTION www.maine.gov/dep
Manure Results
Manure
Sample IDSample
Date
PFOS
(ng/g Dry)
Validation
Qual
PFOA
(ng/g Dry)
Validation
Qual
BEEF MANURE PAD 7/31/2020 113 J 22.1 J
DAIRY MANURE PIT 7/31/2020 35.1 J 4.48 J
HOG MANURE STACK 7/31/2020 39.9 J 5.81 J
“J” indicates an estimated value. This is commonly applied to values that are either very low or very high compared to the calibration range of a test. “ND” indicates that compound not detected in the sample.

MAINE DEPARTMENT OF ENVIRONMENTAL PROTECTION www.maine.gov/dep
Surface Water and Animal Drinking Water Source
Sample ID Sample Date
PFOS
(ng/L)
Validation
Qual
PFOA
(ng/L)
Validation
Qual
DAIRY BARN TROUGH 7/13/2020 4.52 2.44
SW-101 (by home fields) 7/28/2020 127.8 266.5
SW-103 (pond-201 fields) 7/31/2020 6,390 1,920
SW-104 (pond-201 fields) 7/31/2020 7,330 3,340
Water and Other Results
Other
Sample ID Sample Date
PFOS
(ng/g Dry)
Validation
Qual
PFOA
(ng/g Dry)
Validation
Qual
Class A Liming
Product7/9/2020 30.9 54.7
“J” indicates an estimated value. This is commonly applied to values that are either very low or very high compared to the calibration range of a test. “ND” indicates that compound not detected in the sample.

MAINE DEPARTMENT OF ENVIRONMENTAL PROTECTION www.maine.gov/dep
Feed
Sample ID Sample Date
PFOS
(ng/g Dry)
Validation
Qual
PFOA
(ng/g Dry)
Validation
Qual
GRASS-201-5 7/31/2020 352.90 49.96
GREEN CHOP 7/8/2020 31.43 1.58 J
HAY SILOED 2019 7/8/2020 0.44 J ND
HAY-1 (haybale) 7/8/2020 50.61 7.64
GRASS-RIDGE-1 7/31/2020 399.10 39.82
GRASS-RIDGE-3 7/31/2020 396.07 86.06
SILAGE-2019 7/8/2020 ND ND
BYPRODUCT-1 7/13/2020 13.61 2.30
GRAIN-071320 7/13/2020 ND ND
Feed Results
“J” indicates an estimated value. This is commonly applied to values that are either very low or very high compared to the calibration range of a test. “ND” indicates that compound not detected in the sample.

MAINE DEPARTMENT OF ENVIRONMENTAL PROTECTION www.maine.gov/dep
SoilSample ID Sample Date PFOS (ng/g Dry) Validation Qual PFOA (ng/g Dry) Validation Qual
CS-BARN-1 7/24/2020 23.29 1.94 JCS-BARN-2 7/24/2020 4.33 0.44 JFIELD 1 7/28/2020 15.58 3.86FIELD 2 7/28/2020 45.62 48.75NO SPREAD 1 7/28/2020 27.22 3.18P2 7/28/2020 150.3 22.85201-1 7/31/2020 294 J 11.7201-2 7/31/2020 479 31.3201-3 7/31/2020 283 18.4201-4 7/31/2020 544 16.8201-5 7/31/2020 422 16.4201-6 7/31/2020 571 20.2RIDGE-1 7/31/2020 579 21.4RIDGE-2 7/31/2020 792 30.3RIDGE-3 7/31/2020 981 38.7RIDGE-4 7/31/2020 1,080 49.6RIDGE-5 7/31/2020 1,010 J 42.5RIDGE-6 7/31/2020 553 30.6
Soil Results
“J” indicates an estimated value. This is commonly applied to values that are either very low or very high compared to the calibration range of a test. “ND” indicates that compound not detected in the sample.

MAINE DEPARTMENT OF ENVIRONMENTAL PROTECTION www.maine.gov/dep
Soil and Associated Grass Results
“J” indicates an estimated value. This is commonly applied to values that are either very low or very high compared to the calibration range of a test. “ND” indicates that compound not detected in the sample.
Soil and Associated Grass
Sample ID Sample Date
PFOS
(ng/g Dry)
Validation
Qual
PFOA
(ng/g Dry)
Validation
Qual
201-5 Soil 7/31/2020 422 16.4
201-5 Grass 7/31/2020 352.90 49.96
RIDGE-1 Soil 7/31/2020 579 21.4
RIDGE-1 Grass 7/31/2020 399.10 39.82
RIDGE-3 Soil 7/31/2020 981 38.7
RIDGE-3 Grass 7/31/2020 396.07 86.06

MAINE DEPARTMENT OF ENVIRONMENTAL PROTECTION www.maine.gov/dep
Sample Locations - Overview

Residential Drinking Water
Sample ID Sample Date
PFOS
(ng/L)
Validation
Qual
PFOA
(ng/L)
Validation
Qual
1 11/03/2020 ND ND
2 11/03/2020 ND 0.49 J
3 11/03/2020 0.734 J 0.222 J
4 11/03/2020 ND 11.4
5 11/03/2020 ND 0.818 J
6 10/29/2020 ND 5.25
7 8/28/2020 1.12 J 23.92
8 8/28/2020 60.36 50.02
9 9/18/2020 ND 1.08
MAINE DEPARTMENT OF ENVIRONMENTAL PROTECTION www.maine.gov/dep
Residential Drinking Water Results
“J” indicates an estimated value. This is commonly applied to values that are either very low or very high compared to the calibration range of a test. “ND” indicates that compound not detected in the sample.
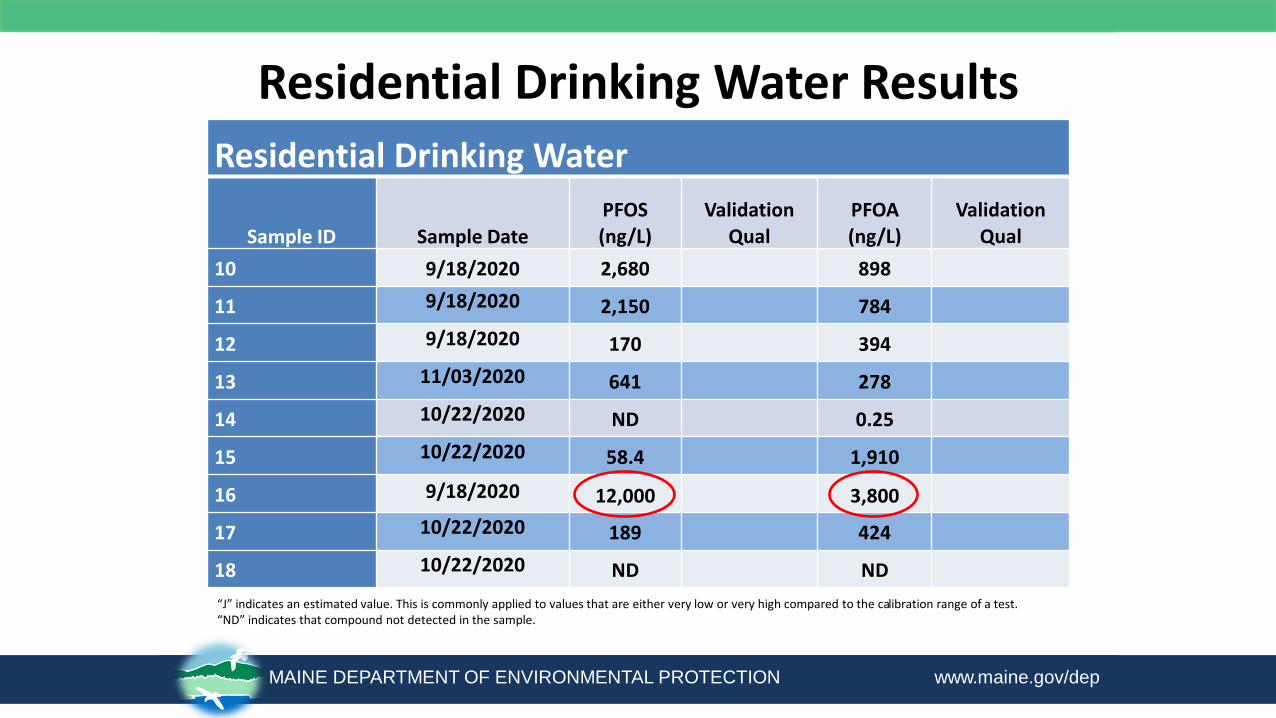
Residential Drinking Water
Sample ID Sample Date
PFOS (ng/L)
Validation Qual
PFOA (ng/L)
Validation Qual
10 9/18/2020 2,680 898
11 9/18/2020 2,150 784
12 9/18/2020 170 394
13 11/03/2020 641 278
14 10/22/2020 ND 0.25
15 10/22/2020 58.4 1,910
16 9/18/2020 12,000 3,800
17 10/22/2020 189 424
18 10/22/2020 ND ND

MAINE DEPARTMENT OF ENVIRONMENTAL PROTECTION www.maine.gov/dep
Residential Drinking Water Results
“J” indicates an estimated value. This is commonly applied to values that are either very low or very high compared to the calibration range of a test. “ND” indicates that compound not detected in the sample.
Residential Drinking Water
Sample ID Sample Date
PFOS (ng/L) Validation Qual
PFOA (ng/L)
Validation Qual
19 10/22/2020 ND 216
20 11/03/2020 26 96.1
21 10/22/2020 59.7 288
22 10/22/2020 3,170 3,520
23 10/22/2020 243 220
24 10/22/2020 511 1,400
24-1 10/22/2020 2,920 3,070
25 11/03/2020 3,190 3,140
26 11/04/2020 414 J 1,130 J
27 10/22/2020 25.4 108

MAINE DEPARTMENT OF ENVIRONMENTAL PROTECTION www.maine.gov/dep
Sample Locations – Home Farm Detail
PFOS – NDPFOA - ND
PFOS – NDPFOA – 0.49
PFOS – 0.734PFOA – 0.222
*All Results in ng/L (parts per trillion)

MAINE DEPARTMENT OF ENVIRONMENTAL PROTECTION www.maine.gov/dep
Sample Locations – Ridge Fields Detail
PFOS – NDPFOA – 11.4
PFOS – NDPFOA – 0. 818
PFOS – NDPFOA – 5.25
PFOS – 1.12PFOA – 23.92
*All Results in ng/L (parts per trillion)

MAINE DEPARTMENT OF ENVIRONMENTAL PROTECTION www.maine.gov/dep
Sample Locations – 201 Fields Detail
PFOS – 60.36PFOA – 50.2
PFOS – NDPFOA – 1.08
PFOS – 2680PFOA – 898
PFOS – 170PFOA – 394
PFOS – 2150PFOA – 784
*All Results in ng/L (parts per trillion)

MAINE DEPARTMENT OF ENVIRONMENTAL PROTECTION www.maine.gov/dep
Sample Locations – 201 Fields Detail
PFOS – 641PFOA – 278
PFOS – 12000PFOA – 3800
PFOS – 189PFOA – 424
PFOS – 3170PFOA – 3520
PFOS – NDPFOA – 0.25
PFOS – 25.4PFOA – 108
PFOS – 414PFOA – 1130 PFOS – 3190
PFOA – 3140
24 24-1PFOS – 511 2920PFOA – 1400 3070
PFOS – 243PFOA – 220
PFOS – 58.4PFOA – 1910
PFOS – 59.7PFOA – 288
PFOS – 26PFOA – 96.1
PFOS – NDPFOA – ND
PFOS – NDPFOA – 216
*All Results in ng/L (parts per trillion)

MAINE DEPARTMENT OF ENVIRONMENTAL PROTECTION www.maine.gov/dep
• Expanding private drinking water well testing based on results
• Reviewing data for soils that received only manure from farm – no Class A or Class B biosolids
• Reviewing data for soils that received only Class A sludge-derived liming product – no Class B biosolids
• Reviewing data from other sites that received the same Class B biosolids during the same timeframe as this farm
Current Work
MAINE DEPARTMENT OF ENVIRONMENTAL PROTECTION www.maine.gov/dep
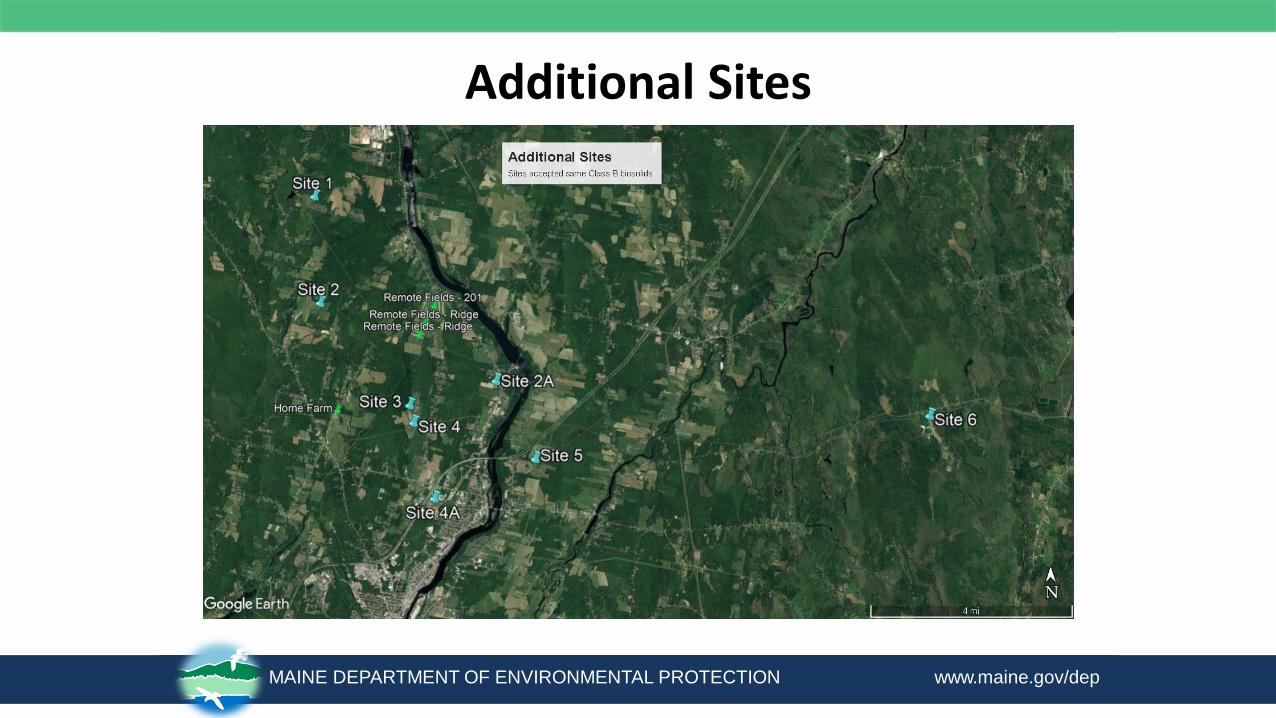
Additional Sites

MAINE DEPARTMENT OF ENVIRONMENTAL PROTECTION www.maine.gov/dep
Additional Sites – Soil Results
“J” indicates an estimated value. This is commonly applied to values that are either very low or very high compared to the calibration range of a test. “ND” indicates that compound not detected in the sample.
SoilSample ID Sample Date PFOS (ng/g Dry) Validation Qual PFOA (ng/g Dry) Validation Qual
Site 1 (3) 10/29/2020 328 31
Site 1 (F2-1) 10/29/2020 60 58.4
Site 2 (P-1) 10/29/2020 83.9 7.21
Site 2 (5-1/5-2) 10/29/2020 220 12.3
Site 2A No Data No Data No Data
Site 3 (A1) 10/29/2020 157 6.27
Site 3 (B1) 10/29/2020 239 9.07
Site 4 (2A) 10/29/2020 298 13.3
Site 4 (2C) 10/29/2020 409 11.4
Site 4A No Data No Data No Data
Site 5 No Data No Data No Data
Site 6 (G4) 10/29/2020 403 26.1
Site 6 (G5) 10/29/2020 208 34.1
MAINE DEPARTMENT OF ENVIRONMENTAL PROTECTION www.maine.gov/dep
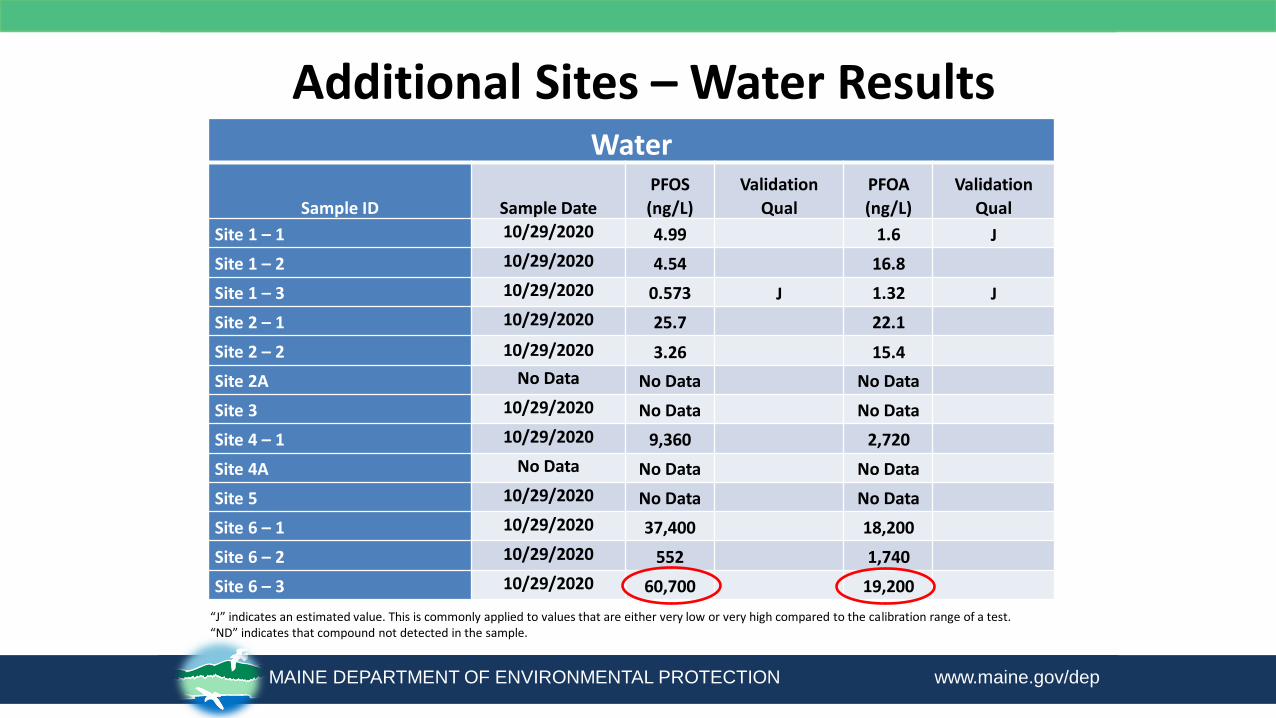
Additional Sites – Water Results
“J” indicates an estimated value. This is commonly applied to values that are either very low or very high compared to the calibration range of a test. “ND” indicates that compound not detected in the sample.
Water
Sample ID Sample Date
PFOS
(ng/L)
Validation
Qual
PFOA
(ng/L)
Validation
Qual
Site 1 – 1 10/29/2020 4.99 1.6 J
Site 1 – 2 10/29/2020 4.54 16.8
Site 1 – 3 10/29/2020 0.573 J 1.32 J
Site 2 – 1 10/29/2020 25.7 22.1
Site 2 – 2 10/29/2020 3.26 15.4
Site 2A No Data No Data No Data
Site 3 10/29/2020 No Data No Data
Site 4 – 1 10/29/2020 9,360 2,720
Site 4A No Data No Data No Data
Site 5 10/29/2020 No Data No Data
Site 6 – 1 10/29/2020 37,400 18,200
Site 6 – 2 10/29/2020 552 1,740
Site 6 – 3 10/29/2020 60,700 19,200

Milk
Sample ID
Sample
Date
PFOS
(ng/L)
Validation
Qual
PFOA
(ng/L)
Validation
Qual
Site 2 (Milk Tank) 10/26/2020 863 -
Site 2 (Milk Tank) 11/17/2020 620 4.07
MAINE DEPARTMENT OF ENVIRONMENTAL PROTECTION www.maine.gov/dep
Additional Sites – Milk Results
“J” indicates an estimated value. This is commonly applied to values that are either very low or very high compared to the calibration range of a test. “ND” indicates that compound not detected in the sample.

MAINE DEPARTMENT OF ENVIRONMENTAL PROTECTION www.maine.gov/dep
• Coordinating treatment systems for those impacted above the EPA Health Advisory
• Continue expanding private drinking water well testing based on results, if necessary
• Review information for other sites that received Class B biosolids from same generator as sites discussed earlier and sample as appropriate
• Expand testing to sites that received other Class B biosolids
Next Steps

Contact:
Carla J. Hopkins
(207) 215-3314
www.maine.gov/dep

DAY 3: EPA NATIONAL VIRTUAL BIOSOLIDS MEETING

Reflections and Insights from Experienced Biosolids Practitioners
Speakers will each have 10-minutes:
• Kyle Dorsey, Washington Department of Ecology
• Lauren Fondahl, US EPA
• Greg Kester, California Association of Sanitation Agencies
• Cynthia Sans, US EPA
• Frederick J. Hegeman, Wisconsin Department of Natural Resources
• John Dunn, US EPA
• Bob Bastian, Retired EPA Senior Environmental Scientist
Questions for Speakers:
• What advice would you give your younger self?
• In biosolids, what has been the most impactful development or achievement you have witnessed or been a part of and why was it so impactful?

BREAK
MEETING RESUMES AT: 2:35 PM

Breakout Sessions
• Breakout 1: Chemical and Microbial Methods for Meeting Part 503 Requirements
• Breakout 2: Considerations for Resource Recovery
• Breakout 3: Experiences in Risk Communications
• Breakout 4: Thermal Technologies: Incineration, Pyrolysis and Gasification
• Breakout 5: Surface Disposal and Storage Approaches, Planning and Challenges
• Breakout 6: Continuity and Institutional Knowledge Transfer within Biosolids Programs
• Breakout 7: (Non-PFAS!) Current Challenges for State and Tribal Biosolids Programs
150

Presentation Format
For each breakout session the ‘report out’ will follow this format:
1. Opportunity/Challenge Statement (<1 min)
2. Key Observations, Obstacles, & Actions (<2 mins)
3. Full Group Reflection via chat/hand raise (5 mins)
1. For those who participated in the breakout any points you wish to amplify, amend, or share?
2. For those who did not participate in the breakout session – what jumps out at you? Were there any surprises and why is it a surprise?
8-12 minutes per breakout session
151

1. CHEMICAL AND MICROBIAL METHODS FOR MEETING PART 503 REQUIREMENTS

Breakout Group Topic Opportunities and Challenges
• 40 CFR Part 503 identifies allowable methods to be used for four
pathogens, inorganic pollutants, and some physical and aggregate
biosolids properties. This session explores the use of existing
methods and potential need for new methods.
• The focus of this session is not PFAS methods.
• Website reference to the methods:
https://www.epa.gov/biosolids/biosolids-analytical-methods-and-
sampling-procedures
153

Key Observations, Obstacles, & ActionsEPA as an Information Resource
• More information from EPA on preferred or recommended methods would be helpful (beyond what’s reflected in EPA table – even if just anecdotal information) – providing contextual text or references to understand what might be more desirable or appropriate under certain circumstances when choosing a method – e.g., clarity regarding holding times for different pollutants.
• One thing missing on EPA methods chart is test methods for nutrients (especially in land application) – requires us to typically rely on wastewater methods but when reviewing out of state products, many different methods are used.
• Is there additional resource or guidance EPA can provide regarding sampling? e.g., authoritative structure that identifies what constitutes truly representative sample.
• Sometimes site-specific issues and dependent on where they are in process – would be helpful for consultants or cities to have place they can go to, to know what they should be thinking about and what method is appropriate (e.g., what do you need to think about in early-stage vs mid or later stage)
• Would be helpful to let EPA know what particular aspect of language in rule that is not clear, so they can more effectively fix it.
Changes and Availability of Methods
• Would like more options or alternative approach from EPA to provide support for additional method(s) for vector attraction reduction and stability (e.g., Solvita for respiration).
• For fecal coliform analysis, IDEXX method not listed as allowed under 503 (though this wasn’t developed for use on solids, originally designed for drinking water analysis; may not have received favorable results in comparison to EPA method).
• 200.7 (1994) for metals is in 40 CFR Part 136, but it does not have a biosolids section. 200.7 (2001) has a biosolids section but is not in 40 CFR Part 136. If you want to play it safe, you stick with the methods listed in Part 503.
• Would like EPA to revisit 6-hour holding time for fecal coliform – 1680 or 1681.
154

Breakout Reflections
Full Group Reflection via chat/hand raise:
1. For those who participated in the breakout any points you wish to amplify, amend, or share?
2. For those who did not participate in the breakout session – what jumps out at you? Were there any surprises and why is it a surprise?
155

2. CONSIDERATIONS FOR RESOURCE RECOVERY
Breakout Group Topic Opportunities and Challenges
• EPA is aware of new approaches to make and sell products recovered
from sewage sludge waste streams regulated under Part 503. In
some cases, Part 503 may create regulatory hurdles to the
development of these products, which EPA did not envision when it
promulgated Part 503 in 1993.
157

Key Observations, Obstacles, & Actions• Succinct list generated of the current primary products/efforts.
Opportunities/Actions
• Development of user standards, e.g., characterizing the odor intensity. (This augments 503’s focus on health/safety).
• Need to help utilities in understanding lifecycle costs/benefits of the products/options so a utility can best select among the options to match with the community’s needs. This includes information on financing option pros/cons and the economics of keeping the programs going (staffing, qualified operators etc.)
• Coordinated effort to address limitations to biosolids use in global markets and certified organics program.
• Easier certification for beneficial reuse.
• Leverage common causes – Climate Change, Healthy Soils, Urban Agriculture, NetZero.
• EPA should enhance partnership among the federal family: EPA and USDA (organics), USGS (soil conservation), USFS (reclamation).
• Enhance reclamation use of biosolids.
158
Breakout Reflections
Full Group Reflection via chat/hand raise:
1. For those who participated in the breakout any points you wish to amplify, amend, or share?
2. For those who did not participate in the breakout session – what jumps out at you? Were there any surprises and why is it a surprise?
159

3. EXPERIENCES IN RISK COMMUNICATIONS

Breakout Group Topic Opportunities and Challenges
• Communicating risk uncertainties from pollutants in biosolids is
challenging. Concerns over biosolids containing high levels of PFAS
chemicals are presenting challenges for land application. This session
explores biosolids risk communication strategies, tools and
messaging.
161

Key Observations, Obstacles, & Actions• Great opportunity to learn from one another’s successes and failures. Great brainstorming in the notes including some
lessons learned, best practices, formats, routes, etc.
• Some targeted communications resources exist, e.g., PFOS NH, ITRC.
• Convergence around most common challenges
• Trust issues stem from misperceptions/sensationalism, legacy issue/sites, distrust of messengers.
• Reactive Cycle and disincentive to be proactive
• PFOA/PFOS/CECs
• Predicable ‘triggers’, e.g., odor
Opportunities and Actions
• Leverage EPA’s expertise and credibility
• Finishing the risk assessment work for PFOS and PFOA ASAP would help states. Create flyers/graphics that explains risk comms for PFOS/PFOA specific to biosolids. (Applies to CECs generally).
• Webinars on ‘hot topics’ and areas where EPA has deep experience, e.g., crisis communication from large events.
• Tools like model MOU from EPA would help lend credibility.
• Dedicated, knowledgeable spokesperson at EPA – to deliver message at a national level proactively…and answer some of the questions that are difficult to answer.
• Message around source reduction work as other strategies are developed. Legacy issues – connected to trust.
162

Breakout Reflections
Full Group Reflection via chat/hand raise:
1. For those who participated in the breakout any points you wish to amplify, amend, or share?
2. For those who did not participate in the breakout session – what jumps out at you? Were there any surprises and why is it a surprise?
163

4. THERMAL TECHNOLOGIES: INCINERATION, PYROLYSIS, AND
GASIFICATION

Breakout Group Topic - Opportunities and Challenges
This session explores the use of incineration, pyrolysis and
gasification as options for biosolids management. While EPA
continues to support the land application of biosolids, additional
management options are needed, particularly for biosolids that are
highly contaminated with PFAS.
165

Key Observations, Obstacles, & Actions• Impressive brainstorm on why/why not different technologies are being used
and what is working well and not working well.
• Obstacles/Opportunities (See next slide)
• Targeted brainstorm on Permitting Issues/Challenges and Ash Reuse
166

Connections btwn CAA and
CWA
What obstacles exist for implementing thermal technologies? How can some of the obstacles be addressed?
167
Risk to invest in new technologies
NJ (Linden) – Gasification facility under construction (by
2022) (sharing lessons learned, etc.). Same company
may have a facility under construction in CA (Aries)
How are pyro/gasif
regulated under CAA
For Pyr and Gasif – would be helpful to see scaled-up pilots to prove technology. With help
from Fed/State funding to support.
Better coordination/communication and education btwn OW, OAR with support from Biosolids
office
Third party review/federal review/reporting to provide information not just from
company
Provide more certainty on how these types of facilities are
permitted (pyro/gasif)
(+3) Lingering questions about
PFAS
(+1) how to regulate solids that
come out of pyr/gas would be
helpful
(+1) Local rules impact ability to find sites to build - would benefit from state support to
advocate for policies that allow for permits.
Comes up in industrially impacted sludge from PFAS w/ land application and landfills (nervous) taken off table
Political issues w/ moving this material (GB as an example from MI) – liability
issue
Better understand the fate and transport
(+1) Do other technologies better handle PFAS? Understanding what options are available to deal with this contaminant?
Prefer to be in incineration vs. land application

Breakout Reflections
Full Group Reflection via chat/hand raise:
1. For those who participated in the breakout any points you wish to amplify, amend, or share?
2. For those who did not participate in the breakout session – what jumps out at you? Were there any surprises and why is it a surprise?
168

5. SURFACE DISPOSAL AND STORAGE APPROACHES, PLANNING, AND
CHALLENGES

Breakout Group Topic Opportunities and Challenges
• This session explores surface disposal and storage approaches,
planning, and challenges.
170

Key Observations, Obstacles, & Actions
• Impressive brainstorm on experiences with surface disposal and storage planning.
• Peer to Peer direct support during the breakout session ☺!
Explored challenges and opportunities in both planning and surface disposal
• Big constellation of “Small Town” challenges. Big opportunity area for EPA to provide some support?
• Funding
• Expertise and Capacity
• Lack of storage or land disposal sites
• Lack of planning
• Conflicting and/or inconsistent regulations (topic and geographic) Example: Biosolid Storage Regulations.
• Local zoning – cannot build additional storage sites due to restrictions.
• Sampling analysis/approach and analytic methods.
• Alternative methods for analysis for compliance.
171
Breakout Reflections
Full Group Reflection via chat/hand raise:
1. For those who participated in the breakout any points you wish to amplify, amend, or share?
2. For those who did not participate in the breakout session – what jumps out at you? Were there any surprises and why is it a surprise?
172

6. CONTINUITY AND INSTITUTIONAL KNOWLEDGE TRANSFER ACROSS THE
BIOSOLIDS COMMUNITY

Breakout Group Topic Opportunities and Challenges
• Biosolids co-regulators and management professionals experience a
turnover in personnel. This session explores ways in which to create
and maintain continuity and institutional knowledge transfer
across the biosolids community.
174

Key Observations, Obstacles, & Actions
• White house manual; SOPs, compliance plans, sampling plan; written procedures; fact sheets; listservs; regional/national meetings; through regional organizations; and conferences are the primary tools for knowledge and information transfer.
• Key takeaway: Clear need and demand to ramp up opportunities for institutional transfer of knowledge (like this conference!)
Obstacles and Opportunities
• Reliance on paper copies and/or much of the information is ‘trapped’ in documents and slowly getting out of date. Opportunity to improve ability to find/access right technical/background material. Specific suggestions to update topic specific guidance docs from EPA e.g., the plain English guide, domestic septage guidance, manual of good practices, white house document, storage document
• Resources and staffing – having the right amount of people to commit to a biosolids program.
• Retirements are challenging capacity and existing knowledge. Younger generation less enthusiastic about biosolids and stay in positions for only a few years.
• In several states, not allowed to fill position until it’s empty. As a result, can’t get anyone up to speed until that seat is empty. Would like ability to hire on to have that interchange/overlap.
• Opportunity to create “biosolids for beginners, for inspectors, permitters,” etc. Documents to have people to refer people to. Need to have clear resources to start with when new to the field.
• Accept delegation, give grant money to hire more staff – tying delegation to grants or funding is a potential EPA strategy.
• Situations that don’t fit neatly into existing rules or legislation. When situations happen that aren’t covered specifically – people who have been in field for long time have more knowledge to handle it. Opportunity to better use networks/conferences to support this.
• Working with small facilities who don’t receive outreach/help. Need outreach to small facilities. New staff don’t understand 503, etc.
175

Breakout Reflections
Full Group Reflection via chat/hand raise:
1. For those who participated in the breakout any points you wish to amplify, amend, or share?
2. For those who did not participate in the breakout session – what jumps out at you? Were there any surprises and why is it a surprise?
176

7. CURRENT CHALLENGES FOR STATE AND TRIBAL BIOSOLIDS PROGRAMS

Breakout Group Topic Opportunities and Challenges
• While PFAS is a major issue for biosolids programs today, this session
explores non-PFAS challenges that state and tribal programs
currently face and what possible solutions exist.
178

Brainstormed List of Challenges Facing Biosolids Program (non PFAS!)• Gaps in current science and access to emerging science (e.g., on phosphorous) This is exacerbated by internal challenges in dealing with own scientists.
• Understanding emerging technologies including cost and capability of technologies.
• Lack of science and communications about the benefits of biosolids. Need funds for research to document benefits. Most funds are going toward CECs.
• Inter-state transfers of biosolids. Need ways to regulate transport between states and track the treatment processes, complianceetc.
• Working in and communicating with remote areas.
• Running out of capacity for disposal, application sites, etc. Exacerbated by impacts from climate change.
• Changing climate is influencing land application opportunities, timing, storage needs, etc.
• Time and capacity to do this work; response time—e.g. 8 people for 300+ facilities; working on new permit approach; statewide general permit; identifying facilities without active biosolids programs—automatically covered under the general permit.
• Lack of clarity around regulatory jurisdiction. E.g., tribal program bringing biosolids into state; subject to regulations; also, federal facilities. Movements in and out of jurisdictions.
• Regulate struvite; ammonia removal from biosolids; how rule applies to products “derived from” biosolids; secondary products from WW treatment plants. Importance of EPA’s position on 503 rule; helpful for regulators; provide consistency for industry.
• Challenge navigating the benefits of land application and uncertainties.
• Administration of biosolids program. 8 states with delegated authority, others not delegated. No EPA funding; limited FTE. Lack of funding and support. Have a coordinators network (list serv) for asking questions, etc.; EPA website. Would like to be able to do more—e.g., permitting. Not enough to ensure compliance.
• In remote areas of the state, we have tribal lands. Holding times for samples that are shipped to labs. Microbial methods.
• New fields, whether will become part of regulatory frameworks. Antibiotic resistance.
• Phosphorous. Basin plan, TMDL. How can you permit new land application?
• E-reporting
179

Opportunities and Actions for EPA to consider
• Excited about EPA re-engaging in biosolids!
• Supporting end uses and analysis of benefits. Anything EPA can do. Support for science on contaminants—but also on benefits of biosolids as a resource for land application. Organics rule is a big opportunity/need.
• Emerging science and new technologies
• Wastewater resource recovery. Research and science re: potential to contain pathogens. Suggest EPA develop science to support decision-making.
• New technologies. E.g., facility testing infra-red to reduce pathogens; microwave technologies. State regulators, don’t have the experience. Where get more information to understand technologies? Often pick up the phone to EPA Region or ORD.
• On research, EPA is reinvesting in biosolids program. Concerns re: microplastics and other emerging contaminants. Small states don’t have the capacity to do more research. Need information to support land application (where appropriate).
• Rely on EPA for science and supporting science-based decision-making. Appreciated how EPA responded to language/issues raised in the OIG report.
• EPA convene a sharing group for new practitioners.
• Co-digestion and pyrolysis (hydro char). New treatment methods.
180

Breakout Reflections
Full Group Reflection via chat/hand raise:
1. For those who participated in the breakout any points you wish to amplify, amend, or share?
2. For those who did not participate in the breakout session – what jumps out at you? Were there any surprises and why is it a surprise?
181