epidemiology and ecology of tularemia in sweden, 1984 2012 · tularemia in sweden, 1984–2012...
TRANSCRIPT

RESEARCH
32 Emerging Infectious Diseases • www.cdc.gov/eid • Vol. 21, No. 1, January 2015
The zoonotic disease tularemia is endemic in large ar-eas of the Northern Hemisphere, but research is lacking on patterns of spatial distribution and connections with ecologic factors. To describe the spatial epidemiology of and identify ecologic risk factors for tularemia incidence in Sweden, we analyzed surveillance data collected over 29 years (1984–2012). A total of 4,830 cases were noti-fied, of which 3,524 met all study inclusion criteria. From the first to the second half of the study period, mean in-cidence increased 10-fold, from 0.26/100,000 persons during 1984–1998 to 2.47/100,000 persons during 1999–2012 (p<0.001). The incidence of tularemia was higher than expected in the boreal and alpine ecologic regions (p<0.001), and incidence was positively correlated with the presence of lakes and rivers (p<0.001). These results provide a comprehensive epidemiologic description of tu-laremia in Sweden and illustrate that incidence is higher in locations near lakes and rivers.
Tularemia is a zoonotic disease that causes geographi-cally confined and seasonal outbreaks in many loca-
tions in the Northern Hemisphere (1–3). The highly in-fectious causative bacterial agent, Francisella tularensis, comprises 4 subspecies, but nearly all cases of tularemia are caused by subspecies tularensis (type A), the most viru-lent type, which is found in North America, or subspecies holarctica (type B), which is the most widespread species in Europe (4). F. tularensis can infect humans through bites of arthropods (e.g., mosquitoes, ticks, tabanid flies); inhala-tion of infectious aerosols; handling of infected animals; or ingestion of contaminated water (2,3).
Sweden, Finland, and Turkey have reported the high-est incidences of tularemia worldwide (5). In Sweden and Finland, the most common form of the disease is ulcero-glandular tularemia, which is characterized by a skin ulcer at the site of infection and adjacent swollen regional lymph
nodes (6–8). A marked seasonality of tularemia has been reported in Sweden; most cases occur during late summer and early autumn (8–12). An exception was an outbreak af-fecting >2,700 persons during late fall and winter in 1966-1967 (13). In 2000, large numbers of cases were recorded outside the historically tularemia-endemic northern regions of Sweden, which could indicate a changing geographic pattern of disease (6).
F. tularensis subspecies holarctica naturally infects several mammalian wildlife species, in particular, mice, rabbits, hares, beavers, voles, lemmings, and muskrats (14). In Europe, the ticks Dermacentor reticularis and Ixo-des ricinus are vectors for the bacterium (15–17), although previous research has suggested that mosquito bites are the most frequent route of transmission to humans in Sweden (6,9,18). Furthermore, a relationship between exposure to F. tularensis and the presence of lakes and rivers has long been suspected and is repeatedly described in the literature on tu-laremia (4,19–23). However, the ecologic cycles and envi-ronmental reservoirs of tularemia remain largely unknown. Since the 1950s, observed disease patterns have suggested that tularemia foci in nature coincide with a suitable eco-system at a particular place (21,24,25). According to this theory, disease vectors, hosts, and the pathogen are tied to a particular landscape—that is, an ecologic region—as the en-vironmental determinant that controls disease distribution.
To determine the ecologic factors that contribute to the transmission of F. tularensis and the spread of tularemia in Sweden, we examined trends in the epidemiology of tula-remia among humans during 1984–2012. We analyzed de-scriptive epidemiologic data, including the geographic dis-tribution of cases during the study period, and investigated if changes in distribution occurred and if disease was as-sociated with particular ecologic regions and inland water.
Methods
Sources of Epidemiologic, Geographic, and Demographic DataSince 1968, suspected and confirmed tularemia cases have been mandatory reportable diseases as required by the
Epidemiology and Ecology of Tularemia in Sweden, 1984–2012
Amélie Desvars, Maria Furberg, Marika Hjertqvist, Linda Vidman, Anders Sjöstedt, Patrik Rydén, and Anders Johansson
Author affiliations: Umeå University, Umeå, Sweden (A. Desvars, M. Furberg, L. Vidman, A. Sjöstedt, P. Rydén, A. Johansson); and The Public Health Agency of Sweden, Solna, Sweden (M. Hjertqvist)
DOI: http://dx.doi.org/10.3201/eid2101.140916

Emerging Infectious Diseases • www.cdc.gov/eid • Vol. 21, No. 1, January 2015 33
Swedish Communicable Disease and Prevention Act. Data on tularemia cases occurring from September 1984 through December 2012 were collected from the national system for communicable disease surveillance database, maintained by the Public Health Agency of Sweden. Data on patient sex, age, place of residence, suspected location of disease exposure, date of exposure, date of onset of illness, date of diagnosis, and date of notification were retrieved from this database. This study was approved by the Regional Ethical Review Board in Umeå, Sweden (2014-204-31M).
Data on population, land, and water areas were re-trieved from Statistics Sweden (26). The proportion of land area covered by inland water (defined as lakes and rivers >6 meters wide) was determined by municipality. The areas of the 4 largest lakes of Sweden (Vänern, Vättern, Mälaren, and Hjälmaren) and sea water areas were calculated sepa-rately by municipality. Incidences of tularemia, nationwide and by municipality, were calculated on the basis of the number of infections per 100,000 persons and year by us-ing population census data for 1984–2012. The altitude (meters above sea level) at which each tularemia case-pa-tient was exposed to F. tularensis and the centroids of the 9,875 postal code areas in Sweden were retrieved by using the 30 arc-second digital elevation model of Europe (27) and the extraction toolset of the Spatial Analyst toolbox in ArcGIS version 10.0 (ESRI, Gävle, Sweden). Geographic data were visualized by using ArcMap software in ArcGIS and R software version 2.9.1 (http://www.r-project.org).
Geographic Coding and Spatial and Temporal DataFor each tularemia case recorded, geographic coordinates (longitude/latitude) were determined for the location of dis-ease exposure and the disease onset date. (For details, see online Technical Appendix, http://wwwnc.cdc.gov/EID/article/21/1/14-0916-Techapp1.pdf.) These data underwent quality coding to enable subsequent analysis with a high level of spatial and temporal certainty.
Ecologic Regions and Definition of Northern and Southern SwedenFor our study, we used previously defined ecologic regions (e.g., areas defined by the distribution of flora, fauna, geo-morphology, climate, and soils) (28). The southernmost part of Sweden is nemoral forest (broadleaf forest); north of this region is the boreo-nemoral forest region (mixed deciduous and coniferous forest). Most of the rest of the country is boreal forest (coniferous forests) and is divided into 3 subregions: southern, middle, and northern boreal forest. Alpine tundra is located in northwestern Sweden and is composed of the birch forest, the middle to low al-pine forest (grass and shrub heaths, fens), and the high al-pine forest (boulder fields). We defined southern Sweden as the region located south of the southern border of the boreal
forest region; the area above this boundary was defined as northern Sweden (29).
Local Outbreaks and Outbreak LengthA local outbreak was defined as >4 cases of tularemia dur-ing a 30-day period in a municipality. The criterion for a new outbreak was a lag phase of >4 months after the end of the preceding 30-day outbreak period. The mean dura-tion of outbreaks was compared between the northern and southern parts of Sweden by measuring the interquartile ranges of the outbreaks (i.e., the periods during which 50% of cases occurred).
Statistical AnalysisCategorical data were analyzed by using the χ2 test for goodness of fit. Differences between incidence propor-tions were analyzed by using the 2-tailed 2-proportion z-test with a 95% CI, and nonparametric bootstrapping was used to construct a 95% CI for the relative increase in risk. The Wilcoxon rank-sum test was used to compare differ-ences between groups, and the Spearman rank correlation was used to study the dependencies between variables. The spatial distribution of tularemia cases was compared with a regularly distributed set of points determined by the un-derlying population of each municipality. A municipality was part of an ecologic region if its geographic centroid was within the borders of the ecologic region. All statistical analyses were conducted in R version 2.9.1.
Results
Epidemiologic Characteristics of Tularemia in SwedenDuring 1984–2012, a total of 4,830 cases of tularemia were notified to the Public Heath Agency of Sweden; of these, 4,792 patients were infected in Sweden. The annual mean incidence of tularemia on the basis of these 4,792 patients was 1.86 cases per 100,000 persons (range 0.00–5.62; Fig-ure 1). A total of 2,791 (58.2%) case-patients were men; mean age was 47.6 ± 19.5 years (men, 47.8 ± 19.5; wom-en, 47.2 ± 19.5; range 1–95 years). After applying qual-ity criteria for disease onset date and location of disease exposure, 3,524 of the 4,792 cases were included for the subsequent analyses (the quality of descriptive metadata connected with cases is summarized in online Technical Appendix Table 1). All further results, including incidence estimates, were determined on the basis of these 3,524 cas-es for which high-quality data on disease onset date and location of infection were available.
During the study period, tularemia incidence was distrib-uted widely among age groups, with the highest incidence among those 55–69 years of age (Figure 2). The mean annual incidence by age group showed a distinct bimodal pattern for both sexes; peaks in incidence for age groups 10–14 and
Tularemia in Sweden, 1984–2012

RESEARCH
34 Emerging Infectious Diseases • www.cdc.gov/eid • Vol. 21, No. 1, January 2015
55–59 years were 0.93 and 2.75 cases per 100,000 persons, respectively. The global relative risk of contracting tularemia was 1.39 times higher for men/boys than for women/girls; the corresponding difference in incidence between sexes was 0.44 cases/100,000 persons/year (95% CI 0.35–0.53; p<0.001). By age group, the incidence of tularemia for the study period was significantly higher for men than for women in all age groups >55 years of age (Figure 2). The male:female relative risk for infection was 0.89 for the 0- to 4-year age group but ranged from 1.15 to 4.28 for all other age groups.
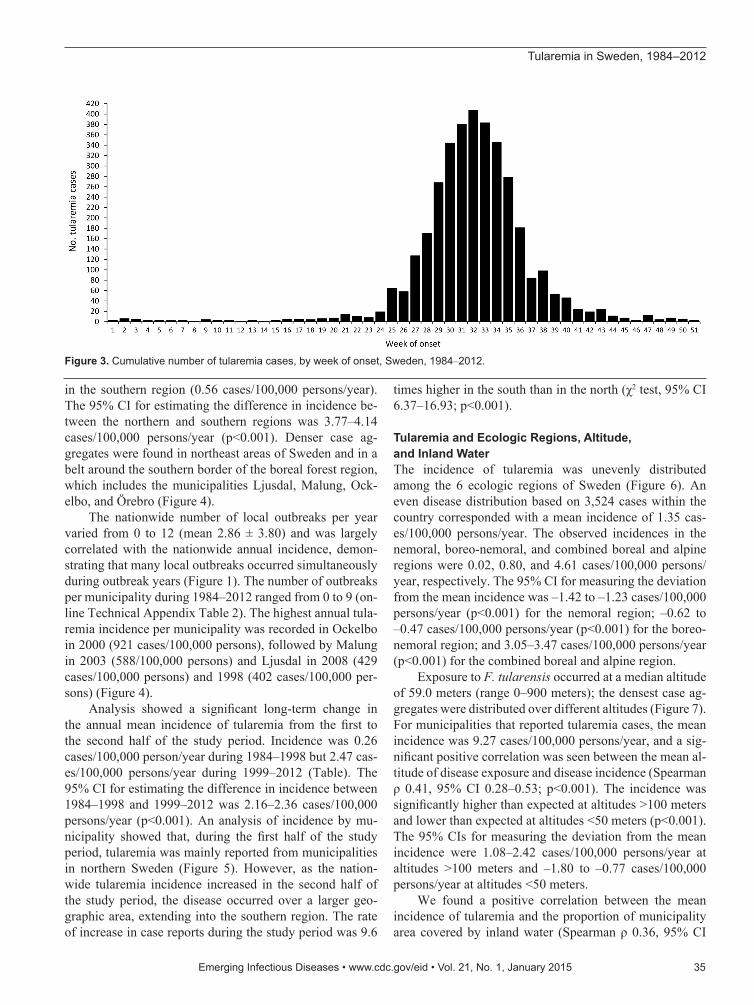
Spatial and Temporal Distribution of Tularemia CasesTularemia reports were highly seasonal. The cumula-tive number of cases per week for 1984–2012 showed a
symmetric pattern with a peak at week 32; approximately two thirds of cases occurred during weeks 29–35 (mid- July to late August; Figure 3). The seasonal outbreak peaks were similarly distributed in the southern region (weeks 30 to 35) and in the northern region (weeks 30 to 34; Wil-coxon rank-sum tests, p>0.05). The mean lengths of out-breaks were also similar between regions (Wilcoxon rank sum test, p>0.05).
Tularemia was reported in 189 of 290 municipalities during the study period; some geographic clustering of cases was evident (Figure 4). Most cases were reported from the northern region, where ≈20% of the Swedish population lives, and incidence was significantly higher in the northern region (4.52 cases/100,000 persons/year) than
Figure 1. Mean incidence of tularemia (per 100,000 persons) and number of local outbreaks, Sweden, 1984–2012.
Figure 2. Annual mean incidence of tularemia by age group and sex, Sweden, 1984–2012. Asterisks (*) indicate significant differences by sex.
Emerging Infectious Diseases • www.cdc.gov/eid • Vol. 21, No. 1, January 2015 35
Tularemia in Sweden, 1984–2012
in the southern region (0.56 cases/100,000 persons/year). The 95% CI for estimating the difference in incidence be-tween the northern and southern regions was 3.77–4.14 cases/100,000 persons/year (p<0.001). Denser case ag-gregates were found in northeast areas of Sweden and in a belt around the southern border of the boreal forest region, which includes the municipalities Ljusdal, Malung, Ock-elbo, and Örebro (Figure 4).
The nationwide number of local outbreaks per year varied from 0 to 12 (mean 2.86 ± 3.80) and was largely correlated with the nationwide annual incidence, demon-strating that many local outbreaks occurred simultaneously during outbreak years (Figure 1). The number of outbreaks per municipality during 1984–2012 ranged from 0 to 9 (on-line Technical Appendix Table 2). The highest annual tula-remia incidence per municipality was recorded in Ockelbo in 2000 (921 cases/100,000 persons), followed by Malung in 2003 (588/100,000 persons) and Ljusdal in 2008 (429 cases/100,000 persons) and 1998 (402 cases/100,000 per-sons) (Figure 4).
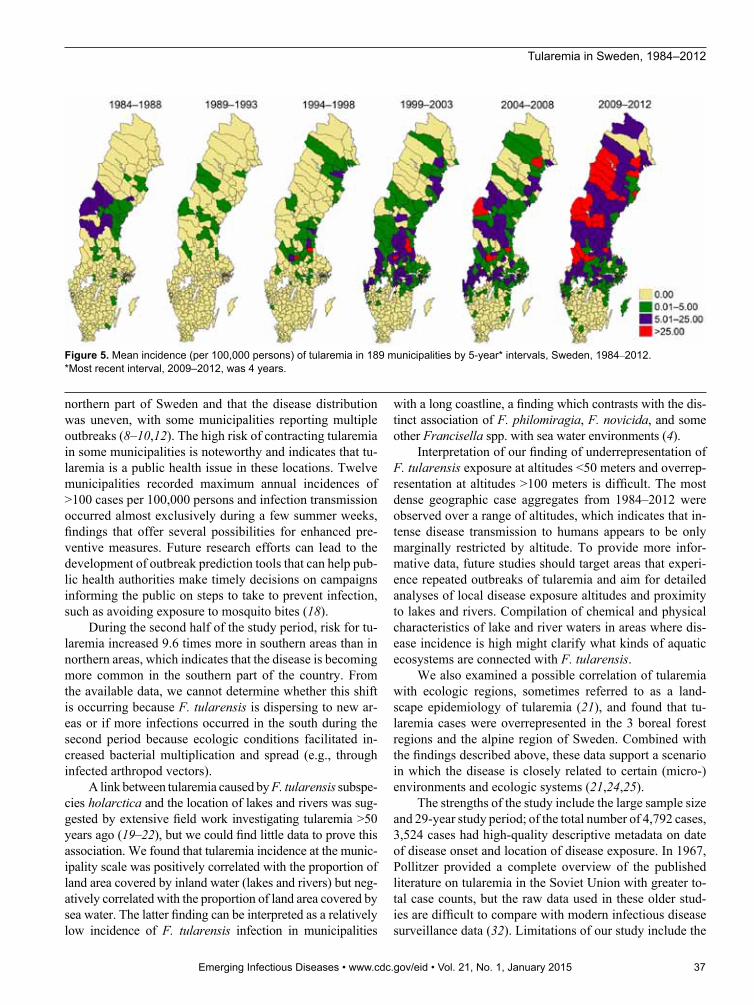
Analysis showed a significant long-term change in the annual mean incidence of tularemia from the first to the second half of the study period. Incidence was 0.26 cases/100,000 person/year during 1984–1998 but 2.47 cas-es/100,000 persons/year during 1999–2012 (Table). The 95% CI for estimating the difference in incidence between 1984–1998 and 1999–2012 was 2.16–2.36 cases/100,000 persons/year (p<0.001). An analysis of incidence by mu-nicipality showed that, during the first half of the study period, tularemia was mainly reported from municipalities in northern Sweden (Figure 5). However, as the nation-wide tularemia incidence increased in the second half of the study period, the disease occurred over a larger geo-graphic area, extending into the southern region. The rate of increase in case reports during the study period was 9.6
times higher in the south than in the north (χ2 test, 95% CI 6.37–16.93; p<0.001).
Tularemia and Ecologic Regions, Altitude, and Inland WaterThe incidence of tularemia was unevenly distributed among the 6 ecologic regions of Sweden (Figure 6). An even disease distribution based on 3,524 cases within the country corresponded with a mean incidence of 1.35 cas-es/100,000 persons/year. The observed incidences in the nemoral, boreo-nemoral, and combined boreal and alpine regions were 0.02, 0.80, and 4.61 cases/100,000 persons/year, respectively. The 95% CI for measuring the deviation from the mean incidence was –1.42 to –1.23 cases/100,000 persons/year (p<0.001) for the nemoral region; –0.62 to –0.47 cases/100,000 persons/year (p<0.001) for the boreo-nemoral region; and 3.05–3.47 cases/100,000 persons/year (p<0.001) for the combined boreal and alpine region.
Exposure to F. tularensis occurred at a median altitude of 59.0 meters (range 0–900 meters); the densest case ag-gregates were distributed over different altitudes (Figure 7). For municipalities that reported tularemia cases, the mean incidence was 9.27 cases/100,000 persons/year, and a sig-nificant positive correlation was seen between the mean al-titude of disease exposure and disease incidence (Spearman ρ 0.41, 95% CI 0.28–0.53; p<0.001). The incidence was significantly higher than expected at altitudes >100 meters and lower than expected at altitudes <50 meters (p<0.001). The 95% CIs for measuring the deviation from the mean incidence were 1.08–2.42 cases/100,000 persons/year at altitudes >100 meters and –1.80 to –0.77 cases/100,000 persons/year at altitudes <50 meters.
We found a positive correlation between the mean incidence of tularemia and the proportion of municipality area covered by inland water (Spearman ρ 0.36, 95% CI
Figure 3. Cumulative number of tularemia cases, by week of onset, Sweden, 1984–2012.

RESEARCH
36 Emerging Infectious Diseases • www.cdc.gov/eid • Vol. 21, No. 1, January 2015
0.23–0.47; p<0.001) but a negative correlation between the mean incidence of tularemia and the proportion of the mu-nicipality areas covered by sea water (Spearman ρ –0.28, 95% CI 00.40 to –0.15; p<0.05). We found no correla-tion between the mean incidence per municipality and the proportion of the municipality area covered by the 4 largest lakes in Sweden (Spearman ρ –0.10; p>0.05).
DiscussionWe used 29 years of nationwide notifiable disease surveillance data on tularemia in Sweden to investigate the epidemiologic
patterns in relation to time, disease location, and certain eco-logic factors. The approach enabled us to identify a marked overrepresentation of cases in the northern part of the coun-try, including annual incidences of 400-900 cases per 100,000 persons in some municipalities, and to identify a marked in-crease in the overall number of cases reported during the study period. We also observed that the rate of disease increase was higher in the southern part of the country than in the northern part, which suggest that tularemia is becoming more common in the southern regions. We also found statistical support for an association of tularemia with the location of lakes and riv-ers and with certain ecologic regions of Sweden, a finding notable because the existence of such associations has been postulated for decades but did not have robust support.
We determined that those 40–70 years of age were at greatest risk for tularemia, whereas, for unknown reasons, young adults were at the lowest risk and children and young teenagers were at intermediate risk. A similar age distri-bution was recently reported from Missouri, USA, which indicates that this type of age distribution is not unique to Sweden (30). Age-related differences in disease incidence could mirror differences in behavior; for example, higher-risk outdoor activities such as farming, hunting, and berry-picking may be more common among 40–70-year-olds.
The difference in incidence that we found between the sexes, with tularemia being more common in men than in women, is notable but not unique to this study. Similar findings were reported in several earlier studies (7,13,31). It is unclear if the sex bias results from a difference in ex-posure to disease or if men are simply more susceptible to tularemia. Our results demonstrate that differences by sex occurred across age groups for all case-patients >5 years of age, a finding that suggests that, among the possible bio-logic mechanisms involved, sex hormone differences are unlikely to explain the difference in incidence.
Results from our large set of case data corroborated previous reports on the seasonality of tularemia. The dis-ease risk peaks in late summer or early autumn with most cases occurring in early August (6,7,9). In addition, we found that tularemia incidence was almost 10-fold higher in the second half than in the first half of the study period. We cannot rule out the possibility that improved disease awareness accounts for this difference, but because tula-remia typically carries distinct symptoms, this is unlikely.
In agreement with previously published data, we observed that the tularemia incidence was highest in the
Figure 4. Distribution of 3,524 tularemia cases, Sweden, 1984–2012. Red dots indicate locations of reported cases; blue line indicates border between northern and southern Sweden, as defined by the southern border of the boreal forest. The municipalities with the highest tularemia incidence (Ljusdal, Malung, Ockelbo), and most outbreaks (Örebro) are indicated, as is the capital city of Stockholm.
Table. Human tularemia notifications, by study period and geographic location, Sweden, 1984–2012*
Study period No. cases (incidence)
Northern Sweden Southern Sweden All Sweden First half, 1984–1998 324 (1.17) 19 (0.02) 343 (0.26) Second half, 1999–2012 2,034 (8.61) 1,147 (1.14) 3,181 (2.47) Full study, 1984–2012 2,358 (4.52) 1,166 (0.56) 3,524 (1.37) *Only cases for which high-quality data on disease onset date and location of disease exposure were available were included. Incidence is given as no. case-patients/100,000 persons/year.
EmergingInfectiousDiseases•www.cdc.gov/eid•Vol.21,No.1,January2015 37
TularemiainSweden,1984–2012
northern part of Sweden and that the disease distribution was uneven, with some municipalities reporting multiple outbreaks (8–10,12). The high risk of contracting tularemia in some municipalities is noteworthy and indicates that tu-laremia is a public health issue in these locations. Twelve municipalities recorded maximum annual incidences of >100 cases per 100,000 persons and infection transmission occurred almost exclusively during a few summer weeks, findings that offer several possibilities for enhanced pre-ventive measures. Future research efforts can lead to the development of outbreak prediction tools that can help pub-lic health authorities make timely decisions on campaigns informing the public on steps to take to prevent infection, such as avoiding exposure to mosquito bites (18).
During the second half of the study period, risk for tu-laremia increased 9.6 times more in southern areas than in northern areas, which indicates that the disease is becoming more common in the southern part of the country. From the available data, we cannot determine whether this shift is occurring because F. tularensis is dispersing to new ar-eas or if more infections occurred in the south during the second period because ecologic conditions facilitated in-creased bacterial multiplication and spread (e.g., through infected arthropod vectors).
A link between tularemia caused by F. tularensis subspe-cies holarctica and the location of lakes and rivers was sug-gested by extensive field work investigating tularemia >50 years ago (19–22), but we could find little data to prove this association. We found that tularemia incidence at the munic-ipality scale was positively correlated with the proportion of land area covered by inland water (lakes and rivers) but neg-atively correlated with the proportion of land area covered by sea water. The latter finding can be interpreted as a relatively low incidence of F. tularensis infection in municipalities
with a long coastline, a finding which contrasts with the dis-tinct association of F. philomiragia, F. novicida, and some other Francisella spp. with sea water environments (4).
Interpretation of our finding of underrepresentation of F. tularensis exposure at altitudes <50 meters and overrep-resentation at altitudes >100 meters is difficult. The most dense geographic case aggregates from 1984–2012 were observed over a range of altitudes, which indicates that in-tense disease transmission to humans appears to be only marginally restricted by altitude. To provide more infor-mative data, future studies should target areas that experi-ence repeated outbreaks of tularemia and aim for detailed analyses of local disease exposure altitudes and proximity to lakes and rivers. Compilation of chemical and physical characteristics of lake and river waters in areas where dis-ease incidence is high might clarify what kinds of aquatic ecosystems are connected with F. tularensis.
We also examined a possible correlation of tularemia with ecologic regions, sometimes referred to as a land-scape epidemiology of tularemia (21), and found that tu-laremia cases were overrepresented in the 3 boreal forest regions and the alpine region of Sweden. Combined with the findings described above, these data support a scenario in which the disease is closely related to certain (micro-)environments and ecologic systems (21,24,25).
The strengths of the study include the large sample size and 29-year study period; of the total number of 4,792 cases, 3,524 cases had high-quality descriptive metadata on date of disease onset and location of disease exposure. In 1967, Pollitzer provided a complete overview of the published literature on tularemia in the Soviet Union with greater to-tal case counts, but the raw data used in these older stud-ies are difficult to compare with modern infectious disease surveillance data (32). Limitations of our study include the
Figure 5.Meanincidence(per100,000persons)oftularemiain189municipalitiesby5-year*intervals,Sweden,1984–2012. *Mostrecentinterval,2009–2012,was4years.

RESEARCH
38 Emerging Infectious Diseases • www.cdc.gov/eid • Vol. 21, No. 1, January 2015
inherent weaknesses of infectious disease surveillance data in general; for example, data on risk factors related to hu-man behavior are lacking, and disease in humans may be underreported because of few clinical symptoms (33,34). Some inaccurate or imprecise information on disease onset date and location of disease exposure may also have slipped through our filters to ensure strict data quality for case in-clusion (e.g., because of patient recall bias).
In conclusion, our findings should stimulate discus-sion on future possibilities to prevent tularemia. Although this disease does not cause a high number of deaths, the ill-ness can be incapacitating for days, weeks, and sometimes even months. Future studies should focus on the causes of an increased risk for disease in men and in older persons of both sexes. Our findings of a significantly increased risk for contracting tularemia in certain ecologic regions and the positive correlation between disease and inland water may prove useful in future prevention strategies. We believe that knowledge of ecologic region and proximity to water can be used to define areas within which tularemia exposure is more
likely. In addition, dynamics introduced by climate change, such as increasing temperature and changing precipitation patterns, can be incorporated in risk assessments (18,35). Fi-nally, further study is needed to identify the reservoirs of F. tularensis in nature and the role of vector abundance. Human activities such as the restoration of wetlands and changes of land use may affect tularemia incidence, but data to influence appropriate risk assessments are lacking.
AcknowledgmentsWe thank all physicians in Sweden and the epidemiologists at the Public Health Agency of Sweden who provided and curated the epidemiological information in the national communicable dis-ease surveillance system and the personnel at Statistics Sweden and at the Swedish Meteorological and Hydrological Institute for providing open data for research. We also thank Frauke Ecke for providing the map on ecological regions.
This work was supported by grants from the Swedish Research Council for Environment, Agricultural Sciences and Spatial Plan-ning (Formas no. 2012-1070) and Västerbotten County Council (Dnr. VLL-378261).
Figure 6. Distribution of tularemia cases by ecologic region, Sweden, 1984–2012. Black dots indicate locations of reported cases. Region designations adopted from (24).
Figure 7. Distribution of tularemia cases by altitude, Sweden, 1984–2012. Black dots indicate locations of reported cases.

Emerging Infectious Diseases • www.cdc.gov/eid • Vol. 21, No. 1, January 2015 39
Tularemia in Sweden, 1984–2012
Dr. Desvars is a veterinarian and a postdoctoral scientist at Umeå University, Umeå, Sweden. Her research interests include epidemiology, animal health, and the ecology of zoo-notic pathogens.
References
1. Francis E. Sources of infection and seasonal incidence of tularaemia in man. Public Health Rep. 1937;52:103–13. http://dx.doi.org/10.2307/4582067
2. Sjöstedt A. Tularemia: history, epidemiology, pathogen physiology, and clinical manifestations. Ann N Y Acad Sci. 2007;1105:1–29. http://dx.doi.org/10.1196/annals.1409.009
3. Penn RL. Francisella tularensis (tularemia). In: Mandell GL, Bennet JE, Dolin R, editors. Mandell, Douglas and Bennett’s principles and practice of infectious diseases. 7th ed. Phildelphia: Elsevier, Churchill Livingstone; 2010. p. 2927–37.
4. Keim P, Johansson A, Wagner DM. Molecular epidemiology, evolution, and ecology of Francisella. Ann N Y Acad Sci. 2007;1105:30–66. http://dx.doi.org/10.1196/annals.1409.011
5. Global Infectious Disease and Epidemiology Network (GIDEON). 2014 [cited 2014 Jan 21]. http://www.gideononline.com
6. Eliasson H, Lindbäck J, Nuorti JP, Arneborn M, Giesecke J, Tegnell A. The 2000 tularemia outbreak: a case-control study of risk factors in disease-endemic and emergent areas, Sweden. Emerg Infect Dis. 2002;8:956–60. http://dx.doi.org/10.3201/eid0809.020051
7. Rossow H, Ollgren J, Klemets P, Pietarinen I, Saikku J, Pekkanen E, et al. Risk factors for pneumonic and ulceroglandular tularaemia in Finland: a population-based case-control study. Epidemiol Infect. 2014;142:2207–16. http://dx.doi.org/10.1017/S0950268813002999
8. Tärnvik A, Sandström G, Sjöstedt A. Epidemiological analysis of tularemia in Sweden 1931–1993. FEMS Immunol Med Microbiol. 1996;13:201–4. http://dx.doi.org/10.1016/0928-8244(95)00104-2
9. Christenson B. An outbreak of tularemia in the northern part of central Sweden. Scand J Infect Dis. 1984;16:285–90. http://dx.doi.org/10.3109/00365548409070402
10. Payne L, Arneborn M, Tegnell A, Giesecke J. Endemic tularemia, Sweden, 2003. Emerg Infect Dis. 2005;11:1440–2. http://dx.doi.org/10.3201/eid1109.041189
11. Eliasson H, Bäck E. Tularaemia in an emergent area in Sweden: an analysis of 234 cases in five years. Scand J Infect Dis. 2007;39:880–9. http://dx.doi.org/10.1080/00365540701402970
12. Public Health Agency of Sweden. Disease statistics: tularemia [harpest] [in Swedish]. 2014 [cited 2014 Apr 5]. http://www.folk halsomyndigheten.se
13. Dahlstrand S, Ringertz O, Zetterberg B. Airborne tularemia in Sweden. Scand J Infect Dis. 1971;3:7–16.
14. Mörner T, Addison E. Tularemia. In: Williams ES, Barker IK, editors. Infectious diseases of wild mammals. Ames (IA): Iowa State University Press; 2001. p. 303–12.
15. Reye AL, Stegniy V, Mishaeva NP, Velhin S, Hübschen JM, Ignatyev G, et al. Prevalence of tick-borne pathogens in Ixodes ricinus and Dermacentor reticulatus ticks from different geographical locations in Belarus. PLoS ONE. 2013;8:e54476. http://dx.doi.org/10.1371/journal.pone.0054476
16. Gehringer H, Schacht E, Maylaender N, Zeman E, Kaysser P, Oehme R, et al. Presence of an emerging subclone of Francisella tularensis holarctica in Ixodes ricinus ticks from south-western Germany. Ticks Tick Borne Dis. 2013;4:93–100. http://dx.doi.org/10.1016/j.ttbdis.2012.09.001
17. Reis C, Cote M, Paul RE, Bonnet S. Questing ticks in suburban forest are infected by at least six tick-borne pathogens. Vector Borne Zoonotic Dis. 2011;11:907–16. http://dx.doi.org/10.1089/vbz.2010.0103
18. Rydén P, Björk R, Schäfer ML, Lundström JO, Petersén B, Lindblom A, et al. Outbreaks of tularemia in a boreal forest region
depends on mosquito prevalence. J Infect Dis. 2012;205:297–304. http://dx.doi.org/10.1093/infdis/jir732
19. Bell JF. Tularaemia. In: Steel JH, editor. CRC handbook series, zoonoses section A: bacterial, rickettsial, and mycotic diseases. Boca Raton (FL): CRS Press; 1980. p. 161–93.
20. Parker RR, Steinhaus EA, Kohls GM, Jellison WL. Contamination of natural waters and mud with Pasteurella tularensis and tularemia in beavers and muskrats in the northwestern United States. Bull Natl Inst Health. 1951;193:1–161.
21. Pavlovsky EN. Natural nidality of transmissible diseases, with special reference to the landscape epidemiology of zooanthroponse. Urbana (IL): University of Illinois Press; 1966.
22. Jellison WL. Tularemia in North America, 1930–1974. Missoula (MT): University of Montana Foundation; 1974.
23. Thelaus J, Andersson A, Broman T, Bäckman S, Granberg M, Karlsson L, et al. Francisella tularensis subspecies holarctica occurs in Swedish mosquitoes, persists through the developmen-tal stages of laboratory-infected mosquitoes and is transmissible during blood feeding. Microb Ecol. 2014;67:96–107. http://dx.doi.org/10.1007/s00248-013-0285-1
24. Svensson K, Bäck E, Eliasson H, Berglund L, Granberg M, Karlsson L, et al. Landscape epidemiology of tularemia outbreaks in Sweden. Emerg Infect Dis. 2009;15:1937–47. http://dx.doi.org/10.3201/eid1512.090487
25. Goethert HK, Telford SR III. Nonrandom distribution of vector ticks (Dermacentor variabilis) infected by Francisella tularensis. PLoS Pathog. 2009;5:e1000319. http://dx.doi.org/10.1371/journal.ppat.1000319
26. Statistics Sweden. Statistical database. 2014 [cited 2014 Apr 5]. http://www.scb.se
27. US Geological Survey Center for Earth Resources Observation and Science. Global 30-arc-second elevation data set. Sioux Falls (SD): The Center; 1996.
28. Sjörs H. The background: geology, climate and zonation. In: Rydin H, Snoeijs P, Diekmann M editors. Swedish plant geography. Uppsala (Sweden): Acta phytogeographica Suecica 84; 1999. p. 244.
29. Axelsson R, Angelstam P. Uneven-aged forest management in boreal Sweden: local forestry stakeholders’ perceptions of different sustainability dimensions. Forestry. 2011;84:567–79. http://dx.doi.org/10.1093/forestry/cpr034
30. Weber IB, Turabelidze G, Patrick S, Griffith KS, Kugeler KJ, Mead PS. Clinical recognition and management of tularemia in Missouri: a retrospective records review of 121 cases. Clin Infect Dis. 2012;55:1283–90. http://dx.doi.org/10.1093/cid/cis706
31. Staples JE, Kubota KA, Chalcraft LG, Mead PS, Petersen JM. Epidemiologic and molecular analysis of human tularemia, United States, 1964–2004. Emerg Infect Dis. 2006;12:1113–8. http://dx.doi.org/10.3201/eid1207.051504
32. Pollitzer R. History and incidence of tularemia in the Soviet Union; a review. Bronx (NY): Fordham University Institute of Contempo-rary Russian Studies; 1967.
33. Clark DV, Ismailov A, Seyidova E, Hajiyeva A, Bakhishova S, Hajiyev H, et al. Seroprevalence of tularemia in rural Azerbaijan. Vector Borne Zoonotic Dis. 2012;12:558–63. http://dx.doi.org/10.1089/vbz.2010.0081
34. Ljung O. Intradermal and agglutination tests in tularaemia; with particular regard to the demonstration of past infec-tion. Acta Med Scand. 1958;160:149–54. http://dx.doi.org/10.1111/j.0954-6820.1958.tb10337.x
35. Semenza JC, Menne B. Climate change and infectious diseases in Europe. Lancet Infect Dis. 2009;9:365–75. http://dx.doi.org/10.1016/S1473-3099(09)70104-5
Address for correspondence: Anders Johansson, Department of Hospital Infection Control, Umeå University, SE-901 85, Umeå, Sweden; email: [email protected]

Page 1 of 2
Article DOI: http://dx.doi.org/10.3201/eid2101.140916
Epidemiology and Ecology of Tularemia in Sweden, 1984–2012
Technical Appendix
Geographic coordinates and quality coding of locations of disease exposure and disease onset dates
Data collected from the national system for communicable disease surveillance at the
Public Health Agency of Sweden on the location of disease exposure and the disease onset date
were quality coded for each case patient notified. Subsequently, only cases with high-quality
data were included for further analyses (Technical Appendix Table 1). The location of disease
exposure was selected and a geographical coordinate determined as follows: quality code 1 for a
small-sized distinct and unmistakably named disease exposure location, e.g. a small village or
the place of residence; quality code 2 for the place of residence if a record in the database stated
disease exposure by the municipality name coinciding with the place of residence; quality code 3
for the place of residence if a specific place of disease exposure was not specified; quality code 4
for an unmistakably named disease exposure location if several such potential locations were
specified, with the final decision based on an educated guess including knowledge of where
other case patients had contracted disease the same year; quality code 5 for a large geographical
area (such as a County); and finally quality code 6 for missing data. The disease onset date was
determined as follows: quality code A for the disease onset date if this was notified; quality code
B for the disease exposure date if the disease onset date was missing; quality code C for the date
of disease notification if both the disease onset date and the disease exposure date were missing.
We included in this study only case patients with high-quality information on the location of
disease exposure (quality codes 1 and 2) and robust information for making an accurate
estimation of the disease onset date (quality codes A and B).
Descriptive epidemiological data and geographical coordinates of the local outbreaks are
detailed in Technical Appendix Table 2.

Page 2 of 2
Technical Appendix Table 1. Quality coding of time and place data for domestic tularemia notifications 1984–2012 in the Swedish national system for communicable disease surveillance*
Quality code for location of disease exposure
Quality code for disease onset date and corresponding no. case-patients
A B C 1 3,326 70 341 2 142 6 16 3 233 11 64 4 117 4 15 5 164 4 17 6 94 4 164 *Boldface indicates tularemia case-patients that met all study inclusion criteria. Technical Appendix Table 2. Descriptive data on local outbreaks in Sweden, 1984–2012 Municipalities where local outbreaks occurred
No. outbreaks (years, first
outbreak−last outbreak)
Mean incidence*
Cumulative no. cases Maximum annual
incidence (year)
Longitude; latitude in decimal degrees for the centroid of the
municipality Outbreak
years Nonoutbreak
years Outbreak
years Nonoutbreak
years Arboga 1 (2010) 105.38 6.34 14 24 105.38 (2010) 59.4000; 15.8333 Arvika 1 (2003) 26.61 2.32 7 17 26.61 (2003) 59.7364; 12.6972 Berg 1 (2010) 163.22 2.88 12 6 163.22 (2010) 62.7725; 14.1699 Boden 4 (2002−2012) 91.28 2.11 101 15 166.68 (2012) 66.0310; 21.1208 Bollnäs 2 (1995−2000) 70.51 3.79 38 27 115.95 (2000) 61.3484; 16.3943 Borlänge 1 (2003) 57.55 2.17 27 29 57.55 (2003) 60.4884; 15.3620 Ekerö 1 (2010) 55.10 3.30 14 22 55.09 (2010) 59.2798; 17.7902 Eskilstuna 2 (2000−2010) 23.77 1.40 44 35 24.92 (2000) 59.3184;16.3833 Falun 1 (2003) 39.99 3.02 22 47 39.99 (2003 60.7169; 15.8428 Flen 1 (2000) 60.37 4.19 10 19 60.37 (2000) 59.0579; 16.5879 Gagnef 5 (1995−2012) 155.86 11.57 79 28 229.72 (2012) 60.4528; 14.8480 Gävle 5 (1985−2012) 28.56 1.44 131 32 57.80 (2003) 60.6749; 17.1413 Hammarö 4 (1999−2009) 86.59 14.81 46 37 172.54 (2010) 59.3115;13.5299 Kalix 1 (2011) 48.22 2.46 8 12 48.22 (2011) 65.9178; 22.8775 Karlstad 4 (2006−2010) 19.01 1.33 64 28 22.42 (2006) 59.3791;13.5008 Katrineholm 1 (2000) 52.52 2.65 17 24 52.52 (2000) 59.0019; 16.4523 Krokom 2 (2008−2011) 58.89 4.92 17 19 62.83 (2008) 63.8201; 14.2943 Köping 1 (2002) 40.57 1.44 10 10 40.57 (2002) 59.5121; 15.9945 Lindesberg 1 (2003) 29.86 2.46 7 16 29.86 (2003) 59.5977; 15.2229 Ljusdal 4 (1995−2008) 276.99 6.97 219 34 428.58 (2008) 61.8308; 16.0818 Ludvika 1 (2003) 73.05 1.52 19 11 73.05 (2003) 60.2051; 14.9393 Luleå 1 (2012) 21.36 0.83 16 17 21.36 (2012) 65.6611; 21.9320 Malung 1 (2003) 588.35 10.47 62 31 588.35 (2003) 60.6864;13.7210 Nordanstig 2 (2003−2005) 95.84 9.36 19 26 100.29 (2003) 62.0359; 17.2048 Nyköping 1 (2000) 18.34 0.98 9 14 18.34 (2000) 58.7528; 17.0085 Ockelbo 3 (1995−2003) 447.47 17.18 83 27 920.99 (2000) 60.8918; 16.7201 Ovanåker 1 (2000) 72.05 4.15 9 14 72.05 (2000) 61.5738; 15.6054 Piteå 3 (1996−2012) 69.87 1.23 86 13 160.67 (2012) 65.3168; 21.4801 Robertsfors 1 (2012) 74.44 3.56 5 7 74.44 (2012) 64.1348; 20.7981 Sandviken 2 (2000−2009) 24.30 0.99 18 10 32.38 (2000) 60.6216; 16.7759 Skellefteå 3 (1999−2012) 16.59 1.17 36 22 20.55 (1999) 64.7048; 20.6358 Strömsund 1 (2010) 49.24 5.16 6 20 49.24 (2010) 63.8522; 15.5678 Sundsvall 2 (2003−2012) 7.87 1.45 15 37 9.31 (2012) 62.3908; 17.3067 Umeå 1 (2008) 7.98 0.44 9 14 7.98 (2008) 63.9565; 20.3265 Vansbro 2 (2003−2008) 190.19 12.99 27 25 279.17 (2003) 60.5099; 14.2253 Ånge 1 (2010) 139.26 4.80 14 15 139.26 (2010) 62.4507; 15.3702 Åre 2 (2008−2012) 62.95 9.58 13 26 68.23 (2008) 63.5856; 12.7115 Älvsbyn 1 (2012) 73.17 2.02 6 5 73.17 (2012) 65.6826; 20.7634 Örebro 9 (2000−2011) 24.71 0.83 286 22 82.35 (2003) 59.2753; 15.2134 Örnsköldsvik 1 (2012) 27.27 1.79 15 28 27.27 (2012) 63.4490; 18.3156 Östersund 1 (2010) 21.88 1.34 13 22 21.88 (2010) 63.2070; 14.8475 *Incidence is given as no. of cases/100,000 persons/year.