establishing kpis and developing a comprehensive situation ... · establishing kpis and developing...
TRANSCRIPT

1
Strategic Enrollment Planning Executive Forum
Establishing KPIs and Developing a Comprehensive Situation Analysis
Senior Vice President Gary Fretwell
2
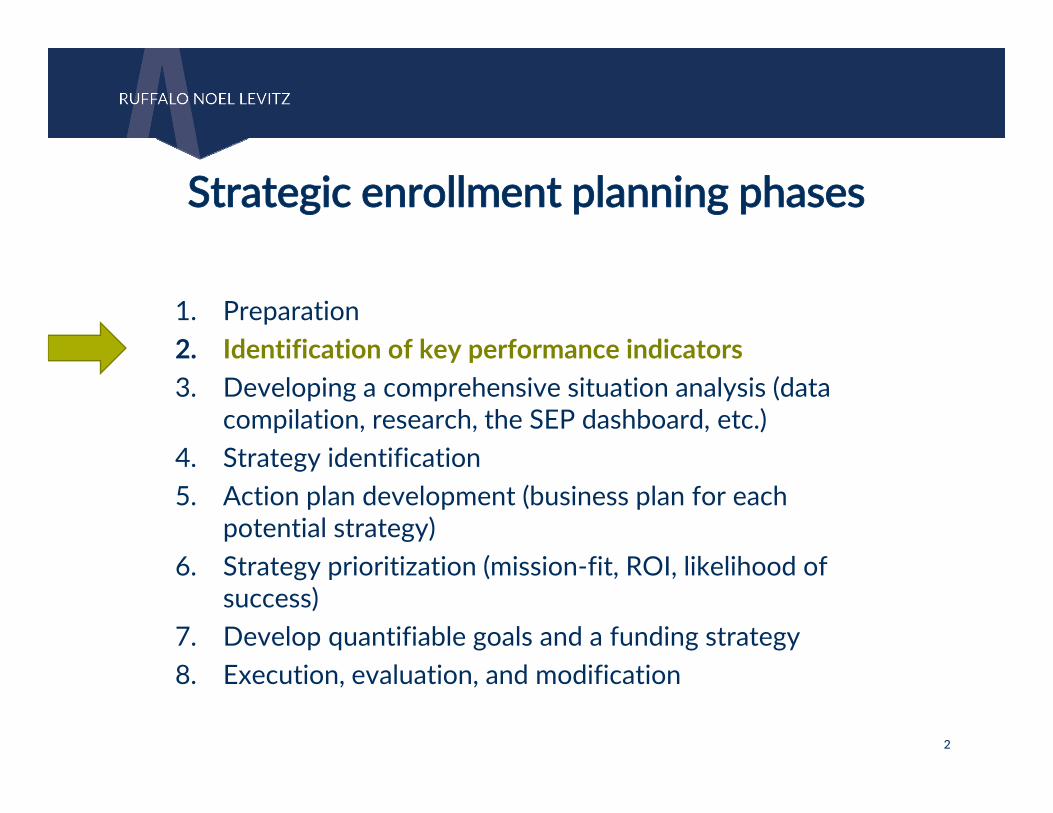
1. Preparation 2. Identification of key performance indicators3. Developing a comprehensive situation analysis (data
compilation, research, the SEP dashboard, etc.)4. Strategy identification5. Action plan development (business plan for each
potential strategy)6. Strategy prioritization (mission‐fit, ROI, likelihood of
success) 7. Develop quantifiable goals and a funding strategy8. Execution, evaluation, and modification
Strategic enrollment planning phases

3
Establishing Key Performance Indicators and Aligning Research
Data Required to Develop a Comprehensive Situation Analysis
Internal and External Research Checklist
Session overview
1
2
3
4
Establishing Key Performance Indicators and Aligning Your Research

5
•KPIs are commonly‐acknowledged measurements that are directly related and critical to the mission and fiscal health of the institution. (Large items such as enrollment or student quality.)
Key Performance Indicators
•PIs are important measurements that are indirectly related to the mission and support key performance indicators. (Specific items such as applicants or ACT/SAT score averages.)
Performance Indicators
What are key performance indicators (KPIs)?
6
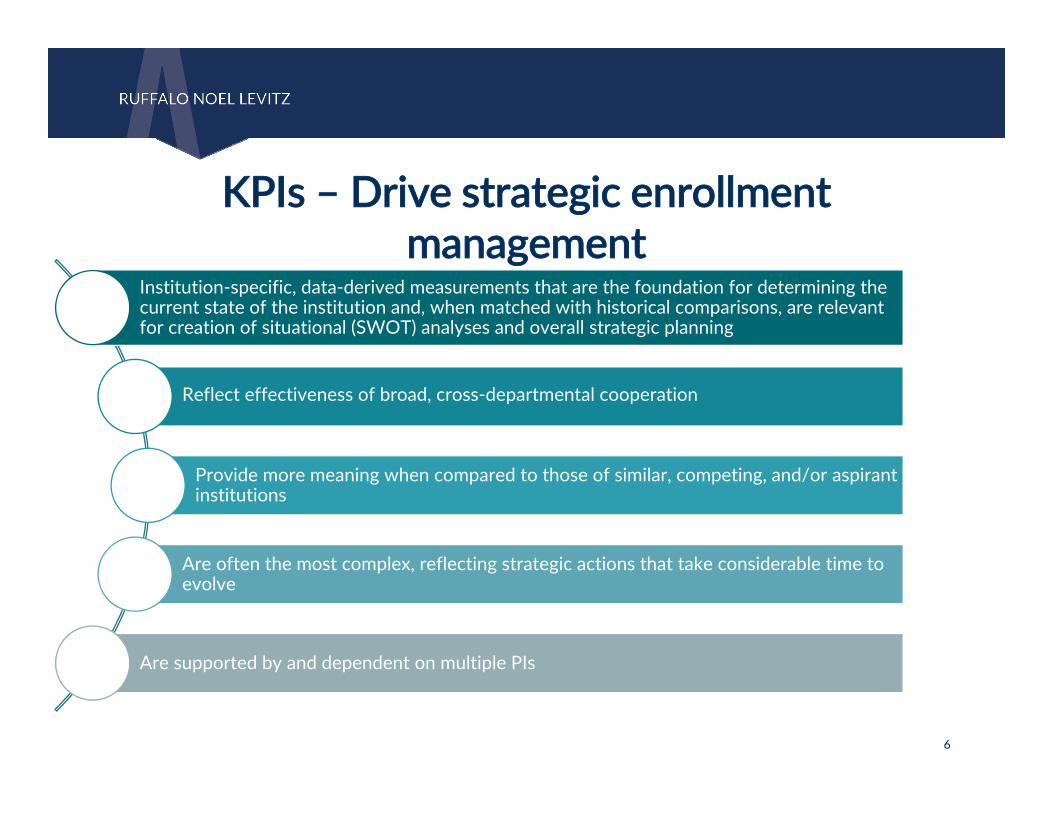
Institution‐specific, data‐derived measurements that are the foundation for determining the current state of the institution and, when matched with historical comparisons, are relevant for creation of situational (SWOT) analyses and overall strategic planning
Reflect effectiveness of broad, cross‐departmental cooperation
Provide more meaning when compared to those of similar, competing, and/or aspirant institutions
Are often the most complex, reflecting strategic actions that take considerable time to evolve
Are supported by and dependent on multiple PIs
KPIs – Drive strategic enrollment management

7
Often, PIs can be addressed more readily than KPIs; it takes improvement in multiple PIs to impact any one or more KPIs
Nearly all PIs are a function of the work done among two or more functional areas
Improvements in KPIs and PIs should be an integral part of any institution’s strategic planning regimen
Through the planning process, institutions can create a list of PIs to support KPI development
Performance indicators (PIs) support KPIs

8
KPI: Enrollment – Headcount, FTE, off‐site enrollment, online enrollment, transfer students, undergraduate/graduate, full‐ and part‐time, geographic origin of students, retention and graduation rates
KPI: Student Quality – Average ACT/SAT scores (and 25th‐75th percentile), average high school GPA, average college GPA, rank in class
KPI: Program Quality – CCSSE or NSSE results, student outcomes, capstone course results, placement or licensure exam results, average class size, undergraduate and graduate research, alumni survey data
KPI: Market Position – Program awareness, web site traffic, name recognition, market penetration analyses, institutional image studies, employer survey data
KPI: Fiscal Health – Gross and net operating revenues, auxiliary income, E&G costs by student sub‐groups where specialized programs are provided (academic support), net tuition by academic program, co‐curricular program, and student segment (academic ability and need)
The interplay between KPIs and PIs

9
Enrollment
External
MarketDemand
Selectivity
Diversity
True Capacity
Pricing and Net Costs
Persistence, Graduation
Capacity Analysis
Student Life
Marketing Data
Experience Engagement
Program Quality
The institution’s mission and data should drive the development and agreement of KPIs
Data Types

10
KPIs are often the most complex, reflecting strategic actions that take considerable time to evolve
KPI: Full‐time Undergraduate Headcount
Graduating Seniors
New FY, Transfer, & Re-Admits
FT UG Headcount
Attrition
11
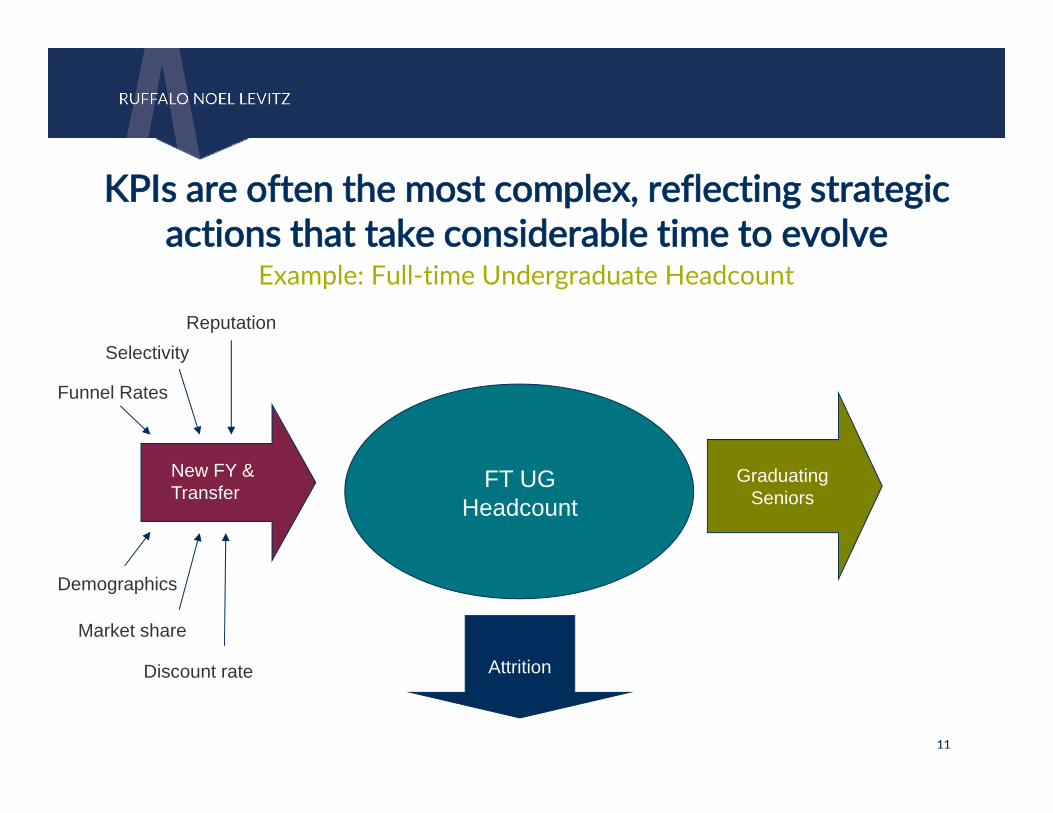
New FY & Transfer FT UG
Headcount
Funnel Rates
SelectivityReputation
Demographics
Market share
Discount rate Attrition
Graduating Seniors
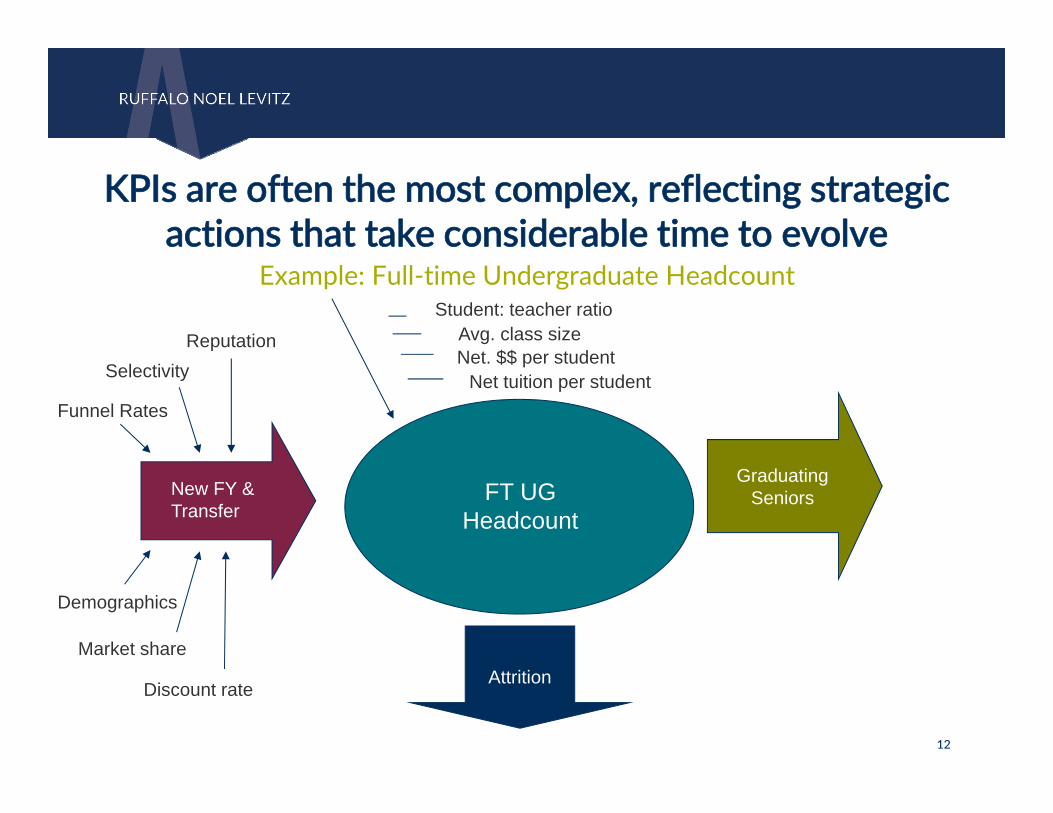
KPIs are often the most complex, reflecting strategic actions that take considerable time to evolve
Example: Full‐time Undergraduate Headcount
12
New FY & Transfer
FT UG Headcount
Funnel Rates
SelectivityReputation
Demographics
Market share
Discount rate
Student: teacher ratioAvg. class sizeNet. $$ per student
Net tuition per student
Attrition
Graduating Seniors
KPIs are often the most complex, reflecting strategic actions that take considerable time to evolve
Example: Full‐time Undergraduate Headcount

13
New FY & Transfer
FT UG Headcount
Funnel Rates
SelectivityReputation
Demographics
Market share
Discount rate
First-year, So, Jr., Sr. rates Minority, high revenue, athletes, etc.
Student: teacher ratioAvg. class sizeNet. $$ per student
Net tuition per student
Attrition
Graduating Seniors
KPIs are often the most complex, reflecting strategic actions that take considerable time to evolve
Example: Full‐time Undergraduate Headcount

14
New FY & Transfer
FT UG Headcount
Funnel Rates
SelectivityReputation
Demographics
Market share
Discount rate
Placement rate: Grad & Prof. Sch.
Student loan debt
Job placement rate
Overall satisfaction
4,5,6 yr. grad. rates
NSSE scores
First year, So, Jr. Sr. Rates Minority, High revenue, Athletes, etc.
Student: teacher ratioAvg. class sizeNet. $$ per studentNet tuition per student
Attrition
Graduating Seniors
KPIs are often the most complex, reflecting strategic actions that take considerable time to evolve
Example KPI: Full‐time Undergraduate Headcount

15
Table One: Summary of Enrollment Key Performance Indicator’s PIsEnrollment PIs Five‐year mean 2016‐17 Metric/Empirical Definition
Inquiries Total number
Applicants Total number
Acceptance rate Percent admitted full‐time, first‐time students
Undergraduate freshmen cohort
Total number of first‐time, full‐time freshmen
Undergraduate headcount
Total number
Undergraduate FTE Total number of units attempted divided by 15
Undergraduate FTE for two‐year programs
Total number of units attempted divided by 15 enrolled in two‐year programs
New transfers Total number of students coming from another institution
Out‐of‐state (%) Percent of student body who are not stateresidents
International (%) Percent of student body coming from other countries
Defining the metric
16
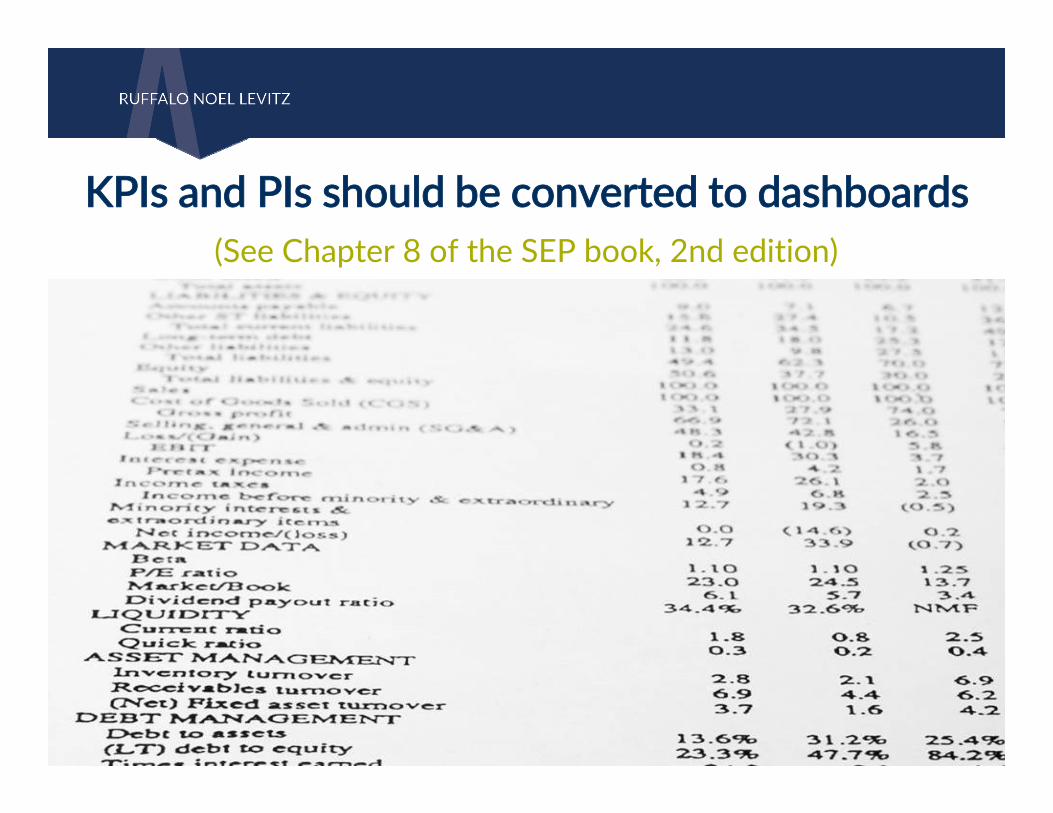
KPIs and PIs should be converted to dashboards(See Chapter 8 of the SEP book, 2nd edition)

17
• Typically, KPIs are identified early in the process, especially if the institution has a clear sense of its desired direction or has externally mandated performance metrics
• Operationalizing of some KPIs may occur later in the process and arise from data collection and the situation analysis
• Worry less about the distinction between KPIs and PIs than about identifying measures that matter
• The real key is building a robust SEP dashboard to inform strategy development and business planning, and using that dashboard to monitor and evaluate strategy implementation and outcomes; if you do that, the KPIs and PIs will take care of themselves
Final thoughts on KPIs

18
Task One: KPI Identification• Sketch out the existing key performance indicators (KPIs) for your institution. Recall that KPIs are measures that determine the success or failure of the institution in fulfilling its mission and vision.
• As you have time, consider performance indicators (PIs) which contribute to each KPI.
Working session
19
Data Required to Develop a Comprehensive Situation Analysis

20
1. Preparation 2. Identification of key performance indicators 3. Developing a comprehensive situation analysis (data
compilation, research, the SEP dashboard, etc.)4. Strategy identification5. Action plan development (business plan for each
potential strategy)6. Strategy prioritization (mission‐fit, ROI, likelihood of
success) 7. Develop quantifiable goals and a funding strategy8. Execution, evaluation, and modification
Strategic enrollment planning phases

21
A systematic collection and evaluation of past and present data, aimed at identification of internal and external forces that may influence the institutional performance and choice of strategies. In addition it will allow a comprehensive assessment of the organization’s current and future strengths, weaknesses, opportunities, and threats.
Definition of Situation Analysis
22
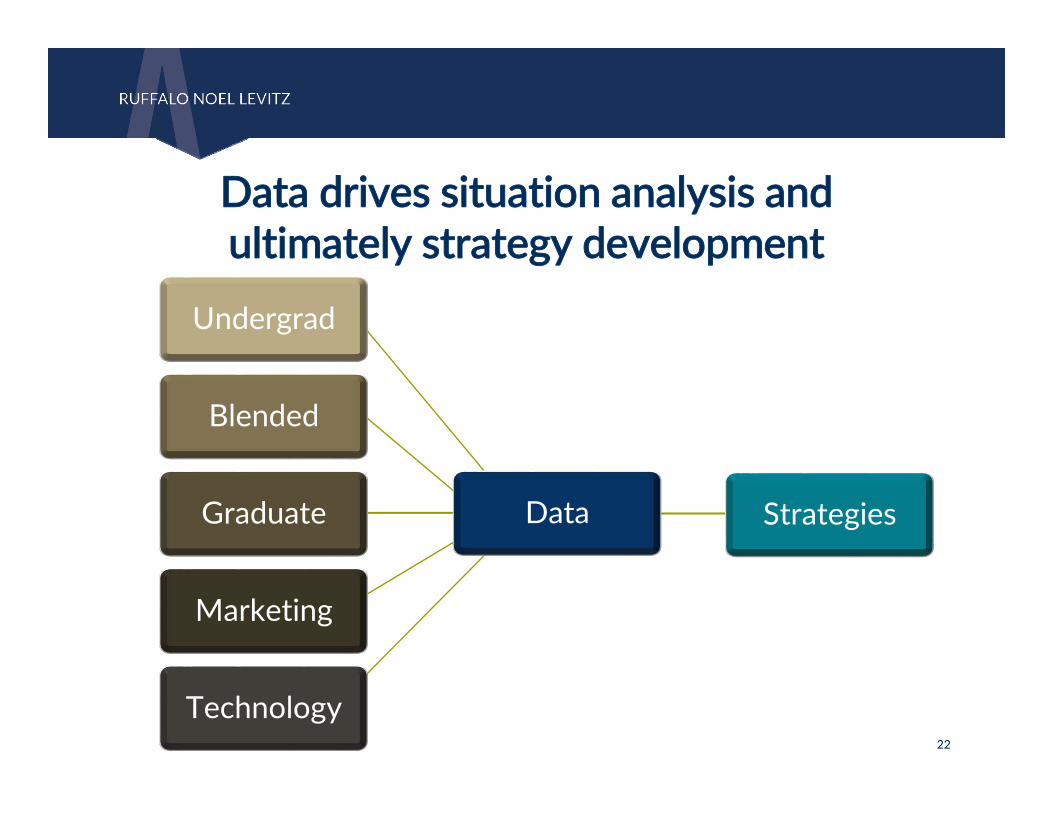
Data drives situation analysis and ultimately strategy development
Undergrad
Blended
Graduate
Marketing
Technology
Data Strategies
23
Data readiness, availability, exploration

24
What do you know? What do you wish you knew?

25
Each planning process will vary because each institution’s planning situation is different
What data is available
The institutional objectives
What level of commitment
Quality of the existing work
What plans/actions exist
What are critical timelines
The SEP process is highly
customized
UniqueStrategicPlan

26
Creating an information‐driven culture
Comprehensive information system and database
Create relevant reports
Make decisions based on information analysis

27
Four macro data will be required
Environmental data
Competitor data
Market demand data
Institutional strength data

28
Three over‐arching aspects of data you must know

29
Environmental Data
30
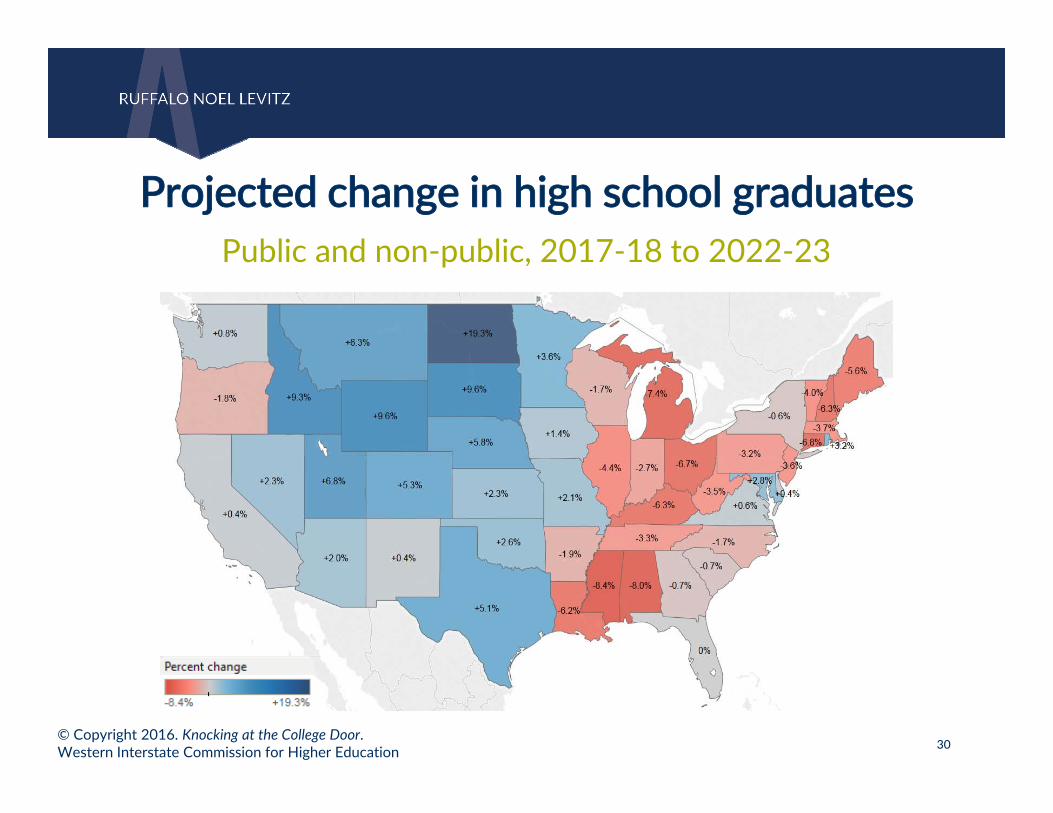
Projected change in high school graduatesPublic and non‐public, 2017‐18 to 2022‐23
© Copyright 2016. Knocking at the College Door.Western Interstate Commission for Higher Education

31
Projected change in high school graduatesWhite, non‐Hispanic, 2017‐18 to 2022‐23
© Copyright 2016. Knocking at the College Door.Western Interstate Commission for Higher Education
32
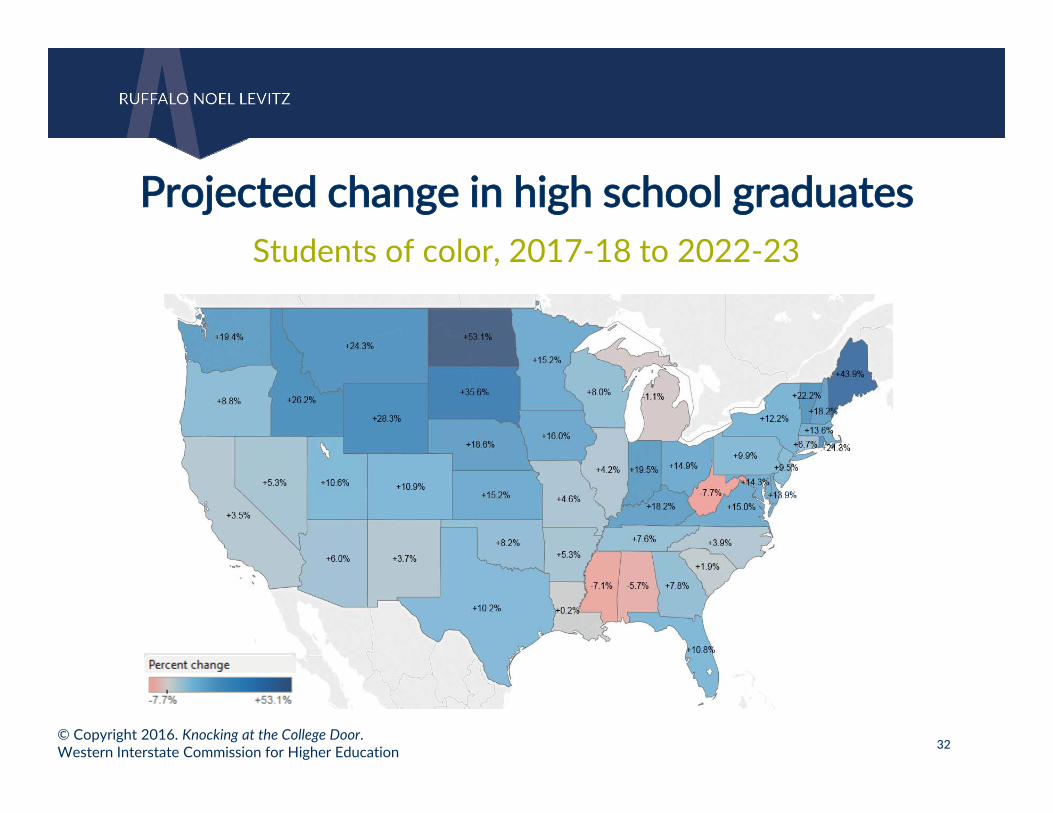
Projected change in high school graduatesStudents of color, 2017‐18 to 2022‐23
© Copyright 2016. Knocking at the College Door.Western Interstate Commission for Higher Education

33
Understanding Your Competition
34
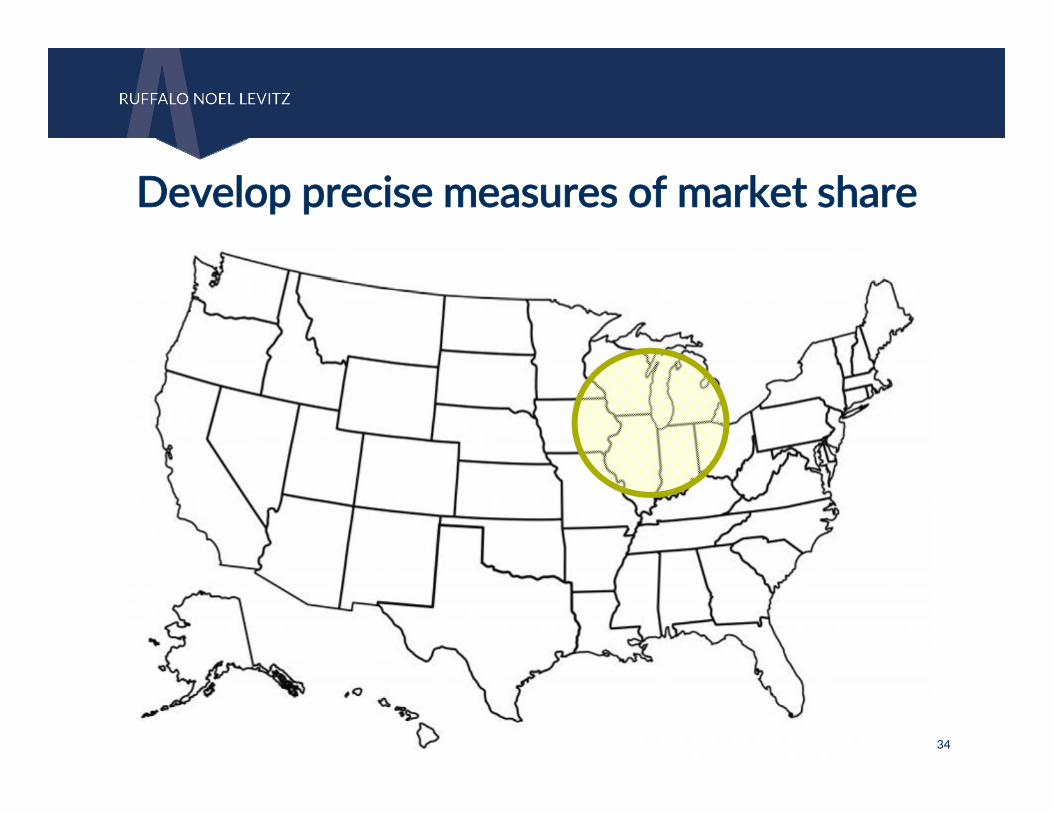
Develop precise measures of market share
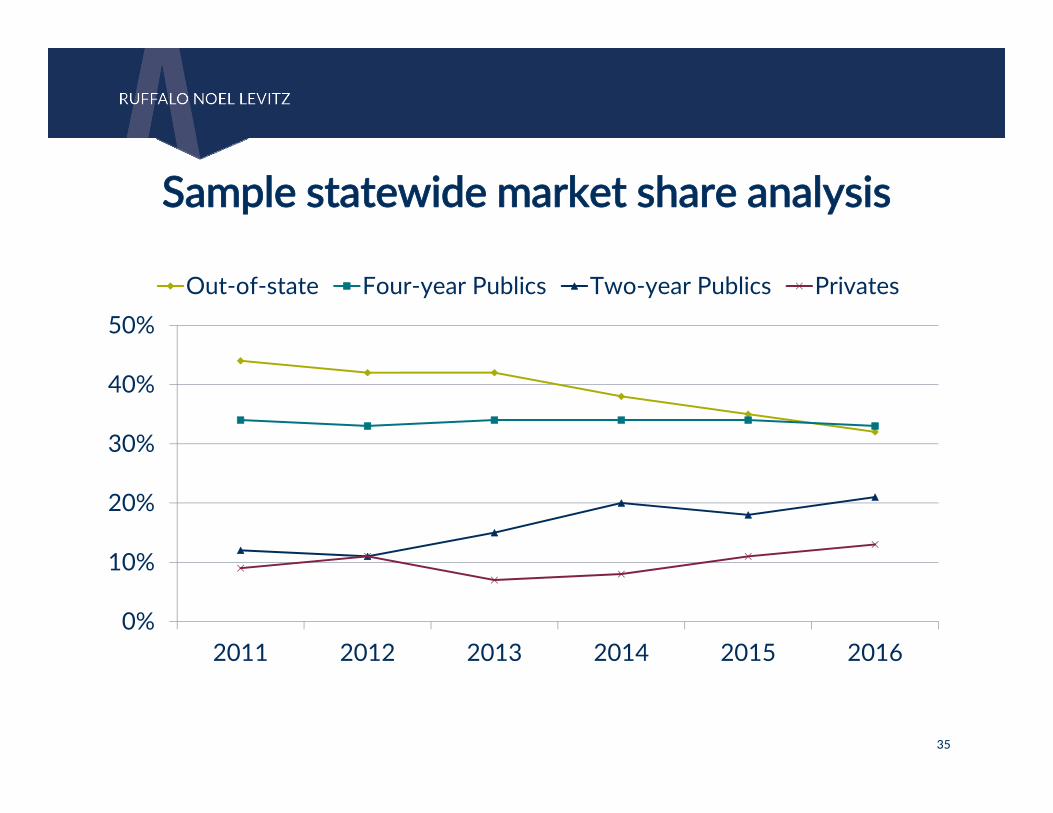
35
0%
10%
20%
30%
40%
50%
2011 2012 2013 2014 2015 2016
Out‐of‐state Four‐year Publics Two‐year Publics Privates
Sample statewide market share analysis

36
0
2,000
4,000
6,000
8,000
10,000
12,000
14,000
2011 2012 2013 2014 2015 2016
Four‐year Public Four‐year Private
Sample part‐time student market penetration analysis

37
0%5%
10%15%20%25%30%35%40%
Specializedschools
Associatescolleges
Public four‐year Small
Public four‐year Medium
Public four‐year Large
Private four‐year Small
Private four‐year Medium
Private four‐year Large
Typical Student Sample U Lost Admits
Lost admits by type of institution
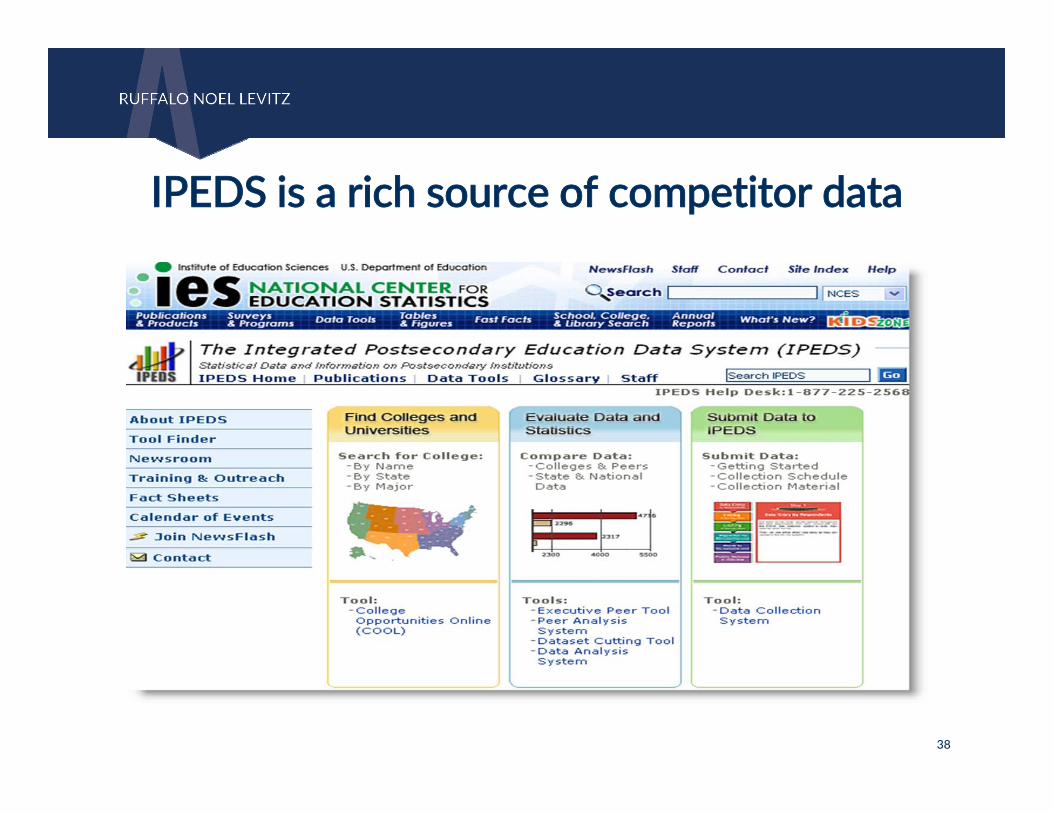
38
• (www.nces.ed.gov/IPEDS/)
IPEDS is a rich source of competitor data
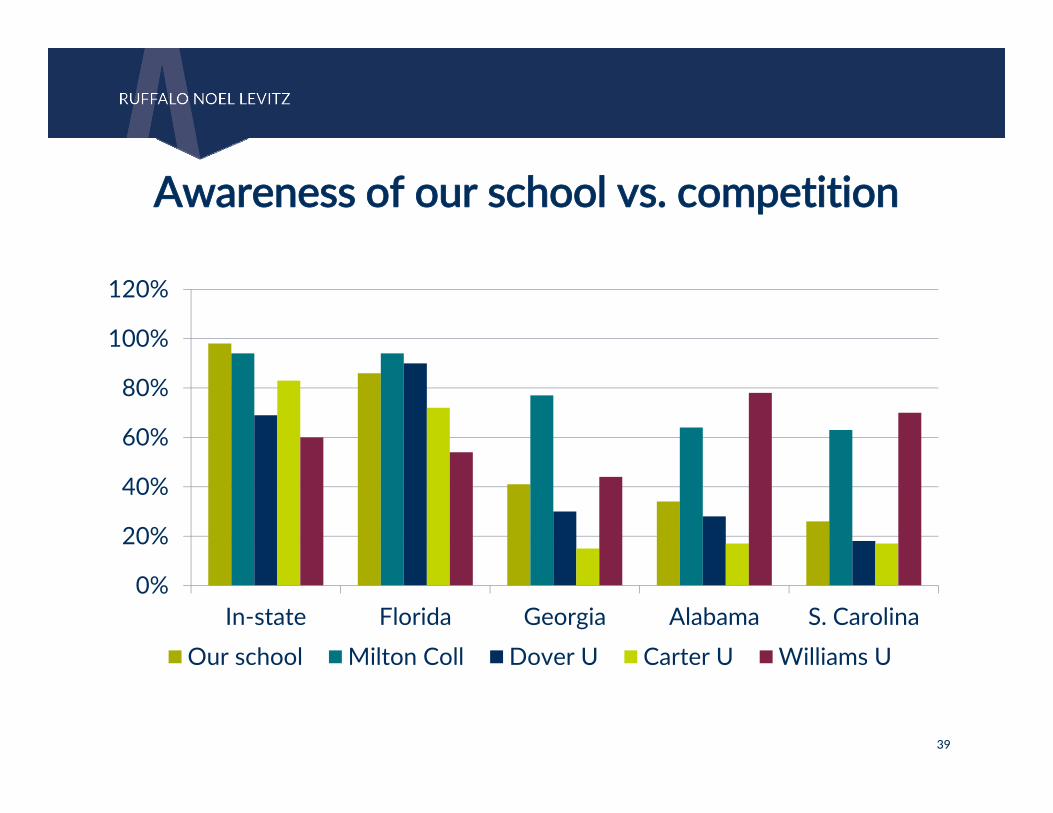
39
Awareness of our school vs. competition
0%
20%
40%
60%
80%
100%
120%
In‐state Florida Georgia Alabama S. CarolinaOur school Milton Coll Dover U Carter U Williams U

40
Competitor analysis with cost overlay (lost admits)
Selectivity
Tuition and fees (or net charges)
N=21
N=35
N=4
N=14
N=10
N=5
N=5

41
How price sensitive are your students vs. your competitors? Students at these schools show
substantial price elasticity.

42
Understanding Market Demand
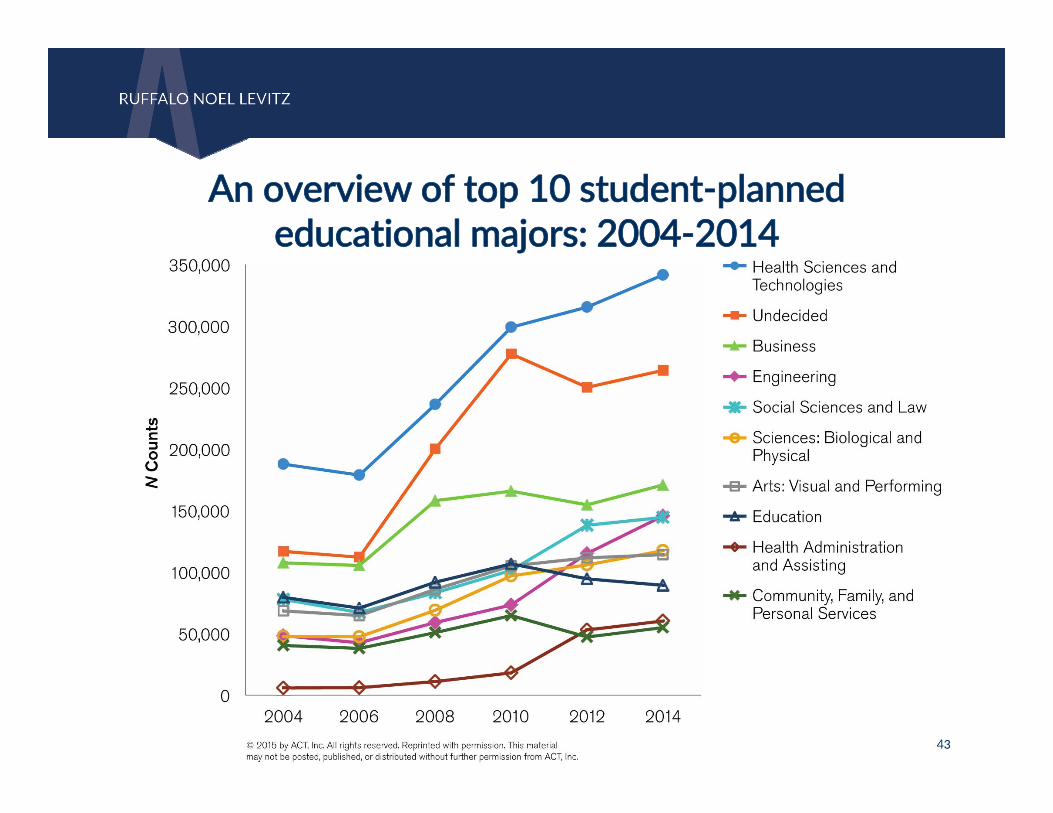
43
An overview of top 10 student‐planned educational majors: 2004‐2014
44
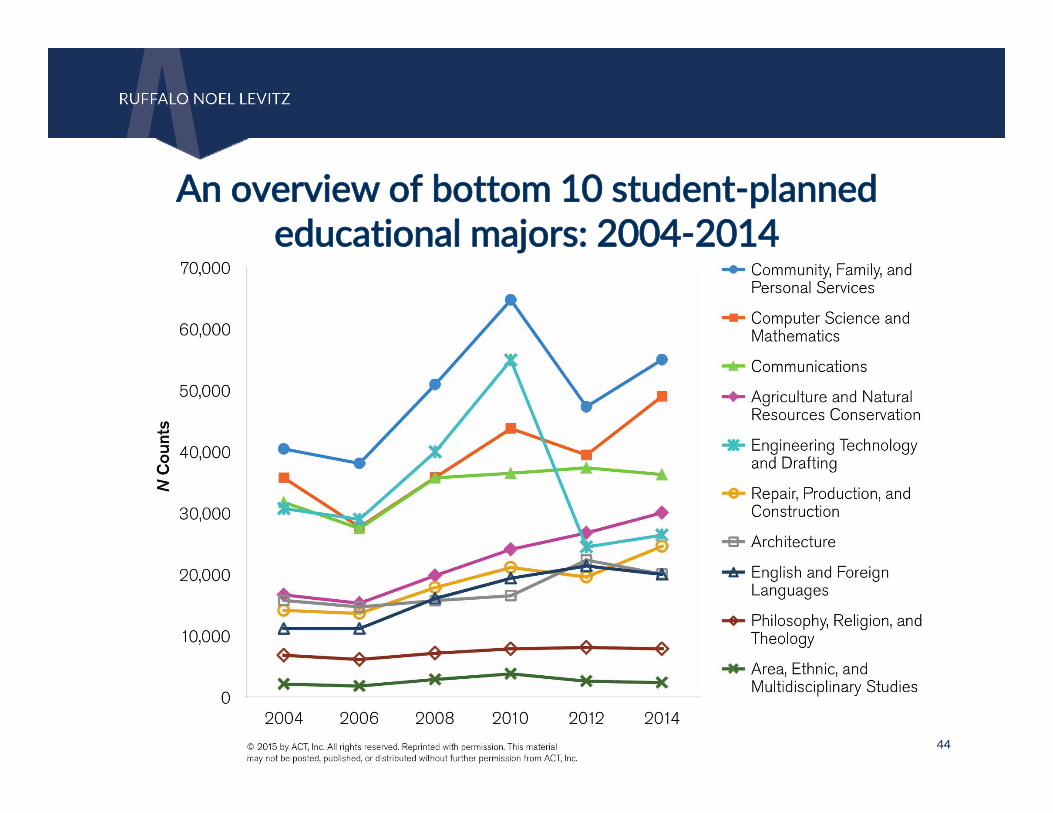
An overview of bottom 10 student‐planned educational majors: 2004‐2014
45
Occupation # of New Jobs % Change 2014 Median Wage
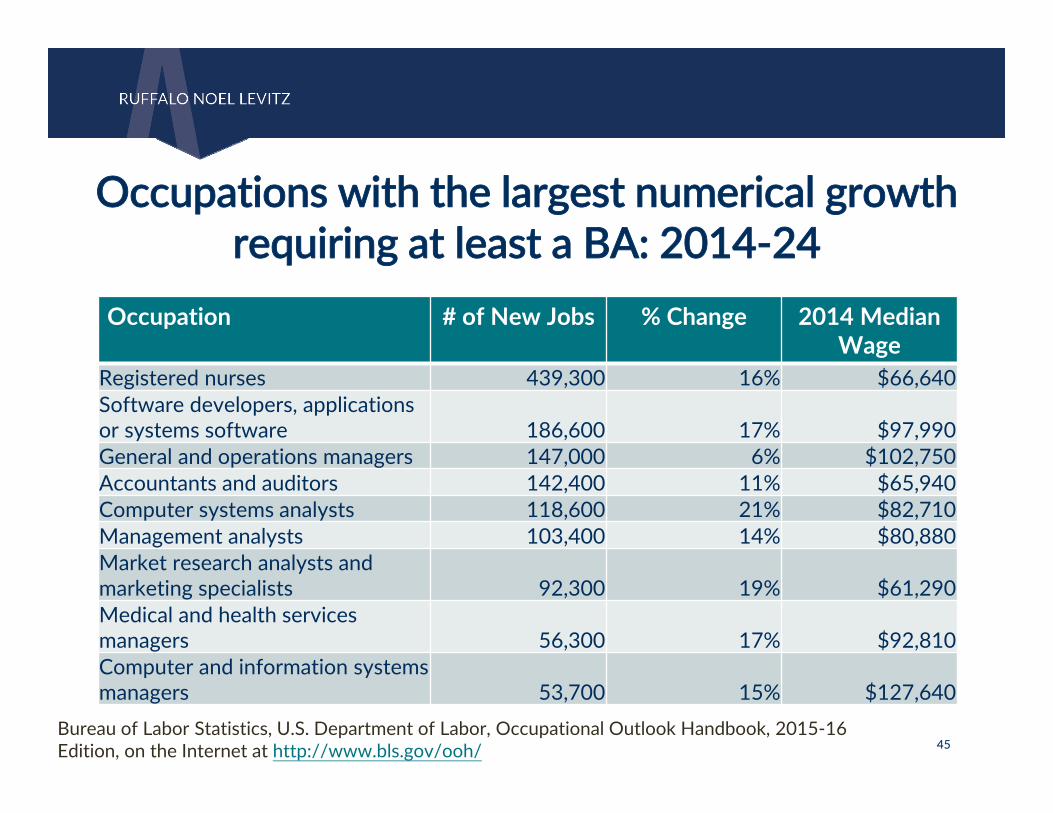
Registered nurses 439,300 16% $66,640Software developers, applications or systems software 186,600 17% $97,990General and operations managers 147,000 6% $102,750Accountants and auditors 142,400 11% $65,940Computer systems analysts 118,600 21% $82,710Management analysts 103,400 14% $80,880Market research analysts and marketing specialists 92,300 19% $61,290Medical and health services managers 56,300 17% $92,810Computer and information systems managers 53,700 15% $127,640
Occupations with the largest numerical growth requiring at least a BA: 2014‐24
Bureau of Labor Statistics, U.S. Department of Labor, Occupational Outlook Handbook, 2015‐16 Edition, on the Internet at http://www.bls.gov/ooh/
46
Occupation % Change # of New Jobs 2014 Median Wage
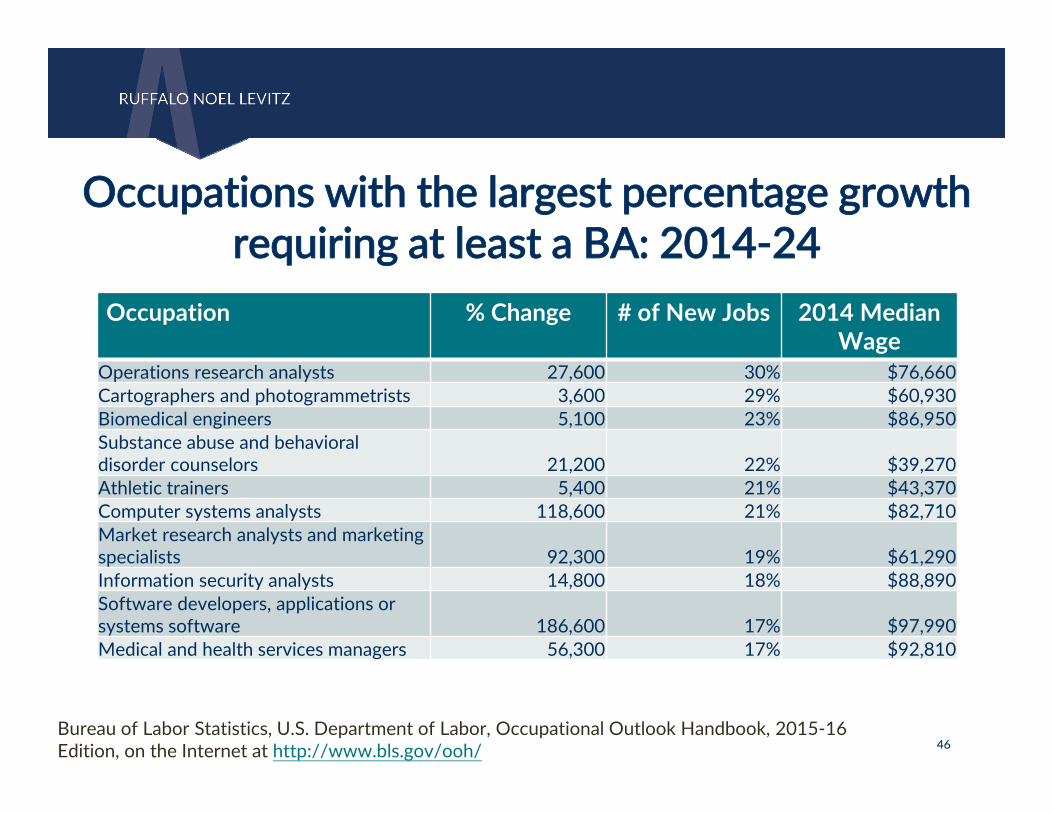
Operations research analysts 27,600 30% $76,660Cartographers and photogrammetrists 3,600 29% $60,930Biomedical engineers 5,100 23% $86,950Substance abuse and behavioral disorder counselors 21,200 22% $39,270 Athletic trainers 5,400 21% $43,370Computer systems analysts 118,600 21% $82,710Market research analysts and marketing specialists 92,300 19% $61,290Information security analysts 14,800 18% $88,890Software developers, applications or systems software 186,600 17% $97,990Medical and health services managers 56,300 17% $92,810
Occupations with the largest percentage growth requiring at least a BA: 2014‐24
Bureau of Labor Statistics, U.S. Department of Labor, Occupational Outlook Handbook, 2015‐16 Edition, on the Internet at http://www.bls.gov/ooh/

47
MajorsStates
OH IN IL MD VA NJ PA TN WV MO TXMedical Physician 11,144 5,733 11,739 4,596 6,790 7,782 11,866 6,587 2,190 5,871 27,502Nursing/Health Care 7,906 4,362 7,760 3,393 4,393 3,741 7,937 4,985 1,548 3,300 20,128Lawyer/Legal Services 5,173 2,417 6,538 3,091 3,802 5,217 6,633 2,861 646 2,912 13,203Engineering (General) 4,171 2,034 4,476 2,413 2,735 3,597 4,943 1,897 610 2,327 11,721Law Enforcement/Criminal Justice 2,977 1,474 3,868 1,839 2,081 2,916 4,106 1,680 467 1,279 8,324Business Owner/Entrepreneur 3,151 1,430 3,275 1,916 2,350 2,445 4,128 1,731 344 1,699 8,476Architecture 3,245 1,497 3,744 1,501 2,096 2,720 3,674 1,251 382 1,626 8,282Culinary/Chef 2,992 1,245 3,672 1,720 2,040 2,476 3,545 1,437 468 1,730 7,187Athletics/Coaching 2,875 1,319 3,112 1,324 1,732 1,815 3,297 1,500 409 1,426 7,375Engineering (Mechanical) 2,774 1,417 2,639 1,200 1,791 1,607 2,811 1,393 481 1,103 7,447Physical Therapy 3,382 1,657 2,875 937 1,586 1,470 3,784 1,769 696 1,290 3,855Child Care/Development 2,448 1,127 2,802 1,240 1,474 1,631 3,166 1,558 367 1,498 5,959Sports Medicine 3,286 1,328 2,343 1,292 1,893 1,523 3,196 1,590 532 1,236 4,614Veterinary Medicine 2,350 1,330 2,040 936 1,483 1,004 2,264 1,232 428 1,144 5,257Military Science 2,267 894 2,179 1,106 1,809 1,671 2,456 1,255 308 1,114 4,142Engineering (Electrical) 1,862 956 2,079 1,254 1,446 1,362 2,106 1,038 416 815 5,767Pharmacy 2,164 1,211 2,109 536 1,054 1,286 2,567 1,433 579 919 4,443Photography/Video/Film 1,821 1,041 2,225 984 1,360 1,417 2,373 947 287 871 4,793Graphic Arts/Design 1,880 900 2,122 991 1,153 1,504 2,331 856 254 967 4,598Fashion Merchandising 1,447 559 1,758 1,047 1,239 1,508 1,822 659 133 730 4,506
Sample University’s out‐of‐state market: All students with a B+ and above GPA
48
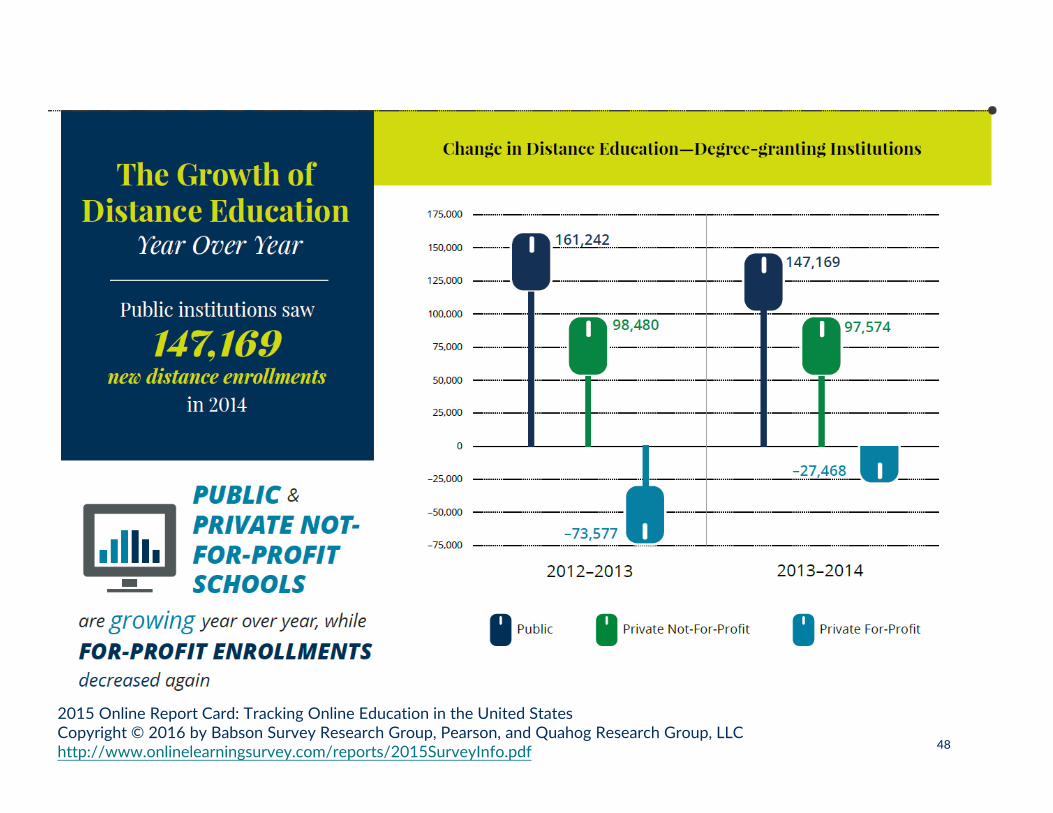
2015 Online Report Card: Tracking Online Education in the United StatesCopyright © 2016 by Babson Survey Research Group, Pearson, and Quahog Research Group, LLChttp://www.onlinelearningsurvey.com/reports/2015SurveyInfo.pdf

49
Understanding Your Institutional Strength

50
Understanding your institutional strength
51
• Student satisfaction and engagement metrics
• Faculty/staff satisfaction and alignment with student expectations
• Alumni satisfaction/outcomes• Student attrition research
The institution

52
0
1
2
3
4
5
6
Overall, metexpectations?
Rate overallsatisfaction
Would enroll hereagain
Tuition aworthwhileinvestment
Our students Students at other schools
Overall Satisfaction
Current student research reveals broad institutional issues…

53
1. I am able to register for classes I need with few conflicts.
2. Tuition paid is a worthwhile investment.
3. There is a good variety of courses provided on this campus.
4. The campus is safe and secure for all students.
5. Faculty are fair and unbiasedin their treatment of individual students.
6. Adequate financial aid is available for most students.
…and specific institutional challenges
54
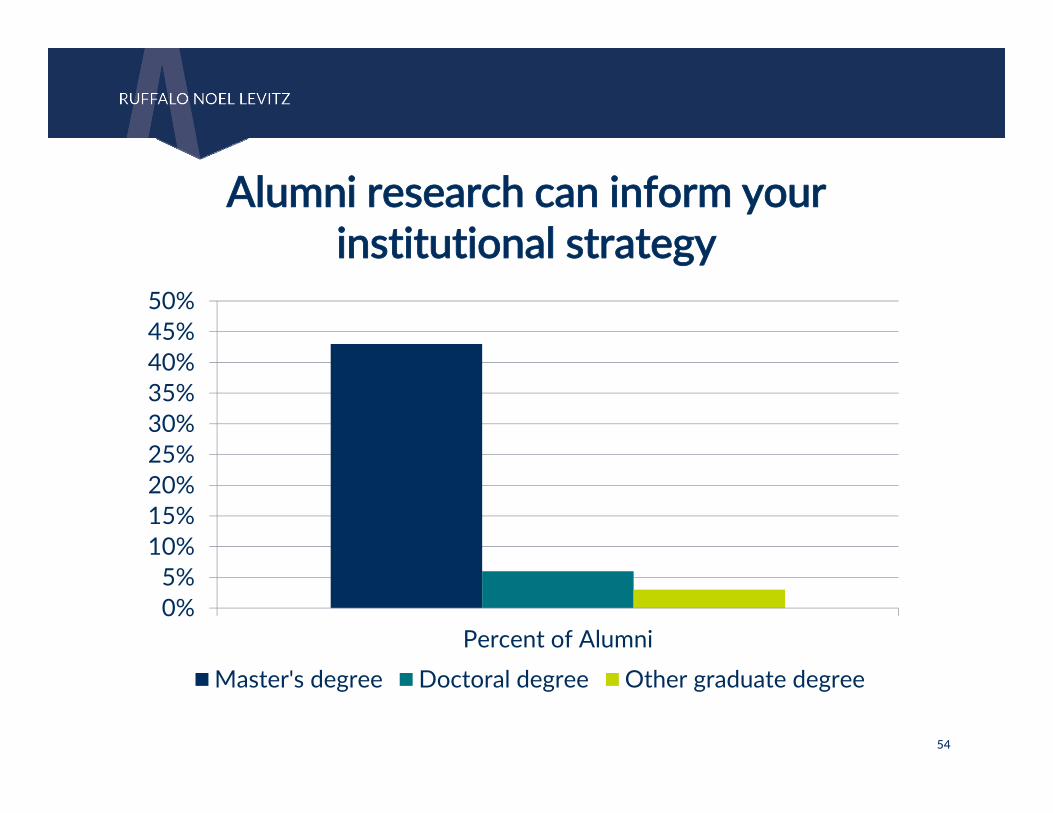
0%5%
10%15%20%25%30%35%40%45%50%
Percent of AlumniMaster's degree Doctoral degree Other graduate degree
Alumni research can inform your institutional strategy

55
Very Important
Very Unimportant
Very Dissatisfied Very Satisfied
Institutional Challenges
Institutional Strengths
Understanding how satisfied students are

56
Internal and External Checklist
57
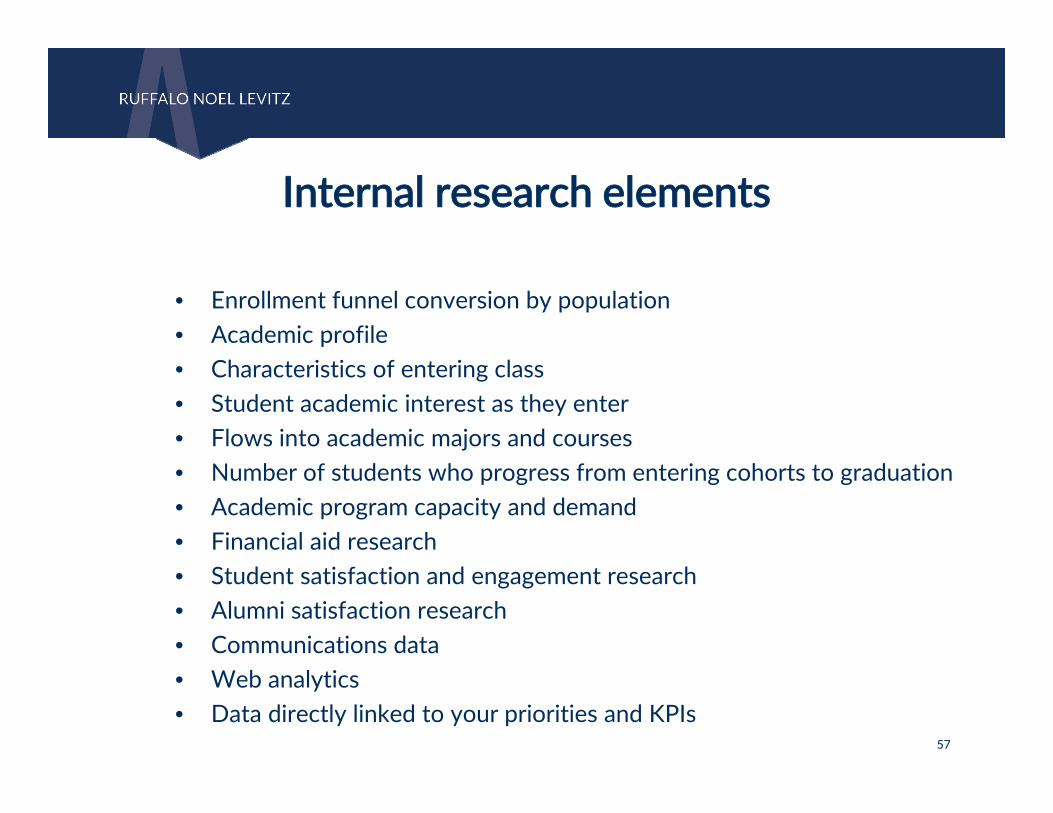
• Enrollment funnel conversion by population• Academic profile • Characteristics of entering class• Student academic interest as they enter• Flows into academic majors and courses • Number of students who progress from entering cohorts to graduation• Academic program capacity and demand• Financial aid research• Student satisfaction and engagement research• Alumni satisfaction research• Communications data• Web analytics• Data directly linked to your priorities and KPIs
Internal research elements

58
Example – Regional funnel management
FTIC Funnels by Region: Fall 2017Stage / Region
County 1
County 2
County 3
County 4
County 5
Rest of State
Out of State
Intnl
Inqs.Conv. RateApps.Accept RateAdmitsDeps.Yield RateEnroll
59
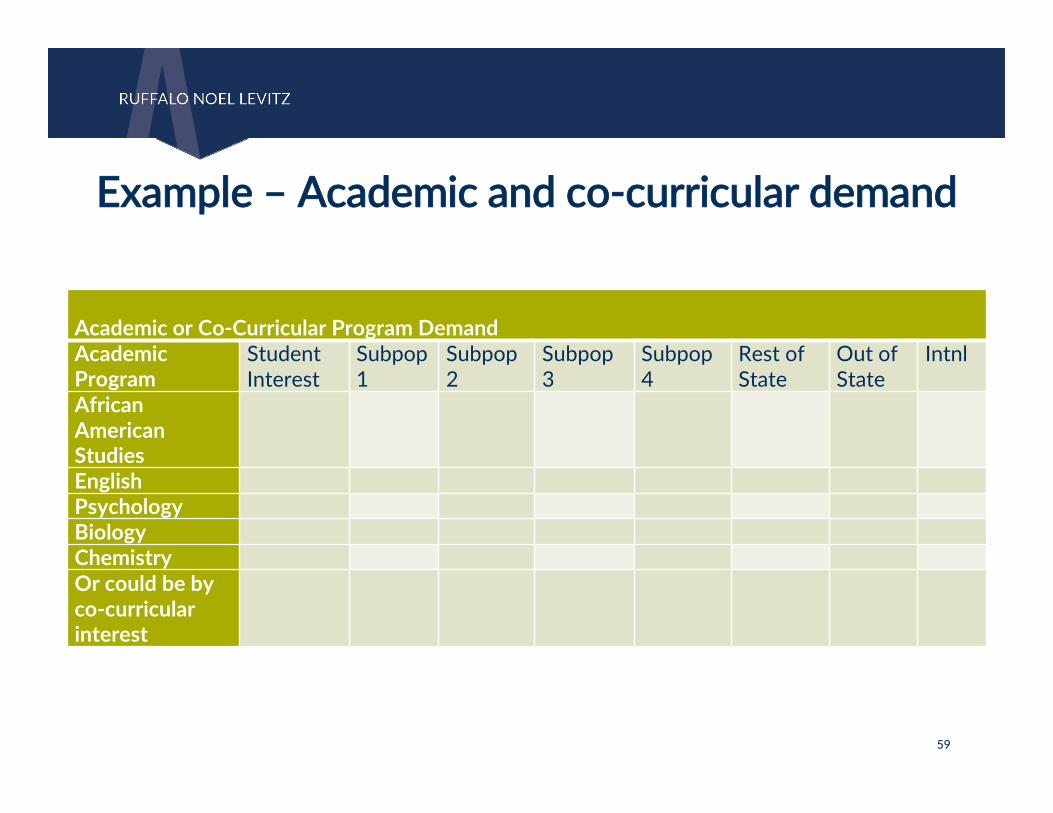
Example – Academic and co‐curricular demand
Academic or Co‐Curricular Program DemandAcademic Program
Student Interest
Subpop 1
Subpop 2
Subpop 3
Subpop 4
Rest of State
Out of State
Intnl
AfricanAmerican StudiesEnglishPsychologyBiologyChemistryOr could be by co‐curricular interest

60
Example – Retention cohortFirst‐time Freshmen Fall 07 Fall 08 Fall 09 Fall 10 Fall 11 Fall 12 Fall 13 Fall 14 Fall 15
Cohort Size 159 143 161 141 137 175 177 167 175No. Retained after 1 semester 143 126 143 118 115 150 159 153% Retained after 1 semester 89.9% 88.1% 88.8% 83.7% 83.9% 85.7% 89.8% 91.6%No. Returning as Sophomores 120 100 120 100 103 118 133 133Retention rate frosh‐to‐soph 75.5% 69.9% 74.5% 70.9% 75.2% 67.4% 75.1% 79.6%No. Returning as juniors 99 91 108 87 94 107 110Retention rate frosh‐to‐jnr (after 2 years)
62.3% 63.6% 67.1% 61.7% 68.6% 61.1% 62.1%
Retention between sophomore and junior year
82.5% 91.0% 90.0% 87.0% 91.3% 90.7% 82.7%
No. Returning as seniors 99 89 102 83 91 103Retention rate frosh‐to‐ snr (after 3 years)
62.3% 62.2% 63.4% 58.9% 66.4% 58.9%
Retention between junior and senior year
100% 97.8% 94.4% 95.4% 96.8% 96.3%
No. Graduated after 4 yrs 68 59 78 59 73% Graduated after 4 years 42.8% 41.3% 48.4% 41.8% 53.3%No. Graduated after 5 years 86 78 91 76% Graduated after 5 years 54.1% 54.5% 56.5% 53.9%No. Graduated after 6 years 92 80 91% Graduated after 6 years 57.9% 55.9% 56.5%
61
• Demographic trends• Number of students expressing
specific major interest, including by test score range
• Workforce demand• Lost inquiry study• Lost admit study• Competition analysis
• Market demand analysis• Price sensitivity study• FASFA application competition
report• Special population changes• State‐specific data • Information on possible
disruptive innovations
External research elements

62
Working session
Task Two: Research Planning
• Review the document: Typical High‐Priority Research Checklist.
• Identify which of these research elements are currently available at your institution.
• Identify which should be a high priority for compiling after your return to campus.

63
Questions and Discussion

64
All material in this presentation, including text and images, is the property
of Ruffalo Noel Levitz. Permission is required to reproduce information.