ethiopia - usaid’s building the potential of youth activity … · 2019-08-13 · employment,...
TRANSCRIPT
USAID’s Building the Potential of Youth Activity (POTENTIAL)
Addis Ababa November 2018
Report of the 2017 Outcome Survey
1 Senior MEAL Specialist, USAID’s Building the Potential of Youth Activity, Save the Children Ethiopia
2 Senior Advisor, Research & Evaluation, Save the Children US
3 MEAL Specialist USAID’s Building the Potential of Youth Activity, Save the Children Ethiopia
©2018 USAID’s Building the Potential of Youth Activity
This publication is made possible by the generous support of the United States Agency for International Development (USAID) under cooperative Agreement# AID-663-A-15-00006.
The contents are the sole responsibility of POTENTIAL and do not necessarily reflect the views of USAID or the United States
1
Larry Dershem (PhD) 2
Metselal Abraha (MA) 3
Survey Team Leaders:Abdusemed Mussa (MPH)
Table of Contents ACRONYMS ......................................................................................................................................... 2
ACKNOWLEDGMENTS ..................................................................................................................... 3
EXECUTIVE SUMMARY ..................................................................................................................... 5
INTRODUCTION ................................................................................................................................ 7
BACKGROUND ................................................................................................................................... 7
Purpose of the Outcome Survey ..................................................................................................... 9
Methodology and data collection tools/instruments ...................................................................... 9
Qualitative Methods: Key Informant Interviews and Focus Group Discussions ...................... 9
Quantitative Method: Structured Questionnaire for Individual Youth Interviews ............... 10
Sampling and Sample Size ............................................................................................................. 11
Study Population or Sample Frame .......................................................................................... 11
Survey Woredas and Study Frame ............................................................................................ 12
Sampling Procedure .................................................................................................................... 12
Selection and training of data collectors ................................................................................... 12
Data Management and Quality ...................................................................................................... 12
Data Processing and Analysis ......................................................................................................... 13
Survey Timeline and Team Composition and Responsibilities ................................................... 13
Bias and Limitations ....................................................................................................................... 14
FINDINGS ........................................................................................................................................... 15
Demographic Information ............................................................................................................. 15
Age and Sex Composition .......................................................................................................... 15
Marital Status .............................................................................................................................. 15
Educational status of youth ........................................................................................................ 16
Length of Program Participation ................................................................................................... 16
Program Activities Involvement.................................................................................................... 17
Knowledge and Skill Changes ........................................................................................................ 18
Change in Attitude and Behavior Related to Livelihood Opportunities .................................... 18
New and Better Employment ........................................................................................................ 19
Sectors of Employment .................................................................................................................. 20
Change in Youth Income ..................................................................................................................... 21
Change in Productive Assets ......................................................................................................... 22
CONCLUSION ................................................................................................................................... 23
DETAILED RESULTS ........................................................................................................................ 24
DATA COLLECTION TOOLS ......................................................................................................... 38
REFERENCES ..................................................................................................................................... 49
2
ACRONYMS
WBL Work-Based Learning WO Woreda Officers WRN! WorkReadyNow! WR+ Work Ready Plus YES Youth Economic Strengthening YF Youth Facilitator
BYOB Be Your Own Boss DECSI Dedebit Credit and saving institution EDC Education Development Center ETB Ethiopian Birr FC Facilitator for Change FGD Focus Group Discussion FTC Farmer Training Center GOE Government of Ethiopia GO Government Organizations HUNDEE HUNDEE-Oromo Grassroots Development Initiative IGA Income Generating Activities IR Intermediate Result KII Key Informant Interview MOU Memorandum of Understanding NGO Non-Governmental Organizations PADet Professional Alliance for Development in Ethiopia PAT POTENTIAL Addis Team PDP Personal Development Plan POTENTIAL USAID’s Building the Potential of Youth PYD Positive Youth Development REST Relief Society of Tigray SCI Save the Children International SNNP Southern Nations, Nationalities, and Peoples TOT Training of Trainers TVET Technical and Vocational Education and Training USAID United States Agency for International Development USD United States Dollar USG United States Government
3
ACKNOWLEDGMENTS First and foremost, I am extremely grateful to the survey participant, our beneficiaries, and
also the employers and partners who took the time from their busy schedules to participate
in the study. Without their participation and feedback, this survey would not have been
possible.
My acknowledgement goes to the core survey team members of our Activity who have
participated in conducting the qualitative data collection, supervision and facilitation. I would
also like to express my gratefulness to our regional and Woreda staff and the temporarily
hired data collectors who have worked hard tirelessly to accomplish their assignments and
meet our deadline.
The following list shows names of individuals to whom we are greatly indebted including the
survey team leaders, coordinators, data collectors and supervisors deployed in all the survey
Woredas (districts).
Abdulfatah Jemal Demelash Kitata Hailemariam Getahun Samuel G/Medhin Abshir Abdi Gure Dereje Asrate Kassahun Mekuriya Samuel Neto Aemero Tazebwe Dereje Terefe Lenjisa Bedhane Shambel Hailu Alem Teklu Dinka Geleta Maereg Belay Shermarke Umer Amin Mohamud, Eden Tadele Meles G/Tensae Solomon Hailu Anteneh Tadele Engidashet Melaku Mengistu Gessese Werke Beyene Ayinalem Bekele Esubalew Hasen Mengistu Gessesse Wondwosen Wogayehu Azezew Yalew Firew Ejegu Mengistu Wakjira Worknesh Addisu Belayneh Tilahun Fituma Gutema Metadel Fantahun Yemsrach Essalegn Birhane W/Gebreal Getinet Seid Metselal Abraha Zegeye Mengestu Bishar Bare Gezzu Lema Michael Getachew Zelalem Fola Daniel Fufa Gudeta Fufa Mohammed Abdulahi Zena Yemane Dawud Mahmud Habib Hussein Nimo Abdulahi Degarege Gizachew Habtamu Melkie Rozina Getie Degarege Yazachew Hachalhu Hundessa Salih Desalew
Genet Lemma
Deputy Chief of Party (Programs)
4
Message from the Chief of Party This past Ethiopian year has been another glowing
reminder that our Activity, along with our
partners, EDC, FC, HUNDEE, PADet and REST, is
making a positive difference to young people and
their families across all the six implementation
regions. We pride ourselves on providing
opportunities to young people in rural Ethiopia
specially in hard to reach neighborhoods through
innovative approaches, executive leadership,
credible research and public engagement.
This “outcome survey” covers the period of September 1, 2015 to June 30, 2017. Through
the work of dedicated staff, partners and stakeholders, USAID’s building the potential of youth
activity (POTENTIAL) has reached 27,279 youth beneficiaries in the past four years of which
45% are female. We are truly an Activity dedicated to strengthening the youth development
initiative of the country. We are thankful to our donor USAID for supporting us achieving
our objectives and all the remarkable results. I believe that we have been successful in bringing
together youths, government offices, community associations, parents and guardians, teaching
institutes, public and private businesses to attain our common goal; and these efforts are
continually producing outstanding results. We thank all of you for your support. Your
commitment and involvement assisted us to reach as many beneficiaries as possible and ensure
that all of them are equipped with both the ability and opportunity to strive for personal
excellence and to unleash their potential.
Olaf Erz
Chief of Party
5
EXECUTIVE SUMMARY The goal of USAID’s Building the Potential of Youth Activity (POTENTIAL) is to help un- and underemployed Ethiopian youth increase their assets and incomes through new and better employment, including self-employment, while building the capacity of local institutions who can continue this work in the long term. Launched in 2015, as of September 2018 the Activity had assisted 27,279 target youth to build their economic self-sufficiency in 30 Woredas across six regions of Ethiopia. By the end of 2019, this number will be 34,537.
This outcome survey, conducted halfway through the Activity life in 2017, was designed to assess the Activity’s progress by examining the extent to which beneficiaries were taking part in program interventions, building their skills, demonstrating behavioral outcomes, accessing new or better employment, and improving their incomes and assets. A survey of a representative sample of 2088 youth from 11 Woredas in the six implementation regions was complemented with focus group discussions with 180 youth and key informant interviews with 57 other stakeholders, such as government representatives and employers.
This paper presents descriptive statistics and cross-tabulations of survey results, with focus group and key informant interview findings included to add perspective to the numbers. Multivariate regression analysis to determine the predictors of employment among respondents has also been conducted, and will be presented in a separate forthcoming paper.
The outcome survey results revealed that participants were approximately evenly split by gender and that most were unmarried. Male participants tended to be older (72% from 25-29 years old) while female participants tended to be younger (62% between 15-19 years old). The vast majority of both male and female participants (93% and 87% respectively) could read and write.
The number of months since participants had joined the program ranged from 2-36, with a mean of 12.8. In that time, the mean number of program interventions they had participated in was four (3.8 among females and 4.1 among males) out of a possible nine, with almost 100% participating in the foundational Work Ready Now! or Work Ready Plus curriculum, and 48% or more participating in another three interventions.
As a result of these interventions, 80-90% of respondents reported improving their communication skills and work habits/conduct. Fifty to sixty percent said they built their self-confidence; improved goal setting and planning; enhanced their business start-up, management, and decision-making skills; and had better savings habits. Forty to fifty percent reported better job search skills, access to resources and markets, and social bonds and teamwork. Only .1% of respondents reported no improved skills at all.
Respondents also reported improvements along all eight measures of attitudes and behaviors covered by the survey. The proportions of respondents reporting improvements ranged from 72% to 36%, in areas such as job search behavior, starting/improving livelihood activities, saving money, and customer handling.
These improvements in skills, attitudes, and behaviors are reflected in the data on participants accessing new and better employment. While only 28% of respondents reported being employed or self-employed before joining the Activity, at the time of the survey, nearly three-quarters reported working, the vast majority in self-employment. Additionally, of those previously employed, a significant majority reported better self/employment.
Four sectors dominate youth employment: 1) agriculture, 2) agricultural trading, 3) trading consumer
6
goods, and 4) services. Relatively more young men are involved in agriculture while young women are predominant in trading and services.
Reflecting the increases in self/employment described above, a significant majority of respondents also reported increases in income. The proportion of both males and females reporting no income dropped by roughly two-thirds after respondents joined the Activity. Further, those with current income reported that their income levels had increased 97.3% for males and 68.6% for females, on average, since joining the Activity.
Survey data also indicated that some of this increased income is being converted into assets. While about one-third of youth reported no change in productive assets after joining the Activity, nearly 43% reported one new productive asset and 19% reported two new productive assets, with some respondents reporting up to four new productive assets.
While recognizing the limitations of a study relying on self-report without a control/comparison group, POTENTIAL is gratified at the positive results revealed by the survey in terms of skills, employment, income, and assets. These results support the intuition embodied in the Activity’s theory of change, and justify more investment in rigorous impact assessment in the future. Further analyses of the data from this survey will also be useful in better targeting program interventions and potentially streamlining a core program model in future iterations.
“I used to spend my time idly siting on the streets of the town before joining the program; then I got the chance for the training through our Village administration. Then the training triggered my feelings; I started to think about myself, my strength and my purpose of living. Generally, it gives me the new insight of life. Now I started saving money and I have established group business with my friends. The project helps me to recognize our community’s assets, to improve my interpersonal communication skills; even my relationship with my family and friends become better than it was before. So, there are many youths like me in the village who have brought positive changes on themselves and in their community.” – Male FGD participant, Yem Woreda (SNNPR region)
7
INTRODUCTION Ethiopia is the second-most populous country in sub-Saharan Africa. It is also a young country, with 45 percent of the population under age 15 and 71 percent under age 30. The number of people in this age group is projected to rise to 40 million by 2030 (1, 2).
Unemployment in Ethiopia has declined markedly since 1999, both for youth and for the population as a whole. The national rate of unemployment, which stood at 8.2 % in 1999, declined to 4.5% in 2013 (4). However, despite the overall improvement, the unemployment of youth is still high (23.1%, 25.8%, 17.2% for the 15-19, 20-24, and 25-29 age groups respectively) (5). This is mainly due to rapid population and labor force growth and limited employment generation in the modern industrial sector of the economy (3). There are many more under-15 year-olds entering the work force each year than there are people retiring or leaving the labor market. The agricultural sector and the informal urban sector employ a large proportion of the labor force, but are characterized by low earnings and contribute significantly to the issue of “under employment” (6).
The Government of Ethiopia has been initiating different policies and strategies to combat the problem of youth unemployment. The Youth Policy, issued in 2004, called for major interventions to enhance youth participation in Ethiopia’s development. The Policy recognizes the importance of youth participating, in an organized manner, in the process of building a democratic system, good governance, and development endeavors, and benefiting fairly from the outcomes (8).
The importance of youth participation has been increasingly recognized by the public authorities since the government’s strategy to involve youth in decision-making processes (9). In addition, the national employment policy of Ethiopia emphasized youth employment and set forth youth-focused employment mainstreaming strategies (10). More recently, the second Growth and Transformation Plan (GTP II 2015/16-2019/20) gave strong emphasis to employment creation and set strategic directions to be pursued during GTP II (7). Although the results of these efforts have been meaningful, young people still continue to face various challenges related to un-/under-employment.
BACKGROUND In keeping with its commitment to the Government of Ethiopia (GOE) to support its efforts to bring economic growth opportunities to its people, the United States Agency for International Development (USAID) is funding Building the Potential of Youth Activity (POTENTIAL) with the goal of “helping youth increase their assets and incomes through employment or better employment for them to achieve economic self-sufficiency, while building the capacity of local institutions to continue this work in the long term.”1 The support aims at providing rural youth with transferable soft skills training alongside vocational and entrepreneurship development activities through partnerships with training, small business, and micro-finance institutions.
A five-year program launched in September 2015, POTENTIAL targets unemployed and underemployed young people aged 15-29 living in 30 Woredas of six regional states of Ethiopia. The Activity helps beneficiaries access the livelihood knowledge, skills, and opportunities they need to be economically self-sufficient. It is implemented by Save the Children Federation, Inc. and its partners: Education Development Center, Inc., HUNDEE-Oromo Grassroots Development Initiative, Professional Alliance for Development in Ethiopia, Relief Society of Tigray, and Facilitator for Change Ethiopia. In order to fulfill its goal, the Activity will achieve the following Intermediate Results:
1 https://www.usaid.gov/ethiopia/education
8
• IR1: Rigorous evidence base developed to inform USAID and its development partners, including
youth, Government of Ethiopia (GOE), and non-governmental organizations (NGOs), on
appropriate, effective, and sustainable market driven youth workforce development intervention
• IR2: Improved youth access to market relevant skills and experiences to support the transition to
safe and viable employment; and
• IR3: Coordinated delivery, among local institutions, of quality market driven services connecting
underserved youth, especially women, to employment and income opportunities.
By the end of 2019, this Activity will build the economic self-sufficiency of 34,537 youth across the 30
Woredas of Afar, Amhara, Oromia, SNNPR, Somali, and Tigray regional states.
POTENTIAL’s youth livelihood framework encompasses the development of young people’s human, social,
financial and physical capital while concurrently building the capacity of local service providers. The
Activity’s strategic approach responds to unemployed and underemployed youths’ capacity needs, leverages
existing youth development activities, and contributes to improving the quality and accountability of local
training and business service providers by ensuring existing entities work in concert. Specific strategies
include the following:
• Focusing on skills building: POTENTIAL offers tailored technical and life skills trainings to create
more viable livelihood prospects.
• Using targeted labor market assessments: POTENTIAL ensures training and service providers
consider market relevance, targeting curricula and programs to emerging skills needs.
• Expanding approaches and offerings in work-based learning: POTENTIAL assists youth to
participate in employer visits, job-shadowing, short-term employment, and internships. Both
learners and employers benefit from training and supervisory support, leading to workforce-ready
and employable youth with practical experience.
• Building youth service provider networks: POTENTIAL implements a cost-effective approach to
enhance support service access for remote communities and disadvantaged groups.
POTENTIAL is now completing four years of implementation and is preparing to start its fifth year, offering
beneficiary youth a menu of up to nine training modules as well as integrated employability interventions
that provide knowledge and support (through coaching, mentoring, and linking) to enhance their
developmental assets (skills, understandings, and personal attributes) so as to be able to gain sound
employment (self- or wage) and to be successful in their chosen career. As of September 2018, the Activity
had reached 27,279 young people (79% of the LoP target). About 45 percent of program participants are
female. So far, 13,943 have gained new or better employment; of these, 69 percent are self-employed, 14
percent have acquired wage work, and 17 percent have gained better employment.
9
Purpose of the Outcome Survey
One of the three principal results of the USAID’s Building the Potential of Youth Activity is to develop a
rigorous evidence base to inform USAID and its development partners, including youth, the GoE and
NGOs, on appropriate, effective, and sustainable market-driven youth workforce development
interventions. To this end, and also with an objective of evaluating its performance, the Activity carried out
two annual outcome surveys.
The 2017 outcome survey covered the following outcome indicators:
• Number of persons receiving new employment or better employment (including self-employment)
as a result of participation in USG-funded workforce development programs
• Number of youth beneficiaries with increased income
• Number of youth beneficiaries with increased productive assets
• Percent of youth with improved development assets as per social capital dimensions in the youth
livelihood framework
• Number of persons (youth) with improved workforce readiness skills as a result of USG-funded
work force development programs (employability skills)
• Number of youth who utilized coaching to search for employment (wage or self-employment)
• Attitudinal/behavior change related to financial management (saving), business, livelihood
opportunities, etc.
• Opportunities to access resources
Methodology and data collection tools/instruments
This outcome survey used quantitative and qualitative methods, including structured individual interviews,
focus group discussions with beneficiary youth, and key informant interviews with other stakeholders.
The following survey instruments/tools were used to generate data from the beneficiaries and partners:
• Individual interview questionnaire
• Interview guide for key informant interviews
• Discussion guide for focus group discussions
• Employment questionnaire
Qualitative Methods: Key Informant Interviews and Focus Group Discussions
Sample selection for the qualitative methods (key informant interviews and focus groups) was done through
non-random purposive selection. Discussion guides were used to ensure smooth flows of the discussions
and the interviews with different partners and group of beneficiaries.
10
Key Informant Interviews (KIIs) with Stakeholders
KIIs with stakeholders/partners covered all those with whom the Activity is working closely. The
participants discussed achievements and outcomes demonstrated by the Activity and their thoughts on the
implementation mechanisms/approaches. This required the survey team to identify government, private
sector, NGOs, and other community organizations or individuals at Woreda and Kebele level. In each
survey Woreda the possible relevant partners included:
• TTIs: TVETs, Farmer Training Center/Woreda Agriculture Office, universities, etc.
• Region/Woreda/Kebele: Relevant Sector Offices, such as Woreda Youth and Sport, Women
Affairs, Kebele Administration
• Private Sector: Businesses who employed beneficiary youth, mentors
• Civic Organizations: Youth Associations
In total, 57 key informants were interviewed from 8 Woredas; 5 from the private sector and the rest from
various public offices and agencies at both the Woreda and Kebele level.
Focus Group Discussions (FGDs) with Beneficiary Youth
Teams composed of one facilitator and one note taker conducted FGDs with Activity beneficiaries to
generate additional information on Activity outcomes. FGDs with youth were conducted in separated
groups of employed and unemployed beneficiary youth in each sample Kebele, either mixed male and female
or separated by gender depending on the context. A total of 180 beneficiaries, of which 98 female and 86
unemployed, took part in 27 focus groups.
Employment Data from Secondary Sources
Employment data was routinely collected and recorded by the staff of the Activity and reported on
quarterly basis. As part of the outcome survey, the survey team collected employment data from the
Woreda staff as secondary data to validate the employment outcome indicator results from routine
monitoring data. A revised version of the employment monitoring/tracking tool was developed in table
format to collect this secondary data.
Quantitative Method: Structured Questionnaire for Individual Youth Interviews
Structured interviews were conducted with samples of youth taken from each Kebele with probability
proportional to size (PPS).
A structured questionnaire was prepared in English and was used by the data collectors, who interviewed
the respondents using local language; translation of the questionnaire was practiced during the data
collectors’ training in order to simplify translation during interviews.
The facilitators/data collectors were advised to introduce the purpose of the interview and also ask for the
consent of survey participants using the statement at the beginning of the structured individual interview
questionnaire (please see Appendix) and to get their verbal consent before enrolling them in the study.
11
Another part of the survey team played check the completed questionnaires daily to ensure their
consistency and completeness, and provided on-the-spot feedback to the data collectors. In line with this,
the completed questionnaires were entered into the computer (tablet) based data entry form on a daily
basis by the survey team.
Sampling and Sample Size
A sample size of 2,104 was taken for this survey. A reasonable proportion of the key outcome indicators
were obtained from previous study. The degree of accuracy required was within 5%; the confidence level
required is 95%. The sample size was calculated for each of the outcome indicators of the survey using the
following formula, and the one with the greatest number of required participants was selected as the sample
size.
n = Z2 p(1-p) / w2 d
Where:
n = sample size
Z = Z statistic for a level of confidence (95% level of confidence used, therefore Z value is 1.96)
P = expected prevalence of proportion
w = precision
d=design effect
With a response rate of 99%, the final sample numbered 2,088 respondents.
Study Population or Sample Frame
The study population includes all youth who were engaged in the Activity up to June 2017 and residing in
the selected sample pastoralist and agriculturalist Woredas. This includes the youth who have attended
one or more of the activities offered by the Activity within the specified period, e.g. Work Ready
Now/Work Ready Plus, Positive Youth Development/Youth in Action, Be Youth Own Boss (BYOB),
Aflateen, or short-term technical/hard skill trainings.
For the quantitative investigation, the team used a stratified multistage random sampling technique
to identify a representative sample of program participants to include in the survey. The survey data
collection was done in 11 selected Woredas (out of the 30 target Woredas in the six regions) in two strata:
pastoralist and agricultural/productive Woredas. A representative number of Kebeles were considered in
each of the selected Woredas.
12
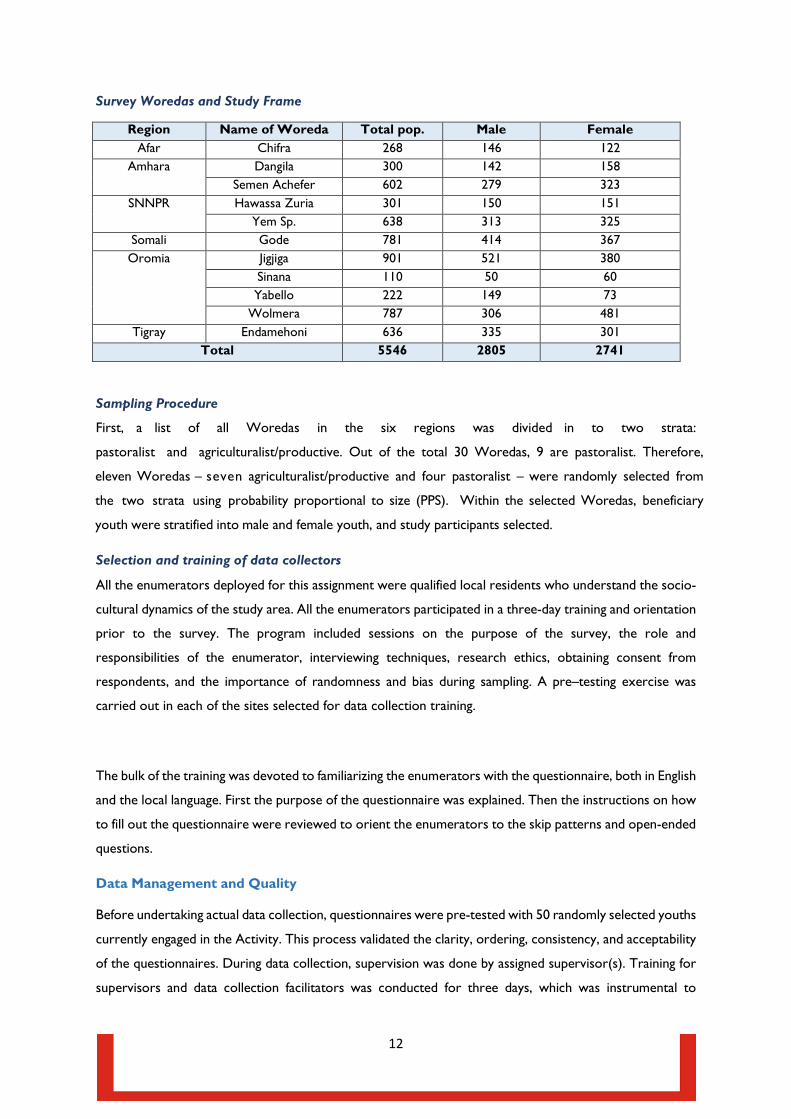
Survey Woredas and Study Frame
Region Name of Woreda Total pop. Male Female Afar Chifra 268 146 122
Amhara Dangila 300 142 158 Semen Achefer 602 279 323
SNNPR Hawassa Zuria 301 150 151 Yem Sp. 638 313 325
Somali Gode 781 414 367 Oromia Jigjiga 901 521 380
Sinana 110 50 60 Yabello 222 149 73
Wolmera 787 306 481 Tigray Endamehoni 636 335 301
Total 5546 2805 2741
Sampling Procedure
First, a list of all Woredas in the six regions was divided in to two strata:
pastoralist and agriculturalist/productive. Out of the total 30 Woredas, 9 are pastoralist. Therefore,
eleven Woredas – seven agriculturalist/productive and four pastoralist – were randomly selected from
the two strata using probability proportional to size (PPS). Within the selected Woredas, beneficiary
youth were stratified into male and female youth, and study participants selected.
Selection and training of data collectors
All the enumerators deployed for this assignment were qualified local residents who understand the socio-
cultural dynamics of the study area. All the enumerators participated in a three-day training and orientation
prior to the survey. The program included sessions on the purpose of the survey, the role and
responsibilities of the enumerator, interviewing techniques, research ethics, obtaining consent from
respondents, and the importance of randomness and bias during sampling. A pre–testing exercise was
carried out in each of the sites selected for data collection training.
The bulk of the training was devoted to familiarizing the enumerators with the questionnaire, both in English
and the local language. First the purpose of the questionnaire was explained. Then the instructions on how
to fill out the questionnaire were reviewed to orient the enumerators to the skip patterns and open-ended
questions.
Data Management and Quality
Before undertaking actual data collection, questionnaires were pre-tested with 50 randomly selected youths
currently engaged in the Activity. This process validated the clarity, ordering, consistency, and acceptability
of the questionnaires. During data collection, supervision was done by assigned supervisor(s). Training for
supervisors and data collection facilitators was conducted for three days, which was instrumental to
13
ensuring quality as a result of understanding of the purpose, the data collection process, and how to use
the tools.
Quantitative data was entered daily from the hard copies into a database to make it easily available for
analysis. Data was entered into the tablet computers using KOBO tool box. Qualitative data was
summarized and interpreted on the spot by the survey team leaders.
Data Processing and Analysis
Prior to data entry, each questionnaire was checked for completeness and consistency, and coded. Next,
data was entered in to SPSS and cleaned by doing simple frequency and cross tabulation. Simple analysis of
cross tabulation, descriptive statistics, proportions, and frequencies, were the main methods used to
summarize the data. To determine associations between the independent and dependent variables, cross
tabulation and binary logistic regression was run. Those variables that were found to be significantly
associated during the bivariate analysis were entered in to a multivariate logistic regression to determine
their individual effects in explaining the outcome of interest and control for confounding variables.
Descriptive statistics are presented here using text, graphs, and tables. Statistically significant differences
between male and female beneficiaries are included among the findings; however, whether those differences
are meaningful, e.g. for youth gaining employment, is unclear based on the current state of research in the
youth livelihoods field. A paper presenting the full results of regression analysis identifying predictors of
employment is forthcoming.
Survey Timeline and Team Composition and Responsibilities
With prior preparation of methods, instruments, and logistical arrangements, the actual survey field work
(data collection) took place during two weeks period in January 2018. The survey team was composed of:
• Addis Ababa-based thematic specialists from POTENTIAL and regional and Woreda implementing
staff – mainly for leading the survey and providing technical support and onsite supervision and
overall coordination
• SCUS M & E Advisor – for technical review, data analysis, and survey report write-up
• SCI Livelihood technical staff – for data collection
• Data collectors – hired for the purpose of collecting mainly quantitative data
• SCI and Implementing Partner support staff – for necessary financial/budget, venue/hall
arrangements, transport and logistics at all levels
14
2) "Translation bias.” Interpretation of questions may be different in the local language compared to
the original question in English. To mitigate this, during the training session the survey team took
sufficient time to translate the questionnaire into the local language
3) "Enumerator bias." The opinions of the enumerators and their supervisors can skew the results,
for example when enumerators show verbal or non-verbal responses to what is “correct” during
the interview. The team tried to minimize this bias during training through role playing.
4) “Respondent bias.” Respondents may have an interest in providing false answers because they think
that they may benefit later, especially in the event that their responses may lead them to some
kind of financial/material support from the project. As a mitigation strategy, in all places, the
enumerators explained the objectives of the study to avoid this bias.
5) "Privacy bias." In order to ensure the respondents’ confidentiality, the enumerators were advised
to make certain that crowds were not present during the interviews.
To further reduce the risks of bias, the survey coordinators:
• Dedicated time and effort to select experienced enumerators.
• Started with a pre-survey (pilot test) and supervised enumerators during the study.
• Verified the completed questionnaires each day and provided feedback to the enumerators before
conducting fieldwork the next day.
Bias and Limitations
1) “Nonresponse bias.” The fact that individual interviews were conducted from 9 a.m. to 4 p.m.
meant that some participants were away during the survey and thus were not included in the study.
15
FINDINGS
Demographic Information
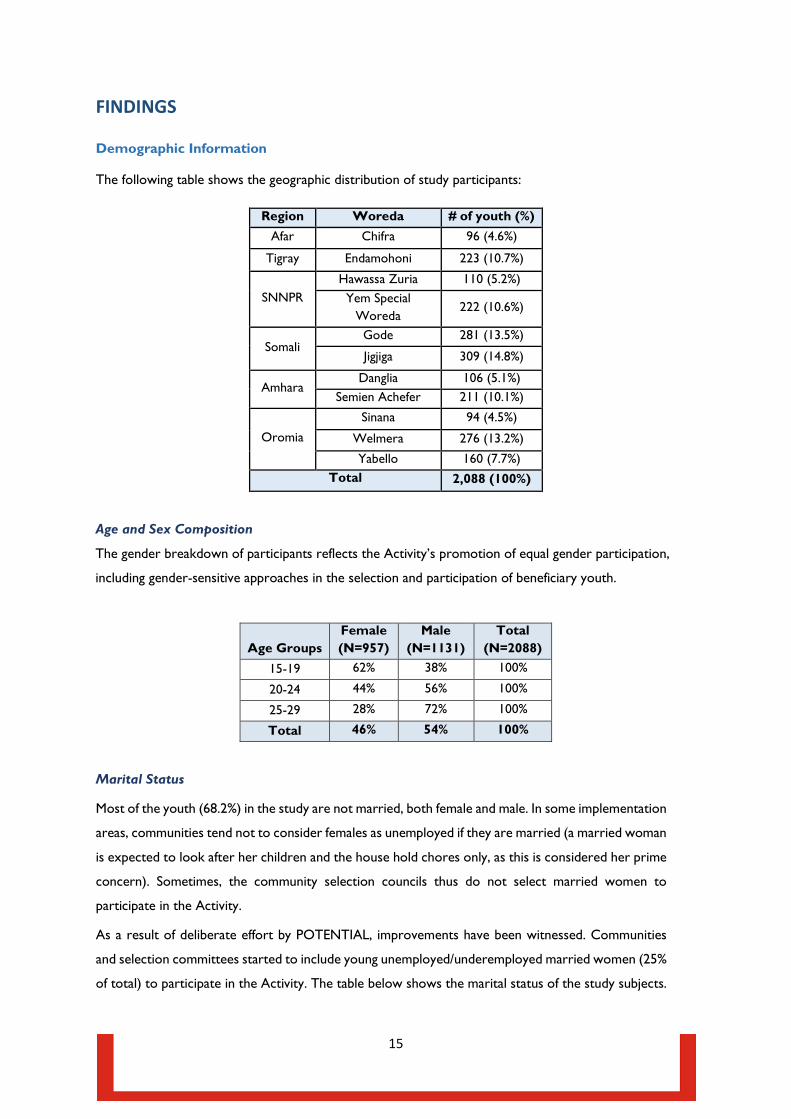
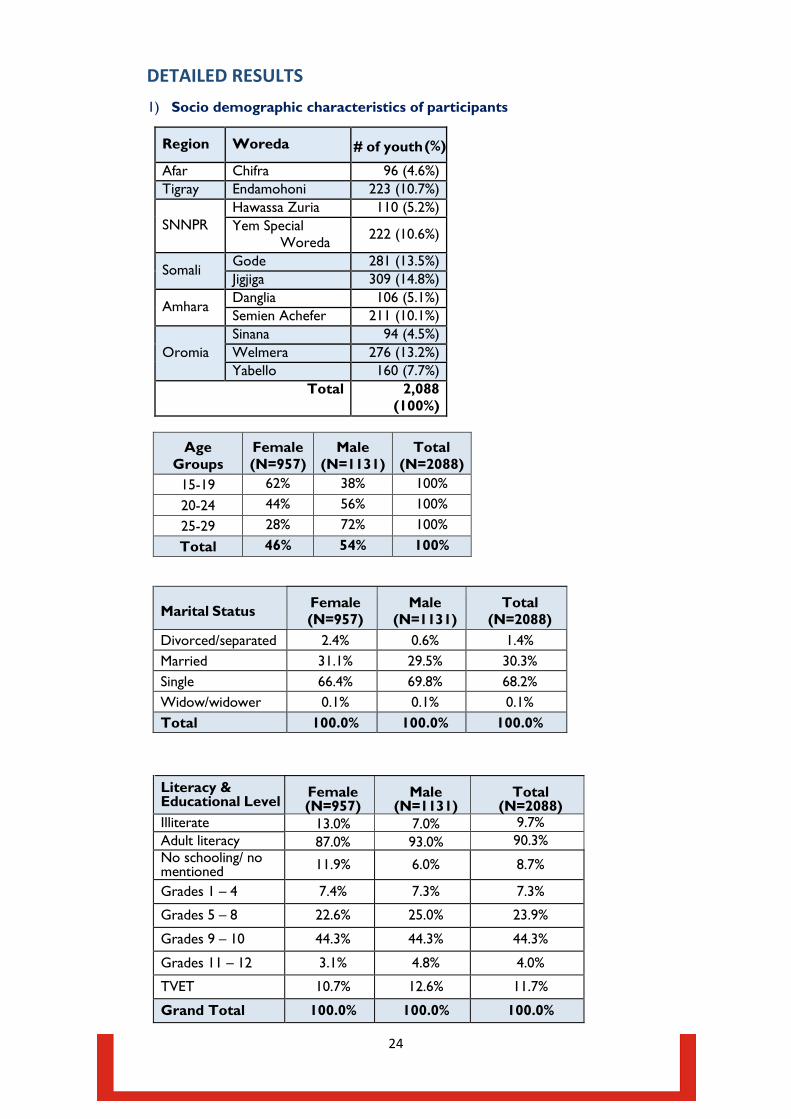
The following table shows the geographic distribution of study participants:
Region Woreda # of youth (%) Afar Chifra 96 (4.6%)
Tigray Endamohoni 223 (10.7%)
SNNPR Hawassa Zuria 110 (5.2%) Yem Special
Woreda 222 (10.6%)
Somali Gode 281 (13.5%)
Jigjiga 309 (14.8%)
Amhara Danglia 106 (5.1%)
Semien Achefer 211 (10.1%)
Oromia
Sinana 94 (4.5%)
Welmera 276 (13.2%)
Yabello 160 (7.7%) Total 2,088 (100%)
Age and Sex Composition
The gender breakdown of participants reflects the Activity’s promotion of equal gender participation,
including gender-sensitive approaches in the selection and participation of beneficiary youth.
Age Groups Female (N=957)
Male (N=1131)
Total (N=2088)
15-19 62% 38% 100%
20-24 44% 56% 100%
25-29 28% 72% 100%
Total 46% 54% 100%
Marital Status
Most of the youth (68.2%) in the study are not married, both female and male. In some implementation
areas, communities tend not to consider females as unemployed if they are married (a married woman
is expected to look after her children and the house hold chores only, as this is considered her prime
concern). Sometimes, the community selection councils thus do not select married women to
participate in the Activity.
As a result of deliberate effort by POTENTIAL, improvements have been witnessed. Communities
and selection committees started to include young unemployed/underemployed married women (25%
of total) to participate in the Activity. The table below shows the marital status of the study subjects.
16
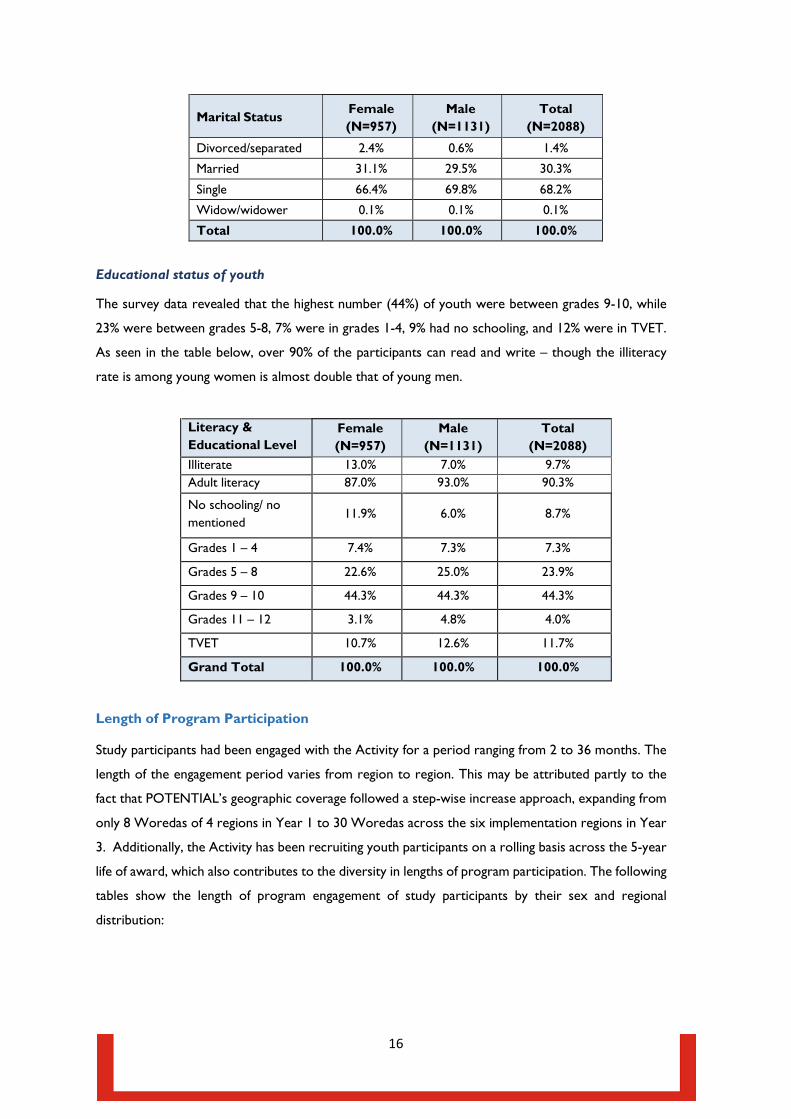
Marital Status Female (N=957)
Male (N=1131)
Total (N=2088)
Divorced/separated 2.4% 0.6% 1.4%
Married 31.1% 29.5% 30.3%
Single 66.4% 69.8% 68.2%
Widow/widower 0.1% 0.1% 0.1%
Total 100.0% 100.0% 100.0%
Educational status of youth
The survey data revealed that the highest number (44%) of youth were between grades 9-10, while
23% were between grades 5-8, 7% were in grades 1-4, 9% had no schooling, and 12% were in TVET.
As seen in the table below, over 90% of the participants can read and write – though the illiteracy
rate is among young women is almost double that of young men.
Literacy & Educational Level
Female (N=957)
Male (N=1131)
Total (N=2088)
Illiterate 13.0% 7.0% 9.7% Adult literacy 87.0% 93.0% 90.3%
No schooling/ no mentioned
11.9% 6.0% 8.7%
Grades 1 – 4 7.4% 7.3% 7.3%
Grades 5 – 8 22.6% 25.0% 23.9%
Grades 9 – 10 44.3% 44.3% 44.3%
Grades 11 – 12 3.1% 4.8% 4.0%
TVET 10.7% 12.6% 11.7%
Grand Total 100.0% 100.0% 100.0%
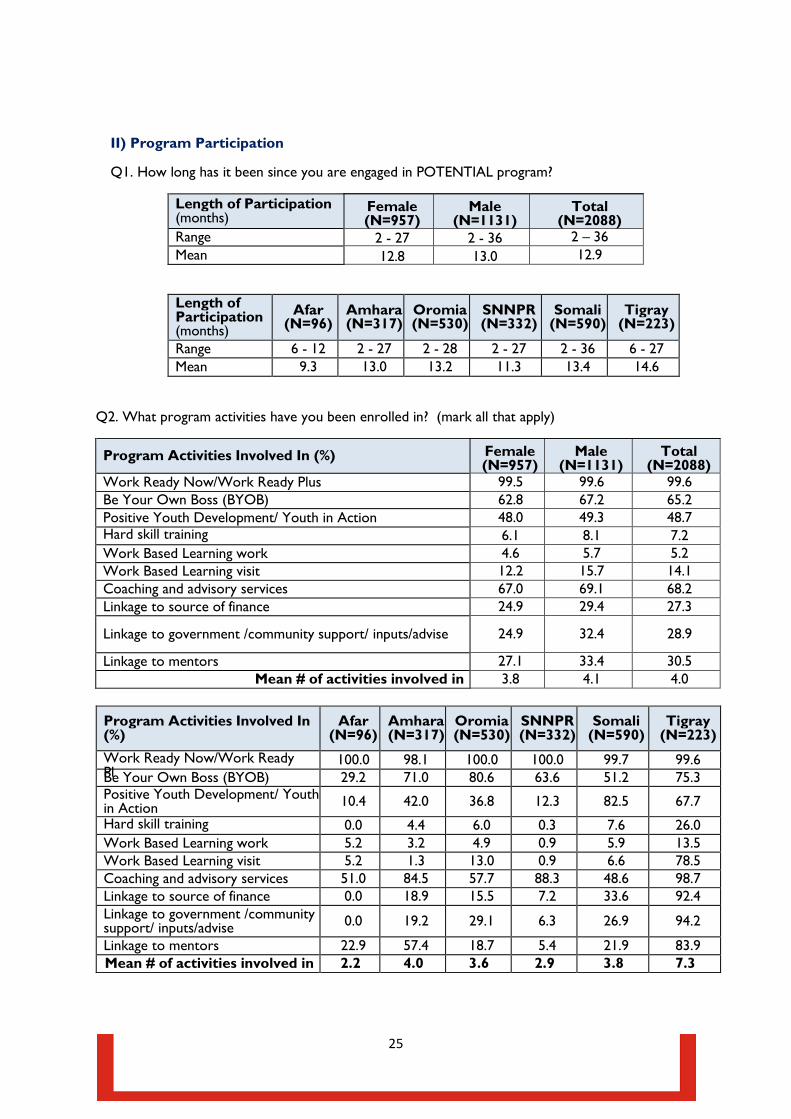
Length of Program Participation
Study participants had been engaged with the Activity for a period ranging from 2 to 36 months. The
length of the engagement period varies from region to region. This may be attributed partly to the
fact that POTENTIAL’s geographic coverage followed a step-wise increase approach, expanding from
only 8 Woredas of 4 regions in Year 1 to 30 Woredas across the six implementation regions in Year
3. Additionally, the Activity has been recruiting youth participants on a rolling basis across the 5-year
life of award, which also contributes to the diversity in lengths of program participation. The following
tables show the length of program engagement of study participants by their sex and regional
distribution:
17
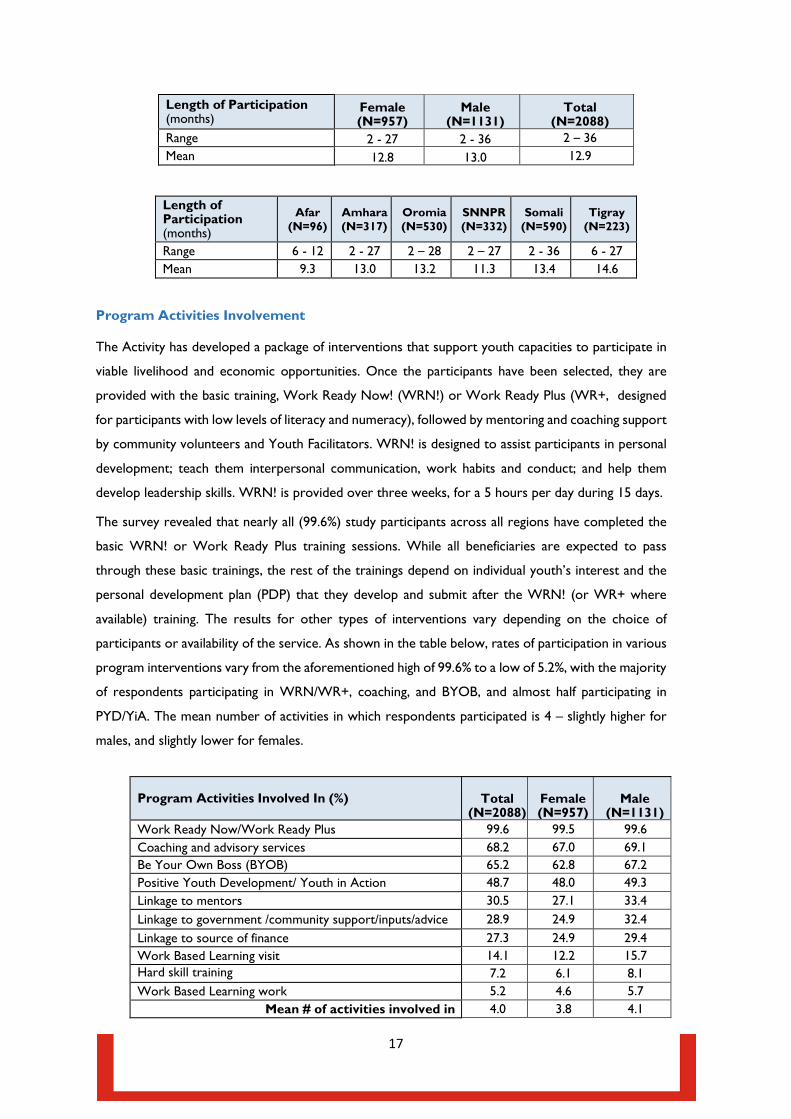
Length of Participation (months)
Female (N=957)
Male (N=1131)
Total (N=2088)
Range 2 - 27 2 - 36 2 – 36 Mean 12.8 13.0 12.9
Length of Participation (months)
Afar (N=96)
Amhara (N=317)
Oromia (N=530)
SNNPR (N=332)
Somali (N=590)
Tigray (N=223)
Range 6 - 12 2 - 27 2 – 28 2 – 27 2 - 36 6 - 27 Mean 9.3 13.0 13.2 11.3 13.4 14.6
Program Activities Involvement
The Activity has developed a package of interventions that support youth capacities to participate in
viable livelihood and economic opportunities. Once the participants have been selected, they are
provided with the basic training, Work Ready Now! (WRN!) or Work Ready Plus (WR+, designed
for participants with low levels of literacy and numeracy), followed by mentoring and coaching support
by community volunteers and Youth Facilitators. WRN! is designed to assist participants in personal
development; teach them interpersonal communication, work habits and conduct; and help them
develop leadership skills. WRN! is provided over three weeks, for a 5 hours per day during 15 days.
The survey revealed that nearly all (99.6%) study participants across all regions have completed the
basic WRN! or Work Ready Plus training sessions. While all beneficiaries are expected to pass
through these basic trainings, the rest of the trainings depend on individual youth’s interest and the
personal development plan (PDP) that they develop and submit after the WRN! (or WR+ where
available) training. The results for other types of interventions vary depending on the choice of
participants or availability of the service. As shown in the table below, rates of participation in various
program interventions vary from the aforementioned high of 99.6% to a low of 5.2%, with the majority
of respondents participating in WRN/WR+, coaching, and BYOB, and almost half participating in
PYD/YiA. The mean number of activities in which respondents participated is 4 – slightly higher for
males, and slightly lower for females.
Program Activities Involved In (%) Total (N=2088)
Female (N=957)
Male (N=1131)
Work Ready Now/Work Ready Plus 99.6 99.5 99.6 Coaching and advisory services 68.2 67.0 69.1 Be Your Own Boss (BYOB) 65.2 62.8 67.2 Positive Youth Development/ Youth in Action 48.7 48.0 49.3 Linkage to mentors 30.5 27.1 33.4 Linkage to government /community support/inputs/advice 28.9 24.9 32.4 Linkage to source of finance 27.3 24.9 29.4 Work Based Learning visit 14.1 12.2 15.7 Hard skill training
7.2 6.1 8.1 Work Based Learning work 5.2 4.6 5.7
Mean # of activities involved in 4.0 3.8 4.1
18
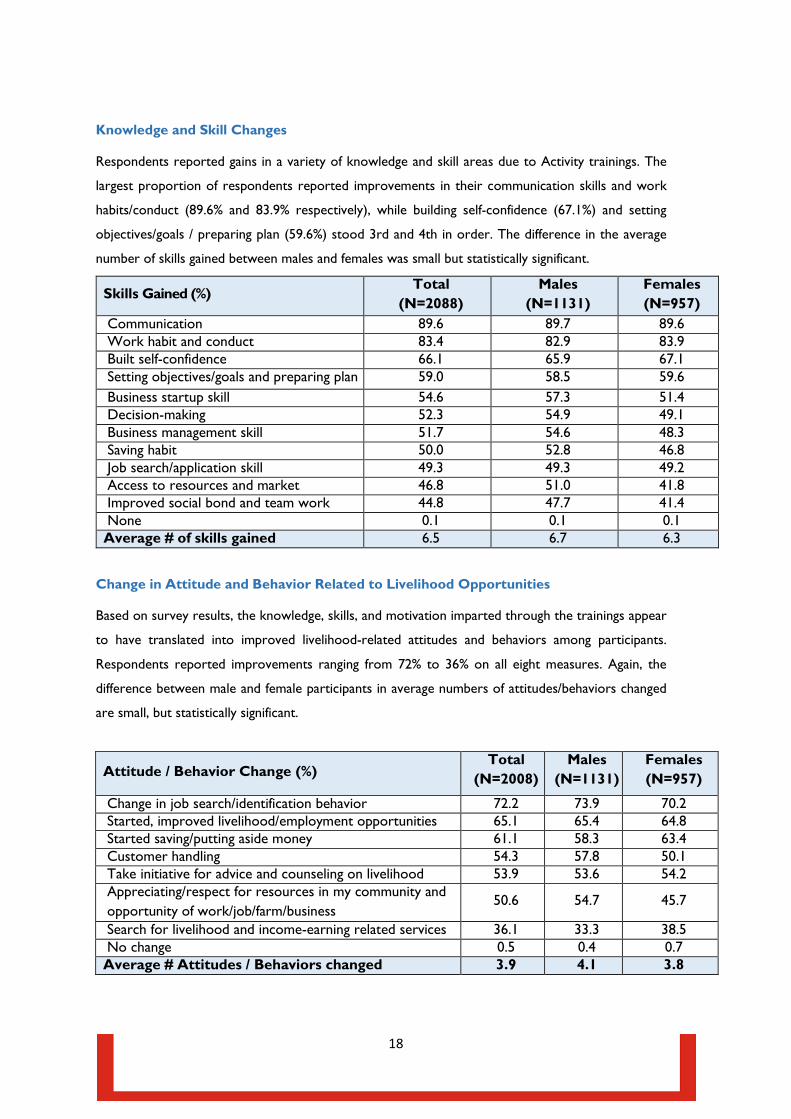
Knowledge and Skill Changes
Respondents reported gains in a variety of knowledge and skill areas due to Activity trainings. The
largest proportion of respondents reported improvements in their communication skills and work
habits/conduct (89.6% and 83.9% respectively), while building self-confidence (67.1%) and setting
objectives/goals / preparing plan (59.6%) stood 3rd and 4th in order. The difference in the average
number of skills gained between males and females was small but statistically significant.
Skills Gained (%) Total
(N=2088) Males
(N=1131) Females (N=957)
Communication 89.6 89.7 89.6 Work habit and conduct 83.4 82.9 83.9 Built self-confidence 66.1 65.9 67.1 Setting objectives/goals and preparing plan 59.0 58.5 59.6 Business startup skill 54.6 57.3 51.4 Decision-making 52.3 54.9 49.1 Business management skill 51.7 54.6 48.3 Saving habit 50.0 52.8 46.8 Job search/application skill 49.3 49.3 49.2 Access to resources and market 46.8 51.0 41.8 Improved social bond and team work 44.8 47.7 41.4 None 0.1 0.1 0.1 Average # of skills gained 6.5 6.7 6.3
Change in Attitude and Behavior Related to Livelihood Opportunities
Based on survey results, the knowledge, skills, and motivation imparted through the trainings appear
to have translated into improved livelihood-related attitudes and behaviors among participants.
Respondents reported improvements ranging from 72% to 36% on all eight measures. Again, the
difference between male and female participants in average numbers of attitudes/behaviors changed
are small, but statistically significant.
Attitude / Behavior Change (%) Total
(N=2008) Males
(N=1131) Females (N=957)
Change in job search/identification behavior
72.2 73.9 70.2 Started, improved livelihood/employment opportunities 65.1 65.4 64.8 Started saving/putting aside money 61.1 58.3 63.4 Customer handling 54.3 57.8 50.1 Take initiative for advice and counseling on livelihood
53.9 53.6 54.2
Appreciating/respect for resources in my community and opportunity of work/job/farm/business
50.6 54.7 45.7
Search for livelihood and income-earning related services
36.1 33.3 38.5 No change 0.5 0.4 0.7 Average # Attitudes / Behaviors changed 3.9 4.1 3.8
19
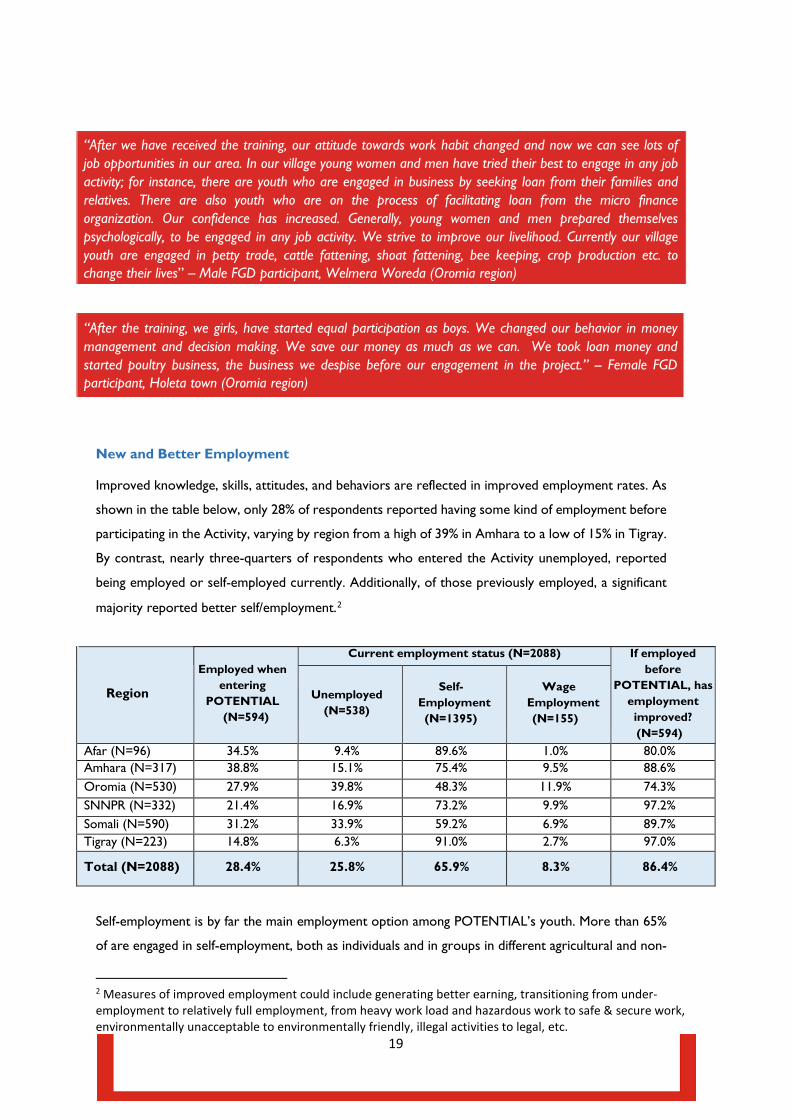
New and Better Employment
Improved knowledge, skills, attitudes, and behaviors are reflected in improved employment rates. As
shown in the table below, only 28% of respondents reported having some kind of employment before
participating in the Activity, varying by region from a high of 39% in Amhara to a low of 15% in Tigray.
By contrast, nearly three-quarters of respondents who entered the Activity unemployed, reported
being employed or self-employed currently. Additionally, of those previously employed, a significant
majority reported better self/employment.2
Region
Employed when entering
POTENTIAL (N=594)
Current employment status (N=2088) If employed before
POTENTIAL, has employment improved? (N=594)
Unemployed (N=538)
Self- Employment (N=1395)
Wage Employment (N=155)
Afar (N=96) 34.5% 9.4% 89.6% 1.0% 80.0% Amhara (N=317) 38.8% 15.1% 75.4% 9.5% 88.6% Oromia (N=530) 27.9% 39.8% 48.3% 11.9% 74.3% SNNPR (N=332) 21.4% 16.9% 73.2% 9.9% 97.2% Somali (N=590) 31.2% 33.9% 59.2% 6.9% 89.7% Tigray (N=223) 14.8% 6.3% 91.0% 2.7% 97.0%
Total (N=2088) 28.4% 25.8% 65.9% 8.3% 86.4%
Self-employment is by far the main employment option among POTENTIAL’s youth. More than 65%
of are engaged in self-employment, both as individuals and in groups in different agricultural and non-
2 Measures of improved employment could include generating better earning, transitioning from under- employment to relatively full employment, from heavy work load and hazardous work to safe & secure work, environmentally unacceptable to environmentally friendly, illegal activities to legal, etc.
“After we have received the training, our attitude towards work habit changed and now we can see lots of job opportunities in our area. In our village young women and men have tried their best to engage in any job activity; for instance, there are youth who are engaged in business by seeking loan from their families and relatives. There are also youth who are on the process of facilitating loan from the micro finance organization. Our confidence has increased. Generally, young women and men prepared themselves psychologically, to be engaged in any job activity. We strive to improve our livelihood. Currently our village youth are engaged in petty trade, cattle fattening, shoat fattening, bee keeping, crop production etc. to change their lives” – Male FGD participant, Welmera Woreda (Oromia region)
“After the training, we girls, have started equal participation as boys. We changed our behavior in money management and decision making. We save our money as much as we can. We took loan money and started poultry business, the business we despise before our engagement in the project.” -- Female FGD participant, Holeta town (Oromia region)
20
agricultural activities. This accords with the results of USAID’s Ethiopia Performance Monitoring and
Evaluation Service (EPMES) Activity, which found that Youth stated that self-employment was their
primary “choice” of an income activity than wage employment because 1) greater income-generating
potential; (ii) better and continuous source of income; and (iii) satisfaction of being one’s own “boss”
and not having to report to somebody else. Wage employment opportunities are limited in these
rural areas; in addition, the low rate of respondents entering wage employment (8.3%) reflects the
low level of education and limited technical skills of target youth, and the fact that the Activity is
primarily supporting them on soft skills.
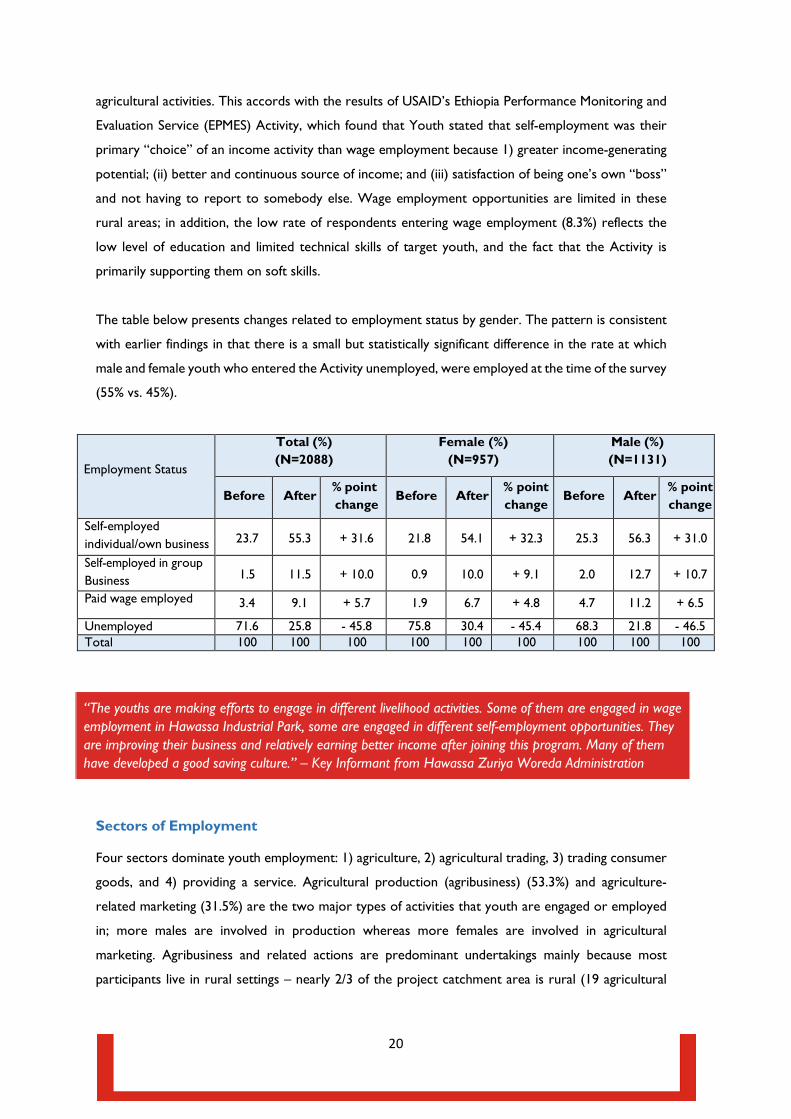
The table below presents changes related to employment status by gender. The pattern is consistent
with earlier findings in that there is a small but statistically significant difference in the rate at which
male and female youth who entered the Activity unemployed, were employed at the time of the survey
(55% vs. 45%).
Employment Status
Total (%) (N=2088)
Female (%) (N=957)
Male (%) (N=1131)
Before After % point change
Before After % point change
Before After % point change
Self-employed individual/own business
23.7 55.3 + 31.6 21.8 54.1 + 32.3 25.3 56.3 + 31.0
Self-employed in group Business 1.5 11.5 + 10.0 0.9 10.0 + 9.1 2.0 12.7 + 10.7
Paid wage employed 3.4 9.1 + 5.7 1.9 6.7 + 4.8 4.7 11.2 + 6.5
Unemployed 71.6 25.8 - 45.8 75.8 30.4 - 45.4 68.3 21.8 - 46.5Total 100 100 100 100 100 100 100 100 100
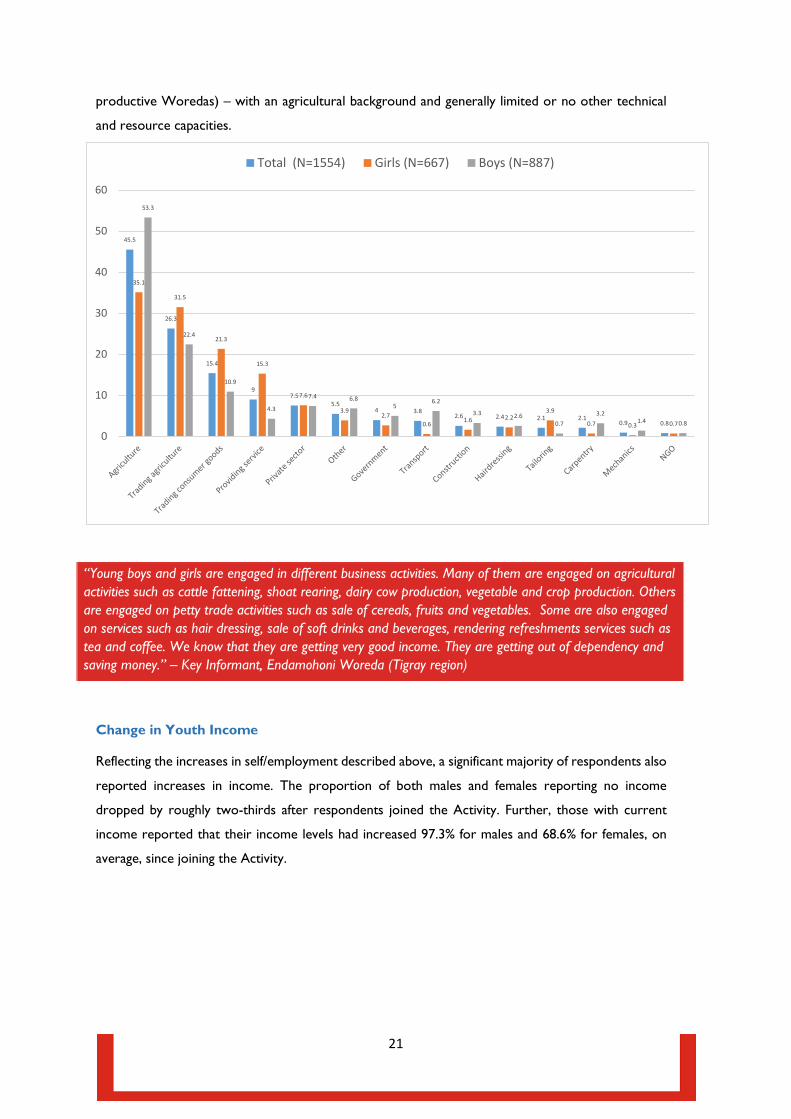
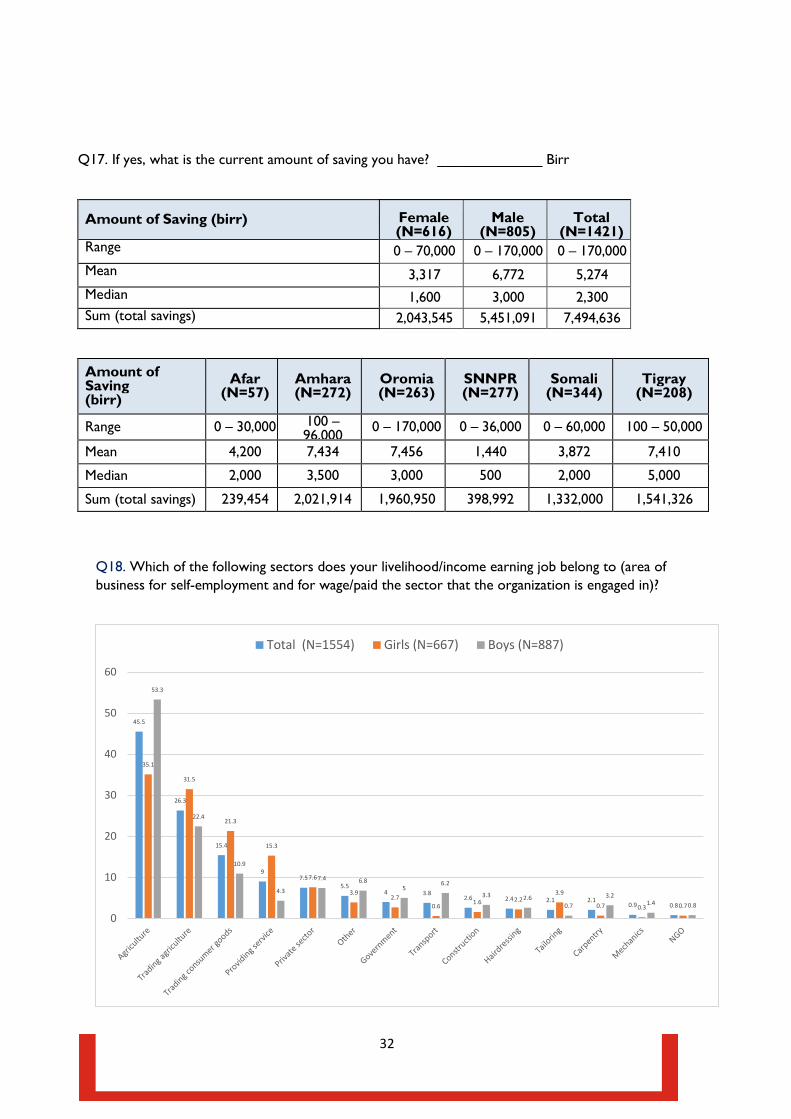
Sectors of Employment
Four sectors dominate youth employment: 1) agriculture, 2) agricultural trading, 3) trading consumer
goods, and 4) providing a service. Agricultural production (agribusiness) (53.3%) and agriculture-
related marketing (31.5%) are the two major types of activities that youth are engaged or employed
in; more males are involved in production whereas more females are involved in agricultural
marketing. Agribusiness and related actions are predominant undertakings mainly because most
participants live in rural settings – nearly 2/3 of the project catchment area is rural (19 agricultural
“The youths are making efforts to engage in different livelihood activities. Some of them are engaged in wage employment in Hawassa Industrial Park, some are engaged in different self-employment opportunities. They are improving their business and relatively earning better income after joining this program. Many of them have developed a good saving culture.” – Key Informant from Hawassa Zuriya Woreda Administration
21
productive Woredas) – with an agricultural background and generally limited or no other technical
and resource capacities.
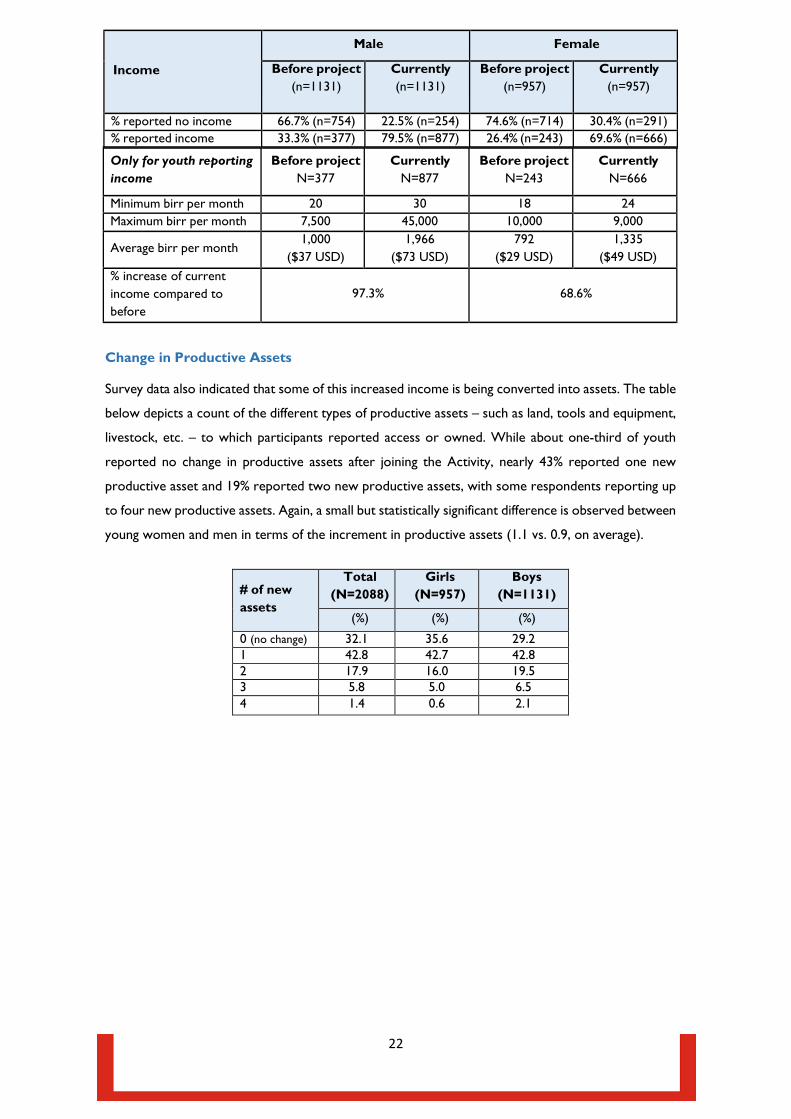
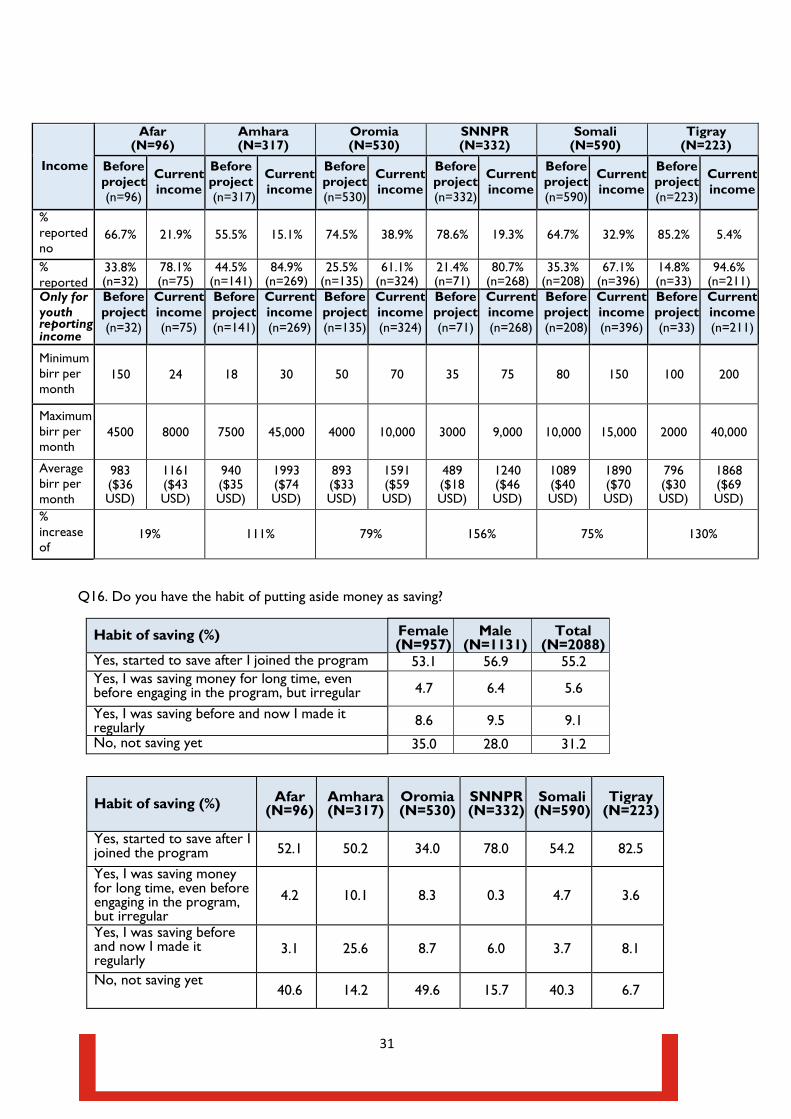
Change in Youth Income
Reflecting the increases in self/employment described above, a significant majority of respondents also
reported increases in income. The proportion of both males and females reporting no income
dropped by roughly two-thirds after respondents joined the Activity. Further, those with current
income reported that their income levels had increased 97.3% for males and 68.6% for females, on
average, since joining the Activity.
45.5
26.3
15.4
97.5
5.54 3.8
2.6 2.4 2.1 2.10.9 0.8
35.1
31.5
21.3
15.3
7.6
3.92.7
0.6 1.6 2.23.9
0.7 0.3 0.7
53.3
22.4
10.9
4.3
7.4 6.85
6.2
3.3 2.60.7
3.21.4 0.8
0
10
20
30
40
50
60
Total (N=1554) Girls (N=667) Boys (N=887)
“Young boys and girls are engaged in different business activities. Many of them are engaged on agricultural activities such as cattle fattening, shoat rearing, dairy cow production, vegetable and crop production. Others are engaged on petty trade activities such as sale of cereals, fruits and vegetables. Some are also engaged on services such as hair dressing, sale of soft drinks and beverages, rendering refreshments services such as tea and coffee. We know that they are getting very good income. They are getting out of dependency and saving money.” – Key Informant, Endamohoni Woreda (Tigray region)
22
Only for youth reporting income
Before project N=377
Currently N=877
Before project N=243
Currently N=666
Minimum birr per month 20 30 18 24 Maximum birr per month 7,500 45,000 10,000 9,000
Average birr per month 1,000
($37 USD) 1,966
($73 USD) 792
($29 USD) 1,335
($49 USD) % increase of current income compared to before
97.3% 68.6%
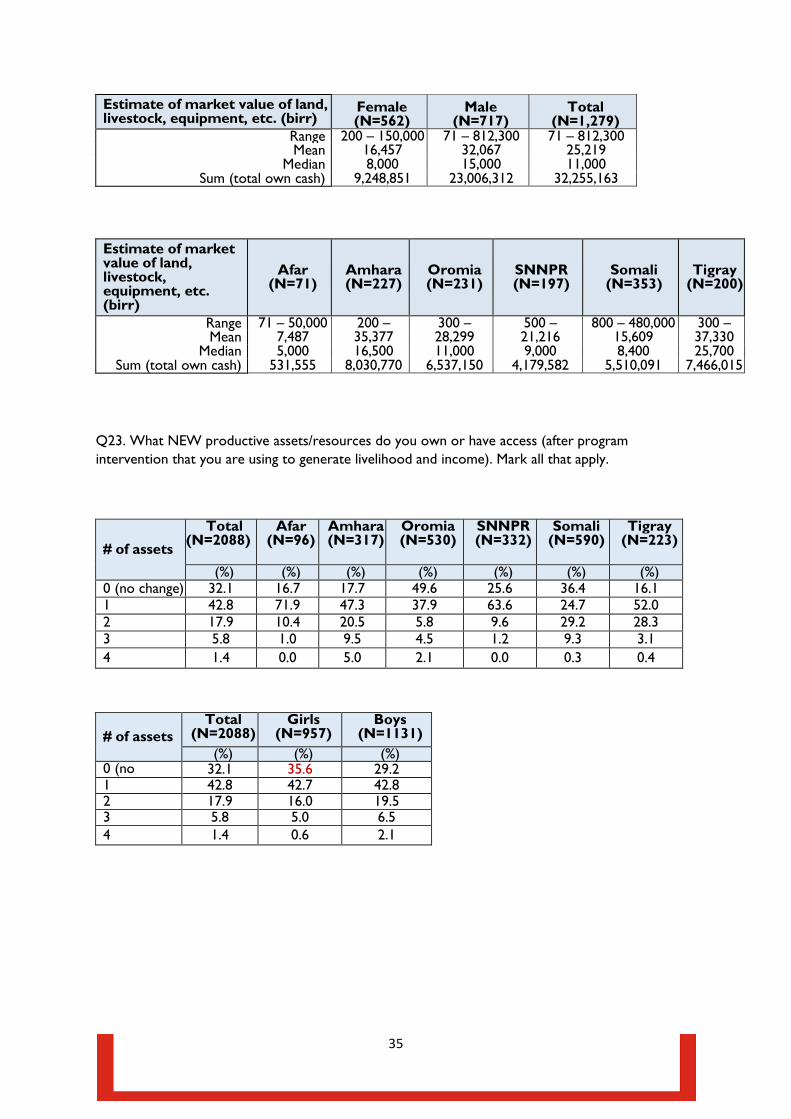
Change in Productive Assets
Survey data also indicated that some of this increased income is being converted into assets. The table
below depicts a count of the different types of productive assets – such as land, tools and equipment,
livestock, etc. – to which participants reported access or owned. While about one-third of youth
reported no change in productive assets after joining the Activity, nearly 43% reported one new
productive asset and 19% reported two new productive assets, with some respondents reporting up
to four new productive assets. Again, a small but statistically significant difference is observed between
young women and men in terms of the increment in productive assets (1.1 vs. 0.9, on average).
# of new assets
Total (N=2088)
Girls (N=957)
Boys (N=1131)
(%) (%) (%)
0 (no change) 32.1 35.6 29.2 1 42.8 42.7 42.8 2 17.9 16.0 19.5 3 5.8 5.0 6.5 4 1.4 0.6 2.1
Income
Male Female
Before project (n=1131)
Currently (n=1131)
Before project (n=957)
Currently (n=957)
% reported no income 66.7% (n=754) 22.5% (n=254) 74.6% (n=714) 30.4% (n=291) % reported income 33.3% (n=377) 79.5% (n=877) 26.4% (n=243) 69.6% (n=666)
23
incomes, and new productive assets. None of the interventions studied had significant negative impact
on employment or earnings of participants.
Gender-related findings were also promising in that females demonstrated changes along most
dimensions very similar to those experienced by males, though the small differences were statistically
significant. One important exception to this pattern was income, which increased approximately 40%
more for young men than for young women. This suggests that while the Activity is doing a
commendable job recruiting and improving livelihoods outcomes for females, more remains to be
understood about how to attain true gender parity in Activity results.
More also remains to be learned from survey results about which intermediate outcomes (changes in
knowledge/skills, attitudes, and livelihoods-related behaviors) are most associated with increases in
employment. This analysis is currently being completed and will be presented in a forthcoming paper.
While these findings are self-reported and based on participants only, they provide initial support for
the Activity’s programmatic logic and suggest that further investment in rigorous impact analysis would
be justified. Potential looks forward to continuing to mine this and additional data in order to deepen
its positive impact for the youth of Ethiopia.
CONCLUSION
The initial analysis of outcomes data summarized in this paper suggests that USAID’s Building the
Potential of Youth is producing positive results for beneficiaries at the halfway point. The Activity’s
theory of change posits that improving youth skills, attitudes, behaviors, and opportunities related to
livelihoods will increase their rates of employment, income, and assets. Outcomes data appear to
support this theory: widespread self-reported improvements in knowledge/skills, attitudes, and
behaviors were observed in tandem with increased rates of self/wage/better employment, increased
“Most of us have changed in different dimensions of our life after participating in this project. We became active in business, started respecting others and ourselves as a human being and are willing to do any kind of productive work like others do. Some of us become skillful, knowledgeable, can regularly save money, have a good decision-making behavior, and manage our time.” – Male FGD participant, C f (Af)
24
Age Groups
Female (N=957)
Male (N=1131)
Total (N=2088)
15-19 62% 38% 100%
20-24 44% 56% 100%
25-29 28% 72% 100%
Total 46% 54% 100%
Marital Status Female (N=957)
Male (N=1131)
Total (N=2088)
Divorced/separated 2.4% 0.6% 1.4% Married 31.1% 29.5% 30.3% Single 66.4% 69.8% 68.2% Widow/widower 0.1% 0.1% 0.1% Total 100.0% 100.0% 100.0%
Literacy & Educational Level
Female (N=957)
Male (N=1131)
Total (N=2088)
Illiterate 13.0% 7.0% 9.7% Adult literacy 87.0% 93.0% 90.3% No schooling/ no mentioned 11.9% 6.0% 8.7%
Grades 1 – 4 7.4% 7.3% 7.3%
Grades 5 – 8 22.6% 25.0% 23.9%
Grades 9 – 10 44.3% 44.3% 44.3%
Grades 11 – 12 3.1% 4.8% 4.0%
TVET 10.7% 12.6% 11.7%
Grand Total 100.0% 100.0% 100.0%
Region Woreda (%)
Afar Chifra 96 (4.6%) Tigray Endamohoni 223 (10.7%)
SNNPR Hawassa Zuria 110 (5.2%) Yem Special
Woreda 222 (10.6%)
Somali Gode 281 (13.5%) Jigjiga 309 (14.8%)
Amhara Danglia 106 (5.1%) Semien Achefer 211 (10.1%)
Oromia Sinana 94 (4.5%) Welmera 276 (13.2%) Yabello 160 (7.7%)
Total 2,088 (100%)
# of youth
DETAILED RESULTS 1) Socio demographic characteristics of participants
25
Q2. What program activities have you been enrolled in? (mark all that apply)
Program Activities Involved In (%) Female (N=957)
Male (N=1131)
Total (N=2088)
Work Ready Now/Work Ready Plus 99.5 99.6 99.6 Be Your Own Boss (BYOB) 62.8 67.2 65.2 Positive Youth Development/ Youth in Action 48.0 49.3 48.7 Hard skill training
6.1 8.1 7.2 Work Based Learning work 4.6 5.7 5.2 Work Based Learning visit 12.2 15.7 14.1 Coaching and advisory services 67.0 69.1 68.2 Linkage to source of finance 24.9 29.4 27.3
Linkage to government /community support/ inputs/advise 24.9 32.4 28.9
Linkage to mentors 27.1 33.4 30.5 Mean # of activities involved in 3.8 4.1 4.0
Program Activities Involved In (%)
Afar (N=96)
Amhara (N=317)
Oromia (N=530)
SNNPR (N=332)
Somali (N=590)
Tigray (N=223)
Work Ready Now/Work Ready Pl
100.0 98.1 100.0 100.0 99.7 99.6 Be Your Own Boss (BYOB) 29.2 71.0 80.6 63.6 51.2 75.3 Positive Youth Development/ Youth in Action 10.4 42.0 36.8 12.3 82.5 67.7
Hard skill training
0.0 4.4 6.0 0.3 7.6 26.0 Work Based Learning work 5.2 3.2 4.9 0.9 5.9 13.5 Work Based Learning visit 5.2 1.3 13.0 0.9 6.6 78.5 Coaching and advisory services 51.0 84.5 57.7 88.3 48.6 98.7 Linkage to source of finance 0.0 18.9 15.5 7.2 33.6 92.4 Linkage to government /community support/ inputs/advise 0.0 19.2 29.1 6.3 26.9 94.2
Linkage to mentors 22.9 57.4 18.7 5.4 21.9 83.9 Mean # of activities involved in 2.2 4.0 3.6 2.9 3.8 7.3
II) Program Participation
Q1. How long has it been since you are engaged in POTENTIAL program?
Length of Participation (months)
Female (N=957)
Male (N=1131)
Total (N=2088)
Range 2 - 27 2 - 36 2 – 36 Mean 12.8 13.0 12.9
Length of Participation (months)
Afar (N=96)
Amhara (N=317)
Oromia (N=530)
SNNPR (N=332)
Somali (N=590)
Tigray (N=223)
Range 6 - 12 2 - 27 2 - 28 2 - 27 2 - 36 6 - 27 Mean 9.3 13.0 13.2 11.3 13.4 14.6
26
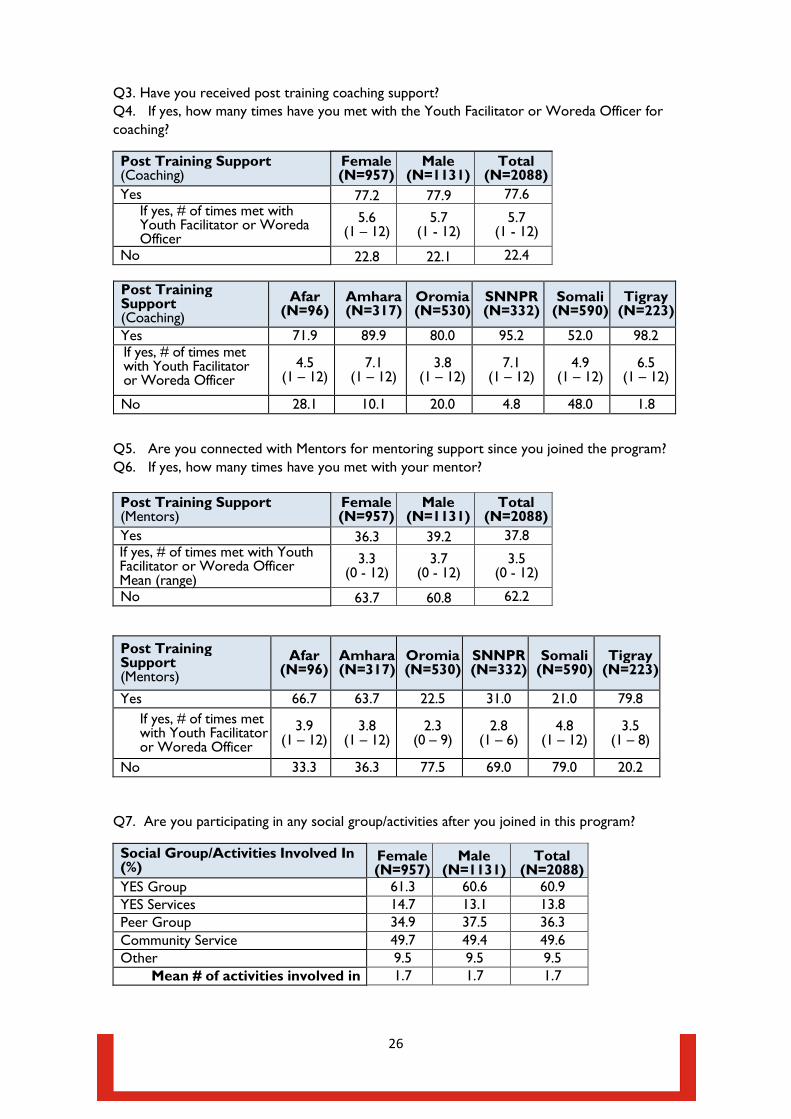
Q5. Are you connected with Mentors for mentoring support since you joined the program? Q6. If yes, how many times have you met with your mentor?
Post Training Support (Mentors)
Female (N=957)
Male (N=1131)
Total (N=2088)
Yes 36.3 39.2 37.8 If yes, # of times met with Youth Facilitator or Woreda Officer Mean (range)
3.3 (0 - 12)
3.7 (0 - 12)
3.5 (0 - 12)
No 63.7 60.8 62.2
Post Training Support (Mentors)
Afar (N=96)
Amhara (N=317)
Oromia (N=530)
SNNPR (N=332)
Somali (N=590)
Tigray (N=223)
Yes 66.7 63.7 22.5 31.0 21.0 79.8 If yes, # of times met with Youth Facilitator or Woreda Officer
3.9 (1 – 12)
3.8 (1 – 12)
2.3 (0 – 9)
2.8 (1 – 6)
4.8 (1 – 12)
3.5 (1 – 8)
No 33.3 36.3 77.5 69.0 79.0 20.2
Q7. Are you participating in any social group/activities after you joined in this program?
Social Group/Activities Involved In (%)
Female (N=957)
Male (N=1131)
Total (N=2088)
YES Group 61.3 60.6 60.9 YES Services 14.7 13.1 13.8 Peer Group 34.9 37.5 36.3 Community Service 49.7 49.4 49.6 Other 9.5 9.5 9.5
Mean # of activities involved in 1.7 1.7 1.7
Q3. Have you received post training coaching support? Q4. If yes, how many times have you met with the Youth Facilitator or Woreda Officer for coaching?
Post Training Support (Coaching)
Female (N=957)
Male (N=1131)
Total (N=2088)
Yes 77.2 77.9 77.6 If yes, # of times met with Youth Facilitator or Woreda Officer
5.6 (1 – 12)
5.7 (1 - 12)
5.7 (1 - 12)
No 22.8 22.1 22.4
Post Training Support (Coaching)
Afar (N=96)
Amhara (N=317)
Oromia (N=530)
SNNPR (N=332)
Somali (N=590)
Tigray (N=223)
Yes 71.9 89.9 80.0 95.2 52.0 98.2 If yes, # of times met with Youth Facilitator or Woreda Officer
4.5 (1 – 12)
7.1 (1 – 12)
3.8 (1 – 12)
7.1 (1 – 12)
4.9 (1 – 12)
6.5 (1 – 12)
No 28.1 10.1 20.0 4.8 48.0 1.8
27
III) Outcomes
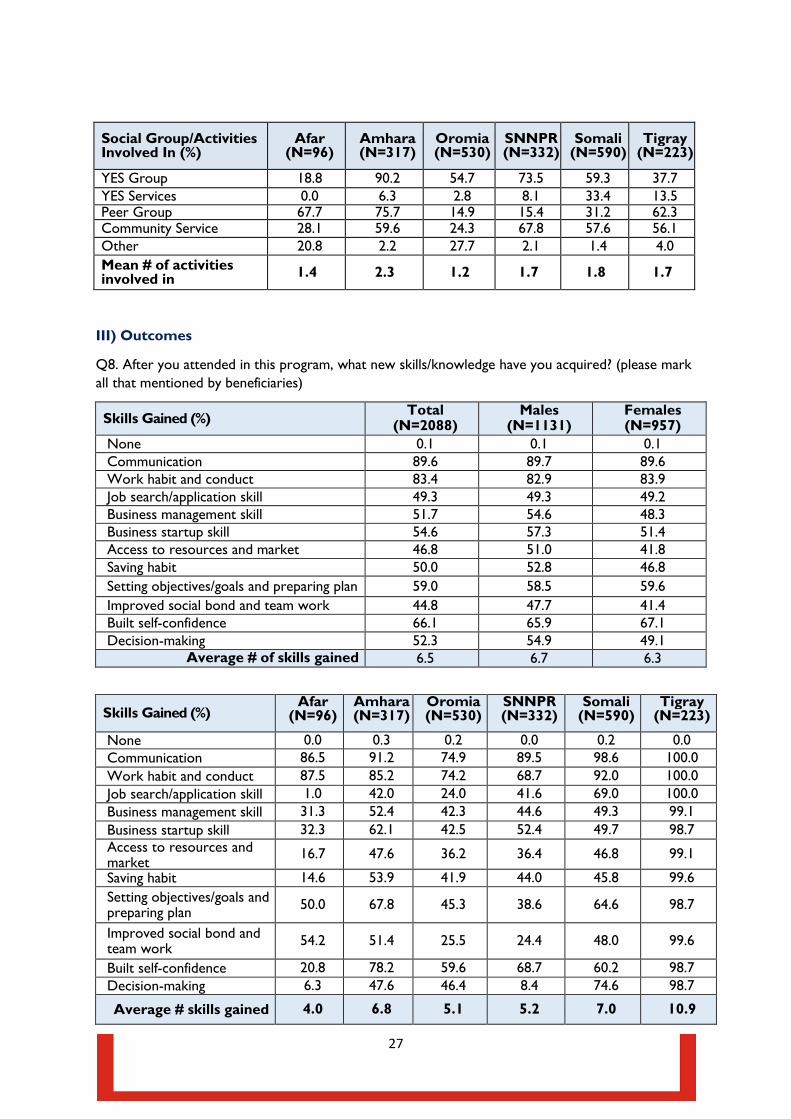
Q8. After you attended in this program, what new skills/knowledge have you acquired? (please mark all that mentioned by beneficiaries)
Skills Gained (%) Total (N=2088)
Males (N=1131)
Females (N=957)
None 0.1 0.1 0.1 Communication 89.6 89.7 89.6 Work habit and conduct 83.4 82.9 83.9 Job search/application skill 49.3 49.3 49.2 Business management skill 51.7 54.6 48.3 Business startup skill 54.6 57.3 51.4 Access to resources and market 46.8 51.0 41.8 Saving habit 50.0 52.8 46.8 Setting objectives/goals and preparing plan 59.0 58.5 59.6 Improved social bond and team work 44.8 47.7 41.4 Built self-confidence 66.1 65.9 67.1 Decision-making 52.3 54.9 49.1
Average # of skills gained 6.5 6.7 6.3
Skills Gained (%) Afar
(N=96) Amhara (N=317)
Oromia (N=530)
SNNPR (N=332)
Somali (N=590)
Tigray (N=223)
None 0.0 0.3 0.2 0.0 0.2 0.0 Communication 86.5 91.2 74.9 89.5 98.6 100.0 Work habit and conduct 87.5 85.2 74.2 68.7 92.0 100.0 Job search/application skill 1.0 42.0 24.0 41.6 69.0 100.0 Business management skill 31.3 52.4 42.3 44.6 49.3 99.1 Business startup skill 32.3 62.1 42.5 52.4 49.7 98.7 Access to resources and market
16.7 47.6 36.2 36.4 46.8 99.1
Saving habit 14.6 53.9 41.9 44.0 45.8 99.6 Setting objectives/goals and preparing plan 50.0 67.8 45.3 38.6 64.6 98.7
Improved social bond and team work 54.2 51.4 25.5 24.4 48.0 99.6
Built self-confidence 20.8 78.2 59.6 68.7 60.2 98.7 Decision-making 6.3 47.6 46.4 8.4 74.6 98.7
Average # skills gained 4.0 6.8 5.1 5.2 7.0 10.9
Social Group/Activities Involved In (%)
Afar (N=96)
Amhara (N=317)
Oromia (N=530)
SNNPR (N=332)
Somali (N=590)
Tigray (N=223)
YES Group 18.8 90.2 54.7 73.5 59.3 37.7 YES Services 0.0 6.3 2.8 8.1 33.4 13.5 Peer Group 67.7 75.7 14.9 15.4 31.2 62.3 Community Service 28.1 59.6 24.3 67.8 57.6 56.1 Other 20.8 2.2 27.7 2.1 1.4 4.0 Mean # of activities involved in 1.4 2.3 1.2 1.7 1.8 1.7
28
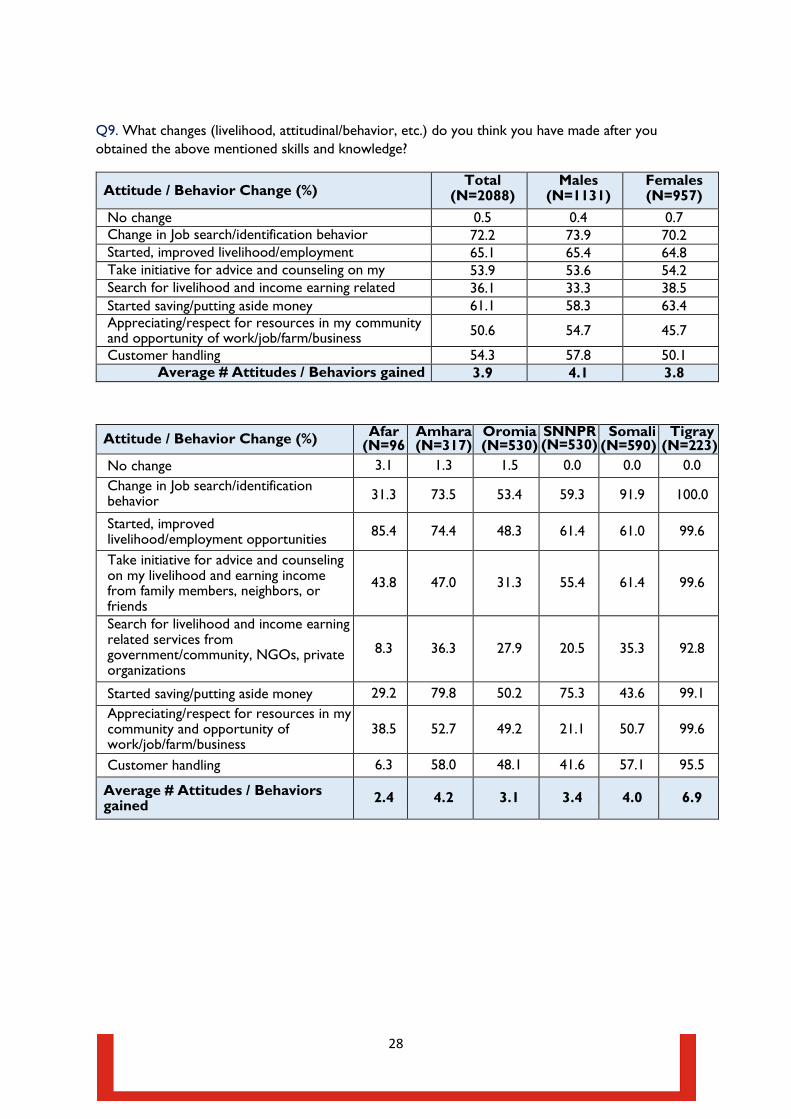
Q9. What changes (livelihood, attitudinal/behavior, etc.) do you think you have made after you obtained the above mentioned skills and knowledge?
Attitude / Behavior Change (%) Total
(N=2088) Males
(N=1131) Females (N=957)
No change 0.5 0.4 0.7 Change in Job search/identification behavior
72.2 73.9 70.2 Started, improved livelihood/employment
65.1 65.4 64.8
Take initiative for advice and counseling on my
53.9 53.6 54.2 Search for livelihood and income earning related
36.1 33.3 38.5
Started saving/putting aside money 61.1 58.3 63.4 Appreciating/respect for resources in my community and opportunity of work/job/farm/business
50.6 54.7 45.7
Customer handling 54.3 57.8 50.1 Average # Attitudes / Behaviors gained 3.9 4.1 3.8
Attitude / Behavior Change (%) Afar (N=96
Amhara (N=317)
Oromia (N=530)
SNNPR Somali (N=5
90)
Tigray (N=2
23)
No change 3.1 1.3 1.5 0.0 0.0 0.0 Change in Job search/identification behavior
31.3 73.5 53.4 59.3 91.9 100.0
Started, improved livelihood/employment opportunities 85.4 74.4 48.3 61.4 61.0 99.6
Take initiative for advice and counseling on my livelihood and earning income from family members, neighbors, or friends
43.8 47.0 31.3 55.4 61.4 99.6
Search for livelihood and income earning related services from government/community, NGOs, private organizations
8.3 36.3 27.9 20.5 35.3 92.8
Started saving/putting aside money 29.2 79.8 50.2 75.3 43.6 99.1 Appreciating/respect for resources in my community and opportunity of work/job/farm/business
38.5 52.7 49.2 21.1 50.7 99.6
Customer handling 6.3 58.0 48.1 41.6 57.1 95.5
Average # Attitudes / Behaviors gained 2.4 4.2 3.1 3.4 4.0 6.9
(N=530)
29
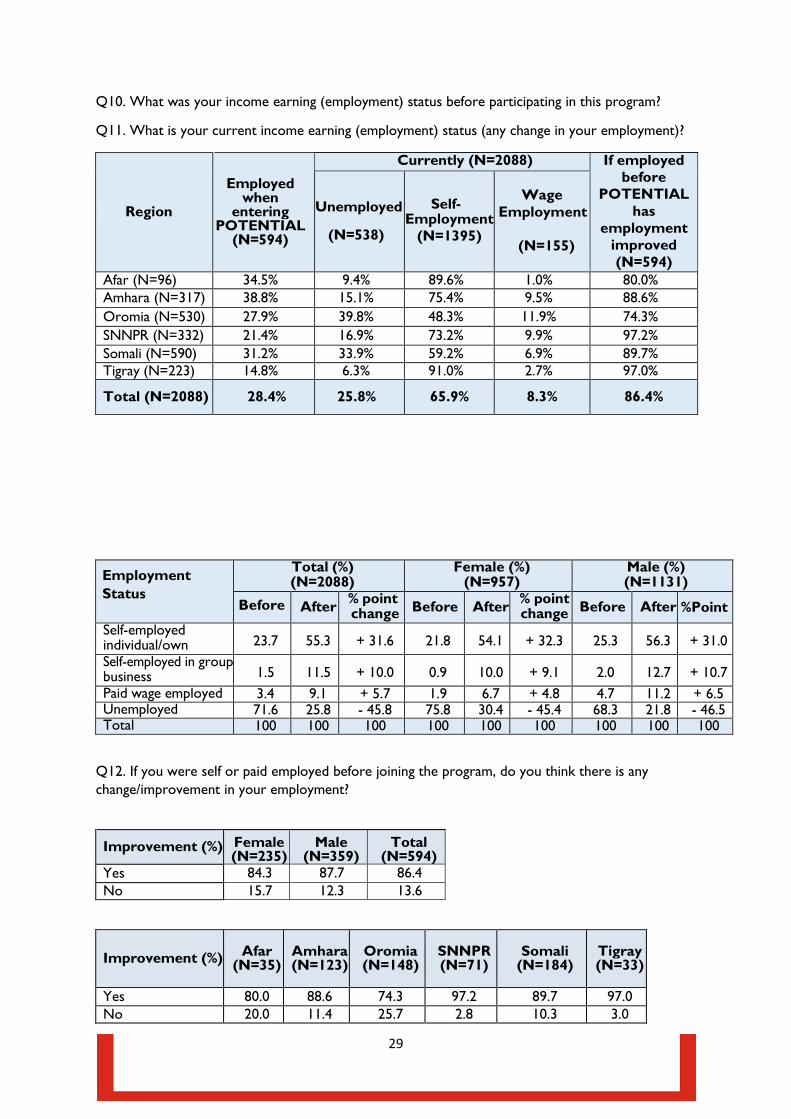
Q10. What was your income earning (employment) status before participating in this program?
Q11. What is your current income earning (employment) status (any change in your employment)?
Region
Employed when
entering POTENTIAL
(N=594)
Currently (N=2088) If employed before
POTENTIAL has
employment improved (N=594)
Unemployed
(N=538)
Self- Employment
(N=1395)
Wage Employment
(N=155)
Afar (N=96) 34.5% 9.4% 89.6% 1.0% 80.0% Amhara (N=317) 38.8% 15.1% 75.4% 9.5% 88.6% Oromia (N=530) 27.9% 39.8% 48.3% 11.9% 74.3% SNNPR (N=332) 21.4% 16.9% 73.2% 9.9% 97.2% Somali (N=590) 31.2% 33.9% 59.2% 6.9% 89.7% Tigray (N=223) 14.8% 6.3% 91.0% 2.7% 97.0%
Total (N=2088) 28.4% 25.8% 65.9% 8.3% 86.4%
Employment Status
Total (%) (N=2088)
Female (%) (N=957)
Male (%) (N=1131)
After % point change Before After % point
change Before After
Self-employed individual/own
23.7 55.3 + 31.6 21.8 54.1 + 32.3 25.3 56.3 + 31.0
Self-employed in group business 1.5 11.5 + 10.0 0.9 10.0 + 9.1 2.0 12.7 + 10.7Paid wage employed 3.4 9.1 + 5.7 1.9 6.7 + 4.8 4.7 11.2 + 6.5Unemployed 71.6 25.8 - 45.8 75.8 30.4 - 45.4 68.3 21.8 - 46.5Total 100 100 100 100 100 100 100 100 100
Q12. If you were self or paid employed before joining the program, do you think there is any change/improvement in your employment?
Improvement (%) Female (N=235)
Male (N=359)
Total (N=594)
Yes 84.3 87.7 86.4 No 15.7 12.3 13.6
Improvement (%) Afar (N=35)
Amhara (N=123)
Oromia (N=148)
SNNPR (N=71)
Somali (N=184)
Tigray (N=33)
Yes 80.0 88.6 74.3 97.2 89.7 97.0 No 20.0 11.4 25.7 2.8 10.3 3.0
Before %Point
30
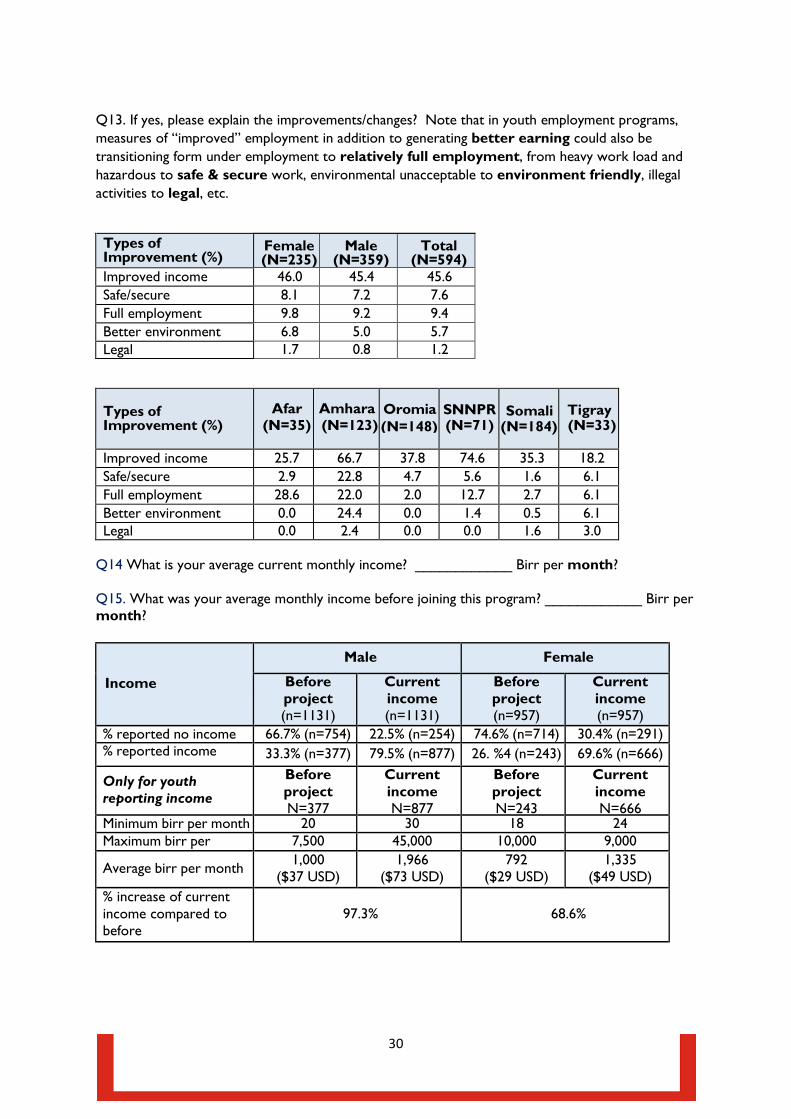
Q13. If yes, please explain the improvements/changes? Note that in youth employment programs, measures of “improved” employment in addition to generating better earning could also be transitioning form under employment to relatively full employment, from heavy work load and hazardous to safe & secure work, environmental unacceptable to environment friendly, illegal activities to legal, etc.
Types of Improvement (%)
Female (N=235)
Male (N=359)
Total (N=594)
Improved income 46.0 45.4 45.6 Safe/secure 8.1 7.2 7.6 Full employment 9.8 9.2 9.4 Better environment 6.8 5.0 5.7 Legal 1.7 0.8 1.2
Types of Improvement (%)
Afar (N=35)
Amhara (N=123) (N=148) (N=71)
Tigray (N=33)
Improved income 25.7 66.7 37.8 74.6 35.3 18.2 Safe/secure 2.9 22.8 4.7 5.6 1.6 6.1 Full employment 28.6 22.0 2.0 12.7 2.7 6.1 Better environment 0.0 24.4 0.0 1.4 0.5 6.1 Legal 0.0 2.4 0.0 0.0 1.6 3.0
Q14 What is your average current monthly income? ____________ Birr per month?
Q15. What was your average monthly income before joining this program? ____________ Birr per month?
Income
Male Female
Before project (n=1131)
Current income (n=1131)
Before project (n=957)
Current income (n=957)
% reported no income 66.7% (n=754) 22.5% (n=254) 74.6% (n=714) 30.4% (n=291) % reported income 33.3% (n=377) 79.5% (n=877) 26. %4 (n=243) 69.6% (n=666)
Only for youth reporting income
Before project N=377
Current income N=877
Before project N=243
Current income N=666
Minimum birr per month 20 30 18 24 Maximum birr per
7,500 45,000 10,000 9,000
Average birr per month 1,000 ($37 USD)
1,966 ($73 USD)
792 ($29 USD)
1,335 ($49 USD)
% increase of current income compared to before
97.3% 68.6%
(N=184)Oromia SNNPR Somali
31
Income
Afar (N=96)
Amhara (N=317)
Oromia (N=530)
SNNPR (N=332)
Somali (N=590)
Tigray (N=223)
Before project (n=96)
Current income
Before project (n=317)
Current income
Before project (n=530)
Current income
Before project (n=332)
Current income
Before project (n=590)
Current income
Before project (n=223)
Current income
% reported no
66.7% 21.9% 55.5% 15.1% 74.5% 38.9% 78.6% 19.3% 64.7% 32.9% 85.2% 5.4%
% reported
33.8% (n=32)
78.1% (n=75)
44.5% (n=141)
84.9% (n=269)
25.5% (n=135)
61.1% (n=324)
21.4% (n=71)
80.7% (n=268)
35.3% (n=208)
67.1% (n=396)
14.8% (n=33)
94.6% (n=211)
Only for youth reporting income
Before project (n=32)
Current income (n=75)
Before project (n=141)
Current income (n=269)
Before project (n=135)
Current income (n=324)
Before project (n=71)
Current income (n=268)
Before project (n=208)
Current income (n=396)
Before project (n=33)
Current income (n=211)
Minimum birr per month
150 24 18 30 50 70 35 75 80 150 100 200
Maximum birr per month
4500 8000 7500 45,000 4000 10,000 3000 9,000 10,000 15,000 2000 40,000
Average birr per month
983 ($36 USD)
1161 ($43 USD)
940 ($35 USD)
1993 ($74 USD)
893 ($33 USD)
1591 ($59 USD)
489 ($18 USD)
1240 ($46 USD)
1089 ($40 USD)
1890 ($70 USD)
796 ($30 USD)
1868 ($69 USD)
% increase of
19% 111% 79% 156% 75% 130%
Q16. Do you have the habit of putting aside money as saving?
Habit of saving (%) Female (N=957)
Male (N=1131)
Total (N=2088)
Yes, started to save after I joined the program 53.1 56.9 55.2 Yes, I was saving money for long time, even before engaging in the program, but irregular 4.7 6.4 5.6
Yes, I was saving before and now I made it regularly 8.6 9.5 9.1
No, not saving yet 35.0 28.0 31.2
Habit of saving (%) Afar (N=96)
Amhara (N=317)
Oromia (N=530)
SNNPR (N=332)
Somali (N=590)
Tigray (N=223)
Yes, started to save after I joined the program 52.1 50.2 34.0 78.0 54.2 82.5
Yes, I was saving money for long time, even before engaging in the program, but irregular
4.2 10.1 8.3 0.3 4.7 3.6
Yes, I was saving before and now I made it regularly
3.1 25.6 8.7 6.0 3.7 8.1
No, not saving yet 40.6 14.2 49.6 15.7 40.3 6.7
32
Q17. If yes, what is the current amount of saving you have? _____________ Birr
Amount of Saving (birr) Female (N=616)
Male (N=805)
Total (N=1421)
Range 0 – 70,000 0 – 170,000 0 – 170,000 Mean 3,317 6,772 5,274 Median 1,600 3,000 2,300 Sum (total savings) 2,043,545 5,451,091 7,494,636
Amount of Saving (birr)
Afar (N=57)
Amhara (N=272)
Oromia (N=263)
SNNPR (N=277)
Somali (N=344)
Tigray (N=208)
Range 0 – 30,000 100 – 96,000 0 – 170,000 0 – 36,000 0 – 60,000 100 – 50,000
Mean 4,200 7,434 7,456 1,440 3,872 7,410
Median 2,000 3,500 3,000 500 2,000 5,000
Sum (total savings) 239,454 2,021,914 1,960,950 398,992 1,332,000 1,541,326
Q18. Which of the following sectors does your livelihood/income earning job belong to (area of business for self-employment and for wage/paid the sector that the organization is engaged in)?
45.5
26.3
15.4
97.5
5.54 3.8
2.6 2.4 2.1 2.10.9 0.8
35.1
31.5
21.3
15.3
7.6
3.92.7
0.6 1.6 2.23.9
0.7 0.3 0.7
53.3
22.4
10.9
4.3
7.4 6.85
6.2
3.3 2.60.7
3.21.4 0.8
0
10
20
30
40
50
60
Total (N=1554) Girls (N=667) Boys (N=887)
33
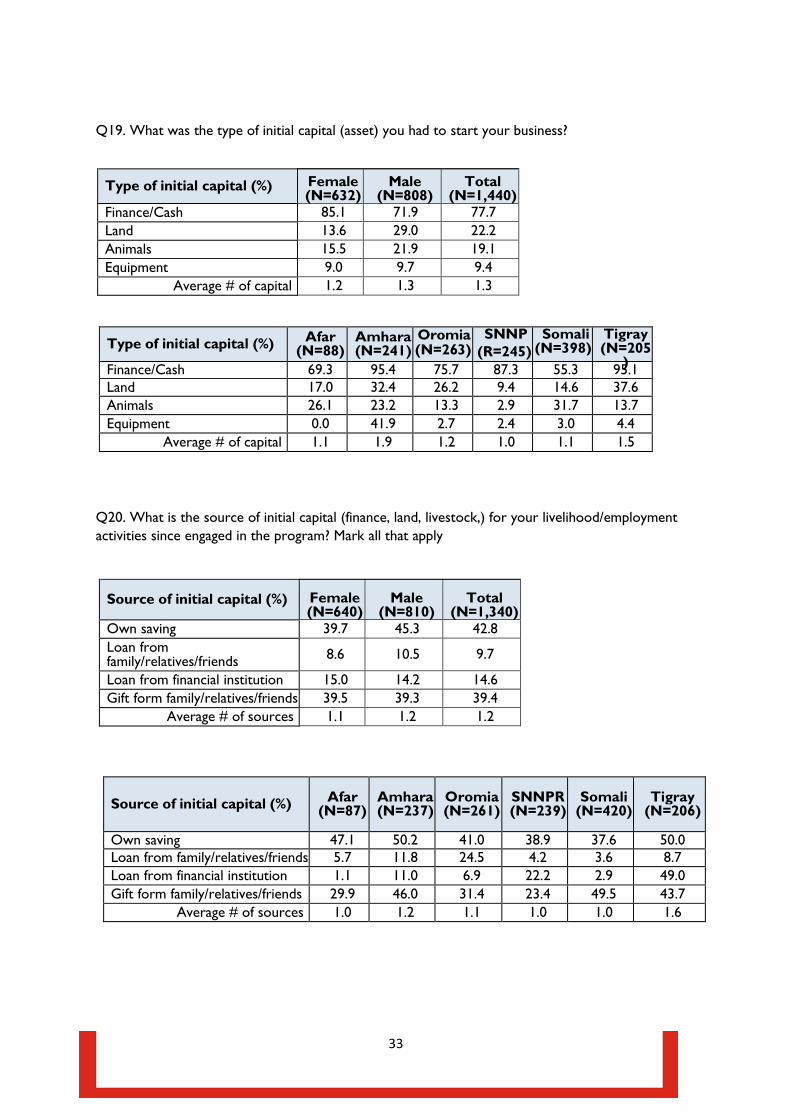
Q19. What was the type of initial capital (asset) you had to start your business?
Type of initial capital (%) Female (N=632)
Male (N=808)
Total (N=1,440)
Finance/Cash 85.1 71.9 77.7 Land 13.6 29.0 22.2 Animals 15.5 21.9 19.1 Equipment 9.0 9.7 9.4
Average # of capital 1.2 1.3 1.3
Type of initial capital (%) Afar (N=88)
Amhara (N=241)
Oromia SNNP Somali (N=398)
Tigray (N=205
) Finance/Cash 69.3 95.4 75.7(N=26 3)
87.3 55.3 95.1Land 17.0 32.4 26.2 9.4 14.6 37.6 Animals 26.1 23.2 13.3 2.9 31.7 13.7 Equipment 0.0 41.9 2.7 2.4 3.0 4.4
Average # of capital 1.1 1.9 1.2 1.0 1.1 1.5
Q20. What is the source of initial capital (finance, land, livestock,) for your livelihood/employment activities since engaged in the program? Mark all that apply
Source of initial capital (%) Female (N=640)
Male (N=810)
Total (N=1,340)
Own saving 39.7 45.3 42.8 Loan from family/relatives/friends 8.6 10.5 9.7
Loan from financial institution 15.0 14.2 14.6 Gift form family/relatives/friends 39.5 39.3 39.4
Average # of sources 1.1 1.2 1.2
Source of initial capital (%) Afar (N=87)
Amhara (N=237)
Oromia (N=261)
SNNPR (N=239)
Somali (N=420)
Tigray (N=206)
Own saving 47.1 50.2 41.0 38.9 37.6 50.0 Loan from family/relatives/friends 5.7 11.8 24.5 4.2 3.6 8.7 Loan from financial institution 1.1 11.0 6.9 22.2 2.9 49.0 Gift form family/relatives/friends 29.9 46.0 31.4 23.4 49.5 43.7
Average # of sources 1.0 1.2 1.1 1.0 1.0 1.6
(R=245)
34
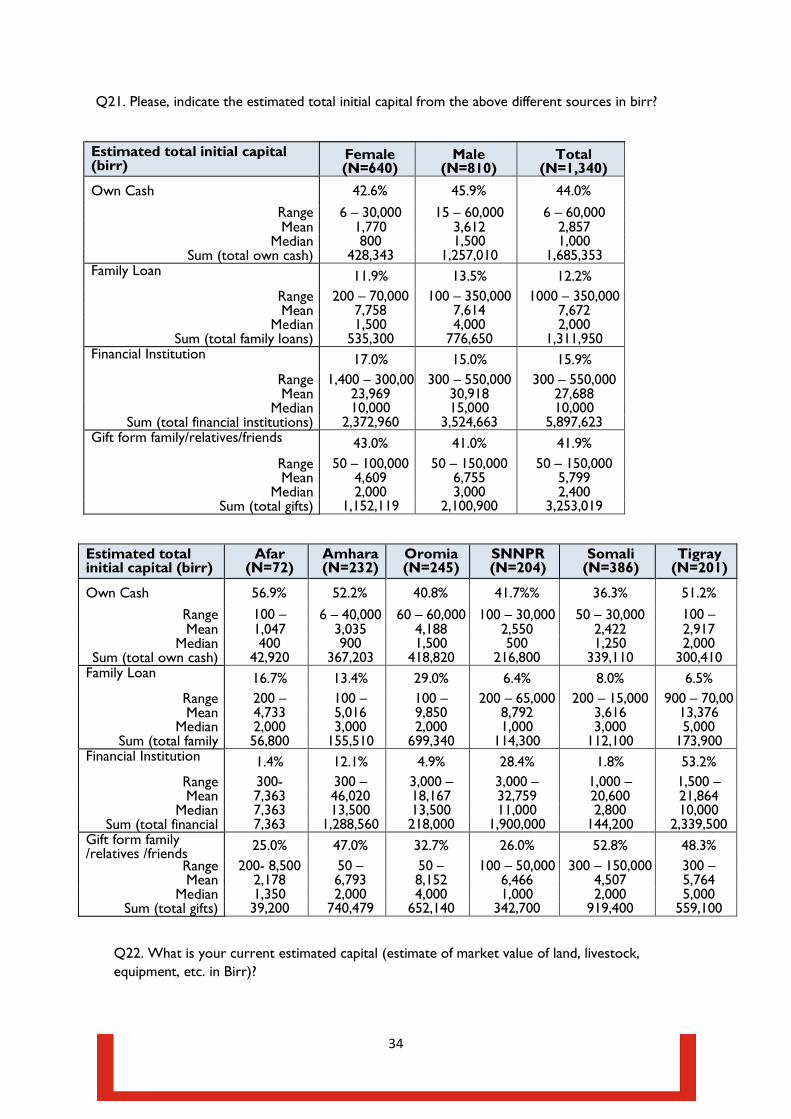
Q21. Please, indicate the estimated total initial capital from the above different sources in birr?
Estimated total initial capital (birr)
Female (N=640)
Male (N=810)
Total (N=1,340)
Own Cash 42.6% 45.9% 44.0% Range 6 – 30,000 15 – 60,000 6 – 60,000 Mean 1,770 3,612 2,857
Median 800 1,500 1,000 Sum (total own cash) 428,343 1,257,010 1,685,353
Family Loan 11.9% 13.5% 12.2% Range 200 – 70,000 100 – 350,000 1000 – 350,000 Mean 7,758 7,614 7,672
Median 1,500 4,000 2,000 Sum (total family loans) 535,300 776,650 1,311,950
Financial Institution 17.0% 15.0% 15.9% Range 1,400 – 300,00 300 – 550,000 300 – 550,000 Mean 23,969 30,918 27,688
Median 10,000 15,000 10,000 Sum (total financial institutions) 2,372,960 3,524,663 5,897,623
Gift form family/relatives/friends 43.0% 41.0% 41.9% Range 50 – 100,000 50 – 150,000 50 – 150,000 Mean 4,609 6,755 5,799
Median 2,000 3,000 2,400 Sum (total gifts) 1,152,119 2,100,900 3,253,019
Estimated total initial capital (birr)
Afar (N=72)
Amhara (N=232)
Oromia (N=245)
SNNPR (N=204)
Somali (N=386)
Tigray (N=201)
Own Cash 56.9% 52.2% 40.8% 41.7%% 36.3% 51.2% Range 100 – 6 – 40,000 60 – 60,000 100 – 30,000 50 – 30,000 100 – Mean 1,047 3,035 4,188 2,550 2,422 2,917
Median 400 900 1,500 500 1,250 2,000 Sum (total own cash) 42,920 367,203 418,820 216,800 339,110 300,410
Family Loan 16.7% 13.4% 29.0% 6.4% 8.0% 6.5% Range 200 – 100 – 100 – 200 – 65,000 200 – 15,000 900 – 70,00 Mean 4,733 5,016 9,850 8,792 3,616 13,376
Median 2,000 3,000 2,000 1,000 3,000 5,000 Sum (total family 56,800 155,510 699,340 114,300 112,100 173,900
Financial Institution 1.4% 12.1% 4.9% 28.4% 1.8% 53.2% Range 300- 300 – 3,000 –
3,000 – 1,000 – 1,500 –
Mean 7,363 46,020 18,167 32,759 20,600 21,864 Median 7,363 13,500 13,500 11,000 2,800 10,000
Sum (total financial 7,363 1,288,560 218,000 1,900,000 144,200 2,339,500 Gift form family /relatives /friends 25.0% 47.0% 32.7% 26.0% 52.8% 48.3%
Range 200- 8,500 50 – 50 – 100 – 50,000 300 – 150,000 300 – Mean 2,178 6,793 8,152 6,466 4,507 5,764
Median 1,350 2,000 4,000 1,000 2,000 5,000 Sum (total gifts) 39,200 740,479 652,140 342,700 919,400 559,100
Q22. What is your current estimated capital (estimate of market value of land, livestock, equipment, etc. in Birr)?
35
Estimate of market value of land, livestock, equipment, etc. (birr)
Female (N=562)
Male (N=717)
Total (N=1,279)
Range 200 – 150,000 71 – 812,300 71 – 812,300 Mean 16,457 32,067 25,219
Median 8,000 15,000 11,000 Sum (total own cash) 9,248,851 23,006,312 32,255,163
Estimate of market value of land, livestock, equipment, etc. (birr)
Afar (N=71)
Amhara (N=227)
Oromia (N=231)
SNNPR (N=197)
Somali (N=353)
Tigray (N=200)
Range 71 – 50,000 200 – 300 – 500 – 800 – 480,000 300 – Mean 7,487 35,377 28,299 21,216 15,609 37,330
Median 5,000 16,500 11,000 9,000 8,400 25,700 Sum (total own cash) 531,555 8,030,770 6,537,150 4,179,582 5,510,091 7,466,015
Q23. What NEW productive assets/resources do you own or have access (after program intervention that you are using to generate livelihood and income). Mark all that apply.
# of assets
Total (N=2088)
Afar (N=96)
Amhara (N=317)
Oromia (N=530)
SNNPR (N=332)
Somali (N=590)
Tigray (N=223)
(%) (%) (%) (%) (%) (%) (%) 0 (no change) 32.1 16.7 17.7 49.6 25.6 36.4 16.1 1 42.8 71.9 47.3 37.9 63.6 24.7 52.0 2 17.9 10.4 20.5 5.8 9.6 29.2 28.3 3 5.8 1.0 9.5 4.5 1.2 9.3 3.1 4 1.4 0.0 5.0 2.1 0.0 0.3 0.4
# of assets Total
(N=2088) Girls
(N=957) Boys
(N=1131) (%) (%) (%)
0 (no 32.1 35.6 29.2 1 42.8 42.7 42.8 2 17.9 16.0 19.5 3 5.8 5.0 6.5 4 1.4 0.6 2.1
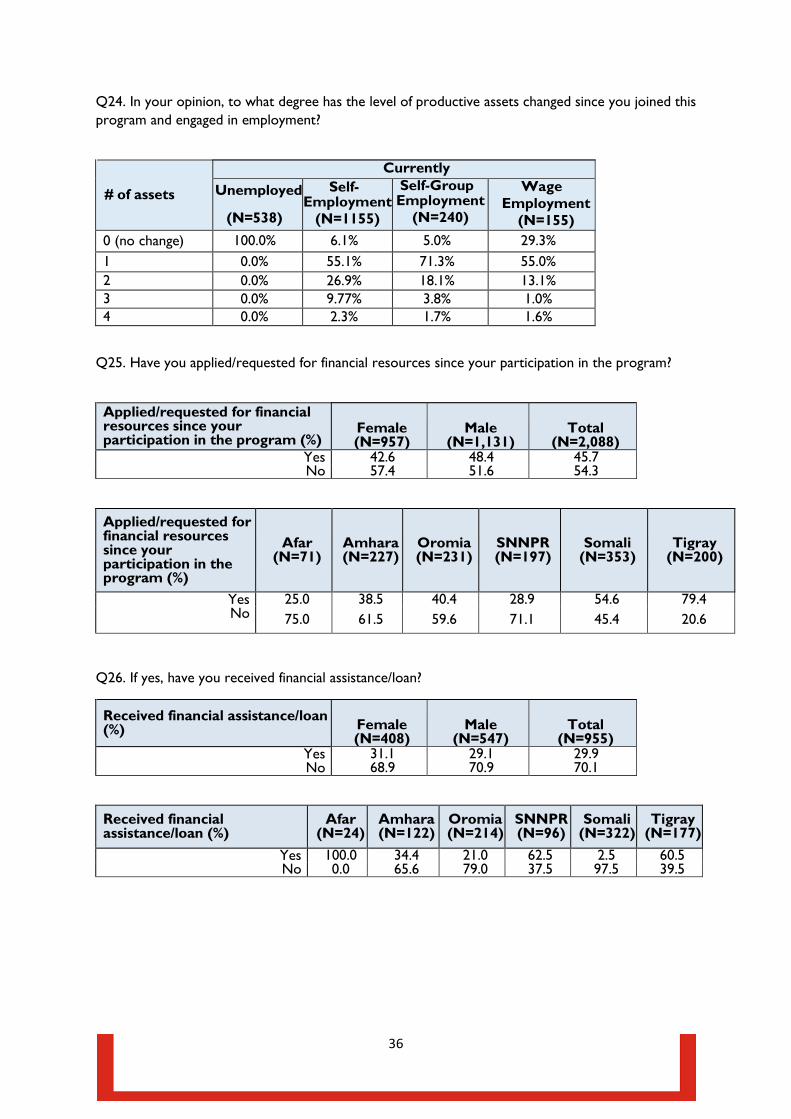
36
Q24. In your opinion, to what degree has the level of productive assets changed since you joined this program and engaged in employment?
# of assets
Currently Unemployed
(N=538)
Self- Employment
(N=1155)
Self-Group Employment
(N=240)
Wage Employment
(N=155) 0 (no change) 100.0% 6.1% 5.0% 29.3% 1 0.0% 55.1% 71.3% 55.0% 2 0.0% 26.9% 18.1% 13.1% 3 0.0% 9.77% 3.8% 1.0% 4 0.0% 2.3% 1.7% 1.6%
Q25. Have you applied/requested for financial resources since your participation in the program?
Applied/requested for financial resources since your participation in the program (%)
Female (N=957)
Male (N=1,131)
Total (N=2,088)
Yes 42.6 48.4 45.7 No 57.4 51.6 54.3
Applied/requested for financial resources since your participation in the program (%)
Afar (N=71)
Amhara (N=227)
Oromia (N=231)
SNNPR (N=197)
Somali (N=353)
Tigray (N=200)
Yes 25.0 38.5 40.4 28.9 54.6 79.4 No 75.0 61.5 59.6 71.1 45.4 20.6
Q26. If yes, have you received financial assistance/loan?
Received financial assistance/loan (%) Female
(N=408) Male
(N=547) Total
(N=955) Yes 31.1 29.1 29.9 No 68.9 70.9 70.1
Received financial assistance/loan (%)
Afar (N=24)
Amhara (N=122)
Oromia (N=214)
SNNPR (N=96)
Somali (N=322)
Tigray (N=177)
Yes 100.0 34.4 21.0 62.5 2.5 60.5 No 0.0 65.6 79.0 37.5 97.5 39.5
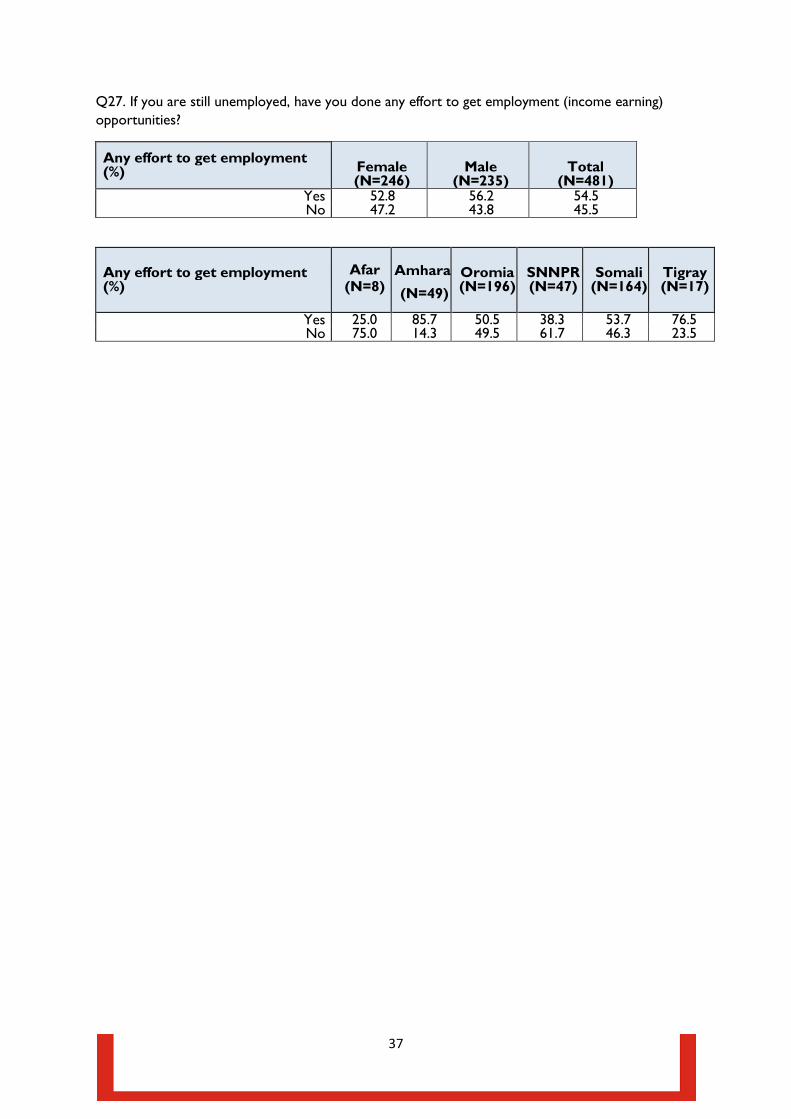
37
Q27. If you are still unemployed, have you done any effort to get employment (income earning) opportunities?
Any effort to get employment (%) Female
(N=246) Male
(N=235) Total
(N=481) Yes 52.8 56.2 54.5 No 47.2 43.8 45.5
Any effort to get employment (%)
Afar (N=8) (N=49)
Oromia (N=196)
SNNPR (N=47)
Somali (N=164)
Tigray (N=17)
Yes 25.0 85.7 50.5 38.3 53.7 76.5 No 75.0 14.3 49.5 61.7 46.3 23.5
Amhara
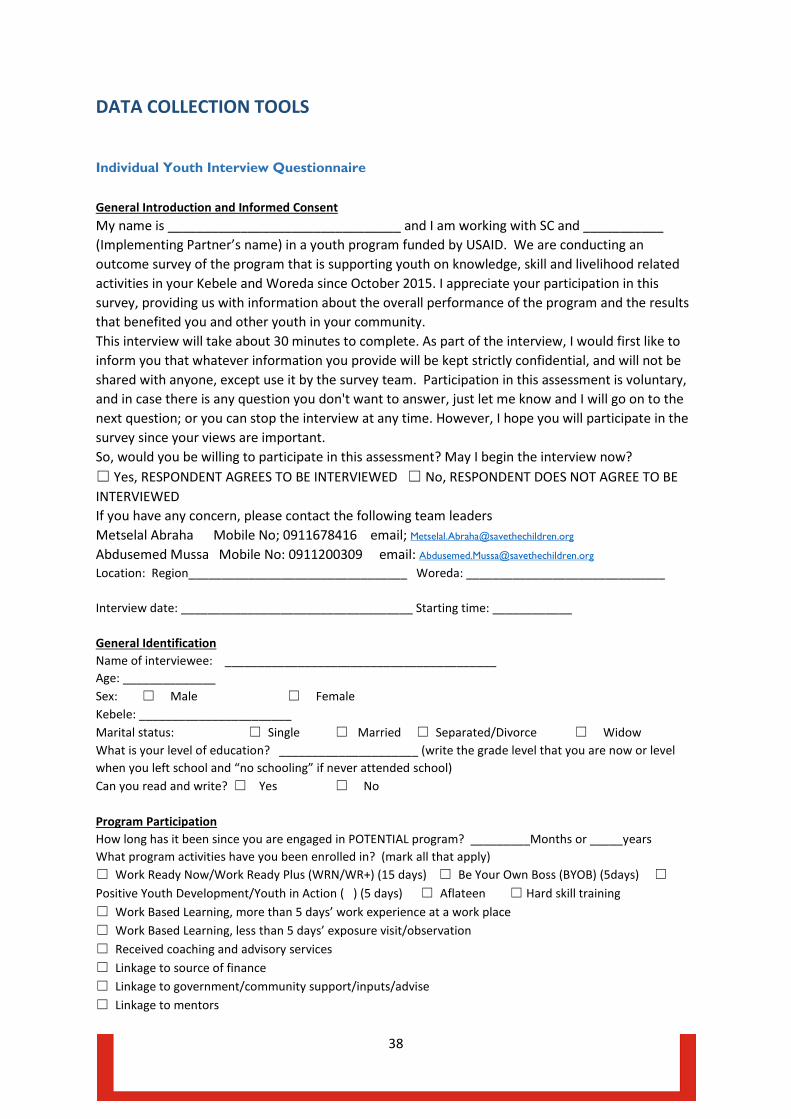
38
DATA COLLECTION TOOLS
Individual Youth Interview Questionnaire
General Introduction and Informed Consent My name is ________________________________ and I am working with SC and ___________ (Implementing Partner’s name) in a youth program funded by USAID. We are conducting an outcome survey of the program that is supporting youth on knowledge, skill and livelihood related activities in your Kebele and Woreda since October 2015. I appreciate your participation in this survey, providing us with information about the overall performance of the program and the results that benefited you and other youth in your community. This interview will take about 30 minutes to complete. As part of the interview, I would first like to inform you that whatever information you provide will be kept strictly confidential, and will not be shared with anyone, except use it by the survey team. Participation in this assessment is voluntary, and in case there is any question you don't want to answer, just let me know and I will go on to the next question; or you can stop the interview at any time. However, I hope you will participate in the survey since your views are important. So, would you be willing to participate in this assessment? May I begin the interview now? ☐ Yes, RESPONDENT AGREES TO BE INTERVIEWED ☐ No, RESPONDENT DOES NOT AGREE TO BEINTERVIEWEDIf you have any concern, please contact the following team leadersMetselal Abraha Mobile No; 0911678416 email; [email protected]
Abdusemed Mussa Mobile No: 0911200309 email: [email protected]
Location: Region_________________________________ Woreda: ______________________________
Interview date: ___________________________________ Starting time: ____________
General Identification Name of interviewee: _________________________________________ Age: ______________ Sex: ☐ Male ☐ Female Kebele: _______________________ Marital status: ☐ Single ☐ Married ☐ Separated/Divorce ☐ Widow What is your level of education? _____________________ (write the grade level that you are now or level when you left school and “no schooling” if never attended school) Can you read and write? ☐ Yes ☐ No
Program Participation How long has it been since you are engaged in POTENTIAL program? _________Months or _____years What program activities have you been enrolled in? (mark all that apply) ☐ Work Ready Now/Work Ready Plus (WRN/WR+) (15 days) ☐ Be Your Own Boss (BYOB) (5days) ☐Positive Youth Development/Youth in Action ( ) (5 days) ☐ Aflateen ☐ Hard skill training☐ Work Based Learning, more than 5 days’ work experience at a work place☐ Work Based Learning, less than 5 days’ exposure visit/observation☐ Received coaching and advisory services☐ Linkage to source of finance☐ Linkage to government/community support/inputs/advise☐ Linkage to mentors
39
☐ Others, specify ______________________________
Have you received post training coaching support? ☐ Yes ☐ No
If yes, how many times have you met with the Youth Facilitator or Woreda Officer for coaching? _________________
Are you connected with Mentors for mentoring support since you joined the program? ☐ Yes ☐ No
If yes, how many times have you met with your mentor? ________________ Are you participating in any social group/activities after you joined in this program? ☐ YES Group☐ YES Services☐ Peer group☐ Community services☐ Other, Specify __________________________
Outcomes After you attended in this program, what new skills/knowledge have you acquired? (please mark all that mentioned by beneficiaries) ☐ Interpersonal communication☐ Work habit and conduct☐ Job search skill (reading posted job application, cv writing, etc.)☐ Business management/improvement skills☐ Business start-up skills☐ Knowledge about different sources of resources (finance, land, inputs…), markets☐ Resource management, including saving habits☐ Setting objectives/goals and preparing personal development plan☐ Improved social bond and team work☐ Build self-confidence☐ Decision making skills☐ Other, specify __________________________________________
What changes (livelihood, attitudinal/behavior, etc.) do you think you have made after you obtained the above mentioned skills and knowledge? Mark all that apply ☐ Change in Job search/identification behavior☐ Started, improved livelihood/employment opportunities☐ Take initiative for advice and counseling on my livelihood and earning income from family members,neighbors, or friends☐ Search for livelihood and income earning related services from government/community, NGOs, privateorganizations☐ Started saving/putting aside money☐ Appreciating/respect for resources in my community and opportunity of work/job/farm/business☐ Customer handling☐ Other, specify _______________________________________________________
What was your income earning (employment) status before participating in this program? ☐ Self-employed individual/own business ☐ Self-employed in group business☐ Paid/wage employed ☐ Unemployed (dependent on support from others)
40
What is your current income earning (employment) status (any change in your employment)? ☐ Self-employed individual/own business ☐ Self-employed in group business☐ Paid/wage employed ☐ Unemployed (dependent on support from others)
If the answer to question 18 is currently unemployed, skip to question 33
If you were self or paid employed before joining the program, do you think there is any change/improvement in your employment? ☐ Yes, there is change ☐ No change
If yes, please explain the improvements/changes? Note that in youth employment programs, measures of “improved” employment in addition to generating better earning could also be transitioning form under employment to relatively full employment, from heavy work load and hazardous to safe & secure work, environmental unacceptable to environment friendly, illegal activities to legal, etc.
_____________________________________________________________________________________________________________________________________________________________________________________________________________________________________________________________
What was your average monthly income before joining this program? ____________ Birr per month? (recalculate income to average monthly, e.g., if earning is weekly and works four weeks in a month, multiply by four and if respondent estimates annual earning divides the total by 12, etc.)
What is your average current monthly income? ____________ Birr per month? (same as Question 21.)
Do you have the habit of putting aside money as saving? ☐ Yes, started to save after I joined the program☐ Yes, I was saving money for long time, even before engaging in the program, but irregular☐ Yes, I was saving before and now I made it regularly☐ No, not saving yet
If yes, what is the current amount of saving you have? _____________ Birr
Which of the following sectors does your livelihood/income earning job belong to (area of business for self-employment and for wage/paid the sector that the organization is engaged in)? ☐ Agricultural + Animal production activities for consumption and selling☐ Trading (buying and selling) agricultural/livestock products☐ Trading consumer products/items – small shop/kiosk☐ Carpentry, carving, or woodwork,☐ Mechanics, metal work☐ Construction work (brick/stone laying, building, etc.)☐ Tailoring (making clothes or textiles)☐ Transport service☐ Hairdressing/Barber☐ Providing services (such as coffee/tea, small restaurant, shoe shine, repair and maintenance, etc.)☐ Government☐ Privet sector☐ Non-governmental organizations☐ Others (specify) ________________________
What was the type of initial capital (asset) you had to start your business?
41
☐ Finance/Cash ☐ Animals☐ Land ☐ Equipment
What is the source of initial capital (finance, land, livestock,) for your livelihood/employment activities since engaged in the program? Mark all that apply ☐ Own saving ☐ Loan from financial institution☐ Loan from family/relatives/friends ☐ Gift form family/relatives/friends☐ Others, (specify) ____________________________Please, indicate the estimated total initial capital from the above different sources in birr?
☐ Own cash___________ ☐ Loan from financial institution __________☐ Loan from family/relatives/friends _______________☐ Gift form family/relatives/friends ___________________☐ Others, (specify) ________________
What is your current estimated capital (estimate of market value of land, livestock, equipment, etc. in Birr)? ______________________
What NEW productive assets/resources do you own or have access (after program intervention that you are using to generate livelihood and income). Mark all that apply.
☐ I have land for growing crops and/or livestock production for food and earn a living☐ I have livestock☐ I have natural resources (plantation trees, sand, quarry, etc.) I can use or earn a living☐ I have tools or equipment I need to earn a living☐ Other (specify): ______________________________________
In your opinion, to what degree has the level of productive asset have changed since you joined this program and engaged in employment? ☐ Increased (expanded the same business or diversified)☐ No change☐ DecreasedExplain the reason for change/no change ______________________________________
Have you applied/requested for financial resources since your participation in the program? ☐ Yes ☐
No If No, why? _____________________________________________________________ If yes, have you received financial assistance/loan? ☐ Yes ☐ No If you are still unemployed, have you done any effort to get employment (income earning) opportunities? ☐ Yes ☐ No
If yes, what efforts have you made or are you making to get income earning (employment) opportunities? ________________________________________________________________________________________________________________________________________________________________________
If no, what are the factors/challenges that are affecting you not to work on your livelihood or employment? ___________________________________________________________________________________________________________________________________________________________________________________________________________________________________________________________
In your opinion, what do you say about the current contribution or support from Kebele and Woreda government and Non-government organization on youth livelihood/employment opportunities?
42
_____________________________________________________________________________________________________________________________________________________________________________________________________________________________________
What is your future plan on your livelihood/employment? ___________________________________________________________________________________________________________________________________________________________________________________________________________________________
Any general comments/views that you want to tell us related with program performance and your livelihood? _________________________________________________________________________________________________________________________________________________________________________________________________________________________________________________________________________________________________________________
Name of interviewer: _____________________________ Date: _______________ Ending time: __________
Thank you!!
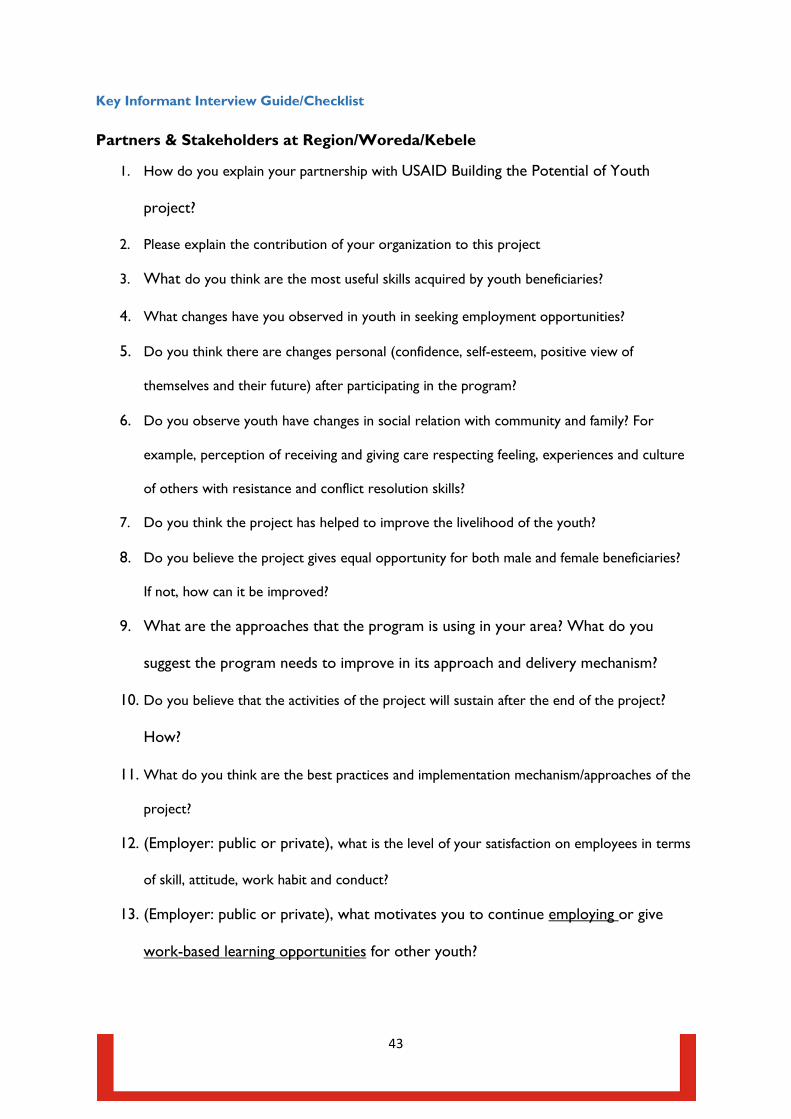
43
Key Informant Interview Guide/Checklist
Partners & Stakeholders at Region/Woreda/Kebele
1. How do you explain your partnership with USAID Building the Potential of Youth
project?
2. Please explain the contribution of your organization to this project
3. What do you think are the most useful skills acquired by youth beneficiaries?
4. What changes have you observed in youth in seeking employment opportunities?
5. Do you think there are changes personal (confidence, self-esteem, positive view of
themselves and their future) after participating in the program?
6. Do you observe youth have changes in social relation with community and family? For
example, perception of receiving and giving care respecting feeling, experiences and culture
of others with resistance and conflict resolution skills?
7. Do you think the project has helped to improve the livelihood of the youth?
8. Do you believe the project gives equal opportunity for both male and female beneficiaries?
If not, how can it be improved?
9. What are the approaches that the program is using in your area? What do you
suggest the program needs to improve in its approach and delivery mechanism?
10. Do you believe that the activities of the project will sustain after the end of the project?
How?
11. What do you think are the best practices and implementation mechanism/approaches of the
project?
12. (Employer: public or private), what is the level of your satisfaction on employees in terms
of skill, attitude, work habit and conduct?
13. (Employer: public or private), what motivates you to continue employing or give
work-based learning opportunities for other youth?
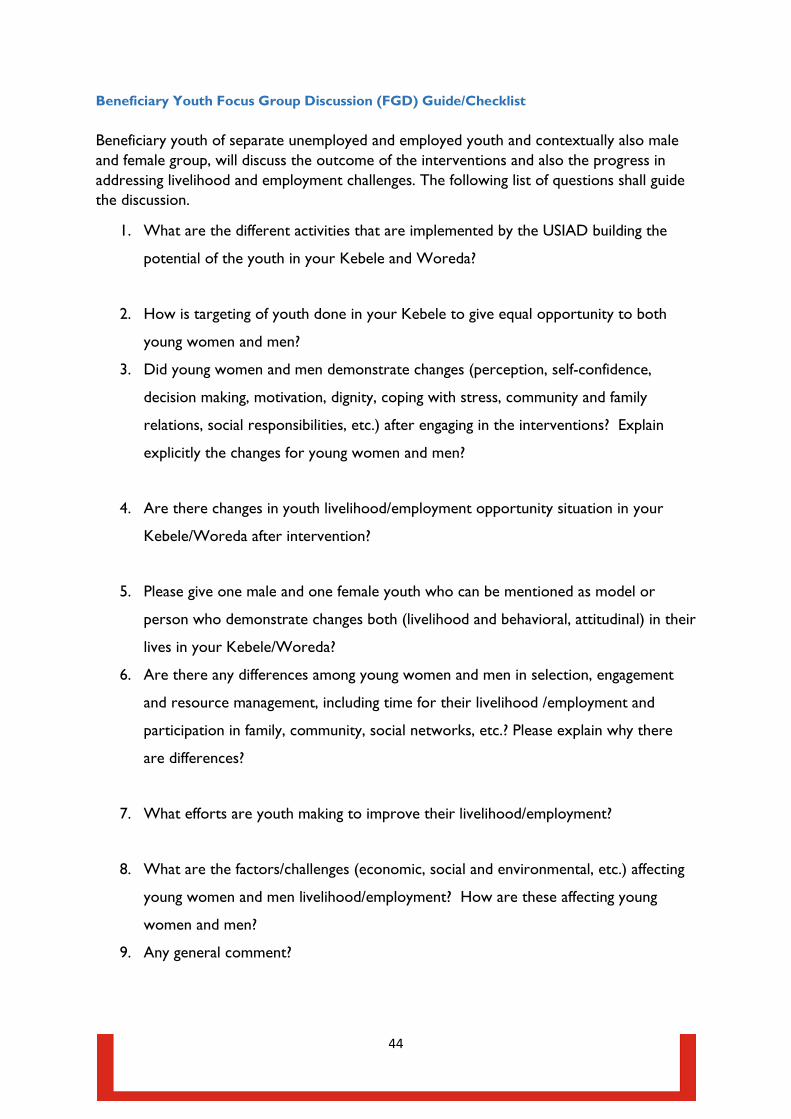
44
Beneficiary Youth Focus Group Discussion (FGD) Guide/Checklist
Beneficiary youth of separate unemployed and employed youth and contextually also male and female group, will discuss the outcome of the interventions and also the progress in addressing livelihood and employment challenges. The following list of questions shall guide the discussion.
1. What are the different activities that are implemented by the USIAD building the
potential of the youth in your Kebele and Woreda?
2. How is targeting of youth done in your Kebele to give equal opportunity to both
young women and men?
3. Did young women and men demonstrate changes (perception, self-confidence,
decision making, motivation, dignity, coping with stress, community and family
relations, social responsibilities, etc.) after engaging in the interventions? Explain
explicitly the changes for young women and men?
4. Are there changes in youth livelihood/employment opportunity situation in your
Kebele/Woreda after intervention?
5. Please give one male and one female youth who can be mentioned as model or
person who demonstrate changes both (livelihood and behavioral, attitudinal) in their
lives in your Kebele/Woreda?
6. Are there any differences among young women and men in selection, engagement
and resource management, including time for their livelihood /employment and
participation in family, community, social networks, etc.? Please explain why there
are differences?
7. What efforts are youth making to improve their livelihood/employment?
8. What are the factors/challenges (economic, social and environmental, etc.) affecting
young women and men livelihood/employment? How are these affecting young
women and men?
9. Any general comment?
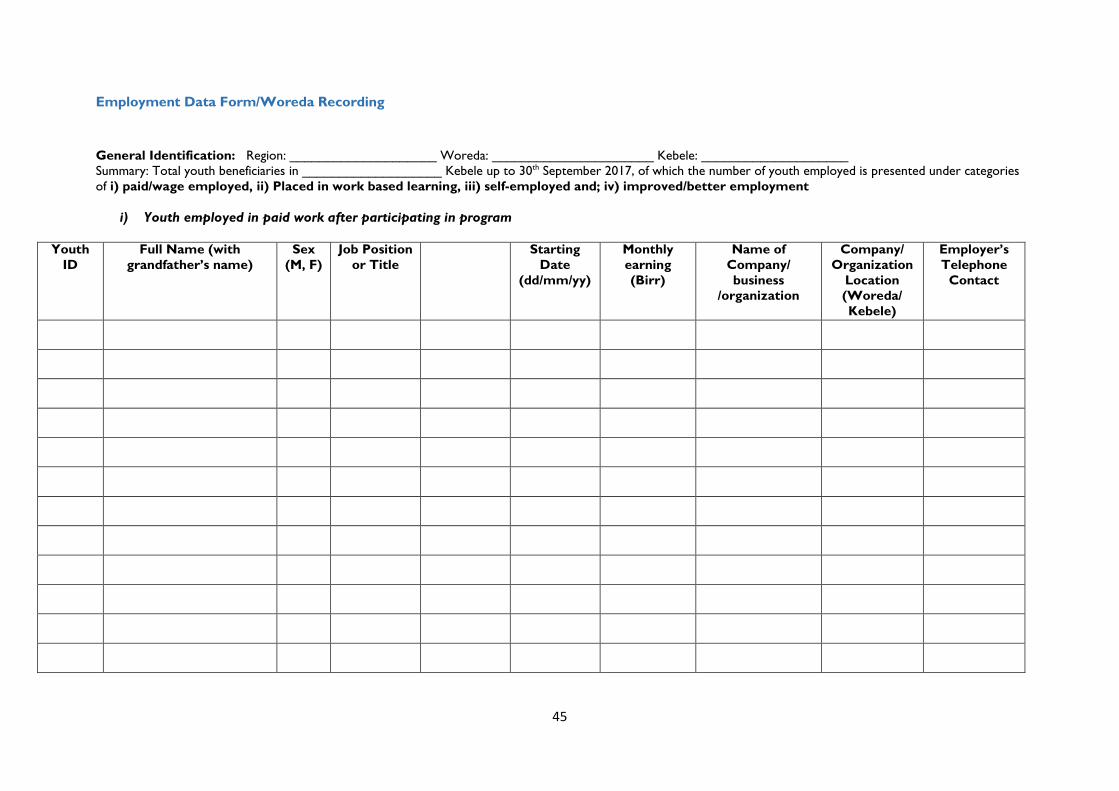
45
Employment Data Form/Woreda Recording
General Identification: Region: ____________________ Woreda: ______________________ Kebele: ____________________ Summary: Total youth beneficiaries in ___________________ Kebele up to 30th September 2017, of which the number of youth employed is presented under categories of i) paid/wage employed, ii) Placed in work based learning, iii) self-employed and; iv) improved/better employment
i) Youth employed in paid work after participating in program
Youth ID
Full Name (with grandfather’s name)
Sex (M, F)
Job Position or Title
Starting Date
(dd/mm/yy)
Monthly earning (Birr)
Name of Company/ business
/organization
Company/ Organization
Location (Woreda/ Kebele)
Employer’s Telephone
Contact
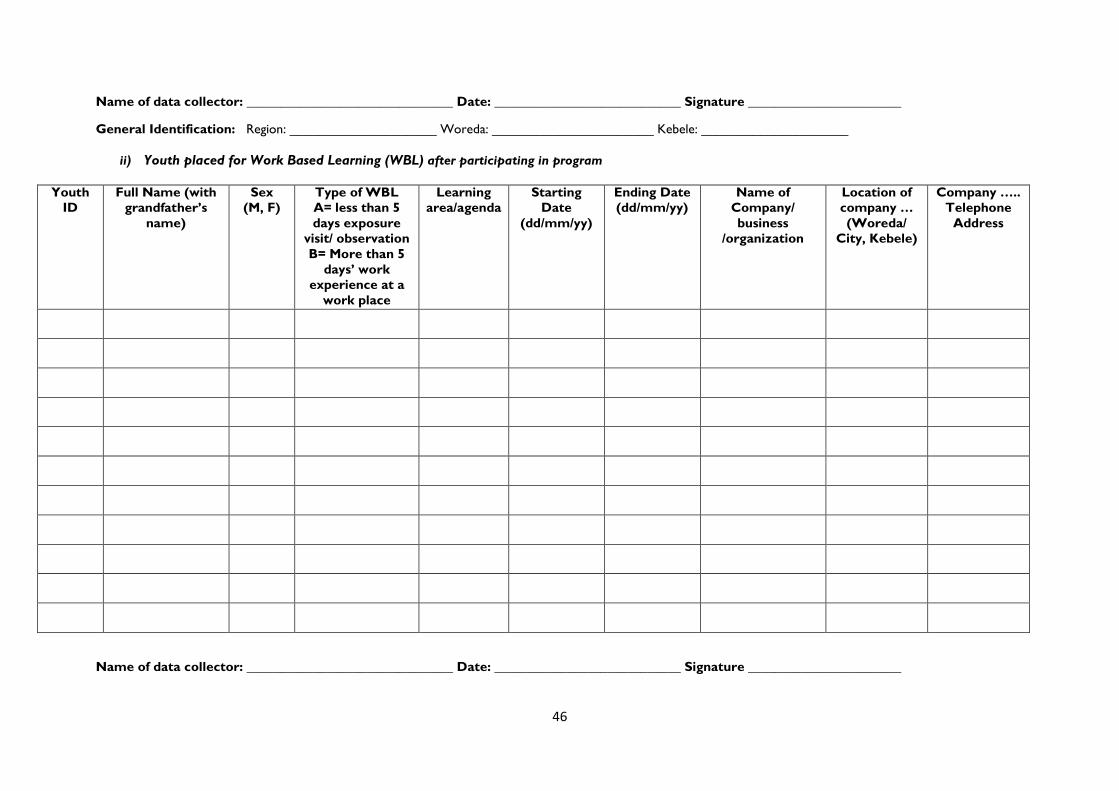
46
Name of data collector: _______________________________ Date: ____________________________ Signature _______________________
General Identification: Region: ____________________ Woreda: ______________________ Kebele: ____________________
ii) Youth placed for Work Based Learning (WBL) after participating in program
Youth ID
Full Name (with grandfather’s
name)
Sex (M, F)
Type of WBL A= less than 5 days exposure
visit/ observation B= More than 5
days’ work experience at a
work place
Learning area/agenda
Starting Date
(dd/mm/yy)
Ending Date (dd/mm/yy)
Name of Company/ business
/organization
Location of company … (Woreda/
City, Kebele)
Company ….. Telephone
Address
Name of data collector: _______________________________ Date: ____________________________ Signature _______________________
47
General Identification: Region: ____________________ Woreda: ______________________ Kebele: ____________________
iii) Youth newly self-employed after participating in program ☐ Individual (alone) ☐ joint/group (business partnership)
If joint/group, group name: ________________________________ use one separate sheet of this page for one group
Youth ID (“None” if
group member is
non- beneficiary)
Full Name (with grandfather’s name)
Sex (M, F)
Type of business/ livelihood activity (list also if there is
more than one for each person)
Type of Initial resources used
(own cash, in kind)
Estimated value (Birr) of
resources
Starting Date (dd/mm/yy)
Amount of average income
earned per month
48
Name of data collector: _______________________________ Date: ____________________________ Signature _______________________
iv) Improved/better employment/livelihood: Youth who had employment, but underemployed before the programIf group/business, name of the group: __________________________________ use one separate sheet of this page for one group
Youth ID Full Name (with grandfather’s name)
Sex (M, F) Type of employment, livelihood/business you had before
joining the program
Briefly note how the youth explains change/improvement in their business after benefiting from program activities, including change in income
level, size or number of business with direct “quotations”
49
REFERENCES 1. PRB, 2016
2. Central Statistical Authority,2013
3. World Bank,2013
4. Annual Labor Force Survey, CSA 2013
5. Statistical report on the 2013 national labor force survey, 2014 CSA
6. Ministry of Finance and Economic Development, 2013
7. GOE, National Planning Commission, Growth and Transformation Plan 2
(2015/16-2019/20)
8. GOE, Youth Policy, 2009 Addis Ababa
9. Ethiopian Youth Federation, 2009, Addis Ababa
10. GOE, Employment policy, 2009, Addis Ababa
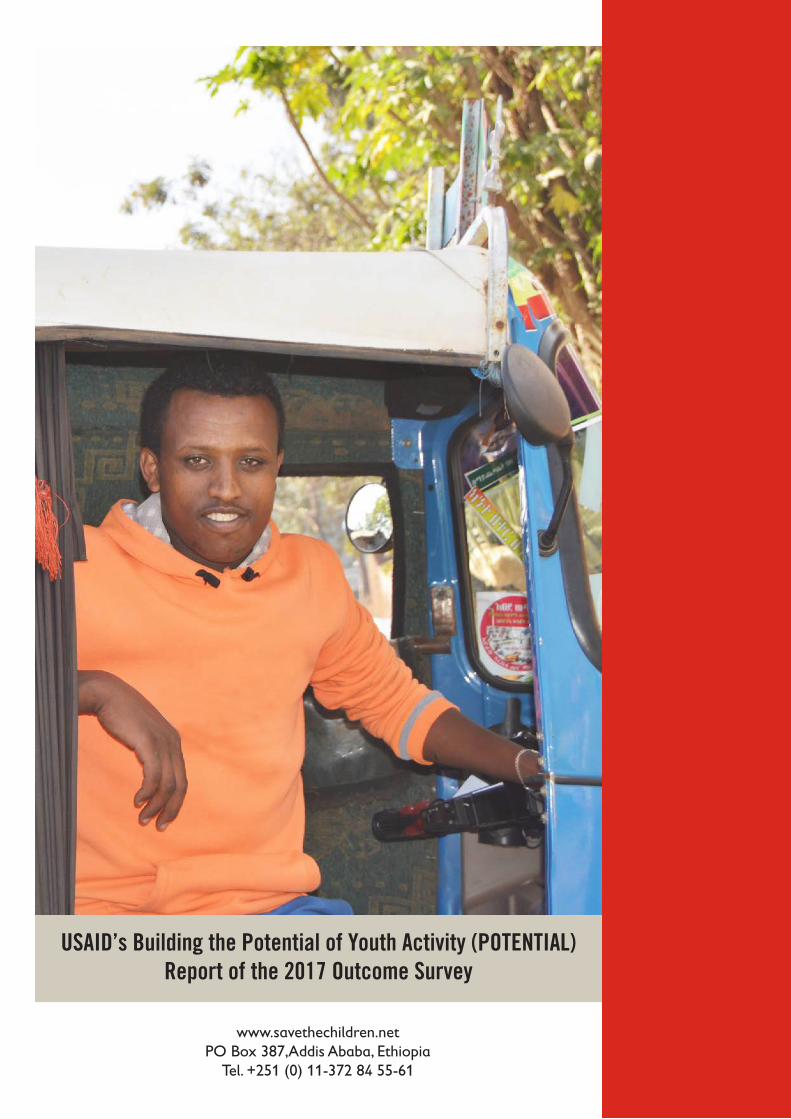
USAID’s Building the Potential of Youth Activity (POTENTIAL) Report of the 2017 Outcome Survey
www.savethechildren.net PO Box 387,Addis Ababa, Ethiopia
Tel. +251 (0) 11-372 84 55-61