eu economy & steel market - oecd
TRANSCRIPT

EU ECONOMY & STEEL MARKETCHALLENGES
1
88 SESSION OF THE OECD STEEL COMMITTEE
MARCH 2020

2
LATEST ACTUAL DATA: DOWNWARD TREND IN EU SENTIMENT SEEMS TO HAVEBOTTOMED OUT IN NOV AND DEC ’19, BEFORE THE COVID-19 OUTBREAK
ECONOMIC OUTLOOK
80
85
90
95
100
105
110
115
120
jan
v-1
2
juin
-12
no
v-1
2
avr-
13
sep
t-13
févr
-14
juil-
14
dé
c-14
mai
-15
oct
-15
mar
s-16
aoû
t-16
jan
v-1
7
juin
-17
no
v-1
7
avr-
18
sep
t-18
févr
-19
juil-
19
dé
c-19
EU Economic Sentiment(Long-term average=100)
-20
-15
-10
-5
0
5
10
15
jan
v-12
juin
-12
no
v-12
avr-
13
sep
t-13
févr
-14
juil-
14
dé
c-14
mai
-15
oct
-15
mar
s-16
aoû
t-16
jan
v-17
juin
-17
no
v-17
avr-
18
sep
t-18
fév
r-19
juil-
19
dé
c-19
EU Industrial ConfidenceBalance of positive and negative answers
-15
-10
-5
0
5
10
15
20
jan
v-12
juin
-12
no
v-12
avr-
13
sep
t-13
févr
-14
juil-
14
dé
c-14
mai
-15
oct
-15
mar
s-16
aoû
t-16
jan
v-17
juin
-17
no
v-17
avr-
18
sep
t-18
févr
-19
juil-
19
dé
c-19
EU Services ConfidenceBalance of positive and negative answers
-25
-20
-15
-10
-5
0
jan
v-12
juin
-12
no
v-12
avr-
13
sep
t-13
févr
-14
juil-
14
dé
c-14
mai
-15
oct
-15
mar
s-16
ao
ût-
16
jan
v-17
juin
-17
no
v-17
avr
-18
sep
t-18
févr
-19
juil-
19
dé
c-19
EU Consumer ConfidenceBalance of positive and negative answers

3
EU ECONOMY AT END-2019 STILL AFFECTED BY PERSISTENT TRADE TENSIONS AND
SLOWING GLOBAL GROWTH – HURTING GERMANY IN PARTICULAR
ECONOMIC OUTLOOK
• GDP growth in the EU slowed furtherdown in Q4’19 (0.1% q-o-q, 1.4% y-o-y)
• Coronavirus outbreak will cost at least 1%of world GDP to the global economy(supply chain disruption etc). IMF andOECD have lowered their global growthpredictions (2.4% in 2020, formerly 2.9%).Most likely biggest impact during H1 ‘20
• EU private consumption and servicesprovided strongest contribution togrowth
• Led by Germany, manufacturing activitydragged lower by slowing domesticgrowth, weaker exports, automotiveslump
• Business sentiment in Q4 still affected bytrade war worries and ongoing Brexit-related uncertainty
• Overall negative impact on businessinvestment
• GDP growth expected at only 1.3% overthe whole year 2019 (lowest since 2013)
Industrial Production Volume
Industrial Production Volume
-8
-6
-4
-2
0
2
4
6
2018Q1 2018Q2 2018Q3 2018Q4 2019Q1 2019Q2 2019Q3 2019Q4
Year-on-year Industrial Production change, %
EU Germany Spain Italy France

4
EU OUTLOOK 2020-2021: RECESSION HAS BECOME ALMOST CERTAIN DUETO INDUSTRY WEAKNESS AND CORONAVIRUS OUTBREAK
ECONOMIC OUTLOOK
• Coronavirus outbreak set to take a heavy tollon global supply chain and overall economicand industrial activity
• Most indicators signal subdued economicgrowth in Q1 ‘20, with worsening outlook
• Key driver: private consumption• Weak investment outlook• Slowdown in growth of international trade
likely to continue, albeit easing somewhat• US and China trade agreement of 15 January –
fragile deal but slightly more optimistic outlook
• Risks of financial instability and debtsustainability issues (both corporate and gov’tdebt)
• Monetary policy has almost run out its tools –a new QE and zero/negative rates set tocontinue; fiscal policy more expansionary
• Manufacturing weakness to continue until H22020, with further downside risks
• GDP growth at 1.3% in ’19 in the EU, but theoutlook has worsened rapidly and recession isalmost certain in 2020 (the first since 2009)
0
1
1
2
2
3
3
4
0
0
0
1
1
1
1
1
2
2
2
2014Q
1
2014Q
2
2014Q
3
2014Q
4
2015Q
1
2015Q
2
2015Q
3
2015Q
4
2016
Q1
2016
Q2
2016
Q3
2016
Q4
2017Q
1
2017Q
2
2017Q
3
2017Q
4
2018
Q1
2018
Q2
2018
Q3
2018
Q4
2019
Q1
2019
Q2
2019
Q3
2019
Q4
EU GDP GROWTH, %Year-on-Year (right axis)
Quarter-on-Quarter (leftaxis)

5
CONSTRUCTION SECTOR
STEEL USING SECTORS
Current situation• Confidence slowed down, but still at high
levels• Strength of residential real estate markets• Private non-residential investment
weighed down by subdued businesssentiment
• Civil engineering best performingsubsector: infrastructure demand remainsthe key driver in Central Europe
• Output growth 2019: 3.8%
• Outlook 2020-2021• Albeit strongly affected by the overall
macroeconomic turmoil caused by Covid-19, the sector will prove relatively resilient
• Residential building: cyclical slowdownafter multi-year boom
• Weak business sentiment set to curbprivate commercial and industrialconstruction activity in 2020
• Civil engineering will be used ascountercyclical economic tool and publicconstruction spending is likely to increase
-35
-30
-25
-20
-15
-10
-5
0
5
10
jan
v-12
juin
-12
no
v-12
avr-
13
sep
t-13
févr
-14
juil-
14
dé
c-14
mai
-15
oct
-15
mar
s-16
aoû
t-16
jan
v-17
juin
-17
no
v-17
avr-
18
sep
t-18
févr
-19
juil-
19
dé
c-19
EU Construction ConfidenceBalance of positive and negative answers

6
AUTOMOTIVE SECTOR
STEEL USING SECTORS
Current situation• In 2019 EU car sales rose by 1.2%. Strong growth in
the last four months of 2019 resulted into positive sales growth in the EU . Negative figures in Jan. 2020, though (-7.5%)
• While market conditions in the EU were showing signs of stabilisation, falling demand in key export markets such as the USA, China and Turkey
• Delays in gaining WLTP certification had a negative impact on production activity
• Output in the EU automotive industry fell by 2.5% y-o-y in the third quarter of 2019, overall -5.9% in 2019, worst performance since 2012
Outlook 2020-2021• The impact of Covid-19 on the industry in 2020 is
going to be very high, with plants closure and huge disruptions in the supply chain
• Electric-vehicle (EV) market looks set to grow, with car buyers’ preference shifting from petrol and diesel cars to EVs and plug-in hybrids
• Still, subdued demand for exports to key markets
• The commercial vehicle market segment relatively weak also in 2020 and 2021
• Automotive output is expected to experience serious recession in 2020. Possible recovery in 2021.
Number of car registrations in the EU

7
SHARPLY NEGATIVE TREND IN APPARENT STEEL CONSUMPTION IN 2019
EU STEEL MARKET
Current situation• Apparent steel consumption falling
since early 2019, reflecting negativetrend in real steel consumption anddestocking
• EU imports fell by 11% y/y over 11M’19• EU safeguards limit volumes but also
lead to more volatile monthly imports(unusual peak in July)
• Pressure on prices intensifies,offsetting any gains in market shareby EU steel producers
• Apparent consumption: -3.3% in 2019
Outlook 2020-2021:• Improvement in steel using sectors +
some restocking will be negatively offsetby the huge impact of Covid-19
• The transfer mechanism of unusedquota may benefit non-EU exporters tothe detriment of EU producers
• In addition, ongoing risk of importdistortions destabilising supply-demandbalance
8
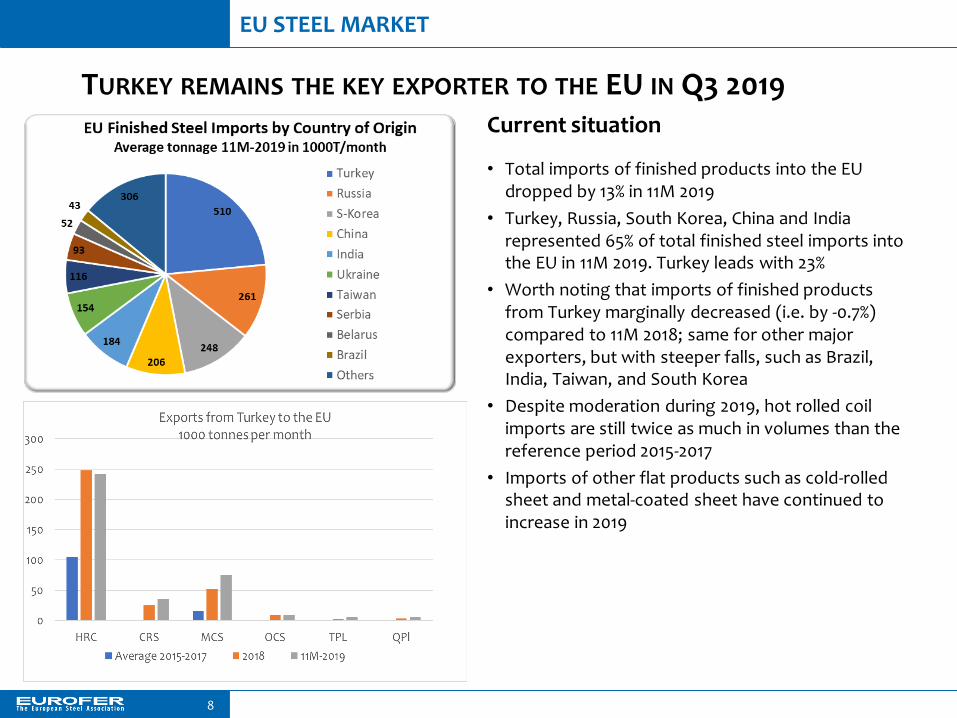
TURKEY REMAINS THE KEY EXPORTER TO THE EU IN Q3 2019
EU STEEL MARKET
Current situation
• Total imports of finished products into the EU dropped by 13% in 11M 2019
• Turkey, Russia, South Korea, China and India represented 65% of total finished steel imports into the EU in 11M 2019. Turkey leads with 23%
• Worth noting that imports of finished products from Turkey marginally decreased (i.e. by -0.7%) compared to 11M 2018; same for other major exporters, but with steeper falls, such as Brazil, India, Taiwan, and South Korea
• Despite moderation during 2019, hot rolled coil imports are still twice as much in volumes than the reference period 2015-2017
• Imports of other flat products such as cold-rolled sheet and metal-coated sheet have continued to increase in 2019

9
EU STEEL TRADE
EU IMPORT VOLUME DECREASED IN 2019 REFLECTING DEPRESSED DEMAND, BUT EU IMPORT MARKET SHARE REMAINING HIGH
Source: COMEXT, EUROFER
* Finished steel includes flat and long products excluding tubes
1900
1950
2000
2050
2100
2150
2200
2250
2300
2350
2017 2018 2019 YTD
+12%
-1%
-10%
(Jan – Sep)
EU imports finished steel* (% change y-o-y) EU import market share (%)
‘000 Tonnes
1418 19 19 20 21 20 20
1720
Flat Products
8 10 10 1012 11
1310
7
14
Long Products

10
EU STEEL INDUSTRY SITUATION
Dunkirk 0.4
Bremen 0.4
Eisenhüttenstadt 0.2
Krakow 1.5
Gijon 0.8
Kosice 0.7
Taranto 1.0
EU STEEL PRODUCTION CUTS IN 2019 ADJUSTING TO CYCLICAL DEMAND DEPRESSION AND IMPORT PRESSURE // PERMANENT CAPACITY CLOSURES SINCE 2009
In 2019: EU steel producers individually reducing production, totalling 8 million tonnes (integrated sites only)
Announced cuts in direct jobs : 15,000
Since 2009 permanent capacity closures 20 million tonnes :
Blast Furnace closures
Electric Arc Furnace closures
Source: Company and press announcements
Teesside 3.5
Piombino 2.4
Kremikovtzi 2.2
Florange 2.7
Liège 1.7
Carsid 1.9
Trieste 0.9 (announced)
Raahe 1.3
Oxelösund 0.5
Salzgitter 0.6
Ostrava 0.4
Sisak (halts production)
Madrid 0.6
Bergara 0.6Zumarraga 0.7
80,000 direct jobs lost since 2009 (25% of total EU steel workforce)
Bochum 0.8Krefeld 0.6
Liepaja 0.9

EUROFER WELCOMES THE AGREEMENT OF A LARGE MAJORITY OF GFSEC MEMBERS TO CONTINUE ADDRESSING STEEL EXCESS CAPACITY ON THE CURRENT GFSEC BASIS
11
GLOBAL FORUM STEEL EXCESS CAPACITY
➢ EUROFER in cooperation with the U.S. steel industry mobilised 19 steel industryassociations in Europe, the Americas, Asia and Africa calling for the governmentsto step up efforts to effectively tackle persistent global steel excess capacityincluding a continuation of the GFSEC implementing the full mandate.
➢ Regional steel industries are deeply disappointed about China stepping out of theforum undermining the multilateral approach that is needed for reaching effectivesolutions to a global problem.
➢ EUROFER welcomes the agreement of a large majority of members of the GFSEC,excluding China, to continue the work on addressing steel excess capacity

STRONGER INTERNATIONAL SUBSIDY RULES AND DISCIPLINES ARE CRITICAL TO EU INDUSTRY INCLUDING STEEL
12
WTO REFORM – INDUSTRIAL SUBSIDIES
The Global Forum on Steel Excess Capacities hasprovided the substantial groundwork fornegotiating stronger subsidy disciplines
The EU/US/Japan statement targets the subsidies distorting capacities and trade that are the most harmful for the steel sector including:
Other important elements include:
1. Absolute prohibition of unlimited stateguarantees
2. Subsidies to insolvent producers absent crediblerestructuring plan
3. Subsidies to producers unable to attract privateinvestment or financing in situations ofovercapacity
4. Debt forgiveness
5. Certain subsidies for which there is a presumptionof serious harmful effects unless the subsidisingcountry can demonstrate the opposite (such asexcessively large subsidies, subsidies creatingmassive manufacturing capacity, subsidieslowering input costs domestically…)
1. Qualifying non-notifiedsubsidies that are counter-notified by another WTOmember as prohibitedones
2. Considering subsidies distorting capacityas such causing serious prejudicetherefore actionable (WTO disputesettlement and ultimately retaliation)
3. Review of the “publicbody” notion for purposeof countervailing dutyactions
EUROFER welcomes the recent EU/US/Japanstatement agreeing to strengthen the existingWTO disciplines on industrial subsidies (14/01/20)