european planning studies - ucsb
TRANSCRIPT

This article was downloaded by:[Clarke, Keith][CDL Journals Account]
On: 28 August 2007Access Details: [subscription number 780222585]Publisher: RoutledgeInforma Ltd Registered in England and Wales Registered Number: 1072954Registered office: Mortimer House, 37-41 Mortimer Street, London W1T 3JH, UK
European Planning StudiesPublication details, including instructions for authors and subscription information:http://www.informaworld.com/smpp/title~content=t713417253
Complexity, emergence and cellular urban models:lessons learned from applying SLEUTH to twoPortuguese metropolitan areasElisabete A. Silva a; Keith C. Clarke ba Lisbon Technical University CESUR, Instituto Superior Técnico, Lisboa, Portugalb Geography Department, University of California Santa Barbara, Santa Barbara,USA
Online Publication Date: 01 January 2005To cite this Article: Silva, Elisabete A. and Clarke, Keith C. (2005) 'Complexity,emergence and cellular urban models: lessons learned from applying SLEUTH totwo Portuguese metropolitan areas', European Planning Studies, 13:1, 93 - 115To link to this article: DOI: 10.1080/0965431042000312424
URL: http://dx.doi.org/10.1080/0965431042000312424
PLEASE SCROLL DOWN FOR ARTICLE
Full terms and conditions of use: http://www.informaworld.com/terms-and-conditions-of-access.pdf
This article maybe used for research, teaching and private study purposes. Any substantial or systematic reproduction,re-distribution, re-selling, loan or sub-licensing, systematic supply or distribution in any form to anyone is expresslyforbidden.
The publisher does not give any warranty express or implied or make any representation that the contents will becomplete or accurate or up to date. The accuracy of any instructions, formulae and drug doses should beindependently verified with primary sources. The publisher shall not be liable for any loss, actions, claims, proceedings,demand or costs or damages whatsoever or howsoever caused arising directly or indirectly in connection with orarising out of the use of this material.
© Taylor and Francis 2007

Dow
nloa
ded
By:
[Cla
rke,
Kei
th] A
t: 19
:14
28 A
ugus
t 200
7
Complexity, Emergenceand Cellular Urban Models: LessonsLearned from Applying Sleuth to TwoPortuguese Metropolitan Areas
ELISABETE A. SILVA1,� & KEITH C. CLARKE2
1Lisbon Technical University CESUR, Instituto Superior Tecnico Lisboa, Portugal, 2Geography Department,
University of California Santa Barbara, Santa Barbara, USA.
[Paper first received, November 2003; in final form, March 2004]
ABSTRACT We explore the simulation of urban growth using complex systems theory andcellular automata (CA). The SLEUTH urban CA model was applied to two differentmetropolitan areas in Portugal, with the purposes of allowing a comparative analysis, of usingthe past to understand the dynamics of the regions under study, and of learning how to adaptthe model to local characteristics in the simulation of future scenarios. Analysis of the two casestudies show the importance of SLEUTH’s self-modification rules in creating emergent urbanforms. This behavior can help build an understanding of urban social systems through thisclass of CA.
Introduction
The concentration of population in urban areas and accompanying rapid urban growth is a
global phenomenon. One would imagine, therefore, that these problems have less magni-
tude where population growth is stable, or even in decline: as is the case in Portugal.
Despite a long period of growth at about the 1% rate during most of the twentieth
century, and a boost when some 5-800,000 people returned from the colonies after the
1974 revolution, the country’s population is likely to peak some time in this decade at
about 10.8 million, and then will decline. Yet ironically, urban growth is rampant in
Portugal, centered in the two largest cities of Lisbon and Porto. Urbanization is obviously
not simply a linear function of population growth, the decline in household size and the
�Correspondence Address: Lisbon Technical University CESUR, Instituto Superior Tecnico; Av. Rovisco Pais,
1049-001 Lisboa, Portugal, Email: [email protected]
ISSN 0965-4313 print=ISSN 1469-5944 online=05=010093–24 # 2005 Taylor & Francis LtdDOI: 10.1080=0965431042000312424
European Planning Studies Vol. 13, No. 1, January 2005

Dow
nloa
ded
By:
[Cla
rke,
Kei
th] A
t: 19
:14
28 A
ugus
t 200
7
ageing of the population imply a far more subtle dynamic. Traditional modelling
approaches based solely on demographic trends seem to fail to account for contemporary
urban growth. Therefore, it is important to take into account urban growth through time,
and particularly, its recent evolution, collective social preferences for different styles of
living, and recent market trends. These elements have a key impact on how urban land
uses are organized. Urban modelling approaches that are sensitive to local diversity in
these factors can be more successful when simulating various shapes, intensities and
velocities of urban growth throughout space.
Understanding such non-linear and negative feedbacks requires a complex systems
approach in order to better understand the processes involved and to help assure that
future urban forms are both suitable living places and are environmentally sustainable.
Until recently, complexity was generally associated with randomness, and science’s
primary objective was to reduce this randomness and reveal the order, either by inferential
statistics or by the construction of analytic models. Yet a consequence of such reduction
methods was the loss of the local detail that could help us to understand the interconnect-
edness of urban systems.
Complexity theory has become important to understand self-organized, critical and
chaotic kind of systems (Wilson, 2000; Phillips, 1999; Kay, 1999; Toffoli, 1998;
Holland, 1995; White, 1994; Kauffman, 1993; Prigogine, 1984). Complexity in nature
is often the result of continuous adaptations to change. The tools for understanding
urban landscapes are inherently static and many of the feedbacks are unknown, or unquan-
tifiable. The consequence is that our design and planning solutions often lack the ability to
respond to change and to integrate with the rest of the environment (Itami, 1988: 52).
From early origins in physics and biology, particularly in the field of Artificial Life
(Delorme, 1999; Goles, 1996; Resnick, 1995; Langton, 1991), complexity theory has
grown to influence many sciences, including ecology, geography, hydrology, and urban
studies.
The family of models called cellular automata (CA) is a simple vehicle to capture
and simulate the complexity inherent in dynamic systems. In this paper we document
the application of the SLEUTH CA urban growth model to two Portuguese metropoli-
tan areas. These cities have very different geographic characteristics, and were selected
to test the model’s flexibility to adapt or ‘evolve’ into different urban environments.
Lisbon is the capital of Portugal, and the administratively defined metropolitan area
includes large patches of farmland surrounding the mouth of the Tagus River. The
urban pattern of Lisbon and its environs is characterized by intense urban pressures,
first along main roads and rail lines and, in a recent period, through the development
of large suburban developments in rural areas. By contrast, the metropolitan area of
Porto is characterized by a coastal Atlantic landscape at the mouth of the River
Douro and is surrounded by mountains. The urban pattern grew constantly mainly
around its two nuclei (Porto and Vila Nova de Gaia), and the settlements are scattered
among many small rural towns and villages with small patches of intensive agriculture
and pine forests.
This paper summarizes research conducted to describe, model and predict urbanization
in these two metropolitan areas of Portugal (Figure 1). We begin by describing the history
of CA modelling and its main elements, pointing out some of the differences between
simple and more extended CA often used in urban modelling. Then, the SLEUTH
model is described, explaining the original CA theory, and its novelties. The third part
94 E. A. Silva & K. C. Clarke

Dow
nloa
ded
By:
[Cla
rke,
Kei
th] A
t: 19
:14
28 A
ugus
t 200
7
describes the database used as model input for the Lisbon and Porto Metropolitan Areas.
The fourth and fifth parts describe the process of running the model, its calibration with
historical data, and the future simulations. The correspondence of the SLEUTH model
to the original CA theory and the appropriateness of introducing self-modification rules
are explored throughout. The sixth part analyses the data resulting from the prediction
mode of SLEUTH, and the seventh part returns to the lessons learned from the modeling
effort, and their consequences for future work.
Cellular Automata
Sixty years ago, von Neumann and Morgenstern’s “theory of games and economic
behavior” (1944) initiated a very important pan-disciplinary paradigm change. Initially
conceptualized as an attack of the Hicks-Samuelson variant of neoclassical economics
then dominant, “it precludes the emergence in the twentieth century of structuralist
analysis” (Leonard, 1995: 731). Influential research was Hilbert’s construction in
1899 of the axioms of Euclidean geometry, Zermelo’s 1912 link of kinetic theory,
Figure 1. Location of the Metropolitan Area of Lisbon and the Metropolitan Area of Porto, Portugal
Complexity, Emergence and Cellular Urban Models 95

Dow
nloa
ded
By:
[Cla
rke,
Kei
th] A
t: 19
:14
28 A
ugus
t 200
7
quantum mechanics, and parlour games, and Remark’s 1929 works on microeconomics.
The theory of games “becomes part of a general shift in science which involved,
broadly speaking, the abandonment of determinism, continuity, calculus, and the meta-
phor of the ‘machine’ to allow for indeterminism, probability, and discontinuous
changes of state” (Leonard, 1995: 756). The emphasis was therefore shifted from deter-
minant to structure.
Beyond his academic work, Von Neumann was engaged in an intense collaboration
with the military. His work with Standislav Ulam, a renowned mathematician, suggested
to him as early as 1950 that simple CA could be given sets of local rules that generated
mathematical patterns in two-dimensional and three dimensional space. The key was
that global order could be produced from local action (Batty, 1997b: 159).
Von Neumann “called his proposed systematic theory the ‘theory of automata’. This
theory of automata was to be a coherent body of concepts and principles concerning the
structure and organization of both natural and artificial systems, the role of language
and information in such systems, and the programming and control of such systems”
(Von Neumann, 1966: 18). In 1970, Conways’s ‘game of life’, popularized by Gardner
in his column in Scientific American, exposed these ideas through other fields of
science. Simple simulations of death and life in a CA game proved the striking similarities
between real life and simulated life in a computer.
Strict CA came into geography through Waldo Tobler who had contact with Arthur
Burks at Michigan (a disciple of Ulam’s) and was exposed to von Neumann’s works,
leading to ‘Cellular Geography’ (Tobler, 1979). At the University of California, Santa
Barbara, Helen Couclelis, influenced by Tobler, and also by Prigogine’s work on molecu-
lar interactions and their resulting large-scale spatial structures, published ‘Cellular
Worlds’ (Couclelis, 1985).
Cellular automata are formally expressed rather simply, and their power comes from the
ease with which simple preconditions, distributions, rules, and actions can lead to extra-
ordinary complexity. There are several components in a CA: spaces, states, neighbour-
hoods, and transition rules. The space of CA maps well onto the raster data structure of
geographic information systems. Grid space is organized by cells, and for CA models
these are generally two-dimensional, rectilinear, and homogeneous. The cells are the smal-
lest units, and must manifest adjacency or proximity. The state of a cell can change accord-
ing to one or more transition rules, defined in terms of neighbourhood functions. In a
standard CA model, the state is usually used as the main attribute to describe the develop-
ment of a cell. The cell neighbourhood is central to the CA paradigm, the state of any cell
depends on the state and configuration of other cells in the neighbourhood of that cell. Two
neighbourhoods commonly defined are the von Neumann neighbourhood (defined by
5 cells, the cell itself plus the N, S, E, W contiguous cells), and the Moore neighbourhood
(defined by 9 cells, the immediate 8 cells close to the central cell).
Transition rules are decision rules or transition functions of the cellular model, and must
be clearly stated. The rules can be deterministic or stochastic, and in theory there can be as
many transition rules as cells, but in practice there are only a few. One key element is that
the rules must be spatially uniform. They must apply to every cell, state, and neighbour-
hood, and every change in each state must be local.
Dynamics with a CA require an initial set of states over the cells, and a sequence of dis-
crete time steps. In CA, time is discrete through a simultaneous updating of all cell states
after the rules have been applied to the current configuration. When activated, the cellular
96 E. A. Silva & K. C. Clarke

Dow
nloa
ded
By:
[Cla
rke,
Kei
th] A
t: 19
:14
28 A
ugus
t 200
7
automaton proceeds through a series of iterations. For each iteration, the cells in the grid
are examined in order. Based on the composition of cells in the neighbourhood of that
central cell, the transition rules are applied to determine the central cell in the next
iteration.
Figure 2 presents an example of a CA. The universe is the matrix, states are dead or
living cells, the transition roles are set, and time corresponds to T1, T2, T3. An
example applied to urban planning is as follows: the universe is the land, live cells are
urban areas, and an example of a transition rule is “urban nuclei below a specific
number of households can’t pay for facility costs and will be abandoned through time if
they become individual households”. Therefore, accordingly to figure 2 and the rules,
the urban area of the Time 1, will have two households moving to its periphery in Time 2,
one of the households will disappear because of the rule. At Time 3, another household
moves further into the countryside, once it loses the connection with another urban cell,
it becomes isolated and also disappears. Through this simple example, it is possible to
understand the consequences of the rule as manifested in the formation of different
urban shapes over time. Dynamic simulations, besides their visual impact that promote
analysis and understanding of the shape and size of urban growth, also allow for quanti-
tative analysis on the elements that promote, for instance, specific paths of urban growth.
Wolfram (1994: 3–7) outlined a number of characteristics that CAs possess:
1. The correspondence between physical and computational processes is clear;
2. CA models are much simpler than many mathematical equations, but produce results
that are more complex;
Figure 2. An example of a CA running at different time steps (integrating: time, transitionrules and states)
Complexity, Emergence and Cellular Urban Models 97

Dow
nloa
ded
By:
[Cla
rke,
Kei
th] A
t: 19
:14
28 A
ugus
t 200
7
3. CA models can be modelled using computers with no loss of precision;
4. CA can mimic the actions of any possible physical system;
5. CA models are irreducible.
These properties of CA imply that there is no pre-knowledge of a global structure and
that any global pattern created by CA is not prescribed or predetermined but rather
emerges from purely local interactions. Cellular automata models are based on the
premise that it is possible to describe the complex patterns of natural phenomena by mod-
elling the simple rules that govern the actions of the component parts, and consequently,
emergent patterns and properties can be identified. A classic example of an emergent
phenomenon in the game of life are ‘gliders’, spatial configurations that endure by con-
tinuous movement, and oscillators, that seem to be stable in situ by oscillating between
two complimentary spatial patterns.
Cellular automata can be seen as discrete models of spatio-temporal dynamics where
local and regional behavior are interrelated. The work of Prigogine pioneered the relation-
ships between molecular interactions in chemical reactions, and demonstrated the import-
ance of this micro-macro interaction in pattern identification. In the same way the works of
Holland (1999), Crutchfield (1995), and Kauffman (1984), have been important in point-
ing out the emergent properties of random complex automata.
While the patterns obtained with different rules are different in detail, their CAs appear
to fall into four qualitative classes, at least for one-dimensional automata:
1. behaviour leads to a homogenous state;
2. behaviour leads to a set of separated simple stable or periodic structures;
3. behaviour leads to a chaotic pattern;
4. behaviour leads to complex localized structures, sometimes long-lived (WOLFRAM,
1984: 5).
The observation that micro-simulations lead to macro-patterns is at the basis of CA. This
implies that patterns are imprinted at several scales, giving a fractal character to their CA
simulations. Several authors have observed this after applying their CAs. Clarke and
Gaydos (1998: 700) stated that “Simple cellular automata are characterized by phase-
transitions between behavior types, so that a single model can result in stability, stochastic
instability, or chaos”. White (1997b: 234) mentions that bifurcations appear in any sufficiently
nonlinear system, where new and qualitatively different solutions appear suddenly (as one or
more parameters pass a critical value). Batty (1997a: 268) also remarked on this quality:
“their patterns repeat themselves across many scales due to the fact that their growth reflects
the successive application of the neighborhood principle”.
With time came a better understanding of CA in the geographical sciences, and with the
integration of real data came the technical possibility of relaxing the assumptions of stan-
dard CA that do not fit our experience of cities and regions: non-homogeneity of space;
non-regularity of neighbourhoods, different transition functions, probabilistic transition
rules, permeability to action at a distance, allowance for time decay, and variable time
steps. Some recent applications of CA include several of these variants. These include
the incorporation of bigger neighbourhoods, such as the case of 112 cells (White,
1997), the use of hexagonal cells (Sanders, 1997), the use of constrained and stochastic
CA with friction at a distance (Ward, 2000; Clarke, 1997; White, 1997), and the idea
98 E. A. Silva & K. C. Clarke

Dow
nloa
ded
By:
[Cla
rke,
Kei
th] A
t: 19
:14
28 A
ugus
t 200
7
that binary states have been replaced by several transient states (e.g. gray or ‘ghost state’
urban growth simulated by Li, 2000: 137).
The range of approaches to CA has also broadened: from urban and metropolitan
growth models (Ward, 2000; Li, 2000; Batty, 1999; Clarke, 1998, 1997), to CA migration
of workers (Sembolini, 1997), to simulation of urban forms (Wu, 1999, 2000; Batty,
1997a), to modelling systems of cities and regions (White, 2000; Sembolini, 1997;
Sanders, 1997; Portugali, 1995), to CA’s use in international migration (Portugali,
1995), to micro-economic theory and environmental economic efficiency locations (Wu,
2000; Webster & Wu, 1999), and to models of competitive behaviour (Benati, 1997).
With this broadening of CA, new geographical areas have been studied: from China
and Portugal, to the USA, Canada, UK and Mexico.
With this deeper knowledge of CA, new questions and problems arose at the level of
implementation, concerning model results and the conceptual application of CA. One
of the problems, pointed out since the origins of CA in the social sciences, lies in
one of the basic principles of CA: the lack of action at a distance (Li, 2000: 133; Batty,
1997b: 161). Another problem is the homogeneous time period update, since in reality
updates are not independent, and individual decisions influence others, especially
within a neighbourhood, in the same time period (Huberman, 1993: 7716).
The introduction of global constraints to the initial sets of CA conditions has been the
subject of intense discussion in the literature. Usually, exogenous estimates of amounts of
change are used, such as population projections, and the CA ‘allocates’ the change spatially.
Introducing constraints requires two problems to be solved; that numerical values for the con-
straints be acquired or generated; and that the constraints be incorporated into the transition
rules in such a way as to ensure that they are satisfied without violating the logic of the local
process modelled by CA (White, 2000: 390; Ward, 2000: 542). It remains to be proven that
CA models used in this way behave any different than probabilistic GIS-based constraint allo-
cation methods, such as multi-criterion weighting. Other theoretical questions have been
raised, such as the fact that simply by using the overall rate of increase and overall movement
rates without concern for the life stages at which movement takes place may introduce very
large errors (Hastings, 1996: 1679; Huberman, 1993: 7716).
Problems of back and forward propagation seem also to be a concern. Toffoli (1987:
146) posed questions of reversibility and the problems of applying the inverse rules in
non-linear systems. Prigogine questions whether irreversibility throughout what is com-
monly defined as the direction of time and the theory of dynamical systems, allows the
formulation of laws of nature (Prigogine, 1999: 538). Gowithz (1991: i–xiv) stated the
forward problem, and the inverse problem: “the forward problem is: given a CA rule,
determine (predict) its properties. The inverse problem is: given a description of some
properties, find a rule, determinant, or set of rules, which have these properties”. A rel-
evant example of this second problem was explored in von Neumann’s seminal construc-
tion of a cellular automaton capable of reproducing itself.
In summary, while complex systems theory and cellular automata are mature and rich
areas of theory, many fundamental questions remain about the suitability of CA for social
systems. In particular, they require that cities be reduced to cells and states that may be
simple to map, yet generate rules and forecasts that leave much unexplained about how
human settlements work. These questions are often lost in the details of model application.
We therefore will apply such a model, and then return to discuss the issues in the light of
the lessons learned in application.
Complexity, Emergence and Cellular Urban Models 99
Dow
nloa
ded
By:
[Cla
rke,
Kei
th] A
t: 19
:14
28 A
ugus
t 200
7
The SLEUTH Cellular Automaton Model
SLEUTH is a CA model developed to forecast urban growth and land use change.
SLEUTH is an acronym for Slope, Land Use, Excluded Areas, Urbanization, Transpor-
tation, and Hillshade, the input layers that make the model run. Developed by Clarke
(1997, 1998) this CA contains the main elements that characterize the core characteristics
of CA: it works in a grid space of homogeneous cells, with a neighbourhood of eight cells,
two cell states (urban/non-urban), and five transition rules that act in sequential time steps.
SLEUTH also incorporates several novelties that bring its behaviour closer to observed
urban evolution. Self-modification is permitted, which allows the rules to change in reac-
tion to aggregate behaviour, in particular the overall growth rate. The automated cali-
bration process allows the model to ‘learn’ the history of the place and simulate
accordingly to the most important characteristics, allowing for periods of intense rapid
growth, or little or no growth. SLEUTH also allows weighting of cells, besides 0/1, differ-
ent weights are possible in some of the data layers.
SLEUTH requires five inputs maps: urbanization, transportation, areas excluded from
urbanization, slopes, and a hill shaded map (prepared using GIS and then converted to
8 bit GIF images). For all these layers, 0 is a null value, while all the values in-between
1 and 255 are a measured value. The model also requires that the input layers have the
same number of rows and columns and are correctly georeferenced, as the model is sen-
sitive to layer misregistration. Urbanization is the most important layer in the model, and
for statistical calibration of the model at least four urban time periods or spatial extent
‘snapshots’ must be used.
Urbanization in the model results from several active elements (stored as files): a seed
urban file with the oldest urban year, and at least two road maps that interact with a topo-
graphic slope layer, to allow the generation of new nuclei or the outward growth of exist-
ent ones. Besides the slope, a constraint or exclusion map represents water bodies, or
natural and agricultural reserves that prevent development from happening, with either
probabilities or hard criteria. The weighting of the raster layer of roads allows a hierarchy
with different values that influence urbanization in different ways, directions and intensi-
ties. A final layer, normally hill shading, is required as a cartographic background for the
dynamic urbanization display.
The model works in the following way: after reading the input layers, initializing
random numbers and controlling parameters, a predefined number of interactions takes
place that corresponds to the same number of years. An outer loop executes each
growth history and retains statistical data, while an inner loop executes the growth rules
for a single year. After each model run, sets of descriptive statistics are computed and
saved to a file for the purpose of calibration. There are thirteen scores, and include: r2
population (least squares regression score for the number of urban pixels compared to
actual urbanization for the control years), edge r2 (least squares regression score for the
length of the urban-rural edge compared to actual urbanization for the control years),
r2 clusters (least squares regression score for modelled average urban cluster size com-
pared to known mean urban cluster size for the control years), and the Lee-Sallee index
(1975) (a shape index, a measurement of spatial fit between the model’s growth and the
known urban extent for the control years).
The change rules that determine the state of each individual cell are applied to the neigh-
bourhood of each cell are tuned with five parameters: Diffusion, Breed, Spread, Slope
100 E. A. Silva & K. C. Clarke

Dow
nloa
ded
By:
[Cla
rke,
Kei
th] A
t: 19
:14
28 A
ugus
t 200
7
Resistance and Road Gravity. The total modelled growth is the sum of the four different
types of urban growth defined in the CA transition rules. The diffusion factor determines
the overall dispersiveness of the distribution of single grid cells and of the movement of
new settlements outward through the road system. The breed factor determines how likely
a newly generated detached settlement is to begin its own growth cycle. The spread coef-
ficient controls how much outward ‘organic growth’ expansion and infill takes place
within the system. The slope resistance factor influences the likelihood of settlement on
steeper slopes, and Road Gravity is a factor that simulates the effect of attracting new
settlements onto the road system if new areas fall within a given distance of a road
(Clarke et al., 1997: 252; Candau et al., 2000). These coefficients allow the generation
of four different kinds of urban growth, Spontaneous New Growth, Diffusive Growth,
Spread of a New Growth Center, Organic Growth and Road Influenced Growth.
A practical example of the mechanics of the model follows. In a grid where flat surfaces
exist and roads are close by, urban cells will accumulate over several interactions in areas
close to and along that roadway, and then spread from this location to new neighbours to
yield new growth from this location outwards. The same can happen in locations where at
least three urban cells exist in the neighbourhood, allowing, in this case, organic growth to
expand from those existing three cells. In areas with no or isolated urban cells without
direct road influence, two kinds of urbanization can happen, spread from a newly
formed urban centre, or spontaneous new growth can occur if it is possible there. These
examples of the model functioning are intended to illustrate the internal mechanics, never-
theless, this is a more complex process with multiple possibilities for non-linear feedbacks
among the factors creating the growth.
The use of initial conditions, as previously described, reflect the spirit of the initial CA
theory. The authors (Clarke et al., 1997, 1998) included a set of additions to the model by
developing a set of self-modification rules in order to control the parameters, allowing the
model to modify itself making them closer to what is observed in the real world. This was
necessary because only occasionally did the CA behave so as to create the lazy-S urban
saturation curve over time, which non-linear behaviour feedbacks made far more
common, increasing the likelihood that the model behaviour would match the observed
behaviour. With each run, the model records an average history of urban growth, using
Monte Carlo simulation. A single simulation’s ‘success’ is in maximizing the 13 measures
that compare the modelled growth to the observed, and the model is tested exhaustively
until a best solution emerges.
During any one simulation, the detection of intense growth periods (boom) or periods of
little or no growth (bust), changes the behaviour control parameters. When the rate of growth
in any year exceeds a critical value, the Diffusion, Spread and Breed factors are increased by
a multiplier greater than one. This encourages diffusive, organic and road influenced growth,
reproducing the tendency of an expanding system to grow even faster. In contrast, when the
system growth rates fall below another critical value, the diffusion spread and breed factors
are decreased by a multiplier less than one, similarly to what would happen in depressed or
built-out areas. Two other self-modification rules can play an important role in the case of
normal growth (representing linear growth). As the road network densifies and enlarges, the
road gravity factor is increased. As the percentage of land available for development
decreases, the slope resistance factor is decreased, allowing expansion onto steeper
slopes, up to a maximum feasible buildable slope value. With time, the spread factor is
also increased, which accelerates urban expansion on flat land.
Complexity, Emergence and Cellular Urban Models 101

Dow
nloa
ded
By:
[Cla
rke,
Kei
th] A
t: 19
:14
28 A
ugus
t 200
7
Calibration plays an important role, not only by allowing an improved fit between the
simulation and the actual data by refining the control values, but also, because it allows us
to see, in a very clear way, how these self-modification rules contribute to the CA beha-
viour (Silva Clarke, 2002; Clarke et al., 1998). The method of calibration has been termed
‘brute force’: all combinations and permutations of the five control parameters are
searched in a method designed to lead to at least a local best solution, though not a pro-
vable optimal solution (Clarke, 2003). The calibration process is compute-intensive,
and has led to experiments and methods to speed up the routines, including parallel pro-
cessing and supercomputing.
Input Data from the Lisbon and Porto Metropolitan Areas
Cellular Automaton (CA) have proliferated outside of GIS in spatial analysis and planning
mainly due to the inability of GIS to perform modelling, especially in a computationally
intensive setting. GIS has limited ability to perform repetitive operations (especially on
large volume data sets), and has only a weak ability to handle dynamic spatial models
(Park Wagner 1997: 213). While several of the commercial GIS vendors are trying to
address this absence nevertheless, the capabilities of GIS in data manipulation make it criti-
cal in preparing the data sets (new map extents, projections, grid resolutions,
co-registration, editing and visualization of the data), and GIS has the potential to be a
very important engine for cellular automata (Goodchild Longley, 1999; Anselin, 1999).
The advantages of linking CA and GIS have been discussed extensively with respect to
CA (Li, 2000; Wu, 1999; Clarke, 1998, 1997; Wagner, 1997; White, 1997). The linkage
between CA and GIS varies, and has been characterized as of three types: stand-alone,
loosely coupled and fully integrated (Goodchild, 1992: 417; Park Wagner, 1997: 215).
SLEUTH is a stand-alone model, but requires a data set to be built in GIS in order to run.
The GIS and CA integration in SLEUTH has been described in three phases: an initial
phase of tight coupling when the data set is worked to feed the model; a second phase
of loose coupling during exploration of the results of the application; and a third phase,
also of loose coupling where the predictions generated are introduced again in GIS to
allow further display and analysis (Clarke & Gaydos, 1998: 701).
For the Lisbon and Porto Metropolitan Areas, compilation of the data was a straightfor-
ward process in the case of the Lisbon, but a harder task for Porto. The database for Lisbon
was built for a longer time period and was documented. The Porto database was completed
only in December 1999. Classification of Landsat imagery was also easier in the case of
Lisbon. Tables 1 and 2 present a synthesis of the different layers required and their grid
values.
The urban extent data was a result of a supervised classification of Landsat imagery. The
urban-built up land, including buildings, asphalt, concrete, suburban gardens, and road-
ways, was classified, extracted and represented as binary files (urban/non urban). The
Landsat data resolution of 30 metre pixels limited the minimum unit possible to
extract to four adjacent pixels (3600 square metres), therefore, elements below that
threshold were automatically clumped by predominance. The classified data was then
georeferenced, using the transportation layer (the root mean squared positional error for
all of the images was below half the cell size), resampled to a 100 � 100 m grid, and
clipped to the metropolitan area administrative boundary (a similar process of resampling
and clipping the layers occurred in all the other layers).
102 E. A. Silva & K. C. Clarke

Dow
nloa
ded
By:
[Cla
rke,
Kei
th] A
t: 19
:14
28 A
ugus
t 200
7
The transportation layer was derived from several sources. In the case of the Lisbon
Metropolitan Area, the most recent year was extracted from the Regional Plan for the
Lisbon Metro Area (the acronym is PROT-AML). The oldest year was obtained
through the following process: using a 1987 Road Map from ACP (Automovel Club de
Portugal), the roads that did not exist in 1987 were subtracted from the PROT-AML,
until it matched the ACP 1987 map. In the case of the Porto Metropolitan Area,
the 2000 map was a result of the compilation of the Municipal Master Plan roadway
maps, and several other forms of auxiliary data information, and the same process
was applied to obtain the 1987 road map. The model allows weighting of the different
roads with values that reflect their importance to the transportation system, so the roads
were ordered by degree of importance in both metropolitan areas, and three classes
were defined: surface roads, highways, and proposed roads. We decided to equally distri-
bute the values between 0 and 100, being aware that further studies need to be done in
order to be sure of the degree of importance in the network. The assigned values were
the following: highway 100, base roads 50, and proposed roads 25.
The excluded-areas layer contains the water bodies and land where urbanization cannot
occur. In both case studies, the information was taken from the Municipal Master
Plans, predominately from two classes defined by law: the ‘Ecological Reserve’ and the
‘Agricultural Reserve’. For both the Lisbon and Porto Metropolitan areas, this layer
also contains weight values indicating probabilities of exclusion. In the Lisbon database,
we decided to attribute a value of 100 to the Ecological Reserve and 50 to the Agricultural
Reserve. One hundred means that no development is allowed and 50 that some
Table 1. Description of the input layers for the Lisbon Metropolitan Area (AML) data-base
Description
AMP layer
no
layers no years no classes Cell value Source of data
Slope 1 – – 0–768(0–373%)
CNIG-RCV�
Excluded 1 – 1. Ecologicalreserve (REN)
2. Agriculturalreserve (RAN)
1. REN ¼ 1002. RAN ¼ 50
Municipalmaster plans
Urban 4 1975, 1984,1995, 1997
1. Urban Landsat images(MSS, TM:Eurimage,
USGS)Transportation 2 1987, 2000 1. Base Roads
(BR)2. Highways
(HW)3. Proposed
Roads (PR)
1. 502. 1003. 25
1987 roadsprovidedby ACP
2000 roadsprovidedby PROT
Hillshade 1 – 0–3658Azimuth-315Altitude 45
DTM with100 � 100 mcell size
�Centro de Informacao Geografica (CNIG, Portugal), Project “Rede de Corredores Verdes”
Complexity, Emergence and Cellular Urban Models 103

Dow
nloa
ded
By:
[Cla
rke,
Kei
th] A
t: 19
:14
28 A
ugus
t 200
7
development is possible. Once again, tagging these values with the specific land use
reflects our knowledge of Portuguese land conservation, but further studies need to be
done in order to assign values with more certainty.
We compared the Landsat urbanized areas with the initial maps of Agricultural
Reserve (RAN) and Ecological Reserve (REN), and demonstrated that the prohibition
of urban growth by law in both cases was not effective. We decided to keep REN as
non-developable and RAN as partially developable. REN included major parks, habitat
areas and riparian corridors, and therefore tends to have more law enforcement. The Agri-
cultural Reserve (RAN), seems to be less protected when compared with REN, and
therefore was given the possibility of having some development.
Comparing the simulated past urban years with the Landsat classification (Figure 3),
there is not an absolute match between them, the simulated image presents the urban
cells as more scattered. This is due to the fact that we decided to prevent urbanization
from happening in the RAN and the REN areas, as defined by Portuguese law, therefore
the model keeps past urbanization more concentrated.
The slope layer is the average percent slope computed from a 100 metre digital terrain
model, and lastly the hillshade layer was used as a visual display of model results in the
graphic version of the model.
Three final steps were necessary before the data could feed the model. The first action
was to make sure that all the files had the exact final number of rows and columns,
Table 2. Description of the input layers for the Porto Metropolitan Area (AMP) data-base
Description
AMP layer
no
layers no years no classes Cell value Source of data
Slope 1 – 0–768(0–373%)
CNIG
Excluded 1 – 1. Ecologicalreserve (REN)
2. Agriculturalreserve (RAN)
1. REN ¼ 1002. RAN ¼ 50
Municipalmaster plans
Urban 4 1975, 1987,1997, 2000
1975, 1987, 1997,Landsat images(MASS, TM:Eurimage andUSGS); 2000Municipalmaster plans
Transportation 2 1987, 1999 1. Base Roads(BR)
2. Highways(HW)
3. ProposedRoads (PR)
1. 502. 1003. 25
1987 extractedfrom AICP
1999 Municipalmaster plans
Hillshade 1 – 0–3658Azimuth-315Altitude 45
DTM with100 � 100 mcell size
�Centro de Informacao Geografica (CNIG, Portugal), Project “Rede de Corredores Verdes”
104 E. A. Silva & K. C. Clarke

Dow
nloa
ded
By:
[Cla
rke,
Kei
th] A
t: 19
:14
28 A
ugus
t 200
7
784 � 836 pixels for Lisbon, and 347 � 563 pixels for Porto. The second action was the
conversion of all the GIS files to a GIF file format, and thirdly to be sure that the files had
the naming conventions the model would read, as these are standardized and used for the
data input part of the modelling.
Running the Model
The model is first run in a calibration phase to obtain a suitable set of parameters. More
precisely, the model was run in three different calibration phases (coarse, fine and
final). This process, described elsewhere (Silva & Clarke, 2002), explores the parameter
Figure 3. Observed urbanization and simulated urbanization in 1997, for Porto and LisbonMetropolitan Areas. This simulation assumed that, as stated by Portuguese law, no growth couldhappen in the Ecological Reserve (REN=100), and little growth could happen in the AgriculturalReserve (RAN ¼ 50). The white cells in the two images represents actual urban pixels, the dark
gray cells in the simulated images represent simulated urban cells
Complexity, Emergence and Cellular Urban Models 105

Dow
nloa
ded
By:
[Cla
rke,
Kei
th] A
t: 19
:14
28 A
ugus
t 200
7
space in a sequential multi-stage reduction by extensive automated exploration of the par-
ameters that control the system’s behaviour. The calibration phases allow the model to
simulate urban growth from the past into the present with a very high degree of fit
between the simulated years and the control years (r-squared of 0.91 in the case of
Lisbon, and 0.99 in the case of Porto – Table 3). These high values imply that it is possible
to simulate almost exactly the number of urban pixels from the control years, yet it is
nevertheless very difficult to simulate exactly the way these urban pixels are organized
in space (the urban shape), the shape index reflects this statement with values of correspon-
dence of 0.58 for Porto and 0.35 for Lisbon. This was at least partially due to the fact that
we decided to constrain the model to follow Portuguese Law by forbidding development in
the reserves (RAN and REN).
As seen in Figures 4 and 5, the behaviour of the Lisbon and Porto Metropolitan Areas
simulations is visually different but familiar to those familiar with both places, and easily
confirmed by the local history and scores resulting from the model calibration. The cali-
bration process for the two cities has been documented in depth (Silva & Clarke, 2002).
Both the Lisbon and Porto Metropolitan Areas underwent intense growth from the
beginning of the 1970s until the present, reflecting the post-revolution return from the
colonies. According to Rodrigues (1999: 313) between 1994 and 1998, 40% of the devel-
opment permits in the country were given in these two metropolitan areas. This intense
growth assumed different shapes, directions and intensities in each area. From the
Table 3. Best overall final calibration results for Lisbon and Porto Metropolitan Areas
AML AMP
Score/ 784 � 836 347 � 563Composite score 0.15 0.48Compare 0.90 0.97r2 population� 0.91 0.99Edges r2 0.78 0.98Cluster r2 0.85 0.99Leesalle 0.35 0.58
FinalCalibration
AfterSelf-modification
FinalCalibration
AfterSelf-modification
Diffusion 16 19 20 25Breed 57 70 20 25Spread 50 62 40 51Slope 25 38 45 100Roads 30 43 20 75
–The overall composite score (all scores multiples together) is bigger in Porto. The compare score (comparison of
modelled final population�� to real data final population��) and the r2 population (least squares regression score
for modelled urbanization compared to actual urbanization for the control years) are both similar
–The Edges r2 (least squares regression score for modelled urban edge count compared to actual urban edge count
for the control years) and the Cluster r2 (least squares regression score for modelled urban clustering for the
control years) are smaller in Lisbon. Due to the fact of the road oriented and nuclei organic growth, orignates
very defined shapes, and ages ‘harder’ to replicate compared to known urban clustering
–The Leesalle index (a shape index, a measurement of spatial fit between the model’s growth and the known
urban extent for the control years) also smaller for Lisbon reinforces the previous indexes
–The Diffusion, Breed, Spread, Slope and Road values include the final calibration values and the values after
self-modification
106 E. A. Silva & K. C. Clarke

Dow
nloa
ded
By:
[Cla
rke,
Kei
th] A
t: 19
:14
28 A
ugus
t 200
7
1970s to the present, the Lisbon Metropolitan Area followed a more ‘ordered’ growth,
with an urban axis expanding from the main urban nucleus: Lisbon, Oeiras, Alamada
and Seixal. Visual inspection of the Porto Metropolitan Area reveals a scattered urban
pattern throughout the entire metropolitan area with high densities around the cities of
Porto, V. N. Gaia, Matosinhos and Povoa do Varzim.
These differences are reflected by the model parameter values resulting from the final
calibration phase (Table 3). The five coefficients that both control and describe the beha-
viour of the system fall into the range of 0–100, allowing the user to understand in a
comparative way the contribution, of each element to the urban pattern. Calibration of
Figure 4. From 1976 to 1997 (selection of 4 years for the yearly simulation). The Urban Evolution ofthe Metropolitan Area of Lisbon (AML). The dark gray cells represent urbanization growth, the grayhillshade background was clipped to the administrative boundary of the AML. White represents the
outer area of AML, (mainly the Tagus estuary to the SW, and land at NE)
Complexity, Emergence and Cellular Urban Models 107
Dow
nloa
ded
By:
[Cla
rke,
Kei
th] A
t: 19
:14
28 A
ugus
t 200
7
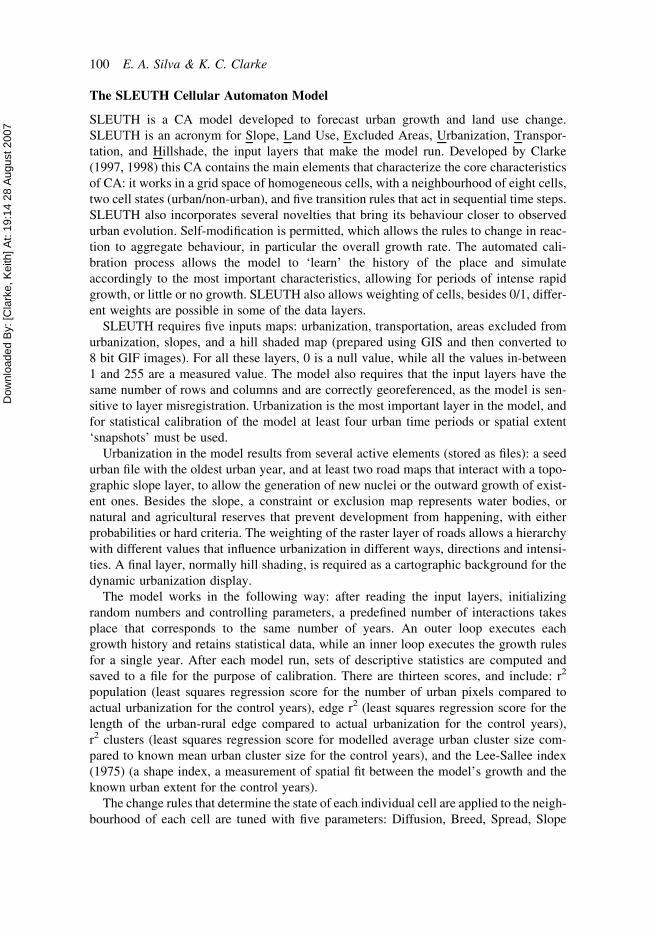
SLEUTH gave different values of Diffusion (16 in the case of Lisbon and 20 for Porto),
suggesting that the overall dispersiveness of Porto is greater. The values of Dispersion
and Road Gravity seem to reinforce this conclusion. Road influence has bigger values
in Lisbon than in Porto (30 to 20) and organic growth is more intense in Lisbon than in
Porto (50 to 40). These conclusions also reinforce the validity of CA (and of this specific
CA) to help in understanding complex phenomena through micro-macro analysis, where
the understanding of the particular behaviour of the individual elements of the system dis-
closes important patterns and processes at a regional scale (Clarke et al., 1997).
In the two case studies, inductive and deductive knowledge seem to reinforce each other
(Silva, 2001). Porto Metropolitan Area’s past absence of a regional plan has led to a more
‘unorganized’ urban system; but the recent decision to impose a major regional transpor-
tation plan is beginning to re-organize the urban pattern in the metropolitan area. The
model seems to be able to disclose both past characteristics (through calibration) and
the more recent behaviour (through self-modification). In the case of the Lisbon Metropo-
litan Area, the development of a series of regional plans imposed a more ‘orderly’ urban
growth.
Both Metropolitan Areas have been subject to intense urban pressures through time.
In the case of Lisbon during the last three decades, efforts to compete with other Euro-
pean capitals have placed an emphasis on the transportation system. National transpor-
tation plans laid out the road and rail networks in Lisbon and connected the shoreline
between Lisbon and the densely populated industrial district of Porto. Plans for the
modernization of infrastructure with major consequences for today’s urban form
began during the 1960s through the development of the 25 de Abril bridge, and the
construction of highways. At the regional scale, two plans were developed; and,
although these plans were never implemented in whole, their transportation structure
component was. These two regional plans (one developed in 1964, and a second first
presented in 1992), defined a set of N-S and E-W radials from Lisbon, as well as
two major circulars that led to the current urban form. The Lisbon Metropolitan
Area contains 2,554,240 inhabitants in an area of 3128 km2 with a population
Figure 5. From 1972 to 2000 (selection of 4 years for the yearly simulation). Urban Evolution of theMetropolitan Area of Porto (AMP). The dark gray cells represent urbanization growth, the grayhillshade background was clipped to the administrative boundary of the AMP. White represents
the area outside the AMP (The Atlantic Ocean to the west, and land to the East)
108 E. A. Silva & K. C. Clarke

Dow
nloa
ded
By:
[Cla
rke,
Kei
th] A
t: 19
:14
28 A
ugus
t 200
7
density of 817 people/km2. Several structural urban characteristics particular to the
Lisbon Metropolitan Area are apparent: rapid spread of tertiary centres in the munici-
palities close to Lisbon; new urbanization along the main high speed roadways due to
the increase in car usage; and the development of smaller residential areas all over the
metropolitan area (Silva, 1999; Viegas, 1989; Gaspar, 1997).
The Porto Metropolitan Area has a population of 1,196,850 inhabitants, an area of
817 km2, and a population density of 1465 people/km2. The main factors shaping
current urban form was not transportation, but population growth and the location of
industry. More importantly, the state authorities use of a polycentric vision for the dis-
persion of growth was a main shaping factor (Cardoso, 1996; Vasquez, 1989). This
approach was an attempt to extract advantages from the settlement history and its scattered
population and activities. Finally, the absence of regional planning for the area that now
comprises the Porto Metropolitan Area further emphasized the already disperse character
of population and land use.
Unlike the transportation network in Lisbon that acted as a structuring element for urban
growth, Porto’s scattered high-density population and industrial polycentric model pre-
vented centralized transportation planning, and the mapped and modelled data seem to
reflect this character. The stepwise adaptation of the SLEUTH model through calibration
seems to reveal properties of the physical characteristics of the two built environments
(Silva, 2001). This seems to confirm other CA studies where the self-organization charac-
ter of settlement systems and “the ‘urban transition’ at the scale of the whole system is
made through local and competitive transformations” (Sanders, 1995: 289).
Urban form as a product of micro interactions, and the emergence of regional patterns
from local, need further explanation. Sanders’ reference to the urban transition at the scale
of the whole system emphasizes a particular character of this kind of complex system.
Nevertheless, it is unreasonable to think that all the patterns will be observed from the
most local pixel to the entire globe, there is a set of discontinuities where some micro pat-
terns are lost and others emerge. Factors explaining the choice of a single land parcel by an
individual citizen, for example, differ from those influencing a developer seeking to build
an entire neighbourhood. Consequently, a constant evolution from local to global by a
linear process seems unlikely to exist. As Prigogine (1999: 538) pointed out “the main
result of our work is the formulation of microscopic laws of nature which are expressed
in terms of probabilities (and not trajectories or wave functions) and lead to time symmetry
breaking”.
These ‘phase transitions’ (Clarke & Gaydos, 1998: 707) in SLEUTH are enhanced by
the self-modification rules, “In geographical terms, this means that different periods of
time should be dominated by different growth behavior, and by increasing spatial adap-
tation to the local environmental conditions”.
It is possible to save the temporally varying set of SLEUTH parameter values resulting
from the self-modification rules. The self-modification rules alter coefficient values during
a run, so the finishing values of all coefficients are used to find the final best results that
describe the boom and bust periods of the system. This is even more important
because, through time we must assume that only two trends might prevail:
1. urban growth stabilizes, and in this case the final calibration values and the self-
modified values will converge;
2. urban growth increases.
Complexity, Emergence and Cellular Urban Models 109

Dow
nloa
ded
By:
[Cla
rke,
Kei
th] A
t: 19
:14
28 A
ugus
t 200
7
In the case of increased urban growth, the amplitude of urban growth from the final cali-
bration phase to the self-modification values might reflect the intensity of urban pressure in
the more recent periods. In both cases it is important to verify if the hierarchy of the coef-
ficients is the same for both final calibration and self-modification. If different, it might
imply among other things that we are heading to a different kind of metropolitan shape
and size (‘a new phase-transition’ or a ‘time symmetry breaking’).
In the model application for both Porto and Lisbon the parameter values changed from
{16,57,50,25,30} in the final calibration to {19,70,62,38,43} in self-modification in
Lisbon, and changed from {20,20,40,45,50} to {25,25,51,100,75} in Porto (Table 3).
We conclude that there were elements that caused a behaviour change, in other words,
the high investment in particular kinds of roads, and particularly high volumes of immigra-
tion, caused a discontinuity in the speed, direction, and shape of past growth, there-by,
signalling a phase-transition in the urban growth (Silva & Clarke, 2002; Silva, 2001).
In Porto the element that seems to contain urbanization from growing ubiquitously is the
slope factor. In the case of Lisbon, it seems that the most important element is the value of
Breed (which controls the creation of new-detached growing nuclei). These are the most
important elements controlling the behaviour of the both Lisbon and Porto Systems. Com-
parison of the values before and after self-modification for the Lisbon Metropolitan Area
does not reveal such a mutation, the values that seem to be predominant remain so.
Comparing behaviour parameters before and after self-modification for Porto it is poss-
ible to again verify that slope was the main growth control factor. If the amplitude of
values before and after self-modification reflects phase changes, another important
element that might also reflect such changes is the Road Gravity. In Porto, outward-
organic growth (spread) has higher values than Road Gravity; yet self-modification
increased the importance of roads in the behaviour of the system. Road Gravity moved
up to the second position of importance in the system after self-modification, from third.
Our analysis shows that the historical supposedly constant growth of the Porto Metro-
politan Area is instead ‘arrhythmic’ growth. Changes in the rate of growth seem to be
propelled by a different factor (new fast traffic lanes) and consequently suggest a new
phase-transition that probably will reshape the future scattered urban landscape of Porto.
Perhaps in the future we will observe a reorganization of activities and populations
accordingly to an increasing importance of highways in the system. If so what will the
Porto Metropolitan Area lose/win? More intriguing is to ask whether we can promote such
a kind of phase-transition in the future in order generate more sustainable urban forms? The
model, at least, gives us one platform on which to conduct experiments to this end.
Forecasts
Validity is a measure of how well the model captures the inherent qualities of a real system
in terms of replicability, prediction and structural integrity (Deadman, 1993: 154). For
policy makers and elected officials, modelling with CA has the potential to demonstrate
the outcome of policies before they are implemented, to evaluate alternative scenarios,
and to avoiding serious and irreversible errors. For researchers it is the chance to model
and understand a wide variety of natural and cultural phenomena contributing to the
process of land transformation (Wu, 1999: 202; Ward, 2000: 540).
If it is possible to verify validity, then the sustainability in future scenarios can be more
than a vague guideline. As Li points out (2000: 133) a new paradigm for thinking about
110 E. A. Silva & K. C. Clarke

Dow
nloa
ded
By:
[Cla
rke,
Kei
th] A
t: 19
:14
28 A
ugus
t 200
7
urban planning emerges. It is possible to embed some constraints in the transition rules of
cellular automata so that urban growth can be rationalized according to a set of pre-defined
sustainable criteria, and so explore a sustainable urban future through simulation.
In the case of the two metropolitan areas studied, the first hypothetical question posed
was: what if these metropolitan areas keep growing the same way (in a sort of trend scen-
ario – the same regional form, with the same elements constraining its behaviour)? What
would be the image of these regions 25 years in the future? Figures 6 and 7 present these
scenarios. It is possible to state that the cities’ historical characters are imprinted in the
Figure 6. One scenario of urbanization for the Metropolitan Area of Lisbon (AML). Besides the graybackground and dark gray, already visible in the previous images. Two other colours can be observedin this image, as a result of the Monte Carlo simulation: white cells inside the metropolitan areaboundaries represents median/low probability of change, or the formation of new urban nuclei,and black represents high probabilities of change to urban cells selection of 4 years for the yearly
simulation
Complexity, Emergence and Cellular Urban Models 111

Dow
nloa
ded
By:
[Cla
rke,
Kei
th] A
t: 19
:14
28 A
ugus
t 200
7
simulated future trend. Compared to the historically dispersed Porto, Lisbon’s forecast
growth continues to appear more organized toward the existent urban nuclei and along
main roads, which tend to generate new urban nuclei in high accessibility locations.
Besides these two overall urban patterns, other emergent patterns can be seen at the
regional scale. One pattern is the development of what is commonly known as ‘edge
cities’ (cities ‘born’ as a result of the transportation system, lacking the traditional old
central city, and having a ‘placeless’ nature). An example can be seen in the south-east
area of the Lisbon Metropolitan Area. Another emergent property seems to be the densi-
fication of urbanization in the northeast municipality (there is a new airport programmed
for nearby, the model without knowing, seems to reflect that). In the Porto Area, historical
characteristics seem to be the constant densification and growth of population over time
structured around an old transportation system (with narrow and highly intertwined
roads and transit lines). Nevertheless, the kind of transportation system (wider and
faster roads with a regional impact) now under construction will bring with it a different
kind of emergent urban pattern. Similarly, will more intense and regular boom and bust
phases, in a system historically characterized by constant and continuous growth, similarly
mark a phase transition in urban form (Silva & Clarke, 2001)?
The emphasis on the dynamics of development shows the importance of the contri-
bution of CA modelling to urban theory, in the empirical investigation of urban pressures
and prediction and decision support. One of its major contributions rests upon the import-
ance of developing and visualizing scenarios that support decision-making, and that
make the planning process more transparent (Xiang & Clarke, 2003; Barredo, Kasanko,
Mccormick Lavalle, 2003; Adam, 2003).
The forecasts for Porto and Lisbon highlight areas of high urban pressure, growth trends
that might be unsustainable, and give visions of metropolitan areas that might be more or
less compact, scattered, or with different levels of organization. These forecasts make the
public aware of the spatial organization of their metropolitan areas, and decision makers
Figure 7. One scenario of urbanization for the Metropolitan Area of Porto (AMP). Besides the graybackground, the dark gray, already visible in the previous images. Two other colours can beobserved in this image, as a result of the Monte Carlo simulation: white cells inside themetropolitan boundaries represents median/low probability of change, or the formation of newurban nuclei, and black represents high probabilities of change to urban cells selection of 4 years
for the yearly simulation
112 E. A. Silva & K. C. Clarke

Dow
nloa
ded
By:
[Cla
rke,
Kei
th] A
t: 19
:14
28 A
ugus
t 200
7
have the ability to adjust the results of planning according to the narrative of one or another
metropolitan future (i.e. more of less traffic congestion, natural resources preservation,
management of utilities).
Urban theory can gain from these developments. The importance of understanding the
critical decision points that lead to a specific urban form, the quantification of the com-
parative importance of the elements that structuring the metropolitan area, and the identi-
fication of phase transitions that might be shifting the metropolitan area’s future are some
of the relevant elements that require additional study and linkage to theory.
Conclusions
“There are two general approaches to the study of behavior in CA: 1. Start with specific
behaviors in mind and derive a function that will support those behaviors, 2. Start by spe-
cifying function and observe the resulting behavior” (Langton, 1986: 124). In this study,
we used the SLEUTH CA model (Clarke et al., 1997) to apply both ideas, through the use
of existing theory on how cities grow, and through the local behaviour of the system.
While we have favoured the second approach, with a slight adaptation the model can
adjust itself. Changing the parameter sets can allow the emergence of regional patterns
throughout micro-simulations, and self-adaptation to time variations. Experiments could
test what would happen if Lisbon were to adopt Porto’s planning strategy, for example.
Alternatively, Lisbon’s learned pattern of historical growth could be applied to Porto, to
explore what would have happened if it had been the nation’s capital. With informed plan-
ning as the goal, it might be best to explore enforced behaviour changes and their spatial
impacts; such as enforced conservation, growth management and smart growth planning
solutions as alternatives to the ‘business as usual’ forecasts.
The first parts of the paper pointed out the theoretical insights and formal requirements
of CA, emphasizing the importance of a simple process of finding out regional complex
forms by the understanding of local behaviour without any pre-knowledge of a global
structure or any prescribed or predetermined outcome (Wolfram, 1994; Clarke &
Gaydos, 1998; Batty, 1999). The application of SLEUTH to these very different metropo-
litan areas demonstrates this advantage of CA, in that without any prior knowledge of the
systems under study (besides the eight input layers) it was possible to characterize the
Lisbon and Porto Metropolitan Areas, spatially and temporally, with reasonable accuracy.
The ‘character’ of each metropolitan area was identified, as reflected in the dynamics of
the calibrated parameter set and its reaction to self-modification (Silva, 2001), through
the use of an analysis of the calibration process itself (Silva & Clarke, 2002). It was
also possible to define several emergent regional spatial patterns, such as the development
of new edge cities, and to date the phase changes in growth behavior. This is true both in
analyzing the past through the model, and in forecasting the future.
The concern expressed that by including modifications to the classical CA model, we
might be abusing the philosophy behind CA theory, is certainly fair (White, 2000;
Hastings, 1996; Huberman, 1993; Gowithz, 1991). Nevertheless, this is a question that
needs to be viewed in the light of model advances and the study of the social phenomena
dependent on urban dynamics. SLEUTH mirrors the elements that seem to make CA
attractive: that is building an understanding of complex systems through the analysis of
how local behaviour generates complex patterns. The comparative model application
revealed an emergent urban phenomenon in the ‘edge city’ form of Lisbon. While the
Complexity, Emergence and Cellular Urban Models 113

Dow
nloa
ded
By:
[Cla
rke,
Kei
th] A
t: 19
:14
28 A
ugus
t 200
7
adoption of self-modification into SLEUTH is considered by some as an adaptation that
might violate the original CA theory, nevertheless it seems to reinforce the value of CA
when applied across different landscapes.
Through self-modification it was possible to further improve the resemblance of the
simulation to the reality throughout calibration. The character of scattered populations
and activities that Porto had through the centuries (seems to be changing dramatically.
In the past, Porto’s growth was dominated mainly by spread and slope constraints). A
new factor is increasing its importance in the systems behaviour: the influence of roads
(as was observed by running self-modification rules). Therefore, self-modification
revealed new emergent elements, reinforced others and therefore further emphasizes the
original theoretical requirements.
Once applied to a region, SLEUTH ‘learns’ the region’s own characteristics, mirrors the
region’s own individuality, and reveals new emergent characteristics. We have referred to
this as both characterizing a region’s DNA, and analyzing how it is mutating and evolving.
Therefore testing the validity of the model and its strength create inherent structural vali-
dity. Through applying the model, more knowledge was gained that was evident from the
data that the model ingested. With further improvements in such models, planners and
geographers may finally have basic tools with which to explore the ‘genetic engineering’
necessary to evolve sustainable cities for the future.
Acknowledgments
This research is the result of two grants: between 1998-1999 from the Luso-America
Foundation (FLAD); and between 2000-2002 from the Portuguese National Science Foun-
dation (FCT-PRAXIS XXI). Work was conducted while the primary author was a visiting
scholar at the US National Science Foundation-funded National Center for Geographic
Information and Analysis at the University of California, Santa Barbara. We thank the
anonymous reviewers for suggestions and additions to the manuscript.
References
Anselin, L. (1999) Interactive Techniques and exploratory data analysis, in: P. Longley, M. Goodchild, D.
Maguaire, D. Rhind (Eds) Geographic Information systems. Volume 1. Principles and Techniques,
pp. 253–266. (New York: John Wiley and Sons, inc).
Batty, M., Yichun, X. & Zhanli, S. (1999) Modeling urban dynamics through GIS-based cellular automata, Com-
puters, Environment and Urban Systems 23, pp. 205–233.
Batty, M. (1997a) Cellular Automata and Urban Form: A primer, Journal of the American Planning Association,
63, (2), pp. 266–274.
Batty, M., Couclelis, H. & Eichen, M. (1997b) Editorial: urban systems as cellular automata, Environment and
Planning B: Planning and Design, 24, pp. 159–164.
Barredo, J., Kasanko, M., McCormick, Lavalle C. (2003) Modeling dynamic spatial processes: simulation of
urban future scenarios through cellular automata, Landscape and Urban Planning, 64, pp. 145–160.
Candau, J., Rasmussen, S. & Clarke, K. C. (2000) A coupled cellular automaton model for land use/land cover
dynamics. 4th International Conference on Integrating GIS and Environmental Modeling (GIS/EM4):
Problems, Prospects and Research Needs, Banff, Alberta, Canada, September 2–8.
Cardoso (1996) Do desenvolvimento do planeamento ao planeamento do desenvolvimento (Porto, Portugal:
Departamento de Engenharia Civil da FEUP, Edicoes Afrontamento)
Clarke, K. (1999) Visualizing Different Geofutures, in: P. Longley, S. Brooks, B. Macmillan & Mcdonnell (Eds)
Geocomputation: A Primer pp. 119–137. (London: Wiley).
Clarke, K. (2003) Geocomputation’s future at the extremes: high performance computing and nanoclients,
Parallel Computing, 29, (10), pp. 1281–1295.
114 E. A. Silva & K. C. Clarke

Dow
nloa
ded
By:
[Cla
rke,
Kei
th] A
t: 19
:14
28 A
ugus
t 200
7
Clarke, K. & Gaydos, L. (1998) Loose-coupling a cellular automaton model and GIS: long-term urban growth
prediction for San Francisco and Washington/Baltimore’, International Journal of Geographical Infor-
mation Science, 12 (7), pp. 699–714.
Clarke, K., Hoppen, S., & Gaydos, L. (1997) A self-modifying cellular automaton model of historical
urbanization in the San Francisco Bay area, Environment and Planning A: Planning and Design, 24,
pp. 247–261.
Couclelis, H. (1985) Cellular worlds: a framework for modeling micro-macro dynamics, Environment and Plan-
ning A, 17, pp. 585–596.
Crutchfield, J. & Mitchell, M. (1995) The evolution of emergent computation, Proc. National Academy of
Sciences – USA, 92, pp. 10742–10746.
Deadman, R. (1993) Modeling rural residential settlement patterns with cellular automata, Journal of Environ-
mental Management, 37, pp. 147–160.
Delorme, M. & Mazoyer, A. (1999) Cellular Automata. A Parallel Model (Dordrecht: Kluwer Academic Publishers).
Gardner, M. (1970) The fantastic combinations of John Conway’s new solitaire game ‘Life’, Scientific American,
233 (4), pp. 120–123.
Gaspar, J. (1997) Lisbon: Metropolis between center and periphery, in: C. Jensen Butler, A. Shachar & J. van
Weesep (Eds) European Cities in Competition, pp. 147–178 (Averbury, UK: Aldershot).
Goles, E. & Martinez, S. (1996) Cellular Automata and Complex Systems (Dortrecht: Kluwer Academic Publishers).
Goodchild, M., Haining, R. and Wise, S. (1992) Integrating GIS and spatial data analysis: problems and possi-
bilities, International Journal of Geographic Information Systems, 6 (5), pp. 407–423.
Goodchild, M. & Longley, P. (1999) The future of GIS and spatial analysis, in: P. Longley, M. Goodchild,
D. Maguire, D. Rhind (Eds) Geographic Information systems. Volume 1. Principles and Techniques,
pp. 567–580 (New York: John Wiley and Sons, Inc).
Gutowitz, H. (1991) Cellular Automata: Theory and Experiment (Cambridge, Massachusetts, USA: Bradford).
Hastings, A. (1996) Models of spatial spread: is the theory complete?, Ecology, 77 (6), pp. 1675–1679.
Hilbert, D. (1899) The foundations of geometry (Der Grundlagen der Geometry). Trans.: E.J. Townsed (Chicago:
Open Court).
Holland, J. (1995) Hidden Order. How adaptation builds complexity (Reading, Massachusetts, USA: Helix
Books).
Holland, J. (1999) Emergence: From Chaos to Order (Reading, Massachusetts, USA: Helix Books).
Hubernman, B. & Glance, N. (1993) Evolutionary games and computer simulation, Proc. National Academy of
Sciences – USA, 90, pp. 7716–7718.
Itami, R. (1988) Cellular Worlds. Models for Dynamic conceptions of landscape, Landscape Architecture, 78 (4),
pp. 52–57.
Kauffman, S. (1984) Emergent Properties in random complex automata, Physica D, 10, pp. 145–156.
Kauffman, S. (1993) Origins of Order. Self-Organization and Selection in Evolution (Oxford, UK: Oxford
University Press).
Langton, C. (1986) Studying artificial life with cellular automata, Physica D, 22, pp. 120–149.
Langton, C. (1995) Artificial Life. An Overview (Cambridge, Massachusetts, USA: Bradford & The MIT Press).
Lee, D. R. & Sallee, G. T. (1975) Method of measuring shape, Geographical Review, 60 (4), pp. 555–563.
Leonard, R. (1995) From Parlor Games to Social Science: von Neumann, Morgenstern and the Creation of Game
Theory 1928–1944, Journal of Economic Literature, 33, pp. 730–761.
Longley, P. & Mesev, V. (1997) Beyond analogue models: Space filling and density measurement of an urban
settlement, PAP REG SCI, 76 (4), pp. 409–427.
Li, X. & Yeh, A. (2000) Modeling sustainable urban development by the integration of constrained celular auto-
mata and GIS, International Journal of Geographical Information Science, 14 (2), pp. 131–152.
Openshaw, S. & Openshaw, W. C. (1997) Artificial intelligence in geography (Chichester: Wiley).
Park, S. & Wagner, D. (1997) Incorporating cellular automata simulators as analytical engines in GIS, Trans-
actions in GIS, 2 (3), pp. 213–231.
Philips, J. (1999) Divergence, Convergence, and Self-Organization in Landscapes, Annals of the Association of
American Geographers, 89 (3), pp. 466–488.
Portugal, J. & Benenson, I. (1995) Artificial planning experience by means of a heuristic cell-space model:
simulating international migration and the urban process’, Environment and Planning A, 27, pp. 1647–1665.
Prigogine, I. (1999) Laws of nature, probability and time symmetry breaking, Physica D, 263, pp. 528–539.
Prigogine, I. & Stengers, I. (1984) Order out of chaos. Man’s new dialogue with nature (Toronto, CA: Bantam
Books).
Complexity, Emergence and Cellular Urban Models 115

Dow
nloa
ded
By:
[Cla
rke,
Kei
th] A
t: 19
:14
28 A
ugus
t 200
7
Remark, R. (1929) Kann die Volkswirtschaftslehre eine exakte Wissenschaft Werden?, Jahrbucher fur Nationa-
lokonomie und Statistik, 131, pp. 703–35.
Resnick, M. (1995) Learning About Life, in: C. Langton (Ed) Artificial life. An Overview, pp 230–241
(Cambridge, Massachusetts, USA: Bradford & the MIT Press).
Rodrigues, D. (1999) Pressao construtiva nas areas metropolitanas em Portugal, in: Actas do VI Encontro Nacio-
nal da APDR, Regioes Cidades na Uniao Europeia: Que Futuro? Vol 1., pp 307–326 (Portugal: APDR).
Sanders, L., Pumain, D. & Mathian, H. (1997) SIMPOP: a multiagent for the study of urbanism, Environment and
Planning B: Planning and Design, 24, pp. 278–305.
Semboloni, F. (1997) An urban and regional model based on cellular automata, Environment and Planning B:
Planning and Design, 24, pp. 589–612.
Silva, E. & Clarke, K. C. (2002) ‘Calibration of the SLEUTH urban growth model for Lisbon and Porto,
Portugal’, Computers, Environment and Urban Systems, 26 (6), pp. 525–552.
Silva, E. (2001) The DNA of our Regions. Artificial Intelligence in Regional Planning, World Planning Schools
Congress (paper 5019), pp. 109, Shanghai.
Silva, E. (1999) Os efeitos estruturantes das vias de communicaaao na transofrmaaao dos usos do solo. Obser-
vaaaoo e estudo da Area Metropolitana de Lisboa (lisboa, Portugal: Patrimonia Geographica).
Sullivan, O. (2001) Exploring Spatial Processes dynamics using irregular cellular automata models, Geographi-
cal Analysis, 33 (1), pp. 1–18.
Tobler, W. (1979) Cellular Geography, in: Gale S. & Olosson, G. (Eds) Philosophy and Geography, pp. 279–386
(Dodrecht: D. Reidel).
Toffoli, T. (1998) Cellular Automata as an Alternative to (rather than an approximation of) differential equations,
Physica D, 10, pp. 117–127.
Toffoli, T. & Margolus, N. (1987) Cellular Automata Machines (Cambridge, Massachusetts, USA: MIT Press).
Vazques, I. (1989) A Evolucao da Cidade do Porto e a Estruturacao dos Concelhos Perifericos: Algumas consid-
eracoes sobre modalidades de articulacao territorial. Paper presented at the conference: O Porto na epoca
contemporanea, Porto, Portugal: Ateneu Comercial do Porto, ?
Viegas, J. (1989) Os sistemas de transporte numa Area Metropolitana em Portugal: desafios tecnicos e politico-
administrativos, in: Espaao Imperfeito – Area Metropolitana do Porto, As questoes do presente e do futuro,
pp. 277–287 (Porto, Portugal: Forum Portucalence).
von Neumann, J. (1966) Theory of self-reproducing automata (Urbana, USA: University of Illinois Press).
Wagner, D. (1997) Cellular Automata and geographic information systems, Environment and Planning B:
Planning and Design, 24, pp. 219–234.
Ward, D., Murray, A. & Phinn, S. (2000) A stochastically constrained cellular model of urban growth, Compu-
ters, Environment and Urban Systems, 24, pp. 539–558.
Webster, C. & Wu, F. (1999) Regulation, Land Use Mix, and Urban Performace. Part 2: Simulation, Environment
and Planning A, 31 (9), pp. 1529–1545.
White, R. & Engelen, G. (2000) High-resolution integrated modeling of the spatial dynamics of urban and
regional systems, Computers, Environment and Urban Systems, 24, pp. 383–400.
White, R., Engelen, G. & Uljee, I. (1997) The use of constrained cellular automata for high-resoltuion modeling
of urban land use dynamics, Environment and Planning B: Planning and Design, 24, pp. 323–343.
White, R. & Engelen, G. (1994) Cellular Dynamics and GIS: Modeling spatial complexity, Geographical
Systems, 1, pp. 237–253.
Wilson, A. (2000) Complex Spatial Systems: The Modeling Foundations of Urban and Regional Analysis
(Harlow, England: Prentice Hall).
Wolfram, S. (1994) Cellular Automata and Complexity. Collected Papers (Reading Massachusetts, USA:
Addison-Wesley Publishing Company).
Wolfram, S. (1984) Universality and complexity in cellular automata, Physica D, 10, pp. 1–35.
Wu, F. & Webster, C. (2000) Simulating artificial cities in a GIS environment: urban growth under alternative
regulation regimes, International Journal of Geographical Science, 14 (7), pp. 625–648.
Wu, F. (1999) GIS-based simulation as an exploratory analysis for space-time processes, Journal Geographical
Systems, 1, pp. 199–218.
Xang, W. & Clarke, K. (2003) The use of scenarios in land use planning, Environmental and Planning B, 30,
pp. 885–909.
Zermelo, E. (1912) Uber eine Anwendung der Mengenlehre auf die Theorie des Schachspiels (‘On the application
of Set Theory to the theory of Chessgames’), in: Proceedings of the Fifth International Congress of Math-
ematics, Cambridge, 22–28 Aug. 1912, 1913, II, 501–04.
116 E. A. Silva & K. C. Clarke