european union–developing country ftas: overview and … · european union–developing country...
TRANSCRIPT

World Development Vol. 33, No. 10, pp. 1545–1565, 2005� 2005 Elsevier Ltd. All rights reserved
Printed in Great Britain
0305-750X/$ - see front matterdoi:10.1016/j.worlddev.2005.05.006www.elsevier.com/locate/worlddev
European Union–Developing Country FTAs:
Overview and Analysis
JOSEPH F. FRANCOISErasmus University, Rotterdam, Netherlands
MATTHEW MCQUEENUniversity of Reading, UK
and
GANESHAN WIGNARAJA *
Asian Development Bank, Manila, Philippines
Summary. — This paper explores the complex structures of recent free-trade agreements (FTAs)between the European Union and developing countries, surveys the main factors determining theireconomic effects, and presents quantitative simulations of the effects of these agreements. Limita-tions of product coverage substantially reduce the potential benefits of the agreements comparedto full bilateral free trade, while only the Mexico, Chile, and Turkey agreements have trade relatedcommitments which are wider and deeper than the preferential reduction in tariffs. In the case ofEgypt, existing levels of protection mean that it is moving toward regional free trade with manydomestic distortions still in place, producing a significant loss for the Egyptian economy.
� 2005 Elsevier Ltd. All rights reserved.Key words — free-trade agreements, CGE modeling, European Union, developing countries
* This paper builds on a much larger study Maxwell
Stamp PLC (2003) supported by DFID. The authors are
grateful for helpful suggestions from Chris Milner, Tom
Hertel, Susan Prowse, and Jennifer Barugh, and to the
editor of this journal and four anonymous referees. They
are also grateful to Paul Bartlett for research assistance
and helpful suggestions. The usual disclaimer applies.Final revision accepted: May 6, 2005.
1. INTRODUCTION
The Uruguay Round Agreements and thecreation of the WTO have strengthened themultilateral trading system. At the same time,however, there has also been a proliferationof free-trade agreements (FTAs) in the worldeconomy. The European Union has been themajor driving force behind the spread of FTAsin the developing world in recent years. A com-bination of economic and political factors(including greater peace and stability in theEU hinterland, support for democratic reformsand the furthering of trade and investmentliberalization in developing countries, andaccessing new markets for EU exports), havemotivated the European Union to concludesuch agreements. For developing countries,the attraction has been preferential access tothe large EU market and the prospect of in-creased EU aid.
154
Against this background, this paper under-takes an analysis of the complex structure ofthese agreements and surveys the main factorsdetermining their economic effects. It then pre-sents a simulation of the quantitative effects offive European Union–developing partner FTAs(South Africa, Mexico, Chile, MERCOSUR, 1
and Egypt) and the customs union agreementin industrial products with Turkey. Five ofthese agreements have been concluded (SouthAfrica, Mexico, Chile, Turkey, and Egypt)
5

1546 WORLD DEVELOPMENT
while the one with MERCOSUR is, at the timeof writing, still being negotiated. It stresses thelikely economic effects on the trade, welfare,and economic structure of both parties of thesepreferential trading agreements, as well as theimpact on third countries. The quantitativeanalysis is built around the Global Trade Ana-lysis Project (GTAP) computable general equi-librium model and database (version 5.0) withan aggregation of 29 regions and 24 sectors. 2
Previous studies on the effects of EU-FTAsusing GTAP 5 or CGE models, such as thoseon South Africa (Lewis, Robinson, & Thierfel-der, 1999; McDonald & Walmsley, 2003), Tur-key (Alessandri, 2000; Harrison, Rutherford, &Tarr, 1996), and Egypt (Dessus & Suwa-Eisen-mann, 1998) have assumed full liberalizationbetween the partner countries. This paper goesbeyond the literature and simulates two alter-native policy scenarios within the model: (a)the actual European Union–developing coun-try FTA and (b) a full European Union–devel-oping country FTA (expanded to include theproducts currently excluded in the actualFTA) 3 and examines (a) in relation to (b).Section 2 discusses some key characteristics
of the EU’s trade agreement partners. Sections3 and 4 chart the spread of European Union–developing country FTAs since the mid-1990sand analyzes key aspects of the agreements.Sections 5 and 6 present the modeling resultson the overall effects of the trade agreements,and compare them with full free trade.
2. CHARACTERISTICS OF THE EU’STRADE AGREEMENT PARTNERS
The discussion starts with a brief examina-tion, using the GTAP 5 data (based on 1997),of the key characteristics of the EU’s tradingagreement partners. As shown in Table 1, col-
Table 1. GD
Country/region GDP($bn)
Agriculture(%)
Procfood
South Africa 139.1 4.2 7Mexico 388.8 7.3 9Chile 76.1 8.7 1MERCOSUR 1,134.7 7.9 1Turkey 192.4 11.4 8Egypt 70.2 13.2 4European Union 7,958.0 2.8 5
Source: GTAP 5.
lectively the MERCOSUR economies (domi-nated by Brazil) are the largest economyamong the six agreement partners. Mexico fol-lows this some way behind. Chile and Egypt arethe smallest, whereas Turkey and South Africafall in between these extremes. It is noteworthythat the total GDP of the six economies com-bined amounts to about a quarter of the GDPof the European Union.At the same time, there is a significant varia-
tion in the production structures of the sixagreement partners. MERCOSUR and Mexicoare the most industrialized whereas Chile is byfar the least. All the agreement partners havesignificant service economies (making uparound half of the GDP). Chile and Turkeyhave the largest agriculture and food processingsectors while the others have significant sharesof agriculture and food processing sectors. Bycomparison, the EU’s economy is dominatedby services and, to a lesser extent, manufactur-ing while its agricultural and food processingsectors have declined and account for a negligi-ble share of the economic activity.The individual developing countries are rela-
tively small trading partners for the EuropeanUnion and even when combined only accountfor 3.7% of total EU exports and 2.9% of totalEU imports (IMF Direction of Trade Statistics,2001). In contrast, the European Union is amajor export market for most of the agreementpartners. Hence, the European Union accountsfor 54.6% of exports in Turkey, 43.6% in Egypt,28.6% in South Africa, 25.2% in Chile, and23.8% in MERCOSUR (Table 2). Mexico, witha particularly high reliance on the US market(accounting for 90.7% of Mexico’s exports), isan exception with only 3.4%. On the importside, Turkey, South Africa, and Egypt haveparticularly strong ties with the EuropeanUnion (with between 37% and 50% of theirimports from the European Union) while the
P shares
essed(%)
Mining(% shares)
Manufacture(%)
Services(%)
.0 5.0 28.8 55.1
.5 3.8 34.2 45.22.0 3.9 23.5 52.00.1 1.3 34.3 46.2.3 0.8 26.6 52.8.6 3.8 27.5 50.8.5 0.4 29.1 62.3

Table 2. Composition of developing country exports to the European Union (% share)
Sector South Africa Mexico Chile MERCOSUR Turkey Egypt
Agriculture 11 7 12 24 9 12Processed food 9 4 15 26 2 1Mining 24 2 10 10 3 45Manufactures 56 87 63 39 86 42Totala 100 100 100 99 100 100
Source: GTAP 5; Egypt: Francois and Spinanger (2002b).a Total may not add up to 100 because of rounding.
EUROPEAN UNION–DEVELOPING COUNTRY FTAS 1547
three Latin American economies have some-what weaker ties (with between 9% and 20%of imports from the European Union).The commodity composition of EU exports
to the developing country partners and themake-up of their exports to the EuropeanUnion reflect endowments, historical ties, andtrade policies among other factors. The EU’sexports to the developing country partners aredominated by manufactures (in excess of 95%of total export value), and the pattern hasshown little change since the mid-1960s (Max-well Stamp PLC, 2003). Processed food prod-ucts (2–4%) and agricultural items (around1%) make-up a tiny share of the EU’s exportsto the six developing countries. There are alsosmall shares of EU mining exports to Turkey.In contrast, there has been a marked struc-
tural transformation in the export patterns of
Table 3. EU trade weighted bilateral import tar
Sector South Africa Mexico
Agriculture 12 15Processed food 41 29Mining 0 0Manufactures 2 4Services 0 0
Source: GTAP 5.a Ad valorem rate.
Table 4. Developing country trade weighted bilate
Sector South Africa Mexico
Agriculture 21 6Processed food 72 30Mining 0 6Manufactures 8 10Services 0 0
Source: GTAP 5; Egypt: Francois and Spinanger (2002b).a Ad valorem rate.
the EU’s partner countries over the same peri-od (see Table 2 for data on selected partners).This is associated with the rapid rise of manu-facturers and a decline in the share of agricul-ture and processed food products. The shareof manufactures in total exports increased from30% to 87% in Mexico, 8% to 86% in Turkey,11% to 56% in South Africa, and 2% to 39%in MERCOSUR. Although Chile’s exportsare also dominated by manufacturers (63%),there has been a notable decline in this categoryfrom 1965 levels and a rise in processed food,agricultural products, and mining.Data on bilateral trade weighted average tar-
iff rates 4 levied by the European Union againstfive developing country partners and similarones levied by all six developing country part-ners against the European Union are shownin Tables 3 and 4. There is a distinct pattern
iffs against FTA developing country partnersa
Chile MERCOSUR Turkey Egypt
14 5 12 n/a23 30 27 n/a0 0 0 n/a1 4 9 n/a0 0 0 n/a
ral import tariffs against the European Uniona
Chile MERCOSUR Turkey Egypt
11 10 11 811 18 43 1212 2 1 511 15 7 220 0 0 0

1548 WORLD DEVELOPMENT
of import protection in the European Unionagainst developing country products. TheEuropean Union seems to be providing a rela-tively high import protection for declining sec-tors such as processed food and agricultureand a relatively low protection for manufactur-ing, one of its leading sectors. There is alsosome variation by country within this generalpattern. For instance, South Africa seems toface the highest import duties against food pro-cessing exports and Chile, the lowest. Further-more, Mexico and Chile confront relativelyhigh protection against agricultural items.There is relatively little variation in low protec-tion rates against manufacturers, and duties onEU imports of manufactures from Turkey havenow been phased out under the customs unionagreement.More variation is visible in protection levied
by developing countries against the EuropeanUnion. Interestingly, Chile has remarkablylow uniform rates of import protection ofaround 11% (12% for mining) for most catego-ries of EU imports. However, the other devel-oping countries have much higher ratesagainst EU imports. South Africa seems tohave relatively high rates particularly for pro-cessed food (72%) and agricultural products(21%) while MERCOSUR and Egypt havequite high rates for manufacturers. Mexico lev-ies relatively high rates for processed food, butnot for agricultural goods or manufacturers.Turkey has relatively low rates for most prod-ucts (notable only 7% for manufactures) exceptprocessed food.
3. THE SPREAD OF EU TRADEAGREEMENTS
The European Union has, since 1995, beencentral to the proliferation of trade agreementsin the world economy. Details of the agree-ment, which have been concluded, or are cur-rently, being negotiated (with the exceptionof the long-standing negotiations with theGCC States) are given in Table 5. They showthat the European Union has agreements, oris in the process of negotiating agreements,with the Middle East and North African(MENA) countries, a substantial proportionof Latin America, the African, Caribbeanand Pacific countries, and South Africa. Acommon feature of the agreements is thereplacement of unilateral preferences with reci-procal preferences.
The reasons for this change of trade policytoward the developing countries have beenderived from political, economic, and legalconsiderations; the precise mix of these threecomponents varying according to the primaryobjectives of the agreement.Legal considerations principally derived from
the Uruguay Round Agreements of 1994,which strengthened the ‘‘rules based’’ systemof international trade and focused attentionon the incompatibility of the EU’s unilateralpreferences for the MENA and ACP countrieswith the WTO Agreements (McQueen, 1998).Political considerations have been particu-
larly important in the FTAs with the MENAcountries, where the EU’s Barcelona Declara-tion in 1995, which launched the Euro-Mediter-ranean Partnership Agreements, explicitlyreferred to the need to create greater socialand economic stability and economic conver-gence with the European Union in a region ofvital interest to the security of the EuropeanUnion. Nonreciprocal preferential trade agree-ments were seen as having failed to achievethese objectives, whereas FTAs (leading to theestablishment of a Euro-Mediterranean FreeTrade Area by 2010), being reciprocal, of indef-inite duration, and binding on both parties,would accelerate economic development. Notonly would they provide both parties with agreater certainty of preferential treatment and,it was hoped, therefore increase trade andinvestment, but they were also envisaged asproviding greater opportunities for deepeningcooperation on a bilateral basis than was possi-ble within a multilateral framework (EuropeanCouncil, 2000). In addition, since the costs ofterminating the agreement would be high forany MENA country, the agreements were seenas ‘‘locking in’’ essential trade and structuralreforms in these countries.Economic considerations have primarilymoti-
vated the agreements with Mexico, Chile, andMERCOSUR. First, to meet the competitivechallenge posed by the United States underNAFTA and the possible establishment of theFTA, and to provide a platform for EU exportsto North and South America. Second, particu-larly in the case of MERCOSUR (which aimsto complete the formation of a single market by2005), to preserve EUmarket shares and expandinto new areas of exports, including services(European Commission, 2000, 2001). More gen-erally, the fact that all of the EU’s agreementscover a wide range of trade related issues, suchas customs cooperation and rules of origin, com-
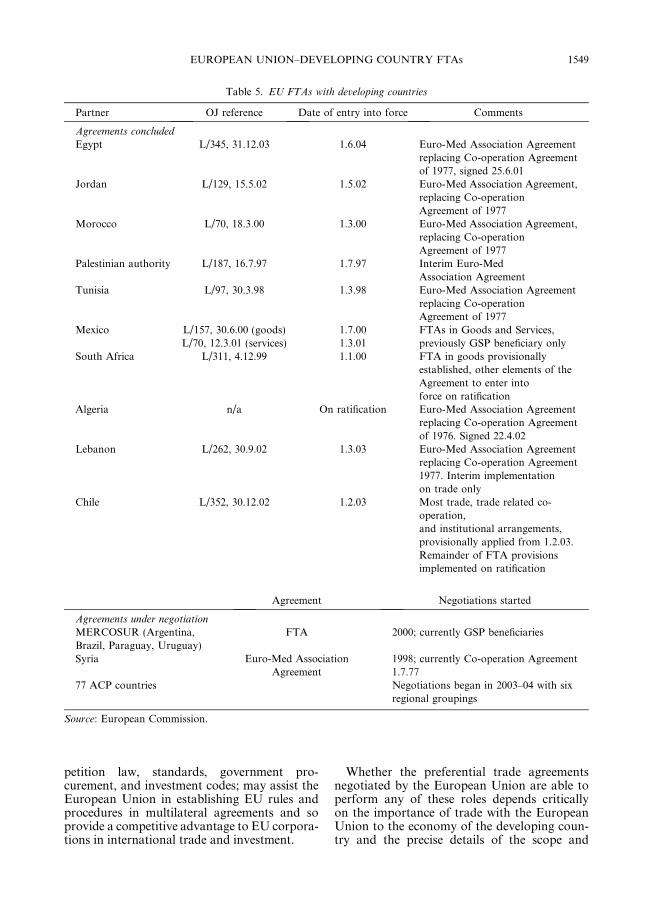
Table 5. EU FTAs with developing countries
Partner OJ reference Date of entry into force Comments
Agreements concluded
Egypt L/345, 31.12.03 1.6.04 Euro-Med Association Agreementreplacing Co-operation Agreementof 1977, signed 25.6.01
Jordan L/129, 15.5.02 1.5.02 Euro-Med Association Agreement,replacing Co-operationAgreement of 1977
Morocco L/70, 18.3.00 1.3.00 Euro-Med Association Agreement,replacing Co-operationAgreement of 1977
Palestinian authority L/187, 16.7.97 1.7.97 Interim Euro-MedAssociation Agreement
Tunisia L/97, 30.3.98 1.3.98 Euro-Med Association Agreementreplacing Co-operationAgreement of 1977
Mexico L/157, 30.6.00 (goods) 1.7.00 FTAs in Goods and Services,previously GSP beneficiary onlyL/70, 12.3.01 (services) 1.3.01
South Africa L/311, 4.12.99 1.1.00 FTA in goods provisionallyestablished, other elements of theAgreement to enter intoforce on ratification
Algeria n/a On ratification Euro-Med Association Agreementreplacing Co-operation Agreementof 1976. Signed 22.4.02
Lebanon L/262, 30.9.02 1.3.03 Euro-Med Association Agreementreplacing Co-operation Agreement1977. Interim implementationon trade only
Chile L/352, 30.12.02 1.2.03 Most trade, trade related co-operation,and institutional arrangements,provisionally applied from 1.2.03.Remainder of FTA provisionsimplemented on ratification
Agreement Negotiations started
Agreements under negotiation
MERCOSUR (Argentina,Brazil, Paraguay, Uruguay)
FTA 2000; currently GSP beneficiaries
Syria Euro-Med AssociationAgreement
1998; currently Co-operation Agreement1.7.77
77 ACP countries Negotiations began in 2003–04 with sixregional groupings
Source: European Commission.
EUROPEAN UNION–DEVELOPING COUNTRY FTAS 1549
petition law, standards, government pro-curement, and investment codes; may assist theEuropean Union in establishing EU rules andprocedures in multilateral agreements and soprovide a competitive advantage to EU corpora-tions in international trade and investment.
Whether the preferential trade agreementsnegotiated by the European Union are able toperform any of these roles depends criticallyon the importance of trade with the EuropeanUnion to the economy of the developing coun-try and the precise details of the scope and

1550 WORLD DEVELOPMENT
content of the agreements and their enforce-ment mechanisms.
4. KEY ASPECTS OF EUROPEANUNION–DEVELOPING COUNTRY
AGREEMENTS
(a) The structure of the agreements
A synopsis of the general structure of theEU’s agreements with selected developingcountries is given in Table 6.It is important to appreciate that these agree-
ments are substantial documents often coveringover 1,000 pages of text and annexes and so thetable can only provide a brief guide to a morecomplex reality. It does, however, illustratetwo important features: First, the agreementsfall short of establishing ‘‘free trade’’ in the nor-mal sense of the term. Second, the agreementscover considerably more that just concessionson tariffs.
(b) Liberalization of trade in goods
A basic dilemma facing EU negotiators ofthese FTAs is that, according to their negotiat-ing mandate, they must not undermine thefinely tuned border protection of the CAPand the Common Fisheries Policy. At the sametime, they must ensure that the agreement iscompatible with Article XXIV of GATT1994, particularly Section 8 requiring coverageof ‘‘substantially all trade’’ and the Under-standing on Article XXIV (especially the pre-amble which states that ‘‘no major sector isexcluded’’). The European Union seeks to re-solve this dilemma by interpreting WTO rulesas requiring free trade to be established on90% of the total bilateral trade flows. SinceEU tariffs on most industrial products are zeroor very low (exceptions are, for example, cloth-ing and motor vehicles) the European Unionhas little difficulty in liberalizing imports ofall, or practically all, industrial products. Also,since imports of agricultural products and fish-eries are limited by (sometimes prohibitive)border protection they account for only a smallproportion of existing total imports from thepartner country. As a result, the EuropeanUnion is able to make a sufficient contributionto the fulfillment of the 90% criteria by fully lib-eralizing imports of manufactured goods but,as shown in Table 6, only around 60% of its im-ports of agricultural products. Similar calcula-
tions, it is argued by the European Union,also enables the partner country to protect sen-sitive industrial and agricultural sectors of itseconomy while remaining within the EU’sinterpretation of requirements of Article XXIV.The liberalization of trade in industrial prod-
ucts almost invariably covers all of the EU’simports from the partner country, and in thecase of Egypt and Mexico, similarly covers allof their imports of industrial products fromthe European Union. Since the customs unionagreement in industrial products with Turkeyaims at eventual membership of the EuropeanUnion, the agreement covers the abolition ofduties on all industrial products by both par-ties. It is only in the case of the agreement withSouth Africa that 87% of its imports from theEuropean Union are liberalized with theremaining 13% being listed for future consider-ations.Tariffs are almost invariably higher in the
developing countries and so the transitionalperiod to free trade in industrial products isasymmetric, with the EU liberalization sche-dule being of a shorter duration than that ofthe partner developing country. In the case ofSouth Africa and Egypt, this has been set at12 years (15 years for imports of motor vehiclesin the case of Egypt). This enables the develop-ing country to spread the adjustment to freetrade in industrial products over a longerperiod of time and enables the Government ofthat country to reduce its dependence onimport taxes and restructure its sources ofrevenue. It is only in the case of Mexico thatthe pace of tariff reductions is a relatively shortperiod of seven years, while free trade in indus-trial products has already been establishedbetween the European Union and Turkey.The pattern of tariff reductions in the devel-
oping country usually takes the form of dutieson capital and intermediate goods being abol-ished before those on final consumer goods,which are also subject to significantly higherinitial duties and which are only liberalized to-ward the end of the transitional period.It is in the area of trade in agricultural and
fishery products that the agreements fall sig-nificantly short of free trade. The EuropeanUnion routinely excludes or strictly limitsconcessions on products such as beef, sugar, arange of dairy products, some cereals and cer-eal products, rice, some fresh fruits and vegeta-bles, some cut flowers, and fishery products.The partner developing country also excludesa range of agricultural products, not least to

Table 6. Structure of EU FTAs with selected developing countries
Egypt South Africa Mexico Turkey
RationaleEuropean Union Security Reinforce democracy
regional hubAccess to NAFTAregional hub
Customs Union agreement inindustrial products. Objective ofmembership if European Union
Partner Maintain preferences.Lock-in reforms. Attract FDI
Improve access to EUmarket. Attract FDIlock-in reforms
Reduce dominance ofUnited States. Improveaccess to EU market.Attract FDI
Transitional periodEuropean Union Immediate 10 years 10 years Turkey’s customs legislation
now almost same as European UnionPartner 12/15 years 12 years 12 years
Ind. coverageEuropean Union All Almost all, most by 2006 All by 2003 AllPartner All, >half by year 4, end
weighted on themost protected
87%, and end weighted All by 2007,most by 2003
All
Agric. coverageEuropean Union Approximately 60%+ of imports, entry prices, plus preferences within tariff
quotas. Sometimes concessions on ad valorem but not specific dutiesSeparate preferential agreement coveringrange of products, some with tariff quotas
Partner Very limited; some dutyreductions within tariff quotas
Substantial; some winessubject to tariff quotas
Some for example,dairy, tobacco,processed foods
Rules of origin EU rules. Bilateral cumulation with European Union. Derogations can be requested EU rulesPart MEDAcumulation an objective
Full SACU cumulation.Partial SADC cumulationwith one country
Relaxation in somesectors due to lack ofraw materialsand components
Safeguards Standard EU clause for both parties + transitional arrangements for partner EU rulesAntidumping Standard WTO rulesIntellectualproperty rights
Protected under TRIPS plus list of international agreements Special Committeeto solve difficulties
TRIPS + list of internationalagreements
(continued next page)
EUROPEAN
UNIO
N–D
EVELOPIN
GCOUNTRY
FTA
S1551

Table 6—continued
Egypt South Africa Mexico Turkey
Competition rules Outlaws collusion/abuse ofdominant positionof enterprises which distortscompetition in trade(except for ECSC products)
Each retain own rules.Outlaws collusion/abuseof market power etc.Co-operation + EU assistance
Own laws. Detailedstatement on Co-operation.Technical assistance
EU policy
State aids Must not distort competition in trade between the European Union and partner but are permissible for public orpolicy objectives (European Union. Article 92)
Public procurement Consultation withaim of liberalization
‘‘fair, equitable,and transparent’’
National treatment andnondiscrimination phasedover 10 years except for somepublic utilities and transport
Agreement to be reached in the future
Rights ofestablishmentand services
GATS plus possibility of further liberalization Trade in most servicesliberalized + most modesof supply by 2004. Transitionalperiod of 10 years. Nationaltreatment
National treatment. Services Agreementunder negotiation
Capitalmovements
Capital relating to direct investment plusinterest profits and dividends can move freely
Program of liberalizationrelating to investment +protection of investment
Export of large sums fromTurkey unclear
Standards Aim of reducing differences (especially SPS)and mutual recognition
Co-operation. SpecialCommittee on SPS measures
Working toward implementationof EU rules
1552WORLD
DEVELOPMENT

Custom cooperation,institutions
For example; exchange of information, introduce single administrationdocument, simplification of controls, and procedures forclearance, co-operation on Rules of Origin
EU commercial policy and rules
Joint European Union/Partner Association/Co-operation Council at ministerial levelsupported by committees (high official) and technical working groups
Association Council
CU Joint Committee. JointConsultative Committee
Dispute settlement Association council by ‘‘decision’’or by arbitration binding on bothparties. No time limit orenforcement procedures
Coop. Council or arbitration.Stages time limited. Noenforcement procedures
Joint Committeeor arbitration. Rulesfor procedures, timelimited, stages,compensation
Association Council or Arbitration
General Political dialogue, social and cultural co-operation, democratic principles and respect for human rights, scientific,technical and technological co-operation
Other Money laundering,drug trafficking, migrantworkers and illegalimmigration, regionalintegration
Wine and spiritsagreement, fisheries(not concluded),Regional co-operation
Turkey to adopt all of EU’spreferential trade agreements
Source: Table 5, column 2; Turkey: European Communities (1996, 1998).
EUROPEAN
UNIO
N–D
EVELOPIN
GCOUNTRY
FTA
S1553

1554 WORLD DEVELOPMENT
protect their agriculture from imports of subsi-dized agricultural goods from the EuropeanUnion such as, beef, sugar, dairy products,and cereals. As a result, in the case of the agree-ment with Mexico, only 62% of bilateral tradein agricultural products is fully liberalized,while in the case of the agreement with SouthAfrica 62% of EU imports are liberalized whileSouth Africa fully liberalizes 82% of its importsfrom the European Union. No comparablefigures are published for trade in agriculturalproduces with Egypt or Turkey.In addition, the European Union also makes
some concessions in terms of reductions orthe abolition of duties within tariff quotas. Inthe case of fruits and vegetables (which areparticularly important exports for the Medi-terranean countries and South Africa), theEuropean Union maintains in all of itsagreements, the restrictions of the minimumentry price regime and calendar restrictions,although concessions may be made in eitheror both of these restrictions. The result is avery complex combination of EU preferencesin agricultural products which may includetariff reductions, with or without quotas orthe possibility of reference quantities being de-fined; reduced tariffs for quantities outside thequotas; reduced entry prices with or withoutquotas; all of which may be limited withincalendar periods with the possibility of conces-sions here as well. The existence of tariff quo-tas also raises the question of who benefitsfrom the quota rents. It is therefore very diffi-cult to make valid generalizations about theeffects of this finely tuned system of protectionin terms of the extent to which the preferences(which, in any case, are relative to those givento other countries) are capable of stimulatingincreased exports from the beneficiary devel-oping countries. Broadly speaking, it wouldappear that the Mediterranean countries haveobtained tariff decreases without strong quan-titative restrictions for the majority of their ex-ports (Grethe & Tangermann, 1999), while thetariff quotas in the FTA for Egypt are signifi-cantly higher than the tariff quotas which theyobtained under the previous Co-operationAgreement. However, the existence of theserestrictions will inevitably affect the produc-tion and export decisions of producers andsimple comparisons of tariff quotas with exist-ing trade flows cannot provide a true indica-tion of the degree of restriction imposed bythe import regime of the European Union.All of the agreements have a review clause
(usually three years after the implementationof the agreement) to consider whether prefer-ences may be increased.Processed agricultural products obtain a
reduction in the agricultural element of protec-tion commensurate with the preferences for theraw materials used in production, but this is‘‘likely to be quite insignificant for the size ofthe preference margin’’ (Grethe & Tanger-mann, 1999).Agricultural products are not included in the
Customs Union Agreement with Turkey, butsince the objective is full membership of theEuropean Union, both Parties have agreed toprogressively improve their preferential regimein the agricultural sector with the objective ofallowing Turkey to adapt its agricultural pol-icy to that of the Common Agricultural Policy.It should be noted, however, that no time scalehas been placed on this process and that thesystem of preferences does not ‘‘restrict inany way the pursuance of the respective agri-cultural policies of the Community in Tur-key.’’ In addition, both countries have asafeguard clause which can be activated if‘‘either quantities or the prices of importedproducts from the other Party in respect ofwhich a preferential regime has been created,causes or threatens to cause a disturbance ofthe Community or the Turkish market.’’ TheCommission estimates that 93% of Turkey’sagricultural exports to the European Unionand 33% of EU agricultural exports to Turkeyare covered (i.e., obtain concessions) by the1998 scheme of preferences.Preferences in fisheries are variable and in the
case of South Africa, preferences are condi-tional on the latter concluding a FisheriesAgreement, which would, among other conces-sions, give EU vessels access to South Africanwaters. To date, negotiations between theEuropean Union and South Africa have beenterminated without agreement. In the case ofChile, the European Union will eliminate tariffson 91% of fish imports over the 10-year transi-tion period.
(c) Rules of origin
All preferential trade agreements requirerules of origin to prevent trade deflection (im-ports from third countries receiving preferentialtreatment) and the European Union insists onits own rules of origin being applied in all ofits preferential trade agreements. When all ofthe inputs used in production originate in the

EUROPEAN UNION–DEVELOPING COUNTRY FTAS 1555
partner counter, there are clearly few problemsin determining the origin. When processing ormanufacturing uses imported intermediatematerial in production, clearly the definitionof an originating product becomes more com-plex since both parties will wish to exclude frompreferences, third country goods which haveundergone only superficial working or process-ing in the partner country.The EU rules are based on process criteria
which start with the general rule that sufficientworking or processing is obtained when theproduct being considered for preferential treat-ment is classified in a different four-digit HStariff heading from all of the nonoriginatingmaterials or component used in production(the CTH rule). Since, however, the Harmo-nized System was not designed to provide adefinition of sufficient working or processing,this rule is supplemented by a ‘‘Single List’’covering a very substantial number of productswhere specific conditions must be fulfilledrather than the CTH rule. These conditionsset out definitions and specify one or more ofthe following: (a) the starting material(s) usedin production which must originate from thepartner country, (b) permitted nonoriginatingmaterials, (c) combinations of the two, (d) max-imum percentage for nonoriginating inputs(typically 40% or 50% or the ex-works priceof the product).The European Union has been subjected to a
considerable degree of criticism over the pastfew decades in going beyond the legitimate pur-pose of rules of origin in preventing tradedeflection and using them as a means of importprotection (Ghoneim, 2003; McQueen, 1982).Developing countries, particularly in the Medi-terranean region and Africa, have a relativelysmall manufacturing base and many exportersfind it very difficult if not impossible to meetthe implicit or explicit levels of local value-added required by the rules of origin. They alsomake little sense in a world of internationalproduction and where one of the objectives ofthe agreements is to integrate these economiesmore fully into the world economy.The European Union seeks to mitigate the
restrictive effect of the rules of origin by allow-ing a partner country to count imports fromthe European Union of intermediate productsused in production as ‘‘originating’’ products(bilateral cumulation). The difficulty, however,is that if the European Union is not the mostefficient source of supply, then bilateral cumula-tion will cause trade diversion. It should also be
noted that the combination of restrictive rulesof origin with bilateral cumulation reinforcesthe ‘‘hub-and-spoke effect’’ of the agreements,reducing the overall gains from trade and con-centrating them in the European Union.The European Union also allows a degree of
regional cumulation of origin among approvedgroups of developing countries. The agreementwith Egypt, for example, allows materials orig-inating in Algeria, Cyprus, Israel, Jordan, Leb-anon, Malta, Morocco, Syria, Tunisia, Turkey,the West Bank, and the Gaza Strip, to count asoriginating in the Community or Egypt whenincorporating into a product produced inEgypt. The difficulty with this ‘‘diagonal cumu-lation’’ is that the imported intermediate prod-ucts have to have acquired originating status inthe partner country in accordance with theEU’s rules of origin. Diagonal cumulation alsorequires 100% value added in Egypt to thematerials used from the partner country. Therewould also appear to be some degree of varia-tion in the rules for diagonal cumulation. Forexample, the agreement with South Africa onlyallows cumulation with one (ACP) partnercountry and not to the regional group (SADC)as a whole. Full cumulation is only permittedamong the SACU countries. Again, as arguedby McQueen (2002), the system, appears de-signed to promote hub-and-spoke relationshipswith the European Union.Additional flexibility is provided by the ‘‘tol-
erance levels’’ of 15% of the ex-works price ofthe finished product and by the possibility of‘‘derogations’’ from the rules of origin. How-ever, the operation of the Lome Convention/Cotonou Agreement over the past 30 yearsdemonstrates that the derogation proceduresare costly to use, highly restrictive in their oper-ation, and are of little practical use.In an interesting departure from its normal
stance that the rules of origin are non-negotia-ble, the European Union has allowed Mexicosome potentially significant relaxations in ex-change for a ‘‘considerably larger market accesspackage’’ for the European Union. These con-cessions have been made to take account ofthe lack of raw materials and components inMexico, (while avoiding ‘‘simple assembly’’)and apply to certain sections of chemicals, com-ponents, and machinery. For other sectors suchas clothing, vehicles, and complex car partssuch as engines and chassis, a transitional relax-ation of EU rules has been agreed to give timefor Mexican industry to adapt to the EU rulesorigin.

1556 WORLD DEVELOPMENT
(d) Other trade related issues
An important argument in support of FTAsis that because they are restricted to the partnercountries to the agreement, they encourage dee-per forms of trade liberalization than would bepolitically feasible within the nondiscrimina-tory WTO framework. Successful implementa-tion of the FTA may then encourage thesubsequent generalization of key elements ofthe agreement on a multilateral basis. In this re-spect, Table 6 shows that the agreements aredisappointing, although it should be noted thatin the special case of the customs union agree-ment in industrial products with Turkey, stren-uous efforts are being made to conform to EUlaws in preparation for eventual membershipof the European Union. Despite covering com-petition law and subsidies insofar as they affecttrade between the partner countries, each side,in addition, retains the right to use the protec-tionist WTO procedures on Antidumping andCountervailing Measures and the Agreementon Subsidies and Countervailing Measures.All of the agreements include a variety of pro-visions, which could significantly lower fric-tional barriers to trade and increase certaintyof treatment, such as the harmonization ofstandards, certification, quality assurance, andenforcement procedures. None of the agree-ments, however, includes a timetable for theseimprovements, far less for the mutual recogni-tion of standards and procedures. In addition,although there are dispute settlement proce-dures, both parties retain the right to substitutethe more limited WTO Disputes Settlementprocedures. Similarly, empirical evidence sug-gests that substantial gains could accrue tothe developing country partners from the inclu-sion of services and rights of establishment inthe FTAs (Hoekman & Konan, 1999). Onlythe agreements with Mexico and Chile providefor a substantial liberalization of services, whilethe Euro-Med Agreements and the FTA withSouth Africa merely state that this is an objec-tive for negotiation at an unspecified time in thefuture.A further potential ‘‘nontraditional’’ gain
(Fernandez & Portes, 1998) from these agree-ments is to provide credibility to the economicreforms of the government of the developingcountry because, it is argued, they ‘‘lock in’’ lib-eralization measures and sound economic poli-cies (see, e.g., Collier & Gunning, 1995). It isalso argued that scheduling the abolition oftrade restrictions with the European Union sig-
nals to the world that the developing countryconsiders that it will be able to compete withEU imports. None of the EU’s agreements,however, cover macroeconomic policy, privati-zation, and deregulation, while only the agree-ments with Mexico and Chile make specificprovisions for the liberalization of certainpublic procurement markets. In addition, theagreements include the EU’s standard safe-guard clauses against preferential importswhich cause or threaten to cause serious diffi-culties to a sector or region in either country.The extent of ‘‘credibility’’ or ‘‘signaling’’ con-ferred by the agreements has therefore beenquestioned (McQueen, 2002) both in terms ofthe exclusions and limitations of the agree-ments and the plausibility of the EuropeanUnion enforcing the agreement on a developingpartner country at a time when it is probablysubject to severe economic problems.
5. EMPIRICAL ANALYSIS OF THEACTUAL AGREEMENTS
(a) Methodology
The effects of the FTAs have been estimatedthrough the application of a global generalequilibrium model that reflects post UruguayRound trade policy data. The model is charac-terized by an input–output structure (based onregional and national input–output tables) thatexplicitly links industries in a value-addedchain from primary goods, over continuouslyhigher stages of intermediate processing, tothe final assembling of goods and services forconsumption. Intersectoral linkages are direct,like the input of steel in the production oftransport equipment, and indirect, via interme-diate use in other sectors. The model capturesthese linkages by modeling firms’ use of factorsand intermediate inputs. The most importantaspects of the model can be summarized as fol-lows: (i) it covers all world trade and produc-tion; (ii) it allows for medium- to long-runinvestment effects on the installed stock of cap-ital; (iii) it includes intermediate linkages be-tween sectors.Our data come from a number of sources.
Data on production and trade are based onnational social accounting data linked throughtrade flows (see Reinert & Roland-Holst, 1997).These social accounting data are drawn directlyfrom the GTAP dataset (Dimaranan &McDougall, 2002). The GTAP version 5 data-
EUROPEAN UNION–DEVELOPING COUNTRY FTAS 1557
set is benchmarked to 1997, and includes de-tailed national input–output, trade, and finaldemand structures. The basic social accountingand trade data are supplemented with tradepolicy data, including additional data on tariffsand nontariff barriers. Post Uruguay Roundstariff data are from Francois and Strutt (1999)while ATC quota price wedges are from Franc-ois and Spinanger (2002a). Remaining UruguayRound tariff and quota commitments are im-posed on the benchmark data before policyexperiments are conducted. Data are aggre-gated into 24 sectors and 30 regions (listed inTables 7 and 11). Egypt is not in the coreGTAP database, and so we model the Egyptagreement on the basis of a modified versionof the database that also includes an estimatedSAM for Egypt for 1997, and mapped to thesame model (see Francois & Spinanger,2002b). NTBs are modeled as export taxes fortextiles and clothing (though we remove thetextile and clothing protection as part of thebaseline), and as a mix of import and exporttaxes in agriculture (see Dimaranan & McDou-gall, 2002, for specific details).Computationally, our starting point is the
standard version of the GTAP model, modifiedto include savings–investment linkages. This isa multisectoral model with sectors linked di-rectly through intermediate linkages and indi-rectly through factor market demands andincludes an explicit treatment of productionand bilateral trade flows (Brockmeier, 2001;Hertel, 1997). The effects of the FTAs comprisethe static effects (where resources are fixed),corresponding to the combination of efficiencyand consumption gains emphasized in tradetheory, and dynamic effects which incorporatethe medium- and long-run linkages betweenthe FTAs, changes in the level of investment,and consequent changes in the capital stock(see Francois, McDonald, & Nordstrom, 1996).In all regions there is a single representative,
composite household in each region, withexpenditures allocated over personal con-sumption and savings (future consumption)and over government expenditures. The com-posite household owns endowments of the fac-tors of production and receives income byselling them to firms. It also receives incomefrom tariff revenue and rents accruing from im-port/export quota licenses (when applicable).There is an implicit nondistortionary incometax in the model that adjusts to replace revenuelost by tax reductions, such as tariff reductions.Part of the income is distributed as subsidy
payments to some sectors, primarily in agricul-ture. Welfare effects are calculated as equiva-lent variation to the policy experimentsconsidered, based on the estimated impact onprices and incomes.On the production side, in all sectors, firms
employ domestic production factors (capital,labor, and land) and intermediate inputs fromdomestic and foreign sources to produce out-puts in the most cost-efficient way that technol-ogy allows. Perfect competition is assumed, andproducts from different regions are assumed tobe imperfect substitutes in accordance with theso-called ‘‘Armington’’ assumption. Prices ongoods and factors adjust until all markets aresimultaneously in (general) equilibrium. Thismeans that we solve for equilibria in which allmarkets clear. Our macroeconomic closureinvolves a fixed net capital account. Hence,while we model changes in gross trade flows,we do not model changes in net internationalcapital flows. Rather our capital market closureinvolves fixed net capital inflows and outflows.This does not preclude changes in gross capi-tal flows. (See the Hertel, Ianchovichina, &McDonald, 1997, discussion on macroeco-nomic closure. The present approach facilitateswelfare analysis.) To summarize, factor mar-kets are competitive, and labor and capitalare mobile between sectors but not betweenregions. All primary factors, labor, land, andcapital are fully employed within each region.The effects of the actual agreements are based
on matching, as closely as possible, the degreeof trade liberalization (full, partial, and ex-cluded products) in the agreements with the24 sectors in the model. In the case of the agree-ment with MERCOSUR (which is currentlyunder negotiation) it was assumed that the lib-eralization of bilateral trade would cover allmanufactured goods, 75% of processed food,50% of agricultural products, and excludesmeats and sugar.
(b) Trade and production effects
The overall trade impact of the agreementscan be proxied by the percentage change in ex-port value (note that this does not indicate thewelfare effects of the agreements). A large pro-portion of the EU’s imports from the develop-ing country with which the European Unionhas concluded FTAs were already subject tozero or very low rates of duty either becausethey were raw materials, industrial goods, ornoncompeting agricultural products subject to

1558 WORLD DEVELOPMENT
low MFN duties, or because they already re-ceived unilateral preferences under bilateralschemes (Mediterranean countries) or theGSP (Latin America and South Africa). Theadditional concessions, which have been offeredby the European Union in the FTAs, are verylimited. As a result, preferential access underthe FTAs can be expected to lead to only a verysmall increase in the existing level of exports ofthe partner developing countries. Our estimatesof the percentage change in export value 5
range from 0.1% for Egypt, 2.8% for Mexico,3.5% for Chile, 5% for MERCOSUR, 6.4%for South Africa, and 14.1% for Turkey. Atthe same time, agreements with third countrieserode the value of individual agreements some-what.The present level of border restrictions of
many developing countries remain at substan-tial levels despite recent programs of liberaliza-tion. The simple average level of tariffs in Egyptin 2002 was recorded as 18.4% with 44.6% of thetariffs being over 15%. South Africa has en-gaged in a vigorous program of liberalizationin recent years and as a result its simple averagelevel of tariffs in 2001 was 9.8%, but 38% of itstariffs were over 15% (World Bank, 2004).Adjustment to the terms of the FTA will there-fore result in a significant decrease in importduties. Equally significant are the numerousadministrative ‘‘red tape’’ barriers to tradewhich may have to be removed or greatly sim-plified as a result of the agreement. If this iscombined with a significant share of the Euro-pean Union in total imports, then the potentialgains from trade creation may be significant.For this reason, the growth in trade is morereadily attributed to one’s own liberalizationthan to liberalization with the European Union.As a result of such liberalization, producers willhave access to lower cost intermediate productsand capital goods and consumers will be offereda wider variety of goods at lower prices.Welfare effects (proxied by real income) are
reported in Table 7. These are based on thechange in economic welfare that follows fromeach RTA. They show that the EuropeanUnion gains most, in economic terms, fromthe full set of agreements studied. The benefitsfor the European Union are estimated to bein the range of $9.1 billion annually (based on1997 GDP). Most FTA partners (except Egypt)benefit from the direct effects of the agree-ment. 6 However, as in trade, the effects ofagreements with third countries limit economicgains. In addition, some third countries, such as
Botswana, North Africa, and the Middle East,are hurt by the agreements. The results forBotswana (with a loss of about $377 millionannually) point to losses for Southern Africain general. 7
The BNLS (Botswana, Nambia, Lesotho,and Swaziland) countries face, as a result ofthe combination of the customs union agree-ment with South Africa (SACU) and theEuropean Union–South Africa (RSA) FTA, in-creased competition from the European Union,both in their exports to, and in their importsfrom, South Africa and will incur a loss of tariffrevenue (significant for Lesotho and Nambia)from the common revenue pool. These coun-tries also have only preferential access to theEuropean Union through the Cotonou Agree-ment, the trade component of which is due toexpire in 2008. Even if future negotiations ex-tended the European Union–RSA agreementto the BNLS countries it is unlikely to includeBotswana, Nambia, and Swaziland’s currentpreferences for beef and sugar as these productsare excluded from the European Union–RSAagreement (though the legality of withdrawingsugar preferences could be legally challengedas these are, under the Sugar Protocol, of‘‘indefinite duration’’).South Africa is also a member of SADC and
these southern African countries will face a lossof regional trade with South Africa as a resultof the trade creation effects of the FTAs. Inaddition, unless South Africa offers the SADCcountries preferences equivalent to those avail-able to the European Union there could also besignificant trade diversion against SADC.These negative effects on regional trade arereinforced by the EU rules of origin whichallow South Africa to cumulate origin with onlyone ACP (including SADC) country, whilethe producer in South Africa has to add 100%to the value of imports of intermediate prod-ucts from the regional partner in order to qual-ify for preferential entry into the EU market.It should also be noted that the ACP (includ-
ing SADC) countries have no automatic rightto include imports from South Africa as origi-nating products when claiming preferences intheir exports to the European Union underthe Cotonou Agreement. In the case of theMediterranean countries, Egypt (but not otherMediterranean countries, such as Moroccoand Tunisia) can, technically, cumulate originwith other Mediterranean countries and Tur-key (subject to some restriction) but only pro-vided that these intermediate products have

EUROPEAN UNION–DEVELOPING COUNTRY FTAS 1559
acquired originating status under the EU rulesof origin in the partner country.These considerations apply to the ultimate ef-
fect of the FTA on the allocation of resourcesonce the agreement has been fully implemented.As we have noted, however, the pattern of tariffreduction in countries like Egypt and SouthAfrica is generally to eliminate tariffs on capitalgoods and intermediate goods where tarifflevels are already fairly low and to delay tariffreductions on the more highly protected con-sumer goods industries to the latter part ofthe transitional period. The result of this is toincrease the variance of effective rates of protec-tion during most of the transitional period,with some liberalized sectors quite possibly
Table 7. The global impact of regional agreement
SouthAfrica FTA
MexicoFTA
ChileFTA
Australia andNew Zealand
�38 15 �11
China �52 �31 �28Hong Kong 1 �4 0Japan �118 �204 �29Korea �61 �12 �31Taiwan �44 �44 �7ASEAN5 �55 6 1Vietnam 0 2 0Bangladesh 0 �1 �1India �54 �22 �7South Asia �7 �5 0Canada �6 �3 �8Mexico �1 4,079 �239United States �48 �256 �102CBI 0 11 1ATP �10 60 �21MERCOSUR �53 1 �43Chile �9 17 312Other LatinAmerica
1 1 1
European Union 1,135 2,652 879CEA �21 �42 �12Turkey �15 �20 �6SACU 727 3 �11Botswana �384 16 1Malawi 4 �1 0Mozambique 2 0 0Rest of SouthernAfrica
�8 �6 �9
Egypt 3 1 �3North Africa andMiddle East
24 13 �34
Rest of the world 8 �17 �33
being subject to significant negative rates ofprotection. The increase in the variance of effec-tive rates of protection will increase the degreeof price distortion in the economy and the con-sequent adverse resource pull effects of thestructure of protection, reducing the incentiveto engage in rapid restructuring of the economyand creating an incentive for scarce resources tobe allocated to sectors of the economy wherethere is a short-term increase in levels of protec-tion (and therefore in profitability). A study(Hoekman & Djankov, 1997) simulating theeffects of applying the Tunisian tariff reductionscheme in the European Union–Tunisia FTAto Egypt showed an increase in the average dis-persion of effective rates of protection (ERP)
s on real income (millions of dollars annually)
MERCOSURFTA
TurkeyCustoms Union
EgyptFTA
Total
�49 �1 �4 �88
�81 �312 �7 �512�4 �12 �1 �2087 �240 �35 �540�58 �128 �4 �293�31 �112 �2 �240�63 �195 �5 �311�7 �11 0 �180 �13 0 �13
�42 �155 �3 �284�6 �43 �1 �61�47 �17 �2 �83�367 �119 �1 3,353�315 68 �20 �6730 8 �1 20
�19 �9 �2 �12,302 �2 �2 2,196�27 �2 �1 29114 2 0 19
3,960 152 302 9,080�62 �70 �2 �210�34 2,237 0 2,161�36 �12 �1 670�13 3 0 �3771 0 0 42 1 0 4
�46 3 �2 �68
�17 �18 �770 �805�177 �191 �1 �366
�171 �271 �13 �498

1560 WORLD DEVELOPMENT
from an initial level of 66% to a level of 73% byyear six of the 12-year transitional period. Sec-tors such as clothing, glass products, footwear,and transport equipment experienced increasedERP’s by year six, while chemicals, crudepetroleum, mineral products, machinery andappliances, and petroleum refining faced nega-tive ERPs (effectively a tax on production).This is contrary to the purpose of the transi-
tional arrangement and as effective rates of pro-tection decrease sharply toward the end of thetransitional period, many producers may beinadequately prepared to meet increased com-petition from the European Union.The limited additional concession by the
European Union in agriculture productscombined with the potentially negative staticwelfare effects of the agreement raises the ques-tion of the effect of these agreements on thepoorest sections of the population. The effectsof trade liberalization on the poor are complex(see, e.g., Winters, 1999) and the additionalcomplexities of these FTAs make it impossibleto make valid generalizations about their likelyeffects. What we can say, however, is thatgreater access to the EU market for agriculturalproducts could have significant effects on thedemand for unskilled agricultural labor. Inthe case of South Africa, for example, it hasbeen shown (McDonald & Punt, 2001) thatincreased exports of wine, table grapes, anddeciduous fruits have the potential to make asignificant contribution to increasing employ-ment and rural incomes, especially among farmworker households. These are, however, pre-cisely the areas of the European Union–SouthAfrica agreement which have either beenexcluded by the European Union from pre-ferences or granted preferences within tariffquotas.As one rough measure of the distributional
impact of agreements, Table 8 reports esti-mated wage effects for unskilled workers. In
Table 8. The global impact of regional agreements on realwages of unskilled workers (% of real wages)
Increases of > +0.1%
Turkey (2.2%) SACU (1.4%)Mexico (1.1%) Chile (0.9%)MERCOSUR (0.3%) European Union (0.3%)Other L.A. (0.2%)
Decreases of > �0.1%
Botswana (�9.9%) Egypt (�4.5%)
general (and due to the exclusion of agricultureas a general rule), unskilled worker gains aresomewhat limited. They are positive and sub-stantial for Turkey, Chile, and South Africa.At the same time, third countries in SouthernAfrica (see Botswana) are hurt.It should also be noted that the partial imple-
mentation of the South Africa Agreementmeans that financial assistance is not availablefor structural adjustment until the Agreementis ratified by all of the EU member states. Expe-rience suggests that this may take several years,particularly following the break-up of the nego-tiation of a Fisheries Agreement and the possi-bility of renewed opposition to the agreementby some of the EU member states.
6. A COMPARISON WITH BILATERALFREE TRADE
As noted above, a common feature of EUFTAs is the exclusion of sensitive sectors, espe-cially in food and agriculture. We now turn,briefly, to the implications of these exclusions.Table 9 presents the estimated effects (expressedas gains relative to 1997 GDP) for actual agree-ments, and a hypothetical extension of theseagreements to include all food and agriculturesectors. Table 10 presents the dollar impact ofthe actual agreements.Not surprisingly, it is the potential agricul-
tural exporters to the European Union (Chile,MERCOSUR), who would benefit the mostfrom the extension of existing agreements tosimple free trade, including all food and agri-culture sectors. Egypt would also witness signi-ficant gains from the extension of existingagreements to full bilateral free trade. ForTurkey and Mexico, the current agreement isalmost equivalent to a full agreement. SACUwould experience a slightly smaller gain froma full FTA compared to the actual FTA. Thesignificant loss to Botswana from the actualFTA would be only very slightly reduced by afull bilateral FTA and the losses would be evengreater if full FTAs were implemented for all ofthe countries analyzed, while Malawi wouldgain more from full FTAs.In contrast, third countries and regions wit-
ness relatively small changes either from theactual European Union–developing countryFTAs or their extension to simple free trade.What is the impact of the EU? One per-
spective is provided in Tables 7–10. Table 11provides another view, based on estimated

Table 9. A comparison of actual and full FTAs (% impact on national incomes)
South AfricanFTA
Mexico FTA Chile FTA MERCOSURFTA
Turkey CustomsUnion
Egypt FTA Total
ActualFTA
FullFTA
ActualFTA
FullFTA
ActualFTA
FullFTA
ActualFTA
FullFTA
ActualFTA
FullFTA
ActualFTA
FullFTA
ActualFTA
FullFTA
European Union and partner countries
European Union 0.0 0.0 0.0 0.0 0.0 0.0 0.1 0.1 0.0 0.0 0.0 0.1 0.1 0.2SACU 0.6 0.5 0.0 0.0 0.0 0.0 0.0 �0.1 0.0 0.0 0.0 0.0 0.6 0.4Mexico 0.0 0.0 1.2 1.3 �0.1 �0.1 �0.1 �0.2 0.0 0.0 0.0 0.0 1.0 1.0Chile 0.0 0.0 0.0 0.0 0.4 1.0 0.0 �0.1 0.0 0.0 0.0 0.0 0.4 0.9MERCOSUR 0.0 0.0 0.0 0.0 0.0 0.0 0.2 0.6 0.0 0.0 0.0 0.0 0.2 0.6Turkey 0.0 0.0 0.0 0.0 0.0 0.0 0.0 0.0 1.3 1.4 0.0 0.0 1.3 1.3Egypt 0.0 0.0 0.0 0.0 0.0 0.0 0.0 0.0 0.0 0.0 �1.1 0.5 �1.1 0.5
Selected third countries and regions
Central and EastEuropean Associates
0.0 0.0 0.0 0.0 0.0 0.0 0.0 0.0 0.0 0.0 0.0 0.0 �0.1 �0.1
Other Latin America 0.0 0.0 0.0 0.0 0.0 0.0 0.2 0.1 0.0 0.0 0.0 0.0 0.2 0.1Botswana �9.0 �8.5 0.4 0.1 0.0 0.0 �0.3 1.1 0.1 0.0 0.0 0.0 �8.8 �9.6Malawi 0.2 0.5 0.0 0.0 0.0 0.0 0.0 0.1 0.0 0.0 0.0 0.0 0.2 0.6Mozambique 0.1 0.1 0.0 0.0 0.0 0.0 0.1 0.1 0.0 0.0 0.0 0.0 0.1 0.3Rest of Southern Africa 0.0 0.0 0.0 0.0 0.0 0.0 0.0 0.0 0.0 0.0 0.0 0.0 0.0 0.0North Africa andthe Middle East
0.0 0.0 0.0 0.0 0.0 0.0 0.0 �0.1 0.0 0.0 0.0 0.0 �0.1 �0.1
Rest of the world 0.0 0.0 0.0 0.0 0.0 0.0 0.0 0.0 0.0 0.0 0.0 0.0 0.0 0.0
EUROPEAN
UNIO
N–D
EVELOPIN
GCOUNTRY
FTA
S1561
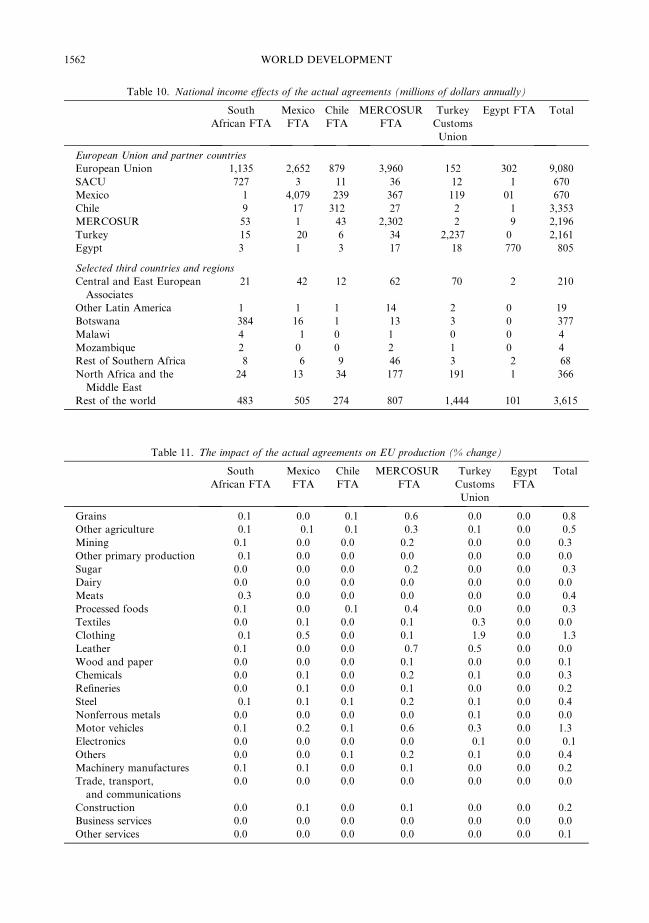
Table 10. National income effects of the actual agreements (millions of dollars annually)
SouthAfrican FTA
MexicoFTA
ChileFTA
MERCOSURFTA
TurkeyCustomsUnion
Egypt FTA Total
European Union and partner countries
European Union 1,135 2,652 879 3,960 152 302 9,080SACU 727 3 �11 �36 �12 �1 670Mexico �1 4,079 �239 �367 �119 01 670Chile �9 17 312 �27 �2 �1 3,353MERCOSUR �53 1 �43 2,302 �2 �9 2,196Turkey �15 �20 �6 �34 2,237 0 2,161Egypt 3 1 �3 �17 �18 �770 �805
Selected third countries and regions
Central and East EuropeanAssociates
�21 �42 �12 �62 �70 �2 �210
Other Latin America 1 1 1 14 2 0 19Botswana �384 16 1 �13 3 0 �377Malawi 4 �1 0 1 0 0 4Mozambique 2 0 0 2 1 0 4Rest of Southern Africa �8 �6 �9 �46 3 �2 �68North Africa and theMiddle East
24 13 �34 �177 �191 �1 �366
Rest of the world �483 �505 �274 �807 �1,444 �101 �3,615
Table 11. The impact of the actual agreements on EU production (% change)
SouthAfrican FTA
MexicoFTA
ChileFTA
MERCOSURFTA
TurkeyCustomsUnion
EgyptFTA
Total
Grains �0.1 0.0 �0.1 �0.6 0.0 0.0 �0.8Other agriculture �0.1 �0.1 �0.1 �0.3 0.1 0.0 �0.5Mining 0.1 0.0 0.0 0.2 0.0 0.0 0.3Other primary production �0.1 0.0 0.0 0.0 0.0 0.0 0.0Sugar 0.0 0.0 0.0 �0.2 0.0 0.0 �0.3Dairy 0.0 0.0 0.0 0.0 0.0 0.0 0.0Meats �0.3 0.0 0.0 0.0 0.0 0.0 �0.4Processed foods 0.1 0.0 �0.1 �0.4 0.0 0.0 �0.3Textiles 0.0 0.1 0.0 0.1 �0.3 0.0 0.0Clothing �0.1 0.5 0.0 0.1 �1.9 0.0 �1.3Leather 0.1 0.0 0.0 �0.7 0.5 0.0 0.0Wood and paper 0.0 0.0 0.0 0.1 0.0 0.0 0.1Chemicals 0.0 0.1 0.0 0.2 0.1 0.0 0.3Refineries 0.0 0.1 0.0 0.1 0.0 0.0 0.2Steel �0.1 0.1 0.1 0.2 0.1 0.0 0.4Nonferrous metals 0.0 0.0 0.0 0.0 0.1 0.0 0.0Motor vehicles 0.1 0.2 0.1 0.6 0.3 0.0 1.3Electronics 0.0 0.0 0.0 0.0 �0.1 0.0 �0.1Others 0.0 0.0 0.1 0.2 0.1 0.0 0.4Machinery manufactures 0.1 0.1 0.0 0.1 0.0 0.0 0.2Trade, transport,and communications
0.0 0.0 0.0 0.0 0.0 0.0 0.0
Construction 0.0 0.1 0.0 0.1 0.0 0.0 0.2Business services 0.0 0.0 0.0 0.0 0.0 0.0 0.0Other services 0.0 0.0 0.0 0.0 0.0 0.0 0.1
1562 WORLD DEVELOPMENT

EUROPEAN UNION–DEVELOPING COUNTRY FTAS 1563
changes in output. The benefits for the Euro-pean Union are estimated to be in the rangeof $9.1 billion annually (based on 1997 GDP).This somewhat overstates the picture and, ingeneral, the combined effects of these agree-ments are very small. The increase in EU realincome (welfare) is in the range of 1%. Industryoutput effects are small (less than 1%). Thenotable exceptions are in clothing where Tur-key exerts significant pressure, and auto-mobiles, where the European producers gainfrom improved market access in South Africa,MERCOSUR, and Turkey. Overall though,the agreements make very little difference inthe long run, economically, to Europe.
7. CONCLUSIONS
This overview reaches three broad conclu-sions.First, in assessing these FTAs, it is important
to appreciate that, as a result of a lack of preci-sion in the wording of Article XXIV of GATT1994 (despite the Uruguay Round ‘‘Under-standing on the Interpretation of ArticleXXIV’’) which requires FTAs to cover ‘‘sub-stantially all trade,’’ they fall substantially shortof creating free trade between the EuropeanUnion and partner developing countries. Inparticular, EU restrictions, both in productcoverage and in rules of origin, adversely affecttrade in agricultural goods and labor-intensivemanufacturers and this significantly reducesthe potential gains from trade liberalizationfrom an FTA with the European Union forthe developing countries.Second, an assessment of the current content
of the agreements indicates that only the agree-ments with Mexico, Chile (in service), and Tur-key (because it is a candidate for membershipof the European Union) can be said to be widerand deeper than commitments available underthe WTO agreements. In this sense, there islittle evidence supporting the view that theagreements could potentially provide the non-traditional gains discussed in the literature.Third, the negotiation of bilateral trade
agreements is not without costs. It requires
the use of negotiating capital (scarce humancapital and related resources) that might alsobe devoted to other issues, such as, WTO-based multilateral negotiations. Multilateral,broad based liberalization offers the opportu-nity for terms of trade losses and gains to can-cel so that efficiency and procompetitive gainscan dominate the net effects of trade liberaliza-tion (i.e., trade diversion effects are more likelyto cancel). Recent estimates (Francois, 2001;Francois, van Meij, & van Tongeren, 2002),for example, suggest that real income gainsfor developing countries, in the context ofthe Doha Development Agenda, could out-weigh recent annual flows of official develop-ment aid from the industrialized countries.Such gains hinge, critically, on mutual tradeliberalization between the developing coun-tries, an issue completely outside the scopeof European Union–developing countryFTAs. In this respect, much of the gains tothe developing countries in the Euro-Medagreements and the agreement with SouthAfrica could equally well have been achievedthrough unilateral trade liberalization and re-form, combined with increased aid and techni-cal assistance. In the case of Egypt, the limitedamount of reforms means that we are mov-ing toward regional free trade with manydomestic distortions (see Francois & Spinan-ger, 2002b; WTO, 1999) while still in place.The result is a significant loss for the Egyptianeconomy.The agreements, however, are of compara-
tively recent origin and the provisions forfurther negotiations may enable them to go sig-nificantly beyond WTO commitments in thefuture and in turn provide ‘‘stepping stones’’for liberalization on an MFN basis. Onthe other hand, a direct approach to the liber-alization of market access through the WTOprovides a much broader avenue for developingcountry gains than is available under the bilat-eral approach. Based on recent estimates (seeAnderson et al., 2002), the likely gains fromsuch an approach appear to outweigh anythingpossible from the combined effect of develop-ment assistance and bilateral agreements.
NOTES
1. MERCOSUR is a regional grouping of Argentina,Brazil, Paraguay, and Uruguay.
2. For details of the GTAP model, see Hertel (1997)and www.gtap.agecon.purdue.edu.

1564 WORLD DEVELOPMENT
3. In the case of Turkey, we model the Customs Unionagreement along similar lines.
4. GTAP 5 data provide MFN tariffs, not preferentialtariffs, and so Table 3 rates are a little higher than actualapplied rates.
5. These are based on the data in GTAP 5 whichprovide MFN tariffs, not EU preferential tariff rates,and so our estimates may produce a larger increase inexports to the European Union than will actually be thecase. We would not, however expect this to be asignificant difference because (a) in the absence of anFTA, the developing countries would have had to relyon the EU’s GSP which provides only a small margin ofpreference for sensitive industrial goods and excludessensitive agricultural products and (b) the limited impactof the GSP has been confirmed by one of the authorsusing a prerelease version of GTAP 6 (which providespreferential tariff rates).
6. Our findings of welfare gains for both the EuropeanUnion and its agreement partners are consistent withother GTAP based studies. See, for instance, Lewiset al. (1999, 2002) and McDonald and Walmsley (2003)on South Africa as well as Zahariadis (2002) on Turkey.Using a dynamic computable general equilibriummodel, Dessus and Suwa-Eisenmann (1998) find thata linear reduction in Egyptian import tariffs on EUmanufactures leads to a welfare loss of 0.18% forEgypt.
7. Welfare losses for Botswana and Southern Africanfrom the European Union–South Africa FTA (seeTables 7 and 8) are confirmed by the GTAP study ofMcDonald and Walmsley (2003) who find that the lossesin Botswana and rest of SADC are $71.5 million and$14.2 million, respectively. Meanwhile, the GTAP stud-ies by Lewis et al. (1999, 2002) report that the impact ofthe European Union–South Africa FTA on otherSADCX countries is small.
REFERENCES
Alessandri, P. (2000). European and Euro-mediterraneanagreements: some simulation analysis on the effects ofthe EU trade policy. CESPRI Working Paper No.110, Universita Commerciale ‘‘Luigi Bocconi’’,Milan.
Anderson, K., Dimaranan, B., Francois, J., Hertel, T.,Hoekman, B., & Martin, W. (2002). The costs of rich(and poor) country protection to developing coun-tries. Journal of African Economies, 10(3), 227–257.
Brockmeier, M. (2001). A graphical exposition of theGTAP model. GTAP Technical Paper No. 8, Centrefor Global Trade Analysis, Purdue University, WestLafayette.
Collier, P., & Gunning, J. W. (1995). Trade policy andregional integration: implications for relations be-tween Europe and Africa. The World Economy, 18,387–410.
Dessus, S., & Suwa-Eisenmann, A. (1998). Trade inte-gration with Europe, export diversification andeconomic growth in Egypt. Working Paper No.135, OECD Development Centre, Paris.
Dimaranan, B. V., & McDougall, R. A. (2002). Globaltrade, assistance, and production: The GTAP 5 database. West Lafayette: Center for Global TradeAnalysis, Purdue University.
European Commission (2000). Commission Staff Work-ing Paper Concerning The Establishment of an Inter-Regional Association Between the European Unionand MERCOSUR, European Commission, Brussels.
European Commission (2001). EU Trade CommissionerPascal Lamy to visit Brazil to strengthen EU/Mercosur and WTO trade ties (July 8–11). Commis-sion Press Release IP/01/967, European Commis-sion, Brussels, July.
European Communities (1996). Decision No. 1/95 of theEC–Turkey Association Council of 22 December
1995 on implementing the final phase of the Cus-tom’s Union. Official Journal, L.035, 13/02/1996,European Commission, Brussels.
European Communities (1998). Decision No. 1/98 of theEC–Turkey Association Council of 25 February1998 on the trade regime for agricultural products.Official Journal, L.086, 20/03/1998, European Com-mission, Brussels.
European Council (2000). Common strategy of theEuropean Council of 19th June, 2000 on the Med-iterranean Region. Official Journal, L183/5, Euro-pean Commission, Brussels.
Fernandez, R., & Portes, J. (1998). Returns to region-alism: an analysis of non-traditional gains fromregional arrangements. The World Bank EconomicReview, 12, 197–220.
Francois, J. F. (2001). The next WTO round: North–south stakes in new market access negotiations.Rotterdam: Tinbergen Institute and Adelaide, CIES.
Francois, J. F., McDonald, B. J., & Nordstrom, H.(1996). Liberalisation and capital accumulation inthe GTAP model. GTAP Technical Paper No. 7,Centre for Global Trade Analysis, Purdue Univer-sity, West Lafayette.
Francois, J. F., & Spinanger, D. (2002a). Estimates ofquota rents for textiles and clothing. In B. V.Dimaranan & R. A. McDougall (Eds.), Global trade,assistance, and production: The GTAP 5 data base.West Lafayette: Center for Global Trade Analysis,Purdue University.
Francois, J. F., & Spinanger, D. (2002b). Would Egyptbenefit from an FTA with the European Union?Faculty of Economics Discussion Paper, ErasmusUniversity, Rotterdam.
Francois, J. F., & Strutt, A. (1999). Post Uruguay roundtariff vectors for GTAP Version 4. Faculty of
EUROPEAN UNION–DEVELOPING COUNTRY FTAS 1565
Economics Discussion Paper, Erasmus University,Rotterdam.
Francois, J. F., van Meij, H., & van Tongeren, F. (2002).Economic benefits of the Doha round for the Nether-lands. Netherlands: LEI-Wageningen University andResearch Centre.
Ghoneim, A. F. (2003). Rules of origin and tradediversion: The case of the Egyptian Europeanpartnership agreement. Journal of World Trade,37(3), 597–622.
Grethe, H., & Tangermann, S. (1999). The New Euro-Mediterranean Agreements—an analysis of tradepreferences. Diskussionbeitrag 9902, Institute ofAgricultural Economics, University of Gottingen,Gottingen.
Harrison, G. W., Rutherford, T. F., & Tarr, D. G.(1996). Economic implications for Turkey of aCustoms Union with the European Union. PolicyResearch Working Paper 1599, World Bank, Wash-ington, DC.
Hertel, T. W. (Ed.) (1997). Global trade analysis:Modelling and applications. Cambridge: CambridgeUniversity Press.
Hertel, T. W., Ianchovichina, E., & McDonald, B. J.(1997). Multi-region general equilibrium modeling.In J. F. Francois & K. A. Reinert (Eds.), Appliedmethods for trade policy analysis: A handbook.Cambridge: Cambridge University Press.
Hoekman, B., & Djankov, S. (1997). Effective protectionand investment incentives in Egypt and Jordanduring the transition to free trade with Europe.World Development, 25(2), 281–291.
Hoekman, B., & Konan, D. E. (1999). Deep integration,non-discrimination and Euro-Mediterranean freetrade. Washington, DC: World Bank, DevelopmentResearch Group.
Lewis, J. D., Robinson, S., & Thierfelder, K. (1999).After the negotiations assessing the impact of freetrade agreements in Southern Africa. Washington,DC: World Bank.
Lewis, J. D., Robinson, S., & Thierfelder, K. (2002).Free trade agreements and the SADC Economies.Africa Region Working Paper Series No. 27, WorldBank, Washington, DC.
Maxwell Stamp PLC (2003). Study on the economiceffects of the EU’s bilateral agreements with develop-ing countries. London: Maxwell Stamp PLC.
McDonald, S., & Punt, C. (2001). The Western Cape ofSouth Africa: export opportunities productivitygrowth and agriculture. Paper presented at the 4thglobal economic analysis conference, GTAP, PurdueUniversity, West Layafette.
McDonald, S., & Walmsley, T. L. (2003). Bilateral freetrade agreements and Customs Unions: the impact ofthe EU Republic of South African free tradeagreement on Botswana. GTAP Working PaperNo. 29, Centre for Global Trade Analysis, PurdueUniversity, West Lafayette.
McQueen, M. (1982). Lome and the protective effect ofrules of origin. Journal of World Trade Law, 16,119–132.
McQueen, M. (1998). Lome versus free trade agree-ments: the dilemma facing the ACP countries. TheWorld Economy, 21(4), 421–443.
McQueen, M. (2002). The EU’s free trade agreementswith developing countries: a case of wishful thinking?The World Economy, 16(9), 1369–1385.
Reinert, K. A., & Roland-Holst, D. W. (1997). Socialaccounting matrices. In J. F. Francois & K. A.Reinert (Eds.), Applied methods for trade policyanalysis: A handbook. New York: Cambridge Uni-versity Press.
Winters, L. A. (1999). Trade and poverty; Is there aconnection? In D. H. Ben-David, D. Nordstrom, &L. A. Winters (Eds.), Trade income disparity andpoverty. Special studies (Vol. 5, pp. 43–65). Geneva:WTO.
World Bank (2004). World development indicators 2004.Washington, DC: International Bank for Recon-struction and Development/The World Bank.
WTO (1999). Trade policy review; Egypt. Geneva: WorldTrade Organisation.
Zahariadis, Y. (2002). Deep integration in the EU–Turkey Customs Union. A preliminary analysisbased on the GTAP model. Paper presented at theDESG annual conference in development econo-mics, University of Nottingham, Nottingham, April18–20.