euroqol working paper series · euroqol working paper series . number 16001 . december 2016 ....
TRANSCRIPT

EuroQol Working Paper Series Number 16001 December 2016 ORIGINAL RESEARCH Important aspects of health not captured by EQ-5D: Views of the UK general public Koonal K. Shah1 Brendan Mulhern2 Louise Longworth3 Bas Janssen4
1 Office of Health Economics, London, UK 2 University of Technology Sydney, Sydney, Australia 3 PHMR Limited, Health Economics, Pricing and Reimbursement, London, UK 4 EuroQol Office, Rotterdam, the Netherlands EuroQol Research Foundation, Rotterdam, the Netherlands Copyright © 2016 EuroQol Research Foundation

Abstract Introduction: The EQ-5D is a standardized instrument designed for use as a generic measure of health outcome. It was (and is) intended to provide information about a “common core” of dimensions known to be relevant across a range of conditions, and valued highly by people. However, the five dimensions may not fully capture the health-related impacts of certain conditions. This study analyses the views of a sample of the UK general public about important aspects of health that they consider to be missing from the five EQ-5D dimensions. Methods: Survey respondents were asked whether there are any aspects of health they consider to be important but are not captured by the five EQ-5D dimensions; and if so, what these aspects of health are. The responses (text comments) were analyzed using a conventional content analysis framework with analyst triangulation. Data were collected from a broadly representative sample of the UK general public via a paper questionnaire administered as part of face-to-face interviews. Results: Data are available for 436 respondents. One-hundred and seventy-nine respondents (41.1%) provided suggestions of aspects of health they considered important but not captured by the five EQ-5D dimensions. These were organized into 22 themes by the study team. Sensory deprivation (particularly vision and hearing) and mental health (referred to either in general terms or with reference to a specific condition) were the aspects of health most commonly mentioned by respondents. Conclusions: To some extent, the findings of this study support the choice of areas in which exploratory “bolt-on” work has been conducted to date. The study can provide the basis for more detailed qualitative and quantitative research to inform further review of the EQ-5D descriptive system. Conflicts of interest: The authors have indicated they have no conflicts of interest with regard to the content of this article. Keywords EQ-5D, dimension, descriptive system, general public, qualitative Acknowledgements This study was funded by a grant from the EuroQol Research Foundation. The views expressed by the authors in this paper do not necessarily reflect the views of the EuroQol Research Foundation. We are grateful for the contributions of Liz Flower, Rachel Ibbotson, Arnd Jan Prause and Arto Ohinmaa. We also wish to thank the interviewers and respondents who took part in the study. . Koonal Shah Office of Health Economics Southside 7th floor, 105 Victoria Street SW1E 6QT, London, UK E: [email protected] Disclaimer: The views expressed are those of the individual authors and do not necessarily reflect the views of the EuroQol Group. E-mail: [email protected]

1
Introduction
The term “health” is defined by the World Health Organization (WHO) as “a state of
complete physical, mental and social well-being and not merely the absence of disease
or infirmity” [1]. The WHO’s definition has not been amended since 1948, and has been
criticised for being too absolute and for failing to capture recent changes in
demographics and the nature of disease [2]. It has been suggested that any attempt to
define health may be futile [3]. However, it is important to understand what health
entails in order to determine what aspects of health need to be measured, as
measurement is needed in order to evaluate policies and interventions.
The EuroQol Group’s EQ-5D is a standardised instrument designed for use as a measure
of health outcome. It was designed as a generic instrument capable of providing simple
descriptive profiles across a wide range of conditions and treatments, and of identifying
differences between populations and population groups [4]. It was intended to provide
information about a “common core” of dimensions known to be relevant across a range
of conditions, and valued highly by people. It was not originally intended to be a
comprehensive, standalone instrument for capturing all aspects of health for all
purposes, but rather, a brief and convenient measure to be used in conjunction with
other, more detailed generic and condition-specific measures [5]; though increasingly it
is used as a standalone measure [6]. It should be noted that while early studies of EQ-
5D referred to it as a measure of health-related quality of life, we follow the suggestion
by Karimi and Brazier [7] that it is more appropriate to think of such instruments as
measures of “self-perceived health status”.
The five EQ-5D dimensions (mobility, self-care, usual activities, pain/discomfort,
anxiety/depression) were chosen to capture physical, mental and social functioning [8].
Candidate dimensions were identified by a review of existing generic measures and a
survey of lay concepts of health [9], and selected based on a largely conceptual process.
The original descriptive system had separate dimensions for “main activity” and “social
relationships” (ability to pursue family and leisure activities), while an additional energy
dimension was considered but not incorporated due to evidence that its inclusion had no
significant effects either on self-reported health or on the valuation of health states [4].
There is evidence that the dimensions currently included in the EQ-5D descriptive system
are able to assess health status validly across a range of physical and mental health
conditions including diabetes [10,11], arthritis [12] and many cancers [13,14]. In other
areas of health, however, the five dimensions may not fully capture the health-related
impacts of certain conditions. Such areas include vision and hearing [14,15], cognition
[16], sexual function, incontinence [17] and severe mental health conditions such as

2
schizophrenia [18]. The EQ-5D may not be psychometrically valid and sensitive to the
impacts of a particular condition if changes in health are not reflected in the descriptive
system.
In addition, ceiling effects (where patients rate themselves at the best level on all
dimensions) have been observed with the EQ-5D, and this may impair the ability of the
descriptive system to measure small changes in health at the less severe end of the
scale. To a large extent, the presence of ceiling effects is likely to be a function of the
number and labels of response levels for each dimension; however, it may also be due to
the relevance of the dimensions themselves with respect to “milder” health problems. An
objective in the development of the EQ-5D-5L (the new, five-level version of the EQ-5D)
was to address the presence of ceiling effects [19]. Evidence to date suggests that EQ-
5D-5L is associated with a substantial reduction in ceiling effects compared to the EQ-
5D(-3L), though a significant proportion of patients still report no problems on all five
dimensions [20,21].
Further attempts to improve the sensitivity of the descriptive system include the
development of “bolt-on” dimensions for the EQ-5D in a number of physical and mental
health areas including cognition [16], psoriasis [22], vision, hearing and tiredness [23].
However, it is currently unclear which conditions and associated aspects of health should
be considered for further bolt-on research.
The primary aim of this paper is to report the views of the UK general public about
aspects of health that they consider to be important but do not perceive as being
captured by the five EQ-5D dimensions. For this purpose, we analyse responses to
follow-up tasks included in a wider study assessing differences in time trade-off
valuations using two different comparator health states: EQ-5D-5L health state 11111
and “full health”. The primary results of that study are reported elsewhere [24].
Methods
Administration of survey
Data were collected from a broadly representative sample of the UK general public via
face-to-face interviews undertaken by three experienced interviewers working for
Sheffield Hallam University. All interviews were carried out in a one-to-one setting in the
homes of respondents. Details of the sample recruitment process are reported by Shah
et al. [24]. The survey was approved by the Ethics Committee of the University of
Sheffield’s School of Health and Related Research.

3
Survey instrument
Respondents first completed a valuation questionnaire. This comprised a series of time
trade-off and discrete choice experiment tasks (following an adapted version of the
EuroQol Group protocol for valuing EQ-5D-5L health states [25]). A computer-based tool
was used to administer the valuation tasks and to capture the response data. The
methods and results of the valuation questionnaire are reported elsewhere [24] and are
not discussed in this paper.
Immediately after completing the valuation questionnaire, respondents were asked to
complete a short pen-and-paper follow-up questionnaire, which comprised the following
tasks (in order):
1. paired comparison task in which respondents were asked to indicate whether they
considered 11111 and full health to be “the same as each other”, and if not, to
explain (open-ended comment) what makes them different from each other;
2. visual analogue scale rating of 11111 and full health (plus two impaired EQ-5D-5L
health states);
3. ranking task in which respondents were asked to rank six health state
descriptions (full health, perfect health, no health problems, 11111, healthy) in
order of how much they would want to live in them;
4. initial question asking respondents whether there are any aspects of health they
consider to be important but are not captured by the five EQ-5D dimensions,
followed by (for respondents who answered “Yes” to the initial question) an open-
ended text box to indicate what these aspects of health are;
5. initial question asking respondents whether there are any aspects of quality of life
they consider to be important but are not captured by the five EQ-5D dimensions,
followed by (for respondents who answered “Yes” to the initial question) an open-
ended text box to indicate what these aspects of quality of life are.
No definition of the term “health” was presented to respondents.
The follow-up questionnaire is reproduced in full in Appendix I. In this paper, we analyse
the responses to task 4. Responses to the other tasks are briefly summarised in
Appendix II.
Methods of analysis
Responses to task 4 (text comments) were analysed using a conventional content
analysis framework [26] with analyst triangulation [27], adopting the following five-step
approach:

4
1. All members of the study team familiarised themselves with the data, reading each
response individually and making notes of first impressions, with a view to identifying
general themes in the responses.
2. Themes were proposed by one member of the study team (LL) and modified
following discussion with the rest of the team.
3. Responses were coded according to their themes by two team members
independently (MFJ and LL).
4. Disagreements were resolved through discussion by the relevant team members.
5. Any remaining disagreements were resolved by a third team member (KS).
A similar approach was used to analyse responses to task 1. Responses to tasks 2 and 3
were examined using basic descriptive analyses such as the calculation of mean ratings
and rankings. Differences across respondent subgroups were assessed using the chi-
squared test. A simple overview of common themes emerging from responses to task 5
was also undertaken. See Appendix II for a summary of responses to tasks 1, 2, 3 and
5.
Results
The interviews were conducted between May and October 2014. The valuation
questionnaire was completed in full by 456 respondents. Responses to the follow-up
questions are available for 436 respondents. These data are unavailable for the
remaining respondents due to a recording error. The respondents with missing data did
not differ greatly from the rest of the sample in terms of key observable characteristics
(age, gender, self-reported health). The remainder of this paper reports the responses of
the 436 respondents for whom data are available.
The background characteristics of the sample are summarised in Table 1. Older (36.0%
of the sample are aged 60 and over) and female (58.0%) individuals are
overrepresented in comparison to the general population [28]. The sample is also
relatively well-educated, with 44.5% of respondents educated to university degree level
or equivalent.
When asked about their own level of health today (i.e. on the day of the interview), 221
respondents (50.7%) self-reported as being in health state 11111. Of these 221
respondents, 184 (83.3%) self-reported an EQ-VAS score of less than 100, indicating
that despite having no problems with the five dimensions covered by EQ-5D, they
considered their level of health to fall short of the EQ-VAS upper anchor of “best
imaginable health”. The mean EQ-VAS score for respondents self-reporting as being in
11111 was 89.5 (median: 90; inter-quartile range: 85-96; full range: 46-100).

5
Table 1. Sample background characteristics
Sample (N=436) N (%) i
General population ii %
Age 18-29 30-44
45-59 60-74 75+
75 (17.2%) 95 (21.8%)
109 (25.0%) 126 (28.9%)
31 (7.1%)
20.7% 26.3%
24.7% 18.5% 9.9%
Gender Female Male
253 (58.0%) 183 (42.0%)
49.2% 50.8%
Economic activity Employed or self-employed Retired Student Looking after home or family
Other / none of the above
212 (49.2%) 140 (32.5%)
28 (6.5%) 21 (4.9%)
33 (7.7%)
59.4% 13.1% 8.8% 4.2%
14.5%
Marital status Single / never Married Married or same-sex civil partnership Separated or divorced iii Widowed iv
64 (14.8%)
305 (70.8%) 35 (8.1%) 27 (6.3%)
34.6% 46.8% 11.7% 6.9%
Education Degree No degree
193 (44.5%) 241 (55.5%)
Responsibility for children
Yes No
153 (35.3%) 241 (55.5%)
Experience of serious illness In self In family In caring for others
144 (33.0%) 282 (64.7%) 166 (38.1%)
Self-reported health using EQ-5D-5L 11111
Any other health state
221 (50.7%)
215 (49.3%)
Self-reported health using EQ-VAS
<80 80-89 90-99 100
125 (28.7%) 96 (22.0%)
174 (39.9%) 41 (9.4%)
i Percentages exclude small number of missing values ii General population data based on UK Census results (Office for National Statistics, 2011), where available iii Comprises individuals who are separated but in a same-sex civil partnership and who were formerly in a same-sex civil partnership which is now legally dissolved iv Includes individuals who are the surviving partner from a same-sex civil partnership
One-hundred and seventy-nine respondents (41.1%) provided text responses when
asked whether there were aspects of health they considered important but were not
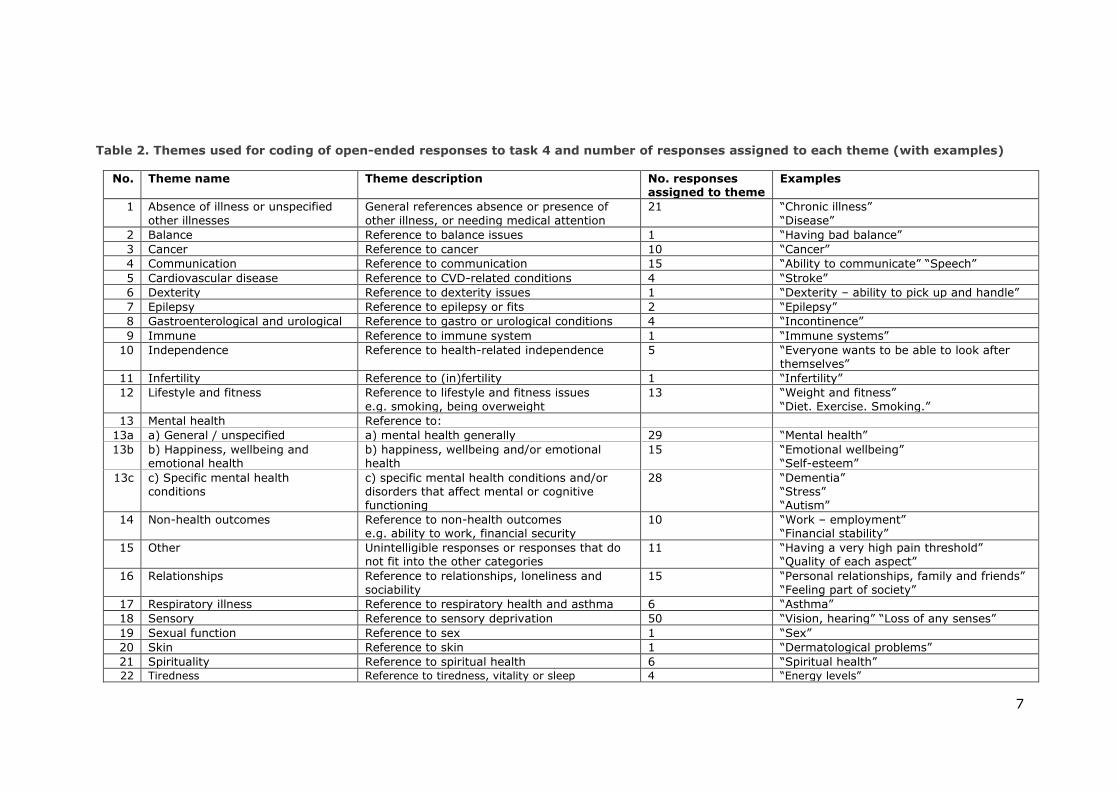
covered by the five EQ-5D dimensions. After familiarising themselves with the data, the
study team identified 22 themes (see Table 2, which includes examples of the responses
provided) and set out to assign each response to one or more of those themes.
MFJ and LL first coded the responses independently of each other (assigning each
response into one or more of the 22 themes and providing a short written justification).
For 126 of the 179 responses (70.4%), both authors were in agreement about all of the
6
themes that the responses should be assigned to. For 156 of the 179 responses
(87.2%), both authors were in agreement about at least one of the themes.
Following discussion between MFJ and LL and examination of each other’s justifications,
full agreement was reached about 163 of the 179 responses (91.1%). The views of a
third author, KS, were sought regarding the remaining 16 responses. KS was able to
make a decision about all 16 responses. In all cases, KS chose a theme that had initially
been proposed by either MFJ or LL. Some responses were assigned to multiple themes –
for example, one respondent’s response was “Sight. Smell. Hearing. Speaking.” This
response was assigned to themes 4 (communication) and 18 (sensory).
Minor amendments to the definitions of the themes were made at various points during
the data analysis. These were all discussed and agreed by the relevant members of the
study team.
Sensory deprivation (particularly vision and hearing) and mental health (referred to
either in general terms or with reference to a specific condition such as dementia) were
the aspects of health most commonly mentioned by respondents. Other frequently
mentioned aspects included the ability to communicate and the ability to form and
engage in relationships. There were 10 mentions of non-health outcomes that may result
from ill health, such as one’s financial situation.
7
Table 2. Themes used for coding of open-ended responses to task 4 and number of responses assigned to each theme (with examples)
No. Theme name Theme description No. responses assigned to theme
Examples
1 Absence of illness or unspecified
other illnesses
General references absence or presence of
other illness, or needing medical attention
21 “Chronic illness”
“Disease”
2 Balance Reference to balance issues 1 “Having bad balance”
3 Cancer Reference to cancer 10 “Cancer”
4 Communication Reference to communication 15 “Ability to communicate” “Speech”
5 Cardiovascular disease Reference to CVD-related conditions 4 “Stroke”
6 Dexterity Reference to dexterity issues 1 “Dexterity – ability to pick up and handle”
7 Epilepsy Reference to epilepsy or fits 2 “Epilepsy”
8 Gastroenterological and urological Reference to gastro or urological conditions 4 “Incontinence”
9 Immune Reference to immune system 1 “Immune systems”
10 Independence Reference to health-related independence 5 “Everyone wants to be able to look after themselves”
11 Infertility Reference to (in)fertility 1 “Infertility”
12 Lifestyle and fitness Reference to lifestyle and fitness issues
e.g. smoking, being overweight
13 “Weight and fitness”
“Diet. Exercise. Smoking.”
13 Mental health Reference to:
13a a) General / unspecified a) mental health generally 29 “Mental health”
13b
b) Happiness, wellbeing and emotional health
b) happiness, wellbeing and/or emotional health
15 “Emotional wellbeing” “Self-esteem”
13c c) Specific mental health conditions
c) specific mental health conditions and/or disorders that affect mental or cognitive functioning
28 “Dementia” “Stress” “Autism”
14 Non-health outcomes Reference to non-health outcomes e.g. ability to work, financial security
10 “Work – employment” “Financial stability”
15 Other Unintelligible responses or responses that do not fit into the other categories
11 “Having a very high pain threshold” “Quality of each aspect”
16 Relationships Reference to relationships, loneliness and sociability
15 “Personal relationships, family and friends” “Feeling part of society”
17 Respiratory illness Reference to respiratory health and asthma 6 “Asthma”
18 Sensory Reference to sensory deprivation 50 “Vision, hearing” “Loss of any senses”
19 Sexual function Reference to sex 1 “Sex”
20 Skin Reference to skin 1 “Dermatological problems”
21 Spirituality Reference to spiritual health 6 “Spiritual health” 22 Tiredness Reference to tiredness, vitality or sleep 4 “Energy levels”

8
Discussion
The results of this study can be compared to those of Devlin et al. [29], who asked
similar questions to respondents in New Zealand as part of a postal questionnaire. In
that study, 29% of respondents suggested aspects of health not covered by EQ-5D that
they considered to be important. Common responses (aside from miscellaneous concerns
and specific health conditions) included: “fitness”, “happiness”, “spiritual and emotional
health” and “mental health and cognition”. The authors report notably fewer responses
related to communication and sensory capacities than in the present study, but in many
other respects the results of the studies were quite similar. Devlin et al. noted that in
their data a “holistic view of health emerges quite strongly – the idea that health is more
than the absence of problems, consistent with the WHO definition of health” (p.1275) –
this is reflected in some of the responses to task 1 in the present study (Appendix II).
Regarding mental health, Connell et al. carried out interviews with people with mental
health conditions and found that the dimensions included on generic measures, including
EQ-5D, did not cover the domain space well given the wide-ranging impacts of the
conditions [30].
Generic measures, such as EQ-5D, have an important role to play and are well
established in the measurement of health status. They facilitate comparisons between
treatments and disease areas for the purpose of economic evaluation, and are
increasingly used to measure population health and health gain in patients undergoing
routine operations. The findings of this study provide valuable insights into the EQ-5D
descriptive system by highlighting those areas where further evaluation would be
beneficial.
To some extent, the findings of this study support the choice of areas in which
exploratory bolt-on work has been conducted to date, namely sensory deprivation [23]
and mental health/cognition [16,31]. The other aspects of health mentioned by
respondents may inform the agenda for future bolt-on research. Some of the aspects
also reflect areas of health where condition-specific preference-based measures have
been developed as an alternative to generic instruments. Examples include EORTC-8D
for cancer [32], DEMQOL-U for dementia [33] and CORE-6D for general mental health
[34].
This research has identified common areas that general public respondents perceive as
missing from the EQ-5D classification system. Many respondents cited specific medical
conditions rather than generic health dimensions in their responses. This is consistent
with the findings of van Dalen et al., who found that the biomedical dimension of health
was considered important by people, regardless of whether they were considering health

9
in themselves or in others, or good or poor health [9]. The design of our study did not
allow for probing or detailed questioning of the rationales behind respondents’ responses
(for example, to understand whose health they were thinking about).
Further qualitative research is required to establish the potential impacts on health that
people associate with specific conditions. For example, “cancer” (mentioned on 10
occasions in the task 4 responses) has a variety of potential impacts including
(treatment-related) fatigue and the effects on emotional health of a terminal diagnosis.
Condition-specific measures are able to provide a more detailed profile of these impacts.
Both condition-specific and generic instruments can be used alongside each other to
provide a detailed profile of an individual’s health whilst allowing for comparability across
conditions.
Further quantitative research is also required to establish how important the identified
themes are relative to the EQ-5D dimensions (which themselves differ in importance
across different health areas); and whether and what people would be willing to trade for
improvements in the dimensions not currently included in the EQ-5D. Exploratory work
has tested the impact of adding a bolt-on dimension, and on how it interacts with
existing dimensions [14]. It is likely that this would differ depending on the dimension
added.
The methods used by the study team to organise and code the responses into different
themes appear to be feasible for analysing these kinds of qualitative data. The level of
agreement between team members was high, with the majority of responses (74.1% of
task 1 responses; 70.4% of task 4 responses) assigned to the same themes by two team
members independently at step III. Agreement about the coding of all responses was
reached by step V.
Some limitations of the study should be mentioned. Although steps were taken to
minimise bias (such as having different team members code the responses
independently in the first instance), our approach necessarily involved subjective
judgement. Different researchers might have interpreted the responses differently. For
example, we assigned mentions of dementia to the “Specific mental health conditions”
theme on the grounds that it is characterised by mental and cognitive impairment. An
alternative approach would be to include a separate theme to cover dementia. The
subjective judgement involved in these kinds of decisions means that any attempt to
judge a theme that appears more often as being “more important” should be treated
with a degree of caution.
The study sought only views of the general public, many of whom were in good health
(as indicated by the distribution of self-reported EQ-VAS ratings) and claimed to have no

10
experience of serious illness in themselves. Other potentially relevant groups, such as
clinicians and patients, were not involved. Since the EQ-5D is intended to include
dimensions that are “relevant to patients across the spectrum of conditions, as well as to
the general population” [4], it would be informative to undertake a similar study with a
sample comprising patients with high-prevalence conditions.
The results may have been influenced by a type of ordering effect. The tasks described
in this paper were completed by respondents after they had completed a series of health
state valuation tasks (in which they became familiar with the EQ-5D dimensions and
encountered the concepts of “full health” and/or 11111). The findings of this study might
have differed had the respondents been asked to consider the dimensions ‘cold’ – and
indeed, the results of the valuation tasks might also have differed had the follow-up
tasks instead been included as warm-up or ‘priming’ tasks.
Conclusions
Respondents in our survey identified several aspects of health that they considered to be
important but not covered by the EQ-5D descriptive system, with those related to
sensory deprivation and mental health mentioned most often. We hope that this study
can provide a basis for more detailed qualitative and quantitative research to inform
further review of the EQ-5D descriptive system.

11
REFERENCES
1. Grad FP. The Preamble of the Constitution of the World Health Organization. Bulletin
of the World Health Organization 2002;80(12):982.
2. Huber M, Knottnerus JA, Green L, van der Horst H, Jadad AR, Kromhout D, Leonard
B, Lorig K, Loureiro MI, van der Meer JW, Schnabel P. How should we define health?
BMJ 2011;26:343.
3. Jadad AR, O’Grady L. How should health be defined? BMJ 2008;337:a2900.
4. Gudex C. The descriptive system of the EuroQol Instrument. In: Kind P, Brooks R,
Rabin R., eds., EQ-5D concepts and methods: a developmental history. Dordrecht:
Springer; 2005.
5. Williams A. The EuroQol Instrument. In: Kind P, Brooks R, Rabin R. (eds) EQ-5D
concepts and methods: a developmental history. Dordrecht: Springer; 2005.
6. Janssen MF, Birnie E, Haagsma JA, Bonsel GJ. Comparing the standard EQ-5D three-
level system with a five-level version. Value in Health 2008;11:275-84.
7. Karimi M, Brazier J. Health, health-related quality of life, and quality of life: what is
the difference? Pharmacoeconomics 2016;34:645-649.
8. Brooks R. Health status measurement: a perspective on change. Hampshire:
Macmillan Press Ltd, 1995.
9. van Dalen H, Williams A, Gudex C. Lay people’s evaluations of health: are there
variations between different subgroups? Journal of Epidemiology and Community
Health 1994;48:248-53.
10. Janssen MF, Lubetkin EI, Sekhobo JP, Pickard AS. The use of the EQ-5D preference-
based health status measure in adults with Type 2 diabetes mellitus. Diabetic
Medicine 2011;28(4):395-413.
11. Mulhern B, Meadows K. The construct validity and responsiveness of the EQ-5D, SF-
6D and Diabetes Health Profile-18 in Type 2 diabetes. Health and Quality of Life
Outcomes 2014;12(42).
12. Marra CA, Woolcott JC, Kopec JA, Shojania K, Offer R, Brazier JE, Esdaile JM, Anis
AH. A comparison of generic, indirect utility measures (the HUI2, HUI3, SF-6D, and
the EQ-5D) and disease-specific instruments (the RAQoL and the HAQ) in rheumatoid
arthritis. Social Science and Medicine 2005;60:1571-82.
13. Pickard AS, Wilke CT, Lin HW, Lloyd A. Health utilities using the EQ-5D in studies of
cancer. Pharmacoeconomics 2007;25(5):365-84.
14. Longworth L, Yang Y, Young T, Mulhern B, Hernandez-Alava M, Mukuria C, Rowen D,
Tosh J, Tsuchiya A, Evans P. Use of generic and condition specific measures of health
related quality of life in NICE decision making: systematic review, statistical
modelling and survey. Health Technology Assessment 2014;18(9).

12
15. Espallargues M, Czoski-Murray CJ, Bansback NJ, Carlton J, Lewis GM, Hughes LA,
Brand CS, Brazier JE. The impact of age-related macular degeneration on health
status utility values. Investigative Ophthalmology & Visual Science
2005;46(11):4016-23
16. Krabbe PFM, Stouthard ME, Essink-Bot ML, Bonsel G. The effect of adding a cognitive
dimension to the EuroQol multiattribute health-status classification system. Journal
of Clinical Epidemiology 1999;52(4):293-301.
17. Kaarlola A, Pettilä V, Kekki P. Performance of two measures of general health-related
quality of life, the EQ-5D and the RAND-36 among critically ill patients. Intensive
Care Medicine 2014;30(12):2245-52.
18. Mulhern B, Mukuria C, Barkham M, Knapp M, Byford S, Soeteman D, Brazier J. Using
preference based measures in mental health conditions: the psychometric validity of
the EQ-5D and SF-6D. British Journal of Psychiatry 2014;205(3):236-243.
19. Herdman M, Gudex C, Lloyd A, Janssen MF, Kind P, Parkin D, Bonsel G, Badia X.
Development and preliminary testing of the new five-level version of EQ-5D (EQ-5D-
5L). Quality of Life Research 2011;20(10):1727-36.
20. Janssen MF, Pickard AS, Golicki D, Gudex C, Niewada M, Scalone L, Swinburn P,
Busschbach J. Measurement properties of the EQ-5D-5L compared to the EQ-5D-3L
across eight patient groups: a multi-country study. Quality of Life Research
2013;22(7):1717-27.
21. Agborsangaya CB, Lahtinen M, Cooke T, Johnson JA. Comparing the EQ-5D 3L and
5L: measurement properties and association with chronic conditions and
multimorbidity in the general population. Health and Quality of Life Outcomes
2014;12(74).
22. Swinburn P, Lloyd A, Boye KS, Edson-Heredia E, Bowman L, Janssen B. Development
of a disease-specific version of the EQ-5D-5L for use in patients suffering from
psoriasis: lessons learned from a feasibility study in the UK. Value in Health
2013;16(8):1156-62.
23. Yang Y, Rowen D, Brazier J, Tsuchiya A, Young T, Longworth L. An exploratory study
to test the impact on three “bolt-on” items to the EQ-5D. Value in Health
2015;18(1):52-60.
24. Shah KK, Mulhern B, Longworth L, Janssen MF. An empirical study of two alternative
comparators for use in time-trade off studies. Value in Health 2016;19(1):53-9.
25. Oppe M, Devlin NJ, van Hout B, Krabbe PF, de Charro F. A program of methodological
research to arrive at the new international EQ-5D-5L valuation protocol. Value in
Health 2014;17:445-53.
26. Hsieh HF, Shannon SE. Three approaches to qualitative content analysis. Qualitative
Health Research 2005;15(9):1277-88.

13
27. Patton MQ. Enhancing the quality and credibility of qualitative analysis. Health
Services Research 34(5 Part 2);1189-208.
28. Office for National Statistics. Census: Digitised Boundary Data (England and Wales)
[computer file]. UK Data Service Census Support; 2011. Available from:
http://edina.ac.uk/ukborders [Accessed October 23, 2014]
29. Devlin NJ, Hansen P, Selai C. Understanding health state valuations: a qualitative
analysis of respondents’ comments. Quality of Life Research 2004;13(7):1265-77.
30. Connell J, O'Cathain A, Brazier J. Measuring quality of life in mental health: Are we
asking the right questions? Social Science and Medicine 2014;120:12-20.
31. Janssen MF, Krabbe PFM, Lamers L, Oppe M, Stolk E, Vermeulen K, van Hout B. The
Cognition dimension revisited: a detailed study on its added value and interactions
with EQ-5D core dimensions. Paper presented at the EuroQol Plenary Meeting,
Montreal; 2013.
32. Rowen D, Brazier J, Young T, Gaugris S, King M, Craig B, Velikova G. Deriving a
preference based measure for cancer using the EORTC QLQ-C30. Value in Health
2011;14(5):721-31.
33. Mulhern B, Rowen D, Brazier J, Smith S, Tait R, Watchurst C, Chua KC, Loftus V,
Young TA, Lamping D, Knapp M, Howard RJ, Banerjee S. Development of DEMQOL-U
and DEMQOL-Proxy-U: Generation of preference based indices from DEMQOL and
DEMQOL-Proxy for use in economic evaluation. Health Technology Assessment
2013;17(5).
34. Mavranezouli I, Brazier JE, Rowen D, Barkham M. Estimating a preference-based
index from the Clinical Outcomes in Routine Evaluation-Outcome Measure (CORE-
OM): valuation of CORE-6D. Medical Decision Making 2013;33(3):381-95.

14
Appendix I: Follow-up questionnaire
Task 1
Please look at the following two health descriptions.
No problems in walking about
No problems washing or dressing yourself
No problems doing your usual activities Full Health
No pain or discomfort
Not anxious or depressed
Do you consider these descriptions to be the same as each other?
Yes No
If no:
Please explain what you think makes them different from each other
______________________________________________________________________
______________________________________________________________________
______________________________________________________________________
______________________________________________________________________
______________________________________________________________________

15
Task 2
Please look at the following health descriptions and rank them on the scale below in
order from best to worst (where 0 is the worst health imaginable and 100 is best health
imaginable).
To do this, please write the letter in the right hand corner of the health description on
the scale below next to the number that you want to give to that description
Health states can be ranked the same.
No problems in walking about
No problems washing or dressing yourself
No problems doing your usual activities Full Health
No pain or discomfort
Not anxious or depressed
A
B
No problems in walking about Moderate problems in walking about
No problems washing or dressing yourself Severe problems washing or dressing yourself
Slight problems doing your usual activities No problems doing your usual activities
No pain or discomfort Extreme pain or discomfort
Not anxious or depressed
C
Extremely anxious or depressed
D

16
Task 3
Please look at the following health descriptions.
Health description Rank
Full health
Perfect health
No health problems
Best imaginable health
No problems in walking about
No problems washing or dressing yourself
No problems doing your usual activities
No pain or discomfort
Not anxious or depressed
Healthy
Which of the above would you most want to live in? Please write a number 1 in
the appropriate box.
Which of the above would you least like to live in? Please write a number 6 in the
appropriate box.
Please rank the other descriptions in the order that you would want to live in
them (from 2 to 5).

17
Task 4
Consider the following dimensions:
Mobility – Ability to walk about
Self-care – Ability to wash or dress yourself
Usual Activities – Ability to do usual activities
Pain or discomfort – Level of pain or discomfort
Anxiety or depression – Level of anxiety or depression
Are there aspects of health that are not included above that you consider to be
important? If yes, what are they?
Yes No
______________________________________________________________________
______________________________________________________________________
______________________________________________________________________
______________________________________________________________________
______________________________________________________________________
Task 5
Are there aspects of quality of life that are not included above that you consider to be
important? What are they?
Yes No
______________________________________________________________________
______________________________________________________________________
______________________________________________________________________
______________________________________________________________________
______________________________________________________________________

18
Appendix II: Responses to tasks 1, 2, 3 and 5
Task 1: Are 11111 and full health “the same as each other”
When asked whether they considered 11111 and full health to be the same as each
other, 305 respondents (70.0%) answered “Yes”.
The 131 respondents who answered “No” were then asked to explain what makes 11111
and full health different from each other. One-hundred and thirty-nine responses were
provided, with a small number of respondents providing explanations that could be
separated into multiple distinct responses. After familiarising themselves with the data,
the study team identified six themes (Table 2) and set out to assign each response to
one or more of those themes.
BM and LL first coded the responses independently of each other (assigning each
response into one of the six themes and providing a short written justification). One-
hundred and nine of the 139 responses (74.1%) were assigned to the same theme by
both authors. Following discussion between BM and LL and examination of each other’s
justifications, agreement was reached about 132 of the 139 responses (95.0%). The
views of a third author, KS, were sought regarding the remaining seven responses. KS
was able to make a decision about all seven responses. In all cases, KS chose a theme
that had initially been proposed by either BM or LL.
Comments suggesting that the five EQ-5D dimensions are not exhaustive of all
conditions and health problems were made most frequently, accounting for 50 of the 139
responses (Table 2). Another common theme comprised comments that suggested that
people with medical conditions with mild or no apparent symptoms could nevertheless be
considered to be in a state of less than full health.
Table 2. Themes used for coding of open-ended responses to task 1 (what makes 11111 and full health different)
No. Theme name No. responses assigned to theme
Theme description Examples
1 Asymptomatic or mild disease
31 People with an illness may have no/few symptoms or may not be in need of health care. This could be due to the mildness of their condition or the absence of symptoms.
“Could have a tumour without having symptoms” “You can have a condition that can affect your life but not in a bad way, but you are not in full health.”
2 Five dimensions not exhaustive of all conditions
50 Some conditions affect health dimensions not covered by the five EQ-5D dimensions. This could be stated either in general terms or in reference to specific conditions/dimensions not covered (e.g. vision problems).
“The left-hand side does not mention all faculties, e.g. sight, hearing, mental.” “You can have respiratory problems and still be able to do the above.”

19
No. Theme name No. responses assigned to theme
Theme description Examples
3 Physicality and Fitness
10 People in state 11111 may not be ill but could be fitter or more physically active, and so are not necessarily in “full health”.
“Full health implies no illness and fully fit rather than just ‘no problems’.”
“You may be able to walk next to a person but when running together there may be a difference in distance and speed.”
4 Wellbeing 27 The five dimensions do not capture wellbeing, quality of life, spirituality or lifestyle aspects.
“Health isn't just the absence of illness or injury, it is a state of wellbeing.” “Full health is a collection of factors - physical, psychological and social wellbeing. Someone can have everything on the left-hand side of the list and still not be in full health because of loneliness.”
5 Same 3 Full health and 11111 are the same as each other.
“They are similar.”
6 Other 18 Responses that are unintelligible, do not fit into the other categories, or do not contain enough information to allow categorisation.
“Because it doesn't ask about or mention any past problems.”
Task 2: Visual analogue scale rating of 11111 and full health
374 respondents (85.8%) gave full health a rating of 100 (mean rating: 98.6; standard
deviation: 4.3). By contrast, 253 respondents (58.2%) gave 11111 a rating of 100
(mean rating: 95.1; standard deviation: 7.8). Respondents who had previously stated
that they considered 11111 and full health to be the same as each other were
statistically significantly more likely to have given the same rating to both descriptors
(chi-squared test; p<0.01).
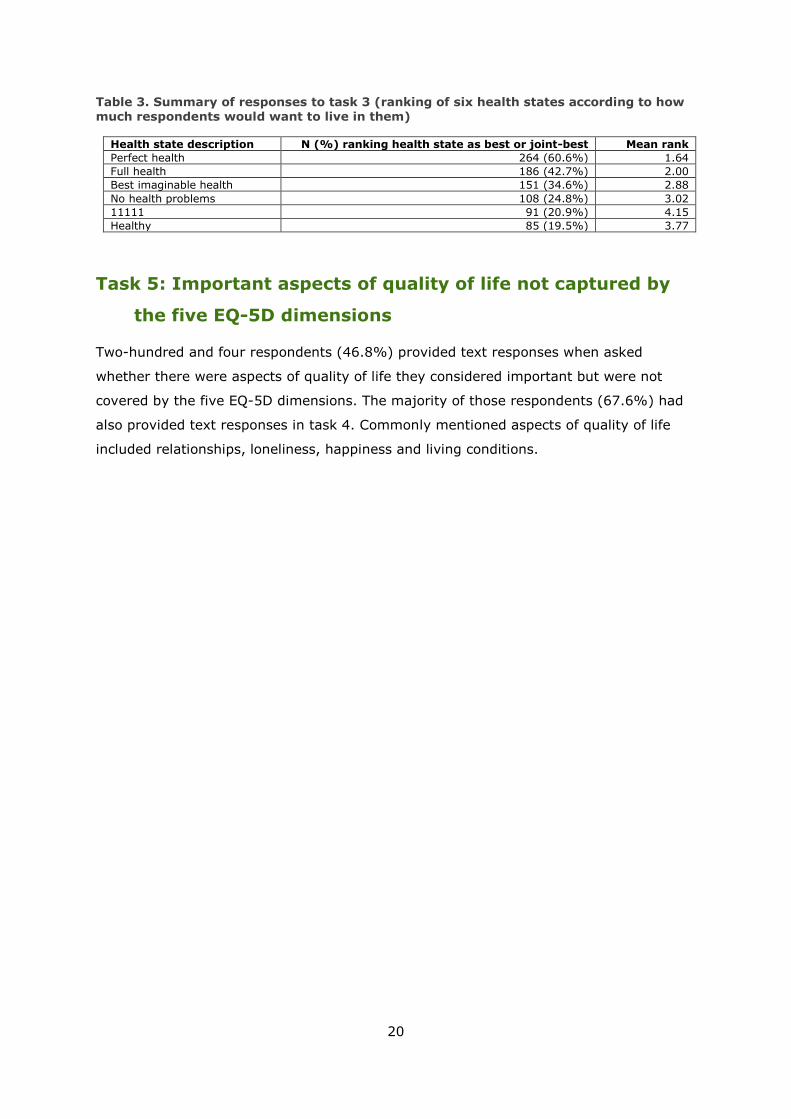
Task 3: Ranking of six health state descriptions
Of the six health state descriptions included in the ranking task, “perfect health” was
most often ranked as the state that respondents most wanted to live in (ranked best or
joint-best by 60.5% of respondents). Full health and 11111 were ranked best or joint-
best by 42.7% and 20.9% of respondents, respectively.
Table 3 shows how many times each health state was ranked best or joint-best.
20
Table 3. Summary of responses to task 3 (ranking of six health states according to how much respondents would want to live in them)
Health state description N (%) ranking health state as best or joint-best Mean rank
Perfect health 264 (60.6%) 1.64
Full health 186 (42.7%) 2.00
Best imaginable health 151 (34.6%) 2.88
No health problems 108 (24.8%) 3.02
11111 91 (20.9%) 4.15
Healthy 85 (19.5%) 3.77
Task 5: Important aspects of quality of life not captured by
the five EQ-5D dimensions
Two-hundred and four respondents (46.8%) provided text responses when asked
whether there were aspects of quality of life they considered important but were not
covered by the five EQ-5D dimensions. The majority of those respondents (67.6%) had
also provided text responses in task 4. Commonly mentioned aspects of quality of life
included relationships, loneliness, happiness and living conditions.