eurostat's indicator and environmental accounts activities
TRANSCRIPT

Eurostat's indicator and
environmental accounts
activities
Anton Steurer
Head of Unit Eurostat E2 – Environment statistics and accounts; sustainable development
Presentation at UNCEEA
25-27 June 2014, New York 1
Overview of presentation
• Indicator activities: resource efficiency scoreboard, Europe 2020 and SDI
• Environmental accounts as producers of indicators and latest developments
2

Eurostat
3
Information pyramid layers:
Data
Accounts
Indicators

Eurostat
RESOURCE EFFICIENCY SCOREBOARD –policy background
Europe 2020 strategy� Sustainable growth: promoting a resource efficient, greener and more competitive economy
� A resource-efficient Europe: Flagship initiative under the Europe 2020 Strategy
� Roadmap to a resource-efficient Europe
� Scoreboard of indicators
4

Eurostat
RESOURCE EFFICIENCY SCOREBOARD – structure
A three-tier system based on available statistics from Eurostat, the EEA, the
JRC and other international recognised sources
�Lead indicator (Resource productivity, DMC) (from envt. accounts)
�Dashboard indicators (Land, Water, Carbon)
�Sets of theme-specific indicators
� 'Transforming the economy' (Waste, Innovation, Getting prices right)
� 'Natural capital and ecosystem services' (Biodiversity, Air, Land, Marine resources)
� 'Key areas' (Food, Buildings, Mobility)
�Press release 186/2013 of 6 Dec. 2013
5

Eurostat
RESOURCE EFFICIENCY SCOREBOARD on the Eurostat website
6

Eurostat
7

� Structured along the five headline targets
� Long time series
� Data on EU and Member States
� Country profiles
� Complemented by interactive tools
Smarter, greener, more inclusive? Indicators to support the Europe 2020 strategy

Eurostat
9
EUROPE 2020 INDICATORS
• 5 main themes• 8 headline indicators• 80+ descriptive indicators

Eurostat
MODERN DISSEMINATION OF INDICATORS - 2020 flexible dashboards
Main page Subpages

Eurostat
11
SUSTAINABLE DEVELOPMENT INDICATORS
• 10 main themes• 12 headline indicators• 100+ total indicators
Methodology for indicator based assessment:
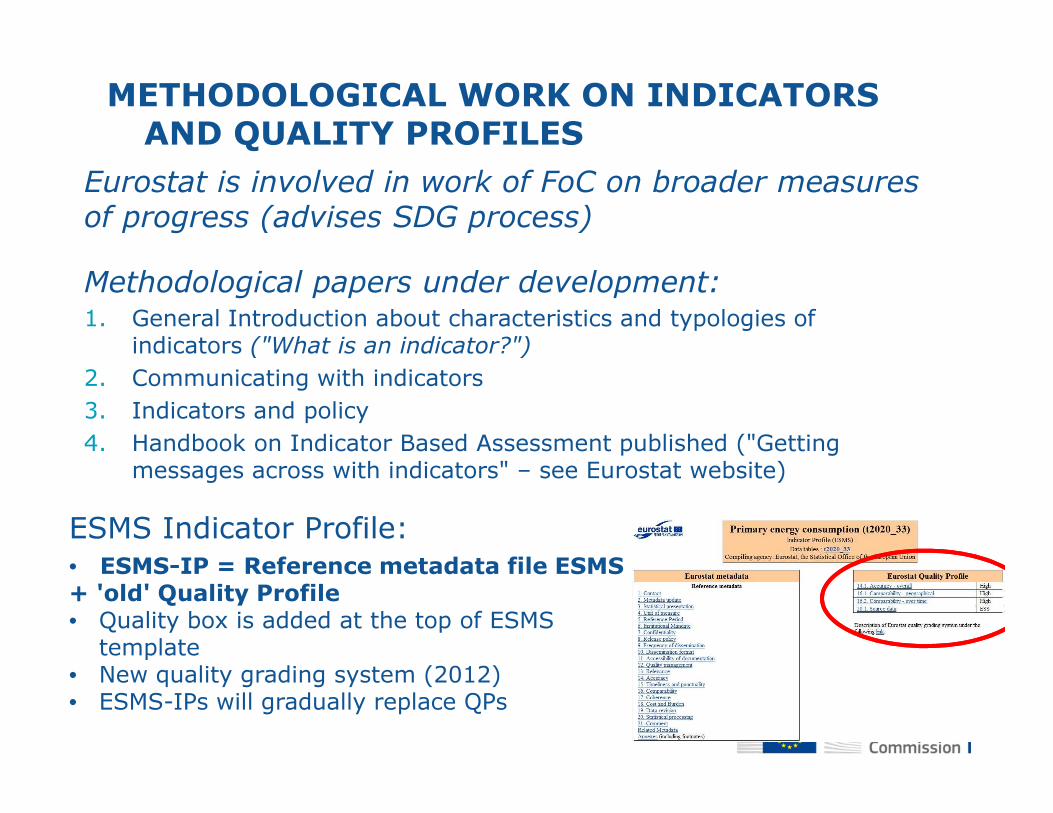
Eurostat is involved in work of FoC on broader measures of progress (advises SDG process)
Methodological papers under development:1. General Introduction about characteristics and typologies of
indicators ("What is an indicator?")
2. Communicating with indicators
3. Indicators and policy
4. Handbook on Indicator Based Assessment published ("Getting messages across with indicators" – see Eurostat website)
METHODOLOGICAL WORK ON INDICATORS AND QUALITY PROFILES
ESMS Indicator Profile:
• ESMS-IP = Reference metadata file ESMS + 'old' Quality Profile • Quality box is added at the top of ESMS
template• New quality grading system (2012)• ESMS-IPs will gradually replace QPs

Europe's progress in environmental accounting
� Pilot work with Member States since 1990s
� Handbooks and voluntary data collections – updates 2014-5
� European Strategy for Environmental Accounts – new 2014
� Legal acts:
� Regulation (EU) No 691/2011 on European environmental economic accounts - 3 modules with data
transmission obligatory since 2013:
• Air emissions (14 pollutants x NACE A*64 + households)
• Environmental taxes (4 types x NACE A*64 + households)
• Material flow accounts (some 50 categories -> Direct Material Consumption indicator to measure resource productivity)
• Regulation No 534/2014 amending 691/2011 in
force since 16 June 2014 adds 3 new modules with data
transmission obligatory from 2017:
• Environmental protection expenditure account
• Environmental goods and services account
• Physical energy flow accounts
13

Example: IO modelling with air emission accounts: carbon footprints 2009
t/cap
8.0 t/cap
7.9 t/cap
9.4 t/cap 9.4 t/cap
EU
-2
7 d
om
esti
c p
ro
du
cti
on
14

Residence principle (used in the national
accounts) versus territory principle (differences can be big for some countries)
Air pollutant: Carbon Dioxide (CO2)
Unit: 1000 tonnes (Gg)Bridging items
2010 2011
Total Air emissions accounts (industry + household s) 86,649.48 84,226.03less National residents abroad 38,442.32 40,939.31 National fishing vessels operating abroad - - Land transport 1,798.18 1,323.68 Water transport 34,465.39 37,445.88 Air transport 2,178.76 2,169.76plus Non-residents on the territory 603.61 603.61 Land transport 603.61 603.61 Water transport - - Air transport - -Other adjustments and statistical discrepancy - -
'Total CO 2 emissions without LULUCF' as reported to UNFCCC 48,810.76 43,890.32Year of submission to UNFCCC 2013 2013
DENMARK
15

Example: Environmental tax revenue by type, EU-28, 2002 – 2012
(million EUR and % TSC)
4.5
5.0
5.5
6.0
6.5
7.0
7.5
0
50 000
100 000
150 000
200 000
250 000
300 000
350 000
2002 2003 2004 2005 2006 2007 2008 2009 2010 2011 2012
% T
SC
Mio
eu
ro
Energy taxes Transport taxes Pollution/resource taxes Total env. taxes in % of TSC
16

Example: Environmental taxes in % of TSC and GDP, 2 012
• *Data for Hungary are preliminary
17
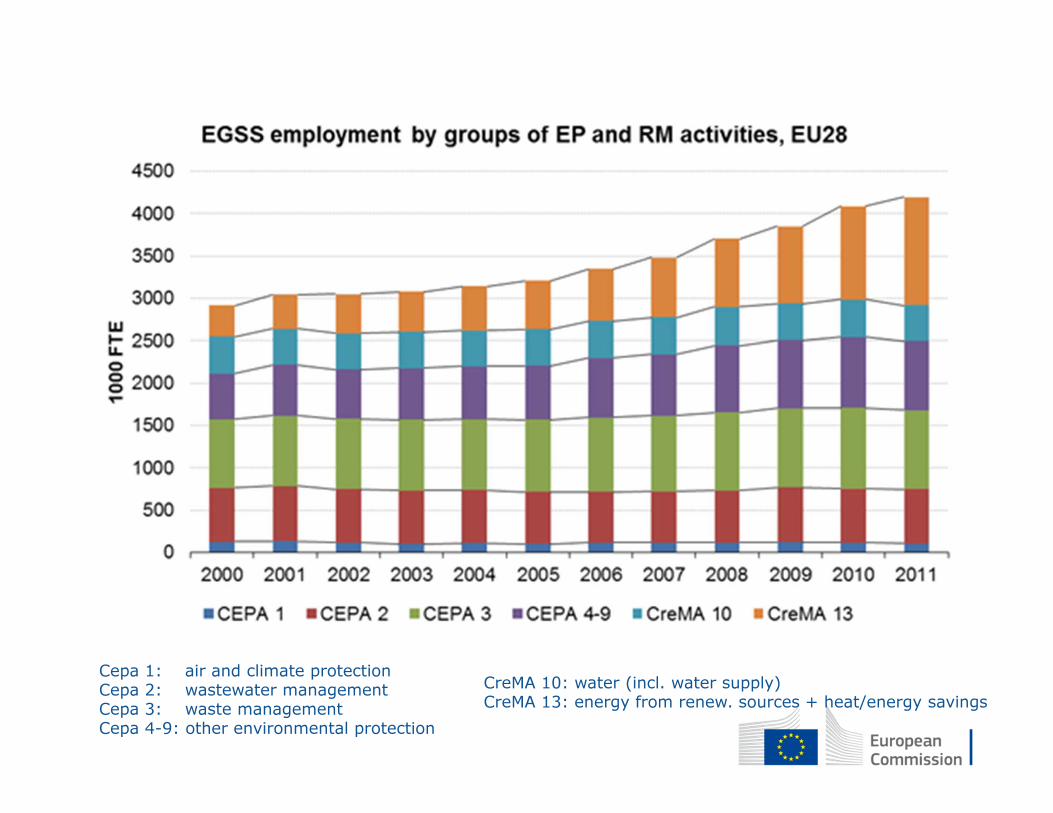
Cepa 1: air and climate protectionCepa 2: wastewater managementCepa 3: waste managementCepa 4-9: other environmental protection
CreMA 10: water (incl. water supply)CreMA 13: energy from renew. sources + heat/energy savings

Example: Resource productivity
19

20
Information pyramid layers:
Data
Accounts
Indicators

Overview of RE indicators from official statistics
STATISTICS and ACCOUNTS
� Land cover and land use statistics (and accounts)
� Energy statistics (and accounts)
� Waste statistics and other waste legislation (Waste Data centre)
� Chemicals
� Water statistics (and accounts)
� Forestry statistics (and accounts)
� Environmental accounts
� EE SUIOT
Some INDICATORS
Land use indicators
Protected areas
Energy efficiencyCO2 early estimatesRenewable energy
Waste generation (activity/waste category)
Waste Treatment (Recycling, incineration…)
Municipal Waste generation and treatment
Hazardous waste…Production harmful / toxic chemicals
Exploitation of water resourcesWastewater treatmentForest surface
Resource productivityDomestic material consumption (DMC)Environmental taxes / protection
expenditure indicatorsGHG emissions and air pollution
Carbon footprint / RMC
21

Next steps – the new European Strategy for Environmental Accounts 2014-2018
The 3rd 5-year strategy after ESEA 2003 and 2008 –adopted by ESSC on 15 May 2014. Main elements:
• Further improve quality of 1st set of modules (air emissions, environmental taxes, material flows)
• Promote uses of available data (e.g. footprints)
• Faster publication & early estimates for EU aggregates
• Implement 2nd set of modules (EPE, EGSS, PEFA)
• Invest in statistical infrastructure (classifications, cooperation with other statistical areas…)
• Develop methods/test new modules (water, forests, environmental subsidies, resource management)
• (Assist EEA on ecosystem accounting)
• (Implement climate-change related statistics)
22
Tools in the EU
Regulation: an obligation
Monitoring compliance (blame and fame)
Supplementary voluntary data collections
Task forces and Working groups
Handbooks and compilation guides
Training material and training courses
Financing implementation in EU (grants)
23

24
Example: Handbooks and compilation guides