evaluating and promoting the financial viability and
TRANSCRIPT

www.rpkgroup.com
Evaluating and Promoting the Financial Viability and Success of Our Postsecondary Institutions
SHEEO – State Agency Workshop
August 6, 2019
Grand Ballroom C

rpkGROUP. All rights reserved.
www.rpkgroup.com
Agenda
▪ Welcome and Session Leader Introductions – 5 minutes
▪ The State of Higher Education –30 minutes
▪ Introducing the ROI Lens –20 minutes
▪ Defining Success Under an ROI Lens – 45 minutes
▪ Break – 10 minutes
▪ Using the ROI Lens to Recognize Institutional Distress/Support Sustainable Models –45 minutes
▪ Break to get Lunch and Return to Room – 15 minutes
▪ Small Group Work – Case Study – 1 hour
▪ Action Plan Creation –15 minutes
2

rpkGROUP. All rights reserved.
www.rpkgroup.com
Session Leaders
▪ State Representatives
– Michael Duffey, Senior Vice Chancellor (OH)
– Terrence Ginn, Deputy Commissioner for Finance and Administration (LA)
– Matthew LaBruyere, Associate Commissioner for Finance and Administration (LA)
– Thomas Simard, Deputy Commissioner for Administration & Finance (MA)
▪ rpk GROUP
– Rick Staisloff, Senior Partner
– Donna Desrochers, Associate
– Lysa Teal, Senior Associate
– Tammy Kolbe, Associate Professor of Educational Leadership & Policy Studies at the University of Vermont.
3

rpkGROUP. All rights reserved.
www.rpkgroup.com
The State of Higher Education Finance
4

rpkGROUP. All rights reserved.
www.rpkgroup.com
What is the Current State of Higher Education Finance?
▪ How are affordability, finance, and outcomes connected?
▪Where does the money come from?
▪ Where does it go?
▪ How do institutional characteristics impact spending?
▪What levers and metrics can help colleges and universities implement and assess sustainable change?
5

rpkGROUP. All rights reserved.
www.rpkgroup.com
Connecting Affordability, Finance and Outcomes
6

rpkGROUP. All rights reserved.
www.rpkgroup.com
Colleges Increasingly Rely on Student Funding
7

rpkGROUP. All rights reserved.
www.rpkgroup.com
Education-related Spending per Student Increased
8

rpkGROUP. All rights reserved.
www.rpkgroup.com
Student Share of Spending is Trending Back Down
9

rpkGROUP. All rights reserved.
www.rpkgroup.com
Degree Productivity Helps Offset Spending Increases
10

rpkGROUP. All rights reserved.
www.rpkgroup.com
Cost Efficiency Reveals Room for Improvement
11

rpkGROUP. All rights reserved.
www.rpkgroup.com
Spending per Completion Varies Within College TypeAcross public higher education, the most cost-efficient institutions spend about
$50k - $85k less per credential awarded than the least cost-efficient institutions.
12

rpkGROUP. All rights reserved.
www.rpkgroup.com
Institutional Characteristics Vary and Impact Spending
Educational Spending
Program Mix
Faculty/ Staff Mix
Student Mix
13

rpkGROUP. All rights reserved.
www.rpkgroup.com
Metrics and Levers to Support Sustainable Change
14

rpkGROUP. All rights reserved.
www.rpkgroup.com
Discussion Questions
15
1. What did the data confirm?
2. What was surprising?
3. How does this data inform your evolving role and an understanding of the challenges you will face?

rpkGROUP. All rights reserved.
www.rpkgroup.com
Introducing the ROI Lens
16

rpkGROUP. All rights reserved.
www.rpkgroup.com
17
Access, Affordability, Attainment
Move from Spending to Investment
Change infrastructure and
culture
then we must get
a better return on
investment from
current resources
through
understanding
levers to change
the business
model…
If we are to
preserve access,
ensure affordability
and increase
attainment, in a
world of
constrained
resources and
fewer students…
which will require a
strategic approach
connecting financial
practice with
institutional change
models and culture.
Need to Shift the Frame:from Cost Cutting to Maximizing Return on Investment
Why Talk About Strategic Finance in Higher Education?

rpkGROUP. All rights reserved.
www.rpkgroup.com
What Do We Mean by ROI?
18
Once these ROI shifts occur:
➢ Institutional cost savings can be utilized to reduce pressures on price increases.
➢ Institutions are empowered to generate more of the resources needed for reinvestment in education quality and attainment.

rpkGROUP. All rights reserved.
www.rpkgroup.com
ROI Means Different Things for Different Stakeholders
StudentsReduced/Stabilized Price, Reduced Time to Degree, Reduction in Excess Credits
InstitutionsIncrease in Net Revenue, Reduced Unit Costs (e.g., Per SCH, Per Completion)
SystemsReduction in Duplication of Effort, Creation of Shared Services
StatesIncrease in Attainment, Reduced Cost per Completion, Addressing Workforce Shortages
FederalStewardship of taxpayer resources
19

rpkGROUP. All rights reserved.
www.rpkgroup.com
How Does ROI Connect to Student Affordability?
• Understanding programs and services that generate net revenue
• Streamlining support services
• Aligning resources with student success investments
• Removing obstacles from attainment pathways
• Tracking metrics that demonstrate unit cost and student success
ROI Solutions
• Increasing governmental support (state/local)
• Increasing financial aid
Revenue SolutionsResult of Using ROI Solutions
Historically, affordability has been approached with revenue based solutions. ROI solutions look to reduce the cost of delivering quality learning that leads to a credential.
• Reduction/stabilization of
cost, taking pressure off of
price increases
• Increased efficiency in
delivery of programs and
services
• Alignment of
affordability/attainment
strategies with resources
(people, time and dollars)
20

rpkGROUP. All rights reserved.
www.rpkgroup.com
Lessons Learned
➢ Applying an ROI lens has to touch on culture and be
recognized as a change management process.
➢ Institutions need a framework to have the ROI conversation.
➢ That framework must reflect different views of ROI for different stakeholders.
➢ Once the framework is in place, tools can be used across the institution and system.
➢ The use of an ROI lens can create engagement across institutions and systems.
21

rpkGROUP. All rights reserved.
www.rpkgroup.com
Process with a Peer
22
• Is higher education ready to adopt an ROI lens?• How does ROI represent a new way to consider the use of resources in
higher education?• How might the use of an ROI lens impact the SHEEO role?

rpkGROUP. All rights reserved.
www.rpkgroup.com
Defining Success Under an ROI Lens
23

rpkGROUP. All rights reserved.
www.rpkgroup.com
What Does “Success” Look Like?
▪ Questions for consideration and discussion:
– How does your organization and/or state define “success” for colleges and universities –
in the short, medium, and long-term?
– What metrics and data are available to you and your constituents to measure/track
success?
– In what ways does a focus on institutional outcomes as a definition of “success” create
opportunities and challenges for your organization?
24

rpkGROUP. All rights reserved.
www.rpkgroup.com
Defining success under an ROI lens:Ohio’s push toward outcome-based funding
Ohio’s Outcome Based Funding
25

rpkGROUP. All rights reserved.
www.rpkgroup.com
Ohio’s Existing Performance-Based Funding
Ohio’s basic subsidy is called the “State Share of Instruction” (SSI) and is 100% performance-based. Here is the current allocation:
SSI is funded at $2.02B in FY2020 and $2.04B in FY2021.
26

rpkGROUP. All rights reserved.
www.rpkgroup.com
Ohio’s Existing Performance-Based Funding
Each course is assigned to one of 26 cost models (subject/level):
• Arts & Humanities (1-6)• Business, Education and Social Sciences (1-7)• Science, Technology, Engineering, Math and Medical (1-9)• Doctoral (1-2)• Medical (1-2)
We utilize consultations with IHEs to decide weights/factors. Based on feedback and consensus, Ohio adjusted at-risk categories and details of calculations.
The more expensive the program, the more funding provided.
27

rpkGROUP. All rights reserved.
www.rpkgroup.com
Ohio’s Existing Performance-Based Funding
Degree completion: Number of degrees awarded per year growing while enrollment is falling
28

rpkGROUP. All rights reserved.
www.rpkgroup.com
Ohio’s Existing Performance-Based Funding
Retention at Ohio’s public colleges and universities is improving
29

rpkGROUP. All rights reserved.
www.rpkgroup.com
Unemployment Insurance Wage Match
This is a standard unemployment insurance (UI) wage match (removed PI) available in Ohio through ODJFS.
30

rpkGROUP. All rights reserved.
www.rpkgroup.com
Unemployment Insurance Wage Match
This is an example report of degrees by CIP code matched to median earnings.
31

rpkGROUP. All rights reserved.
www.rpkgroup.com
Unemployment Insurance Wage Match
And matched to institution, degree and program.
32

rpkGROUP. All rights reserved.
www.rpkgroup.com
Employment Metrics
The state budget enacted this past month tasks our department with exploring the use of employment data to allocate
state share of instruction funding.
“(J) STUDY ON THE USE OF EMPLOYMENT METRICS FOR THE STATE SHARE OF INSTRUCTION FORMULAS
The Inter-University Council and Ohio Association of Community Colleges shall each recommend eight members
representing their institutions to serve on the Employment Metrics Consultation, which shall assist the Chancellor of
Higher Education to study the most appropriate formula weights for post-graduation employment measures that
may be used in the distribution to universities and community colleges from the foregoing appropriation item
235501, State Share of Instruction, beginning in fiscal year 2022. The Chancellor, or the Chancellor's designee,
shall lead the Consultation and call its first meeting. The Consultation shall research the most appropriate data sources
available to measure employment outcomes and evaluate the public policy benefits of adding such measures to the
current State Share of Instruction allocation formulas to reward institutional performance of job placement. The
Consultation shall also identify and evaluate the most critical factors that should be considered as
possible enhancements to the formula, such as the relevance of graduates‘ degrees to job placement, employment
in Ohio versus out of state, placement in high demand fields, and other qualitative factors. Separate allocation
factors may be considered within each sector's share of the foregoing appropriation item 235501, State Share of
Instruction. The study shall be completed by June 30, 2020.”
133rd General Assembly, HB 166, pages 2462-2463
33

rpkGROUP. All rights reserved.
www.rpkgroup.com
Outcomes-Based Funding Formula
34

rpkGROUP. All rights reserved.
www.rpkgroup.com
Outcomes-Based Funding Formula - LA
▪ Act 462 of 2014 required Board of Regents (BOR) and management boards to create an outcomes-based formula;
▪ Funding formula is aligned to Master Plan and Attainment Goal;
▪ Formula alignment is focused on:– Student completion;
– Equity completion (adults, income equity, and equity populations); and
– Economic development through workforce and research.
3535

rpkGROUP. All rights reserved.
www.rpkgroup.com
Outcomes-Based Funding Formula - LA
▪ Base – prior year funding allocation;
▪ Cost – includes weighted credit hours (based on level of student and program), SREB peer group data, class size, and support services;
▪ Outcomes - includes completer levels, transfers, completers in high demand fields (4&5-star jobs), time-to-degree, and enrollment and completion of Pell grant and adult students, and research.
36
Base, 70.0%
Cost, 15.0%
Outcomes, 15.0%
FY17
Base, 65.0%
Cost, 17.5%
Outcomes, 17.5%
FY18
Base, 63.0%
Cost, 17.0%
Outcomes, 20.0%
FY19
$477.3M $483.0M $485.2M
36

rpkGROUP. All rights reserved.
www.rpkgroup.com
Future Data Analysis - LA
▪ BOR currently matches completers by degree program to high wage/high demand jobs determined by LA Dept. of Economic Development.
▪ Next step is to begin using Unemployment Insurance (UI) wage data to better understand the following:– Industries completers are employed;
– Wages earned by completers;
– Wages earned by discipline.
▪ Issues receiving data from other state agencies.
3737

rpkGROUP. All rights reserved.
www.rpkgroup.com
Exit Ticket for Break - Polling Slides
38
1. Use your device to go to: www.menti.com
2. Enter code: 45 09 14
3. Submit answers to two polling questions

rpkGROUP. All rights reserved.
www.rpkgroup.com
Break
39

rpkGROUP. All rights reserved.
www.rpkgroup.com
Feedback from Polling Slides
40

rpkGROUP. All rights reserved.
www.rpkgroup.com
Implementing an ROI Lens to Recognize Institutional Distress and Support Sustainable Models
41

rpkGROUP. All rights reserved.
www.rpkgroup.com
ROI Lens
Metrics
Regulatory
Bodies
Financial Viability Process
(OH)
OUTCOMES
Financial Viability
Assessment
(LA)
Putting ROI into Action
42

rpkGROUP. All rights reserved.
www.rpkgroup.com
Are You Ready for Action?
▪How effective are the tools you have in your state to recognize distress?
▪If you find yourself in this situation, do you have the mechanisms to intervene?
▪Who shares responsibility (accrediting body, legislature, attorney general)?
43

rpkGROUP. All rights reserved.
www.rpkgroup.com
Recognizing and Addressing Distress –Massachusetts
44

rpkGROUP. All rights reserved.
www.rpkgroup.com
• 40% saw expense growth increase by five percentage points or more above revenue growth from 2012 to 2017
• 35% saw a decline in their average U.S. Department of Education Financial Responsibility Composite Score in the five-year period ended 2017
• 31% saw cumulative decreases in fall enrollment greater than 10% from FY2012-17, up from 14% during the prior five years
• 25% received C- or below on the Forbes College Financial Grades list in 2017
Many Private Nonprofit Institutions of HE Show Signs of Distress
45

rpkGROUP. All rights reserved.
www.rpkgroup.com
Massachusetts’ Proposed Regulatory Review Process
I. Annual Review Process – Screening & Inquiry
– Risk Mitigation
Review & Monitoring
– Contingency Closure
Planning & Notice
II. Advisory Committee
III. Confidentiality
IV. Sanctions
46

rpkGROUP. All rights reserved.
www.rpkgroup.com
Massachusetts’ Annual Review Process
47
Annual Review Process
• of all IHEs• BHE Mandate: DHE annual function• Multiple measures and sources*• Defined Standard: “at risk of imminent closure”
• Approaching the 18-month rule*
• opened for those ID’d as “at risk”• Opportunity to review results and respond• False positives: Screened out• Risk confirmed: IHE moves to next phase
• To be refined through policy

rpkGROUP. All rights reserved.
www.rpkgroup.com
Massachusetts’ Annual Review Process (continued)
48
• IHEs screened as “at risk” must submit Risk Mitigation Plans to Commissioner
• Content: Must substantiate capacity to substantially fulfill obligations to students for next 18 months
• Notice to IHE governing board by DHE
• Commissioner reviews and determines* whether Plans demonstrate likelihood of mitigating “risk of imminent closure”
• If yes,
• If no, plus *
* Use of Advisory Committee Review and Recommendations at these critical stages

rpkGROUP. All rights reserved.
www.rpkgroup.com
Fiscal Health Analysis
49

rpkGROUP. All rights reserved.
www.rpkgroup.com
Fiscal Health Analysis - LA
▪ In FY2017, BOR adopted a financial early warning system for the financial stress of institutions.
▪ The analysis is based on the Ohio model and provides a score based on the following:– Viability ratio: Expendable net assets divided by plant debt;
– Reserve ratio: Expendable net assets divided by total operating expenses; and
– Net income ratio: Change in total net assets divided by total revenues.
▪ A score of 1.75 places an institution on fiscal watch.
5050

rpkGROUP. All rights reserved.
www.rpkgroup.com
Fiscal Health Analysis - LA
▪ Fiscal watch requires the system office submit a corrective action plan for the Board to review.
▪ The Fiscal Health Analysis identified an institution in FY17 that was under financial stress.
▪ In FY18, the analysis identified the same institution remained under financial stress.– Same year, the accrediting body placed the institution on watch status.
▪ Utilizing the accrediting body document and the corrective action plan submitted to BOR, the institution was able to receive additional funds from the legislature to correct the financial instability.
5151

rpkGROUP. All rights reserved.
www.rpkgroup.com
Defining success under an ROI lens:Ohio’s push toward outcome-based funding
Recognizing Institutional Distress in Ohio
52

rpkGROUP. All rights reserved.
www.rpkgroup.com
ROI Lens to Recognize Institutional Distress - OhioSB 6 of the 122nd General Assembly was enacted into law in 1997. It came as the result of financial issues and a state “bailout” at Central State University.
Using year-end audited financial statements submitted by each public IHE, the Ohio Department of Higher Education monitors each respective campus’s finances.
Senate Bill 6 requires state IHEs to submit quarterly financial reports to the Ohio Department of Higher Education within 30 days after the end of each fiscal quarter.
Failure to provide the financial data results in the state withholding monthly subsidy payments (SSI) until the quarterly report is received.
Learn more: https://www.ohiohighered.org/campus-accountability53
rpkGROUP. All rights reserved.
www.rpkgroup.com
ROI Lens to Recognize Institutional Distress - Ohio
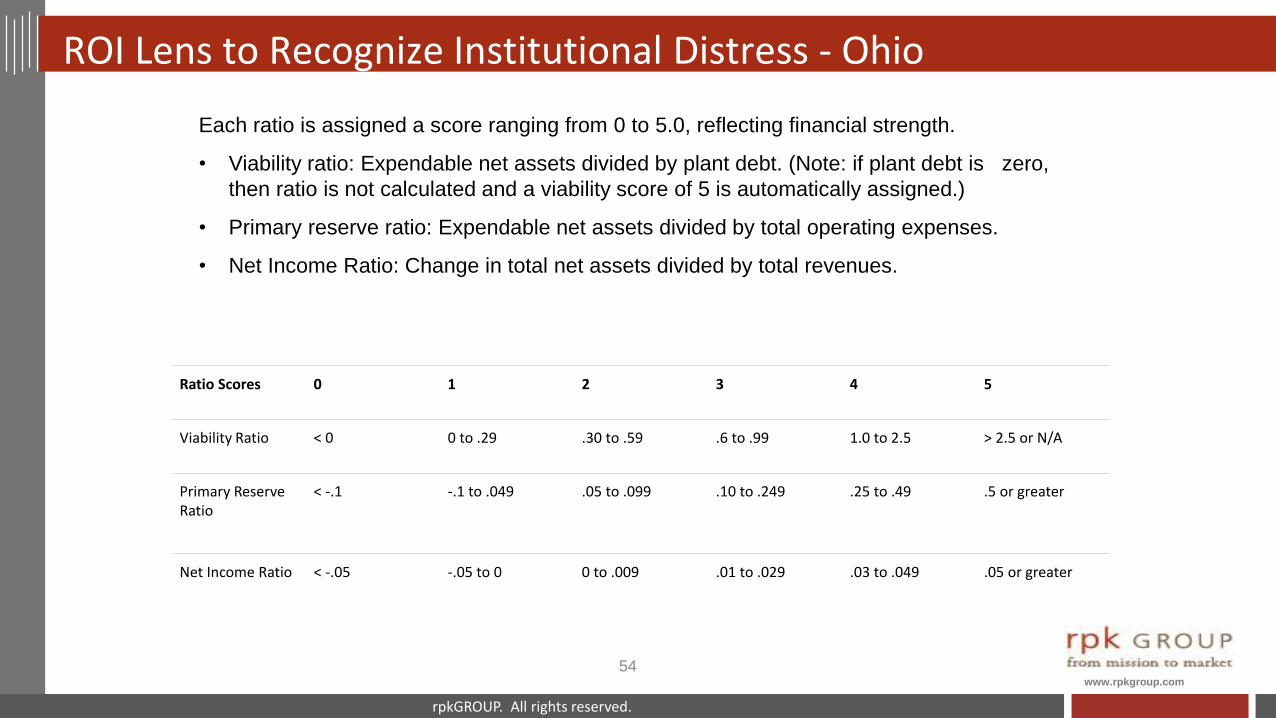
Each ratio is assigned a score ranging from 0 to 5.0, reflecting financial strength.
• Viability ratio: Expendable net assets divided by plant debt. (Note: if plant debt is zero,
then ratio is not calculated and a viability score of 5 is automatically assigned.)
• Primary reserve ratio: Expendable net assets divided by total operating expenses.
• Net Income Ratio: Change in total net assets divided by total revenues.
Ratio Scores 0 1 2 3 4 5
Viability Ratio < 0 0 to .29 .30 to .59 .6 to .99 1.0 to 2.5 > 2.5 or N/A
Primary Reserve Ratio
< -.1 -.1 to .049 .05 to .099 .10 to .249 .25 to .49 .5 or greater
Net Income Ratio < -.05 -.05 to 0 0 to .009 .01 to .029 .03 to .049 .05 or greater
54

rpkGROUP. All rights reserved.
www.rpkgroup.com
ROI Lens to Recognize Institutional Distress - Ohio
A composite score is determined based on the following methodology:
• 50% - Primary reserve ratio
• 30% - Viability ratio
• 20% - Net income ratio
Based on these scores, a summary
composite score is determined.
Intervention – a composite score
Of 1.75 or less for two
consecutive years results in an IHE
being placed on fiscal watch.
…or triggered by a “reportable
event” such as defaulting on a
payment to vendors.
55

rpkGROUP. All rights reserved.
www.rpkgroup.com
ROI Lens to Recognize Institutional Distress - Ohio
We can map the ratios by year:
• Composite score
• Viability ratio
• Net income ratio
• Primary reserve ratio
This is actual data from an IHE.
56
rpkGROUP. All rights reserved.
www.rpkgroup.com
ROI Lens to Recognize Institutional Distress - Ohio
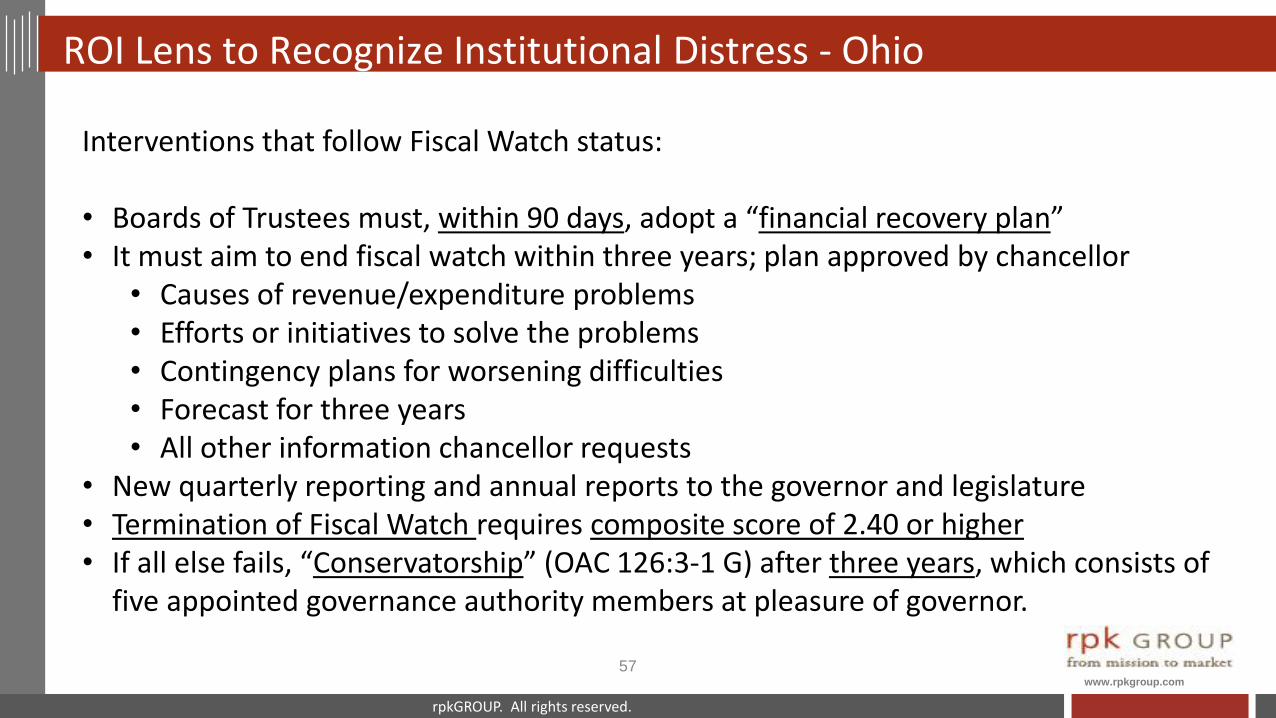
Interventions that follow Fiscal Watch status:
• Boards of Trustees must, within 90 days, adopt a “financial recovery plan”• It must aim to end fiscal watch within three years; plan approved by chancellor
• Causes of revenue/expenditure problems• Efforts or initiatives to solve the problems• Contingency plans for worsening difficulties• Forecast for three years • All other information chancellor requests
• New quarterly reporting and annual reports to the governor and legislature• Termination of Fiscal Watch requires composite score of 2.40 or higher• If all else fails, “Conservatorship” (OAC 126:3-1 G) after three years, which consists of
five appointed governance authority members at pleasure of governor.
57

rpkGROUP. All rights reserved.
www.rpkgroup.com
How Might We Support Sustainable Financial Models?
▪ Understanding Academic Portfolios and Where the Economic Engines are
▪ Creating Shared Service Approaches– Instruction – Ex. Competency Based Education, Open Educational Resources
– Administrative Services
▪ Focusing stakeholders on metrics that highlight sustainability
▪ How might the SHEEO role shift to support sustainability?– Working in a consultative model
– Identifying, sharing and supporting best practice
58

rpkGROUP. All rights reserved.
www.rpkgroup.com
Break to Get Lunch (and come back to the room!)
59

rpkGROUP. All rights reserved.
www.rpkgroup.com
Case Study – Mt. Ida
60

rpkGROUP. All rights reserved.
www.rpkgroup.com
Case Study Questions for Review at Your Table
1. What evidence was there that Mt. Ida was struggling? Was this evidence enough to consider Mt. Ida not viable?
2. Are there specific metric outcomes that would or should be considered as a “sign” of future closure?
3. What are a State’s obligations in similar situations? Obligation to the institution? The students?
4. Who are the other players that should be included in these discussions? What roles do they play?
5. What structures, frameworks and tools currently exist in your state to support a response to institutional viability? What authority exists for your state to respond more proactivity in these situations?
61

rpkGROUP. All rights reserved.
www.rpkgroup.com
Moving to Action
▪ What would need to be true to put an ROI lens into action in your state?
62

rpkGROUP. All rights reserved.
www.rpkgroup.com
For a Deeper Dive Into Strategic Finance and ROI
▪ http://rpkgroup.com/resources/
– White Paper
– Pre recorded webinar
▪ Resources on the business model behind:
– OER
– Tech Enabled Advising
– CBE
– System Level Transformation
63

rpkGROUP. All rights reserved.
www.rpkgroup.com
How Can We Jump From One Curve to the Next?
Incremental Improvement
Innovation
Harvest
Resources to….
…Invest in
InnovationNow
Next
Future
Awareness
Data/Metrics
Reallocation
Net Revenue
Portfolio Assessment
Shared Future
Vision
64

rpkGROUP. All rights reserved.
www.rpkgroup.com
Session Feedback
65