evaluating supported your program education · a promising practice. evaluating your program....
TRANSCRIPT
Evaluating
Your Program
Supported Education
A Promising Practice
U.S. DEPARTMENT OF HEALTH AND HUMAN SERVICESSubstance Abuse and Mental Health Services Administrationwww.samhsa.gov

Evaluating
Your ProgramSupported Education
A Promising Practice
U.S. Department of Health and Human Services
Substance Abuse and Mental Health Services Administration
Center for Mental Health Services
Acknowledgments
This document was prepared for the Substance Abuse and Mental Health Services Administration (SAMHSA) by Karen V. Unger, Ph.D., Rehabilitation Through Education, Portland, Oregon, under contract number P233200500802P and Westat under contract number 270-03-6005 with SAMHSA, U.S. Department of Health and Human Services (HHS). Marian Scheinholtz served as the SAMHSA Government Project Officer.
Disclaimer
The views, opinions, and content of this publication are those of the authors and contributors and do not necessarily reflect the views, opinions, or policies of the Center for Mental Health Services (CMHS), SAMHSA, or HHS.
Public Domain Notice
All material appearing in this document is in the public domain and may be reproduced or copied without permission from SAMHSA. Citation of the source is appreciated. However, this publication may not be reproduced or distributed for a fee without the specific, written authorization from the Office of Communications, SAMHSA, HHS.
Electronic Access and Copies of Publication
This publication may be downloaded or ordered at http://store.samhsa.gov. Or, please call SAMHSA at 1-877-SAMHSA-7 (1-877-726-4727) (English and Español).
Recommended Citation
Substance Abuse and Mental Health Services Administration. Supported Education: Evaluating Your Program. HHS Pub. No. SMA-11-4654, Rockville, MD: Center for Mental Health Services, Substance Abuse and Mental Health Services Administration, U.S. Department of Health and Human Services, 2011.
Originating Office Center for Mental Health Services Substance Abuse and Mental Health Services Administration 1 Choke Cherry Road Rockville, MD 20857 HHS Publication No. SMA-11-4654 Printed 2011

Supported Education
A Promising Practice
Evaluating Your Program
Evaluating Your Program shows quality assurance team members how to evaluate the effectiveness of Supported Education. It includes the following:
A Readiness Assessment;
The Supported Education Fidelity Scale; and
Outcome measures that are specific to Supported Education.
You will also find instructions for conducting assessments and tips on how to use the data to improve your program.
For references, see the booklet, The Evidence.
This KIT is part of a series created by the Center for Mental Health Services, Substance Abuse and Mental Health Services Administra-tion, U.S. Department of Health and Human Services.
This booklet is part of the Supported Education KIT that includes a CD-ROM and seven booklets:
How to Use the KITs
Getting Started with Evidence-Based and Promising Practices
Building Your Program
Training Frontline Staff
Evaluating Your Program
The Evidence
Using Multimedia to Introduce Your Promising Practice
Supported Education
A Promising Practice
What’s in Evaluating Your Program
Why Evaluate Supported Education? ........................................1
Conduct a Readiness Assessment .............................................5
Conduct a Process Assessment .................................................7
Monitor Outcomes ............................................................... 13
Use Data to Improve Supported Education ............................. 21
Appendix A: Cover Sheet—Supported Education Fidelity Scale .................................................... 27
Appendix B: Supported Education Fidelity Scale and Scoresheet .................................................. 31
Appendix C: Supported Education Fidelity Scale Protocol ........................................ 43
Appendix D: Outcomes Report Form ...................................... 73
Appendix E: Instructions for the Outcomes Report Form ...................................................... 77
Appendix F: Assessor Training and Work Performance Checklist ........................................ 85

Evaluating Your Program 1 Why Evaluate Supported Education
Evaluating Your Program
Why Evaluate Supported Education?
Key stakeholders who implement Supported Education may find themselves asking two questions:
Has Supported Education been implemented as planned?
Has Supported Education resulted in the expected outcomes?
Asking these two questions and using the answers to help improve Supported Education are critical for ensuring the success of your program.
To answer the first question, collect process measures (by using the Supported Education Fidelity Scale).
Process measures capture how services are provided. To answer the second question, collect outcome measures. Outcome measures capture the results or achievements of your initiative.
As you prepare to implement Supported Education, we strongly recommend that you develop a quality assurance system using both process and outcome measures to monitor and improve the quality of your program beginning with the startup phase and continuing after that.

Why Evaluate Supported Education 2 Evaluating Your Program
Why Collect Process Measures
In general, process measures give you an objective, structured way to determine if you are implementing a practice in the way that the current research has shown will result in desired outcomes. Programs that adhere closely to an evidence-based model are more effective than those that do not follow the model. Adhering to the model is called fidelity.
Current research shows that Supported Education is a promising practice that warrants additional research to further validate and expand existing knowledge. Process measures also allow agencies to provide services in a standardized manner to facilitate building the evidence base for promising practices such as Supported Education.
Process measures give mental health authorities a comparative framework to evaluate the quality of Supported Education across the state. They allow mental health authorities to identify statewide trends and exceptions to those trends.
While the Supported Education Fidelity Scale captures the core elements of the practice that the current evidence shows are effective, more research is needed. It is likely that this scale will continue to evolve over the next few years.
You can help develop the evidence base for this practice by using the measures in this booklet. Once Supported Education reaches high fidelity, ongoing monitoring allows you to test local innovations while ensuring that your agency does not drift from the core principles of the Supported Education model.
Why Collect Outcome Measures
While process measures capture how services are provided, outcome measures capture the program’s results. Every mental health service intervention has both immediate and long-term consumer goals. In addition, consumers have goals for themselves, which they hope to attain by receiving mental health services. These goals translate into outcomes, and the outcomes translate into specific measures.
Monitoring outcomes in addition to process measures helps establish which components of the practice are most effective. Both types of measures are needed to further establish the evidence base and determine the effectiveness of your Supported Education program.

Evaluating Your Program 3 Why Evaluate Supported Education
Research has shown that you can expect these outcomes
More access to and participation in
educational programs (Unger, Pardee, & Shafer, 2000; Mowbray, Collins, & Bybee, 1999; Lieberman, Goldberg, & Jed, 1993; Hoffman, & Mastrianni, 1993; Cook & Solomon, 1993; Wolf & DiPietro, 1992; Dougherty, Hastie, Bernard, Broadhurst, & Marcus, 1992; Unger, Anthony, Sciarappa, & Rogers, 1991);
Increased competitive employment (Unger, et al., 1991; Dougherty et al, 1992; Unger et al., 2000);
Improved self-esteem (Unger et al., 1991; Cook & Solomon, 1993; Mowbray et al., 1999);
Reduced hospitalization (Unger et al., 1991; Isenwater, Lanham, & Thornhill, 2002); and
Increased consumer satisfaction (Cook & Solomon, 1993; Collins Bybee, & Mowbray, 1998).
Why Develop a Quality Assurance System
In your mental health system, you should develop a quality assurance system that collects not only process measures, such as those on the Supported Education Fidelity Scale, but also outcome measures such as those specified above to show the effect of Supported Education.
Developing a quality assurance system will help you do the following:
Diagnose your program’s strengths and weaknesses;
Formulate action plans for improving your Supported Education program;
Help consumers achieve their goals for recovery; and
Deliver services both efficiently and effectively.


Evaluating Your Program 5 Why Evaluate Supported EducationEvaluating Your Program 5 Conduct a Readiness Assessment
Evaluating Your Program
Conduct a Readiness Assessment
Let’s assume that administrators and program leaders have read Building Your Program in this KIT. How do you get started with putting Supported Education into place?
The Readiness Assessment on the next page will help quality assurance team members, advisory group leaders, and
program leaders track the processes and administrative tasks required to develop your Supported Education initiative.
Answering these questions will help you generate an ongoing to-do list (or implementation plan) to guide your steps in implementing Supported Education.
Why Evaluate Supported Education 6 Evaluating Your ProgramConduct a Readiness Assessment 6 Evaluating Your Program
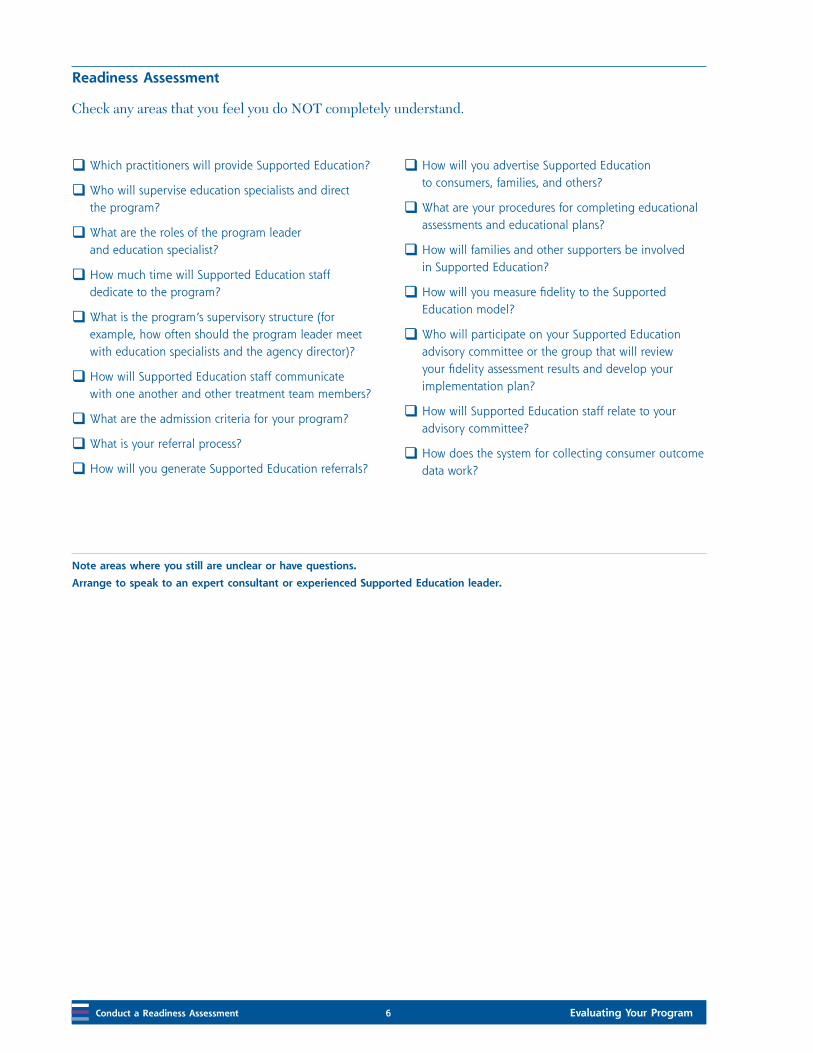
Readiness Assessment
Check any areas that you feel you do NOT completely understand.
qWhich practitioners will provide Supported Education?
qWho will supervise education specialists and direct the program?
qWhat are the roles of the program leader and education specialist?
qHow much time will Supported Education staff dedicate to the program?
qWhat is the program’s supervisory structure (for example, how often should the program leader meet with education specialists and the agency director)?
qHow will Supported Education staff communicate with one another and other treatment team members?
qWhat are the admission criteria for your program?
qWhat is your referral process?
qHow will you generate Supported Education referrals?
qHow will you advertise Supported Education to consumers, families, and others?
qWhat are your procedures for completing educational assessments and educational plans?
qHow will families and other supporters be involved in Supported Education?
qHow will you measure fidelity to the Supported Education model?
qWho will participate on your Supported Education advisory committee or the group that will review your fidelity assessment results and develop your implementation plan?
qHow will Supported Education staff relate to your advisory committee?
qHow does the system for collecting consumer outcome data work?
Note areas where you still are unclear or have questions.
Arrange to speak to an expert consultant or experienced Supported Education leader.
Evaluating Your Program 7 Conduct a Process Assessment
Evaluating Your Program
Conduct a Process Assessment
In addition to the Readiness Assessment, conduct your first process assessment to determine whether your agency has core components of Supported Education in place. During the first 2 years of implementing Supported Education, conduct assessments every 6 months.
After your Supported Education initiative has matured and achieved high fidelity, you may choose to conduct assessments once a year. Agencies that have successfully implemented evidence-based and promising practices indicate that you
must continue to evaluate the process to ensure that you do not revert to previous practice patterns.
Once your agency has achieved high fidelity, Supported Education staff may tailor the program to meet individual needs of the community. If you continue to use process evaluations along with outcomes monitoring, you will be able to understand the extent to which your changes result in your agency’s departure from model fidelity and whether the changes positively or negatively affect consumers.
Conduct a Process Assessment 8 Evaluating Your Program
About the process measures that are included in the KIT
Quality assurance measures have been developed and are included in all Evidence-Based and Promising Practices KITs. The Supported Education Fidelity Scale was developed by a group of researchers at University of Kansas, School of Social Welfare, Center for Mental Health Research and Training. The standards used for establishing the anchors for the “fully implemented” ratings were determined through a variety of expert sources as well as through empirical research. The scale has undergone numerous drafts and review by many groups. Further testing is currently underway.
How to Use Process Measures
The Supported Education Fidelity Scale has been developed to monitor how Supported Education services are provided. The Supported Education Fidelity Scale—developed by and printed with permission from the University of Kansas, School of Social Welfare, Center for Mental Health Research and Training—has 12 categories of program-specific items.
Most items are rated on a 5-point scale, ranging from 1 (meaning not implemented) to 5 (meaning fully implemented). The items capture the core elements of the Supported Education model.
For the Supported Education Cover Sheet and Fidelity Scale, see Appendices A and B. You can also print the forms from the CD-ROM in the KIT.
Who can conduct process assessments?
We recommend enlisting two assessors to conduct your process assessment. Data collected by two assessors simultaneously increases the likelihood that the information will be reliable and valid.
Agencies that have successfully implemented evidence-based and promising practices have taken different approaches to identify assessors. Some agencies train advisory committee members as assessors and rotate the responsibility of
completing assessments. Others have pre-existing quality assurance teams and simply designate team members to complete the assessments. In other cases, the mental health authority has designated staff to conduct assessments.
Conduct assessments either internally through your agency or externally by a review group. External review groups have a distinct advantage because they use assessors who are familiar with the evidence-based or promising practice model but, at the same time, are independent. The goal is to select objective and competent assessors.
Although we recommend using external assessors, agencies can also use fidelity scales to rate their own Supported Education program. The validity of these ratings (or any ratings, for that matter) depends on the following:
The knowledge of the person making the ratings;
Access to accurate information pertaining to the ratings; and
The objectivity of the ratings.
If you do conduct your assessments using internal staff, beware of potential biases of raters who are invested in seeing the agency look good or who do not fully understand the model. It is important that ratings are made objectively and that they are based on hard evidence.
Evaluating Your Program 9 Conduct a Process Assessment
Circumstances will dictate decisions in this area, but we encourage agencies to choose a review process that fosters objectivity in ratings, for example, by involving a practitioner who is not centrally involved in the Supported Education initiative. Only people who have experience and training in interviewing and data collection procedures (including chart reviews) should conduct assessments. Additionally, assessors must understand the nature and critical ingredients of the Supported Education model.
If your agency chooses to use a consultant or trainer to help implement Supported Education, involving that person in the assessment process will enhance the technical assistance you receive. Whichever approach you choose, we encourage you to make these decisions early in the planning process. For a checklist to help evaluate assessors’ training and work performance, see Appendix F.
How to conduct process assessments
A number of activities take place before, during, and after a process assessment. In general, assessments include the following:
Interviewing administrators, the program leader, education specialists, consumers, and families;
Interviewing other agency staff (such as intake specialists or treatment team members);
Observing a treatment team and supervisory meeting; and
Conducting a chart review.
Collecting information from multiples sources helps assessors more accurately capture how services are provided. A daylong site visit is the best way to learn this information. The following suggestions outline steps in the assessment process.
Before the process assessment
Prepare your assessment questions
A detailed protocol has been developed to help you understand each item on the Supported Education Fidelity Scale and the rationale for including it, guidelines for the types of information to collect, and instructions for completing your ratings. Use these protocols to help you prepare the questions that you will ask during your assessment visit. For a copy of the protocols, see Appendix C.
While we expect that quality assurance teams will select which outcome measures meet your agency’s needs, you should use the Supported Education Fidelity Scale in full. Collecting data for all the items on this scale will allow your agency to gain a comprehensive understanding of how closely your program resembles the Supported Education model.
Create a timeline for the assessment
List all the necessary activities leading up to and during the visit and create a timeline for completing each task. Carefully coordinating efforts, particularly if you have multiple assessors, will help you complete your assessment in a timely fashion.
Establish a contact person
Have one key person arrange your visit and communicate beforehand the purpose and scope of your assessment to people who will participate in interviews. Typically, this contact person will be the program leader.
Exercise common courtesy and show respect for competing time demands by scheduling well in advance and making reminder calls to confirm interview dates and times.
Conduct a Process Assessment 10 Evaluating Your Program
Establish a shared understanding with the Supported Education staff
The most successful assessments are those in which assessors and the Supported Education staff share the goal of understanding how the program is progressing according to Supported Education principles. If administrators or staff fear that they will lose funding or look bad if they don’t score well, then the accuracy of the data may be compromised. The best agreement is one in which all parties are interested in learning the truth.
Indicate what you will need from respondents during your visit
In addition to the purpose of the assessment, briefly describe what information you need, with whom you must speak, and how long each interview will take to complete. The visit will be most efficient if the program leader gathers beforehand as much of the following information as possible:
Roster of education specialists—(roles, full-time equivalents);
Roster of Supported Education consumers for each education specialist;
Roster of consumers who have left the Supported Education program in the past 6 months;
Copy of the agency’s Supported Education brochure, mission statement, or other marketing materials;
Copy of Supported Education policies and procedures; and
Total number of consumers that the Supported Education program served in the past 6 months.
Reassure the contact person that you will be able to conduct the assessment, even if all the information you requested is unavailable.
Tell the contact person that you must observe a treatment team meeting and group supervision meeting during your visit. These are important factors in determining when you should schedule your visit.
Alert your contact person that you will need to sample 10 charts
From an efficiency standpoint, it is preferable that the charts be drawn beforehand, using a random selection procedure. A concern may arise that the evaluation may be invalidated if Supported Education staff members handpick charts or update them before the visit. If you both understand that the goal is to learn how the program implements services, this is less likely to occur.
Additionally, you can further ensure random selection by asking for 20 charts and randomly selecting 10 to review. Other options include asking the program leader for a de-identified list of consumers (that is, with names removed) and using the list to choose 10 charts to review.
Evaluating Your Program 11 Conduct a Process Assessment
Clarify reporting procedures
With the appropriate people (agency administrators, the mental health authority, or the program leader), clarify who should receive a report of the assessment results. Recipients may include the following:
Agency administrators;
Members of the agency’s quality assurance team;
Members of the Supported Education advisory committee;
The program leader;
Education specialists; and
Consumers and families.
Assessors should also clarify how the agency would like the report to be distributed. For example, assessors may mail or fax the report and follow up to discuss the results in a meeting or by conference call.
Organize your assessment materials
Two forms have been created to help you conduct your assessment:
The first form is a cover sheet for the Supported Education Fidelity Scale, which is intended to help you organize your process assessment. It captures general descriptive information about the agency and data collection.
The second form is a scoresheet for the scale. It helps you compare assessment ratings from one time period to the next. It may also be useful if you are interested in graphing results to examine your progress over time.
For the Supported Education Fidelity Scale instrument, cover sheet, and scoresheet, see Appendices A and B. You can also print these forms from the CD-ROM in the KIT.
During your assessment visit
Tailor your terminology
To avoid confusion during your interviews, tailor the terminology you use. For example, an agency may use member for consumer or clinician for practitioner. Every agency has specific job titles for particular staff roles. By adopting the local terminology, you will improve communication.
Conduct your chart review
It is important that your chart review is conducted from a representative sample of charts. When you begin your chart review, note whether your sample includes consumer charts from each education specialist’s caseload. If your random sample is not representative in this manner, consider supplementing your sample with selected charts that will increase its representativeness.
Within each chart, examine the referral, educational assessment, and educational plan. If more than one treatment plan exists (such as a clinical treatment plan and educational plan), review both to see if similar educational goals are reflected in each plan.
Review recent Progress Notes to understand the amount and type of contact education specialists have with the consumers on their caseloads. If Progress Notes are not integrated into consumer charts, then ask if educational specialists have any additional files that you may review.
In some cases, a lag may exist between when a service is rendered and when it is documented in consumers’ charts. To get the most accurate representation of services rendered when you sample chart data, try to gather data from the most recent time period in which documentation was completed in full.
Conduct a Process Assessment 12 Evaluating Your Program
To ascertain the most up-to-date time period, ask the program leader, educational specialists, or administrative staff. Avoid getting an inaccurate sampling of data where office-based services might be charted more quickly than services rendered in the field.
If discrepancies between sources occur, query the program leader
The most common discrepancy is likely to occur when the program leader’s interview gives a more idealistic picture of the team’s functioning than the chart and observational data. For example, on the Supported Education Fidelity Scale, Supported Education Program Philosophy (Item 1A) assesses whether marketing materials are highly visible and available in multiple locations. Your observations may show that little information is available, while education specialists may relay otherwise.
To understand and resolve this discrepancy, the assessor could ask the program leader the following:
Our observations show that materials are developed but not displayed yet we are hearing otherwise from the Supported Education team. Would you help us understand this discrepancy?
Often the program leader can provide information that was not apparent.
Before you leave, check for missing data
Fidelity scales should be completed in full, with no missing data on any items. Check with the program leader at the end of the visit to collect any additional information you may need.
After your assessment visit
Follow up
It is important to collect any missing data before completing your rating. If necessary, follow up on any missing data (for example, by calling or sending an e-mail). This would include discussing with the program leader any discrepancies between data sources that you notice after you’ve completed the visit.
Score your scales
Use the Supported Education protocol in Appendix C to score your Supported Education program. The Supported Education scale has 12 categories of program-specific items. Average each item to determine a score for each category. The total score for the scale is the sum of those averages.
If you assess an agency for the first time to determine which components of Supported Education the agency already has in place, some items may not apply. If an item cannot be rated, code the item as “1” on the Supported Education Fidelity Scale.
Complete scales independently
If you have two assessors, both should independently review the data collected and rate the scales. Then compare your ratings, resolve any disagreements, and devise a consensus rating.
Complete the scoresheets
Tally the item scores and determine which level of implementation was achieved.
Evaluating Your Program 13 Monitor Outcomes
Evaluating Your Program
Monitor Outcomes
Unlike process measures, which must be used in full to comprehensively understand how services are provided, you must decide which outcome measures will be most informative for your Supported Education program. Initially, your outcomes monitoring system should be simple to use and maintain. Complexity has doomed many well-intended attempts to collect and use outcomes data.
One way to simplify is to limit the number of outcome measures used. Select your outcome measures based on the type of information that will be most useful to your agency.
Based on the research literature, we suggest that you monitor a core set of outcomes such as the following:
Access to and participation in
educational programs (Unger, Pardee, & Shafer, 2000; Mowbray, Collins, & Bybee, 1999; Lieberman, Goldberg, & Jed, 1993; Hoffman & Mastrianni, 1993; Cook & Solomon, 1993; Wolf & DiPietro, 1992; Dougherty, Hastie, Bernard, Broadhurst, & Marcus, 1992; Unger, Anthony, Sciarappa, & Rogers, 1991);
Competitive employment (Unger et al., 1991; Dougherty et al., 1992; Unger et al., 2000);
Self-esteem (Unger et al., 1991; Cook & Solomon, 1993; Mowbray et al., 1999); and
Hospitalization (Unger et al., 1991; Isenwater Lanham, & Thornhill, 2002).
Monitor Outcomes 14 Evaluating Your Program
Studies of Supported Education, to date, have found positive outcomes in these areas. These outcomes also reflect the primary goals of Supported Education. Specifically, the goals of Supported Education are to help consumers move forward in their process of recovery and become integrated into the community by pursuing their individual educational goals. For this reason, it is important for you to capture outcomes in a way that is most useful for your program.
For data to be useful, they must be valid. That is, the data must accurately represent what they were intended to measure. Thus, the outcomes must be few and concrete for education specialists to focus on key outcomes, to understand them in a similar way, and to make their ratings in a consistent and error-free fashion.
To enhance validity, we recommend using simple ratings initially (such as, Did the consumer hold a competitive job in this quarter?), rather than more detailed ones (such as, How many hours during this quarter did the consumer work competitively?). Limiting your outcome measures to concrete measures will also allow you to collect data from education specialists.
Develop procedures
Agencies may choose to develop the outcomes portion of their quality assurance system from scratch or use existing outcomes monitoring systems. A number of electronic evaluation programs are available to help you develop comprehensive, integrated, user-friendly outcomes monitoring systems. Examples include the following:
Publicly available tools such as the Consumer Outcomes Monitoring Package (see the next page), and Decision Support 2000+ Online (http://www.ds2kplus.org); or
Various commercially available products.
When deciding whether to use an existing outcomes monitoring package or to design your own, it is important to keep your organization’s capabilities in mind. The system must not create undue burden for education specialists, and it must provide information to them that is useful in their jobs.
What is the Consumer Outcomes Monitoring Package?
Sponsored in part by the Substance Abuse and Mental Health Services Administration (SAMHSA), the Consumer Outcomes Monitoring Package (COMP) was designed by a team at the School of Social Welfare, University of Kansas. This computer application allows agencies to choose from a pre-established list of outcomes developed for various evidence-based practices. Although not developed specifically for Supported Education, the outcomes included in COMP represent global life areas that are relevant for assessing overall effects of mental health services as a whole. Data may be entered for the chosen outcomes and reports can be generated quarterly or monthly. The COMP also allows agencies to view their outcomes data using a variety of tables and graphs.
The designers of COMP tried to make the computer application as easy and as flexible to use as possible. You may access COMP through the Web. Agencies can download the computer application and print out Installation Instructions and a User Manual, which provides definitions and forms.
To download COMP—Go to http://research.socwel.ku.edu/ebp;
Click the link to the download page;
Click the links to download the Installation Instructions and the User Manual; and
Follow the instructions to install the application.
Evaluating Your Program 15 Monitor Outcomes
The system should fit into the workflow of the organization, whether that means making ratings on paper, using the COMP computer application, or developing your own outcomes monitoring package. Start with whatever means are available and expand the system from there. In the beginning, you may collect data with a simple report form and you can report hand-tallied summaries to education specialists.
Computer software that allows for data entry and manipulation (such as Microsoft Access, Excel, or Lotus) makes tabulating and graphing data easier than if it is done by hand.
A computerized system for data entry and report generation presents a clear advantage and may be the goal, but do not wait for it. Feedback does not have to come from a sophisticated computer system to be useful. It is more important that it is meaningful and frequent. For a sample Outcomes Report Form that is an example of a simple, paper-based way to collect participation and overall treatment outcomes data regularly, see Appendix D. For instructions for using the Outcomes Report Form, see Appendix E.
Monitor Outcomes 16 Evaluating Your Program
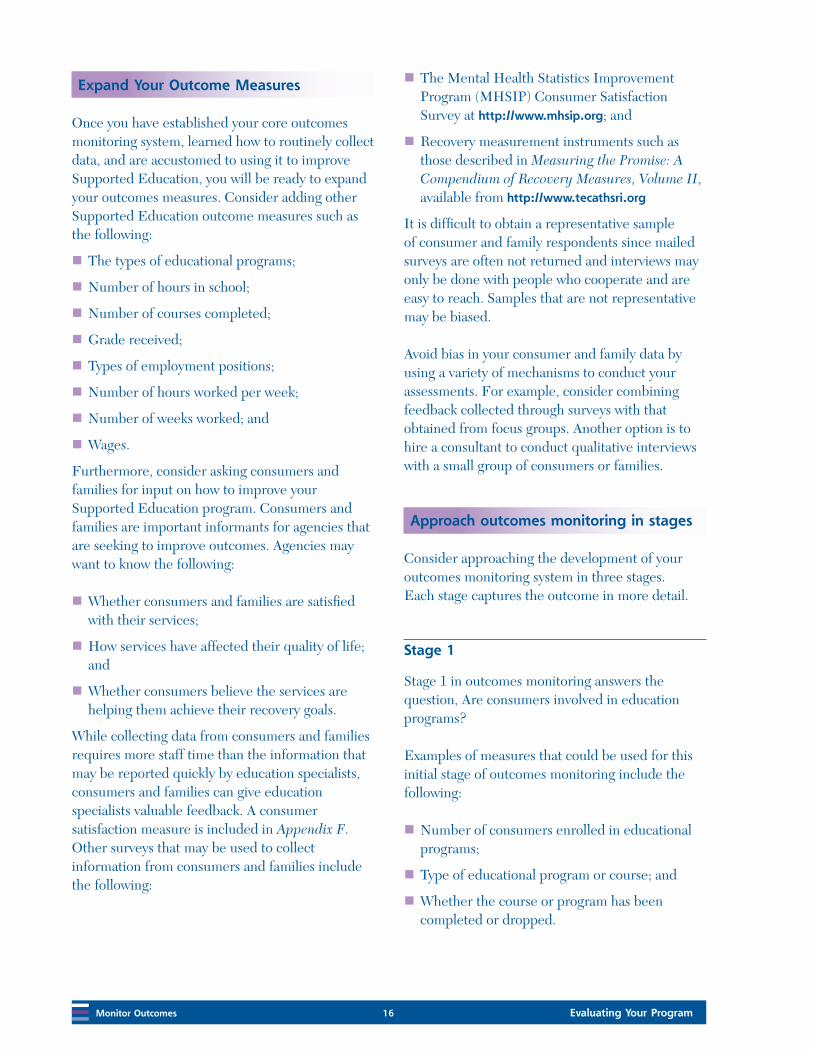
Expand Your Outcome Measures
Once you have established your core outcomes monitoring system, learned how to routinely collect data, and are accustomed to using it to improve Supported Education, you will be ready to expand your outcomes measures. Consider adding other Supported Education outcome measures such as the following:
The types of educational programs;
Number of hours in school;
Number of courses completed;
Grade received;
Types of employment positions;
Number of hours worked per week;
Number of weeks worked; and
Wages.
Furthermore, consider asking consumers and families for input on how to improve your Supported Education program. Consumers and families are important informants for agencies that are seeking to improve outcomes. Agencies may want to know the following:
Whether consumers and families are satisfied with their services;
How services have affected their quality of life; and
Whether consumers believe the services are helping them achieve their recovery goals.
While collecting data from consumers and families requires more staff time than the information that may be reported quickly by education specialists, consumers and families can give education specialists valuable feedback. A consumer satisfaction measure is included in Appendix F. Other surveys that may be used to collect information from consumers and families include the following:
The Mental Health Statistics Improvement Program (MHSIP) Consumer Satisfaction Survey at http://www.mhsip.org; and
Recovery measurement instruments such as those described in Measuring the Promise: A Compendium of Recovery Measures, Volume II, available from http://www.tecathsri.org
It is difficult to obtain a representative sample of consumer and family respondents since mailed surveys are often not returned and interviews may only be done with people who cooperate and are easy to reach. Samples that are not representative may be biased.
Avoid bias in your consumer and family data by using a variety of mechanisms to conduct your assessments. For example, consider combining feedback collected through surveys with that obtained from focus groups. Another option is to hire a consultant to conduct qualitative interviews with a small group of consumers or families.
Approach outcomes monitoring in stages
Consider approaching the development of your outcomes monitoring system in three stages. Each stage captures the outcome in more detail.
Stage 1
Stage 1 in outcomes monitoring answers the question, Are consumers involved in education programs?
Examples of measures that could be used for this initial stage of outcomes monitoring include the following:
Number of consumers enrolled in educational programs;
Type of educational program or course; and
Whether the course or program has been completed or dropped.

Evaluating Your Program 17 Monitor Outcomes
An alternative to gathering course names is to record the type of program in which the consumer is participating. The information may be captured in a simple grid such as the one below.
Stage 1: Enrollment and Completion Information
Student Name/#
Enrolled (Code)
Enrollment Date
Termination Date
Ended (Code)
John Doe 10 9/07 6/08 C
Enrollment Codes
1 = Avocation/educational classes. Community based classes for the purpose of life enrichment, hobbies, recreation, etc. Classes are those that anyone could participate in, not just people with mental illnesses.
2 = English as a second language. Classes in English as a second language.
3 = Adult basic education. Adult education classes focused on basic skills such as math and reading.
4 = General Educational Development (GED) classes to obtain a GED certificate.
5 = High school. Enrollment in high school classes to obtain a diploma.
6 = Pre-enrollment class on campus. Instruction on campus for non-credit classes.
7 = Pre-enrollment class off campus. Instruction at the mental health center for non-credit classes.
8 = Vocational/technical center. Enrollment in a local vocational/technical training center where academic credit is earned.
9 = Trade school. Enrollment in a program of study resulting in a certificate for a specific skill or craft (for example, hairdresser).
10 = Community college. Enrollment in a community college for an associate’s degree.
11 = Four-year college or university. Enrollment in a public or private educational institution for a bachelor’s, master’s, or doctoral degree.
Termination Codes
C = Completed. Consumer completed all courses for which he or she had registered.
D = Dropped. Consumer officially dropped all courses for which he or she had registered before the end of the semester.
I = Incompletes. Consumer left school without officially dropping all courses for which he or she had registered and received incompletes.
GA = Graduated. Graduated with associate’s degree
GB = Graduated. Graduated with bachelor’s degree
GM = Graduated. Graduated with master’s degree
GD = Graduated. Graduated with a doctoral or post-master’s degree, such as a degree in law
L = Completed with a certificate or license.
AD = Audit course taken for no credit.
Monitor Outcomes 18 Evaluating Your Program
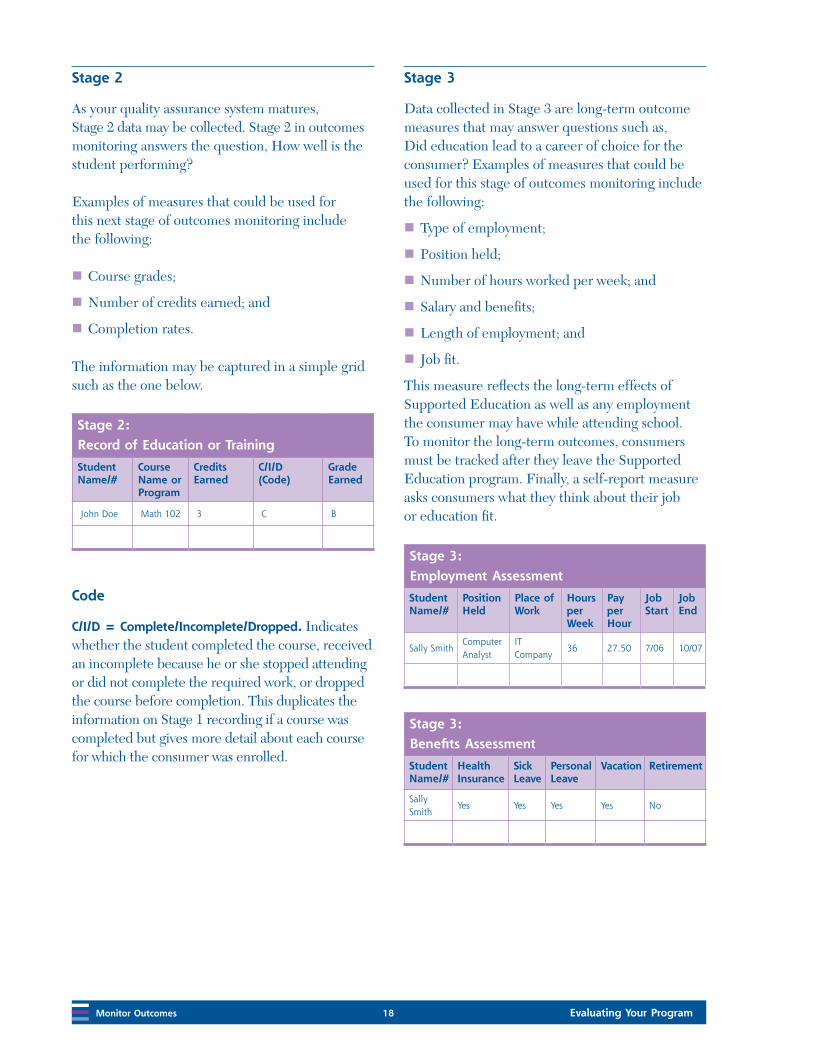
Stage 2
As your quality assurance system matures, Stage 2 data may be collected. Stage 2 in outcomes monitoring answers the question, How well is the student performing?
Examples of measures that could be used for this next stage of outcomes monitoring include the following:
Course grades;
Number of credits earned; and
Completion rates.
The information may be captured in a simple grid such as the one below.
Stage 2: Record of Education or Training
Student Name/#
Course Name or Program
Credits Earned
C/I/D (Code)
Grade Earned
John Doe Math 102 3 C B
Code
C/I/D = Complete/Incomplete/Dropped. Indicates whether the student completed the course, received an incomplete because he or she stopped attending or did not complete the required work, or dropped the course before completion. This duplicates the information on Stage 1 recording if a course was completed but gives more detail about each course for which the consumer was enrolled.
Stage 3
Data collected in Stage 3 are long-term outcome measures that may answer questions such as, Did education lead to a career of choice for the consumer? Examples of measures that could be used for this stage of outcomes monitoring include the following:
Type of employment;
Position held;
Number of hours worked per week; and
Salary and benefits;
Length of employment; and
Job fit.
This measure reflects the long-term effects of Supported Education as well as any employment the consumer may have while attending school. To monitor the long-term outcomes, consumers must be tracked after they leave the Supported Education program. Finally, a self-report measure asks consumers what they think about their job or education fit.
Stage 3: Employment Assessment
Student Name/#
Position Held
Place of Work
Hours per Week
Pay per Hour
Job Start
Job End
Sally SmithComputer Analyst
IT Company
36 27.50 7/06 10/07
Stage 3: Benefits Assessment
Student Name/#
Health Insurance
Sick Leave
Personal Leave
Vacation Retirement
Sally Smith
Yes Yes Yes Yes No
Evaluating Your Program 19 Monitor Outcomes
How often should you collect outcomes data?
Plan to monitor outcomes every 3 months or following each academic unit and share the data with your Supported Education staff. Collecting data at regular and short intervals will enhance the reliability of your outcomes data.
While we recommend that you design a system for collecting outcomes early in the implementation process, agencies should not expect to see the desired results until the Supported Education approach is fully operational. Depending on resources available to your agency, this may take anywhere from 6 to 18 months to accomplish.
How should you identify data collectors?
Agency administrators or mental health authorities may assign the responsibility for collecting outcomes data to the following:
The program leader;
Members of the Supported Education advisory committee;
The quality assurance team;
Independent consultants, including consumers and family members; and
Other staff.
Unlike collecting process measures, collecting outcome measures does not require a daylong assessment process. Many standard outcome measures, such as participation in educational programs and employment, can be collected by education specialists from their daily work with consumers.
It is important to develop a quick, easy, standardized approach to collect outcomes data. For example, create a simple form or computer database that education specialists can routinely update.
Questions for job/education fit
Could you have gotten your job with less education?
Do you perform your job better because of your education?
Does your job fit your education level?
Did your education prepare you for your job?

Evaluating Your Program 21 Use Data to Improve Supported Education
Evaluating Your Program
Use Data to Improve Supported Education
As you develop a quality assurance system, program leaders and staff will weave it into the fabric of their daily routines. Process assessments will give you a window into the demanding work done every day. Outcome reports will give you tangible evidence of the use and value of services, and they will become a basis for decisionmaking and supervision.
At some point, Supported Education staff may wonder how they did their jobs without an information system as they come to view it as an essential ingredient of well-implemented program.

Use Data to Improve Supported Education 22 Evaluating Your Program
Create reports from your assessments
For your process data, in addition to completing the Supported Education Fidelity Scale and scoresheets, assessors should write a report explaining their scores. The report should include the following:
An interpretation of the results of the assessment;
Strengths and weaknesses of the program; and
Clear recommendations to help the program progress.
The report should be informative, factual, and constructive. Since some process measures assess adherence to the Supported Education model at both the agency and staff levels, remember to target recommendations to administrators, program leaders, and staff.
When summarizing outcomes data, start with simple, easy-to-read reports. Then let experience determine what additional reports you need. You can design your reports to give information about individual consumers, a single education specialists’ caseload, or the program as a whole. For example, reports generated for individual consumers may track the consumer’s progress using specific outcomes over time. You could enter these reports in consumers’ charts and they could be the basis for discussions about consumers’ progress.
Use tables and graphs to understand your outcomes data
After the first process and outcomes assessments, it is often useful to provide a visual representation of agency’s progress over time. We recommend that you use tables and graphs to report the results.
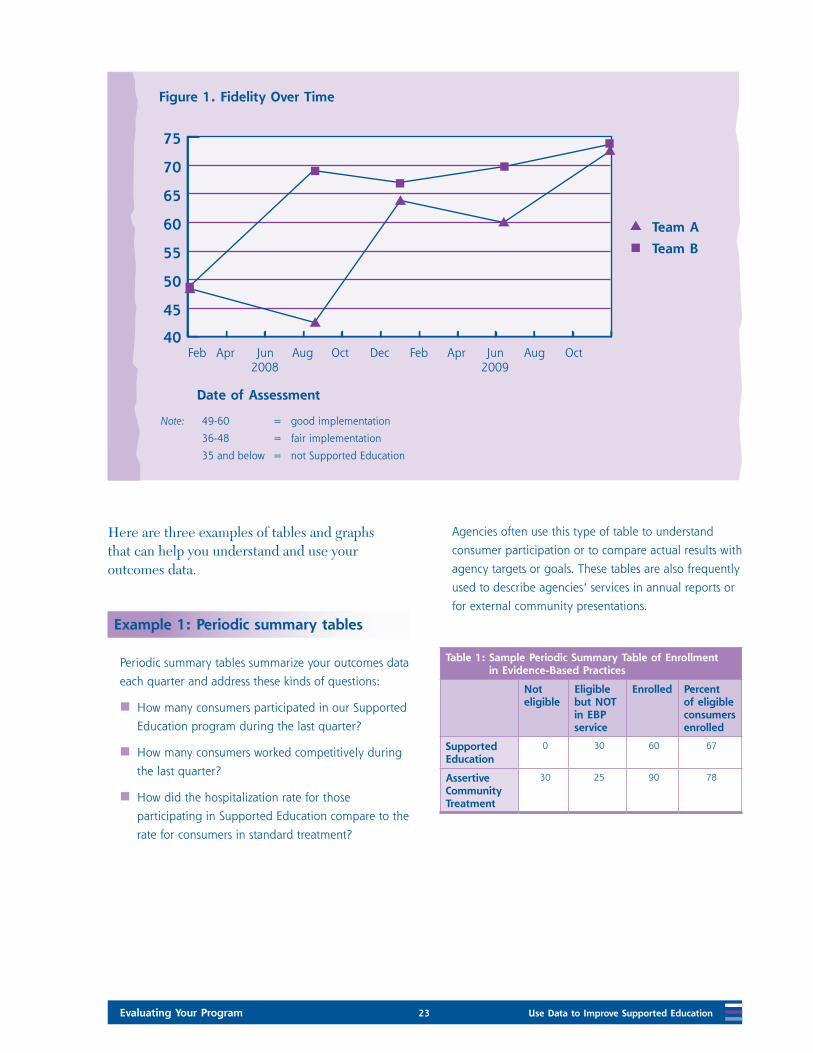
By graphing your fidelity score, you have a visual representation of how your Supported Education program has changed over time. For an example, see Figure 1. For your process data, you may simply graph the results using a spreadsheet and include this in your report.
When your agency shows greater fidelity over time, the graph will display it and reinforce your efforts. Additionally, as you can see in Figure 1, the graph allows you to quickly compare one team to another. In this example, Team A struggled in the first 6 months. Understanding Team A’s progress compared to Team B’s allowed the teams to partner and share strategies. Consequently, Team A improved dramatically over the next 6-month period.
Another feature of graphing assessment scores is to examine the cutoff score for fair (36) or good (49) implementation. Your program can use these scores as targets.
Evaluating Your Program 23 Use Data to Improve Supported Education
40
45
50
55
60
65
70
75
Feb Apr Jun Aug Oct Dec Feb Apr Jun Aug Oct 2008 2009
Note: 49-60 = good implementation
36-48 = fair implementation
35 and below = not Supported Education
Here are three examples of tables and graphs that can help you understand and use your outcomes data.
Example 1: Periodic summary tables
Periodic summary tables summarize your outcomes data
each quarter and address these kinds of questions:
How many consumers participated in our Supported
Education program during the last quarter?
How many consumers worked competitively during
the last quarter?
How did the hospitalization rate for those
participating in Supported Education compare to the
rate for consumers in standard treatment?
Agencies often use this type of table to understand
consumer participation or to compare actual results with
agency targets or goals. These tables are also frequently
used to describe agencies’ services in annual reports or
for external community presentations.
Table 1: Sample Periodic Summary Table of Enrollment in Evidence-Based Practices
Not eligible
Eligible but NOT in EBP service
Enrolled Percent of eligible consumers enrolled
Supported Education
0 30 60 67
Assertive Community Treatment
30 25 90 78

Use Data to Improve Supported Education 24 Evaluating Your Program
This agency provides both Supported Education and
Assertive Community Treatment (ACT). The program
leader identified 90 consumers for the program. Of those,
60 receive Supported Education, while 30 consumers are
eligible but receive another service. Consequently, 67
percent of consumers who are eligible for the Supported
Education program currently participate in the program.
Example 2: Movement tables
Tables that track changes in consumer characteristics
(called movement tables) can give you a quick reference
for determining service effectiveness. For example,
Table 2 compares consumers’ employment status
between two quarters.
Table 2: Sample Movement Table
To FY ’06 Qtr 3
From: FY ‘01 Qtr: 2
Une
mplo
yed
Part
-tim
e em
plo
ymen
t
Full-
tim
e em
plo
ymen
t
Tota
l
Unemployed 2 1 3 6
Part-time employment 3 8 3 14
Full-time employment 1 3 100 104
Totals 6 12 106 124
Above the diagonal
Below the diagonal
Within the diagonal
To create this table, the data were collapsed into the three
broad categories. The vertical data cells reflect the
employment status for consumers for the beginning
quarter. The horizontal data cells reflect the most recent
quarterly information. The employment status categories
are then ordered from the least desirable (unemployed) to
the most desirable (full-time employment).
The data in this table are presented in three colors. The
purple cells are those below the diagonal, the blue cells
are those above the diagonal, and the white cells are
those within the diagonal. The data cells above the
diagonal represent consumers who moved into a more
desirable employment status between quarters. As you can
see, one consumer moved from unemployed to part-time
employment, three consumers moved from unemployed
to full-time employment and three consumers moved
from part-time to full-time employment. These seven
consumers (6 percent of the 124 consumers in the
program) moved to a more desirable employment status
between quarters.
The data reported in the diagonal cells ranging from the
upper left quadrant to the lower right reflect consumers
who remained in the same employment status between
quarters. As you can see, two consumers were unemployed
for both quarters of this report, eight consumers remained
in part-time employment, and 100 remained in full-time
employment. These 110 consumers (89 percent of the
124 consumers in the program) remained stable
between quarters.
The cells below the diagonal line represent consumers
who moved into a less desirable employment status
between quarters. Three consumers moved from part-time
employment to unemployed, one moved from full-time
employment to unemployed and three moved from
full-time employment to part-time employment. These
seven consumers (6 percent of the 124 consumers in the
program) experienced some setbacks between quarters.
The column totals show the number of consumers in a
given employment status for the current quarter, and the
row totals show the prior quarter.
You can use movement tables to portray changes in
outcomes that are important to consumers, supervisors,
and policymakers. The data may stimulate discussion
around the progress that consumers are making or the
challenges with which they are presented.
Evaluating Your Program 25 Use Data to Improve Supported Education
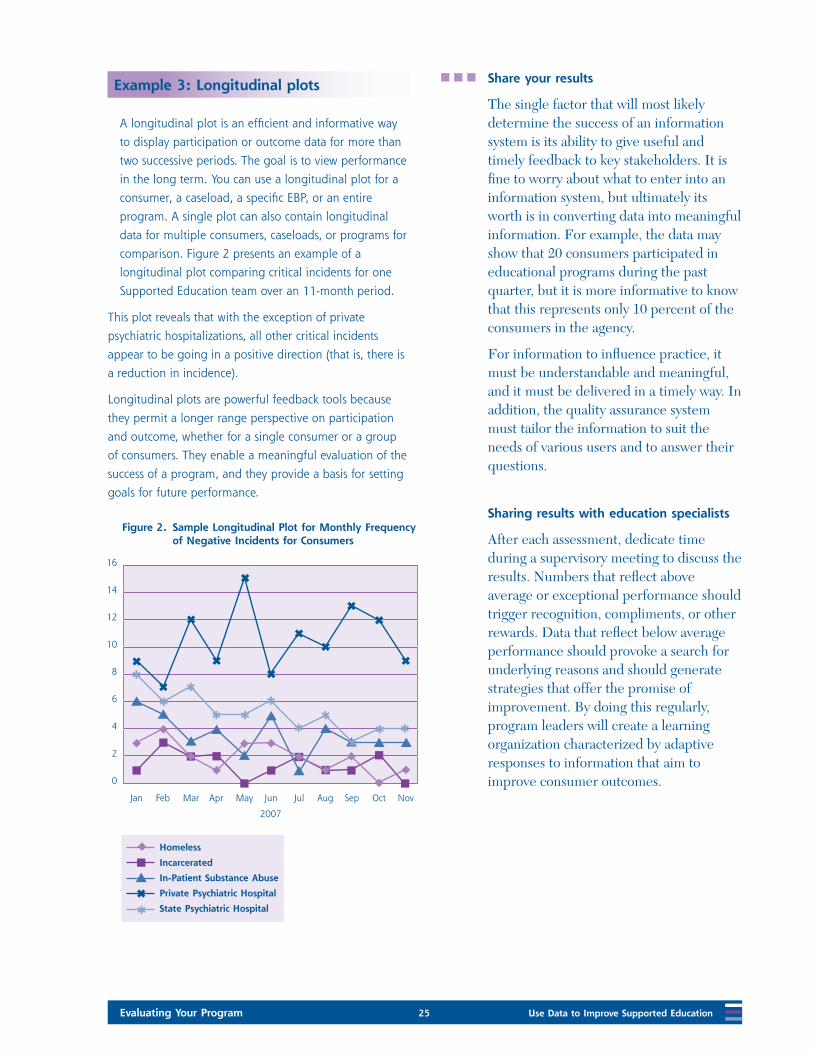
Example 3: Longitudinal plots
A longitudinal plot is an efficient and informative way
to display participation or outcome data for more than
two successive periods. The goal is to view performance
in the long term. You can use a longitudinal plot for a
consumer, a caseload, a specific EBP, or an entire
program. A single plot can also contain longitudinal
data for multiple consumers, caseloads, or programs for
comparison. Figure 2 presents an example of a
longitudinal plot comparing critical incidents for one
Supported Education team over an 11-month period.
This plot reveals that with the exception of private
psychiatric hospitalizations, all other critical incidents
appear to be going in a positive direction (that is, there is
a reduction in incidence).
Longitudinal plots are powerful feedback tools because
they permit a longer range perspective on participation
and outcome, whether for a single consumer or a group
of consumers. They enable a meaningful evaluation of the
success of a program, and they provide a basis for setting
goals for future performance.
Share your results
The single factor that will most likely determine the success of an information system is its ability to give useful and timely feedback to key stakeholders. It is fine to worry about what to enter into an information system, but ultimately its worth is in converting data into meaningful information. For example, the data may show that 20 consumers participated in educational programs during the past quarter, but it is more informative to know that this represents only 10 percent of the consumers in the agency.
For information to influence practice, it must be understandable and meaningful, and it must be delivered in a timely way. In addition, the quality assurance system must tailor the information to suit the needs of various users and to answer their questions.
Sharing results with education specialists
After each assessment, dedicate time during a supervisory meeting to discuss the results. Numbers that reflect above average or exceptional performance should trigger recognition, compliments, or other rewards. Data that reflect below average performance should provoke a search for underlying reasons and should generate strategies that offer the promise of improvement. By doing this regularly, program leaders will create a learning organization characterized by adaptive responses to information that aim to improve consumer outcomes.
Use Data to Improve Supported Education 26 Evaluating Your Program
Sharing results with your advisory committee or quality assurance team
You may also use this information to keep external stakeholders engaged. Sharing information with vested members of the community, staff from your mental health authority, and consumers and family advocates can be valuable. Through these channels, you may develop support for Supported Education, increase consumer participation, and raise private funds for your agency.
Sharing results internally
Agencies may distribute reports during all staff and manager-level meetings to keep staff across the agency informed and engaged in the process of implementing Supported Education. Agencies with successful evidence-based practice programs highlight the importance of developing an understanding and support for the model across the agency.
Additionally, integrating consumer-specific reports into clinical charts may help you monitor consumers’ progress over time. Reporting consumer-specific outcomes information at the treatment team meetings also helps keep the team focused on consumers’ recovery goals.
Sharing results with consumers and families
Agencies may highlight assessment results in consumer and family meetings. Increasing consumers’ and families’ understanding of Supported Education may motivate them to participate in the process and build trust in the consumer-practitioner relationship.
Also, sharing results may create hope and enthusiasm for your Supported Education initiative. Sharing information motivates people and stimulates changes in behavior. Sharing the results of your assessments with a variety of stakeholders is the key to improving services in your agency.

Appendix A 27 Cover Sheet—Supported Education Fidelity Scale
Evaluating Your Program
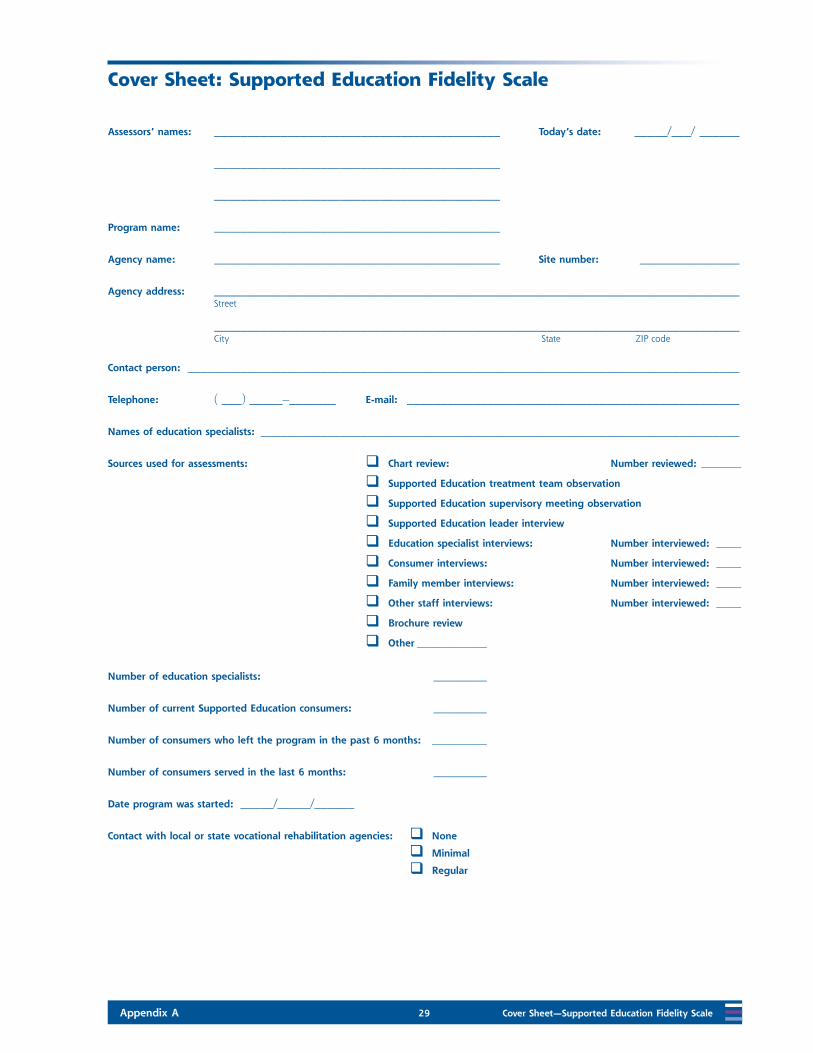
Appendix A: Cover Sheet— Supported Education Fidelity Scale

Appendix A 29 Cover Sheet—Supported Education Fidelity Scale
Cover Sheet: Supported Education Fidelity Scale
Assessors’ names: ___________________________________________ Today’s date: _____/___/ ______
___________________________________________
___________________________________________
Program name: ___________________________________________
Agency name: ___________________________________________ Site number: _______________
Agency address: _______________________________________________________________________________ Street
_______________________________________________________________________________ City State ZIP code
Contact person: ___________________________________________________________________________________
Telephone: ( ___) _____–_______ E-mail: __________________________________________________
Names of education specialists: ________________________________________________________________________
Sources used for assessments: q Chart review: Number reviewed: ��������
q Supported Education treatment team observation
q Supported Education supervisory meeting observation
q Supported Education leader interview
q Education specialist interviews: Number interviewed: �����
q Consumer interviews: Number interviewed: �����
q Family member interviews: Number interviewed: �����
q Other staff interviews: Number interviewed: �����
q Brochure review
q Other ��������������
Number of education specialists: ________
Number of current Supported Education consumers: ________
Number of consumers who left the program in the past 6 months: �����������
Number of consumers served in the last 6 months: ________
Date program was started: _____/_____/______
Contact with local or state vocational rehabilitation agencies: qNone
qMinimal
qRegular

Appendix B 31 Supported Education Fidelity Scale and Scoresheet
Evaluating Your Program
Appendix B: Supported Education Fidelity Scale and Scoresheet
The Supported Education Fidelity Scale on the next pages is printed with permission from the developers at the University of Kansas, School of Social Welfare, Center for Mental Health Research and Training.

Appendix B 33 Supported Education Fidelity Scale and Scoresheet
Supported Education Fidelity ScaleRatings/Anchor
Criteria 1 2 3 4 5
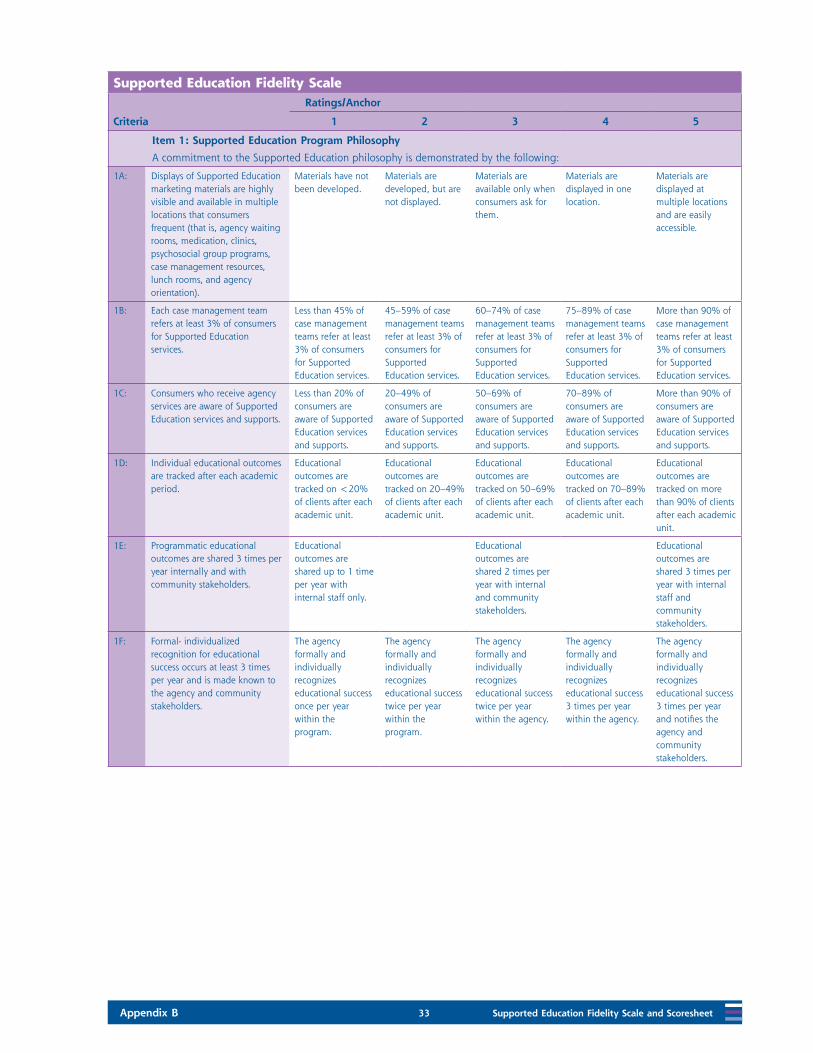
Item 1: Supported Education Program Philosophy
A commitment to the Supported Education philosophy is demonstrated by the following:
1A: Displays of Supported Education marketing materials are highly visible and available in multiple locations that consumers frequent (that is, agency waiting rooms, medication, clinics, psychosocial group programs, case management resources, lunch rooms, and agency orientation).
Materials have not been developed.
Materials are developed, but are not displayed.
Materials are available only when consumers ask for them.
Materials are displayed in one location.
Materials are displayed at multiple locations and are easily accessible.
1B: Each case management team refers at least 3% of consumers for Supported Education services.
Less than 45% of case management teams refer at least 3% of consumers for Supported Education services.
45–59% of case management teams refer at least 3% of consumers for Supported Education services.
60–74% of case management teams refer at least 3% of consumers for Supported Education services.
75–89% of case management teams refer at least 3% of consumers for Supported Education services.
More than 90% of case management teams refer at least 3% of consumers for Supported Education services.
1C: Consumers who receive agency services are aware of Supported Education services and supports.
Less than 20% of consumers are aware of Supported Education services and supports.
20–49% of consumers are aware of Supported Education services and supports.
50–69% of consumers are aware of Supported Education services and supports.
70–89% of consumers are aware of Supported Education services and supports.
More than 90% of consumers are aware of Supported Education services and supports.
1D: Individual educational outcomes are tracked after each academic period.
Educational outcomes are tracked on <20% of clients after each academic unit.
Educational outcomes are tracked on 20–49% of clients after each academic unit.
Educational outcomes are tracked on 50–69% of clients after each academic unit.
Educational outcomes are tracked on 70–89% of clients after each academic unit.
Educational outcomes are tracked on more than 90% of clients after each academic unit.
1E: Programmatic educational outcomes are shared 3 times per year internally and with community stakeholders.
Educational outcomes are shared up to 1 time per year with internal staff only.
Educational outcomes are shared 2 times per year with internal and community stakeholders.
Educational outcomes are shared 3 times per year with internal staff and community stakeholders.
1F: Formal- individualized recognition for educational success occurs at least 3 times per year and is made known to the agency and community stakeholders.
The agency formally and individually recognizes educational success once per year within the program.
The agency formally and individually recognizes educational success twice per year within the program.
The agency formally and individually recognizes educational success twice per year within the agency.
The agency formally and individually recognizes educational success 3 times per year within the agency.
The agency formally and individually recognizes educational success 3 times per year and notifies the agency and community stakeholders.
Supported Education Fidelity Scale and Scoresheet 34 Appendix B
Supported Education Fidelity ScaleRatings/Anchor
Criteria 1 2 3 4 5
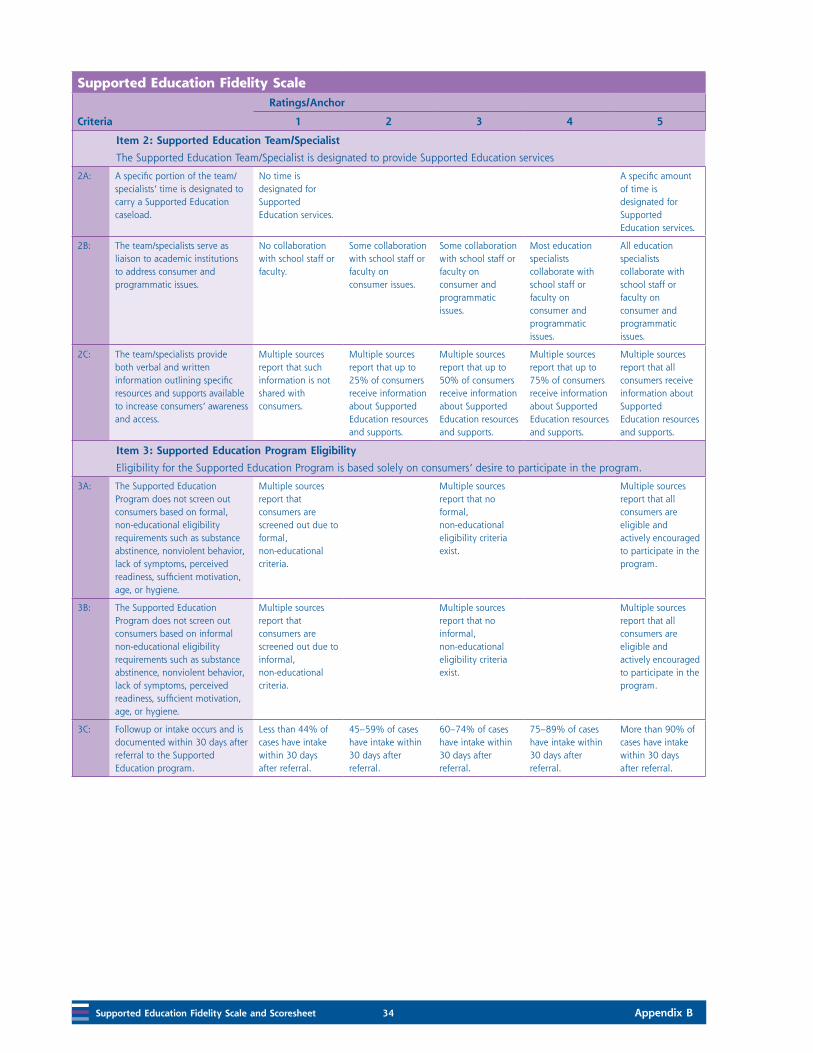
Item 2: Supported Education Team/Specialist
The Supported Education Team/Specialist is designated to provide Supported Education services
2A: A specific portion of the team/specialists’ time is designated to carry a Supported Education caseload.
No time is designated for Supported Education services.
A specific amount of time is designated for Supported Education services.
2B: The team/specialists serve as liaison to academic institutions to address consumer and programmatic issues.
No collaboration with school staff or faculty.
Some collaboration with school staff or faculty on consumer issues.
Some collaboration with school staff or faculty on consumer and programmatic issues.
Most education specialists collaborate with school staff or faculty on consumer and programmatic issues.
All education specialists collaborate with school staff or faculty on consumer and programmatic issues.
2C: The team/specialists provide both verbal and written information outlining specific resources and supports available to increase consumers’ awareness and access.
Multiple sources report that such information is not shared with consumers.
Multiple sources report that up to 25% of consumers receive information about Supported Education resources and supports.
Multiple sources report that up to 50% of consumers receive information about Supported Education resources and supports.
Multiple sources report that up to 75% of consumers receive information about Supported Education resources and supports.
Multiple sources report that all consumers receive information about Supported Education resources and supports.
Item 3: Supported Education Program Eligibility
Eligibility for the Supported Education Program is based solely on consumers’ desire to participate in the program.
3A: The Supported Education Program does not screen out consumers based on formal, non-educational eligibility requirements such as substance abstinence, nonviolent behavior, lack of symptoms, perceived readiness, sufficient motivation, age, or hygiene.
Multiple sources report that consumers are screened out due to formal, non-educational criteria.
Multiple sources report that no formal, non-educational eligibility criteria exist.
Multiple sources report that all consumers are eligible and actively encouraged to participate in the program.
3B: The Supported Education Program does not screen out consumers based on informal non-educational eligibility requirements such as substance abstinence, nonviolent behavior, lack of symptoms, perceived readiness, sufficient motivation, age, or hygiene.
Multiple sources report that consumers are screened out due to informal, non-educational criteria.
Multiple sources report that no informal, non-educational eligibility criteria exist.
Multiple sources report that all consumers are eligible and actively encouraged to participate in the program.
3C: Followup or intake occurs and is documented within 30 days after referral to the Supported Education program.
Less than 44% of cases have intake within 30 days after referral.
45–59% of cases have intake within 30 days after referral.
60–74% of cases have intake within 30 days after referral.
75–89% of cases have intake within 30 days after referral.
More than 90% of cases have intake within 30 days after referral.
Appendix B 35 Supported Education Fidelity Scale and Scoresheet
Supported Education Fidelity ScaleRatings/Anchor
Criteria 1 2 3 4 5
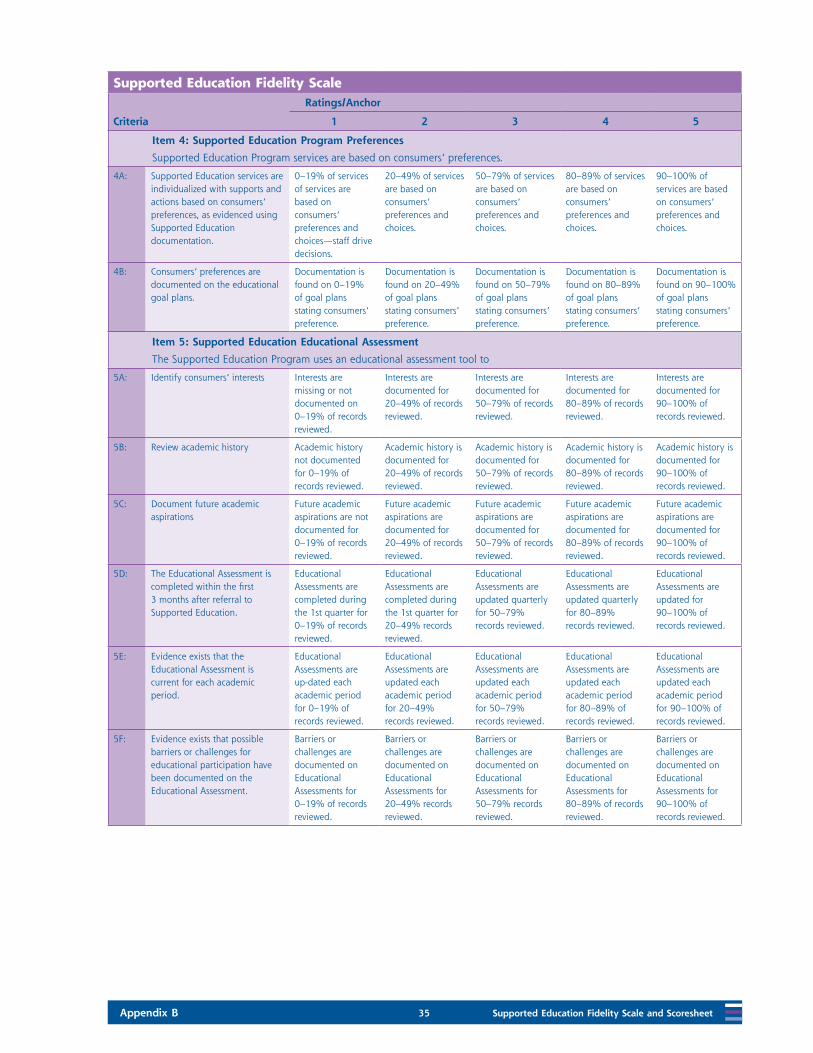
Item 4: Supported Education Program Preferences
Supported Education Program services are based on consumers’ preferences.
4A: Supported Education services are individualized with supports and actions based on consumers’ preferences, as evidenced using Supported Education documentation.
0–19% of services of services are based on consumers’ preferences and choices—staff drive decisions.
20–49% of services are based on consumers’ preferences and choices.
50–79% of services are based on consumers’ preferences and choices.
80–89% of services are based on consumers’ preferences and choices.
90–100% of services are based on consumers’ preferences and choices.
4B: Consumers’ preferences are documented on the educational goal plans.
Documentation is found on 0–19% of goal plans stating consumers’ preference.
Documentation is found on 20–49% of goal plans stating consumers’ preference.
Documentation is found on 50–79% of goal plans stating consumers’ preference.
Documentation is found on 80–89% of goal plans stating consumers’ preference.
Documentation is found on 90–100% of goal plans stating consumers’ preference.
Item 5: Supported Education Educational Assessment
The Supported Education Program uses an educational assessment tool to
5A: Identify consumers’ interests Interests are missing or not documented on 0–19% of records reviewed.
Interests are documented for 20–49% of records reviewed.
Interests are documented for 50–79% of records reviewed.
Interests are documented for 80–89% of records reviewed.
Interests are documented for 90–100% of records reviewed.
5B: Review academic history Academic history not documented for 0–19% of records reviewed.
Academic history is documented for 20–49% of records reviewed.
Academic history is documented for 50–79% of records reviewed.
Academic history is documented for 80–89% of records reviewed.
Academic history is documented for 90–100% of records reviewed.
5C: Document future academic aspirations
Future academic aspirations are not documented for 0–19% of records reviewed.
Future academic aspirations are documented for 20–49% of records reviewed.
Future academic aspirations are documented for 50–79% of records reviewed.
Future academic aspirations are documented for 80–89% of records reviewed.
Future academic aspirations are documented for 90–100% of records reviewed.
5D: The Educational Assessment is completed within the first 3 months after referral to Supported Education.
Educational Assessments are completed during the 1st quarter for 0–19% of records reviewed.
Educational Assessments are completed during the 1st quarter for 20–49% records reviewed.
Educational Assessments are updated quarterly for 50–79% records reviewed.
Educational Assessments are updated quarterly for 80–89% records reviewed.
Educational Assessments are updated for 90–100% of records reviewed.
5E: Evidence exists that the Educational Assessment is current for each academic period.
Educational Assessments are up-dated each academic period for 0–19% of records reviewed.
Educational Assessments are updated each academic period for 20–49% records reviewed.
Educational Assessments are updated each academic period for 50–79% records reviewed.
Educational Assessments are updated each academic period for 80–89% of records reviewed.
Educational Assessments are updated each academic period for 90–100% of records reviewed.
5F: Evidence exists that possible barriers or challenges for educational participation have been documented on the Educational Assessment.
Barriers or challenges are documented on Educational Assessments for 0–19% of records reviewed.
Barriers or challenges are documented on Educational Assessments for 20–49% records reviewed.
Barriers or challenges are documented on Educational Assessments for 50–79% records reviewed.
Barriers or challenges are documented on Educational Assessments for 80–89% of records reviewed.
Barriers or challenges are documented on Educational Assessments for 90–100% of records reviewed.
Supported Education Fidelity Scale and Scoresheet 36 Appendix B
Supported Education Fidelity ScaleRatings/Anchor
Criteria 1 2 3 4 5
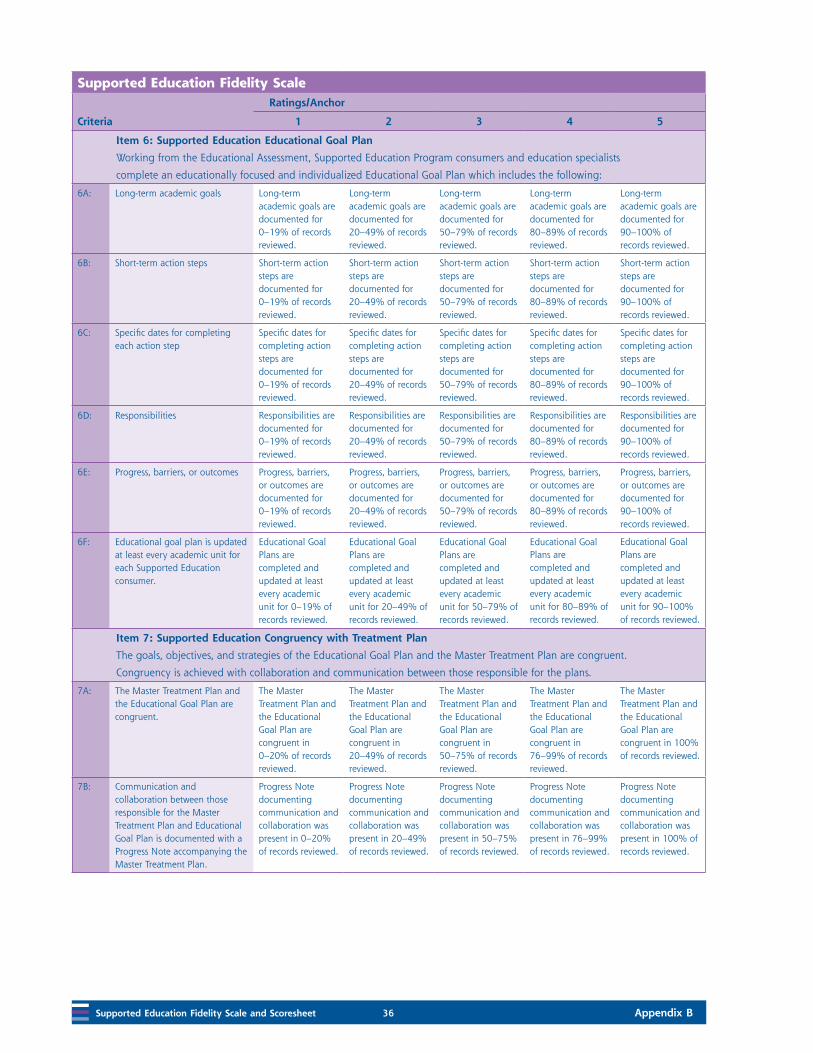
Item 6: Supported Education Educational Goal Plan
Working from the Educational Assessment, Supported Education Program consumers and education specialists
complete an educationally focused and individualized Educational Goal Plan which includes the following:
6A: Long-term academic goals Long-term academic goals are documented for 0–19% of records reviewed.
Long-term academic goals are documented for 20–49% of records reviewed.
Long-term academic goals are documented for 50–79% of records reviewed.
Long-term academic goals are documented for 80–89% of records reviewed.
Long-term academic goals are documented for 90–100% of records reviewed.
6B: Short-term action steps Short-term action steps are documented for 0–19% of records reviewed.
Short-term action steps are documented for 20–49% of records reviewed.
Short-term action steps are documented for 50–79% of records reviewed.
Short-term action steps are documented for 80–89% of records reviewed.
Short-term action steps are documented for 90–100% of records reviewed.
6C: Specific dates for completing each action step
Specific dates for completing action steps are documented for 0–19% of records reviewed.
Specific dates for completing action steps are documented for 20–49% of records reviewed.
Specific dates for completing action steps are documented for 50–79% of records reviewed.
Specific dates for completing action steps are documented for 80–89% of records reviewed.
Specific dates for completing action steps are documented for 90–100% of records reviewed.
6D: Responsibilities Responsibilities are documented for 0–19% of records reviewed.
Responsibilities are documented for 20–49% of records reviewed.
Responsibilities are documented for 50–79% of records reviewed.
Responsibilities are documented for 80–89% of records reviewed.
Responsibilities are documented for 90–100% of records reviewed.
6E: Progress, barriers, or outcomes Progress, barriers, or outcomes are documented for 0–19% of records reviewed.
Progress, barriers, or outcomes are documented for 20–49% of records reviewed.
Progress, barriers, or outcomes are documented for 50–79% of records reviewed.
Progress, barriers, or outcomes are documented for 80–89% of records reviewed.
Progress, barriers, or outcomes are documented for 90–100% of records reviewed.
6F: Educational goal plan is updated at least every academic unit for each Supported Education consumer.
Educational Goal Plans are completed and updated at least every academic unit for 0–19% of records reviewed.
Educational Goal Plans are completed and updated at least every academic unit for 20–49% of records reviewed.
Educational Goal Plans are completed and updated at least every academic unit for 50–79% of records reviewed.
Educational Goal Plans are completed and updated at least every academic unit for 80–89% of records reviewed.
Educational Goal Plans are completed and updated at least every academic unit for 90–100% of records reviewed.
Item 7: Supported Education Congruency with Treatment Plan
The goals, objectives, and strategies of the Educational Goal Plan and the Master Treatment Plan are congruent.
Congruency is achieved with collaboration and communication between those responsible for the plans.
7A: The Master Treatment Plan and the Educational Goal Plan are congruent.
The Master Treatment Plan and the Educational Goal Plan are congruent in 0–20% of records reviewed.
The Master Treatment Plan and the Educational Goal Plan are congruent in 20–49% of records reviewed.
The Master Treatment Plan and the Educational Goal Plan are congruent in 50–75% of records reviewed.
The Master Treatment Plan and the Educational Goal Plan are congruent in 76–99% of records reviewed.
The Master Treatment Plan and the Educational Goal Plan are congruent in 100% of records reviewed.
7B: Communication and collaboration between those responsible for the Master Treatment Plan and Educational Goal Plan is documented with a Progress Note accompanying the Master Treatment Plan.
Progress Note documenting communication and collaboration was present in 0–20% of records reviewed.
Progress Note documenting communication and collaboration was present in 20–49% of records reviewed.
Progress Note documenting communication and collaboration was present in 50–75% of records reviewed.
Progress Note documenting communication and collaboration was present in 76–99% of records reviewed.
Progress Note documenting communication and collaboration was present in 100% of records reviewed.
Appendix B 37 Supported Education Fidelity Scale and Scoresheet
Supported Education Fidelity ScaleRatings/Anchor
Criteria 1 2 3 4 5
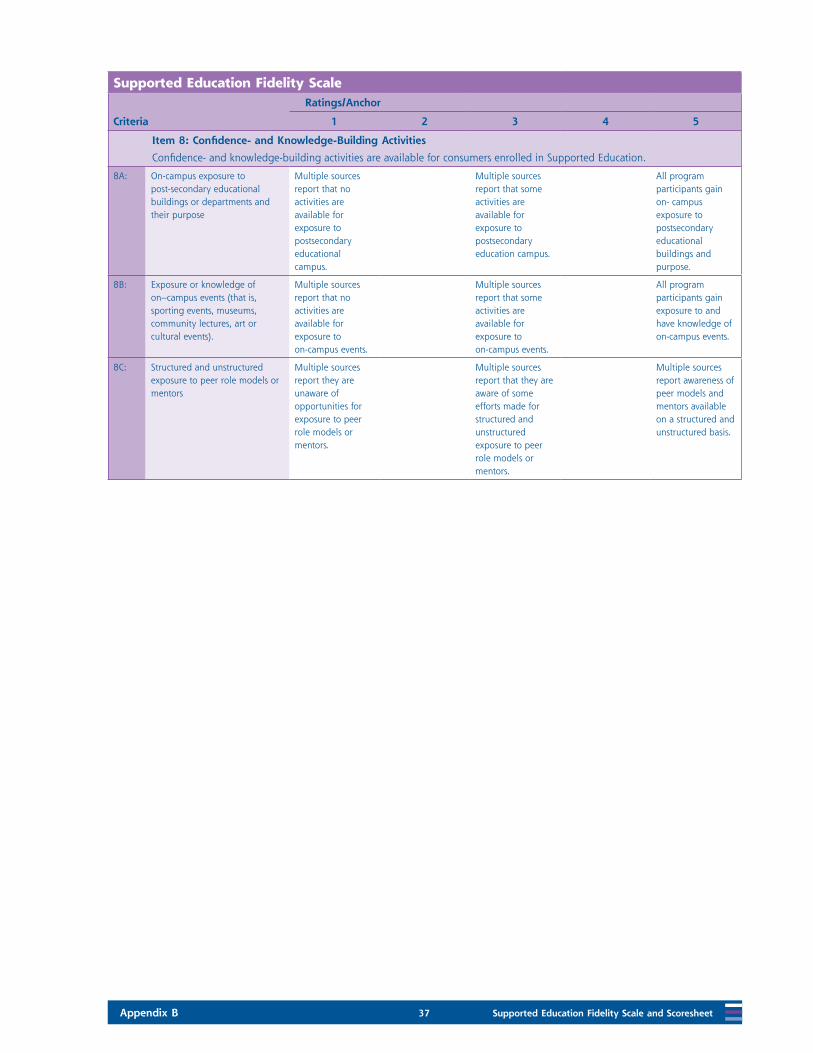
Item 8: Confidence- and Knowledge-Building Activities
Confidence- and knowledge-building activities are available for consumers enrolled in Supported Education.
8A: On-campus exposure to post-secondary educational buildings or departments and their purpose
Multiple sources report that no activities are available for exposure to postsecondary educational campus.
Multiple sources report that some activities are available for exposure to postsecondary education campus.
All program participants gain on- campus exposure to postsecondary educational buildings and purpose.
8B: Exposure or knowledge of on--campus events (that is, sporting events, museums, community lectures, art or cultural events).
Multiple sources report that no activities are available for exposure to on-campus events.
Multiple sources report that some activities are available for exposure to on-campus events.
All program participants gain exposure to and have knowledge of on-campus events.
8C: Structured and unstructured exposure to peer role models or mentors
Multiple sources report they are unaware of opportunities for exposure to peer role models or mentors.
Multiple sources report that they are aware of some efforts made for structured and unstructured exposure to peer role models or mentors.
Multiple sources report awareness of peer models and mentors available on a structured and unstructured basis.
Supported Education Fidelity Scale and Scoresheet 38 Appendix B
Supported Education Fidelity ScaleRatings/Anchor
Criteria 1 2 3 4 5
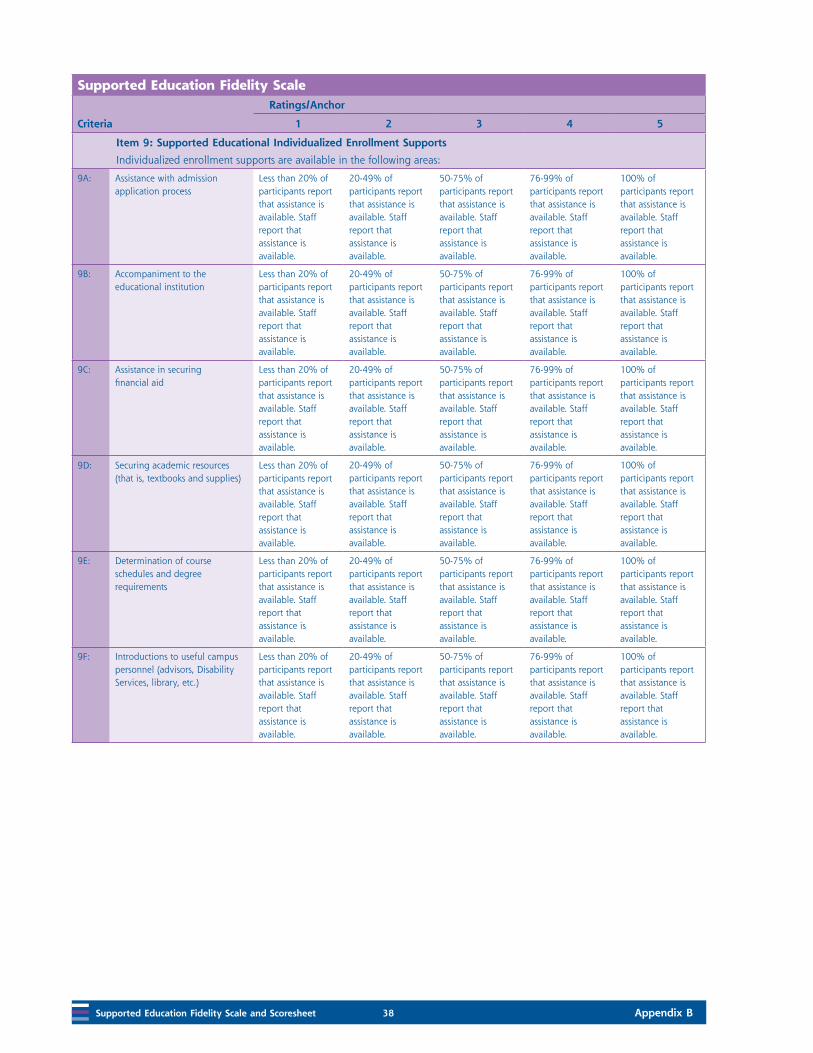
Item 9: Supported Educational Individualized Enrollment Supports
Individualized enrollment supports are available in the following areas:
9A: Assistance with admission application process
Less than 20% of participants report that assistance is available. Staff report that assistance is available.
20-49% of participants report that assistance is available. Staff report that assistance is available.
50-75% of participants report that assistance is available. Staff report that assistance is available.
76-99% of participants report that assistance is available. Staff report that assistance is available.
100% of participants report that assistance is available. Staff report that assistance is available.
9B: Accompaniment to the educational institution
Less than 20% of participants report that assistance is available. Staff report that assistance is available.
20-49% of participants report that assistance is available. Staff report that assistance is available.
50-75% of participants report that assistance is available. Staff report that assistance is available.
76-99% of participants report that assistance is available. Staff report that assistance is available.
100% of participants report that assistance is available. Staff report that assistance is available.
9C: Assistance in securing financial aid
Less than 20% of participants report that assistance is available. Staff report that assistance is available.
20-49% of participants report that assistance is available. Staff report that assistance is available.
50-75% of participants report that assistance is available. Staff report that assistance is available.
76-99% of participants report that assistance is available. Staff report that assistance is available.
100% of participants report that assistance is available. Staff report that assistance is available.
9D: Securing academic resources (that is, textbooks and supplies)
Less than 20% of participants report that assistance is available. Staff report that assistance is available.
20-49% of participants report that assistance is available. Staff report that assistance is available.
50-75% of participants report that assistance is available. Staff report that assistance is available.
76-99% of participants report that assistance is available. Staff report that assistance is available.
100% of participants report that assistance is available. Staff report that assistance is available.
9E: Determination of course schedules and degree requirements
Less than 20% of participants report that assistance is available. Staff report that assistance is available.
20-49% of participants report that assistance is available. Staff report that assistance is available.
50-75% of participants report that assistance is available. Staff report that assistance is available.
76-99% of participants report that assistance is available. Staff report that assistance is available.
100% of participants report that assistance is available. Staff report that assistance is available.
9F: Introductions to useful campus personnel (advisors, Disability Services, library, etc.)
Less than 20% of participants report that assistance is available. Staff report that assistance is available.
20-49% of participants report that assistance is available. Staff report that assistance is available.
50-75% of participants report that assistance is available. Staff report that assistance is available.
76-99% of participants report that assistance is available. Staff report that assistance is available.
100% of participants report that assistance is available. Staff report that assistance is available.
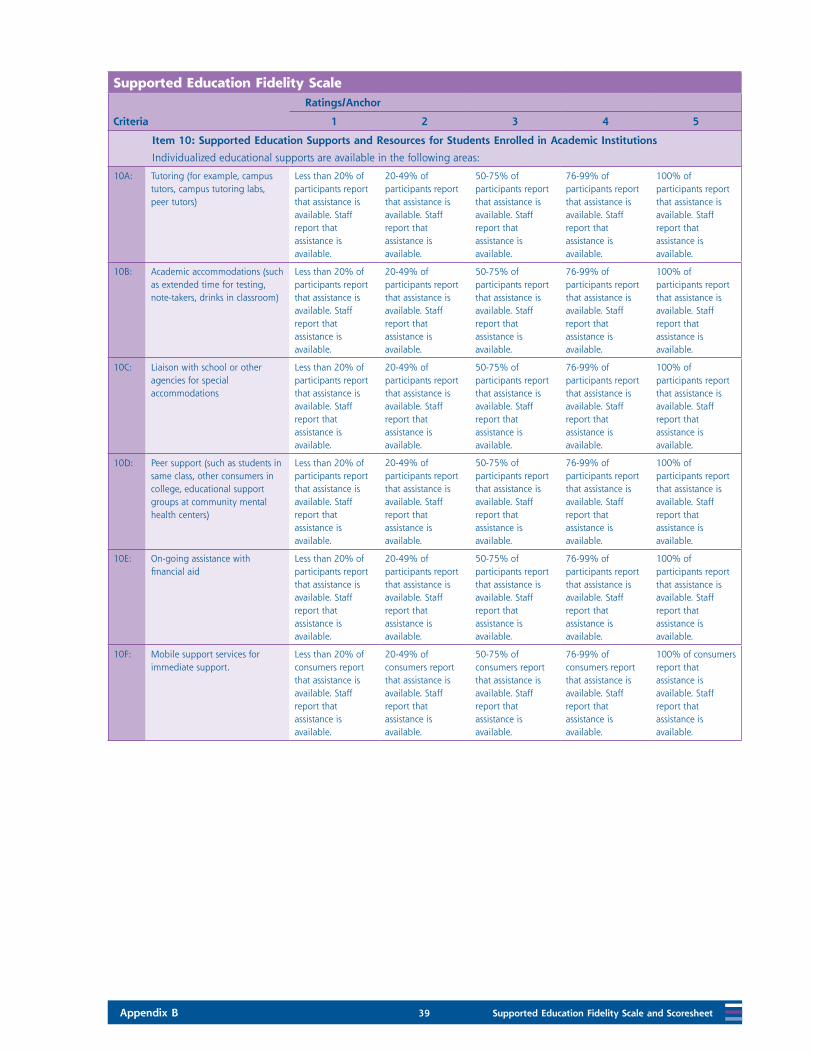
Appendix B 39 Supported Education Fidelity Scale and Scoresheet
Supported Education Fidelity ScaleRatings/Anchor
Criteria 1 2 3 4 5
Item 10: Supported Education Supports and Resources for Students Enrolled in Academic Institutions
Individualized educational supports are available in the following areas:
10A: Tutoring (for example, campus tutors, campus tutoring labs, peer tutors)
Less than 20% of participants report that assistance is available. Staff report that assistance is available.
20-49% of participants report that assistance is available. Staff report that assistance is available.
50-75% of participants report that assistance is available. Staff report that assistance is available.
76-99% of participants report that assistance is available. Staff report that assistance is available.
100% of participants report that assistance is available. Staff report that assistance is available.
10B: Academic accommodations (such as extended time for testing, note-takers, drinks in classroom)
Less than 20% of participants report that assistance is available. Staff report that assistance is available.
20-49% of participants report that assistance is available. Staff report that assistance is available.
50-75% of participants report that assistance is available. Staff report that assistance is available.
76-99% of participants report that assistance is available. Staff report that assistance is available.
100% of participants report that assistance is available. Staff report that assistance is available.
10C: Liaison with school or other agencies for special accommodations
Less than 20% of participants report that assistance is available. Staff report that assistance is available.
20-49% of participants report that assistance is available. Staff report that assistance is available.
50-75% of participants report that assistance is available. Staff report that assistance is available.
76-99% of participants report that assistance is available. Staff report that assistance is available.
100% of participants report that assistance is available. Staff report that assistance is available.
10D: Peer support (such as students in same class, other consumers in college, educational support groups at community mental health centers)
Less than 20% of participants report that assistance is available. Staff report that assistance is available.
20-49% of participants report that assistance is available. Staff report that assistance is available.
50-75% of participants report that assistance is available. Staff report that assistance is available.
76-99% of participants report that assistance is available. Staff report that assistance is available.
100% of participants report that assistance is available. Staff report that assistance is available.
10E: On-going assistance with financial aid
Less than 20% of participants report that assistance is available. Staff report that assistance is available.
20-49% of participants report that assistance is available. Staff report that assistance is available.
50-75% of participants report that assistance is available. Staff report that assistance is available.
76-99% of participants report that assistance is available. Staff report that assistance is available.
100% of participants report that assistance is available. Staff report that assistance is available.
10F: Mobile support services for immediate support.
Less than 20% of consumers report that assistance is available. Staff report that assistance is available.
20-49% of consumers report that assistance is available. Staff report that assistance is available.
50-75% of consumers report that assistance is available. Staff report that assistance is available.
76-99% of consumers report that assistance is available. Staff report that assistance is available.
100% of consumers report that assistance is available. Staff report that assistance is available.
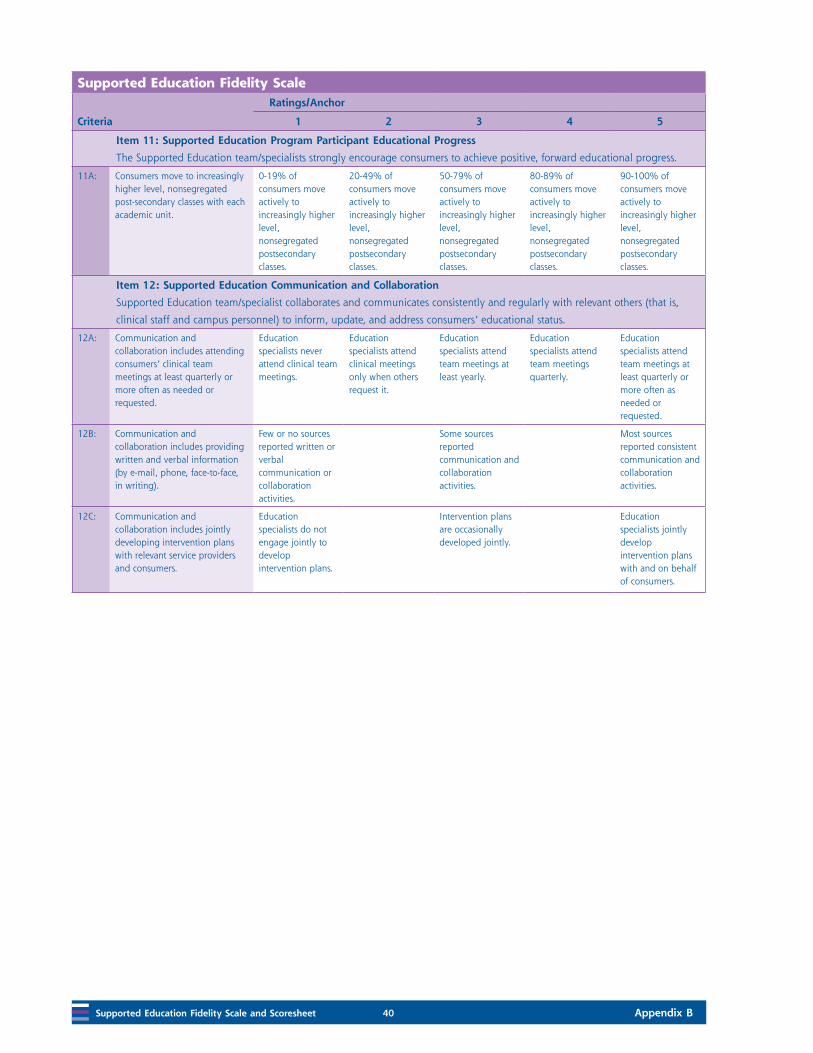
Supported Education Fidelity Scale and Scoresheet 40 Appendix B
Supported Education Fidelity ScaleRatings/Anchor
Criteria 1 2 3 4 5
Item 11: Supported Education Program Participant Educational Progress
The Supported Education team/specialists strongly encourage consumers to achieve positive, forward educational progress.
11A: Consumers move to increasingly higher level, nonsegregated post-secondary classes with each academic unit.
0-19% of consumers move actively to increasingly higher level, nonsegregated postsecondary classes.
20-49% of consumers move actively to increasingly higher level, nonsegregated postsecondary classes.
50-79% of consumers move actively to increasingly higher level, nonsegregated postsecondary classes.
80-89% of consumers move actively to increasingly higher level, nonsegregated postsecondary classes.
90-100% of consumers move actively to increasingly higher level, nonsegregated postsecondary classes.
Item 12: Supported Education Communication and Collaboration
Supported Education team/specialist collaborates and communicates consistently and regularly with relevant others (that is,
clinical staff and campus personnel) to inform, update, and address consumers’ educational status.
12A: Communication and collaboration includes attending consumers’ clinical team meetings at least quarterly or more often as needed or requested.
Education specialists never attend clinical team meetings.
Education specialists attend clinical meetings only when others request it.
Education specialists attend team meetings at least yearly.
Education specialists attend team meetings quarterly.
Education specialists attend team meetings at least quarterly or more often as needed or requested.
12B: Communication and collaboration includes providing written and verbal information (by e-mail, phone, face-to-face, in writing).
Few or no sources reported written or verbal communication or collaboration activities.
Some sources reported communication and collaboration activities.
Most sources reported consistent communication and collaboration activities.
12C: Communication and collaboration includes jointly developing intervention plans with relevant service providers and consumers.
Education specialists do not engage jointly to develop intervention plans.
Intervention plans are occasionally developed jointly.
Education specialists jointly develop intervention plans with and on behalf of consumers.
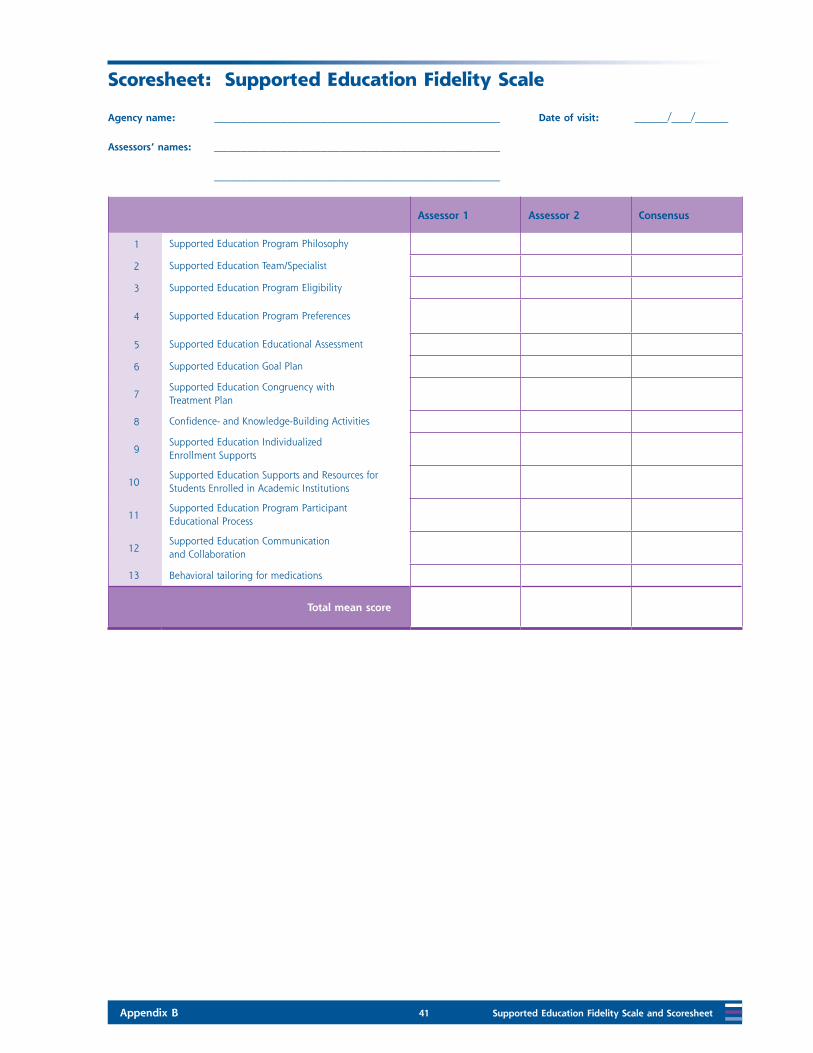
Appendix B 41 Supported Education Fidelity Scale and Scoresheet
Scoresheet: Supported Education Fidelity Scale
Agency name: ___________________________________________ Date of visit: _____/___/_____
Assessors’ names: ___________________________________________
___________________________________________
Assessor 1 Assessor 2 Consensus
1 Supported Education Program Philosophy
2 Supported Education Team/Specialist
3 Supported Education Program Eligibility
4 Supported Education Program Preferences
5 Supported Education Educational Assessment
6 Supported Education Goal Plan
7Supported Education Congruency with Treatment Plan
8 Confidence- and Knowledge-Building Activities
9Supported Education Individualized Enrollment Supports
10Supported Education Supports and Resources for Students Enrolled in Academic Institutions
11Supported Education Program Participant Educational Process
12Supported Education Communication and Collaboration
13 Behavioral tailoring for medications
Total mean score

Appendix C 43 Protocol: Supported Education Fidelity Scale
Evaluating Your Program
Appendix C: Supported Education Fidelity Scale Protocol

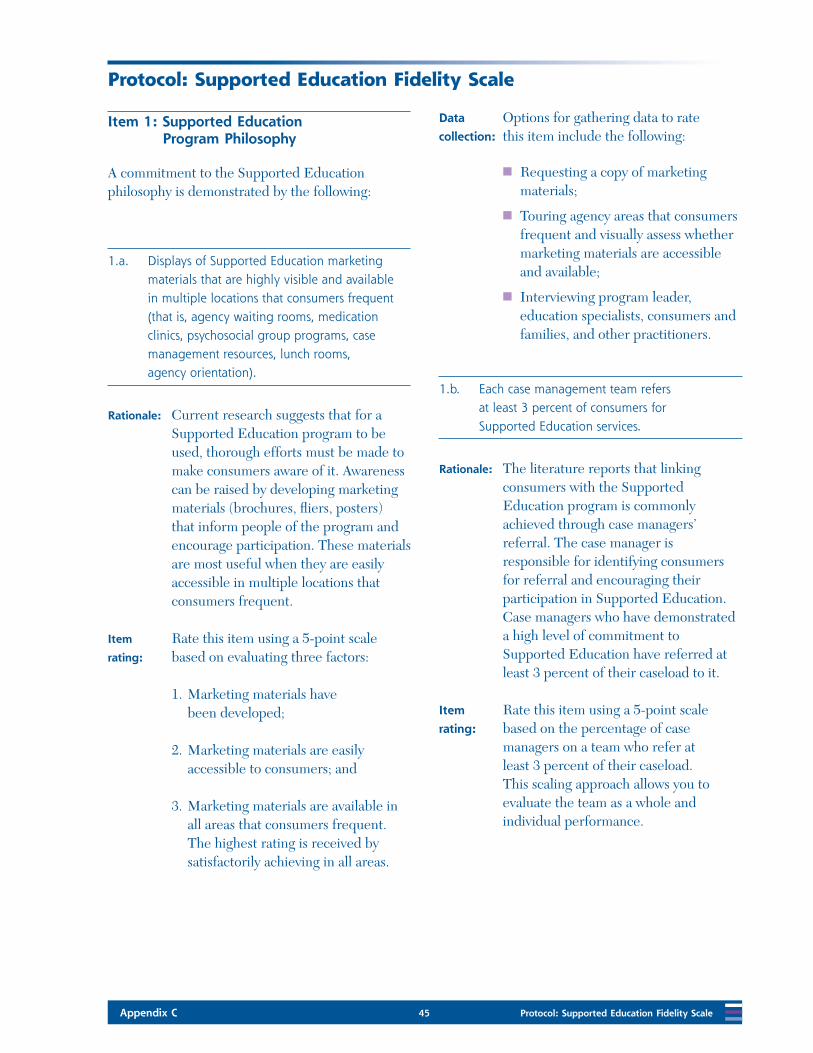
Appendix C 45 Protocol: Supported Education Fidelity Scale
Protocol: Supported Education Fidelity Scale
Item 1: Supported Education Program Philosophy
A commitment to the Supported Education philosophy is demonstrated by the following:
1.a. Displays of Supported Education marketing materials that are highly visible and available in multiple locations that consumers frequent (that is, agency waiting rooms, medication clinics, psychosocial group programs, case management resources, lunch rooms, agency orientation).
Rationale: Current research suggests that for a Supported Education program to be used, thorough efforts must be made to make consumers aware of it. Awareness can be raised by developing marketing materials (brochures, fliers, posters) that inform people of the program and encourage participation. These materials are most useful when they are easily accessible in multiple locations that consumers frequent.
Item
rating:
Rate this item using a 5-point scale based on evaluating three factors:
1. Marketing materials have been developed;
2. Marketing materials are easily accessible to consumers; and
3. Marketing materials are available in all areas that consumers frequent. The highest rating is received by satisfactorily achieving in all areas.
Data
collection:
Options for gathering data to rate this item include the following:
Requesting a copy of marketing materials;
Touring agency areas that consumers frequent and visually assess whether marketing materials are accessible and available;
Interviewing program leader, education specialists, consumers and families, and other practitioners.
1.b. Each case management team refers at least 3 percent of consumers for Supported Education services.
Rationale: The literature reports that linking consumers with the Supported Education program is commonly achieved through case managers’ referral. The case manager is responsible for identifying consumers for referral and encouraging their participation in Supported Education. Case managers who have demonstrated a high level of commitment to Supported Education have referred at least 3 percent of their caseload to it.
Item
rating:
Rate this item using a 5-point scale based on the percentage of case managers on a team who refer at least 3 percent of their caseload. This scaling approach allows you to evaluate the team as a whole and individual performance.
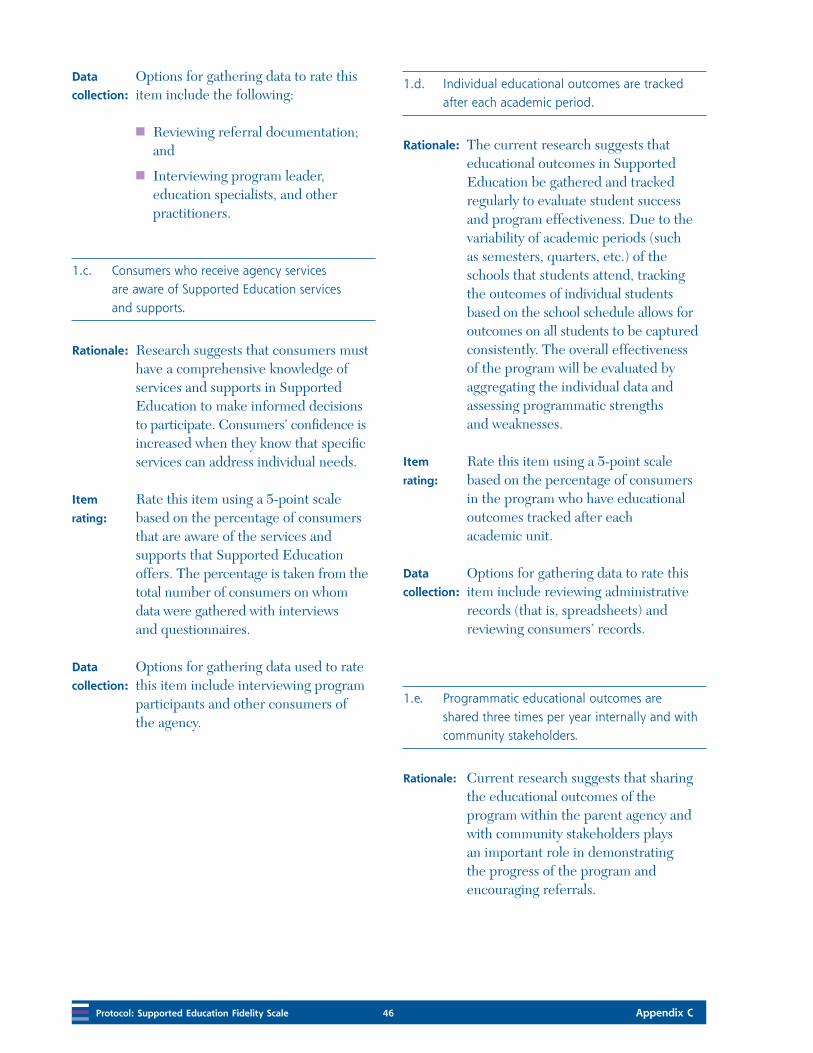
Protocol: Supported Education Fidelity Scale 46 Appendix C
Data
collection:
Options for gathering data to rate this item include the following:
Reviewing referral documentation; and
Interviewing program leader, education specialists, and other practitioners.
1.c. Consumers who receive agency services are aware of Supported Education services and supports.
Rationale: Research suggests that consumers must have a comprehensive knowledge of services and supports in Supported Education to make informed decisions to participate. Consumers’ confidence is increased when they know that specific services can address individual needs.
Item
rating:
Rate this item using a 5-point scale based on the percentage of consumers that are aware of the services and supports that Supported Education offers. The percentage is taken from the total number of consumers on whom data were gathered with interviews and questionnaires.
Data
collection:
Options for gathering data used to rate this item include interviewing program participants and other consumers of the agency.
1.d. Individual educational outcomes are tracked after each academic period.
Rationale: The current research suggests that educational outcomes in Supported Education be gathered and tracked regularly to evaluate student success and program effectiveness. Due to the variability of academic periods (such as semesters, quarters, etc.) of the schools that students attend, tracking the outcomes of individual students based on the school schedule allows for outcomes on all students to be captured consistently. The overall effectiveness of the program will be evaluated by aggregating the individual data and assessing programmatic strengths and weaknesses.
Item
rating:
Rate this item using a 5-point scale based on the percentage of consumers in the program who have educational outcomes tracked after each academic unit.
Data
collection:
Options for gathering data to rate this item include reviewing administrative records (that is, spreadsheets) and reviewing consumers’ records.
1.e. Programmatic educational outcomes are shared three times per year internally and with community stakeholders.
Rationale: Current research suggests that sharing the educational outcomes of the program within the parent agency and with community stakeholders plays an important role in demonstrating the progress of the program and encouraging referrals.
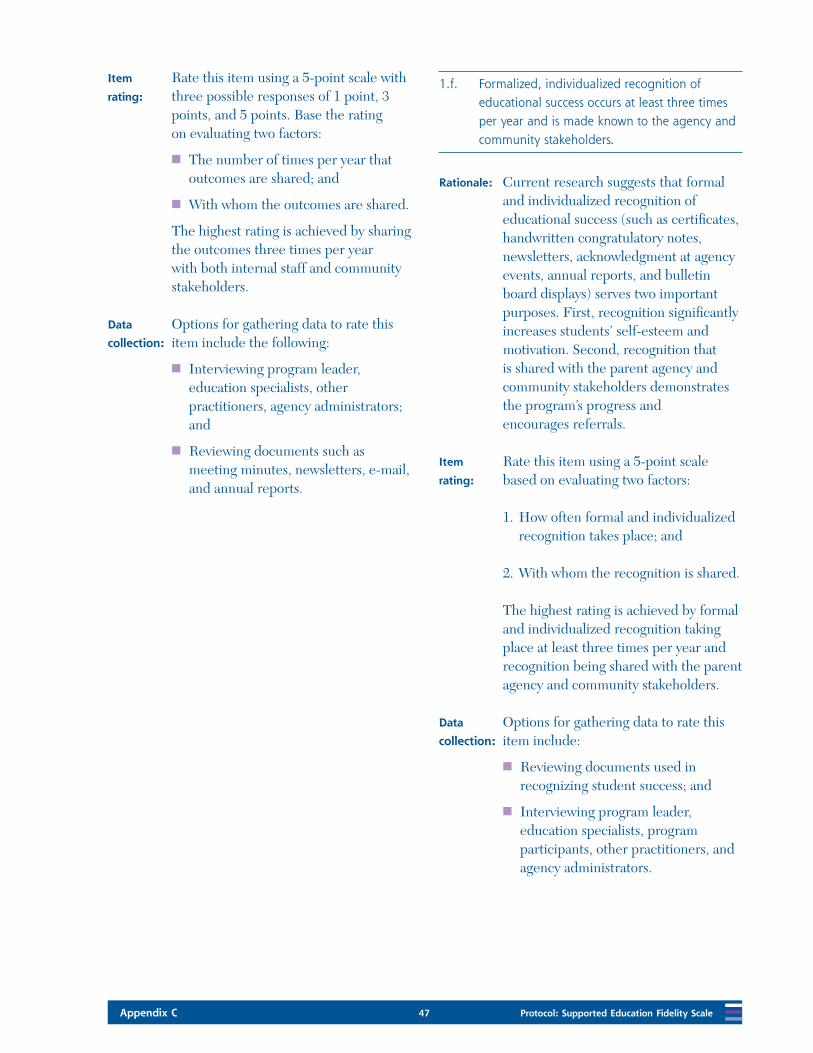
Appendix C 47 Protocol: Supported Education Fidelity Scale
Item
rating:
Rate this item using a 5-point scale with three possible responses of 1 point, 3 points, and 5 points. Base the rating on evaluating two factors:
The number of times per year that outcomes are shared; and
With whom the outcomes are shared.
The highest rating is achieved by sharing the outcomes three times per year with both internal staff and community stakeholders.
Data
collection:
Options for gathering data to rate this item include the following:
Interviewing program leader, education specialists, other practitioners, agency administrators; and
Reviewing documents such as meeting minutes, newsletters, e-mail, and annual reports.
1.f. Formalized, individualized recognition of educational success occurs at least three times per year and is made known to the agency and community stakeholders.
Rationale: Current research suggests that formal and individualized recognition of educational success (such as certificates, handwritten congratulatory notes, newsletters, acknowledgment at agency events, annual reports, and bulletin board displays) serves two important purposes. First, recognition significantly increases students’ self-esteem and motivation. Second, recognition that is shared with the parent agency and community stakeholders demonstrates the program’s progress and encourages referrals.
Item
rating:
Rate this item using a 5-point scale based on evaluating two factors:
1. How often formal and individualized recognition takes place; and
2. With whom the recognition is shared.
The highest rating is achieved by formal and individualized recognition taking place at least three times per year and recognition being shared with the parent agency and community stakeholders.
Data
collection:
Options for gathering data to rate this item include:
Reviewing documents used in recognizing student success; and
Interviewing program leader, education specialists, program participants, other practitioners, and agency administrators.

Protocol: Supported Education Fidelity Scale 48 Appendix C
Item 2: Supported Education Team/Specialist
The Supported Education Team/Specialist is designated to provide Supported Education services.
2.a. A specific portion of the team/specialists’ time is designated to carry a Supported Education caseload.
Rationale: Current research suggests that a specific portion of time spent by the team/specialists be reserved for Supported Education services as a tool to manage and prioritize consumers’ multiple service needs. Time earmarked specifically for Supported Education will help ensure that other demands do not overshadow Supported Education needs. The percentage of time allotted is determined by individual agencies and is based on the service needs of consumers in the Supported Education program. NOTE: Views differ regarding whether it is sufficient to dedicate only a portion of staff time to the provision of Supported Education services. Some experts believe that program leaders and education specialists must be full-time employees.
Item
rating:
Rate this item using a 5-point scale with two possible responses of 1 and 5 points. Base the rating on whether time is designated specifically for Supported Education services.
Data
collection:
Options for gathering data to rate this item include interviewing the program leader, education specialists, and consumers and families.
2.b. The team/specialists serve as liaison to academic institutions to address consumer and programmatic issues.
Rationale: Current research suggests that student and program success are increased when education specialists act as a liaison between the Supported Education program and academic institutions. The interwoven nature of student and programmatic issues require that collaboration efforts will address both. The outcome will be improved communication, problem-solving, and program functioning.
Item
rating:
Rate this item using a 5-point scale based on two factors:
1. Evidence that education specialists act as a liaison and collaborate with the academic institutions; and
2. Evidence that collaboration occurs that addresses both consumer and programmatic issues.
The highest rating is achieved by education specialists collaborating with academic institutions on consumer and programmatic issues.
Data
collection:
Options for gathering data to rate this item include interviewing the program leader, education specialists, consumers, and families.
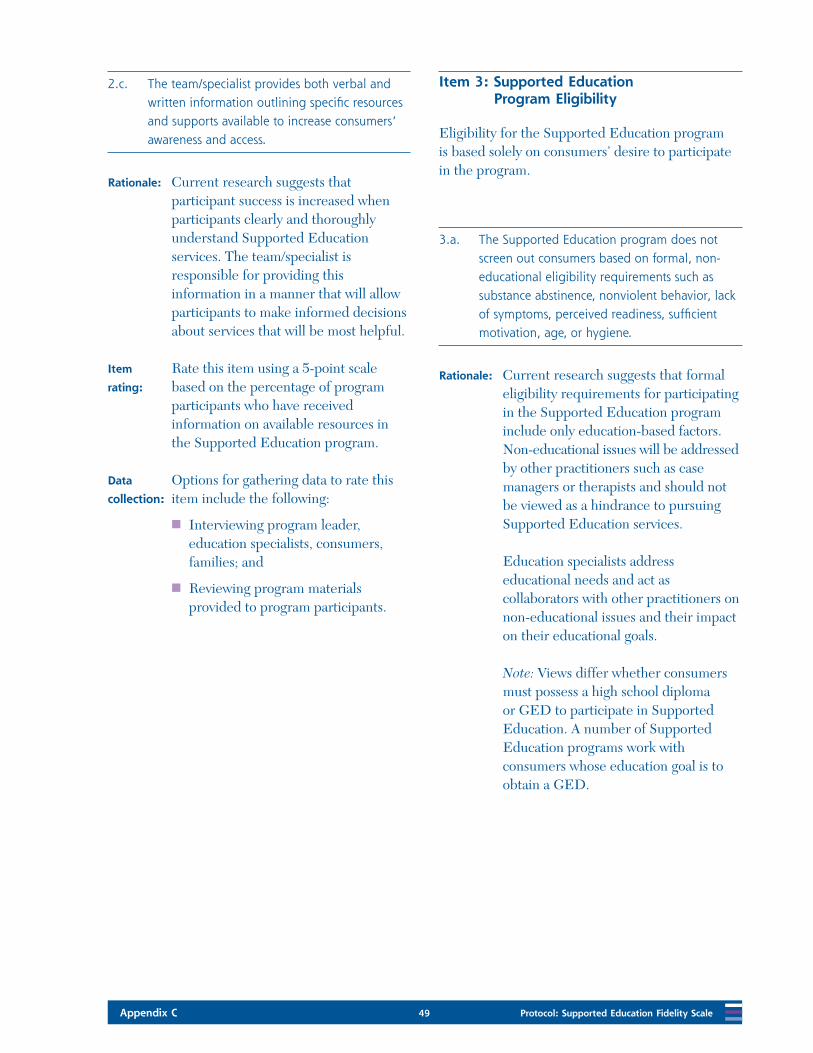
Appendix C 49 Protocol: Supported Education Fidelity Scale
2.c. The team/specialist provides both verbal and written information outlining specific resources and supports available to increase consumers’ awareness and access.
Rationale: Current research suggests that participant success is increased when participants clearly and thoroughly understand Supported Education services. The team/specialist is responsible for providing this information in a manner that will allow participants to make informed decisions about services that will be most helpful.
Item
rating:
Rate this item using a 5-point scale based on the percentage of program participants who have received information on available resources in the Supported Education program.
Data
collection:
Options for gathering data to rate this item include the following:
Interviewing program leader, education specialists, consumers, families; and
Reviewing program materials provided to program participants.
Item 3: Supported Education Program Eligibility
Eligibility for the Supported Education program is based solely on consumers’ desire to participate in the program.
3.a. The Supported Education program does not screen out consumers based on formal, non-educational eligibility requirements such as substance abstinence, nonviolent behavior, lack of symptoms, perceived readiness, sufficient motivation, age, or hygiene.
Rationale: Current research suggests that formal eligibility requirements for participating in the Supported Education program include only education-based factors. Non-educational issues will be addressed by other practitioners such as case managers or therapists and should not be viewed as a hindrance to pursuing Supported Education services.
Education specialists address educational needs and act as collaborators with other practitioners on non-educational issues and their impact on their educational goals.
Note: Views differ whether consumers must possess a high school diploma or GED to participate in Supported Education. A number of Supported Education programs work with consumers whose education goal is to obtain a GED.
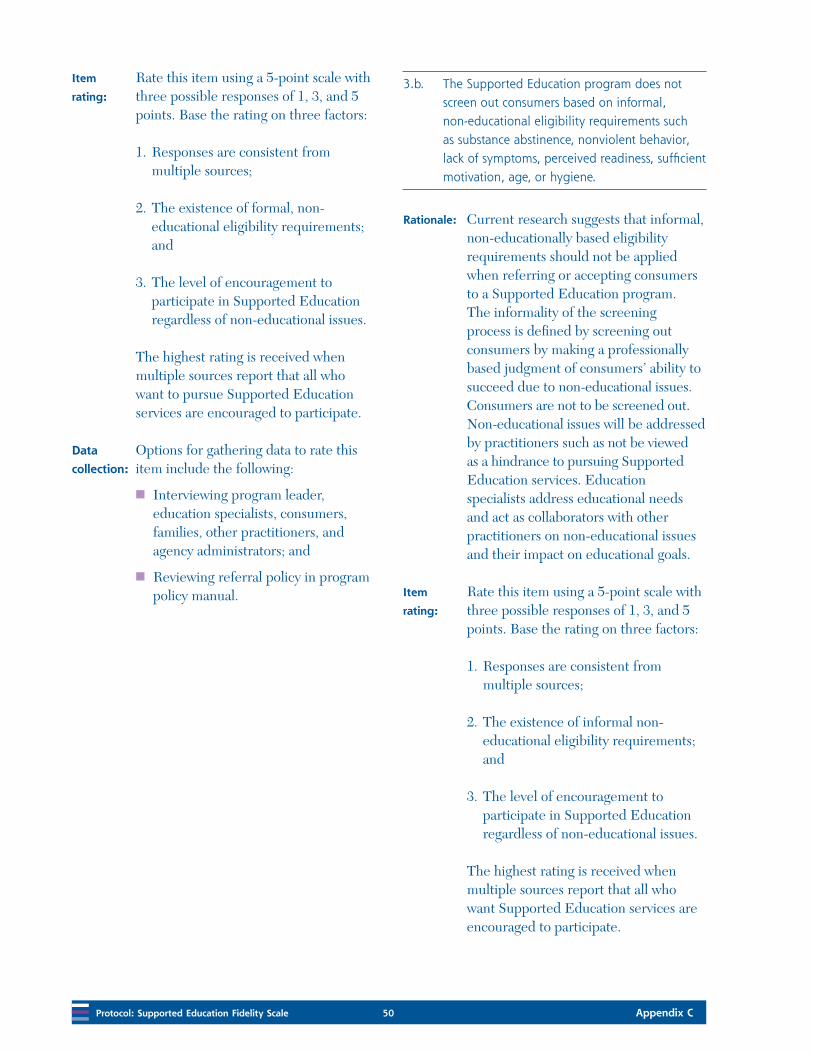
Protocol: Supported Education Fidelity Scale 50 Appendix C
Item
rating:
Rate this item using a 5-point scale with three possible responses of 1, 3, and 5 points. Base the rating on three factors:
1. Responses are consistent from multiple sources;
2. The existence of formal, non-educational eligibility requirements; and
3. The level of encouragement to participate in Supported Education regardless of non-educational issues.
The highest rating is received when multiple sources report that all who want to pursue Supported Education services are encouraged to participate.
Data
collection:
Options for gathering data to rate this item include the following:
Interviewing program leader, education specialists, consumers, families, other practitioners, and agency administrators; and
Reviewing referral policy in program policy manual.
3.b. The Supported Education program does not screen out consumers based on informal, non-educational eligibility requirements such as substance abstinence, nonviolent behavior, lack of symptoms, perceived readiness, sufficient motivation, age, or hygiene.
Rationale: Current research suggests that informal, non-educationally based eligibility requirements should not be applied when referring or accepting consumers to a Supported Education program. The informality of the screening process is defined by screening out consumers by making a professionally based judgment of consumers’ ability to succeed due to non-educational issues. Consumers are not to be screened out. Non-educational issues will be addressed by practitioners such as not be viewed as a hindrance to pursuing Supported Education services. Education specialists address educational needs and act as collaborators with other practitioners on non-educational issues and their impact on educational goals.
Item
rating:
Rate this item using a 5-point scale with three possible responses of 1, 3, and 5 points. Base the rating on three factors:
1. Responses are consistent from multiple sources;
2. The existence of informal non-educational eligibility requirements; and
3. The level of encouragement to participate in Supported Education regardless of non-educational issues.
The highest rating is received when multiple sources report that all who want Supported Education services are encouraged to participate.
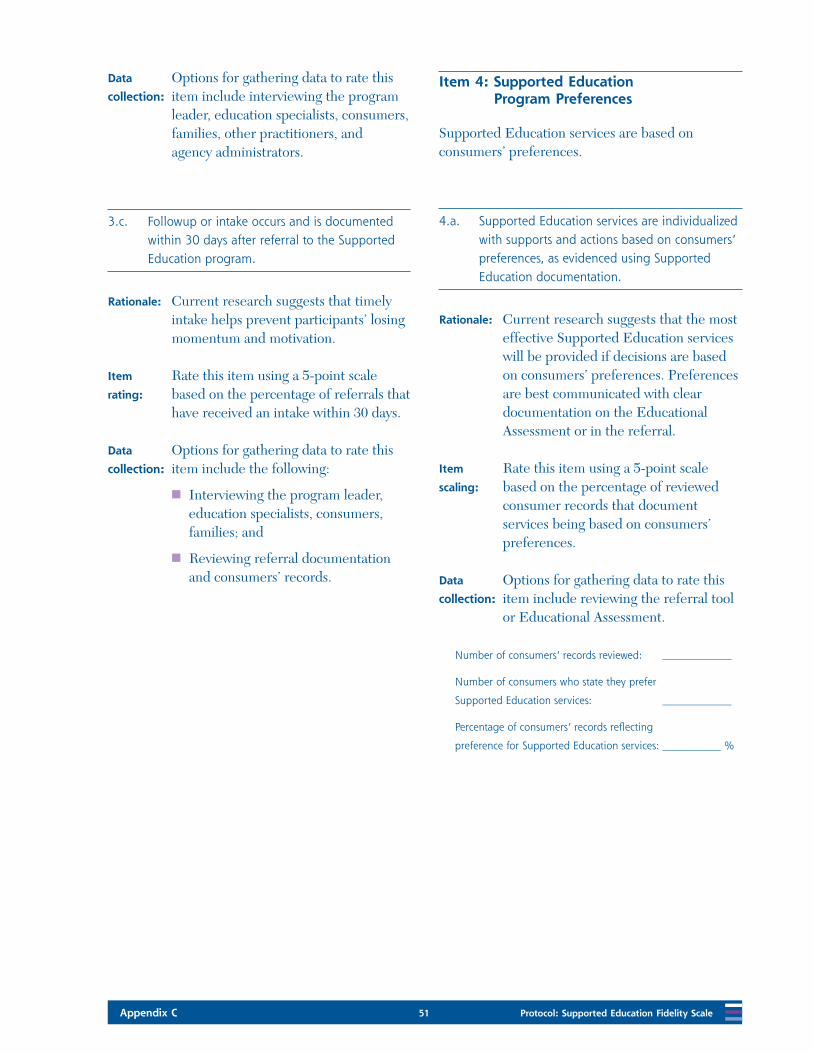
Appendix C 51 Protocol: Supported Education Fidelity Scale
Data
collection:
Options for gathering data to rate this item include interviewing the program leader, education specialists, consumers, families, other practitioners, and agency administrators.
3.c. Followup or intake occurs and is documented within 30 days after referral to the Supported Education program.
Rationale: Current research suggests that timely intake helps prevent participants’ losing momentum and motivation.
Item
rating:
Rate this item using a 5-point scale based on the percentage of referrals that have received an intake within 30 days.
Data
collection:
Options for gathering data to rate this item include the following:
Interviewing the program leader, education specialists, consumers, families; and
Reviewing referral documentation and consumers’ records.
Item 4: Supported Education Program Preferences
Supported Education services are based on consumers’ preferences.
4.a. Supported Education services are individualized with supports and actions based on consumers’ preferences, as evidenced using Supported Education documentation.
Rationale: Current research suggests that the most effective Supported Education services will be provided if decisions are based on consumers’ preferences. Preferences are best communicated with clear documentation on the Educational Assessment or in the referral.
Item
scaling:
Rate this item using a 5-point scale based on the percentage of reviewed consumer records that document services being based on consumers’ preferences.
Data
collection:
Options for gathering data to rate this item include reviewing the referral tool or Educational Assessment.
Number of consumers’ records reviewed: _____________
Number of consumers who state they prefer
Supported Education services: _____________
Percentage of consumers’ records reflecting
preference for Supported Education services: ___________ %
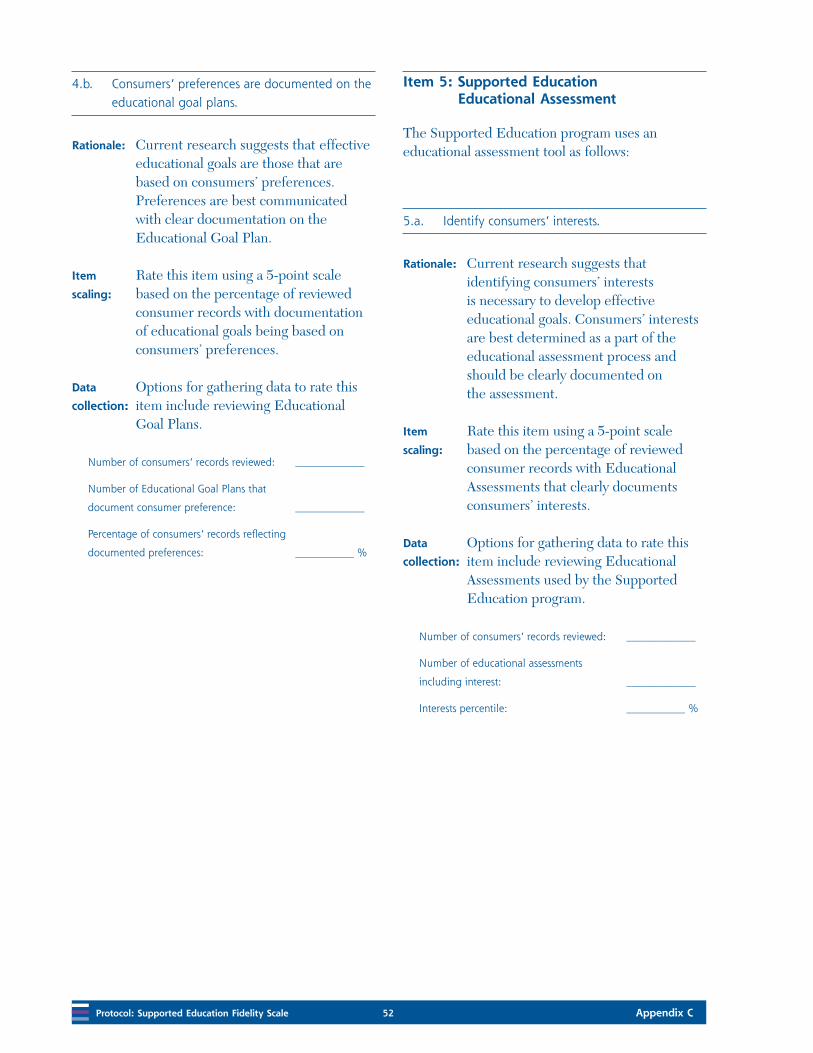
Protocol: Supported Education Fidelity Scale 52 Appendix C
4.b. Consumers’ preferences are documented on the educational goal plans.
Rationale: Current research suggests that effective educational goals are those that are based on consumers’ preferences. Preferences are best communicated with clear documentation on the Educational Goal Plan.
Item
scaling:
Rate this item using a 5-point scale based on the percentage of reviewed consumer records with documentation of educational goals being based on consumers’ preferences.
Data
collection:
Options for gathering data to rate this item include reviewing Educational Goal Plans.
Number of consumers’ records reviewed: _____________
Number of Educational Goal Plans that
document consumer preference: _____________
Percentage of consumers’ records reflecting
documented preferences: ___________ %
Item 5: Supported Education Educational Assessment
The Supported Education program uses an educational assessment tool as follows:
5.a. Identify consumers’ interests.
Rationale: Current research suggests that identifying consumers’ interests is necessary to develop effective educational goals. Consumers’ interests are best determined as a part of the educational assessment process and should be clearly documented on the assessment.
Item
scaling:
Rate this item using a 5-point scale based on the percentage of reviewed consumer records with Educational Assessments that clearly documents consumers’ interests.
Data
collection:
Options for gathering data to rate this item include reviewing Educational Assessments used by the Supported Education program.
Number of consumers’ records reviewed: _____________
Number of educational assessments
including interest: _____________
Interests percentile: ___________ %
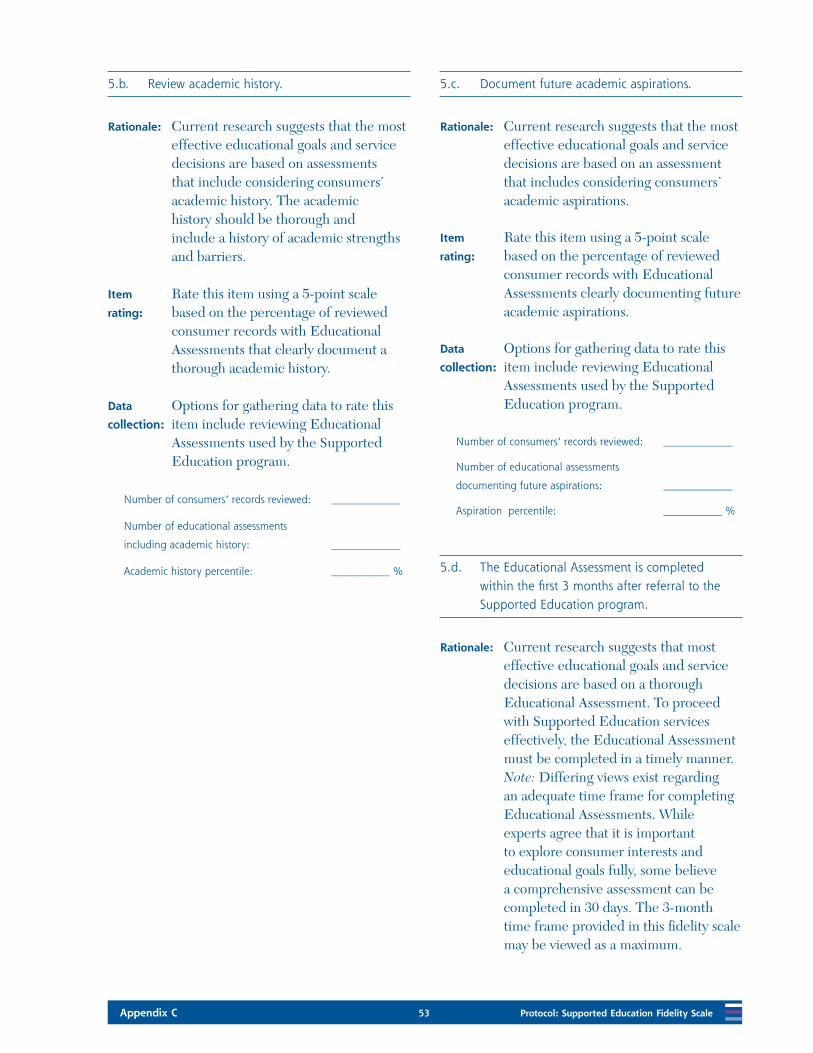
Appendix C 53 Protocol: Supported Education Fidelity Scale
5.b. Review academic history.
Rationale: Current research suggests that the most effective educational goals and service decisions are based on assessments that include considering consumers’ academic history. The academic history should be thorough and include a history of academic strengths and barriers.
Item
rating:
Rate this item using a 5-point scale based on the percentage of reviewed consumer records with Educational Assessments that clearly document a thorough academic history.
Data
collection:
Options for gathering data to rate this item include reviewing Educational Assessments used by the Supported Education program.
Number of consumers’ records reviewed: _____________
Number of educational assessments
including academic history: _____________
Academic history percentile: ___________ %
5.c. Document future academic aspirations.
Rationale: Current research suggests that the most effective educational goals and service decisions are based on an assessment that includes considering consumers’ academic aspirations.
Item
rating:
Rate this item using a 5-point scale based on the percentage of reviewed consumer records with Educational Assessments clearly documenting future academic aspirations.
Data
collection:
Options for gathering data to rate this item include reviewing Educational Assessments used by the Supported Education program.
Number of consumers’ records reviewed: _____________
Number of educational assessments
documenting future aspirations: _____________
Aspiration percentile: ___________ %
5.d. The Educational Assessment is completed within the first 3 months after referral to the Supported Education program.
Rationale: Current research suggests that most effective educational goals and service decisions are based on a thorough Educational Assessment. To proceed with Supported Education services effectively, the Educational Assessment must be completed in a timely manner. Note: Differing views exist regarding an adequate time frame for completing Educational Assessments. While experts agree that it is important to explore consumer interests and educational goals fully, some believe a comprehensive assessment can be completed in 30 days. The 3-month time frame provided in this fidelity scale may be viewed as a maximum.

Protocol: Supported Education Fidelity Scale 54 Appendix C
Item
rating:
Rate this item using a 5-point scale based on the percentage of reviewed consumer records with Educational Assessments that were completed within 3 months after referral to the Supported Education program.
Data
collection:
Options for gathering data to rate this item include reviewing Educational Assessments used by the Supported Education program.
Number of consumers’ records reviewed: _____________
Number of educational assessments completed
during 1st quarter of enrollment: _____________
Percentage of completion: ___________ %
5.e. Evidence exists that that the Educational Assessment is current for each academic period.
Rationale: Current research suggests that the Educational Assessment be updated each academic period to ensure that goal and service planning are based on the most relevant and current information.
Item
rating:
Rate this item using a 5-point scale based on the percentage of reviewed consumer records with Educational Assessments that have been updated every academic period.
Data
collection:
Options for gathering data to rate this item include reviewing Educational Assessments used by the Supported Education program.
Number of consumers’ records reviewed: _____________
Number of educational assessments completed
and current from previous quarter: _____________
Percentage of completion: ___________ %
5.f. Evidence exists that possible barriers or challenges for educational participation have been documented on the Educational Assessment.
Rationale: Current research suggests that the highest educational outcomes are achieved when educational barriers or challenges can be clearly identified and then addressed.
Item
rating:
Rate this item using a 5-point scale based on the percentage of reviewed consumer records with Educational Assessments that document possible barriers or challenges for educational participation.
Data
collection:
Options for gathering data to rate this item include reviewing Educational Assessments used by the Supported Education program.
Number of consumers’ records reviewed: _____________
Number of educational assessments documenting
barriers or challenges for education: _____________
Percentage of completion: ___________ %
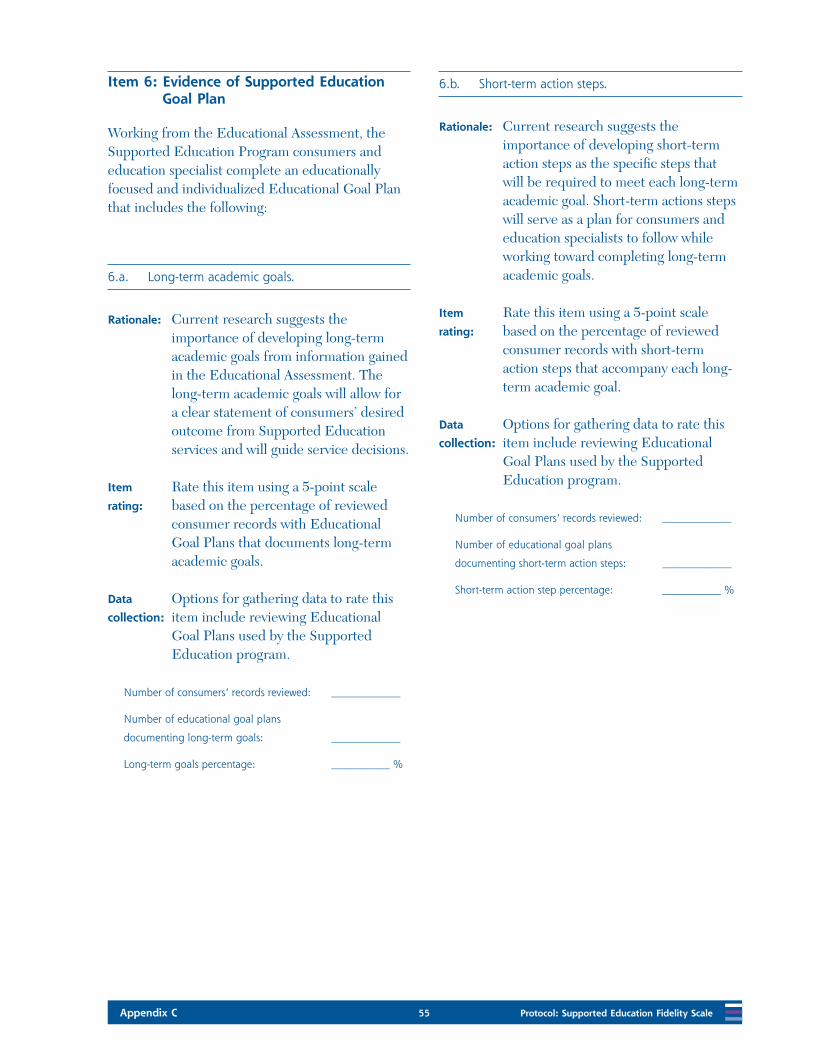
Appendix C 55 Protocol: Supported Education Fidelity Scale
Item 6: Evidence of Supported Education Goal Plan
Working from the Educational Assessment, the Supported Education Program consumers and education specialist complete an educationally focused and individualized Educational Goal Plan that includes the following:
6.a. Long-term academic goals.
Rationale: Current research suggests the importance of developing long-term academic goals from information gained in the Educational Assessment. The long-term academic goals will allow for a clear statement of consumers’ desired outcome from Supported Education services and will guide service decisions.
Item
rating:
Rate this item using a 5-point scale based on the percentage of reviewed consumer records with Educational Goal Plans that documents long-term academic goals.
Data
collection:
Options for gathering data to rate this item include reviewing Educational Goal Plans used by the Supported Education program.
Number of consumers’ records reviewed: _____________
Number of educational goal plans
documenting long-term goals: _____________
Long-term goals percentage: ___________ %
6.b. Short-term action steps.
Rationale: Current research suggests the importance of developing short-term action steps as the specific steps that will be required to meet each long-term academic goal. Short-term actions steps will serve as a plan for consumers and education specialists to follow while working toward completing long-term academic goals.
Item
rating:
Rate this item using a 5-point scale based on the percentage of reviewed consumer records with short-term action steps that accompany each long-term academic goal.
Data
collection:
Options for gathering data to rate this item include reviewing Educational Goal Plans used by the Supported Education program.
Number of consumers’ records reviewed: _____________
Number of educational goal plans
documenting short-term action steps: _____________
Short-term action step percentage: ___________ %

Protocol: Supported Education Fidelity Scale 56 Appendix C
6.c. Specific dates for completing each action step.
Rationale: Current research suggests that specific dates for completing action steps provides structure that helps organize service efforts and contributes to successfully completing action steps.
Item
rating:
Rate this item using a 5-point scale based on the percentage of reviewed consumer records with specific dates for completing short-term action steps.
Data
collection:
Options for gathering data to rate this item include reviewing Educational Goal Plans used by the Supported Education program.
Number of consumers’ records reviewed: _____________
Number of educational goal plans
documenting action steps completion date: _____________
Action step completion date percentage: ___________ %
6.d. Responsibilities.
Rationale: Current research suggests that the responsibilities of consumers and education specialists for completing the tasks required for short-term action steps be clearly documented. The responsibilities are assigned collaboratively between consumers and education specialists.
Item
rating:
Rate this item using a 5-point scale based on the percentage of reviewed consumer records with clearly assigned responsibilities for tasks required to complete short-term action steps.
Data
collection:
Options for gathering data to rate this item include reviewing Educational Goal Plans used by the Supported Education program.
Number of consumers’ records reviewed: _____________
Number of educational goal plans
documenting responsibilities: _____________
Responsibilities percentage ___________ %
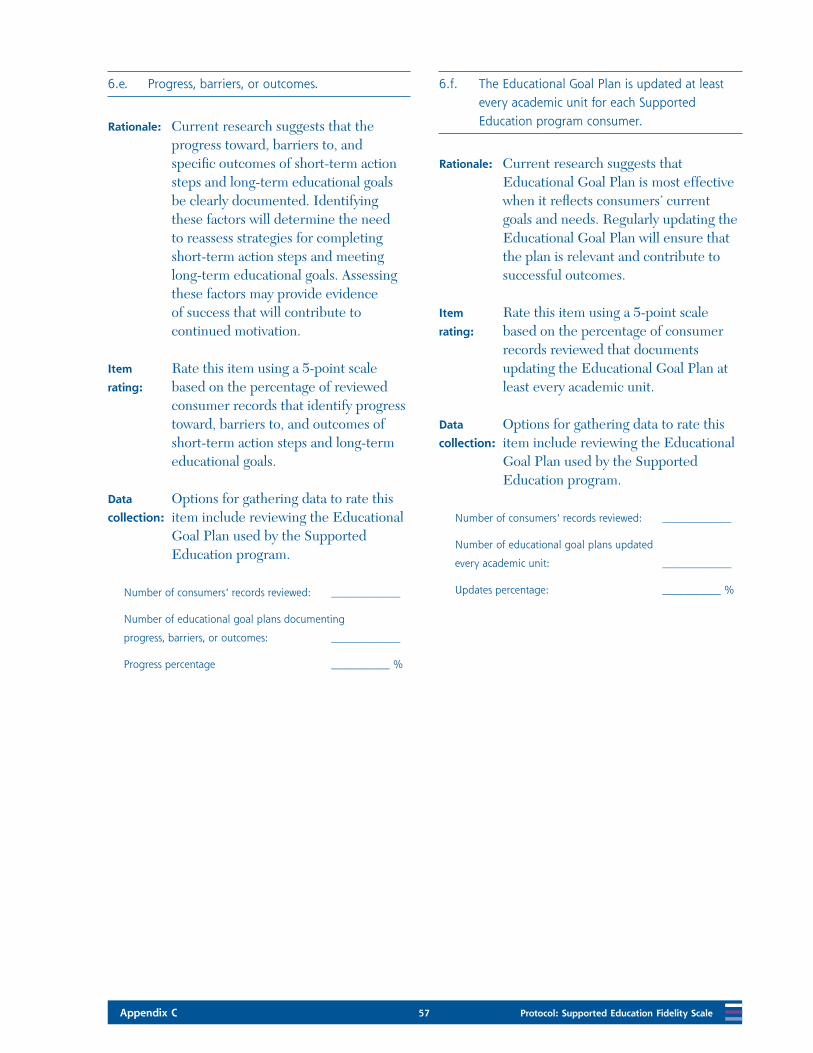
Appendix C 57 Protocol: Supported Education Fidelity Scale
6.e. Progress, barriers, or outcomes.
Rationale: Current research suggests that the progress toward, barriers to, and specific outcomes of short-term action steps and long-term educational goals be clearly documented. Identifying these factors will determine the need to reassess strategies for completing short-term action steps and meeting long-term educational goals. Assessing these factors may provide evidence of success that will contribute to continued motivation.
Item
rating:
Rate this item using a 5-point scale based on the percentage of reviewed consumer records that identify progress toward, barriers to, and outcomes of short-term action steps and long-term educational goals.
Data
collection:
Options for gathering data to rate this item include reviewing the Educational Goal Plan used by the Supported Education program.
Number of consumers’ records reviewed: _____________
Number of educational goal plans documenting
progress, barriers, or outcomes: _____________
Progress percentage ___________ %
6.f. The Educational Goal Plan is updated at least every academic unit for each Supported Education program consumer.
Rationale: Current research suggests that Educational Goal Plan is most effective when it reflects consumers’ current goals and needs. Regularly updating the Educational Goal Plan will ensure that the plan is relevant and contribute to successful outcomes.
Item
rating:
Rate this item using a 5-point scale based on the percentage of consumer records reviewed that documents updating the Educational Goal Plan at least every academic unit.
Data
collection:
Options for gathering data to rate this item include reviewing the Educational Goal Plan used by the Supported Education program.
Number of consumers’ records reviewed: _____________
Number of educational goal plans updated
every academic unit: _____________
Updates percentage: ___________ %
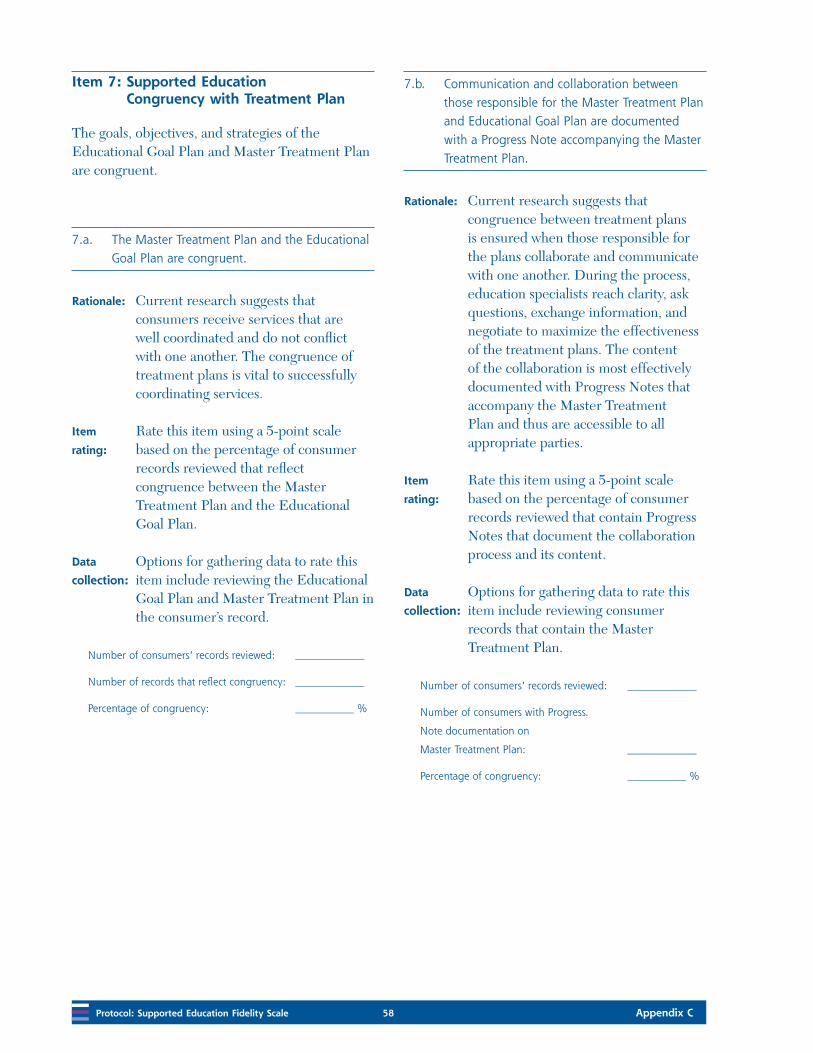
Protocol: Supported Education Fidelity Scale 58 Appendix C
Item 7: Supported Education Congruency with Treatment Plan
The goals, objectives, and strategies of the Educational Goal Plan and Master Treatment Plan are congruent.
7.a. The Master Treatment Plan and the Educational Goal Plan are congruent.
Rationale: Current research suggests that consumers receive services that are well coordinated and do not conflict with one another. The congruence of treatment plans is vital to successfully coordinating services.
Item
rating:
Rate this item using a 5-point scale based on the percentage of consumer records reviewed that reflect congruence between the Master Treatment Plan and the Educational Goal Plan.
Data
collection:
Options for gathering data to rate this item include reviewing the Educational Goal Plan and Master Treatment Plan in the consumer’s record.
Number of consumers’ records reviewed: _____________
Number of records that reflect congruency: _____________
Percentage of congruency: ___________ %
7.b. Communication and collaboration between those responsible for the Master Treatment Plan and Educational Goal Plan are documented with a Progress Note accompanying the Master Treatment Plan.
Rationale: Current research suggests that congruence between treatment plans is ensured when those responsible for the plans collaborate and communicate with one another. During the process, education specialists reach clarity, ask questions, exchange information, and negotiate to maximize the effectiveness of the treatment plans. The content of the collaboration is most effectively documented with Progress Notes that accompany the Master Treatment Plan and thus are accessible to all appropriate parties.
Item
rating:
Rate this item using a 5-point scale based on the percentage of consumer records reviewed that contain Progress Notes that document the collaboration process and its content.
Data
collection:
Options for gathering data to rate this item include reviewing consumer records that contain the Master Treatment Plan.
Number of consumers’ records reviewed: _____________
Number of consumers with Progress.
Note documentation on
Master Treatment Plan: _____________
Percentage of congruency: ___________ %
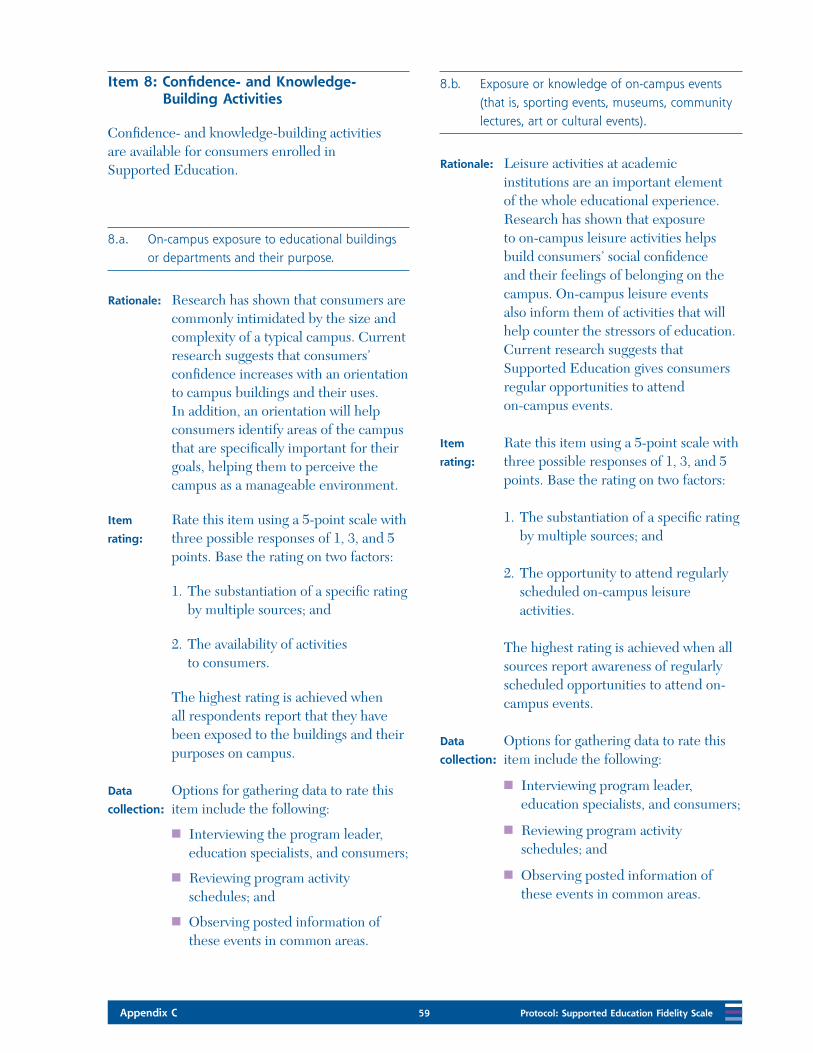
Appendix C 59 Protocol: Supported Education Fidelity Scale
Item 8: Confidence- and Knowledge- Building Activities
Confidence- and knowledge-building activities are available for consumers enrolled in Supported Education.
8.a. On-campus exposure to educational buildings or departments and their purpose.
Rationale: Research has shown that consumers are commonly intimidated by the size and complexity of a typical campus. Current research suggests that consumers’ confidence increases with an orientation to campus buildings and their uses. In addition, an orientation will help consumers identify areas of the campus that are specifically important for their goals, helping them to perceive the campus as a manageable environment.
Item
rating:
Rate this item using a 5-point scale with three possible responses of 1, 3, and 5 points. Base the rating on two factors:
1. The substantiation of a specific rating by multiple sources; and
2. The availability of activities to consumers.
The highest rating is achieved when all respondents report that they have been exposed to the buildings and their purposes on campus.
Data
collection:
Options for gathering data to rate this item include the following:
Interviewing the program leader, education specialists, and consumers;
Reviewing program activity schedules; and
Observing posted information of these events in common areas.
8.b. Exposure or knowledge of on-campus events (that is, sporting events, museums, community lectures, art or cultural events).
Rationale: Leisure activities at academic institutions are an important element of the whole educational experience. Research has shown that exposure to on-campus leisure activities helps build consumers’ social confidence and their feelings of belonging on the campus. On-campus leisure events also inform them of activities that will help counter the stressors of education. Current research suggests that Supported Education gives consumers regular opportunities to attend on-campus events.
Item
rating:
Rate this item using a 5-point scale with three possible responses of 1, 3, and 5 points. Base the rating on two factors:
1. The substantiation of a specific rating by multiple sources; and
2. The opportunity to attend regularly scheduled on-campus leisure activities.
The highest rating is achieved when all sources report awareness of regularly scheduled opportunities to attend on-campus events.
Data
collection:
Options for gathering data to rate this item include the following:
Interviewing program leader, education specialists, and consumers;
Reviewing program activity schedules; and
Observing posted information of these events in common areas.
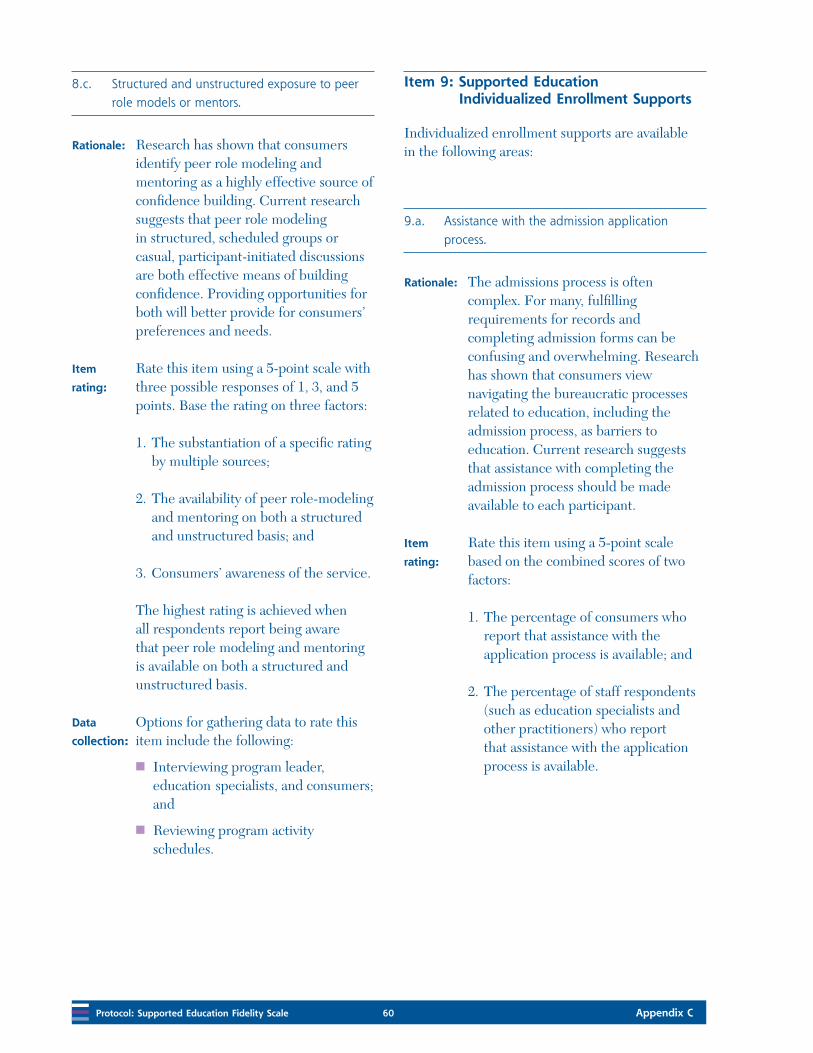
Protocol: Supported Education Fidelity Scale 60 Appendix C
8.c. Structured and unstructured exposure to peer role models or mentors.
Rationale: Research has shown that consumers identify peer role modeling and mentoring as a highly effective source of confidence building. Current research suggests that peer role modeling in structured, scheduled groups or casual, participant-initiated discussions are both effective means of building confidence. Providing opportunities for both will better provide for consumers’ preferences and needs.
Item
rating:
Rate this item using a 5-point scale with three possible responses of 1, 3, and 5 points. Base the rating on three factors:
1. The substantiation of a specific rating by multiple sources;
2. The availability of peer role-modeling and mentoring on both a structured and unstructured basis; and
3. Consumers’ awareness of the service.
The highest rating is achieved when all respondents report being aware that peer role modeling and mentoring is available on both a structured and unstructured basis.
Data
collection:
Options for gathering data to rate this item include the following:
Interviewing program leader, education specialists, and consumers; and
Reviewing program activity schedules.
Item 9: Supported Education Individualized Enrollment Supports
Individualized enrollment supports are available in the following areas:
9.a. Assistance with the admission application process.
Rationale: The admissions process is often complex. For many, fulfilling requirements for records and completing admission forms can be confusing and overwhelming. Research has shown that consumers view navigating the bureaucratic processes related to education, including the admission process, as barriers to education. Current research suggests that assistance with completing the admission process should be made available to each participant.
Item
rating:
Rate this item using a 5-point scale based on the combined scores of two factors:
1. The percentage of consumers who report that assistance with the application process is available; and
2. The percentage of staff respondents (such as education specialists and other practitioners) who report that assistance with the application process is available.
Appendix C 61 Protocol: Supported Education Fidelity Scale
Due to consumers’ differing needs, the item rating is based on the availability of the service as opposed to actual use. Both consumers and staff are considered in scoring to ensure that the overall rating reflects both groups’ perceptions of availability. If differences in perception related to the availability of the service exist, then it is vital that those differences be identified and analyzed to ensure that consumers’ needs are being met.
Data
collection:
Options for gathering data to rate this item include interviewing the program leader, education specialists, and consumers.
Participant + staff score = item score 2
9.b. Accompaniment to the educational institution.
Rationale: Completing some tasks for enrollment requires that consumers be present at the institution. Consumers may prefer to be accompanied by the education specialist for support and assistance with completing tasks. Accompaniment by the education specialist is intended to be an opportunity for consumers to gain confidence and skills that will enable their independent action in the future.
Item
rating:
Rate this item using a 5-point scale based on the combined scores of two factors:
1. The percentage of consumers who report that education specialists are available to accompany them to the educational institution; and
2. The percentage of staff respondents (such as education specialist and other practitioners) who report that education specialists are available to accompany consumers to educational institutions.
Due to consumers’ differing needs, the item rating is based on the availability of the service as opposed to actual use. Both consumers and staff are considered in scoring to ensure that the overall rating reflects the perceptions of availability of both groups. If differences in perception related to the availability of the service exist, then it is vital that those differences be identified and analyzed to ensure that consumers’ needs are being met.
Data
collection:
Options for gathering data to rate this item include interviewing the program leader, education specialists, and consumers.
Participant + staff score = item score 2
9.c. Assistance in securing financial aid.
Rationale: Securing financial resources for education is a complex and arduous process. Research has reported that consumers have identified assistance in securing financial aid as a primary area in which they require assistance. Assistance by the education specialist should be in collaboration with the Office of Student Financial Aid in the institution and is intended to be an opportunity for consumers to gain confidence and skills that will enable their independent action in the future.
Protocol: Supported Education Fidelity Scale 62 Appendix C
Item
rating:
Rate this item using a 5-point scale based on the combined scores of two factors:
1. The percentage of consumers who report that education specialists are available to help secure financial aid; and
2. The percentage of staff respondents (education specialists and other practitioners) who report that education specialists are available to help secure financial aid.
Due to consumers’ differing needs, the item rating is based on the availability of the service as opposed to actual use. Both consumers and staff are considered in scoring to ensure that the overall rating reflects the perceptions of availability of both groups. If differences in perception related to the availability of the service exist, then it is vital that those differences be identified and analyzed to ensure that consumes’ needs are being met.
Data
collection:
Options for gathering data to rate this item include interviewing the program leader, education specialists, and consumers.
Participant + staff score = item score 2
9.d. Securing academic resources (that is, textbooks and supplies).
Rationale: Identifying and obtaining academic supplies is a potentially confusing and overwhelming process, particularly if financial assistance is needed. Helping consumers identify needed supplies and obtain financial resources should be available. Assistance by education specialists is intended to be an opportunity for consumers to gain confidence and skills that will enable their independent action in the future.
Item
rating:
Rate this item using a 5-point scale based on the combined scores of two factors:
1. The percentage of consumers who report that education specialists are available to help secure academic resources; and
2. The percentage of staff respondents (education specialists and other practitioners) who report that education specialists are available to help secure academic resources.
Due to consumers’ differing needs, the item rating is based on the availability of the service as opposed to actual use. Both consumers and staff are considered in scoring to ensure that the overall rating reflects the perceptions of availability of both groups. If differences in perception related to the availability of the service exist, then it is vital that those differences be identified and analyzed to ensure that consumes’ needs are being met.
Appendix C 63 Protocol: Supported Education Fidelity Scale
Data
collection:
Options for gathering data to rate this item include interviewing with program leader, education specialists, and consumers.
Participant + staff score = item score 2
9.e. Determination of course schedule and degree requirements.
Rationale: Consumers must be on an appropriate academic trajectory to fulfill their educational goals. Degree requirements and the availability of courses that meet those requirements will determine the appropriate trajectory. For consumers to decide on the courses in which they wish to enroll during an academic unit, they must appropriately understand their academic trajectory. Consumers should have available help in setting a course that will fulfill their educational goals. Assistance provided by education specialists should be in full collaboration with a formal academic adviser.
Item
rating:
Rate this item using a 5-point scale based on the combined scores of two factors:
1. The percentage of consumers who report that education specialists are available to help determine course schedules and degree requirements; and
2. The percentage of staff respondents (such as education specialists and other practitioners) who report that education specialists are available to help determine course schedules and degree requirements.
Due to consumers’ differing needs, the item rating is based on the availability of the service as opposed to actual use. Both consumers and staff are considered in scoring to ensure that the overall rating reflects the perceptions of availability of both groups. If differences in perception related to the availability of the service exist, then it is vital that those differences be identified and analyzed to ensure that consumers’ needs are being met.
Data
collection:
Options for gathering data to rate this item include interviewing the program leader, education specialists, and consumers.
Participant + staff score = item score 2
9.f. Introductions to useful campus personnel (advisors, Disability Services, library, etc.).
Rationale: Successfully completing educational goals requires that consumers are aware of and able to use campus resources. Current research suggests that the probability of using those resources increases when consumers have a relationship with those who provide those services. Consumers may prefer that the education specialist help initiate these relationships by introducing personnel with whom consumers will be working.
Protocol: Supported Education Fidelity Scale 64 Appendix C
Item
rating:
Rate this item using a 5-point scale based on the combined scores of two factors:
1. The percentage of consumers who report that education specialists introduce them to useful campus personnel; and
2. The percentage of staff respondents (such as education specialists and other practitioners) who report that education specialists introduce consumers to useful campus personnel.
Due to consumers’ differing needs, the item rating is based on the availability of the service as opposed to actual use. Both consumers and staff are considered in scoring to ensure that the overall rating reflects the perceptions of availability of both groups. If differences in perception related to the availability of the service exist, then it is vital that those differences be identified and analyzed to ensure that consumers’ needs are being met.
Data
collection:
Options for gathering data to rate this item include interviewing the program leader, education specialists, and consumers.
Participant + staff score = item score 2
Item 10: Supported Education Supports and Resources for Students Enrolled in Academic Institutions
Individualized educational supports are available in the following areas:
10.a. Tutoring (for example, campus tutors, campus tutoring labs, peer tutors).
Rationale: Consumers commonly use tutoring services to address the need for additional help in mathematics, writing, and science. Current research suggests that consumers in Supported Education are familiar with all tutoring services available through the institution or in the Supported Education program. Ideally, tutoring services at the institution will be used to normalize the experience and integrate consumers into the campus environment.
Item
rating:
Rate this item using a 5-point scale based on the combined scores of two factors:
1. The percentage of consumers who report that tutoring services are available; and
2. The percentage of staff respondents (such as education specialist and other practitioners) who report that tutoring services are available.
Appendix C 65 Protocol: Supported Education Fidelity Scale
Due to consumers’ differing needs, the item rating is based on the availability of the service as opposed to actual use. Both consumers and staff are considered in scoring to ensure that the overall rating reflects the perceptions of availability of both groups. If differences in perception related to the availability of the service exist, then it is vital that those differences be identified and analyzed to ensure that participant needs are being met.
Data
collection:
Options for gathering data to rate this item include interviewing the program leader, education specialists, and consumers.
Participant + staff score = item score 2
10.b. Academic accommodations (such as extended time for testing, note-takers, drinks in the classroom).
Rationale: The Americans with Disabilities Act (ADA) requires that postsecondary institutions provide accommodations to students with disabilities, including psychiatric disabilities. Services provided by Office of Services for Students with Disabilities or Disability Services are intended to offset disability-based barriers without altering the essential components of the class or curriculum. Current research suggests that consumers should be familiar with the institutions’ Disability Services and related services to address any need for accommodation.
Item
rating:
Rate this item using a 5-point scale obased on the combined scores of two factors:
1. The percentage of consumers who report that academic accommodations are available; and
2. The percentage of staff respondents (such as education specialists and other practitioners) who report that academic accommodations are available.
Due to consumers’ differing needs, the item rating is based on the availability of the service as opposed to actual use. Both consumers and staff are considered in scoring to ensure that the overall rating reflects the perceptions of availability of both groups. If differences in perception related to the availability of the service exist, then it is vital that those differences be identified and analyzed to ensure that participant needs are being met.
Data
collection:
Options for gathering data to rate this item include interviewing program leader, education specialists, and consumers.
Participant + staff score = item score 2
Protocol: Supported Education Fidelity Scale 66 Appendix C
10.c. Liaison with school or other agencies for special accommodations
Rationale: Periodically, circumstances beyond consumers’ control may require that a request be made for special accommodations other than those found under the Americans with Disabilities Act (ADA). For example, asking to audit class while financial aid is being processed, negotiating a reduction in credit hours taken per semester with vocational rehabilitation, or requesting that the procedures of the educational institution or service agency be modified to accommodate consumers’ needs. Typically, such a request requires education specialists to serve as a liaison or advocate on consumers’ behalf. Current research suggests that an education specialist should be available to consumers to help in liaison or advocacy functions with the institution or service agency. The intent is to provide this service in a manner that will educate consumers to act as their own advocate in the future.
Item
rating:
Rate this item using a 5-point scale based on the combined scores of two factors:
1. The percentage of consumers who report that advocacy or liaison services are available; and
2. The percentage of staff respondents (such as education specialists and other practitioners) who report that advocacy or liaison services are available.
Due to consumers’ differing needs, the item rating is based on the availability of the service as opposed to actual use. Both consumers and staff are considered in scoring to ensure that the overall rating reflects the perceptions of availability of both groups. If differences in perception related to the availability of the service exist, then it is vital that those differences be identified and analyzed to ensure that consumers’ needs are being met.
Data
collection:
Options for gathering data to rate this item include interviewing the program leader, education specialists, and consumers.
Participant + staff score = item score 2
10.d. Peer support (such as students in same class, other consumers in college, educational support groups at the mental health agency).
Rationale: Research has shown that consumers identify peer support as the most effective means of support for managing the stressors of education. Current research suggests that effective peer support may be provided in regularly scheduled groups or casual, participant-initiated discussions. Providing opportunities for both will better provide for consumers’ preferences and needs. Ideally, consumers will take the utmost leadership in providing peer support services.
Appendix C 67 Protocol: Supported Education Fidelity Scale
Item
rating:
Rate this item using a 5-point scale based on the combined scores of two factors:
1. The percentage of consumers who report that peer support services are available; and
2. The percentage of staff respondents (such as education specialists and other practitioners) who report that peer support services are available.
Due to consumers’ differing needs, the item rating is based on the availability of the service as opposed to actual use. Both consumers and staff are considered in scoring to ensure that the overall rating reflects the perceptions of availability of both groups. If differences in perception related to the availability of the service exist, then it is vital that those differences be identified and analyzed to ensure that consumers’ needs are being met.
Data
collection:
Options for gathering data to rate this item include interviewing the program leader, education specialists, and consumers.
Participant + staff score = item score 2
10.e. Ongoing assistance with financial aid.
Rationale: Research has reported that consumers have identified help in securing financial aid as a primary area in which they require help. Securing financial resources for education is an ongoing process that requires completing complex procedures at least annually. To meet these needs, current research suggests that education specialists be available to help with financial aid matters on an ongoing basis. Help by education specialists should be in collaboration with the institution’s Office of Student Financial Aid and is intended to be an opportunity for consumers to gain confidence and skills that will enable their independent action in the future.
Item
rating:
Rate this item using a 5-point scale based on the combined scores of two factors:
1. The percentage of consumers who report that ongoing assistance with financial aid is available; and
2. The percentage of staff respondents (such as education specialists and other practitioners) who report that ongoing assistance with financial aid is available.
Due to consumers’ differing needs, the item rating is based on the availability of the service as opposed to actual use. Both consumers and staff are considered in scoring to ensure that the overall rating reflects the perceptions of availability of both groups. If differences in perception related to the availability of the service exist, then it is vital that those differences be identified and analyzed to ensure that consumers’ needs are being met.
Protocol: Supported Education Fidelity Scale 68 Appendix C
Data
collection:
Options for gathering data to rate this item include interviewing the program leader, education specialists, and consumers.
Participant + staff score = item score 2
10.f. Mobile support services for immediate support.
Rationale: Research has shown that consumers’ immediate, symptom- or anxiety-related issues are best addressed with mobile support services. Mobile support services require that consumers have immediate contact with the education specialist by phone or in person on the campus. Where the services are provided is based on consumers’ preferences and needs.
Item
rating:
Rate this item using a 5-point scale based on the combined scores of two factors:
1. The percentage of consumers who report that mobile support services are available; and
2. The percentage of staff respondents (such as education specialists and other practitioners) who report that mobile support services are available.
Due to consumers’ differing needs, the item rating is based on the availability of the service as opposed to actual use. Both consumers and staff are considered in scoring to ensure that the overall rating reflects the perceptions of availability of both groups. If differences in perception related to the availability of the service exist, then it is vital that those differences be identified and analyzed to ensure that consumers’ needs are being met.
Data
collection:
Options for gathering data to rate this item include interviewing program leader, education specialists, and consumers.
Participant + staff score = item score 2
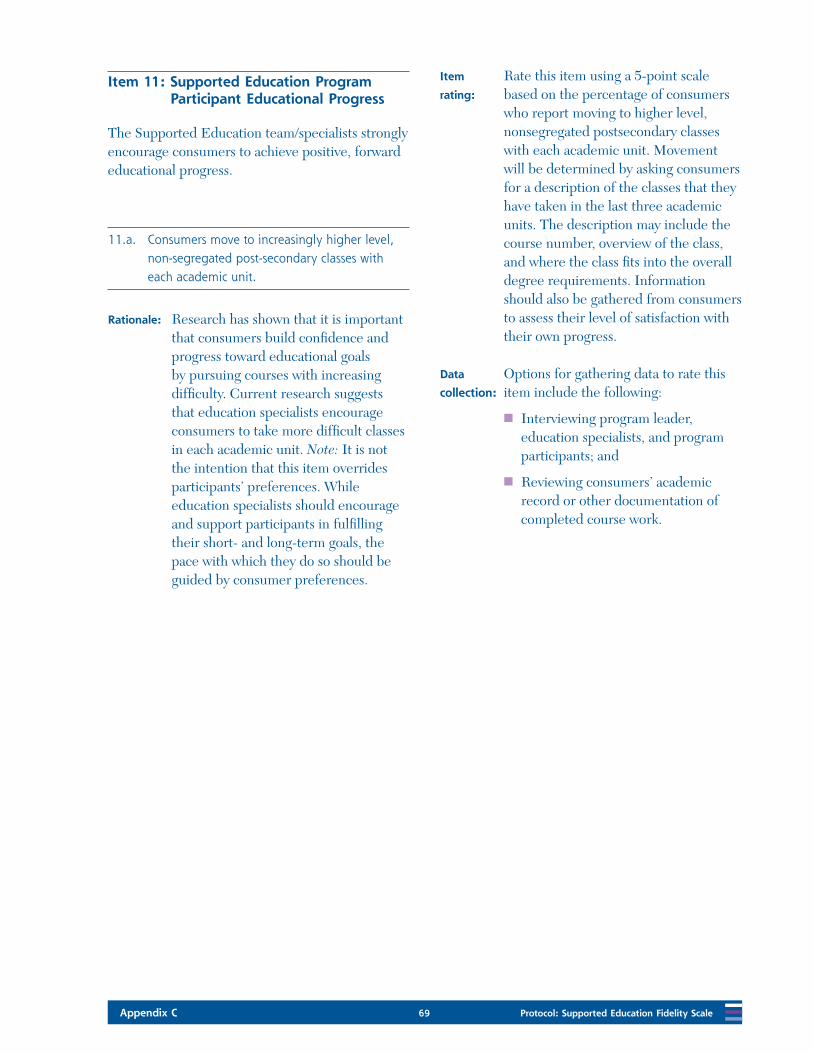
Appendix C 69 Protocol: Supported Education Fidelity Scale
Item 11: Supported Education Program Participant Educational Progress
The Supported Education team/specialists strongly encourage consumers to achieve positive, forward educational progress.
11.a. Consumers move to increasingly higher level, non-segregated post-secondary classes with each academic unit.
Rationale: Research has shown that it is important that consumers build confidence and progress toward educational goals by pursuing courses with increasing difficulty. Current research suggests that education specialists encourage consumers to take more difficult classes in each academic unit. Note: It is not the intention that this item overrides participants’ preferences. While education specialists should encourage and support participants in fulfilling their short- and long-term goals, the pace with which they do so should be guided by consumer preferences.
Item
rating:
Rate this item using a 5-point scale based on the percentage of consumers who report moving to higher level, nonsegregated postsecondary classes with each academic unit. Movement will be determined by asking consumers for a description of the classes that they have taken in the last three academic units. The description may include the course number, overview of the class, and where the class fits into the overall degree requirements. Information should also be gathered from consumers to assess their level of satisfaction with their own progress.
Data
collection:
Options for gathering data to rate this item include the following:
Interviewing program leader, education specialists, and program participants; and
Reviewing consumers’ academic record or other documentation of completed course work.
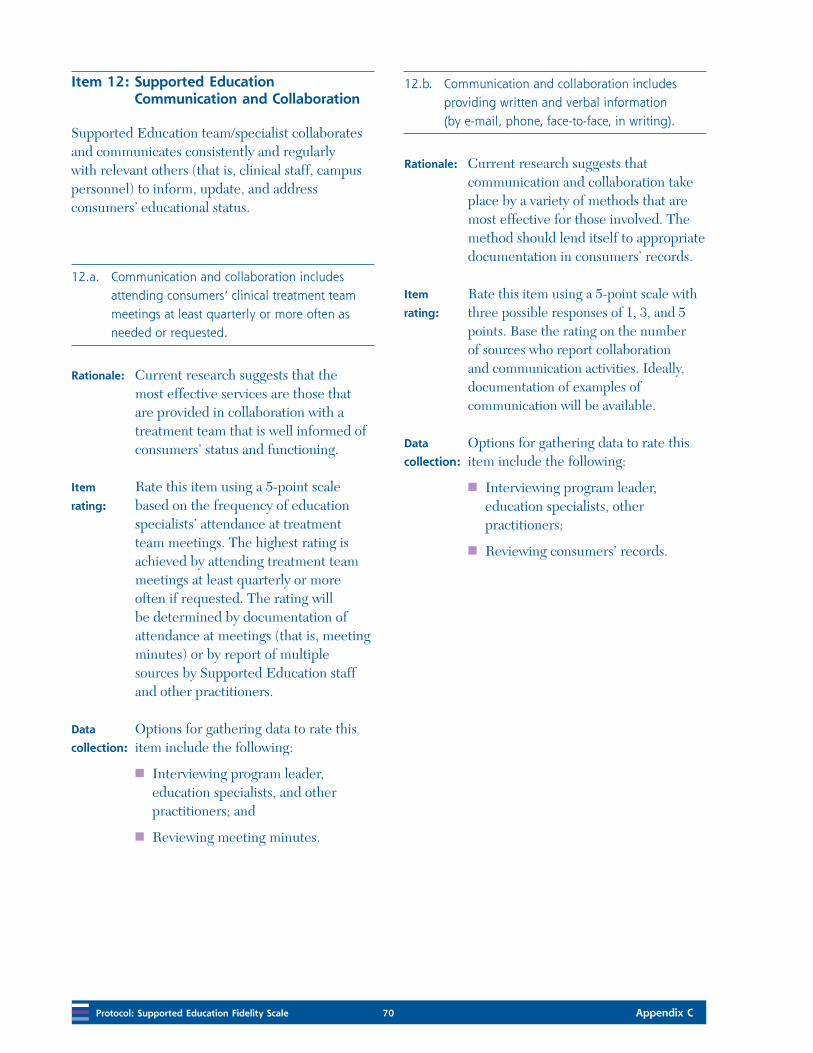
Protocol: Supported Education Fidelity Scale 70 Appendix C
Item 12: Supported Education Communication and Collaboration
Supported Education team/specialist collaborates and communicates consistently and regularly with relevant others (that is, clinical staff, campus personnel) to inform, update, and address consumers’ educational status.
12.a. Communication and collaboration includes attending consumers’ clinical treatment team meetings at least quarterly or more often as needed or requested.
Rationale: Current research suggests that the most effective services are those that are provided in collaboration with a treatment team that is well informed of consumers’ status and functioning.
Item
rating:
Rate this item using a 5-point scale based on the frequency of education specialists’ attendance at treatment team meetings. The highest rating is achieved by attending treatment team meetings at least quarterly or more often if requested. The rating will be determined by documentation of attendance at meetings (that is, meeting minutes) or by report of multiple sources by Supported Education staff and other practitioners.
Data
collection:
Options for gathering data to rate this item include the following:
Interviewing program leader, education specialists, and other practitioners; and
Reviewing meeting minutes.
12.b. Communication and collaboration includes providing written and verbal information (by e-mail, phone, face-to-face, in writing).
Rationale: Current research suggests that communication and collaboration take place by a variety of methods that are most effective for those involved. The method should lend itself to appropriate documentation in consumers’ records.
Item
rating:
Rate this item using a 5-point scale with three possible responses of 1, 3, and 5 points. Base the rating on the number of sources who report collaboration and communication activities. Ideally, documentation of examples of communication will be available.
Data
collection:
Options for gathering data to rate this item include the following:
Interviewing program leader, education specialists, other practitioners;
Reviewing consumers’ records.
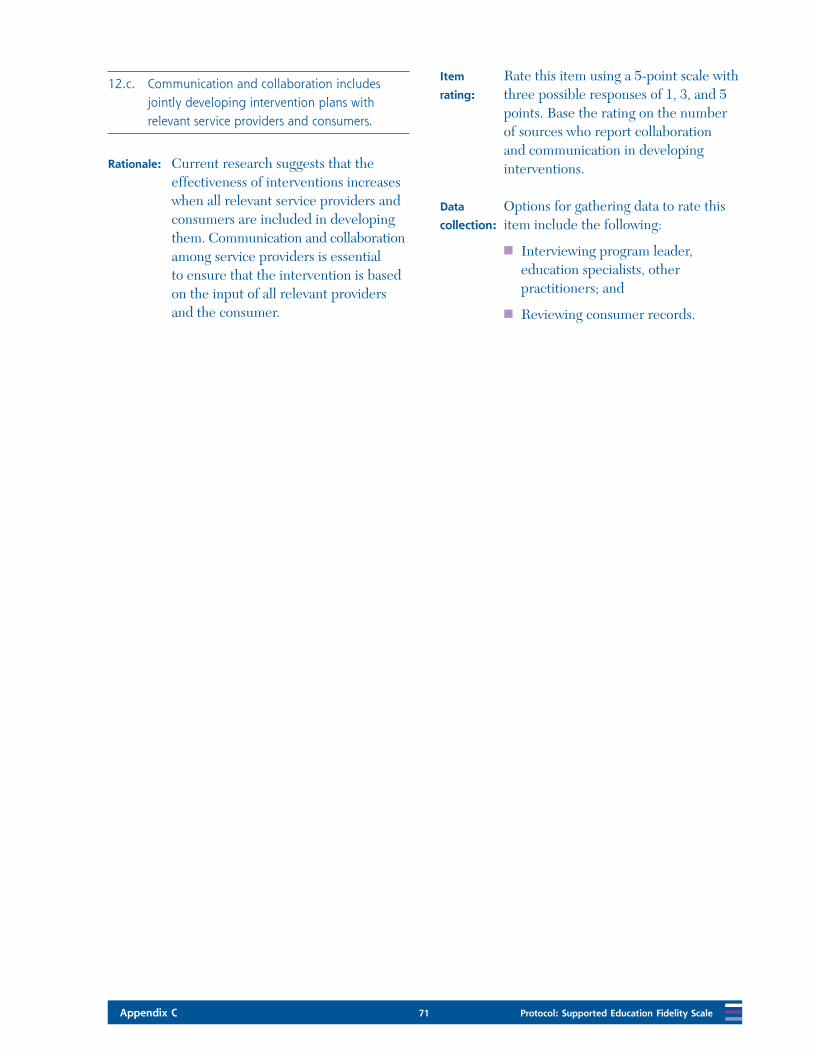
Appendix C 71 Protocol: Supported Education Fidelity Scale
12.c. Communication and collaboration includes jointly developing intervention plans with relevant service providers and consumers.
Rationale: Current research suggests that the effectiveness of interventions increases when all relevant service providers and consumers are included in developing them. Communication and collaboration among service providers is essential to ensure that the intervention is based on the input of all relevant providers and the consumer.
Item
rating:
Rate this item using a 5-point scale with three possible responses of 1, 3, and 5 points. Base the rating on the number of sources who report collaboration and communication in developing interventions.
Data
collection:
Options for gathering data to rate this item include the following:
Interviewing program leader, education specialists, other practitioners; and
Reviewing consumer records.


Appendix D 73 Outcomes Report Form
Evaluating Your Program
Appendix D: Outcomes Report Form

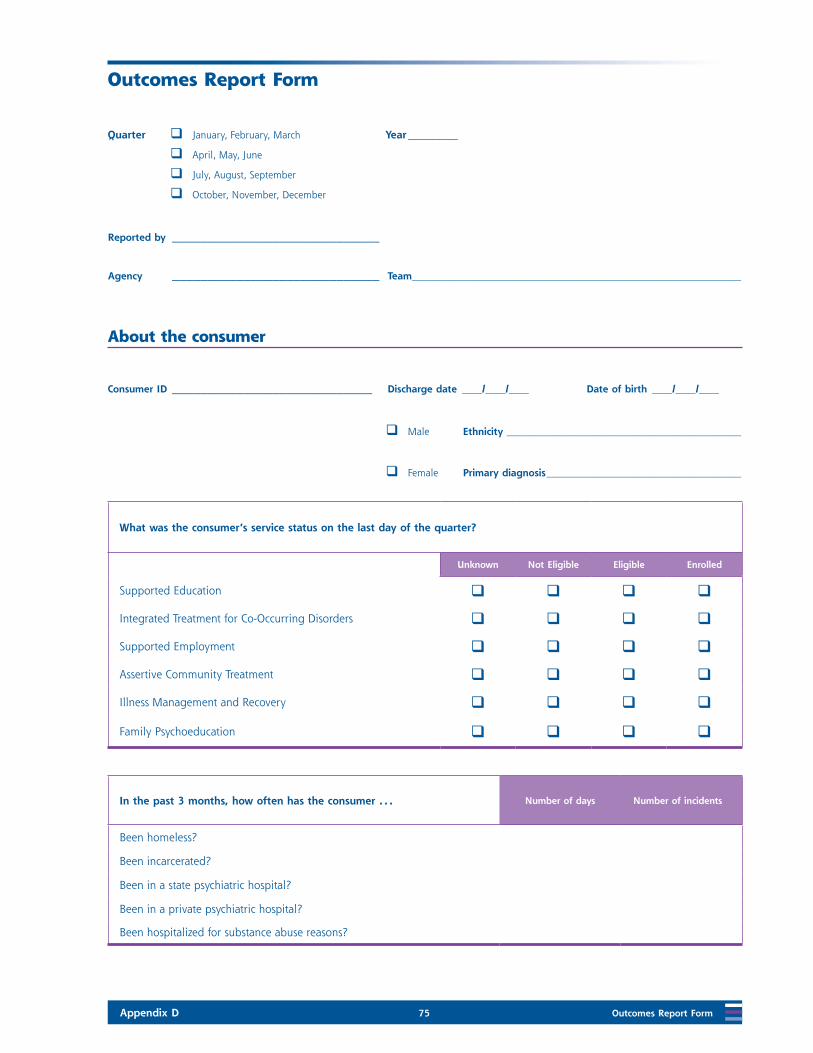
Appendix D 75 Outcomes Report Form
Outcomes Report Form
Quarter qJanuary, February, March Year _______ qApril, May, June
qJuly, August, September
qOctober, November, December
Reported by _____________________________
Agency _____________________________ Team ������������������������������������������������������������������
About the consumer
Consumer ID ____________________________ Discharge date ����/����/���� Date of birth ����/����/����
qMale Ethnicity �����������������������������������������������
qFemale Primary diagnosis ���������������������������������������
What was the consumer’s service status on the last day of the quarter?
Unknown Not Eligible Eligible Enrolled
Supported Education q q q q
Integrated Treatment for Co-Occurring Disorders q q q q
Supported Employment q q q q
Assertive Community Treatment q q q q
Illness Management and Recovery q q q q
Family Psychoeducation q q q q
In the past 3 months, how often has the consumer . . . Number of days Number of incidents
Been homeless?
Been incarcerated?
Been in a state psychiatric hospital?
Been in a private psychiatric hospital?
Been hospitalized for substance abuse reasons?

Outcomes Report Form 76 Appendix D
In the past 3 months, how many days was the consumer
competitively employed? (Use 0 if the consumer has not been
competitively employed.)
_____________ Days
Was the consumer competitively employed on the last day
of the reporting period?
q Yes
q No
What was the consumer’s stage of substance abuse
treatment on the last day of the quarter? Check one.
q Not applicable
qPre-engagement
qEngagement
qEarly persuasion
qLate persuasion
q Early active treatment
q Late active treatment
q Relapse prevention
q In remission or recovery
What was the consumer’s living arrangement on the last
day of the quarter? Check one.
q Not applicable or unknown
q Psychiatric hospital
qSubstance abuse hospitalization
q General hospital psychiatric ward
q Nursing home
qFamily care home
qLiving with relatives (heavily dependent for
personal care)
qGroup home
qBoarding house
q Supervised apartment program
q Living with relatives (but is largely independent)
qLiving independently
qHomeless
q Emergency shelter
q Other (specify): ____________________________
What was the consumer’s educational status on the last day
of the quarter? Check one.
q Not applicable or unknown
q No educational participation
q A vocational/educational involvement
q Pre-educational explorations
q Working on General Education Development certificate
(GED)
q Working on English as a Second Language
q Basic educational skills
q Attending vocational school, vocational program,
apprenticeship, or high school
q Attending college: 1 to 6 hours
q Attending college: 7 or more hours
q Other (specify): _________________________________
What is the consumer’s highest level of education? Check one.
q No high school
q High school diploma or General Educational
Development (GED) diploma
q Some college
q Associate degree
q Vocational training certificate
q Bachelor of Arts or Bachelor of Science
q Master’s degree or Ph.D.

Appendix E 77 Instructions for the Outcomes Report Form
Evaluating Your Program
Appendix E: Instructions for the Outcomes Report Form

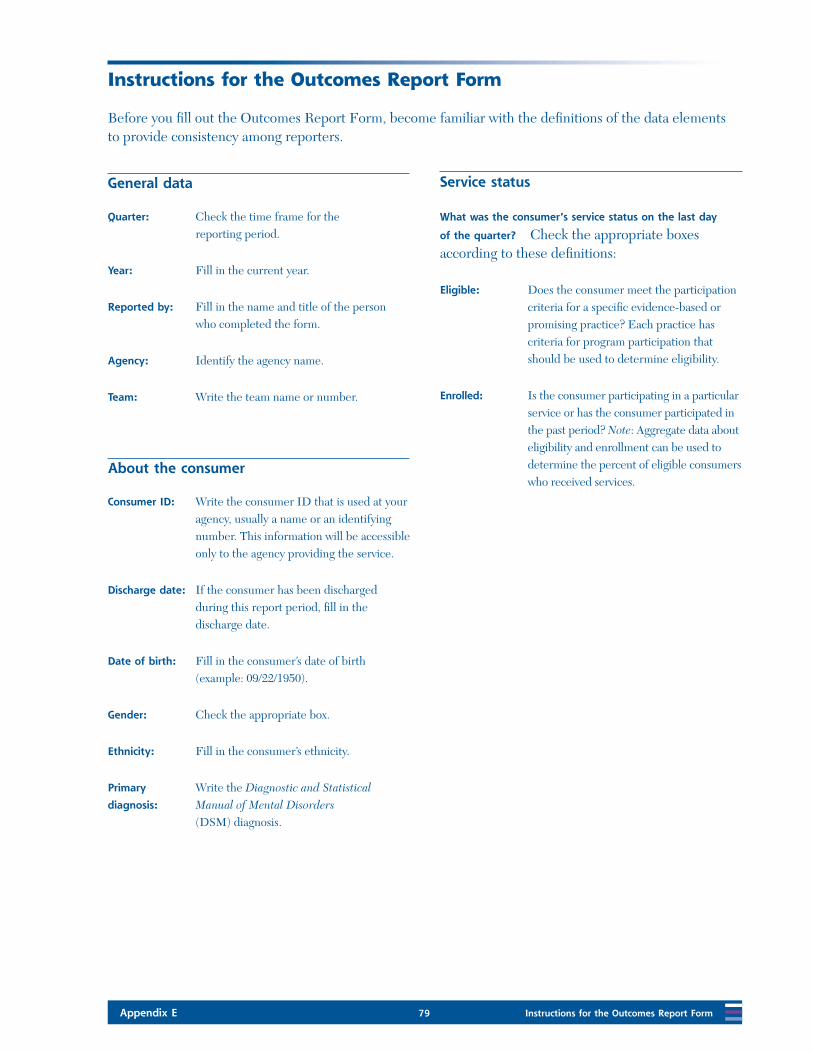
Appendix E 79 Instructions for the Outcomes Report Form
Instructions for the Outcomes Report Form
Before you fill out the Outcomes Report Form, become familiar with the definitions of the data elements to provide consistency among reporters.
General data
Quarter: Check the time frame for the reporting period.
Year: Fill in the current year.
Reported by: Fill in the name and title of the person who completed the form.
Agency: Identify the agency name.
Team: Write the team name or number.
About the consumer
Consumer ID: Write the consumer ID that is used at your agency, usually a name or an identifying number. This information will be accessible only to the agency providing the service.
Discharge date: If the consumer has been discharged during this report period, fill in the discharge date.
Date of birth: Fill in the consumer’s date of birth (example: 09/22/1950).
Gender: Check the appropriate box.
Ethnicity: Fill in the consumer’s ethnicity.
Primary Write the Diagnostic and Statisticaldiagnosis: Manual of Mental Disorders
(DSM) diagnosis.
Service status
What was the consumer’s service status on the last day
of the quarter? Check the appropriate boxes according to these definitions:
Eligible: Does the consumer meet the participation criteria for a specific evidence-based or promising practice? Each practice has criteria for program participation that should be used to determine eligibility.
Enrolled: Is the consumer participating in a particular service or has the consumer participated in the past period? Note: Aggregate data about eligibility and enrollment can be used to determine the percent of eligible consumers who received services.
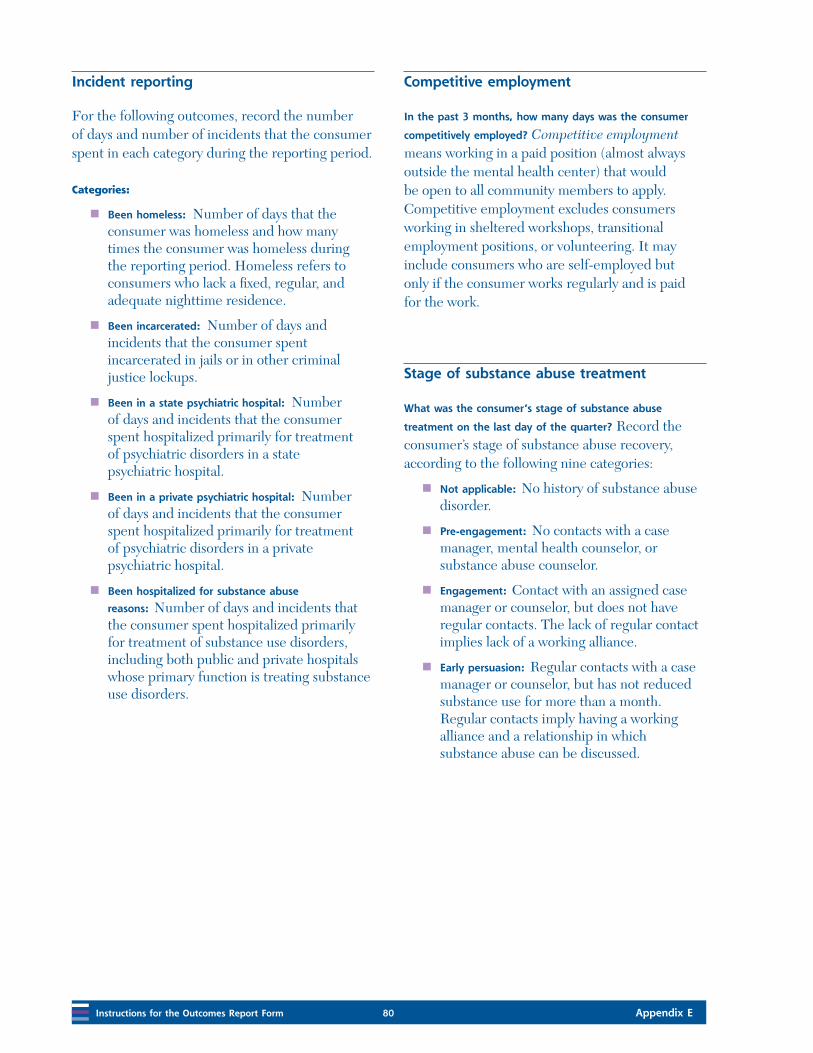
Instructions for the Outcomes Report Form 80 Appendix E
Incident reporting
For the following outcomes, record the number of days and number of incidents that the consumer spent in each category during the reporting period.
Categories:
Been homeless: Number of days that the consumer was homeless and how many times the consumer was homeless during the reporting period. Homeless refers to consumers who lack a fixed, regular, and adequate nighttime residence.
Been incarcerated: Number of days and incidents that the consumer spent incarcerated in jails or in other criminal justice lockups.
Been in a state psychiatric hospital: Number of days and incidents that the consumer spent hospitalized primarily for treatment of psychiatric disorders in a state psychiatric hospital.
Been in a private psychiatric hospital: Number of days and incidents that the consumer spent hospitalized primarily for treatment of psychiatric disorders in a private psychiatric hospital.
Been hospitalized for substance abuse
reasons: Number of days and incidents that the consumer spent hospitalized primarily for treatment of substance use disorders, including both public and private hospitals whose primary function is treating substance use disorders.
Competitive employment
In the past 3 months, how many days was the consumer
competitively employed? Competitive employment means working in a paid position (almost always outside the mental health center) that would be open to all community members to apply. Competitive employment excludes consumers working in sheltered workshops, transitional employment positions, or volunteering. It may include consumers who are self-employed but only if the consumer works regularly and is paid for the work.
Stage of substance abuse treatment
What was the consumer’s stage of substance abuse
treatment on the last day of the quarter? Record the consumer’s stage of substance abuse recovery, according to the following nine categories:
Not applicable: No history of substance abuse disorder.
Pre-engagement: No contacts with a case manager, mental health counselor, or substance abuse counselor.
Engagement: Contact with an assigned case manager or counselor, but does not have regular contacts. The lack of regular contact implies lack of a working alliance.
Early persuasion: Regular contacts with a case manager or counselor, but has not reduced substance use for more than a month. Regular contacts imply having a working alliance and a relationship in which substance abuse can be discussed.
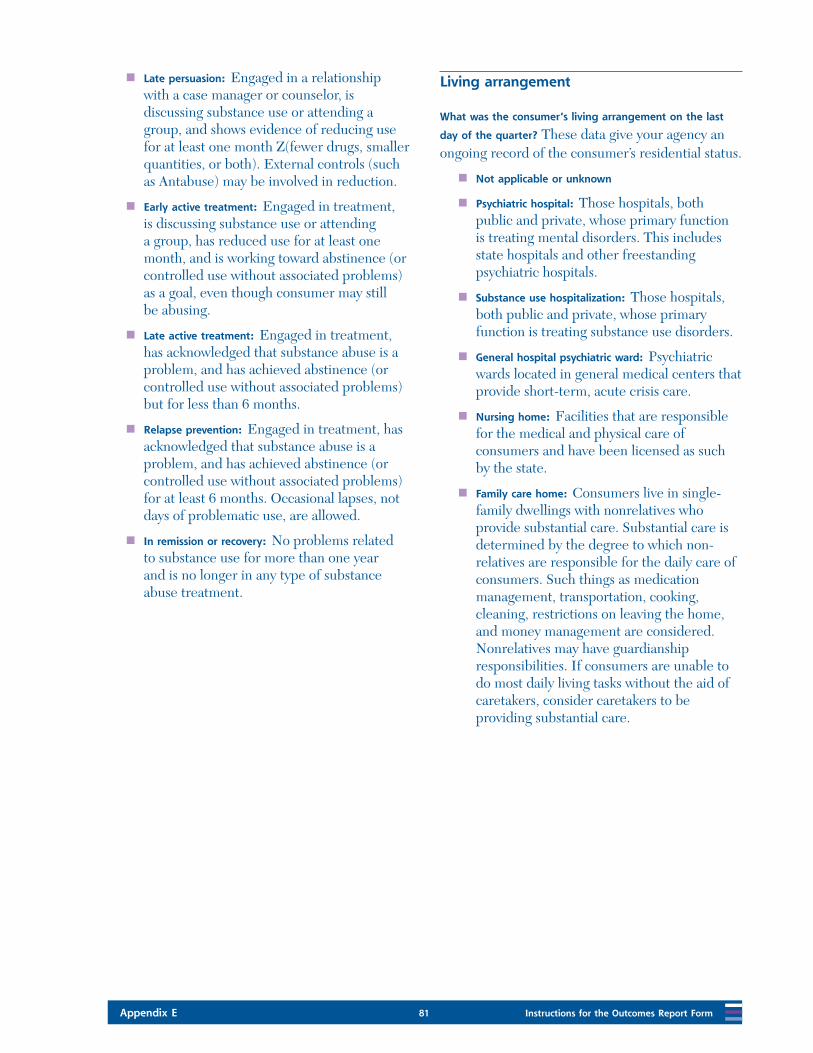
Appendix E 81 Instructions for the Outcomes Report Form
Late persuasion: Engaged in a relationship with a case manager or counselor, is discussing substance use or attending a group, and shows evidence of reducing use for at least one month Z(fewer drugs, smaller quantities, or both). External controls (such as Antabuse) may be involved in reduction.
Early active treatment: Engaged in treatment, is discussing substance use or attending a group, has reduced use for at least one month, and is working toward abstinence (or controlled use without associated problems) as a goal, even though consumer may still be abusing.
Late active treatment: Engaged in treatment, has acknowledged that substance abuse is a problem, and has achieved abstinence (or controlled use without associated problems) but for less than 6 months.
Relapse prevention: Engaged in treatment, has acknowledged that substance abuse is a problem, and has achieved abstinence (or controlled use without associated problems) for at least 6 months. Occasional lapses, not days of problematic use, are allowed.
In remission or recovery: No problems related to substance use for more than one year and is no longer in any type of substance abuse treatment.
Living arrangement
What was the consumer’s living arrangement on the last
day of the quarter? These data give your agency an ongoing record of the consumer’s residential status.
Not applicable or unknown
Psychiatric hospital: Those hospitals, both public and private, whose primary function is treating mental disorders. This includes state hospitals and other freestanding psychiatric hospitals.
Substance use hospitalization: Those hospitals, both public and private, whose primary function is treating substance use disorders.
General hospital psychiatric ward: Psychiatric wards located in general medical centers that provide short-term, acute crisis care.
Nursing home: Facilities that are responsible for the medical and physical care of consumers and have been licensed as such by the state.
Family care home: Consumers live in single-family dwellings with nonrelatives who provide substantial care. Substantial care is determined by the degree to which non-relatives are responsible for the daily care of consumers. Such things as medication management, transportation, cooking, cleaning, restrictions on leaving the home, and money management are considered. Nonrelatives may have guardianship responsibilities. If consumers are unable to do most daily living tasks without the aid of caretakers, consider caretakers to be providing substantial care.

Instructions for the Outcomes Report Form 82 Appendix E
Lives with relatives (heavily dependent for personal
care): Consult consumers and relatives about how much family members are responsible for consumers’ daily care. An important distinction between this status and supervised apartment program is to ask, “If the family were not involved, would the consumer be living in a more restrictive setting?” In assessing the extent to which family members provide substantial care, consider such things as taking medication, using transportation, cooking, cleaning, having control of leaving the home, and managing money. If consumers are unable to independently perform most daily living functions, consider family members to be providing substantial care.
Group home: A residence that is run by staff who provide many functions (shopping, meal preparation, laundry, etc.) that are essential to living independently.
Boarding house: A facility that provides a place to sleep and meals but it is not seen as an extension of a mental health agency, nor is it staffed with mental health personnel. These facilities are largely privately run and consumers have a high degree of autonomy.
Supervised apartment program: Consumers live (fairly independently) in an apartment sponsored by a mental health agency. In determining whether someone fits this category, look at the extent to which mental health staff have control over key aspects of the living arrangements. Example characteristics of control include the following:
The mental health agency signs the lease;
The mental health agency has keys to the house or apartment;
Mental health agency staff provides onsite day or evening coverage; and
The mental health agency mandates that consumers participate in certain mental health services—medication clinic, day program, etc., to live in the house or apartment.
Note: Consumers who receive only case management support or financial aid are NOT included in this category; they are considered to be living independently.
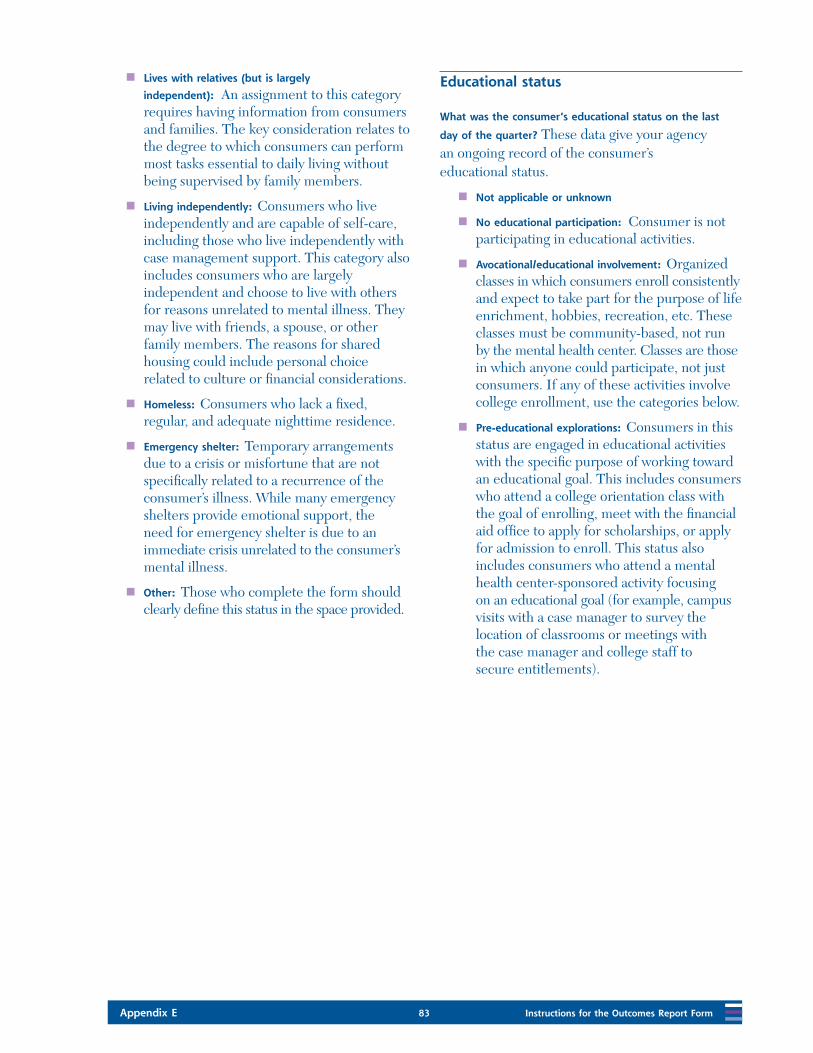
Appendix E 83 Instructions for the Outcomes Report Form
Lives with relatives (but is largely
independent): An assignment to this category requires having information from consumers and families. The key consideration relates to the degree to which consumers can perform most tasks essential to daily living without being supervised by family members.
Living independently: Consumers who live independently and are capable of self-care, including those who live independently with case management support. This category also includes consumers who are largely independent and choose to live with others for reasons unrelated to mental illness. They may live with friends, a spouse, or other family members. The reasons for shared housing could include personal choice related to culture or financial considerations.
Homeless: Consumers who lack a fixed, regular, and adequate nighttime residence.
Emergency shelter: Temporary arrangements due to a crisis or misfortune that are not specifically related to a recurrence of the consumer’s illness. While many emergency shelters provide emotional support, the need for emergency shelter is due to an immediate crisis unrelated to the consumer’s mental illness.
Other: Those who complete the form should clearly define this status in the space provided.
Educational status
What was the consumer’s educational status on the last
day of the quarter? These data give your agency an ongoing record of the consumer’s educational status.
Not applicable or unknown
No educational participation: Consumer is not participating in educational activities.
Avocational/educational involvement: Organized classes in which consumers enroll consistently and expect to take part for the purpose of life enrichment, hobbies, recreation, etc. These classes must be community-based, not run by the mental health center. Classes are those in which anyone could participate, not just consumers. If any of these activities involve college enrollment, use the categories below.
Pre-educational explorations: Consumers in this status are engaged in educational activities with the specific purpose of working toward an educational goal. This includes consumers who attend a college orientation class with the goal of enrolling, meet with the financial aid office to apply for scholarships, or apply for admission to enroll. This status also includes consumers who attend a mental health center-sponsored activity focusing on an educational goal (for example, campus visits with a case manager to survey the location of classrooms or meetings with the case manager and college staff to secure entitlements).
Instructions for the Outcomes Report Form 84 Appendix E
Working on General Educational Development
(GED): Consumers who are taking classes to earn their GED diploma.
Working on English as Second
Language: Consumers who are taking classes in English as a Second Language in a community setting.
Basic educational skills: Consumers who are taking adult educational classes focused on basic skills, such as math and reading.
Attending vocational school or apprenticeship,
vocational program, or attending high
school: Consumers who are—
Participating in community-based vocational schools;
Learning skills through an apprenticeship; internship; or in a practicum setting;
Involved in on-the-job training to acquire more advanced skills;
Participating in correspondence courses which lead to job certification; and
Young adults attending high school.
Attending college: 1 to 6 hours: Consumers who attend college for 6 hours or fewer per term. This status continues over breaks, etc., if consumers plan to continue enrollment. This status suggests that consumers regularly attend college and includes correspondence, TV, or video courses for college credit.
Attending college: 7 or more hours: Consumers attend college for 7 or more hours per term. This status continues over breaks, etc., if consumers plan to continue enrollment.
Regular attendance with expectations of completing course work is essential for assignment to this status.
Other: Those who complete the form should clearly define this status in the space provided.
Appendix F 85 Assessor Training and Work Performance Checklist
Evaluating Your Program
Appendix F: Assessor Training and Work Performance Checklist


Appendix F 87 Assessor Training and Work Performance Checklist
Assessor Training and Work Performance Checklist
Assessment date ����/����/����
Assessor’s name ������������������������������������������������������������ ���������������������� First Middle Initial Last Title
Agency visited ������������������������������������������������������������
Agency address �������������������������������������������������������������������������������������������������� Street
�������������������������������������������������������������������������������������������������� City State ZIP code
EBP assessed ��������������������������������������������������������������������������������������������������
Assessor qualifications
Yes
q 1a. Data collection and skills: Assessor’s skills are evidenced by his or her prior work experience, credentials, or supervisor’s observations.
q 1b. Evidence-based practices (EBP) or promising practice knowledge: Assessor’s knowledge is evidenced by his or her prior work experience, credentials, or passing a knowledge test on a specific EBP or promising practice.
q 1c. Training: Assessors receive at least 8 hours of systematic training on chart review, interviewing techniques, and process assessment.
q 1d. Shadowing: Assessors complete at least 1 assessment with an experienced assessor before the first official process assessment.
q 1e. Practice rating: Assessors co-rate as practice before being official assessors and agree exactly with an experienced assessor on ratings for at least 80 percent of items.
____/5 Subtotal
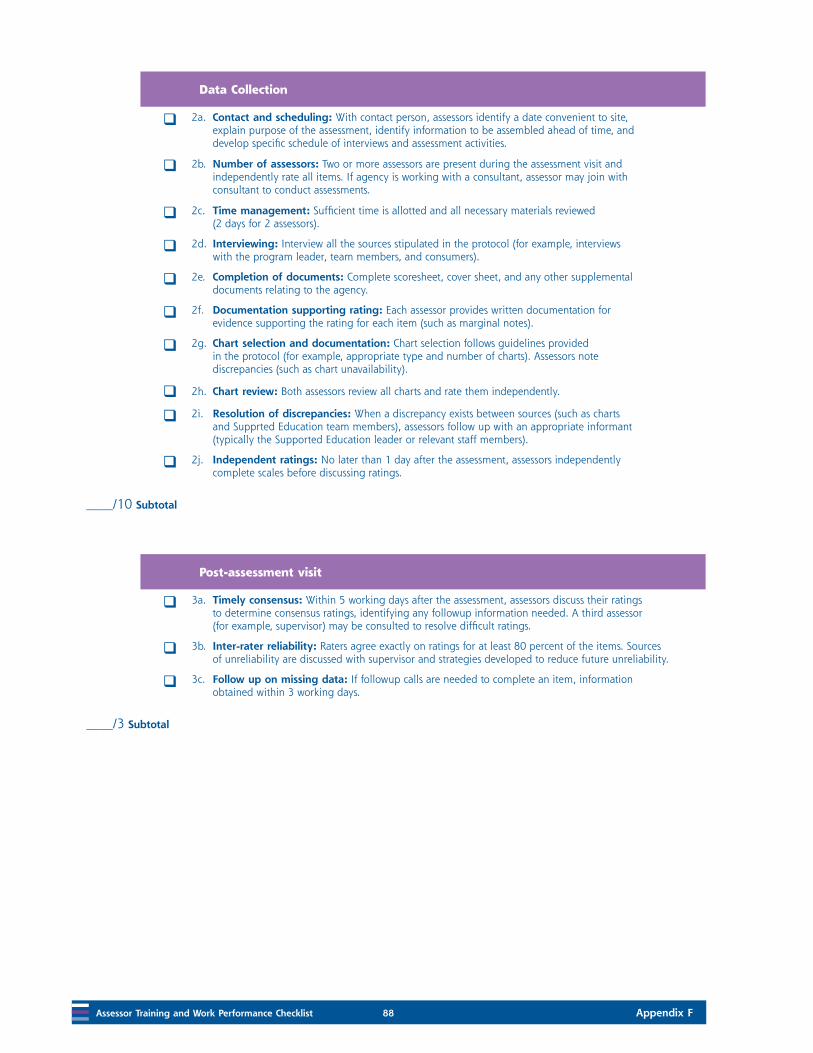
Assessor Training and Work Performance Checklist 88 Appendix F
Data Collection
q 2a. Contact and scheduling: With contact person, assessors identify a date convenient to site, explain purpose of the assessment, identify information to be assembled ahead of time, and develop specific schedule of interviews and assessment activities.
q 2b. Number of assessors: Two or more assessors are present during the assessment visit and independently rate all items. If agency is working with a consultant, assessor may join with consultant to conduct assessments.
q 2c. Time management: Sufficient time is allotted and all necessary materials reviewed (2 days for 2 assessors).
q 2d. Interviewing: Interview all the sources stipulated in the protocol (for example, interviews with the program leader, team members, and consumers).
q 2e. Completion of documents: Complete scoresheet, cover sheet, and any other supplemental documents relating to the agency.
q 2f. Documentation supporting rating: Each assessor provides written documentation for evidence supporting the rating for each item (such as marginal notes).
q 2g. Chart selection and documentation: Chart selection follows guidelines provided in the protocol (for example, appropriate type and number of charts). Assessors note discrepancies (such as chart unavailability).
q 2h. Chart review: Both assessors review all charts and rate them independently.
q 2i. Resolution of discrepancies: When a discrepancy exists between sources (such as charts and Supprted Education team members), assessors follow up with an appropriate informant (typically the Supported Education leader or relevant staff members).
q 2j. Independent ratings: No later than 1 day after the assessment, assessors independently complete scales before discussing ratings.
____/10 Subtotal
Post-assessment visit
q 3a. Timely consensus: Within 5 working days after the assessment, assessors discuss their ratings to determine consensus ratings, identifying any followup information needed. A third assessor (for example, supervisor) may be consulted to resolve difficult ratings.
q 3b. Inter-rater reliability: Raters agree exactly on ratings for at least 80 percent of the items. Sources of unreliability are discussed with supervisor and strategies developed to reduce future unreliability.
q 3c. Follow up on missing data: If followup calls are needed to complete an item, information obtained within 3 working days.
____/3 Subtotal
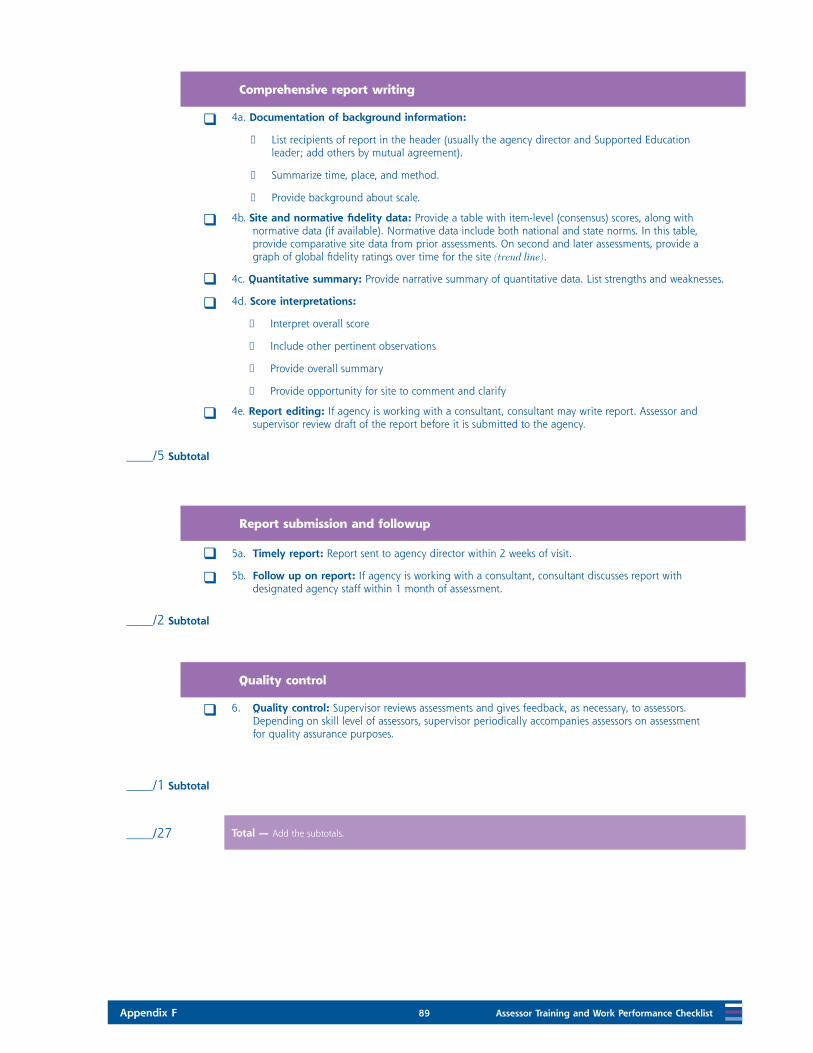
Appendix F 89 Assessor Training and Work Performance Checklist
Comprehensive report writing
q 4a. Documentation of background information:
■List recipients of report in the header (usually the agency director and Supported Education leader; add others by mutual agreement).
■Summarize time, place, and method.
■Provide background about scale.
q 4b. Site and normative fidelity data: Provide a table with item-level (consensus) scores, along with normative data (if available). Normative data include both national and state norms. In this table, provide comparative site data from prior assessments. On second and later assessments, provide a graph of global fidelity ratings over time for the site (trend line).
q 4c. Quantitative summary: Provide narrative summary of quantitative data. List strengths and weaknesses.
q 4d. Score interpretations:
■ Interpret overall score
■ Include other pertinent observations
■Provide overall summary
■Provide opportunity for site to comment and clarify
q 4e. Report editing: If agency is working with a consultant, consultant may write report. Assessor and supervisor review draft of the report before it is submitted to the agency.
____/5 Subtotal
Report submission and followup
q 5a. Timely report: Report sent to agency director within 2 weeks of visit.
q 5b. Follow up on report: If agency is working with a consultant, consultant discusses report with designated agency staff within 1 month of assessment.
____/2 Subtotal
Quality control
q 6. Quality control: Supervisor reviews assessments and gives feedback, as necessary, to assessors. Depending on skill level of assessors, supervisor periodically accompanies assessors on assessment for quality assurance purposes.
____/1 Subtotal
____/27 Total — Add the subtotals.


Appendix F 91 Assessor Training and Work Performance Checklist
Supported Education Consumer Satisfaction Survey
Please complete this survey to help us gather information about the Supported Education program, All information is confidential. If you have any questions, please ask for clarification or help. Thank you for your time.
Check the response that most closely represents how you feel about each statement.
1. Information about the Supported Education
program is widespread and I knew how to get
involved.
qStrongly agree
qAgree
qNeither
qDisagree
qStrongly disagree
2. I had an individual interview with an education
specialist to discuss my ideas and make plans for
my education.
qStrongly agree
qAgree
qNeither
qDisagree
qStrongly disagree
3. There were no requirements, like being drug- or
symptom-free, which would have kept me from
being part of the Supported Education program.
qStrongly agree
qAgree
qNeither
qDisagree
qStrongly disagree
4. My education specialist helped me find an
education program soon after I expressed interest
in becoming involved in the Supported Education
program.
qStrongly agree
qAgree
qNeither
qDisagree
qStrongly disagree
5. I meet or speak with my education specialist at
least every week to discuss how I am doing.
qStrongly agree
qAgree
qNeither
qDisagree
qStrongly disagree
6. My education specialist and I review my educational
goals every semester or quarter.
qStrongly agree
qAgree
qNeither
qDisagree
qStrongly disagree
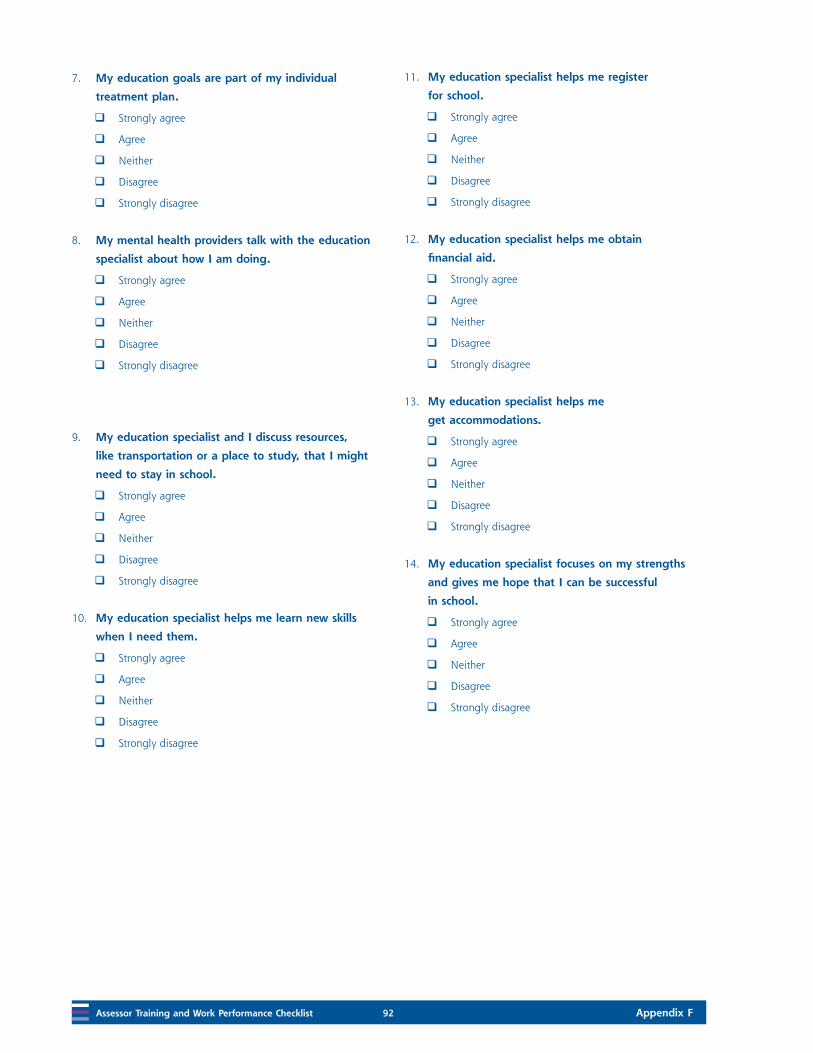
Assessor Training and Work Performance Checklist 92 Appendix F
7. My education goals are part of my individual
treatment plan.
qStrongly agree
qAgree
qNeither
qDisagree
qStrongly disagree
8. My mental health providers talk with the education
specialist about how I am doing.
qStrongly agree
qAgree
qNeither
qDisagree
qStrongly disagree
9. My education specialist and I discuss resources,
like transportation or a place to study, that I might
need to stay in school.
qStrongly agree
qAgree
qNeither
qDisagree
qStrongly disagree
10. My education specialist helps me learn new skills
when I need them.
qStrongly agree
qAgree
qNeither
qDisagree
qStrongly disagree
11. My education specialist helps me register
for school.
qStrongly agree
qAgree
qNeither
qDisagree
qStrongly disagree
12. My education specialist helps me obtain
financial aid.
qStrongly agree
qAgree
qNeither
qDisagree
qStrongly disagree
13. My education specialist helps me
get accommodations.
qStrongly agree
qAgree
qNeither
qDisagree
qStrongly disagree
14. My education specialist focuses on my strengths
and gives me hope that I can be successful
in school.
qStrongly agree
qAgree
qNeither
qDisagree
qStrongly disagree

Appendix F 93 Assessor Training and Work Performance Checklist
15. I believe my education specialist is a good listener
and understands what I am saying and feeling.
qStrongly agree
qAgree
qNeither
qDisagree
qStrongly disagree
16. My ideas and what I want are the focus of
our meetings.
qStrongly agree
qAgree
qNeither
qDisagree
qStrongly disagree
17. My meetings with my education specialist are
helpful and I usually feel good about them.
qStrongly agree
qAgree
qNeither
qDisagree
qStrongly disagree
18. My education specialist is available when I need to
talk, or she or he makes an appointment so we can
get together within a few days.
qStrongly agree
qAgree
qNeither
qDisagree
qStrongly disagree
19. If I do not contact my education specialist, he or
she stays in touch with me through telephone calls,
mail, e-mail, or community visits.
qStrongly agree
qAgree
qNeither
qDisagree
qStrongly disagree
20. My education specialist is helping me accomplish
my education goals.
qStrongly agree
qAgree
qNeither
qDisagree
qStrongly disagree


28857.1210.8712010402
HHS Publication No. SMA-11-4654Printed 2011