evaluating the results of an agricultural cooperative
TRANSCRIPT

Evaluating the results of an agricultural cooperative support programmeBusiness practices, access to fi nance, youth employmentJanuary 2017
TAQEEM INITIATIVE
Impact Report Series, Issue 5
Support programme in Rwanda_Cover.indd 1 22/06/2017 19:06

Evaluating the results of an agricultural cooperative support programmeBusiness practices, access to finance, youth employment
January 2017
International Labour Office Geneva
Support programme in Rwanda.indd 1 22/06/2017 19:06

Copyright © International Labour Organization 2017 First published 2017
Publications of the International Labour Office enjoy copyright under Protocol 2 of the Universal Copyright Convention. Nevertheless, short excerpts from them may be reproduced without authorization, on condition that the source is indicated. For rights of reproduction or translation, application should be made to ILO Publications (Rights and Licensing), International Labour Office, CH-1211 Geneva 22, Switzerland, or by email: [email protected]. The International Labour Office welcomes such applications.
Libraries, institutions and other users registered with a reproduction rights organization may make copies in accordance with the licences issued to them for this purpose. Visit www.ifrro.org to find the reproduction rights organization in your country.
Evaluating the results of an agricultural cooperative support programme: business practices, access to finance, youth employment / International Labour Office. – Geneva: ILO, 2017.
ISBN 978-92-2-130880-5 (print)ISBN 978-92-2-130881-2 (web pdf)
International Labour Office.
cooperative development / management development / employment promotion / Rwanda
03.05 ILO Cataloguing in Publication Data
The designations employed in ILO publications, which are in conformity with United Nations practice, and the presentation of material therein do not imply the expression of any opinion whatsoever on the part of the International Labour Office concerning the legal status of any country, area or territory or of its authorities, or concerning the delimitation of its frontiers.
The responsibility for opinions expressed in signed articles, studies and other contributions rests solely with their authors, and publication does not constitute an endorsement by the International Labour Office of the opinions expressed in them.
Reference to names of firms and commercial products and processes does not imply their endorsement by the International Labour Office, and any failure to mention a particular firm, commercial product or process is not a sign of disapproval.
ILO publications and digital products can be obtained through major booksellers and digital distribution platforms, or ordered directly from [email protected]. For more information, visit our website: www.ilo.org/publns or contact [email protected].
This publication was produced by the Document and Publications Production, Printing and Distribution Branch (PRODOC) of the ILO.
Graphic and typographic design, layout and composition, printing, electronic publishing and distribution.
PRODOC endeavours to use paper sourced from forests managed in an environmentally sustainable and socially responsible manner.
Code: CAD-REPRO
Support programme in Rwanda.indd 2 22/06/2017 19:06

iii
Contents
Contents iii
Preface 1
Section 1: Introduction 3
Section 2: SPARK’s Cooperative Support Programme 7 2.1 The intervention . . . . . . . . . . . . . . . . . . . . . . . . . . . . . . . . . . . . . . . . . . . . . . . . . . . . . . . . . . . . . . 7 2.2 Research questions . . . . . . . . . . . . . . . . . . . . . . . . . . . . . . . . . . . . . . . . . . . . . . . . . . . . . . . . . . . . 9
Section 3: Sample selection and data collection 11 3.1 Sample selection . . . . . . . . . . . . . . . . . . . . . . . . . . . . . . . . . . . . . . . . . . . . . . . . . . . . . . . . . . . . . 11 3.2 Data collection . . . . . . . . . . . . . . . . . . . . . . . . . . . . . . . . . . . . . . . . . . . . . . . . . . . . . . . . . . . . . . . 13
Section 4: Cooperatives’ characteristics and intervention take-up 15 4.1 Sample characteristics . . . . . . . . . . . . . . . . . . . . . . . . . . . . . . . . . . . . . . . . . . . . . . . . . . . . . . . . 15 4.2 Take-up of CSP training and coaching sessions . . . . . . . . . . . . . . . . . . . . . . . . . . . . . . . 21
Section 5: Short-term results on intermediate outcomes 23 5.1 Empirical specification . . . . . . . . . . . . . . . . . . . . . . . . . . . . . . . . . . . . . . . . . . . . . . . . . . . . . . . 23 5.2 Cooperative management . . . . . . . . . . . . . . . . . . . . . . . . . . . . . . . . . . . . . . . . . . . . . . . . . . . . . 24 5.3 Marketing . . . . . . . . . . . . . . . . . . . . . . . . . . . . . . . . . . . . . . . . . . . . . . . . . . . . . . . . . . . . . . . . . . . 27 5.4 Access to finance . . . . . . . . . . . . . . . . . . . . . . . . . . . . . . . . . . . . . . . . . . . . . . . . . . . . . . . . . . . . 30 5.5 Financial management . . . . . . . . . . . . . . . . . . . . . . . . . . . . . . . . . . . . . . . . . . . . . . . . . . . . . . . 32
Section 6: Conclusion 35
Appendix 37
Support programme in Rwanda.indd 3 22/06/2017 19:06

Support programme in Rwanda.indd 4 22/06/2017 19:06

EVALUATING THE RESULTS OF AN AGRICULTURAL COOPERATIVE SUPPORT PROGRAMME
1
Preface
In June 2012, the International Labour Conference of the International Labour Organization (ILO) resolved to take urgent action to tackle the unprecedented crisis in youth employment. The aim was to achieve this through a multi-pronged approach geared towards employment growth and the creation of decent jobs. The resolution “The youth employment crisis: A call for action” contains a set of conclusions that constitute a blueprint for shaping national strategies for youth employment. In 2016, the Global Initiative on Decent Jobs for Youth was launched to facilitate increased impact and expanded country-level action on decent jobs for young people. This will be accomplished through multi-stakeholder partnerships, the dissemination of evidence-based policies and the scaling up of effective and innovative interventions.
The ILO has responded to this challenge by investing more in understanding “what works” in youth employment and supporting governments and social partners to translate evidence into integrated employment policy responses. In 2010 the ILO set-up the Fund for Evaluation in Youth Employment, followed in 2013 by the “Area of Critical Importance: What Works in Skills and Youth Employment” to foster knowledge sharing and provide financial and technical assistance for the rigorous assessment of youth employment interventions. Regional approaches have also been established, including the “Taqeem Initiative: What Works in Youth Employment”, which targets ILO constituents in the Arab States and Africa region. Taqeem (meaning “evaluation” in Arabic) applies an iterative cycle of capacity development, impact research and policy influence to improve evidence and help youth employment policy-makers take evidence-based decisions for better resource allocation and programme design.
The “Impact report” series disseminates research reports from Taqeem-supported impact evaluations. Reports include baseline, endline and qualitative studies which describe the impact estimates of evaluations of youth employment interventions based on experimental and quasi-experimental designs.
This report assesses the effects of an intervention designed to enhance cooperative managers’ business skills, cooperatives’ overall competitiveness and cooperative members’ income and employment conditions, as well as food security in Rwanda. The research explores the short-term impact of the intervention on the employment, organizational, marketing and financial outcomes of agriculture cooperatives. The report was prepared by Jonas Bausch (ILO), Drew Gardiner (ILO) and Bastien Michel (Aarhus University). The COOP Unit and the Small and Medium Enterprises Unit of the ILO’s Enterprises Department provided thoughtful comments on the paper.
It is not an easy time to be a young person in the labour market. The topic of youth employment remains a global challenge and a key policy concern for the ILO, governments, trade unions, employers’ organizations and the UN system as a whole. Through active participation and collaboration between these groups and young people themselves, we can provide the support needed to help young women and men succeed in the future world of work.
Support programme in Rwanda.indd 1 22/06/2017 19:06

EVALUATING THE RESULTS OF AN AGRICULTURAL COOPERATIVE SUPPORT PROGRAMME
2
Youth Employment Programme – Taqeem InitiativeInternational Labour Office (ILO)4, route des Morillons1211 Geneva 22, Switzerlandtel: +41 22 799 [email protected]/taqeem
Support programme in Rwanda.indd 2 22/06/2017 19:06
3
Section 1: Introduction
Despite a significant reduction in poverty over the past decades in Rwanda, the share of its inhabitants living below the national poverty line is still high – around 39.1 per cent in 2014, down from 56.7 per cent in 2005. With more than 70 per cent of the country’s workforce employed primarily in agriculture, increasing earnings in this sector could be a significant driver to further decrease poverty in the coming years. This is all the more important in light of the large share of under-employed workers in the agricultural sector (42 per cent) and the rapidly growing working age population (projected to be on average +222,000 every year between 2015 and 2020). However, increasing earnings will require, among other things, changes in business practices and management, as well as an enabling environment.1
In this context, Rwandan cooperatives appear to be a pivotal tool for agricultural and rural development and poverty reduction, especially for a burgeoning youth population. Cooperatives in Rwanda are part of a vast voluntary sector within and outside the agricultural sector. Agricultural cooperatives typically cover one or more products or crops (such as maize, beans, Irish potatoes or tea). There are also savings and credit cooperatives as well as cooperatives in the service economy, for example in the transport sector.2 Moreover, cooperatives are thought to be enterprises following a broader set of values than those associated purely with profit making, and provide “decent work” opportunities, in particular for young people.3 Setting a normative framework, the ILO’s Recommendation 1934 defines a cooperative as an “autonomous association of persons united voluntarily to meet their common economic, social and cultural needs and aspirations through a jointly owned and democratically controlled enterprise”.
The Government of Rwanda recognized the importance of cooperatives by setting up a Taskforce on Cooperative Promotion in 2005. This action is thought to have fuelled the increase in the number of registered cooperatives from 347 in 2005 to 2,500 in 2008.5 Indeed, in pooling part or all of the surplus of their farmers, cooperatives have a comparative advantage in addressing the needs of their members by making the most of
1 All figures in this paragraph are taken from Ishihara, Y.; Bundervoet, T.; Sanghi, A.; Nishiuchi, T. 2016. Rwanda – Economic update: Rwanda at work (Washington, DC, World Bank Group). Available at: http://documents.worldbank.org/curated/en/2016/03/26010807/rwanda-economic-update-rwanda-work. The national poverty line is defined as earnings below 64,000 Rwandan francs (RWF) per year in 2001 prices.
2 For an excellent overview of the Rwandan cooperative movement, see Nyamwasa, J.D. (2008). “Jump-starting the Rwandan cooperative movement”, in P. Develtere, I. Pollet, F. Wanyama (eds): Cooperating out of poverty – The renaissance of the African cooperative movement (ILO).
3 See ILO. 2015. Rediscovering cooperatives: young people finding work the cooperative way, Cooperatives and the World of Work Series No. 4. Available via: www.ilo.org/coop.
4 ILO Recommendation No. 193, Promotion of Cooperatives. Available at: http://www.ilo.org/dyn/normlex/en/f?p=NORMLEXPUB:12100:0::NO::P12100_ILO_CODE:R193.
5 Mukarugwiza, E. 2010. The hope for rural transformation: a rejuvenating cooperative movement in Rwanda, ILO Working Paper No. 12 (Dar es Salaam).
Support programme in Rwanda.indd 3 22/06/2017 19:06
EVALUATING THE RESULTS OF AN AGRICULTURAL COOPERATIVE SUPPORT PROGRAMME
4
the economies of scale available in activities such as the processing of products, marketing and transportation. Cooperatives may also allow farmers to reduce the costs of their inputs through bulk purchasing. Finally, through a cooperative structure, farmers can improve their access to finance, either through direct financial support from other cooperative members or through a mutualisation of risks at the cooperative level.
However, despite the potential of cooperatives to contribute to poverty alleviation and employment outcomes in Rwanda, relatively little evidence exists on their effectiveness and impact in the country. Perhaps the most notable literature on the subject is from Verhofstadt and Maertens (2014), who looked at cooperative membership among smallholder farmers and analysed the impact of this membership on household income and poverty. Using propensity score matching techniques, they found that cooperative membership in general has a positive impact on farm income and a negative impact on the likelihood of being poor, but that the effect varies with the size of the farm, its distance to market, and the availability of labour in the household.6
In an attempt to explore further how cooperatives can contribute to economic growth and poverty reduction in the agriculture sector, SPARK (a Dutch non-governmental organization (NGO)) partnered with the ILO to evaluate its Cooperative Support Programme (CSP).7 Since June 2014 and through this programme, SPARK has been offering business-oriented training and support to Rwandan cooperatives. Indeed, many of these cooperatives are still in an early stage of development, with rudimentary management structures and practices in place, and are offering only basic services to their members. As part of the first phase of the programme, SPARK’s certified trainers educate cooperative managers on a range of subjects from management practices to marketing, financial literacy, access to finance and financial management. In the second phase of the programme, the coaches train the managers and help them implement new management practices and marketing strategies. For example, they help them start new activities to add value, such as sorting, grading and packaging their products. SPARK also connects cooperatives with microfinance institutions and other actors within their supply chain to create partnerships and secure contracts.
Implementation of the CSP started in June 2014. By August 2015, training had been completed for all cooperatives selected to receive the intervention, and most of these cooperatives had started to receive coaching sessions. In September 2015, a first round of data collection was carried out by a Rwandan-based research firm to document the short-term results of the intervention and learn more about the cooperatives included in the study.
This report describes SPARK’s intervention in greater detail, analyses the study sample and presents the basic characteristics of cooperatives. We also examine a number of intermediate outcome indicators, including the short-term effects of the intervention on the organizational, marketing and financial management practices of cooperatives. This study is based on a small sample of 105 cooperatives, of which 71 benefited from the intervention. The cooperatives that were included in this study, and to which SPARK offered
6 See Verhofstadt and Maertens. 2014. “Smallholder cooperatives and agricultural performance in Rwanda: do organizational differences matter?”, in Agricultural Economics, Vol. 45, Issue S1, pp. 39–52.
7 SPARK successfully applied to the ILO Fund for Evaluation in Employment. Having been selected as one of the beneficiaries of the fund’s call for proposals in 2014, it worked together with the ILO and a Rwandan-based research firm to finalize the design of the evaluation. All data collection for the midline survey was carried out by an external research firm; see Section 3.2 for more details.
Support programme in Rwanda.indd 4 22/06/2017 19:06

EVALUATING THE RESULTS OF AN AGRICULTURAL COOPERATIVE SUPPORT PROGRAMME
5
training and coaching sessions, represent over 22,000 members in total and maintain a combined workforce of over 2,000 employees (as of 2015). Moreover, the majority of employees are women.
However, there are a number of challenges in estimating the impact of the intervention. First, the number of cooperatives included in the study is small (105). Second, cooperatives were not randomly assigned to treatment and control groups as the design of the evaluation was only finalized after implementation of the intervention had started. Rather, cooperatives were offered training and coaching sessions based on SPARK’s pre-defined eligibility criteria. Subject to the information cooperatives provided when applying to benefit from the programme, a comparison group was selected out of the pool of cooperatives that were ultimately not offered the training. An additional drawback is that we were not able to collect baseline data, as the evaluation was only conceptualized after the rollout of the intervention began.
In an attempt to address these drawbacks, we employ a range of methods to measure the impact of the CSP. In particular, while we compare a group of cooperatives that benefited from the intervention with another that did not, we also compare cooperatives that benefited from the intervention at the beginning of the implementation of the programme with those that benefited from it later on. The latter strategy allows us to compare two groups of cooperatives that have relatively similar characteristics. We also make use of a set of questions included in the midline questionnaire (known as “recall” questions hereafter) which allow us to reconstruct the evolution of certain variables through time and, in particular, prior to implementation of the intervention. In turn, this allows us to calculate difference-in-differences (DiD) estimates, in addition to simple difference estimates. However, despite our efforts, the interpretation of our results as the causal impact of the intervention should be approached with some caution.
Keeping these limitations in mind, we found that the intervention appears to have persuaded cooperatives to increase their management activities – as shown through the establishment of additional sub-committees – as well as the portfolio of activities they perform. Cooperatives that benefited from the intervention earlier were more likely to perform storing and processing activities. We also found that this group had been in negotiation with a greater number of buyers than cooperatives that received the intervention later on, leading to a greater number of contracts being signed. However, no impact could be found on the other outcomes investigated as part of this report, such as the total number of services offered to cooperatives’ members or cooperatives’ access to finance. The fact that differences in outcome variables could be found between the cooperatives that had benefited from the intervention earlier on and those that had benefited later on suggests that some of the impacts may take time to materialize. This necessitates the collection of additional data which will allow us to estimate the CSP’s impact over the longer term.
The rest of the report is organized as follows: in Section 2, we describe the specificities of the intervention, its implementation timeline and the main research questions. In Section 3, we provide information on how cooperatives were recruited to take part in the study and selected to benefit from the intervention. In Section 4, we detail how a subset of cooperatives was selected to be surveyed and provide a description of their characteristics (and, in particular, the composition of their workforce). In Section 5, we detail our estimation strategy and provide preliminary results. Finally, in Section 6 we summarize our results and offer some concluding remarks.
Support programme in Rwanda.indd 5 22/06/2017 19:06

Support programme in Rwanda.indd 6 22/06/2017 19:06

7
Section 2: SPARK’s Cooperative Support Programme
2.1 The intervention
Cooperatives have the potential to improve the lives of millions of Rwandans, particularly in the agricultural sector. However, Rwandan cooperatives in the agricultural sector often grow slowly, in part reflecting the limited business development support they can access. Indeed, few institutions or organizations focus on helping cooperatives improve core aspects of their business, such as their management practices and marketing strategy, and strengthen their competitiveness in national and international markets. By providing business skills training and mentoring services through its CSP, SPARK aims to enhance cooperative managers’ business skills and improve cooperatives’ competitiveness, their members’ income and job quality and, eventually, the food security of the country.
In order to understand the demands of cooperatives, a Training Needs Assessment (TNA) was carried out in 2013 on a set of 37 cooperatives located across Rwanda.8 The TNA identified cooperatives’ strengths and weaknesses, as well as strategic areas for improvement to be targeted by SPARK’s intervention. In particular, it aimed to assess cooperatives’ capacity in the following areas:9 governance, financial management, business management, marketing and access to markets, access to finance and credit management, and production management skills – all of which SPARK considered critical for cooperatives’ business development prospects.
The TNA concluded that most cooperatives are still at an early stage of development and could benefit from capacity building in almost all the areas listed above. In total, 23 of the 37 cooperatives surveyed as part of the TNA were categorized as being at a “start-up” or “nascent” stage, characterized by non-existent or very basic management structures. Eight cooperatives were categorized as being at a “development” or “emerging” stage, characterized by functioning but limited structures for governance, management practices, human resources, financial resources management, marketing and working with buyers, access to finance and working with banks, and service delivery. A further six were categorized as being at an “expanding” or “consolidation” stage, at which a cooperative is recognized as an established actor in its sector and is trusted by district and government agencies, as well as by its business partners (such as banks, insurance companies, suppliers and buyers). Finally, none had reached a “sustainability” or “mature” stage, at which a cooperative is fully functioning in a sustainable manner, with a diversified resource base and network including partnerships at the district, provincial, national and international levels.
8 In total, 12 cooperatives were surveyed in the Eastern Province, eight in the Southern Province, eight in the Western Province, seven in the Northern Province and two in the city of Kigali.
9 These areas were selected by SPARK Rwanda, in collaboration with the survey company in charge of carrying out the TNA.
Support programme in Rwanda.indd 7 22/06/2017 19:06

EVALUATING THE RESULTS OF AN AGRICULTURAL COOPERATIVE SUPPORT PROGRAMME
8
In line with the TNA’s conclusions, SPARK then developed training modules to improve cooperatives’ business capacity in four key areas: cooperative enterprise management; marketing and entrepreneurship; financial literacy and access to finance; and financial management. The detailed objectives of each of the modules are listed in Box 1. All the modules were structured around case studies depicting the functioning of model cooperatives and aimed to be as interactive as possible.
SPARK then recruited ten experienced full-time trainers, taking a “training the trainers” approach. Trainers were required to hold a degree in agriculture, agricultural economics or agribusiness, and have a minimum of five years’ experience in training and coaching in the agribusiness sector. Their training started with a one-week intensive course on teaching and coaching techniques provided by a specialist company. This was followed by a three-day training course focusing on the curriculum to be delivered to the cooperatives. Trainers were monitored by a project manager throughout the implementation of the programme through regular follow-up meetings.
Finally, trainers were matched with cooperatives on an informal best-fit basis and training sessions were scheduled. These sessions gathered together four to five members from five to six cooperatives’ management committees. These selected cooperative members attended all the training modules, except for the last one on financial management, which was specifically designed for cooperatives’ financial managers and/or accountants. All the modules lasted three days and were usually separated from one another by periods of one to two months. Coaching sessions were then organized (bringing together the cooperative members who had attended the modules and their trainers) in an attempt to facilitate the implementation of new strategies, rules and/or activities discussed during the training sessions.
In addition to the training and coaching sessions, cooperatives were put in touch with microfinance institutions for financial support. Outside of the here evaluated training programme, microfinance institutions received support to develop tailor made financing products adapted to the business of the value chains served by cooperatives.
In total, 100 cooperatives were chosen to receive SPARK’s intervention, which was developed to be implemented in two consecutive cohorts: 40 cohort 1 cooperatives and 60 cohort 2 cooperatives. Training for cooperatives in the first cohort started in June 2014 and ended in November 2014. Training for cooperatives in the second cohort started in January 2015 and ended in August 2015. Coaching sessions followed the training sessions. Access to the programme was restricted to these 100 cooperatives, to which the intervention was delivered free of charge.
Support programme in Rwanda.indd 8 22/06/2017 19:06

EVALUATING THE RESULTS OF AN AGRICULTURAL COOPERATIVE SUPPORT PROGRAMME
9
2.2 Research questions
As part of this research project, we aimed to understand whether or not an intervention delivering business training and coaching sessions to Rwandan cooperatives could improve their functioning and be a source of job creation. More specifically, the project set out to answer the following questions:
1 Cooperative management: Do CSP training and coaching sessions induce cooperatives to offer more and better products to their buyers, and more and better services and activities to their members? Does the CSP improve the governance and practices of the cooperatives?
2 Cooperative marketing: Do CSP training and coaching sessions lead to a better understanding within cooperatives of available market options and marketing strategies?
3 Financial activities: Do CSP training and coaching sessions result in more access to credit, loans or other sources of finance? Do they increase cooperatives’ financial awareness?
4 Job creation: Do CSP training and coaching sessions induce cooperatives to hire more employees and, in particular, more young people and women? Do they affect the quality of jobs, such as hours worked or wages paid?
In this report, we focus on intermediate outcomes such as whether the intervention was properly implemented and whether or not it had any impact on cooperatives’ management, marketing and finance-related activities. Moreover, we report in detail descriptive statistics related to the fourth research question of how cooperatives create employment and manage their workforces. Whether or not the intervention had any impact on job creation will be the subject of a subsequent report.
Support programme in Rwanda.indd 9 22/06/2017 19:06

EVALUATING THE RESULTS OF AN AGRICULTURAL COOPERATIVE SUPPORT PROGRAMME
10
Box 1 – Objectives of SPARK’s Cooperative Support Programme by training module
Cooperative enterprise management skills
1. To understand SPARK’s programme and how to get the most out of it from a management perspective.
2. To understand the principles of a profitable cooperative enterprise: the importance of a common (economic) goal, how members can earn more through the cooperative, and how to create this in collaboration with group members (further expanded upon in the marketing and entrepreneurship module).
3. To understand the techniques of creating group cohesiveness through proper management and decision making for group activities.
4. To manage their human resources, and delegation of roles and responsibilities through the establishment of relevant sub-committees.
5. To learn how to handle group conflicts, differences and other challenges.
Marketing and entrepreneurship
1. To understand the different market options available to the cooperative.
2. To understand what each buyer wants/the requirements of each buyer.
3. To understand different cooperative strategies, such as specializing or engaging in a range of activities such as product diversification and value addition (entrepreneurship within the product).
4. To understand cost–benefit analysis and how to make decisions about different buyers, different products and who to target, as well as the cooperative’s strategy.
5. To learn how to negotiate contracts (negotiation skills).
Financial literacy and access to finance
1. To understand basic financial statements and what they mean.
2. To understand liquidity, why a cooperative’s working capital is important and how it can be increased.
3. To understand the benefits of accessing finance, risks, costs and sources.
4. To understand loan management skills.
5. To learn how to be informed about other national initiatives and how to access these.
Financial management (only attended by cooperatives’ financial managers and/or accountants)
1. To understand the vital importance of record keeping and how to do this.
2. To understand ways of utilizing and managing collective funds.
3. To understand basic strategies and formulas for liquidity and asset management.
4. To implement adequate cash flows and financial stability.
5. To implement financial policies and strategic decision making.
Support programme in Rwanda.indd 10 22/06/2017 19:06

11
Section 3: Sample selection and data collection
3.1 Sample selection
As a first step in selecting cooperatives, a value chain analysis was conducted to choose the crops with the highest potential. SPARK pre-selected six plants based on their importance in the economy and for job creation: maize, beans, cassava, horticulture, wheat and Irish potatoes. Additional research was then carried out and interviews with members of cooperatives and cooperatives’ stakeholders (NGOs, extension service providers, government institutions) were conducted. These focused on three main criteria: i) competitiveness – potential domestic and regional demand, opportunities for value addition and perceived quality; ii) sector maturity – availability of processors (formal/informal), market and job opportunities and agricultural investment secured; and iii) cross-cutting issues – opportunities for women to earn income, inclusion of young people and the rural poor, and reduction of food insecurity. Each value chain was given a score against each of these criteria, and these scores were finally combined into a single value chain index. Based on this analysis, maize, Irish potatoes and beans were selected. SPARK also decided to include a small number of cooperatives growing fruit and vegetables in the study.10
To be eligible for the intervention, cooperatives had to meet five inclusion criteria. They needed to:
• have been registered with the Rwanda Development Board or the Rwanda Cooperative Agency for longer than a year;
• have set up an accounting system;
• have a manager and an accountant;
• produce one or more of the crops selected for the study, use modern production methods and have a surplus available for marketing;
• have a significant share of women and young people as employees (at least 20 per cent).
The rationale for these inclusion criteria was to filter out the least developed cooperatives and focus on the cooperatives that were advanced enough to produce a surplus that could be sold. Cooperatives also needed to be interested in taking steps to improve the value of their production process (through processing, conservation, storage and other activities) and happy to receive external support to facilitate this process.
10 The reasons for this were: (i) the Rwandan Ministry of Agriculture and Animal Resources had identified horticulture as an important sector for the growth of the country in the near future; and (ii) the Embassy of the Kingdom of the Netherlands had also identified horticulture as a priority sector.
Support programme in Rwanda.indd 11 22/06/2017 19:06

EVALUATING THE RESULTS OF AN AGRICULTURAL COOPERATIVE SUPPORT PROGRAMME
12
For financial and logistical reasons, SPARK decided to focus on cooperatives in the areas with the highest density of eligible cooperatives. In order to do this, an exploratory study was conducted to identify these areas, and 16 districts in the Eastern, Northern and Southern provinces were selected.11
In each of these districts, cooperatives were encouraged (through public advertisements) to apply via cooperative stakeholders (NGOs, extension service provides, government institutions) to benefit from SPARK’s intervention. In the first cohort, 193 cooperatives applied to benefit from the intervention; 98 of these met the programme’s inclusion criteria, and 40 were selected by SPARK to receive the intervention. In the second cohort, 131 cooperatives applied to benefit from the intervention. A total of 60 of these met the programme’s inclusion criteria, and all were selected to receive the intervention.
In total, 100 cooperatives were selected to benefit from the CSP. A further 129 cooperatives were selected by SPARK for inclusion in the comparison group (see Figure 1).
11 These districts were: Burera, Rulindo, Musanze, Gakenke and Rubavu in the Northern Province; Kamonyi, Muhanga, Ruhango, Huye and Gisagara in the Southern Province; and Rwamagana, Kayonza, Ngoma, Kirehe, Yagatare and Bugesera in the Eastern Province.
Figure 1 Selection of study and survey sample
Training Needs Assessment:37 cooperatives interviewed
Exploratory work to select study areas:16 districts selected in 3 provinces
Cohort 1193 applications received,98 eligible cooperatives
Non-treated group:
153 cooperatives
Non-treated group:
71 cooperatives
Treatment group:40 cooperatives
Treatment group selected to be surveyed:
70 cooperatives35 from cohort 1 and 36
from cohort 2
Comparison group selected to be
surveyed:34 cooperatives
Treatment group:60 cooperatives
Cohort 2131 applications received, 60 eligible cooperatives
Treatment group:100 cooperatives
Stud
y sa
mpl
eSu
rvey
sam
ple
Support programme in Rwanda.indd 12 22/06/2017 19:06

EVALUATING THE RESULTS OF AN AGRICULTURAL COOPERATIVE SUPPORT PROGRAMME
13
3.2 Data collection
The first round of data collection took place in September 2015, on completion of the training sessions (see Figure 2). At that point, coaching sessions were still ongoing for cooperatives in both treatment cohorts.
A survey was conducted by a Rwandan-based research firm, which developed the questionnaire and the sampling strategy in close collaboration with SPARK and the ILO. Unfortunately, the study was only conceptualized after implementation of the intervention had already started. It was therefore decided to carry out two follow-up surveys to perform a comparative analysis of how SPARK’s programme had affected its beneficiaries. This was done by collecting information on a set of cooperatives that had benefited from the intervention and another set of cooperatives that had not. The questionnaire contained questions on cooperatives’ background characteristics, such as number of members, revenue and information about employees. It also included questions on outcome variables, each relating to one of the four modules in the CSP (see Box 1). Recall questions were included for selected characteristics (i.e. revenue and membership in 2013, year of foundation) so as to be able to reconstruct the evolution of certain variables throughout time and, in particular, before implementation of the intervention. This also allowed us to obtain a pre-intervention or baseline value for certain key characteristics and outcome variables.12
The bottom half of Figure 1 shows how cooperatives were selected to take part in this first follow-up survey. As part of the first round of data collection, 105 cooperatives were chosen to be surveyed: a third (35) of the cooperatives approached belonged to the first cohort of
12 As baseline characteristics, we used the value of these recall variables on 1 June 2014, before the start of the training sessions.
Figure 2 Timeline
Curriculum development &
exploratory work to select study
areas Early 2014
Cohort 1 193 applications
received
Cohort 2 131 applications
received
Cohort 1 sampling
Selection of 40 treatment cooperatives
Cohort 2 sampling
Selection of 60 treatment cooperatives
Cohort 1 training implementation
June 2014-Dec. 2014
Cohort 2 training implementation
Jan. 2015-Aug. 2015
Cohort 2 coaching sessionsJan. 2015 - ongoing
Cohort 1 coaching sessionsJune 2014 - ongoing
Follow-up survey
Sep. 2015
Support programme in Rwanda.indd 13 22/06/2017 19:06

EVALUATING THE RESULTS OF AN AGRICULTURAL COOPERATIVE SUPPORT PROGRAMME
14
treatment cooperatives that benefited from the programme; another third (36) belonged to the second cohort of cooperatives that benefited from it; and the final third (34) belonged to the group that did not participate in the intervention for the duration of the study. Based on the information cooperatives provided when applying for the CSP training, a comparison group was selected from the pool of cooperatives that applied but were ultimately not selected.13 In order to ensure that the comparison cooperatives were as similar as possible to those in the selected treatment group, initial data on cooperative characteristics were used to match treatment and comparison cooperatives.
The questionnaire was carried out with one or two members of the selected cooperatives, usually the president or the financial manager, depending on their availability.
13 Unfortunately, this information could not be retrieved for the purposes of this study.
Support programme in Rwanda.indd 14 22/06/2017 19:06

15
Section 4: Cooperatives’ characteristics and intervention take-up
4.1 Sample characteristics
Description of cooperatives
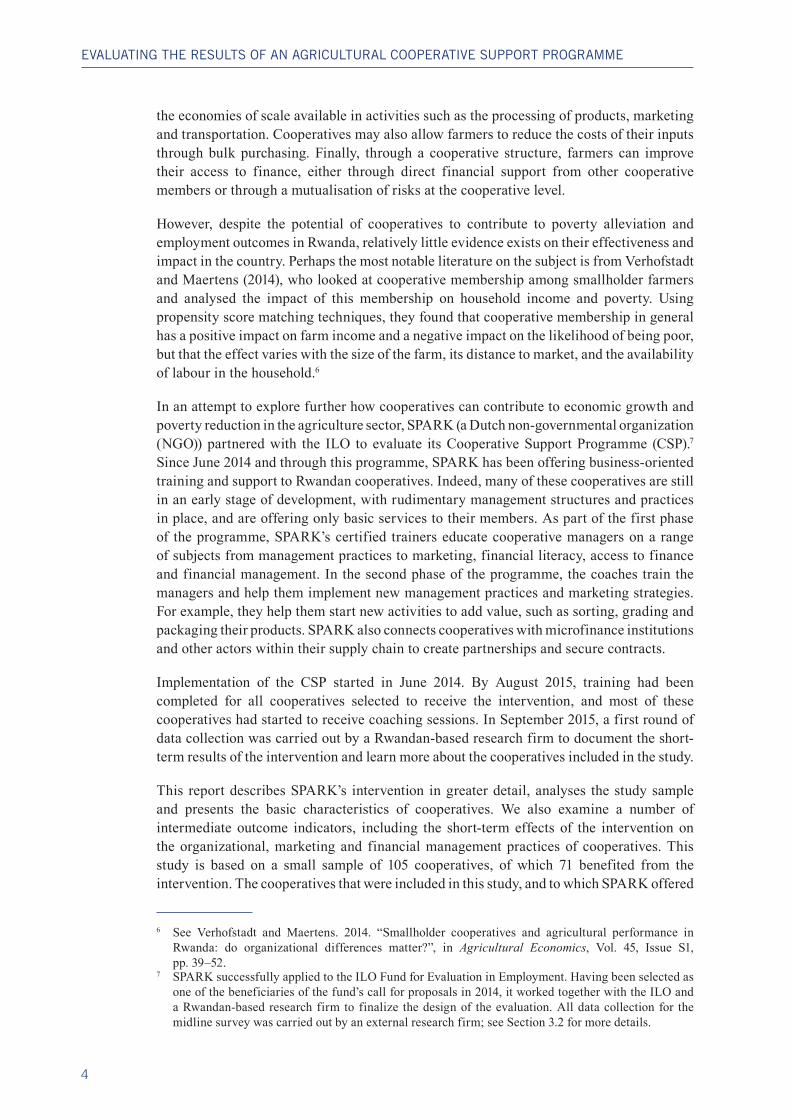
Table 1 shows the average characteristics of the treated and non-treated (comparison) cooperatives using data collected as part of this follow-up survey (but pertaining to the period preceding implementation of the intervention). It does so for the whole sample of 105 cooperatives selected to take part in the survey, as well as for a restricted sample of 85 cooperatives (54 treatment and 31 comparison) that we constructed in an attempt to create two groups of treatment and comparison cooperatives that would be more comparable with regard to observable characteristics. For this restricted sample, we dropped cooperatives with a very large number of members (more than 500 members,14 comprising six cooperatives in the treatment group and two in the comparison group); very high revenue (a self-reported revenue of over 25 million RWF per year in 2013, comprising seven cooperatives in the treatment group and one in the comparison group); or both (comprising four cooperatives in the treatment group and none in the comparison group).
The characteristics of the treatment cooperatives surveyed as part of this round of data collection appear to be broadly similar in the full and restricted samples (aside from the fact that cooperatives in the full sample have more members and higher levels of revenue than those belonging to the restricted sample) and consistent with the inclusion criteria imposed by SPARK. All in all, the treatment cooperatives appear to be quite new, although they are already fairly well developed: more than 90 per cent of them were founded in 2005 or later. Nearly all the treatment cooperatives are legally registered; more than 75 per cent have a financial policy; more than 80 per cent keep financial records; and close to 95 per cent have at least one sub-committee (with an average of slightly more than three sub-committees).15 More than 90 per cent provide at least one service to their members,16 with an average of around two services provided; and around 85 per cent already undertake at least one value-adding activity,17 with an average of more than three undertaken. Moreover, and consistent
14 According to Mukarugwiza (see footnote 5), the average number of members per cooperative was 124 in 2008, meaning that some of the cooperatives included in the sample were much larger than average.
15 As per the questionnaire, sub-committees include: supervisory committees, advisory committees, marketing committees, investment committees, sector committees and other types of committees.
16 As per the questionnaire, services include: free inputs, subsidized inputs, extension services or training in production techniques, access to credit, a loan guarantee fund and social benefits.
17 As per the questionnaire, value-adding activities include: storing products, processing products, marketing products, transporting products, winnowing products, grading products, threshing and drying products, cleaning products, and other activities. Note that some of these activities apply only to specific types of crops (winnowing and threshing and drying products), which complicates the interpretation of our index totalling the number of such activities carried out by cooperatives.
Support programme in Rwanda.indd 15 22/06/2017 19:06

EVALUATING THE RESULTS OF AN AGRICULTURAL COOPERATIVE SUPPORT PROGRAMME
16
with the study’s inclusion criteria, the crops selected by SPARK are widely cultivated in the cooperatives surveyed: close to 96 per cent of them cultivate at least one of the selected crops; more than 70 per cent cultivate maize; 42 per cent beans; 25 per cent Irish potatoes; and 7 per cent pineapple (none produce tomatoes). Almost 53 per cent of the cooperatives also cultivate crops that were not selected by SPARK.
As expected given the challenging study design, comparison of the 70 treatment and 35 comparison cooperatives displays large differences across groups. In particular, treatment cooperatives are larger and have higher revenues than comparison cooperatives: treatment cooperatives have on average 290 members while comparison cooperatives have 156. The data also suggest that, through its training and coaching sessions, SPARK has impacted a total of more than 20,000 cooperative members.18 However, excluding from the sample very large cooperatives (those with more than 500 members) as well as those with very high revenues (over 25,000,000 RWF) results in treatment and comparison groups that are much more comparable, as shown in the restricted sample section of Table 1. Indeed, the differences across these groups appear small and non-significant in most areas: whether or not the cooperative is legally registered; whether it has a financial policy in place or holds financial records; number of members; revenue; number of sub-committees; number of services offered to members; and number of value-adding activities undertaken.
Moreover, fairly large differences can be observed with regard to the crops produced by the cooperatives and their date of establishment, suggesting that there remains some level of heterogeneity across treatment and comparison cooperatives. While we investigate the extent to which these differences affect the comparability of the treatment and comparison groups and the sensitivity of our results, it is nevertheless reassuring that most indicators demonstrating the level of development of the cooperatives (and therefore most indicators more directly related to our outcome variables) display small and non-significant differences across the groups.
In order to increase the similarity between treatment and comparison cooperatives, we focus on cooperatives included in the restricted sample for the preliminary assessment of results in Section 5.
18 As shown in Table 1, the 71 cooperatives included in this study that received support from SPARK had an average of 290 members (giving a total of around 20,500 members). This calculation does not take into account the 29 cooperatives that received SPARK’s training and coaching sessions but were not included in the study.
Table 1: Background characteristics
Full sample Restricted sample
Variables NMean –
treatmentMean – comp.
p-value NMean –
treatmentMean – comp.
p-value
Founded >2010 105 0.296 0.441 0.157 82 0.275 0.419 0.191
Founded 2005–09 105 0.606 0.441 0.117 82 0.608 0.452 0.174
Founded 2000–04 105 0.085 0.088 0.950 82 0.098 0.097 0.985
Founded <2000 105 0.014 0.029 0.638 82 0.020 0.032 0.738
Support programme in Rwanda.indd 16 22/06/2017 19:06
EVALUATING THE RESULTS OF AN AGRICULTURAL COOPERATIVE SUPPORT PROGRAMME
17
Full sample Restricted sample
Variables NMean –
treatmentMean – comp.
p-value NMean –
treatmentMean – comp.
p-value
Legally registered (June 2014) 105 0.972 0.971 0.972 82 0.961 0.968 0.870
Financial policy (June 2014) 105 0.775 0.794 0.821 82 0.804 0.806 0.978
Financial records (June 2014) 105 0.831 0.853 0.773 82 0.804 0.839 0.692
# Members (2013) 101 268 157 0.170 82 87 95 0.705
Members: 0–49 101 0.338 0.394 0.592 82 0.431 0.419 0.916
Members: 50 101 0.250 0.273 0.811 82 0.314 0.290 0.825
Members: 100–499 101 0.265 0.273 0.933 82 0.255 0.290 0.732
Members: 500+ 101 0.103 0.030 0.133 82 0.000 0.000 –
Members: 1,000+ 101 0.044 0.030 0.726 82 0.000 0.000 –
Revenue (2013) in 1,000 RWF 103 15,184 2,749 0.006*** 80 3,015 2,320 0.48
Revenue: 0–500 103 0.232 0.324 0.342 80 0.327 0.355 0.798
Revenue: 500–5,000 103 0.406 0.500 0.373 80 0.490 0.516 0.821
Revenue: 5,000–25,000 103 0.188 0.176 0.884 80 0.184 0.129 0.511
Revenue: 25,000+ 103 0.174 0.000 0.000*** 80 0.000 0.000 –
Activities (June 2014)
At least one sub-committee 105 0.958 0.941 0.727 82 0.980 0.968 0.738
# Sub-committees (0–7) 105 3.183 3.147 0.883 82 3.275 3.258 0.946
At least one service 105 0.915 0.882 0.611 82 0.922 0.871 0.484
# Services for members (0–7) 105 2.070 1.647 0.073* 82 2.000 1.677 0.209
At least one activity 105 0.887 0.853 0.634 82 0.863 0.839 0.772
# Value-adding activities (0–9) 105 3.789 3.059 0.132 82 3.333 2.935 0.437
Type of crops
SPARK crop(s) 105 0.972 0.941 0.500 82 0.961 0.935 0.631
Maize 105 0.775 0.794 0.821 82 0.686 0.806 0.221
Beans 105 0.493 0.324 0.096* 82 0.431 0.323 0.327
Irish potatoes 105 0.254 0.206 0.586 82 0.314 0.161 0.108
Tomatoes 105 0.000 0.118 0.037** 82 0.000 0.129 0.037**
Pineapples 105 0.070 0.059 0.821 82 0.098 0.065 0.587
Non-SPARK crop(s) 105 0.521 0.765 0.012** 82 0.510 0.774 0.013**
Note: This table shows the average characteristics of the treatment and comparison group cooperatives included in the sample, as well as the p-value for a test of equal means. We do this for the full sample of cooperatives selected for the survey, as well as for a restricted sample (excluding large cooperatives). Revenues are in thousands RWF. Robust standard errors are calculated. *, ** and *** denote significance at the 10, 5 and 1 per cent levels respectively.
Support programme in Rwanda.indd 17 22/06/2017 19:06

EVALUATING THE RESULTS OF AN AGRICULTURAL COOPERATIVE SUPPORT PROGRAMME
18
Cooperative employees: Workforce composition and working conditions
Cooperatives are membership-based organizations that finance themselves largely through membership fees. In order to offer services and carry out activities for and with their members, many cooperatives hire employees direct for a variety of tasks.19 Given that most cooperatives participated in SPARK’s CSP relatively recently, we analyse the composition of their workforce for descriptive purposes only, as we do not expect these outcomes to change in the short run.
Figure 3a and Figure 3b show employment patterns in 2015 for cooperatives in the treatment and comparison groups, respectively. They demonstrate that almost all cooperatives (87 per cent in the treatment group and 79 per cent in the comparison group) hired at least some employees, with the majority of cooperatives employing between one and 50 workers. Still, thanks to a large variation in the number of employees, the minority of cooperatives with more than 50 employees accounts for 70 per cent of total employment among cooperatives in the treatment group and 85 per cent of total employment among cooperatives in the comparison group.
Moreover, Figure 3a and Figure 3b also display the share of female and youth (18–35 years of age) employees within each category of employment. While these shares do not appear to vary systematically with the size of the workforce, it seems that SPARK was successful in its goal of targeting cooperatives with a high number of young and female employees. At the time of the survey, 71 per cent of cooperative employees in the treatment group (Figure 3a) were aged between 18 and 35, while 57 per cent were female. In the comparison group, 58 per cent of employees were young people and 56 per cent women.20
Finally, the figures reveal a positive relationship between the size of a cooperative’s workforce and their employee-to-member ratio (shown by the connected black triangles in Figure 3a and Figure 3b). This is because, in our sample, cooperatives with many members do not tend to hire more employees.21 It also suggests that the cooperatives included in the study differ considerably in the extent to which they rely on hired labour per given number of members. On one hand the study includes cooperatives with a relatively small workforce (below 50 employees) and an employee-to-member ratio of well below one. On the other hand, cooperatives with a large workforce tend to employ more workers than they have members.
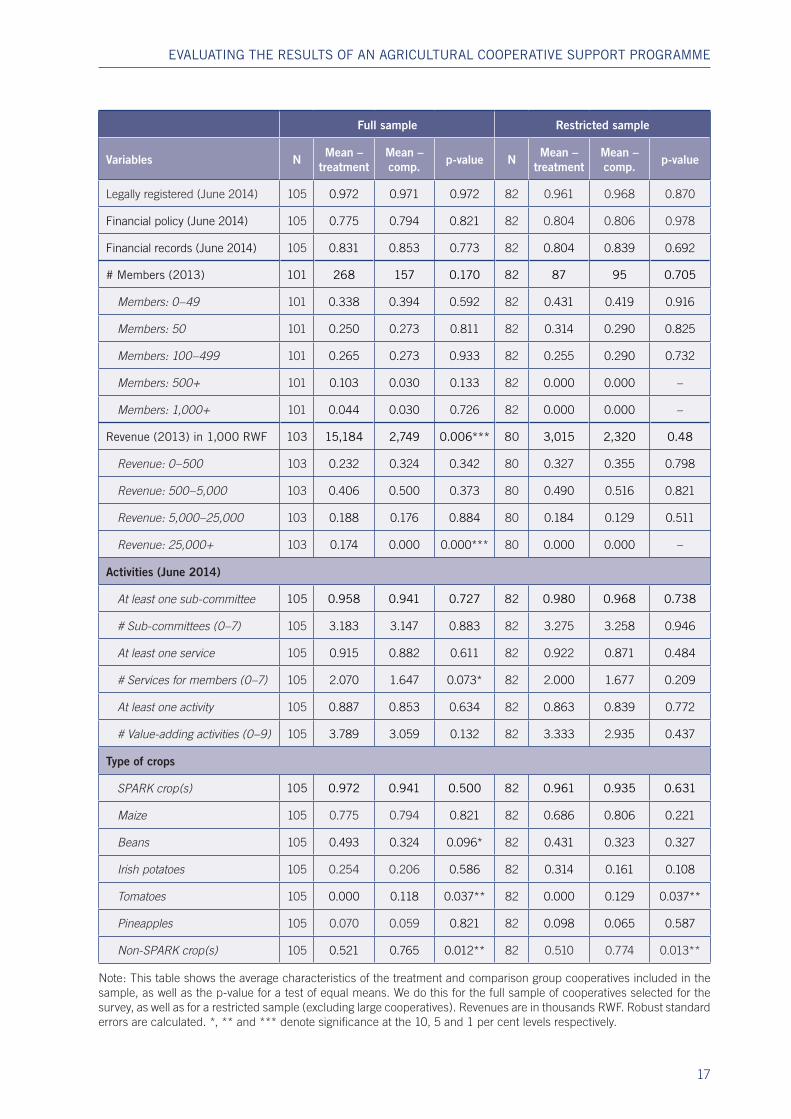
Turning from overall employment data to information about the composition of the workforce, Table 2 shows the hiring patterns of cooperatives in 2015 for five different occupations. Cooperatives in both the treatment and comparison groups rely predominantly on labourers, with an average of 41 (treatment) and 70 (comparison) workers employed in the cooperatives that hire. To a much lesser extent, cooperatives also hire guards, domestic workers, store workers and financial managers. While the share of both young workers (aged 18–35) and women differs across occupations, variation with respect to gender seems
19 Payment of casual labourers might be done directly through the cooperative in case of so-called collective farms or through farmers themselves.
20 Based on all 105 cooperatives that were interviewed for the survey. When taking only the 85 cooperatives in the restricted sample into account, the results barely change: 66 per cent of employees were aged 18–35 and 57 per cent were female.
21 In fact, a closer inspection of the data reveals that the number of employees and the number of members show almost no statistical relationship (a correlation coefficient of 0.05 and a highly insignificant coefficient (p-value: 0.61) when regressing members in 2015 on total employees in 2015).
Support programme in Rwanda.indd 18 22/06/2017 19:06

EVALUATING THE RESULTS OF AN AGRICULTURAL COOPERATIVE SUPPORT PROGRAMME
19
considerably larger: among the treatment cooperatives over three-quarters (76 per cent) of domestic workers are female, while 95 per cent of guards and 83 per cent of store workers are men. On average, cooperatives in the comparison group maintain a larger workforce. While the share of young people is approximately the same overall across treatment status, cooperatives in the treatment group employ considerably more young workers; this is largely driven by a higher share of younger labourers.
Figure 3a Employment patterns in treatment group (N=71)
Cooperatives (%) Female (%) Youth (%) Employees/Members (2015)
100% 4
3,5
3
2,5
2
1,5
1
0,5
0
90%
80%
70%
60%
50%
40%
30%
20%
10%
0%Empl:0 Empl:1-10 Empl:11-50 Empl:51-100 Empl:101-250 Empl:250+
Cooperatives (%) Female (%) Youth (%) Employees/Members (2015)
100% 4
3,5
3
2,5
2
1,5
1
0,5
0
90%
80%
70%
60%
50%
40%
30%
20%
10%
0%Empl:0 Empl:1-10 Empl:11-50 Empl:51-100 Empl:101-250 Empl:250+
Figure 3b Employment patterns in comparison group (N=35)
Cooperatives (%) Female (%) Youth (%) Employees/Members (2015)
100% 4
3,5
3
2,5
2
1,5
1
0,5
0
90%
80%
70%
60%
50%
40%
30%
20%
10%
0%Empl:0 Empl:1-10 Empl:11-50 Empl:51-100 Empl:101-250 Empl:250+
Cooperatives (%) Female (%) Youth (%) Employees/Members (2015)
100% 4
3,5
3
2,5
2
1,5
1
0,5
0
90%
80%
70%
60%
50%
40%
30%
20%
10%
0%Empl:0 Empl:1-10 Empl:11-50 Empl:51-100 Empl:101-250 Empl:250+
Note: These figures show employment patterns for cooperatives in the treatment group by size of overall workforce (six categories) and relies on employment as well as membership data from 2015.
Support programme in Rwanda.indd 19 22/06/2017 19:06
EVALUATING THE RESULTS OF AN AGRICULTURAL COOPERATIVE SUPPORT PROGRAMME
20
Table 2 Composition of cooperatives’ workforce in 2015
Labourers Guards Domestic workers
Financial managers
Store workers
Total
Treatment
Mean 41.46 1.53 1.08 1.29 2.18 34.16
% Female 58.6% 76.1% 53.5% 16.7% 5.1% 57.1%
% Youth (18–35) 69.8% 63.0% 81.4% 83.3% 51.0% 70.6%
No. cooperatives 46 30 40 14 45 62
Comparison
Mean 69.48 1.40 1.20 1.00 1.35 61.44
% Female 57.2% 42.9% 36.5% 0.0% 4.3% 55.9%
% Youth (18–35) 58.4% 64.3% 83.3% 100.0% 52.2% 58.8%
No. cooperatives 23 10 15 4 17 27
Note: The statistics for the different occupations, as well as those for all employees (final column), are based on the cooperatives that employ at least one worker in the respective occupation/overall. Therefore, the number of relevant cooperatives differs across columns.
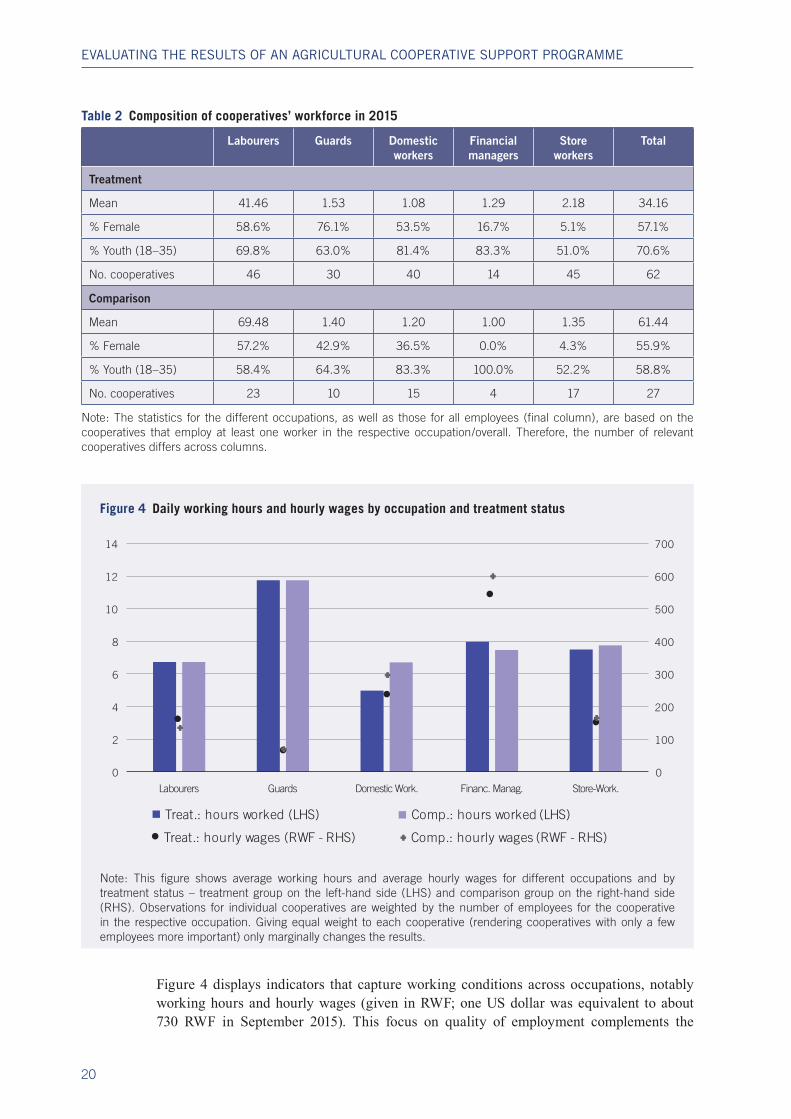
Figure 4 Daily working hours and hourly wages by occupation and treatment status
0
100
200
300
400
500
600
700
0
2
4
6
8
10
12
14
Labourers Guards Domestic Work. Financ. Manag. Store-Work.
Treat.: hours worked (LHS)
Treat.: hourly wages (RWF - RHS) Comp.: hourly wages (RWF - RHS)
Comp.: hours worked (LHS)
Note: This figure shows average working hours and average hourly wages for different occupations and by treatment status – treatment group on the left-hand side (LHS) and comparison group on the right-hand side (RHS). Observations for individual cooperatives are weighted by the number of employees for the cooperative in the respective occupation. Giving equal weight to each cooperative (rendering cooperatives with only a few employees more important) only marginally changes the results.
Figure 4 displays indicators that capture working conditions across occupations, notably working hours and hourly wages (given in RWF; one US dollar was equivalent to about 730 RWF in September 2015). This focus on quality of employment complements the
Support programme in Rwanda.indd 20 22/06/2017 19:06

EVALUATING THE RESULTS OF AN AGRICULTURAL COOPERATIVE SUPPORT PROGRAMME
21
earlier data on the size and composition of cooperatives’ workforces. Average working hours across occupations differ considerably. Labourers, who account for the largest part of the workforce, are on average employed for slightly more than six hours per day, while managerial employees and store workers are hired for approximately eight hours. Guards work almost 12 hours per day while at the same time being paid below 100 RWF per hour, the lowest average wage for any occupation. Guards hired by agricultural cooperatives in Rwanda would typically live close to the cooperatives and, while they would be expected to be present most of the day, the intensity of their work would differ substantially from that of other cooperative employees such as labourers or store workers. This – at least in part – might explain their relatively low wages and long working hours. Finally, financial managers are paid the most, earning approximately four times more per hour than labourers and store workers. When it comes to indicators of quality of work, Figure 4 reveals that there are only minor differences between cooperatives in the treatment and comparison groups.
4.2 Take-up of CSP training and coaching sessions
As part of the follow-up survey, information was gathered on the implementation of the programme. In particular, members of the treatment cooperatives were asked whether they attended each training module, their assessment of the usefulness of its content and the number of times they met with their coach to discuss the implementation of what they had learnt during the module.
Regarding potential contamination of the comparison group, SPARK’s administrative data do not indicate that any of the comparison cooperatives received the intervention by mistake. In addition, the capacity constraints faced by SPARK with respect to the maximum number of cooperatives able to take part in the intervention make it unlikely that any comparison cooperatives would have done so. Furthermore, all cooperatives were asked whether they had worked with any other NGOs in the past three years (2013–15): three out of every five cooperatives in the treatment group and 70 per cent of comparison group cooperatives confirmed that they had done so (p-value: 0.32).
The survey also reveals what kind of services22 – if any – were received. Choosing from ten different types of services, cooperatives in the treatment group indicated that they had benefited from an average of 1.83 (comparison group: 1.76; p-value: 0.87). While these differences are small, the possibility cannot be discounted at this stage that some cooperatives in both the treatment and comparison groups may have benefited from an intervention similar to SPARK’s but delivered by another organization. However, the limited number of organizations delivering such interventions reduces the chances of distortion in the comparison group.
In Table 3, we show the extent to which cooperatives benefited from the intervention. We do so for all treatment cooperatives, as well as for cohort 1 and cohort 2 cooperatives separately. Overall, the take-up rate is high, suggesting that Rwandan cooperatives were interested in the type of intervention delivered by SPARK. Indeed, each module was taken by 91–93 per cent of the treatment cooperatives – take-up rates were only marginally higher for cooperatives in the second cohort. As expected, cooperatives belonging to the first
22 There were ten different options: inputs, extension services, machines, funding or direct financial support, training on cooperative management, training on marketing, training on access to finance, training on financial management, training on entrepreneurship and “other”, a residual category.
Support programme in Rwanda.indd 21 22/06/2017 19:06

EVALUATING THE RESULTS OF AN AGRICULTURAL COOPERATIVE SUPPORT PROGRAMME
22
cohort benefited from more coaching sessions, although the differences are relatively small given that cohort 1 cooperatives started benefiting from the intervention seven months before cohort 2 cooperatives.
Table 3 Take-up of training and coaching sessions
All Cohort 1 Cohort 2
Training (%) Coaching (#) Training (%) Coaching (#) Training (%) Coaching (#)
Module 1 92% 4.03 86% 4.40 97% 3.67
Module 2 90% 3.17 86% 3.37 94% 2.97
Module 3 93% 2.94 91% 3.00 94% 2.89
Module 4 92% 2.72 89% 2.77 94% 2.67
N 71 35 36
Note: This table shows the share of treatment cooperatives that say they have benefited from each training module, as well as the average number of related coaching sessions that were held.
Moreover, cooperatives reported being satisfied with the content of the training sessions. The share of cooperatives declaring that attending the training sessions was a productive use of their time and that they learnt many skills they could apply in the context of their cooperative varies between 82 per cent and 95 per cent, depending on the training session (see Table 4).
Table 4 Cooperatives’ assessment of the usefulness of training sessions
Overall I found the training session to be: Module 1 Module 2 Module 3 Module 4
(1) A productive use of time – I learnt many skills that I have applied to my cooperative
58 53 63 61
(2) A productive use of time – some of what I learnt was not relevant, but some things I will be able to apply to my cooperative
6 9 2 1
(3) A productive use of time, but I don’t think I will be able to apply what I learnt to our cooperative
1 2 1 3
(4) Not a good use of time – I didn’t learn anything new 0 0 0 0
(5) Not a good use of time – I didn’t learn anything relevant that I can apply to the cooperative
0 0 0 0
Number of observations 65 64 66 65
Note: This table displays a measure of self-assessed usefulness for each training module. Only cooperatives that indicated they attended the training sessions for the relevant module were asked this question.
Support programme in Rwanda.indd 22 22/06/2017 19:06

23
Section 5: Short-term results on intermediate outcomes
As part of this survey, data were collected on intermediate outcomes and, in particular, on cooperatives’ management structure and practices, marketing strategies, access to finance, and financial management. Each of these corresponds to the topic of a training module delivered by SPARK. The following sub-sections describe the short-term results of the intervention in terms of these outcomes.
5.1 Empirical specification
In order to assess the short-term results of the intervention, we employ the following two strategies. First, we aim to measure the impact of the intervention by comparing the treatment and comparison cooperatives. Second, we aim to assess the results of the intervention by measuring whether benefiting from it earlier on had any impact on the treatment cooperatives. We do so by comparing cohort 1 cooperatives with cohort 2 cooperatives. There are two reasons for this: first, cohort 2 cooperatives had just completed their training sessions at the time of the survey, and the effects of the intervention may take some time to materialize; and, second, the cohort 1 and cohort 2 cooperatives were more similar in terms of characteristics than the treatment and comparison cooperatives (see Table A1 in the Appendix).
In both cases, we assess the short-term results of the intervention using simple difference estimators, as well as DiD estimators whenever possible. The former set of estimates relies on the strong assumption that the treatment and comparison cooperatives were comparable prior to implementation of the intervention. The latter set of estimates is slightly more flexible, in the sense that they can account for differences across groups, as long as they remain constant throughout the period of the study. These estimates could be calculated for four different categories of “intermediate” outcomes, for which pre-intervention evolution could be reconstructed thanks to the recall questions included in the survey. These estimates also rely on the assumption that any additional measurement errors associated with the recall questions are independent of cooperatives’ treatment status. Given the limited sample size of the study and the non-random allocation of the cooperatives to the treatment groups, the interpretation of these estimates as the causal impact of the intervention should be approached with the appropriate caution.
For all outcome variables, we report the following estimates of the impact of the intervention: the first two columns of each table display simple difference estimates obtained through the estimation of equation (1). This equation is estimated with and without covariates (contained in in equation (1)) to test the sensitivity of the results. When included in the regression, covariates include dummy variables controlling for cooperatives’ year of foundation (three categories), number of members in 2013 (three categories) and revenue in 2013 (three categories), as set out in Table 1. For outcomes based on recall questions, the baseline value of the variable (in June 2014) is also included in the regression as a
Support programme in Rwanda.indd 23 22/06/2017 19:06

EVALUATING THE RESULTS OF AN AGRICULTURAL COOPERATIVE SUPPORT PROGRAMME
24
covariate. Moreover, for these variables, the last two columns of each table show DiD estimates obtained through the estimation of equation (2). Again, this equation is estimated with and without covariates.23
5.2 Cooperative management
In Table 5, we provide estimates of the short-term impact of SPARK’s intervention on a range of outcomes related to cooperatives’ management structure and practices, such as the number of sub-committees (up to seven sub-committees: board of directors, supervisory committee, advisory committee, marketing committee, investment committee, sector committee and “other” committee) and the number of services offered to members (up to seven services: free inputs, subsidized inputs, extension services/training, access to credit, loan guarantee fund for members, social benefits and “others”). We also measure the impact of the intervention on a Business Management Index that captures the level of development of cooperatives’ business plans.24
In the top half of the table, we compare treatment and comparison cooperatives and find that differences are usually close to zero, and never statistically significant. When covariates are controlled for, only the simple difference estimate measuring the impact of the intervention on the number of sub-committees is positive; even then it is small and not statistically significant. Figure 5 depicts the evolution of the number of sub-committees and the number of services offered across time for both treatment cohorts, as well as for the comparison cooperatives, and shows that there were important differences across these groups prior to the start of the intervention (the two red lines in June 2014 and January 2015 indicate when the first and second cohorts started the training, respectively). This suggests that DiD estimates may be more appropriate, especially given that pre-treatment trends appear to be roughly similar across the three groups.
In the bottom half of Table 5, we look at the impact on cooperatives of having benefited from the intervention earlier on. This seems to have increased the number of sub-committees by 0.47 per cooperative – an estimate that is not significant due to large standard errors, suggesting that the intervention may have a positive effect that does, however, take time to materialize. Interestingly, this development appears to have been driven largely by an increase in the share of cohort 1 cooperatives having a marketing sub-committee, as shown in Figure 6. However, despite this substantial effect, even this estimate does not reach a conventional level of statistical significance due to the small sample size. Moreover, none
23 Note that TREAT represents a dummy that equals 1 for cooperatives that were included in the treatment group and 0 otherwise. For the second approach, where we compare cooperatives that were treated earlier (cohort 1) with cooperatives that were treated later (cohort 2), the dummy equals 1 for cohort 1 cooperatives and 0 otherwise.
24 The Business Management Index is based on 12 questions which ask whether the business plan of a cooperative includes any of the following elements: a membership strategy, a production strategy, a marketing strategy, a finance strategy, an operational strategy, a revenue goal, a profit goal, a risk analysis, seasonal targets, annual targets, long-term targets, and/or anything else. The index is then standardized to a variable of 0–1 (0 when a cooperative reports having none of the above elements and 1 when it reports having all 12 of them).
Support programme in Rwanda.indd 24 22/06/2017 19:06

EVALUATING THE RESULTS OF AN AGRICULTURAL COOPERATIVE SUPPORT PROGRAMME
25
Figure 5 Evolution of the number of sub-committees and services provided, by treatment status
Note: This figure plots the evolution of the number of sub-committees cooperatives maintained and the services cooperatives provided to their members between 2012 and 2016 for both treatment cohorts and the comparison group. It aggregates the corresponding backward-looking questions for whether and, if so, when cooperatives started to provide a specific service (up to seven distinct services). The two horizontal lines correspond to the start of the training sessions for the first (June 2014) and second (January 2015) treatment cohorts.
4
3.5
2012 2013 2014 2015 2016
3
2.5
Year
–– Comparison –– Treatment-1 –– Treatment-2
# Sub-Committees (0-7)
2.5
2
1.5
1
0.5
2012 2013 2014 2015 2016
Year
–– Comparison –– Treatment-1 –– Treatment-2
# Services for members (0-7)
Support programme in Rwanda.indd 25 22/06/2017 19:06

EVALUATING THE RESULTS OF AN AGRICULTURAL COOPERATIVE SUPPORT PROGRAMME
26
Table 5 Outcome analysis – cooperative management
Simple diff. DiD
Variables N Mean and std. dev. comparison
group
No covariates
With covariates
No covariates
With covariates
Treatment vs. comparison group
# Sub-committees (0–7) 82 3.645 0.100 0.102 0.083 0.083
0.839 0.195 0.161 0.213 0.198
# Services for members (0–7) 82 1.935 0.084 -0.089 -0.238 -0.164
0.998 0.249 0.193 0.187 0.204
Business Management Index (0–1) 82 0.551 -0.022 -0.012
0.205 0.050 0.046
Figure 6 Evolution of the share of cooperatives with a marketing sub-committee, by treatment status
1
0.9
0.8
0.7
0.6
0.5
0.4
0.3
0.2
0.1
0
2012 2013 2014 2015 2016
Year
–– Comparison –– Treatment-1 –– Treatment-2
Marketing Committee (0/1)
Note: This figure plots the evolution of the share of cooperatives that maintained a marketing sub-committee between 2012 and 2016 for both treatment cohorts and the comparison group. It aggregates the corresponding backward-looking questions for whether and, if so, when cooperatives established such a sub-committee. The two horizontal lines correspond to the start of the training sessions for the first (June 2014) and second (January 2015) treatment cohorts. The DiD estimate with covariates is 0.134 for treatment vs. comparison (p-value: 0.119) and 0.135 for treatment-1 vs. treatment-2 (p-value: 0.432). Note that the DiD estimates compare outcomes from June 2014 to September 2015.
Support programme in Rwanda.indd 26 22/06/2017 19:06

EVALUATING THE RESULTS OF AN AGRICULTURAL COOPERATIVE SUPPORT PROGRAMME
27
of the other estimates comparing cohort 1 and cohort 2 cooperatives shown in Table 5 suggest that this increase in the number of sub-committees was translated into an increase in the number of services offered to cooperative members. No effects could be found on the level of development of cooperatives’ business plans.
5.3 Marketing
In Table 6, we provide estimates of the short-term effects of SPARK’s intervention on a range of outcomes related to cooperatives’ marketing strategy. These include: the number of clients a cooperative was in touch with during the previous season; the number of formal and informal contracts signed during the previous season; and the number of value-adding activities (up to nine value-adding activities: storing, processing, packaging, marketing, transporting, winnowing, grading, threshing and drying, cleaning) undertaken by the cooperative. Indeed, two important components of the intervention were putting treatment cooperatives in touch with other actors within their supply chain to create partnerships and secure contracts, and the promotion of value-adding activities.
Comparing the treatment and comparison cooperatives, we find that the intervention had at best a limited effect on these marketing outcomes. Point estimates come with large standard errors and are in no cases statistically different from zero. However, cooperatives trained by SPARK as part of the first cohort negotiated on average with 2.3 buyers more per season than cooperatives in the second cohort. This also seems to translate into more (informal) contracts for cooperatives that participated in the intervention earlier on. Even though results are only marginally significant, cohort 1 cooperatives also appear to undertake more value-adding activities. This observation seems to be confirmed by the evolution of this outcome in the three groups over time, as shown in Figure 7.
Simple diff. DiD
Variables N Mean and std. dev. comparison
group
No covariates
With covariates
No covariates
With covariates
Cohort 1 vs. cohort 2
# Sub-committees (0–7) 51 3.571 0.385 0.613** 0.331 0.468
0.959 0.242 0.255 0.274 0.346
# Services for members (0–7) 51 2.214 -0.432 0.118 0.043 0.237
1.449 0.332 0.329 0.242 0.365
Business Management Index (0–1) 51 0.557 -0.060 -0.026
0.220 0.070 0.081
Note: This table shows the preliminary effects of having benefited from SPARK’s intervention on management outcomes. The analysis was carried out on cooperatives belonging to the restricted sample. In column (1), we report estimates obtained with a simple difference estimation strategy with no covariates. In column (2), we report coefficients obtained with the same design when the covariates (year of foundation (cat.), number of members (cat.) and 2013 revenue (cat.)) are added to the regression. In columns (3) and (4) we report, wherever possible, coefficients obtained with a DiD estimation strategy, with and without covariates. Robust standard errors are displayed below impact estimates. *, ** and *** denote significance at the 10, 5 and 1 per cent levels respectively.
Support programme in Rwanda.indd 27 22/06/2017 19:06

EVALUATING THE RESULTS OF AN AGRICULTURAL COOPERATIVE SUPPORT PROGRAMME
28
Again, a possible explanation for the differences observed when comparing different groups of cooperatives is that the effects of the intervention only materialize in the medium term (it is worth remembering that cohort 2 cooperatives had only just completed their training sessions at the time of the survey). Figure 8 shows time trends for four of the most common value-adding activities performed by cooperatives in the study sample. It demonstrates that the increase in value-adding activities documented in Table 6 seems to be driven primarily by cohort 1 cooperatives increasing their storing and processing activities after starting the CSP. Overall, these results suggest that SPARK’s intervention had a modest effect on cooperatives’ activities, which was accompanied by a higher number of (potential) buyers. This development, however, appears to take time to materialize.
Table 6 Outcome analysis – cooperative marketing
Simple. diff. DiD
Variables NMean and std.
dev. comparison group
No covariates
With covariates
No covariates
With covariates
Treatment vs. comparison group
# Buyers negotiated with 79 3.167 -0.187 -0.049
1.840 0.423 0.422
# Formal contracts in last season 81 0.710 0.030 0.019
1.101 0.233 0.224
# Informal contracts in last season 78 1.414 0.280 -0.068
1.803 0.435 0.408
# Value-adding activities (0–9) 82 2.677 0.676 0.510 0.278 0.396
1.990 0.493 0.445 0.479 0.512
Cohort 1 vs. cohort 2
# Buyers negotiated with 49 2.393 1.369*** 2.292***
1.449 0.509 0.501
# Formal contracts in last season 50 0.607 0.302 0.091
0.629 0.264 0.309
# Informal contracts in last season 49 1.000 1.545*** 1.493**
1.544 0.534 0.553
# Value-adding activities (0–9) 51 3.214 0.307 1.060 1.231* 1.588
2.331 0.697 0.899 0.630 1.047
Note: This table shows the preliminary effects of having benefited from SPARK’s intervention on marketing outcomes. The analysis was carried out on cooperatives belonging to the restricted sample. In column (1), we report estimates obtained with a simple difference estimation strategy with no covariates. In column (2), we report coefficients obtained with the same design when the covariates (year of foundation (cat.), number of members (cat.) and 2013 revenue (cat.)) are added to the regression. In columns (3) and (4) we report, wherever possible, coefficients obtained with a DiD estimation strategy, with and without covariates. Robust standard errors are displayed below impact estimates. *, ** and *** denote significance at the 10, 5 and 1 per cent levels respectively.
Support programme in Rwanda.indd 28 22/06/2017 19:06

EVALUATING THE RESULTS OF AN AGRICULTURAL COOPERATIVE SUPPORT PROGRAMME
29
Figure 7 Evolution of the number of activities performed by treatment status
Figure 8 Evolution of the share of cooperatives that perform storing and marketing activities, by treatment status
5
4
3
2
1
1 10.9 0.90.8 0.80.7 0.70.6 0.60.5 0.50.4 0.40.3 0.30.2 0.20.1 0.1
0 0
2012
2012 20122013 20132014 20142015 20152016 2016
2013 2014 2015 2016
Year
–– Comparison –– Treatment-1 –– Treatment-2
Year Year
–– Comparison –– Treatment-1 –– Treatment-2 –– Comparison –– Treatment-1 –– Treatment-2
# Value adding activities (0-9)
Value adding activities: Storing (0/1) Value adding activities: Processing (0/1)
Note: This figure plots the evolution of the number of value-adding activities cooperatives offered to their members between 2012 and 2016 for both treatment cohorts and the comparison group. It aggregates the corresponding backward-looking questions for whether and, if so, when cooperatives started to offer a specific activity (up to nine distinct activities). The two horizontal lines correspond to the start of the training sessions for the first (June 2014) and second (January 2015) treatment cohorts.
[
Support programme in Rwanda.indd 29 22/06/2017 19:06
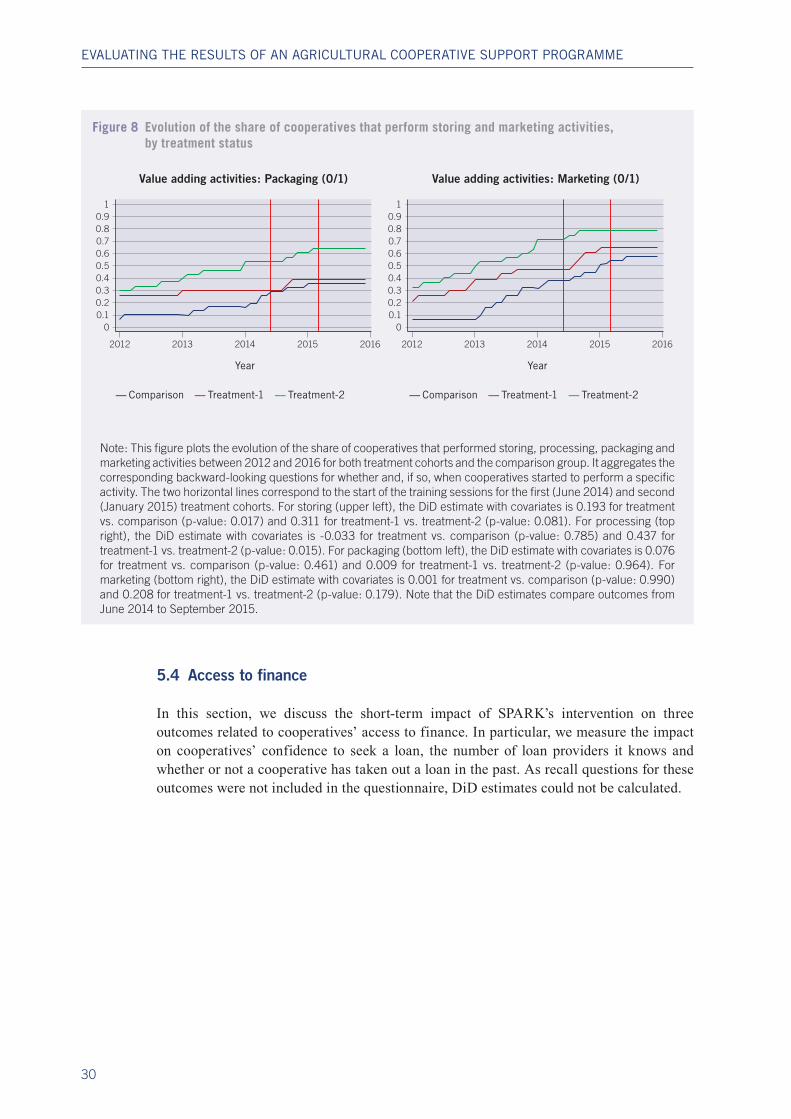
EVALUATING THE RESULTS OF AN AGRICULTURAL COOPERATIVE SUPPORT PROGRAMME
30
5.4 Access to finance
In this section, we discuss the short-term impact of SPARK’s intervention on three outcomes related to cooperatives’ access to finance. In particular, we measure the impact on cooperatives’ confidence to seek a loan, the number of loan providers it knows and whether or not a cooperative has taken out a loan in the past. As recall questions for these outcomes were not included in the questionnaire, DiD estimates could not be calculated.
Note: This figure plots the evolution of the share of cooperatives that performed storing, processing, packaging and marketing activities between 2012 and 2016 for both treatment cohorts and the comparison group. It aggregates the corresponding backward-looking questions for whether and, if so, when cooperatives started to perform a specific activity. The two horizontal lines correspond to the start of the training sessions for the first (June 2014) and second (January 2015) treatment cohorts. For storing (upper left), the DiD estimate with covariates is 0.193 for treatment vs. comparison (p-value: 0.017) and 0.311 for treatment-1 vs. treatment-2 (p-value: 0.081). For processing (top right), the DiD estimate with covariates is -0.033 for treatment vs. comparison (p-value: 0.785) and 0.437 for treatment-1 vs. treatment-2 (p-value: 0.015). For packaging (bottom left), the DiD estimate with covariates is 0.076 for treatment vs. comparison (p-value: 0.461) and 0.009 for treatment-1 vs. treatment-2 (p-value: 0.964). For marketing (bottom right), the DiD estimate with covariates is 0.001 for treatment vs. comparison (p-value: 0.990) and 0.208 for treatment-1 vs. treatment-2 (p-value: 0.179). Note that the DiD estimates compare outcomes from June 2014 to September 2015.
Figure 8 Evolution of the share of cooperatives that perform storing and marketing activities, by treatment status
1 10.9 0.90.8 0.80.7 0.70.6 0.60.5 0.50.4 0.40.3 0.30.2 0.20.1 0.1
0 0
2012 20122013 20132014 20142015 20152016 2016
Year Year
–– Comparison –– Treatment-1 –– Treatment-2 –– Comparison –– Treatment-1 –– Treatment-2
Value adding activities: Packaging (0/1) Value adding activities: Marketing (0/1)
Support programme in Rwanda.indd 30 22/06/2017 19:06

EVALUATING THE RESULTS OF AN AGRICULTURAL COOPERATIVE SUPPORT PROGRAMME
31
Table 7 Outcome analysis – access to finance
Simple. diff. DiD
VariablesN Mean and std.
dev. comparison group
No covariates
With covariates
No covariates
With covariates
Treatment vs. comparison group
Confidence to seek loan (1–5) 82 3.742 0.278 0.329
1.094 0.232 0.230
# Knows sources to seek loan (0–5) 82 1.839 0.024 -0.019
0.779 0.177 0.181
Ever applied for a loan 82 0.613 0.073 0.004
0.495 0.110 0.116
Took loan out in past year 82 0.677 0.028 0.076
0.475 0.107 0.109
Cohort 1 vs. cohort 2
Confidence to seek loan (1–5) 51 4.036 -0.036 0.076
0.881 0.251 0.351
# Knows sources to seek loan (0–5) 51 1.964 -0.225 -0.137
0.793 0.217 0.278
Ever applied for a loan 51 0.679 0.017 0.053
0.476 0.133 0.166
Took loan out in past year 51 0.750 -0.098 -0.064
0.441 0.131 0.150
Note: This table shows the preliminary effects of having benefited from SPARK’s intervention on outcomes relating to access to finance. The analysis was carried out on cooperatives belonging to the restricted sample. In column (1), we report estimates obtained with a simple difference estimation strategy with no covariates. In column (2), we report coefficients obtained with the same design when the covariates (year of foundation (cat.), number of members (cat.) and 2013 revenue (cat.)) are added to the regression. In columns (3) and (4) we report, wherever possible, coefficients obtained with a DiD estimation strategy, with and without covariates. Robust standard errors are displayed below impact estimates. *, ** and *** denote significance at the 10, 5 and 1 per cent levels respectively.
Table 7 presents simple difference estimates with and without covariates and shows that differences between the treatment and comparison groups appear to be limited. All estimates are small and/or insignificant. However, cooperatives appear confident enough to seek a loan without benefiting from the intervention – comparison cooperatives reported a confidence level of 3.7 out of 5 – leaving little room for improvement. Moreover, 68 per cent of cooperatives in the comparison group (75 per cent in the second treatment cohort) had taken out a loan in the previous year. Finally, without more information on the financial needs of the cooperatives in the study, it is unclear to what extent having more of them take out loans would be a desirable outcome.
Support programme in Rwanda.indd 31 22/06/2017 19:06

EVALUATING THE RESULTS OF AN AGRICULTURAL COOPERATIVE SUPPORT PROGRAMME
32
There is some indication that the intervention may have improved cooperatives’ financial management. Comparing the treatment and comparison groups, the data suggest that the intervention has increased the share of cooperatives that have implemented a financial policy (that is, written rules governing the financial management decisions made by a cooperative). In Figure 9, we depict the evolution of the share of cooperatives that have implemented a financial policy across time. This appears to be roughly parallel in the treatment and comparison groups prior to the beginning of the intervention, suggesting that DiD estimates may also be used to measure the intervention’s impact.
We also compare cohort 1 and cohort 2 cooperatives and find that benefiting from the intervention earlier on has no impact on whether a cooperative has implemented a financial policy. This suggests that, while a financial policy may be adopted soon after the beginning of the intervention, hiring a financial manager may take more time and may only happen in the longer run.
5.5 Financial management
In Table 8, we analyse the short-term impact of SPARK’s intervention on two indicators pertaining to cooperatives’ financial management: whether or not the cooperative has hired a financial manager and whether or not it has set up financial guidelines.
Table 8 Outcome analysis – financial management
Simple. diff. DiD
Variables NMean and std.
dev. comparison group
No covariates
With covariates
No covariates
With covariates
Treatment vs. comparison group
Financial manager 82 0.677 -0.011 0.002
0.475 0.108 0.115
Financial policy 82 0.871 0.090 0.109** 0.092 0.122*
0.341 0.067 0.051 0.068 0.065
Cohort 1 vs. cohort 2
Financial manager 51 0.607 0.132 0.025
0.497 0.133 0.178
Financial policy 51 0.929 0.071 0.062 0.031 0.046
0.262 0.050 0.047 0.105 0.119
Note: This table shows the preliminary effects of having benefited from SPARK’s intervention on financial management outcomes. The analysis was carried out on cooperatives belonging to the restricted sample. In column (1), we report estimates obtained with a simple difference estimation strategy with no covariates. In column (2), we report coefficients obtained with the same design when the covariates (year of foundation (cat.), number of members (cat.) and 2013 revenue (cat.)) are added to the regression. In columns (3) and (4) we report, wherever possible, coefficients obtained with a DiD estimation strategy, with and without covariates. Robust standard errors are displayed below impact estimates. *, ** and *** denote significance at the 10, 5 and 1 per cent levels respectively.
Support programme in Rwanda.indd 32 22/06/2017 19:06

EVALUATING THE RESULTS OF AN AGRICULTURAL COOPERATIVE SUPPORT PROGRAMME
33
Figure 9 Evolution of the share of cooperatives that have adopted a financial policy
Year
–– Comparison –– Treatment-1 –– Treatment-2
Financial policy (0/1)
Note: This figure plots the evolution of the share of cooperatives that had a financial policy in place between 2012 and 2016. It aggregates the corresponding backward-looking questions for whether and, if so, when cooperatives established such a practice. The two horizontal lines correspond to the start of the training sessions for the first (June 2014) and second (January 2015) treatment cohorts. The corresponding DiD estimates are given in Table 8.
1
0.9
0.8
0.7
0.6
0.5
0.4
0.3
0.2
0.1
0
2012 2013 2014 2015 2016
Support programme in Rwanda.indd 33 22/06/2017 19:06

Support programme in Rwanda.indd 34 22/06/2017 19:06

35
Section 6: Conclusion
In Rwanda, agricultural cooperatives have the potential to be important instruments for creating employment and reducing poverty over the coming decades. However, many Rwandan agricultural cooperatives are still in an early stage of development and, to have a greater impact on alleviating poverty, they will need to continue to improve their business practices and competitiveness. Among other things, their productivity will depend on their ability to reduce post-harvest losses and increase access to markets.25
In this report, we aim to quantify the short-term impacts of the intervention delivered by the NGO SPARK, which offers business support to cooperatives in Rwanda. As part of this intervention, certified coaches train various cooperative managers in a range of areas pertaining to management, marketing, financial literacy, access to finance, and financial management. These managers are then coached throughout the length of the intervention by their trainer, who helps them implement changes in their cooperative, as well as undertake value-adding activities related to their production and marketing strategies. In addition, cooperatives are put in touch with microfinance institutions and other actors within their supply chain to create partnerships and secure contracts.
The high uptake of the programme by treatment cooperatives and their positive assessment of the impact of the intervention suggest that there was a demand for the types of support offered by SPARK. Taken together, the cooperatives in this study that received support from SPARK represent more than 20,000 members and more than 2,000 employees, the majority of whom are women and young workers in small and medium-sized cooperatives. The implementation of the intervention respected the needs of cooperatives, and a value chain analysis was conducted to ensure the programme was designed effectively. This identified the “high value” crops of maize, beans and Irish potatoes to allow targeting of the types of cooperatives that most needed support.
Regarding short-term results, our analysis suggests that the intervention may have induced cooperatives to increase their management activities – as shown through the establishment of additional sub-committees – as well as the portfolio of activities they perform. For example, we discovered that cohort 1 cooperatives were more likely than cohort 2 cooperatives to perform storing and processing activities. We also found that cohort 1 cooperatives had negotiated with a greater number of buyers than cohort 2 cooperatives, leading to a larger number of contracts being signed. In the longer run, it will be interesting to investigate whether these effects persist and whether they translate into higher and/or more stable revenues for treatment cooperatives. The fact that differences could be found between cooperatives that had benefited from the intervention earlier on and those that had benefited later suggests that some of the impacts may take time to materialize. This will
25 See Ishihara et al. (footnote 1).
Support programme in Rwanda.indd 35 22/06/2017 19:06

EVALUATING THE RESULTS OF AN AGRICULTURAL COOPERATIVE SUPPORT PROGRAMME
36
necessitate the collection of additional data to allow us to examine the long-term impacts of the intervention.
However, no impact could be found on the other outcomes investigated as part of this report, such as the number of services offered to cooperative members or cooperatives’ access to finance. Unfortunately, the survey’s sampling strategies and the small size of the study sample limit the precision and validity of our estimates, as well as their interpretation as causal impacts of the intervention.
While this paper reports on the short-term results of SPARK’s CSP, a second follow-up survey was conducted in late 2016 to provide more comprehensive insights into the results of the intervention over time. Results of this endline survey will be available in 2017.
Support programme in Rwanda.indd 36 22/06/2017 19:06

37
Appendix
Table A1 Background characteristics – first vs. second treatment cohort
Full sample Restricted sample
Variables N Mean – treatment
Mean – comp.
p-value N Mean – treatment
Mean – comp.
p-value
Founded >2010 71 0.286 0.306 0.857 51 0.217 0.321 0.412
Founded 2005–09 71 0.543 0.667 0.293 51 0.565 0.643 0.582
Founded 2000–04 71 0.143 0.028 0.086* 51 0.174 0.036 0.124
Founded <2000 71 0.029 0.000 0.321 51 0.043 0.000 0.321
Legally registered (June 2014) 71 0.971 0.972 0.984 51 0.957 0.964 0.891
Financial policy (June 2014) 71 0.800 0.750 0.620 51 0.826 0.786 0.722
Financial records (June 2014) 71 0.857 0.806 0.568 51 0.826 0.786 0.722
# Members (2013) 68 332 208 0.354 51 590 1100 0.038
Members: 0–49 68 0.455 0.229 0.051* 51 0.652 0.250 0.004**
Members: 50 68 0.182 0.314 0.211 51 0.217 0.393 0.179
Members: 100–499 68 0.152 0.371 0.039 51 0.130 0.357 0.058*
Members: 500+ 68 0.152 0.057 0.212 51 0.000 0.000 –
Members: 1,000+ 68 0.061 0.029 0.532 51 0.000 0.000 –
Revenue (2013) in 1,000 RWF 69 12,869 17,578 0.599 49 2,5090 3,461 0.532
Revenue: 0–500 69 0.206 0.257 0.620 49 0.318 0.333 0.913
Revenue: 500–5,000 69 0.471 0.343 0.287 49 0.545 0.444 0.492
Revenue: 5,000–25,000 69 0.176 0.200 0.806 49 0.136 0.222 0.442
Revenue: 25,000+ 69 0.147 0.200 0.568 49 0.000 0.000 –
Activities (June 2014)
At least one sub-committee 71 0.943 0.972 0.547 51 1.000 0.964 0.323
# Sub-committees (0–7) 71 3.086 3.278 0.504 51 3.304 3.250 0.858
At least one service 71 0.943 0.889 0.419 51 0.913 0.929 0.843
# Services for members (0–7) 71 2.057 2.083 0.934 51 1.739 2.214 0.159
At least one activity 71 0.857 0.917 0.436 51 0.826 0.893 0.509
# Value-adding activities (0–9) 71 3.543 4.028 0.426 51 2.826 3.750 0.190
Support programme in Rwanda.indd 37 22/06/2017 19:06
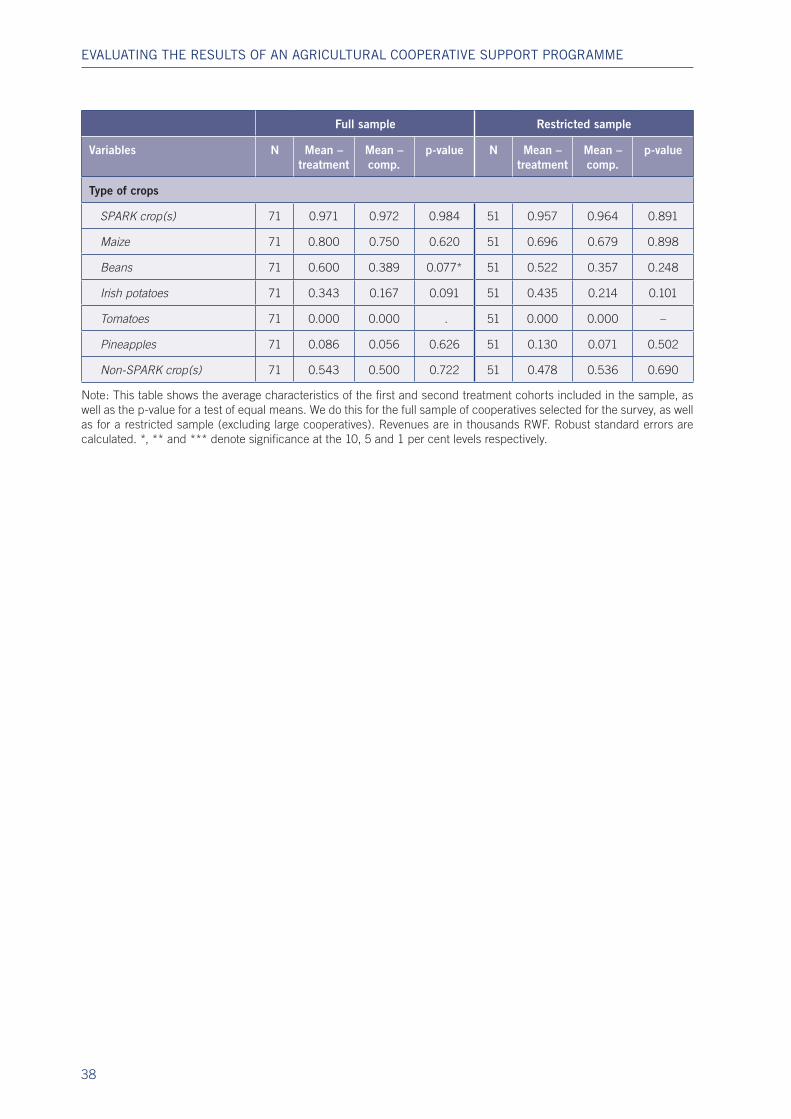
EVALUATING THE RESULTS OF AN AGRICULTURAL COOPERATIVE SUPPORT PROGRAMME
38
Full sample Restricted sample
Variables N Mean – treatment
Mean – comp.
p-value N Mean – treatment
Mean – comp.
p-value
Type of crops
SPARK crop(s) 71 0.971 0.972 0.984 51 0.957 0.964 0.891
Maize 71 0.800 0.750 0.620 51 0.696 0.679 0.898
Beans 71 0.600 0.389 0.077* 51 0.522 0.357 0.248
Irish potatoes 71 0.343 0.167 0.091 51 0.435 0.214 0.101
Tomatoes 71 0.000 0.000 . 51 0.000 0.000 –
Pineapples 71 0.086 0.056 0.626 51 0.130 0.071 0.502
Non-SPARK crop(s) 71 0.543 0.500 0.722 51 0.478 0.536 0.690
Note: This table shows the average characteristics of the first and second treatment cohorts included in the sample, as well as the p-value for a test of equal means. We do this for the full sample of cooperatives selected for the survey, as well as for a restricted sample (excluding large cooperatives). Revenues are in thousands RWF. Robust standard errors are calculated. *, ** and *** denote significance at the 10, 5 and 1 per cent levels respectively.
Support programme in Rwanda.indd 38 22/06/2017 19:06

Support programme in Rwanda.indd 39 22/06/2017 19:06

Support programme in Rwanda.indd 40 22/06/2017 19:06

Evaluating the results of an agricultural cooperative support programmeBusiness practices, access to fi nance, youth employmentJanuary 2017
TAQEEM INITIATIVE
Impact Report Series, Issue 5
Support programme in Rwanda_Cover.indd 1 22/06/2017 19:06