evaluating youth and system outcomes in the louisiana ... · for child welfare involved youths •...
TRANSCRIPT

Eric J. Bruns, Michael D. Pullmann, Spencer Hensley Univ of Washington Jody Levison-Johnson, Connie Goodson, Louisiana DHH – OBH
EVALUATING YOUTH AND SYSTEM OUTCOMES IN THE LOUISIANA COORDINATED SYSTEM OF
CARE (CSOC)
Louisiana CSOC Governance Board Meeting January 30, 2013
1

BACKGROUND
• The Louisiana Coordinated System of Care • CSoC is currently being implemented in 5 regions of the
state. An additional 5 regions are not implementing CSoC services.
• Youths with significant behavioral health challenges who are eligible for CSoC but are out of region are offered admittance into the Magellan Resiliency Care Management (RCM) program. • RCM is an intensive care management approach used by Magellan to
offer enhanced supports to youth with complex needs.
2

BACKGROUND
• The Louisiana CSoC represents a milestone in children’s behavioral health in the United States
• CSoC is an innovative reflection of two powerful movements in American health care: • Coordination of care for individuals with complex needs • Patient-/ youth-/ family-directed care
3
COORDINATION OF CARE
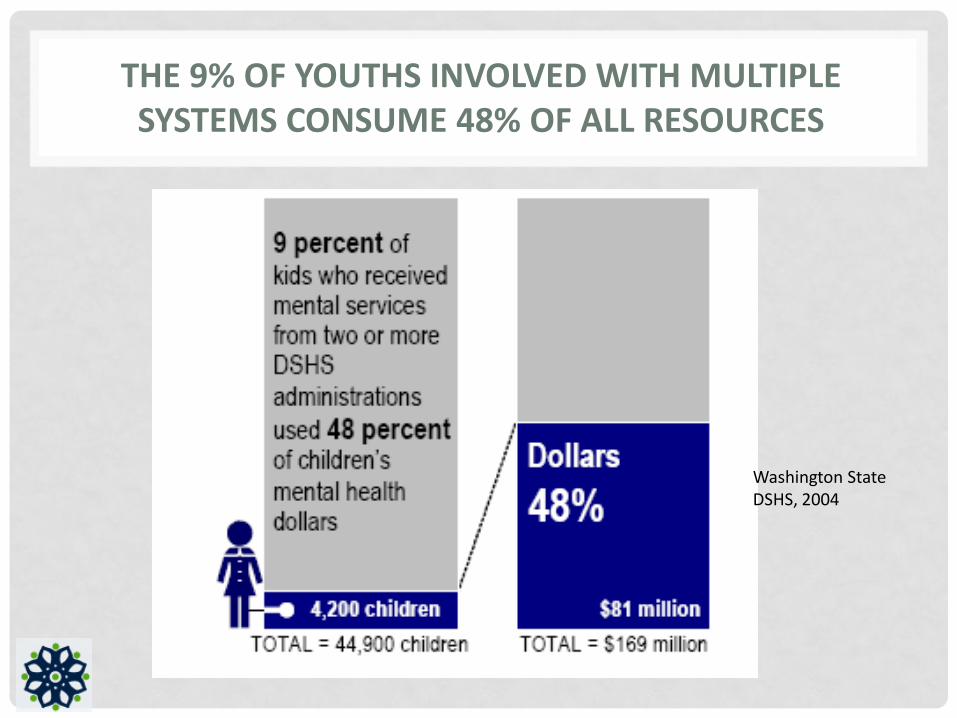
THE 9% OF YOUTHS INVOLVED WITH MULTIPLE SYSTEMS CONSUME 48% OF ALL RESOURCES
Washington State DSHS, 2004

68% OF YOUTHS INVOLVED IN MULTIPLE SYSTEMS PLACED OUT OF HOME IN A GIVEN YEAR
Washington State DSHS, 2004

TRADITIONAL SERVICES RELY ON PROFESSIONALS AND RESULT IN MULTIPLE PLANS
Behavioral Health
Juvenile Justice
Education Child welfare
YOUTH FAMILY
Plan 1 Plan 2 Plan 3 Plan 4
Medicaid
Plan 5
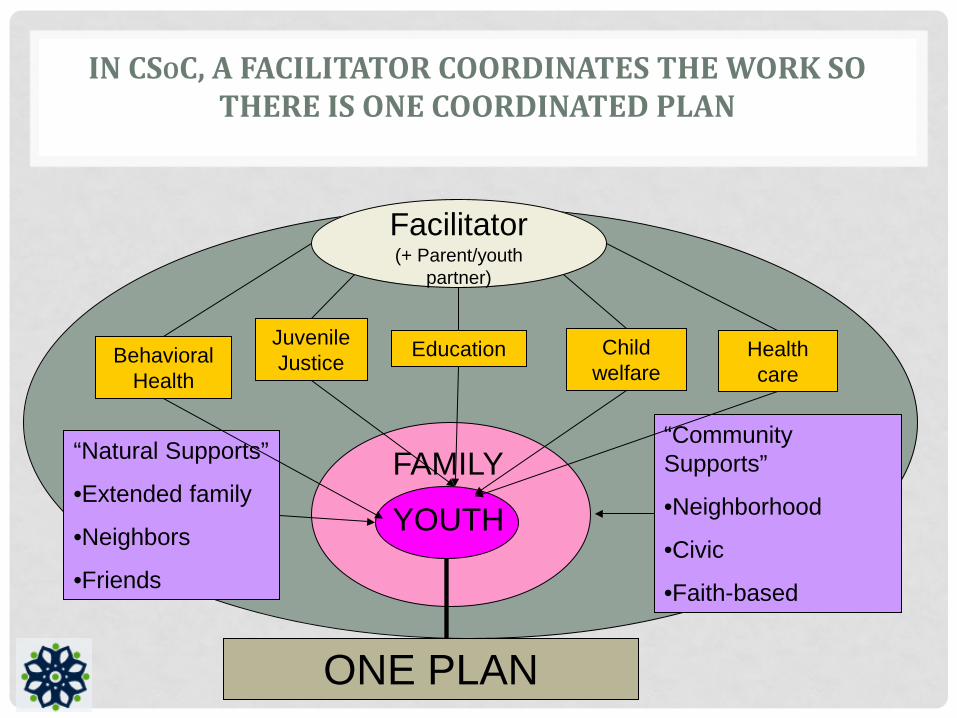
IN CSOC, A FACILITATOR COORDINATES THE WORK SO THERE IS ONE COORDINATED PLAN
Behavioral Health
Juvenile Justice Education Child
welfare
Facilitator (+ Parent/youth
partner)
YOUTH
FAMILY “Natural Supports”
•Extended family
•Neighbors
•Friends
“Community Supports”
•Neighborhood
•Civic
•Faith-based
ONE PLAN
Health care
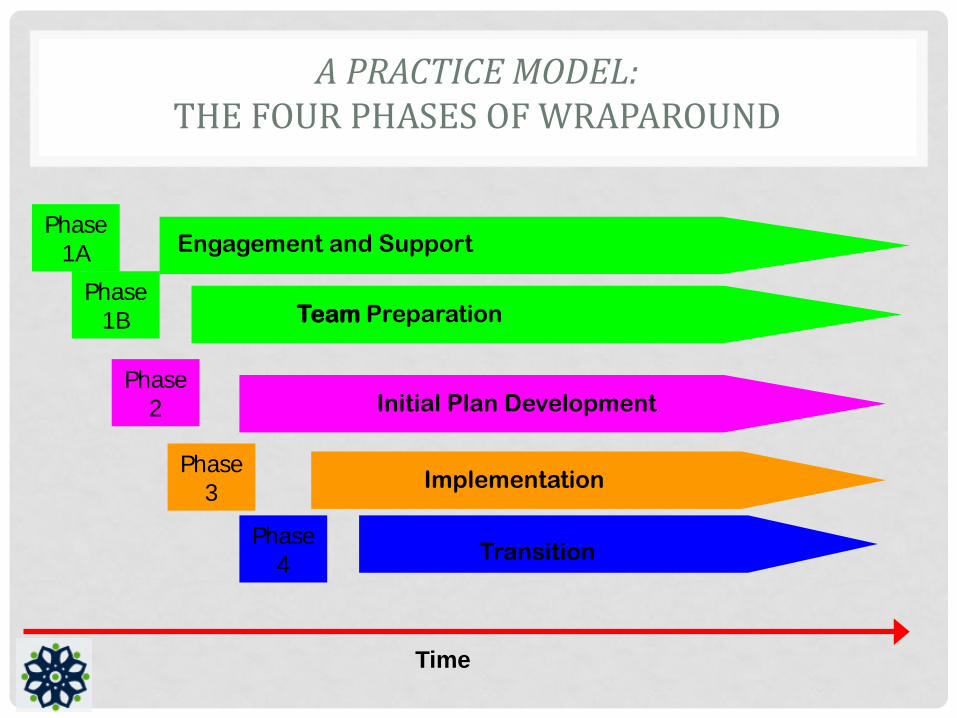
A PRACTICE MODEL: THE FOUR PHASES OF WRAPAROUND
Time
Engagement and Support
Team Preparation
Initial Plan Development
Implementation
Transition
Phase1A
Phase1B
Phase2
Phase3
Phase4
10
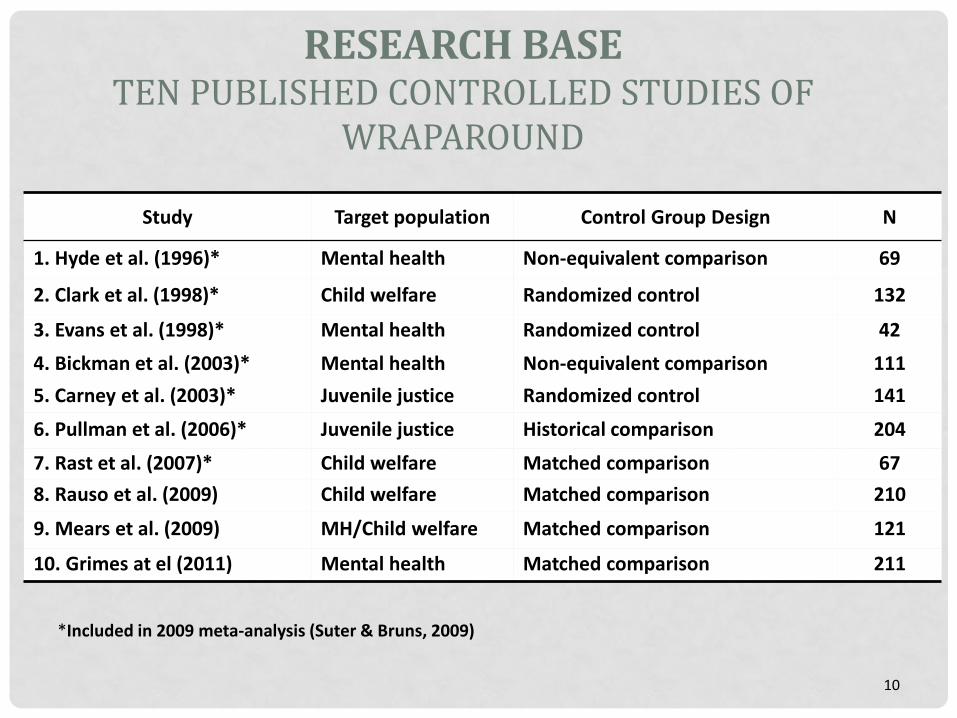
RESEARCH BASE TEN PUBLISHED CONTROLLED STUDIES OF
WRAPAROUND
Study Target population Control Group Design N
1. Hyde et al. (1996)* Mental health Non-equivalent comparison 69
2. Clark et al. (1998)* Child welfare Randomized control 132
3. Evans et al. (1998)* Mental health Randomized control 42 4. Bickman et al. (2003)* Mental health Non-equivalent comparison 111 5. Carney et al. (2003)* Juvenile justice Randomized control 141
6. Pullman et al. (2006)* Juvenile justice Historical comparison 204
7. Rast et al. (2007)* Child welfare Matched comparison 67 8. Rauso et al. (2009) Child welfare Matched comparison 210
9. Mears et al. (2009) MH/Child welfare Matched comparison 121
10. Grimes at el (2011) Mental health Matched comparison 211
*Included in 2009 meta-analysis (Suter & Bruns, 2009)
OUTCOMES OF WRAPAROUND (10 CONTROLLED, PUBLISHED STUDIES TO DATE; BRUNS & SUTER, 2010)
• Better functioning and mental health outcomes
• Reduced recidivism and better juvenile justice outcomes
• Increased rate of case closure for child welfare involved youths
• Reduction in costs associated with residential placements

COSTS AND RESIDENTIAL OUTCOMES OF WRAPAROUND ARE ROBUST
• Wraparound Milwaukee • Reduced psychiatric hospitalization from 5000 to less than 200 days
annually
• Reduced average daily residential treatment facility population from 375 to 50 (Kamradt & Jefferson, 2008)
• Controlled study of Mental Health Services Program for Youth in Massachusetts (Grimes, 2011)
• 32% lower emergency room expenses
• 74% lower inpatient expenses than matched youths
• CMS Psychiatric Residential Treatment Facility Waiver Demonstration project (Urdapilleta et al., 2011)
• Average per capita savings by state ranged from $20,000 to $40,000
12
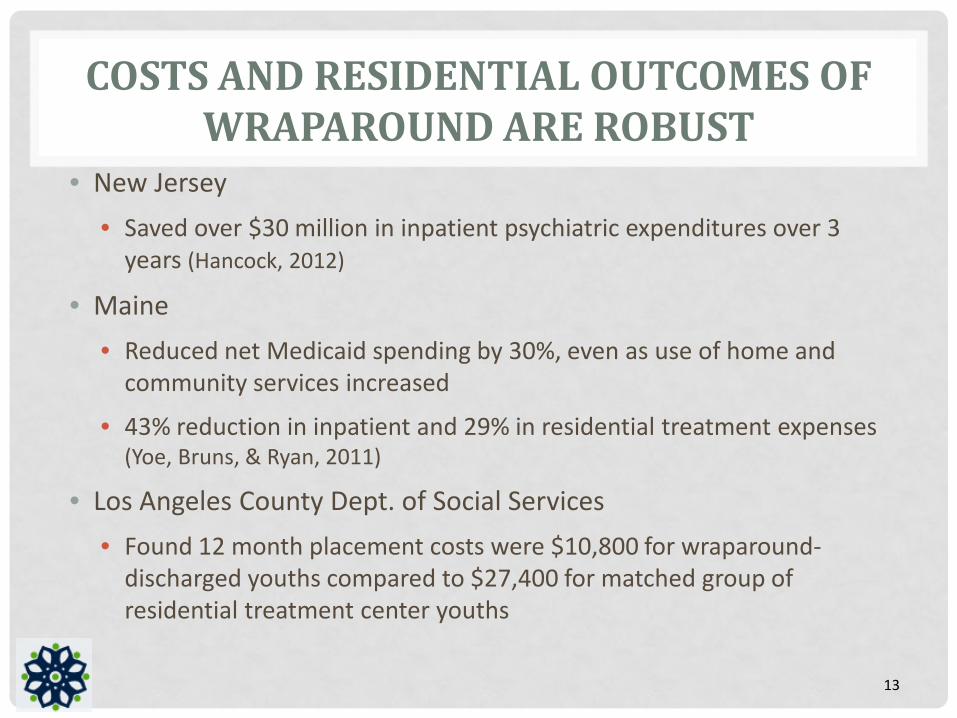
COSTS AND RESIDENTIAL OUTCOMES OF WRAPAROUND ARE ROBUST
• New Jersey • Saved over $30 million in inpatient psychiatric expenditures over 3
years (Hancock, 2012)
• Maine • Reduced net Medicaid spending by 30%, even as use of home and
community services increased
• 43% reduction in inpatient and 29% in residential treatment expenses (Yoe, Bruns, & Ryan, 2011)
• Los Angeles County Dept. of Social Services • Found 12 month placement costs were $10,800 for wraparound-
discharged youths compared to $27,400 for matched group of residential treatment center youths
13

WRAPAROUND IS INCREASINGLY CONSIDERED “EVIDENCE BASED”
• State of Oregon Inventory of Evidence-Based Practices (EBPs) • California Clearinghouse for Effective Child Welfare Practices • Washington Institute for Public Policy: “Full fidelity
wraparound” is a research-based practice
14
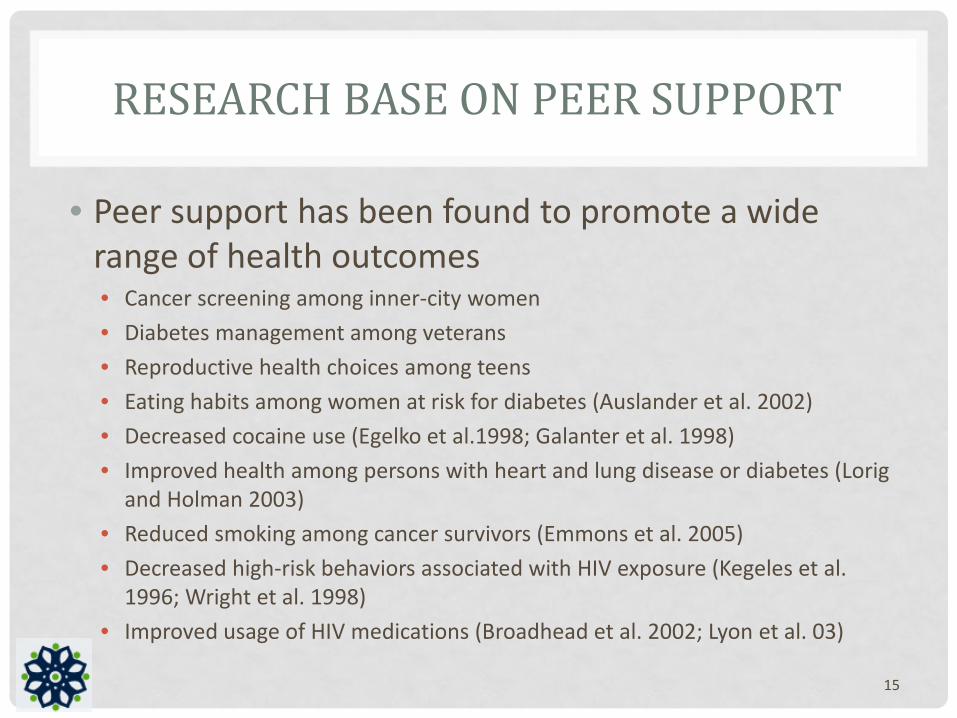
RESEARCH BASE ON PEER SUPPORT
• Peer support has been found to promote a wide range of health outcomes • Cancer screening among inner-city women • Diabetes management among veterans • Reproductive health choices among teens • Eating habits among women at risk for diabetes (Auslander et al. 2002) • Decreased cocaine use (Egelko et al.1998; Galanter et al. 1998) • Improved health among persons with heart and lung disease or diabetes (Lorig
and Holman 2003) • Reduced smoking among cancer survivors (Emmons et al. 2005) • Decreased high-risk behaviors associated with HIV exposure (Kegeles et al.
1996; Wright et al. 1998) • Improved usage of HIV medications (Broadhead et al. 2002; Lyon et al. 03)
15
FAMILY TO FAMILY PEER SUPPORT IN CHILDREN’S BEHAVIORAL HEALTH
“The careful studies that have been undertaken to date identify unequivocal improvements in outcomes such as retention in services, knowledge about mental health issues, self-efficacy, and improved family interactions – all outcomes that are essential ingredients to quality care.” --Hoagwood, 2005
16

THE NEED FOR LOCAL EVALUATION
• Positive cost and youth outcomes of coordinated systems of care / wraparound are far from guaranteed.
• Outcomes are dependent on: • Population of youth and families actually served • System conditions
• Fiscal model • Availability and accessibility of services • Level of interagency collaboration
• Adequacy of training, coaching, and supervision • Quality and fidelity of practice of “real world” implementation
17

BACKGROUND AND PURPOSE
• The University of Washington (UW) Wraparound Evaluation and Research Team (WERT) has been a partner in evaluating the CSoC initiative as part of the Technical Assistance being provided by the University of Maryland Institute for Innovation & Implementation
• We are already evaluating: • Quality and impact of training and TA provided to LA by the Institute • Skill level of providers (e.g., care coordinators) • Wraparound implementation quality and fidelity
• The critical next step: Impacts of CSoC on youth outcomes, system outcomes, and costs.
18

THE OPPORTUNITY
• We have an excellent opportunity to conduct a rigorous and valid study for several reasons: • CSoC will roll out by regions, with some regions
implementing CSoC and others continuing to use services as usual for a period of time • This provides and excellent opportunity to compare outcomes
and costs across CSoC and non-CSoC regions • Efforts to work with the CSoC QA team to confirm research
questions and identify administrative data available for evaluation of impact is already underway
19

RESEARCH QUESTIONS W H AT W E WA N T TO K N O W
20
RESEARCH QUESTIONS
• The evaluation study is focused on evaluating the impact of
the Louisiana CSoC on two broad domains: 1. Impact on individual (youth and family) outcomes 2. Impact on system (e.g., residential and cost) outcomes
21

RESEARCH QUESTIONS
• Within these domains, there are three research questions. • Two are related to Individual Youth Outcomes. • One is related to System Outcomes.
22

RESEARCH QUESTIONS 1-2: YOUTH OUTCOMES
• Youth Outcomes 1. Do youths enrolled in the CSoC experience improved outcomes over
time in areas such as child functioning, youth/family needs and strengths, residential placement and stability, and school achievement and attendance?
2. Do youths enrolled in the CSoC experience better individual outcomes over time, compared to similar youths who are not in CSoC services (i.e., who are in non-CSoC regions)?
23

RESEARCH QUESTION 3: SYSTEM OUTCOMES
• System Outcomes 3. Compared to non-CSoC regions, do CSoC regions demonstrate better
system outcomes such as lower overall rates of use of restrictive residential placements, crisis intervention, and emergency room use; lower overall costs of service; and lower rates of school suspension, juvenile justice commitment, juvenile justice recidivism, and reports of child abuse and neglect?
24

OVERVIEW OF METHOD H O W W E P R O P O S E TO E VA LUAT E I M PA C T
25
METHOD
• The evaluation will conduct two linked studies to address the research questions: • Study 1 (Individual outcomes): Retrospective data analysis
using administrative data and retrospective multilevel propensity score matching.
• Study 2 (System Outcomes): Using regional-level data to compare system differences.
26

METHOD – STUDY 1
27

METHOD – STUDY 1
• Study 1 uses existing administrative data. • The study will match CSoC youth and comparison youth.
• To identify this matched comparison sample, we will first select all youth in non-CSoC regions who meet criteria for CSoC services. From this sample, we will build a multilevel propensity score model. • This means we will look at variables (e.g., age, gender, functioning) on which
we might need to statistically control in order to rigorously compare CSoC to non-CSoC youths
• We will match based on both individual and regional characteristics.
28

METHOD – STUDY 1
• The following data elements are proposed for matching: • CANS screening and/or full assessment (at baseline) • Age, sex, race/ethnicity, • GAF score, • Medicaid status, • Presenting problem, disability, and diagnostic category, • Referring agency, • Residential status, • Admission driver, • Substance use disorder (SUDS) services use, • Pregnancy/marital status, • Whether the child has a PCP, and • Regional characteristics (e.g., county rurality, poverty rate, and
employment rate)
29

METHOD – STUDY 1
• After the youth are identified, we will obtain administrative records from the data systems of child welfare, juvenile justice, public education, and mental health. • Large sample sizes ensure ample statistical power
• Because administrative data will be de-identified to the UW team and collected as part of the usual functioning of the Louisiana child serving systems, we will not need to secure consent for individual youth.
• Because our evaluation team will not have permission to see the names of youth, we will need help from our Louisiana partners to retrieve and de-identify these data. • We will discuss options for doing this a little later…
30

METHOD – STUDY 2
31

METHOD – STUDY 2
• Study 2 will examine the broader systemic impact of the CSoC, by region.
• We will examine whether there are differences in system outcomes over time for CSoC vs. non-CSoC regions in areas such as less use of restrictive residential placements, crisis intervention, emergency room use, and community re-entry for youth who have been placed out of home. • Statistical power permitting, we will control for important regional-level
covariates that may be related to these variables, such as rurality, poverty rate, and employment rates.
32
HYPOTHESIZED EFFECTS
33

HYPOTHESIZED EFFECTS
• Individual Outcomes • We would hypothesize that CSoC youths demonstrate better outcomes
compared to statistically matched non-CSoC youths.
• System Outcomes • We would hypothesize that CSoC regions would demonstrate positive
outcomes (e.g., reductions in costs or out of home placement rates) region-wide that occur after implementation of the CSoC. • Demonstration of these system outcomes at initiation of the CSoC services
in three regions would increase our confidence that the change was due to the CSoC initiative.
34

HYPOTHESIZED EFFECTS
35
CSoC starts in Phase 1 regions
CSoC starts in Phase 2 regions

PROPOSED OUTCOMES AND DATA SOURCES
B A S E D O N O U R W O R K W I T H C S O C T H U S FA R
36

PROPOSED OUTCOMES, DATA ELEMENTS, AND DATA SOURCES
Outcomes and data elements (examples) Data Source CSoC Reduction in number of youths in residential
settings • Admissions to residential settings • Restrictiveness of living settings for youths
Medicaid, OJJ, and DCFS admin data
Improved functional outcomes for youth and caregivers • CANS total and subscale scores
CANS data for CSoC enrolled youths
Reduction in costs of services • Emergency Department Admissions • Community Resource Utilization –MH services • Admission (and re-admission) rates to
inpatient facilities
Medicaid and other costs admin data
37

PROPOSED OUTCOMES, DATA ELEMENTS, AND DATA SOURCES
Outcomes and data elements (examples) Data Source
DCFS Reduced placement disruptions/multiple placements • Number of placements
Medicaid, OJJ, and DCFS admin data
Increased placement stability in family home settings
DCFS administrative data
Reduced service in inpatient and congregate settings • Rate of inpatient/ congregate care • Days of service in inpatient/congregate
Medicaid and DCFS admin data
Length of stay in out-of-home care DCFS administrative data
Reduced incidence of crisis episodes Medicaid & DCFS admin data Reduced rates of subsequent maltreatment events
DCFS administrative data
Increased monitoring of psychotropic medication
DCFS administrative data 38

PROPOSED OUTCOMES, DATA ELEMENTS, AND DATA SOURCES
Outcomes and data elements (examples) Data Source
Magellan Improved interpersonal and social skills • CANS scores
CANS data for CSoC enrolled youths
Improved parental ability to manage behaviors • CANS scores
CANS data for CSoC enrolled youths
39

PROPOSED OUTCOMES, DATA ELEMENTS, AND DATA SOURCES
Outcomes and data elements (examples) Data Source DOE Reduction in school suspensions and expulsions
• Number of disciplinary actions (suspensions, expulsions)
DOE administrative data
Increased school achievement • Attendance • Grades (GPA) • Standardized Test Scores
o Growth or number meeting cutoffs
DOE state assessment data
40

PROPOSED OUTCOMES, DATA ELEMENTS, AND DATA SOURCES
Outcomes and data elements (examples) Data Source
OJJ Increased community-based services for youth on probation • Number of available services • Number of services used by youths on
probation
OJJ and Medicaid admin data
Shorter length of stay in congregate care settings
OJJ administrative data
Fewer youths in secure care OJJ administrative data Decreased justice system contact • All referrals • Filed petitions • Adjudicated delinquent
OJJ administrative data
41
PROPOSED OUTCOMES AND DATA SOURCES
W E N E E D YO U R H E L P W I T H T H I S !
42

DATA SHARING OPTIONS
• (Preferred) Option 1: • Magellan creates a Proxy ID for all youth. • Magellan provides each system with identifying information for ALL
CSoC youth and the entire pool of possible comparison youth. • Each system pulls the relevant data out, de-identifies it, and sends it
directly to The University of Washington. • The University of Washington combines the data from all the systems.
43

DATA SHARING OPTIONS
• Option 2: • Magellan creates a Proxy ID for all youth. • Magellan identifies the referring system for each youth (DCFS, OJJ, or
DOE). • Magellan provides each system with identifying information for those
youth referred by their system as well as a subset of possible comparison youth based on referring system
• Each system pulls the relevant data out, de-identifies it, and sends it directly to The University of Washington.
• The University of Washington combines the data from all the systems.
• Note: This options has some methodological shortcomings
44

DATA SHARING OPTIONS
• Option 3: • Magellan creates a Proxy ID for all youth. • Magellan provides UW with demographic and mental health service
data for ALL CSoC youth and the entire pool of possible comparison youth.
• UW uses this data to match CSoC youth with comparison youth, reducing the pool of comparison youth.
• UW informs Magellan which comparison youth were matched • Magellan provides each system with identifying information for those
youth selected in UW’s matching process. • Each system pulls the relevant data out, de-identifies it, and sends it
directly to The University of Washington. • The University of Washington combines the data from all the systems.
45

QUESTIONS FOR THE COMMITTEE
• Given previous Governance Board approval of this study: • Will this outcomes evaluation provide the information needed by
stakeholders in Louisiana? • Do these research questions and methods seem appropriate? • Which data sharing option should be used? • What are the next steps?
46