evaluation by decision makers - cordis · evaluation by decision makers 8/33 newsreader: ict-316404...
TRANSCRIPT
Evaluation by decision makers Deliverable D8.2.1
Authors: Pim Stouten1, Rutger Kortleven1, Thomas Ploeger2 Affiliation: (1) LexisNexis, (2) SynerScope
BUILDING STRUCTURED EVENT INDEXES OF LARGE
VOLUMES OF FINANCIAL AND ECONOMIC DATA FOR
DECISION MAKING
ICT 316404
Evaluation by decision makers 2/33
NewsReader: ICT-316404 14 Apr 14
Grant Agreement No. 316404
Project Acronym NEWSREADER
Project full title Building structured event indexes of large volumes of financial and economic data for decision making.
Funding Scheme FP7-ICT-2011-8
Project Website http://www.newsreader-project.eu
Project Coordinator Prof. dr. Piek T. J. M. Vossen VU University Amsterdam Tel. +31 (0) 20 5986466 Fax. +31 (0) 20 5986500 Email: [email protected]
Document Number Deliverable D8.2.1
Status & Version First draft, version 0.5
Contractual Date of Delivery February 2014
Actual Date of Delivery February 3rd , 2014
Type Report
Security (distribution level) Public
Number of Pages 33
WP Contributing to the deliverable WP8
WP Responsible WP8
EC Project Officer Susan Fraser
Authors: Pim Stouten1, Rutger Kortleven1, Thomas Ploeger2
Keywords: information delivery solutions, evaluation, baseline system, decision support tool, participants
Evaluation by decision makers 3/33
NewsReader: ICT-316404 14 Apr 14
Abstract: This document describes the progress made in the first 13 months of the project for the first task for Work Package 8, task 2: Evaluation by decision makers. Goal of this task is to use LexisNexis’ customer base to select a group of decision makers for evaluation workshops and use their feedback to define use cases for NewsReader, as well as optimizing the NewsReader tools and applications.
This particular deliverable consists of an evaluation of first versions of the decision support systems: the baseline systems were tested during an evaluation workshop organized by LN in collaboration with SYN and VUA.
The evaluators were exposed to three different systems (Section 2 of this document), and given identical tasks (see Section 3) to be solved with the various systems. The evaluation outcomes are covered in Section 4, with background information on the process and outcomes covered in the appendices at the end of this document.
Sections 5 and 6 contain our conclusions, plus lessons learned and recommendations for the evaluation sessions scheduled for Y2 of the project.
Evaluation by decision makers 4/33
NewsReader: ICT-316404 14 Apr 14
Executive Summary/Abstract
This document describes the progress made in the first 13 months of the project for the first task for Work Package 8, task 2: Evaluation by decision makers. Goal of this task is to use LexisNexis’ customer base to select a group of decision makers for evaluation workshops and use their feedback to define use cases for NewsReader, as well as optimizing the NewsReader tools and applications.
This particular deliverable consists of an evaluation of first versions of the decision support systems: the baseline systems were tested during an evaluation workshop organised by LN in collaboration with SYN and VUA.
The evaluators were exposed to three different systems (See section 2 for a description of the systems), and given identical tasks (see Section 3) to be solved with the various systems. The evaluation outcomes are covered in Section 4, with background information on the process and outcomes covered in the appendices at the end of this document.
Sections 5 and 6 contain our conclusions, plus lessons learned and recommendations for the evaluation sessions scheduled for Y2 of the project.
Evaluation by decision makers 5/33
NewsReader: ICT-316404 14 Apr 14
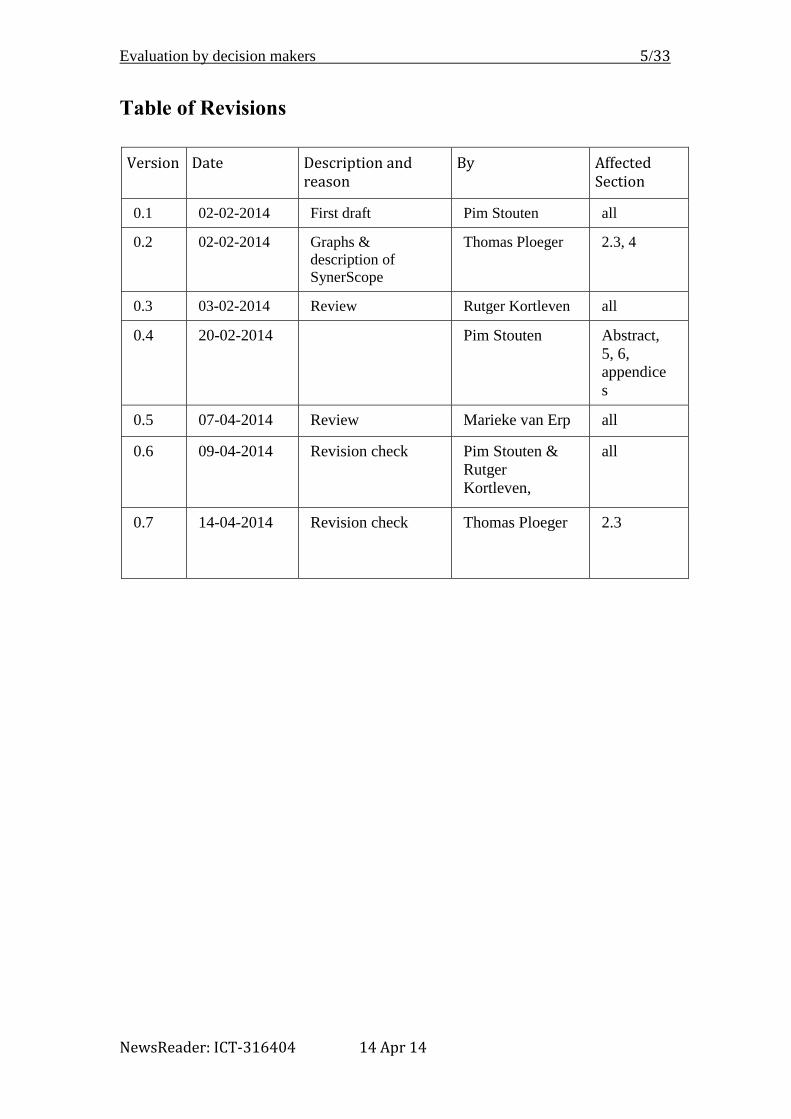
Table of Revisions
Version Date Description and
reason By Affected
Section
0.1 02-02-2014 First draft Pim Stouten all
0.2 02-02-2014 Graphs &
description of
SynerScope
Thomas Ploeger 2.3, 4
0.3 03-02-2014 Review Rutger Kortleven all
0.4 20-02-2014 Pim Stouten Abstract,
5, 6,
appendice
s
0.5 07-04-2014 Review Marieke van Erp all
0.6 09-04-2014 Revision check Pim Stouten &
Rutger
Kortleven,
all
0.7 14-04-2014 Revision check Thomas Ploeger 2.3

Evaluation by decision makers 6/33
NewsReader: ICT-316404 14 Apr 14
Table of Contents
Executive Summary/Abstract ...................................................................................... 4
Table of Revisions ........................................................................................................ 5
List of Tables ................................................................................................................. 7
1. Introduction ................................................................................................................ 8
2. The Decision Support Systems .................................................................................. 9
2.1 Google Search ............................................................................................................... 10
2.2 LexisNexis Academic ..................................................................................................... 11
2.3 SynerScope .................................................................................................................... 11
3. Evaluation Setup ...................................................................................................... 14
3.1 Tasks .............................................................................................................................. 14
3.2 Data ............................................................................................................................... 14
3.3 Participants ................................................................................................................... 14
4. Evaluation Results ................................................................................................... 15
5. Evaluation Discussion and Outlook ......................................................................... 18
5.1 What we learnt .............................................................................................................. 18
5.2 Discussion LN trainers and Dutch House of Representatives ...................................... 18
5.3 Plans & recommendations for Y2 evaluation ............................................................... 18
6. Conclusion ............................................................................................................... 20
Appendix A: Task Descriptions ................................................................................... 21
Appendix B: Participants ............................................................................................. 24
Appendix C: Participant scheduling ............................................................................ 25
Appendix D: Evaluation Rating Model ....................................................................... 26
Appendix E: Evaluation Scores ................................................................................... 27
Appendix F: Checklist Y2 user evaluation test (lessons learned) ................................ 32
Evaluation by decision makers 7/33
NewsReader: ICT-316404 14 Apr 14
List of Tables
Table 1: Key differences between LexisNexis Academic & modified System…………9
Infographic 1: Alpha version of LN baseline tool………………………………………..10
Infographic 2: Search results for ‘Facebook’, using Google Search…………….............10
Infographic 3: Search results for ‘Facebook’, using LexisNexis Academic…….............11
Infographic 4: Network visualization using SynerScope.………………………………..13
Infographic 5: Google Search evaluation results………………………………………....14
Infographic 6: LexisNexis Academic evaluation results.………………………………..16
Infographic 7: SynerScope evaluation results.……………………………………………16
Evaluation by decision makers 8/33
NewsReader: ICT-316404 14 Apr 14
1. Introduction
This deliverable is the first for Work Package 8, task 2: Evaluation by decision makers, in summary: Throughout the course of the NewsReader project LexisNexis customers, each year a group of decision makers will be selected and invited to attend an evaluation workshop. During the first round of evaluations we decided to do ‘in-house’ recruiting participants from VUA and LN for evaluation participants, given the short timeframe between evaluation preparation and the actual evaluation dates. The actual evaluation will take place at three levels of development: the first using the existing LexisNexis systems as a baseline indicator, the second uses the further enriched data from the KnowledgeStore, the third round of evaluation is based on the final version of the NewsReader tool suite, using the complete suite, plus the KnowledgeStore and other (structured) data repositories. The workshops will be organized as centralized events, to ensure we can capture maximum response from the decision makers that take part. The software will log all actions and results and provide a comparison of the different testers on the different systems and version. A post-analysis of the results will be carried out to determine the true quality and nature of the results.
This deliverable consists of an evaluation of first versions of the decision support systems: The baseline systems and the first prototype of the NewsReader decision support tool are tested by a selection of decision makers during an evaluation workshop organized by LN in collaboration with SYN and VUA.

Evaluation by decision makers 9/33
NewsReader: ICT-316404 14 Apr 14
2. The Decision Support Systems
D7.1, Section 1 gives an insight into our definitions and choices for a Decision Support Tool Suite (DSTS). In summary: The DSTS is a graphical user interface that is meant to support users when making strategic decisions. We essentially assist the decision making task by providing insight into the sequences of events and links between events that led up to a current situation so that a user can extrapolate to what might happen in the future. The DSTS does not aim to predict future events, but to aid users in drawing their own conclusions. A requirement for the a predictive system is the availability of all relevant data in the system which is not very likely in an open domain such as news. Also users should be able to play with the data in the user interface and draw their own conclusions. These are the main reasons to provide a system that aims to aid decision makers when making their decisions.
We used three different decision support systems for the first evaluation. All are of-the-shelf systems, either freely available (Google) or commercially available (LexisNexis, SynerScope) on the market.
A modified LexisNexis system that is configured for and optimized to process NewsReader output data is under development, with an alpha version delivered in January 2014 (M13 of the project), and an updated version on February 20th 2014.
The key differences between LexisNexis Academic, used for the evaluation, and the modified system are:
LN Academic Modified LN system
Underlying sources >20,000 sources, covering news, legal and company information
NewsReader output: TechCrunch & CrunchBase for now, other NewsReader data sets as they become available
Search engine LN proprietary Elastic Search
Result display 1) textual list of search results 2) full text documents
1) textual list of search results 2) full text documents 3) network view of NewsReader enrichment
Authentication 1) ID & password 2) IP address recognition
none: open to use
Table 1: Key differences between LexisNexis Academic and the modified LN Baseline System
Due to the relatively late agreement on data format and the development needed to ingest the novel data output formats this process started later than planned.

Evaluation by decision makers 10/33
NewsReader: ICT-316404 14 Apr 14
Late availability of the ‘NWR-compatible’ LN baseline system was the primary reason we decided to use a generic, of-the-shelf solution for the first evaluation instead: LexisNexis Academic1, described in Section 2.2 of this document. An updated version of D7.2 will contain further details of this modified, NewsReader-specific LexisNexis version.
Infographic 1: alpha version of LN baseline tool, optimized for TechCrunch data, processed by NewsReader
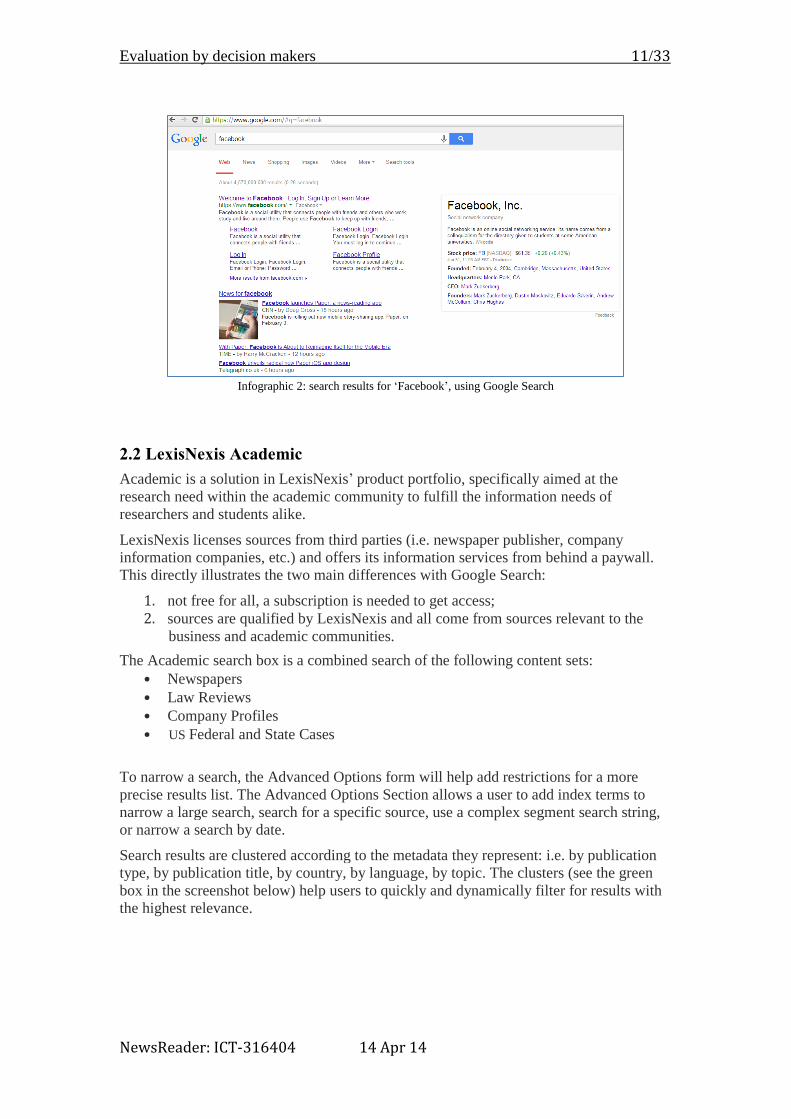
2.1 Google Search Google Search is a free-to-use web search engine owned by Google Inc.2 and the world’s most-used internet search engine. Google Search core feature is to search text in documents that are publicly available on the web. Google's search engine uses full text input for queries. The full text input for the queries is then disassembled into search terms (terms found in the results) and search operators.
Key user features are: • results displayed in an order based on Google’s page ranking3 • language toggle • option to change/refine searches from search and result screens
1 https://academic.lexisnexis.nl/ 2 http://www.google.com/about/company/ 3 http://en.wikipedia.org/wiki/PageRank
Evaluation by decision makers 11/33
NewsReader: ICT-316404 14 Apr 14
Infographic 2: search results for ‘Facebook’, using Google Search
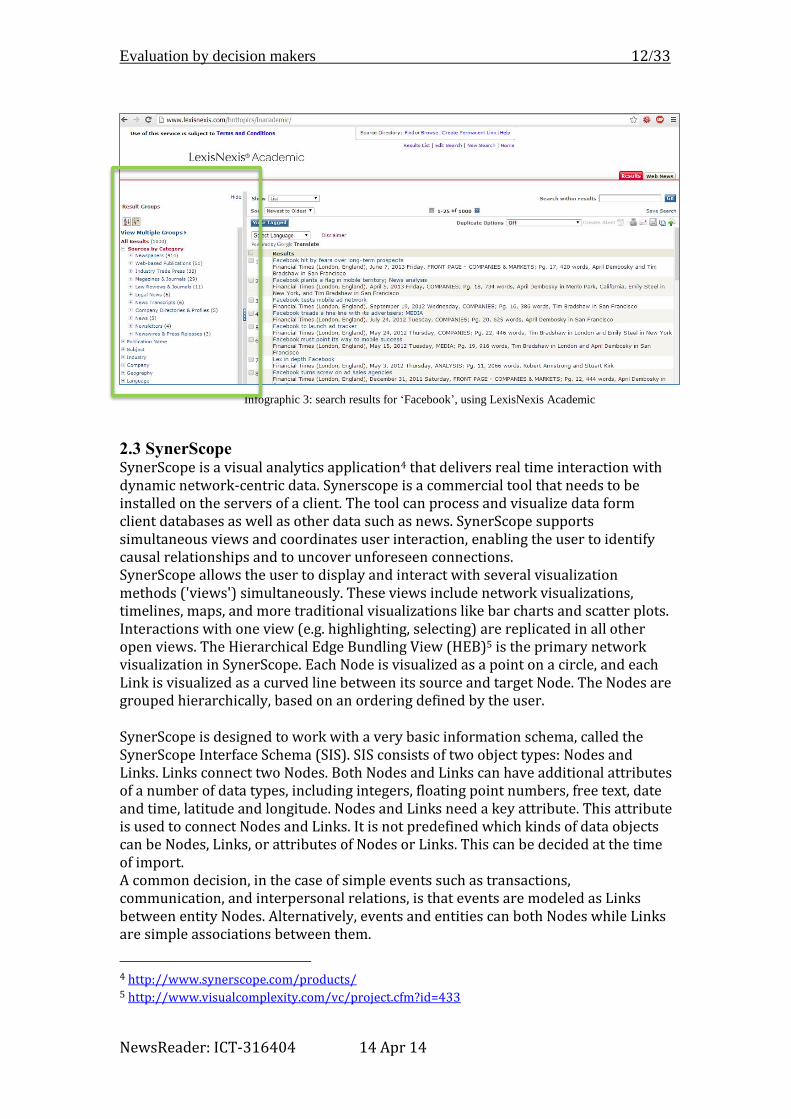
2.2 LexisNexis Academic
Academic is a solution in LexisNexis’ product portfolio, specifically aimed at the
research need within the academic community to fulfill the information needs of
researchers and students alike.
LexisNexis licenses sources from third parties (i.e. newspaper publisher, company
information companies, etc.) and offers its information services from behind a paywall.
This directly illustrates the two main differences with Google Search:
1. not free for all, a subscription is needed to get access; 2. sources are qualified by LexisNexis and all come from sources relevant to the
business and academic communities.
The Academic search box is a combined search of the following content sets: • Newspapers • Law Reviews • Company Profiles • US Federal and State Cases
To narrow a search, the Advanced Options form will help add restrictions for a more
precise results list. The Advanced Options Section allows a user to add index terms to
narrow a large search, search for a specific source, use a complex segment search string,
or narrow a search by date.
Search results are clustered according to the metadata they represent: i.e. by publication
type, by publication title, by country, by language, by topic. The clusters (see the green
box in the screenshot below) help users to quickly and dynamically filter for results with
the highest relevance.
Evaluation by decision makers 12/33
NewsReader: ICT-316404 14 Apr 14
Infographic 3: search results for ‘Facebook’, using LexisNexis Academic
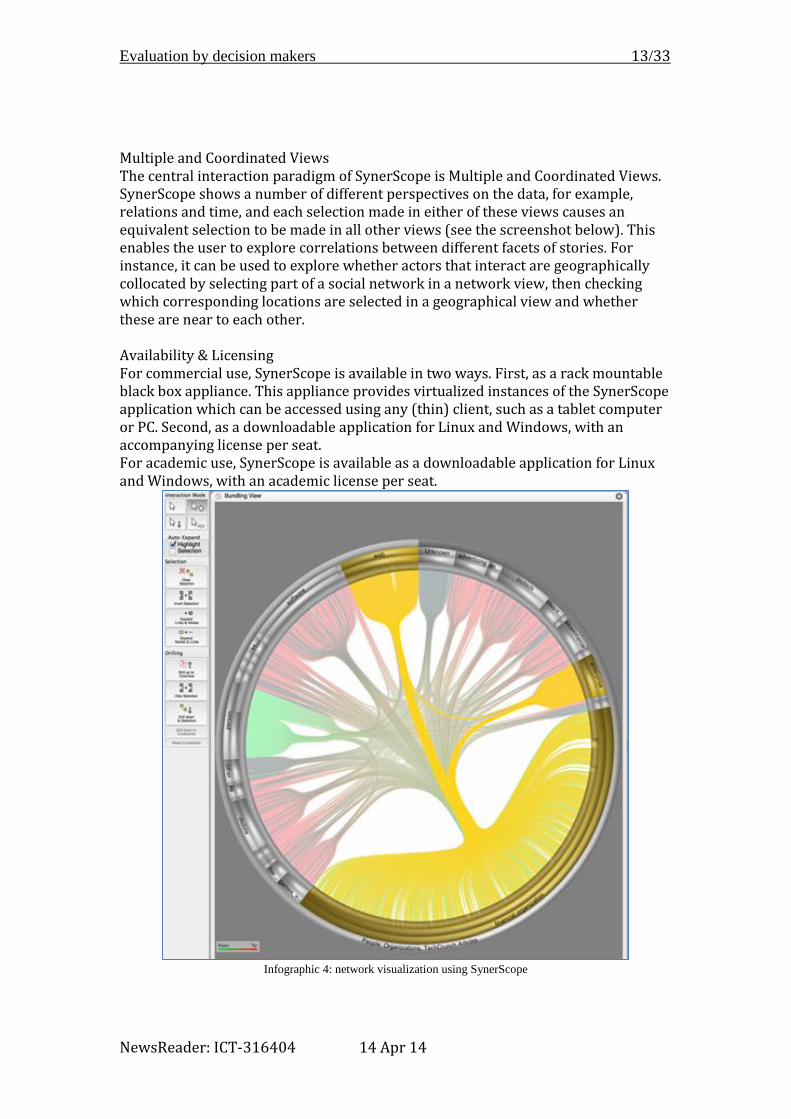
2.3 SynerScope SynerScope is a visual analytics application4 that delivers real time interaction with dynamic network-centric data. Synerscope is a commercial tool that needs to be installed on the servers of a client. The tool can process and visualize data form client databases as well as other data such as news. SynerScope supports simultaneous views and coordinates user interaction, enabling the user to identify causal relationships and to uncover unforeseen connections. SynerScope allows the user to display and interact with several visualization methods ('views') simultaneously. These views include network visualizations, timelines, maps, and more traditional visualizations like bar charts and scatter plots. Interactions with one view (e.g. highlighting, selecting) are replicated in all other open views. The Hierarchical Edge Bundling View (HEB)5 is the primary network visualization in SynerScope. Each Node is visualized as a point on a circle, and each Link is visualized as a curved line between its source and target Node. The Nodes are grouped hierarchically, based on an ordering defined by the user.
SynerScope is designed to work with a very basic information schema, called the SynerScope Interface Schema (SIS). SIS consists of two object types: Nodes and Links. Links connect two Nodes. Both Nodes and Links can have additional attributes of a number of data types, including integers, floating point numbers, free text, date and time, latitude and longitude. Nodes and Links need a key attribute. This attribute is used to connect Nodes and Links. It is not predefined which kinds of data objects can be Nodes, Links, or attributes of Nodes or Links. This can be decided at the time of import. A common decision, in the case of simple events such as transactions, communication, and interpersonal relations, is that events are modeled as Links between entity Nodes. Alternatively, events and entities can both Nodes while Links are simple associations between them.
4 http://www.synerscope.com/products/ 5 http://www.visualcomplexity.com/vc/project.cfm?id=433
Evaluation by decision makers 13/33
NewsReader: ICT-316404 14 Apr 14
Multiple and Coordinated Views The central interaction paradigm of SynerScope is Multiple and Coordinated Views. SynerScope shows a number of different perspectives on the data, for example, relations and time, and each selection made in either of these views causes an equivalent selection to be made in all other views (see the screenshot below). This enables the user to explore correlations between different facets of stories. For instance, it can be used to explore whether actors that interact are geographically collocated by selecting part of a social network in a network view, then checking which corresponding locations are selected in a geographical view and whether these are near to each other. Availability & Licensing For commercial use, SynerScope is available in two ways. First, as a rack mountable black box appliance. This appliance provides virtualized instances of the SynerScope application which can be accessed using any (thin) client, such as a tablet computer or PC. Second, as a downloadable application for Linux and Windows, with an accompanying license per seat. For academic use, SynerScope is available as a downloadable application for Linux and Windows, with an academic license per seat.
Infographic 4: network visualization using SynerScope

Evaluation by decision makers 14/33
NewsReader: ICT-316404 14 Apr 14
3. Evaluation Setup
3.1 Tasks The evaluators were asked to perform identical tasks in the three applications, see Appendix A for full details of the task descriptions. The tasks were chosen using the following criteria:
1. relevance for the CrunchBase/TechCrunch6 data set: i.e. questions around the
domain of ICT and investments; 2. ‘real world relevance’: tasks were written from a user perspective, dealing with
questions that professional researchers work with; 3. go beyond document level to answer questions: i.e. use combined answer sets to
be able to answer the question(s) in a specific task We organized two evaluation days, to ensure as many evaluators as possible turned up. Both days had identical agendas:
• a high-level presentation on the NewsReader project; • introduction of LexisNexis Academic; • introduction of SynerScope; • first round of evaluation; • second round of evaluation; • third round of evaluation
We used VUA’s computer lab facilities for the evaluation, with one PC per evaluator. So called cheat sheets (brief functional descriptions of decision support systems) were available in hard copy: one sheet per evaluation tool per evaluator.
Answers to the task questions (see Appendix A) had to be entered into a Google form. Evaluator feedback consisted of several components:
1. answer to the question(s) laid out in the task; 2. score the tools used for multiple usability qualifiers (see Appendix B)
3.2 Data The data sets for the three applications were not identical, hence limiting the possibilities to analyze evaluation outcomes on a data level. See sections 5.1 and 5.3 below for recommendations for the Y2 evaluation to solve this issue.
1. Google Search: the full range of web sites and web documents indexed by Google 2. LexisNexis Academic: the full range of sources in LexisNexis Academic 3. SynerScope: NewsReader-processed data sets, TechCrunch and CrunchBase
6 http://www.crunchbase.com/, for a further description of the data see delivery D.1.1 definition of data sources
Evaluation by decision makers 15/33
NewsReader: ICT-316404 14 Apr 14
3.3 Participants We decided to do ‘in-house’ recruiting for evaluation participants, given the short, ambitious timeline from the start of the NewsReader project to the actual evaluation dates and the uncertainty of the data formats. VUA and LN recruited a total of 13 evaluators, consisting of VUA students and LN employees; see Appendix B and C for a detailed overview of the evaluators, their background and the day they participated.
Evaluation by decision makers 16/33
NewsReader: ICT-316404 14 Apr 14
4. Evaluation Results
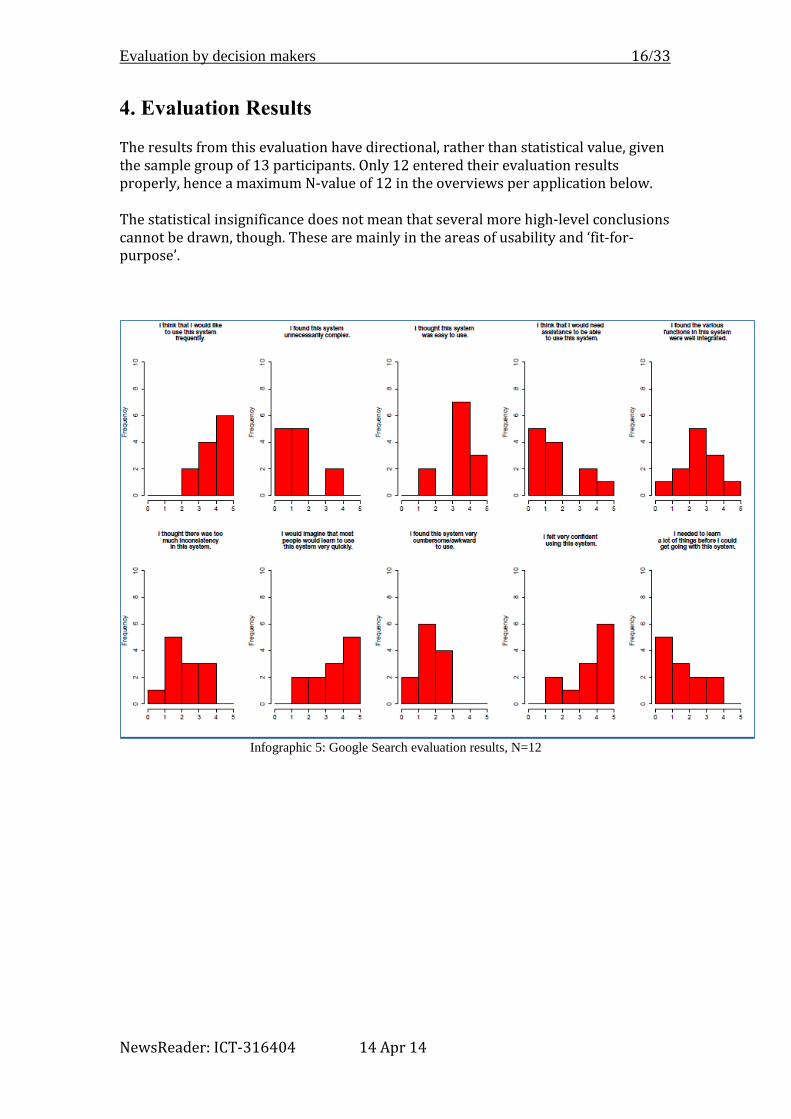
The results from this evaluation have directional, rather than statistical value, given the sample group of 13 participants. Only 12 entered their evaluation results properly, hence a maximum N-value of 12 in the overviews per application below.
The statistical insignificance does not mean that several more high-level conclusions cannot be drawn, though. These are mainly in the areas of usability and ‘fit-for-purpose’.
Infographic 5: Google Search evaluation results, N=12

Evaluation by decision makers 17/33
NewsReader: ICT-316404 14 Apr 14
Infographic 6: LexisNexis Academic evaluation results, N=11
Infographic 7: SynerScope evaluation results, N=12
Evaluation by decision makers 18/33
NewsReader: ICT-316404 14 Apr 14
5. Evaluation Discussion and Outlook
5.1 What we learnt • this first evaluation should be considered a pilot, rather than a full-blown
evaluation. The lessons learned from this evaluation will help to bring Y2/Y3
evaluations and related activities to a substantially higher level; • the evaluation took place slightly too early in the project to properly and
consistently test NWR output: it took until late 2013 to reach sufficient
agreement/clarity on data formats, which was crucial in preparing e.g. the
LexisNexis baseline system (as described in section 2); • Y2/Y3 evaluations will require larger evaluator group sizes, to deliver results that
carry statistical significance; • using identical data sets for all evaluation platforms (i.e NWR-processed
TechCrunch/CrunchBase data for both LexisNexis baseline and SynerScope, plus
a domain-limitation for these two sources for Google Search) will increase result
significance and removes a lot of noise from the evaluation results • decide on a use case at an early stage to make sure the relevant datasets are
available across the three decision support tools • logistics (especially IT-related) posed more barriers than expected: tighter project
planning, plus longer timelines are required for Y2/Y3 evaluations, planning for
the Y2 evaluation is already underway to ensure all lessons learned can be
applied.
5.2 Discussion LN trainers and Dutch House of Representatives
The dialogue between NWR partners VUA/LN and the Dutch House of Representatives is ongoing, with further steps to be expected in February/March 2014. VUA/LN have provided the information department of the Dutch House of Representatives with multiple scenarios, the scenario of choice will depend on the Parliament’s staff availability. The House of Representatives has agreed to supply a data dump of its database consisting of parliamentary documents, news articles and press releases to NewsReader. In Y2NewsReader will process the data provided and subsequently reconstruct one parliamentary inquiry (tbd) and present the results to the information department of the Dutch Parliament. Feedback from the Parliament’s information department, as well as other organizations in LN’s network of customers, partners and suppliers will be invited to prepare use cases for the Y2/Y3 evaluations.
5.3 Plans & recommendations for Y2 evaluation
Planning Time restriction is a much smaller barrier than for the Y1 evaluation, given:
• the experience derived from the first evaluation (also see 5.1 above) • that NewsReader needed most of Y1 to get its data processing infrastructure up
and running We intend to run the Y2 evaluation earlier in the year (Q4 2014)
Evaluation by decision makers 19/33
NewsReader: ICT-316404 14 Apr 14
Recommendations 1) Use strong project management to:
• define evaluation tasks • define the data sets • create evaluation infrastructure: hardware, software • recruit evaluators
2) Work closely with information-based decision makers (such as the Dutch House of Representatives, see 5.2) to draft various use cases based on market requirements. This will help the NWR consortium to set up evaluation circumstances that approach ‘real life’ information-based decision making as closely as possible.
3) Use data sets for evaluation(s) that are identical (possible for LN/SYN baseline systems) or are as close a match as possible (i.e. domain restrictions for Google Search), to get more significant evaluation results. See also section 5.1 above.
4) One of the challenges we will face is the chasm between traditional information retrieval/analysis systems such as LexisNexis on the one hand, and network/relational analysis tools such as SynerScope on the other hand. Asking users of more ‘traditional’ systems to describe a use case will mainly result in tasks and problems that can be solved by the systems they are already familiar with. We will therefor set up one or more ‘playground day’, to expose LN customers to SynerScope, before asking their input on use cases. Our expectation is this will help them think beyond the limitations of document-oriented systems, and thus deliver better suggestions for use cases where NWR and SynerScope can be used in more beneficial ways.
Evaluation by decision makers 20/33
NewsReader: ICT-316404 14 Apr 14
6. Conclusion
The work done during the first round of user evaluations by decision makers can be summarized as follows:
• Synerscope and LexisNexis developed and prepared their tools to be tested
during the evaluation • Participants were recruited by LN and VUA amongst students and co-workers • The participants were given identical tasks to be solved on three different
systems (Google, LN and SynerScope). • The outcomes and lessons learned of this first pilot-like evaluation will be
used for the Y2/Y3 evaluations
Running a first evaluation this early in this project came with several challenges. Defining evaluators without having steady data output proved to be the biggest challenge. The lack of a high-level understanding of the data format/structure meant that building of evaluation tools could only start very late in the year.
Time pressure on delivering output also meant a minimal amount of resources was available to organize the actual evaluation; we learned valuable lessons from that for the evaluations & hackaton scheduled for 2014.
Key learnings from this very first evaluation: - ensure that data sets and decision making tools are available before
planning starts - use identical data sets across the different decision making tools - start recruiting longer in advance - use market input to get ‘real life’ use cases for the evaluation
Evaluation by decision makers 21/33
NewsReader: ICT-316404 14 Apr 14
Appendix A: Task Descriptions The questions and hints below were given to all evaluators, and needed to be answered with one of the 3 (Google, LN, SYN) evaluation tools. 1. Which category of companies receives, on average, the highest amount of angel investment in USD? - Answer: Biotech - Hints: a. Find all investments. b. Filter by angel. c. Filter by USD. d. Group by company category code. e. Calculate average raised amount. f. Find highest average. - Steps: a. Search and filter for link Round code "angel", drill down to selection. b. Search and filter for link Currency code "USD", drill down to selection. c. Bar chart, links, binning to: “Category code", attribute "Raised amount", Function average. d. Find the highest bar.
2. Which people work for both "Benchmark" and "Facebook"? - Answer: Karl Jacob, Bret Taylor, Matt Cohler - Hints: a. Find all professional relationships. b. Find people with a relationship with Facebook. c. Find other relationships of these people. d. Filter by Benchmark. - Steps:
a. Search and filter for links with type "Relationship", drill down to selection. b. Search and filter for links with target_name "Facebook", expand to nodes, expand to links, drill down. c. Search and filter for links with target_name "Benchmark", expand to nodes, add "Facebook"-node to selection, expand to internal links, drill down. d. List of all people nodes currently visible is the answer. # Evaluation tasks 1. List all Series A investments (the company and the amount in USD) of Goldman Sachs before 2009. - Answer: $10M Woven Systems, 2005; $7M McKinstry Reclaim, 2007; $6.7 Derivix, 2008 - Hints: a. Find all investments. b. Filter by Series A. b. Filter by USD. c. Filter by Goldman Sachs. d. Filter before 2009.

Evaluation by decision makers 22/33
NewsReader: ICT-316404 14 Apr 14
- Steps: a. Search and filter on links with round_code "A", drill down to selection. b. This also gives you round_codes like "Angel", "Private", and "Grant". So you search and filter for those, then hide them. c. Search and filter for links with raised_currency_code "USD", drill down to selection. d. Search and filter for nodes with name "Goldman Sachs", drill down to selection. e. Table view Nodes sort by date, last three nodes should be the answer.
2. What is the difference between the average Series A investment and the average Series B investment received by Advertising companies for investments in USD? - Answer: B $11.4M - A $6.1M = $5.3M - Hints: a. Find all investments. b. Filter by Advertising recipient. c. Filter by USD. d. Group by funding round. e. Calculate average raised amount. f. Calculate difference. - Steps: a. Search and filter for links with type "funding", drill down to selection. b. Select all nodes in the "Advertising" category, expand to incoming links, drill down to selection. c. Search and filter for links with raised_currency_code "USD", drill down to selection. d. In the barchart, show the average raised amount per round_code. e. Bar chart shows the average amounts, answer is difference between series a and series b.
3. When did David Cohen turn from a business owner into an investor? - Answer: 2007 - Hints: a. Find David Cohen. b. Find all events involving David Cohen. c. Find earliest investment event. - Steps: a. Search and filter for node with name "David Cohen". b. Expand to links to find all events including a David Cohen, drill down to selection. c. Select the bundle leading from the most prominent David Cohen, drill down to selection. d. Table view Links sort by date, look up the earliest investment.
4. Financial organizations that invest in Mobile and in Biotech invest larger amounts of USD in which of these two branches? - Answer: Biotech - Hints: a. Find all investments. b. Filter by Mobile and Biotech recipient. c. Filter by USD. d. Group by company category code. e. Calculate average raised amounts. f. Compare Mobile and Biotech. - Steps:
Evaluation by decision makers 23/33
NewsReader: ICT-316404 14 Apr 14
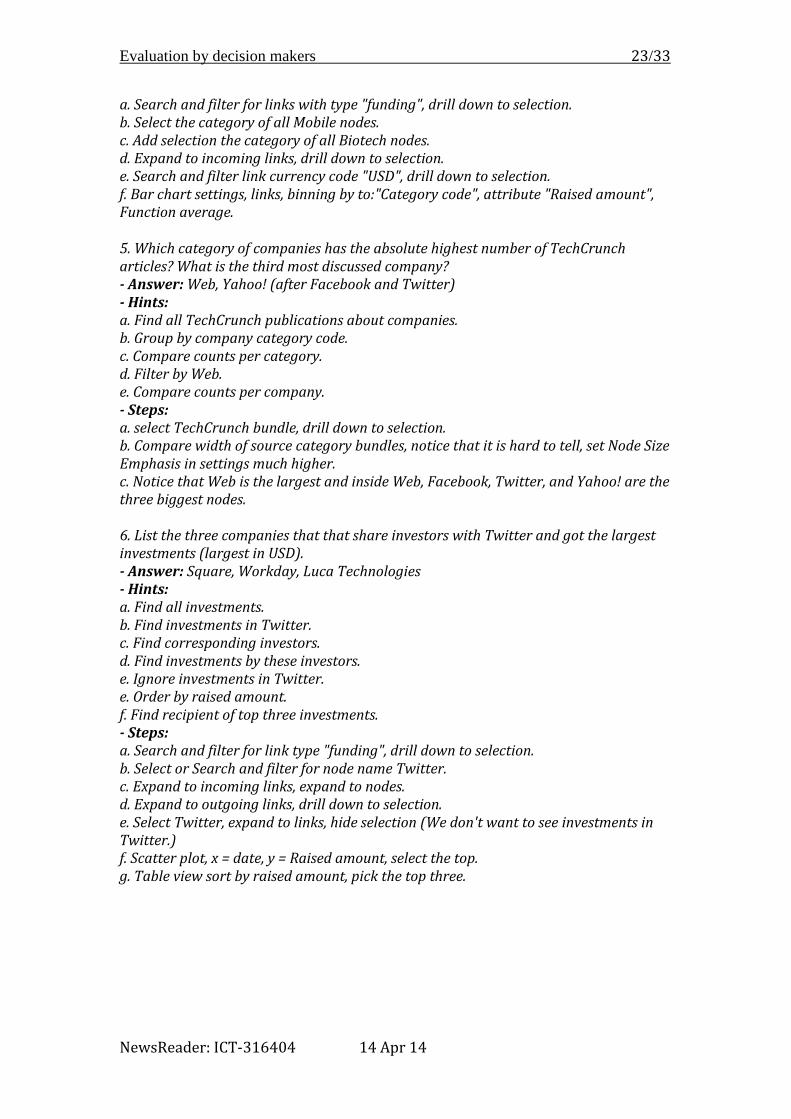
a. Search and filter for links with type "funding", drill down to selection. b. Select the category of all Mobile nodes. c. Add selection the category of all Biotech nodes. d. Expand to incoming links, drill down to selection. e. Search and filter link currency code "USD", drill down to selection. f. Bar chart settings, links, binning by to:"Category code", attribute "Raised amount", Function average.
5. Which category of companies has the absolute highest number of TechCrunch articles? What is the third most discussed company? - Answer: Web, Yahoo! (after Facebook and Twitter) - Hints: a. Find all TechCrunch publications about companies. b. Group by company category code. c. Compare counts per category. d. Filter by Web. e. Compare counts per company. - Steps: a. select TechCrunch bundle, drill down to selection. b. Compare width of source category bundles, notice that it is hard to tell, set Node Size Emphasis in settings much higher. c. Notice that Web is the largest and inside Web, Facebook, Twitter, and Yahoo! are the three biggest nodes. 6. List the three companies that that share investors with Twitter and got the largest investments (largest in USD). - Answer: Square, Workday, Luca Technologies - Hints: a. Find all investments. b. Find investments in Twitter. c. Find corresponding investors. d. Find investments by these investors. e. Ignore investments in Twitter. e. Order by raised amount. f. Find recipient of top three investments. - Steps: a. Search and filter for link type "funding", drill down to selection. b. Select or Search and filter for node name Twitter. c. Expand to incoming links, expand to nodes. d. Expand to outgoing links, drill down to selection. e. Select Twitter, expand to links, hide selection (We don't want to see investments in Twitter.) f. Scatter plot, x = date, y = Raised amount, select the top. g. Table view sort by raised amount, pick the top three.
Evaluation by decision makers 24/33
NewsReader: ICT-316404 14 Apr 14
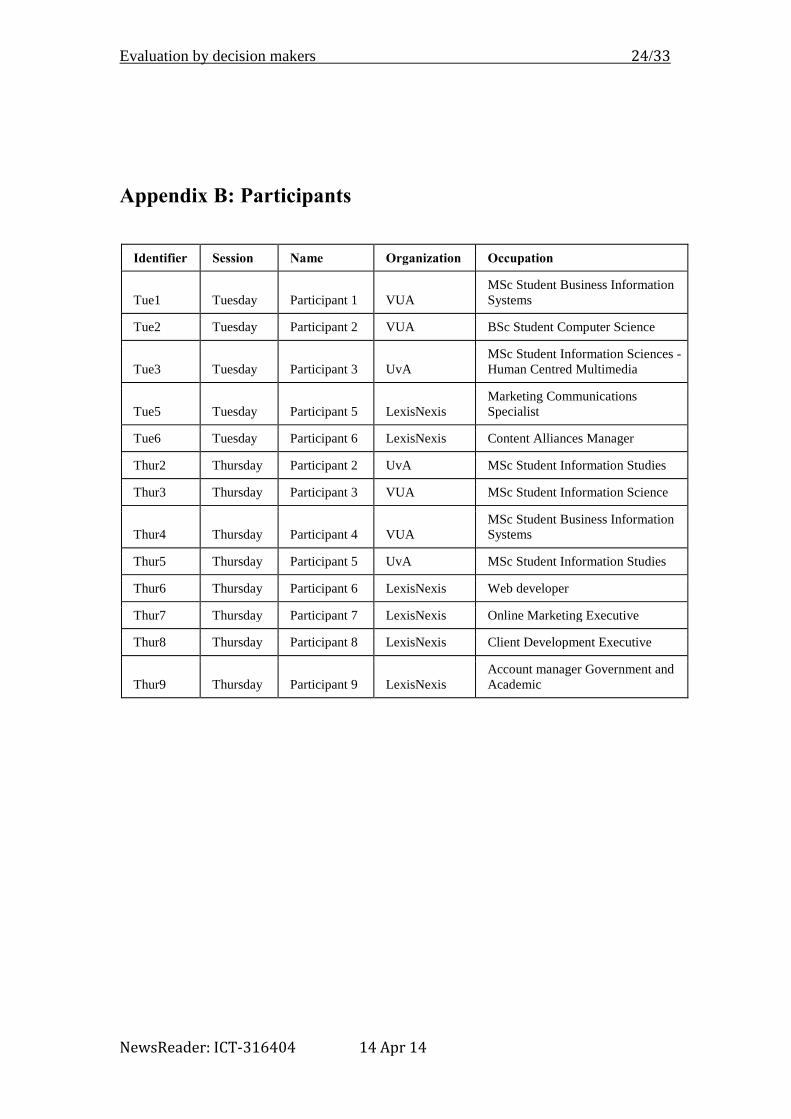
Appendix B: Participants
Identifier Session Name Organization Occupation
Tue1 Tuesday Participant 1 VUA MSc Student Business Information
Systems
Tue2 Tuesday Participant 2 VUA BSc Student Computer Science
Tue3 Tuesday Participant 3 UvA MSc Student Information Sciences -
Human Centred Multimedia
Tue5 Tuesday Participant 5 LexisNexis Marketing Communications
Specialist
Tue6 Tuesday Participant 6 LexisNexis Content Alliances Manager
Thur2 Thursday Participant 2 UvA MSc Student Information Studies
Thur3 Thursday Participant 3 VUA MSc Student Information Science
Thur4 Thursday Participant 4 VUA MSc Student Business Information
Systems
Thur5 Thursday Participant 5 UvA MSc Student Information Studies
Thur6 Thursday Participant 6 LexisNexis Web developer
Thur7 Thursday Participant 7 LexisNexis Online Marketing Executive
Thur8 Thursday Participant 8 LexisNexis Client Development Executive
Thur9 Thursday Participant 9 LexisNexis Account manager Government and
Academic
Evaluation by decision makers 25/33
NewsReader: ICT-316404 14 Apr 14
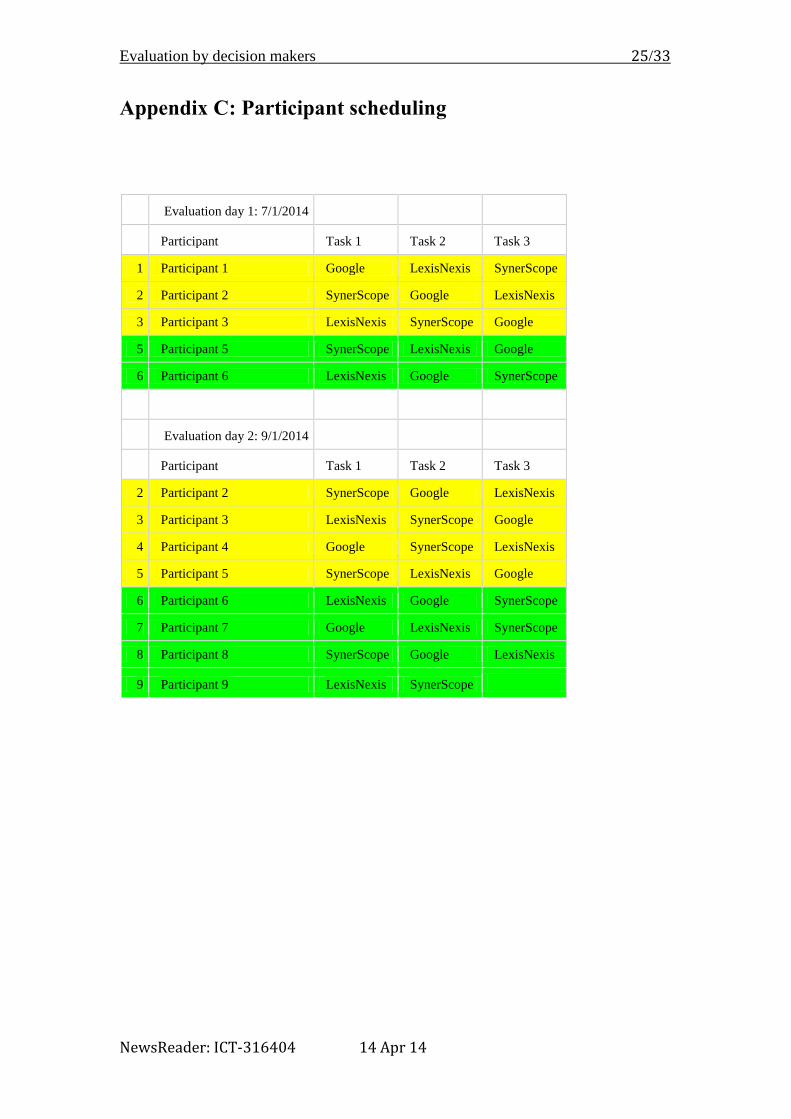
Appendix C: Participant scheduling
Evaluation day 1: 7/1/2014
Participant Task 1 Task 2 Task 3
1 Participant 1 Google LexisNexis SynerScope
2 Participant 2 SynerScope Google LexisNexis
3 Participant 3 LexisNexis SynerScope Google
5 Participant 5 SynerScope LexisNexis Google
6 Participant 6 LexisNexis Google SynerScope
Evaluation day 2: 9/1/2014
Participant Task 1 Task 2 Task 3
2 Participant 2 SynerScope Google LexisNexis
3 Participant 3 LexisNexis SynerScope Google
4 Participant 4 Google SynerScope LexisNexis
5 Participant 5 SynerScope LexisNexis Google
6 Participant 6 LexisNexis Google SynerScope
7 Participant 7 Google LexisNexis SynerScope
8 Participant 8 SynerScope Google LexisNexis
9 Participant 9 LexisNexis SynerScope
Evaluation by decision makers 26/33
NewsReader: ICT-316404 14 Apr 14
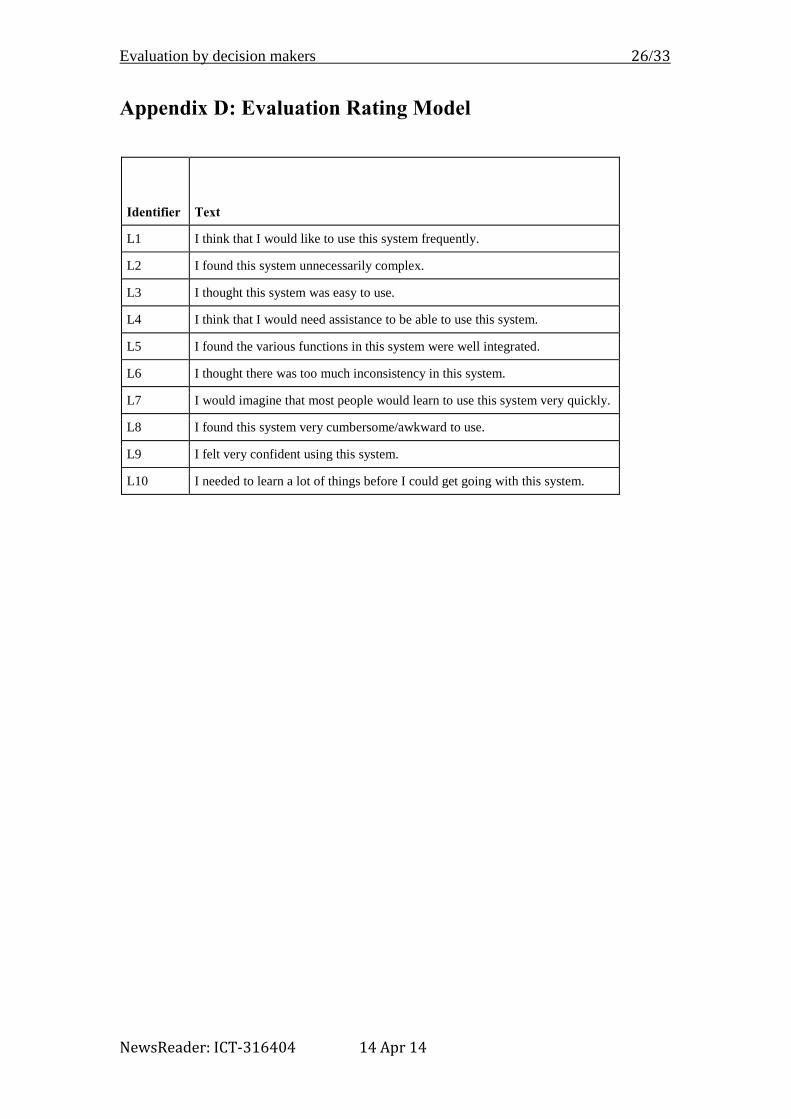
Appendix D: Evaluation Rating Model
Identifier Text
L1 I think that I would like to use this system frequently.
L2 I found this system unnecessarily complex.
L3 I thought this system was easy to use.
L4 I think that I would need assistance to be able to use this system.
L5 I found the various functions in this system were well integrated.
L6 I thought there was too much inconsistency in this system.
L7 I would imagine that most people would learn to use this system very quickly.
L8 I found this system very cumbersome/awkward to use.
L9 I felt very confident using this system.
L10 I needed to learn a lot of things before I could get going with this system.
Evaluation by decision makers 27/33
NewsReader: ICT-316404 14 Apr 14
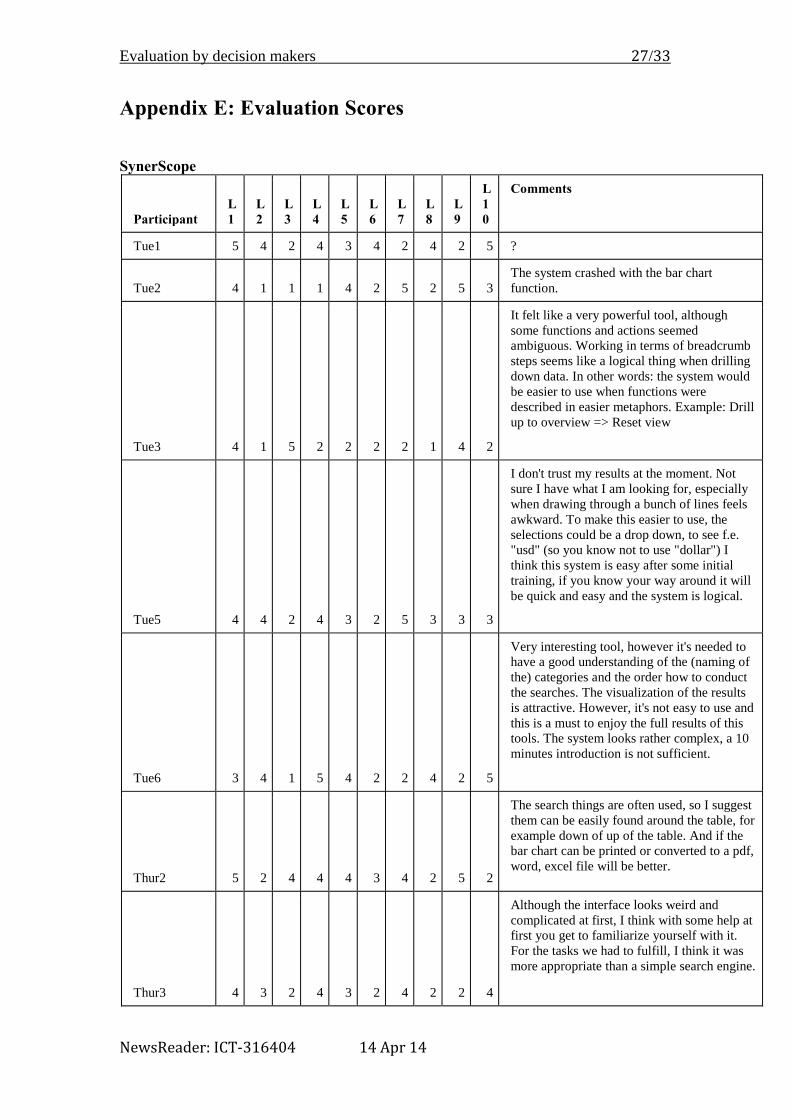
Appendix E: Evaluation Scores SynerScope
Participant L
1 L
2 L
3 L
4 L
5 L
6 L
7 L
8 L
9
L
1
0
Comments
Tue1 5 4 2 4 3 4 2 4 2 5 ?
Tue2 4 1 1 1 4 2 5 2 5 3 The system crashed with the bar chart
function.
Tue3 4 1 5 2 2 2 2 1 4 2
It felt like a very powerful tool, although
some functions and actions seemed
ambiguous. Working in terms of breadcrumb
steps seems like a logical thing when drilling
down data. In other words: the system would
be easier to use when functions were
described in easier metaphors. Example: Drill
up to overview => Reset view
Tue5 4 4 2 4 3 2 5 3 3 3
I don't trust my results at the moment. Not
sure I have what I am looking for, especially
when drawing through a bunch of lines feels
awkward. To make this easier to use, the
selections could be a drop down, to see f.e.
"usd" (so you know not to use "dollar") I
think this system is easy after some initial
training, if you know your way around it will
be quick and easy and the system is logical.
Tue6 3 4 1 5 4 2 2 4 2 5
Very interesting tool, however it's needed to
have a good understanding of the (naming of
the) categories and the order how to conduct
the searches. The visualization of the results
is attractive. However, it's not easy to use and
this is a must to enjoy the full results of this
tools. The system looks rather complex, a 10
minutes introduction is not sufficient.
Thur2 5 2 4 4 4 3 4 2 5 2
The search things are often used, so I suggest
them can be easily found around the table, for
example down of up of the table. And if the
bar chart can be printed or converted to a pdf,
word, excel file will be better.
Thur3 4 3 2 4 3 2 4 2 2 4
Although the interface looks weird and
complicated at first, I think with some help at
first you get to familiarize yourself with it.
For the tasks we had to fulfill, I think it was
more appropriate than a simple search engine.
Evaluation by decision makers 28/33
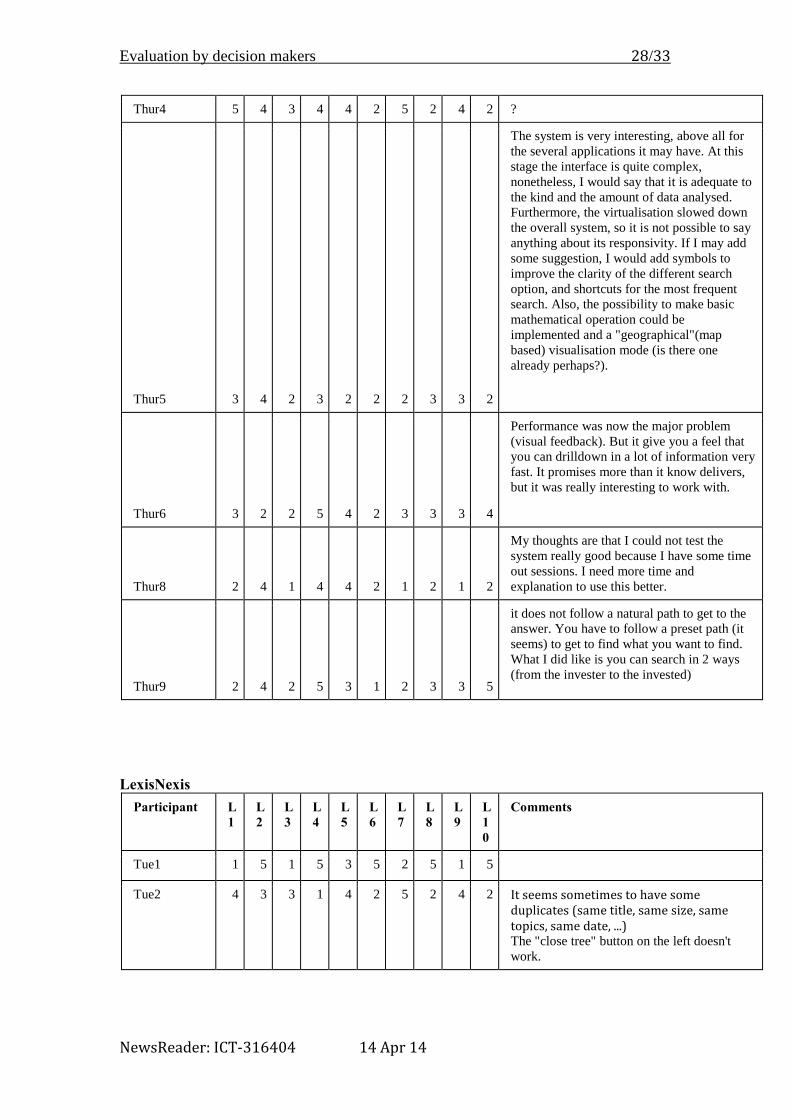
NewsReader: ICT-316404 14 Apr 14
Thur4 5 4 3 4 4 2 5 2 4 2 ?
Thur5 3 4 2 3 2 2 2 3 3 2
The system is very interesting, above all for
the several applications it may have. At this
stage the interface is quite complex,
nonetheless, I would say that it is adequate to
the kind and the amount of data analysed.
Furthermore, the virtualisation slowed down
the overall system, so it is not possible to say
anything about its responsivity. If I may add
some suggestion, I would add symbols to
improve the clarity of the different search
option, and shortcuts for the most frequent
search. Also, the possibility to make basic
mathematical operation could be
implemented and a "geographical"(map
based) visualisation mode (is there one
already perhaps?).
Thur6 3 2 2 5 4 2 3 3 3 4
Performance was now the major problem
(visual feedback). But it give you a feel that
you can drilldown in a lot of information very
fast. It promises more than it know delivers,
but it was really interesting to work with.
Thur8 2 4 1 4 4 2 1 2 1 2
My thoughts are that I could not test the
system really good because I have some time
out sessions. I need more time and
explanation to use this better.
Thur9 2 4 2 5 3 1 2 3 3 5
it does not follow a natural path to get to the
answer. You have to follow a preset path (it
seems) to get to find what you want to find.
What I did like is you can search in 2 ways
(from the invester to the invested)
LexisNexis
Participant L
1 L
2 L
3 L
4 L
5 L
6 L
7 L
8 L
9 L
1
0
Comments
Tue1 1 5 1 5 3 5 2 5 1 5
Tue2 4 3 3 1 4 2 5 2 4 2 It seems sometimes to have some duplicates (same title, same size, same topics, same date, ...) The "close tree" button on the left doesn't
work.

Evaluation by decision makers 29/33
NewsReader: ICT-316404 14 Apr 14
Tue3 3 4 2 2 2 2 3 4 2 2 "Pressing Apply in the advanced search screen and THEN needing to press search felt awkward. This is a logical step, so I expected to only need to press Apply in order to do the search.
Furthermore, operators such as COMPANY() and DATEBEF() were very useful, but a bit hard to come across. They should be highlighted in someway.
And finally, people are used to Google
searching, which is quite different (e.g. the
Google query [""Koningin Beatrix""
verjaardag] would translate to [Koningin
Beatrix AND verjaardag] (mind the quotes
and AND) in LexisNexis.)"
Tue5 4 4 3 3 2 4 3 3 3 3 this system was not appropriate for the
questions, I think.
Tue6 3 2 3 5 4 2 3 3 4 5 An introduction of how to use segments and search commands is key to work with this system; if not, one gets lost in too many results and fall back in the 'google way' of searching (just typing in some text and see what gets back.
For the rest Lexis has a very rich set of
content, key is how to find your way.
Thur3 3 3 4 2 3 2 4 3 2 2 I noticed two things that made the use of the
system more difficult and unnecessarily more
complex: firstly, when you were typing in an
advanced search, you had to press apply and
then again search, which was weird (it also
was duplicating the words each time you
modified the search, which was also
awkward!). Secondly, when the search was
quite broad (over 1000 results), every attempt
to narrow it down was unsuccessful, it should
be easier! And you could not search within all
the results, it would restrict the further search
only on the viewable or the first 1000 results,
which was totally limiting your options for
narrowing down your search.
Thur4 3 4 2 4 3 2 2 3 4 2 if the system can display some linkage
between different information that could be
help to find what the user want
Evaluation by decision makers 30/33
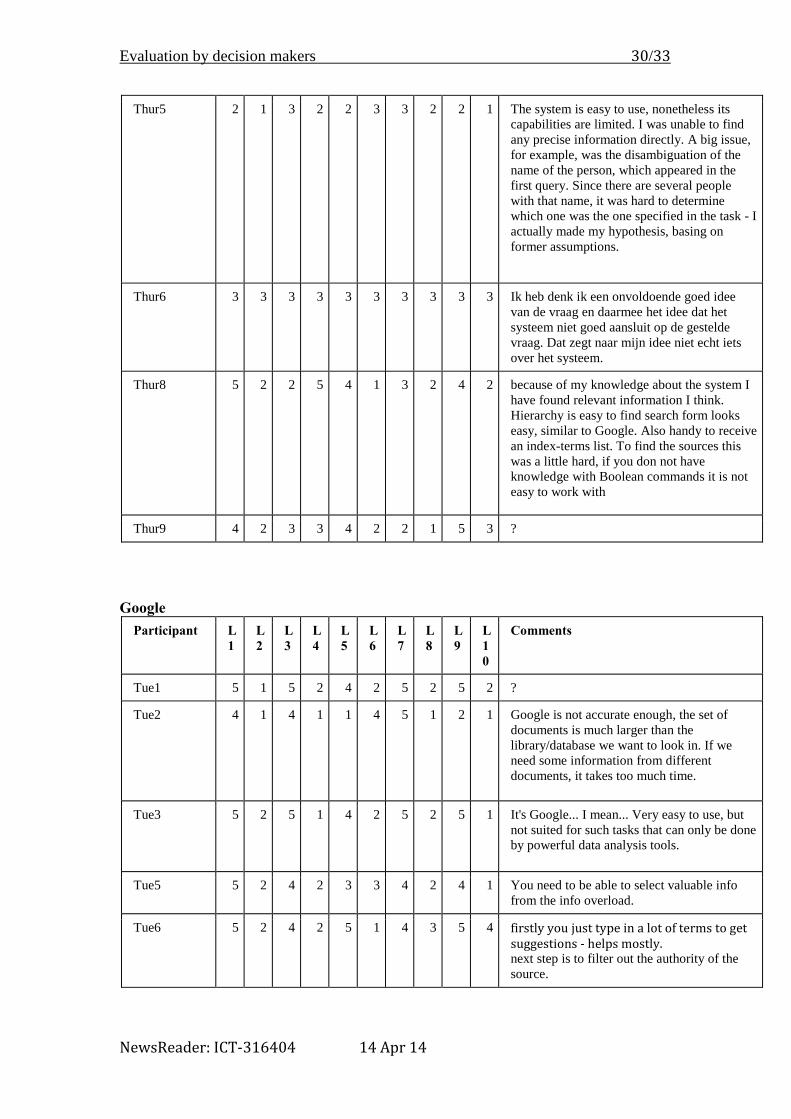
NewsReader: ICT-316404 14 Apr 14
Thur5 2 1 3 2 2 3 3 2 2 1 The system is easy to use, nonetheless its
capabilities are limited. I was unable to find
any precise information directly. A big issue,
for example, was the disambiguation of the
name of the person, which appeared in the
first query. Since there are several people
with that name, it was hard to determine
which one was the one specified in the task - I
actually made my hypothesis, basing on
former assumptions.
Thur6 3 3 3 3 3 3 3 3 3 3 Ik heb denk ik een onvoldoende goed idee
van de vraag en daarmee het idee dat het
systeem niet goed aansluit op de gestelde
vraag. Dat zegt naar mijn idee niet echt iets
over het systeem.
Thur8 5 2 2 5 4 1 3 2 4 2 because of my knowledge about the system I
have found relevant information I think.
Hierarchy is easy to find search form looks
easy, similar to Google. Also handy to receive
an index-terms list. To find the sources this
was a little hard, if you don not have
knowledge with Boolean commands it is not
easy to work with
Thur9 4 2 3 3 4 2 2 1 5 3 ?
Participant L
1 L
2 L
3 L
4 L
5 L
6 L
7 L
8 L
9 L
1
0
Comments
Tue1 5 1 5 2 4 2 5 2 5 2 ?
Tue2 4 1 4 1 1 4 5 1 2 1 Google is not accurate enough, the set of
documents is much larger than the
library/database we want to look in. If we
need some information from different
documents, it takes too much time.
Tue3 5 2 5 1 4 2 5 2 5 1 It's Google... I mean... Very easy to use, but
not suited for such tasks that can only be done
by powerful data analysis tools.
Tue5 5 2 4 2 3 3 4 2 4 1 You need to be able to select valuable info
from the info overload.
Tue6 5 2 4 2 5 1 4 3 5 4 firstly you just type in a lot of terms to get suggestions - helps mostly. next step is to filter out the authority of the
source.
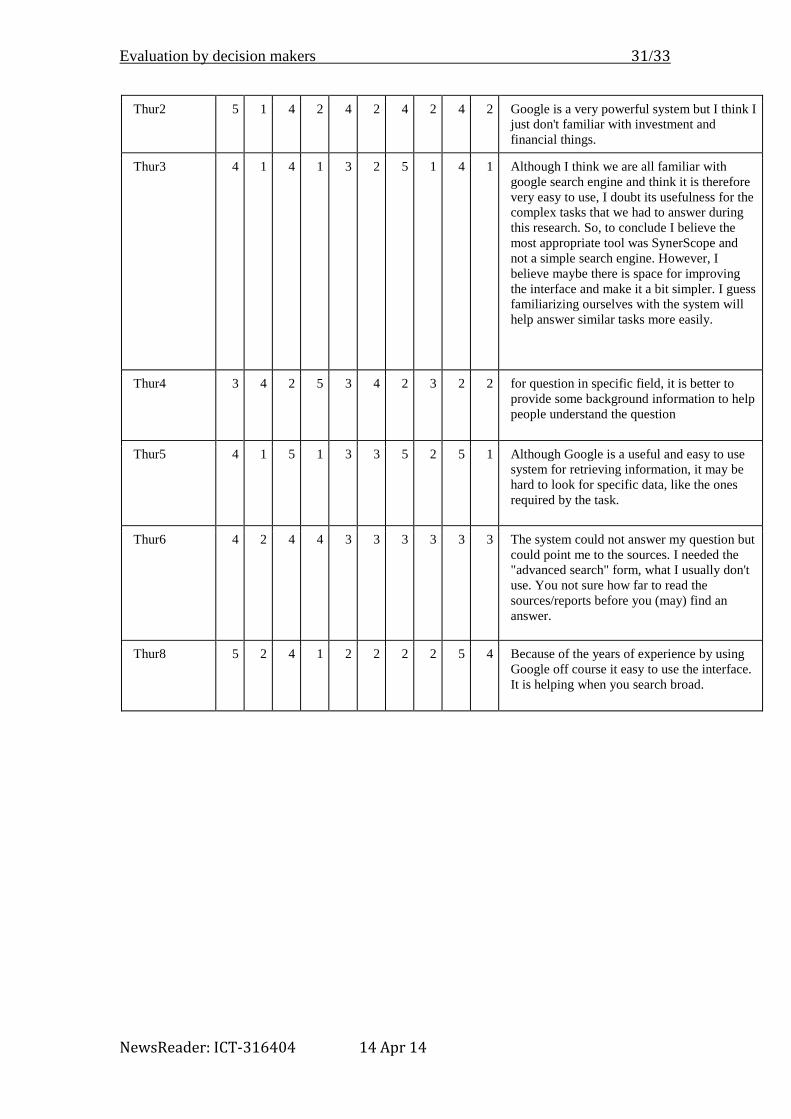
Evaluation by decision makers 31/33
NewsReader: ICT-316404 14 Apr 14
Thur2 5 1 4 2 4 2 4 2 4 2 Google is a very powerful system but I think I
just don't familiar with investment and
financial things.
Thur3 4 1 4 1 3 2 5 1 4 1 Although I think we are all familiar with
google search engine and think it is therefore
very easy to use, I doubt its usefulness for the
complex tasks that we had to answer during
this research. So, to conclude I believe the
most appropriate tool was SynerScope and
not a simple search engine. However, I
believe maybe there is space for improving
the interface and make it a bit simpler. I guess
familiarizing ourselves with the system will
help answer similar tasks more easily.
Thur4 3 4 2 5 3 4 2 3 2 2 for question in specific field, it is better to
provide some background information to help
people understand the question
Thur5 4 1 5 1 3 3 5 2 5 1 Although Google is a useful and easy to use
system for retrieving information, it may be
hard to look for specific data, like the ones
required by the task.
Thur6 4 2 4 4 3 3 3 3 3 3 The system could not answer my question but
could point me to the sources. I needed the
"advanced search" form, what I usually don't
use. You not sure how far to read the
sources/reports before you (may) find an
answer.
Thur8 5 2 4 1 2 2 2 2 5 4 Because of the years of experience by using
Google off course it easy to use the interface.
It is helping when you search broad.
Evaluation by decision makers 32/33
NewsReader: ICT-316404 14 Apr 14
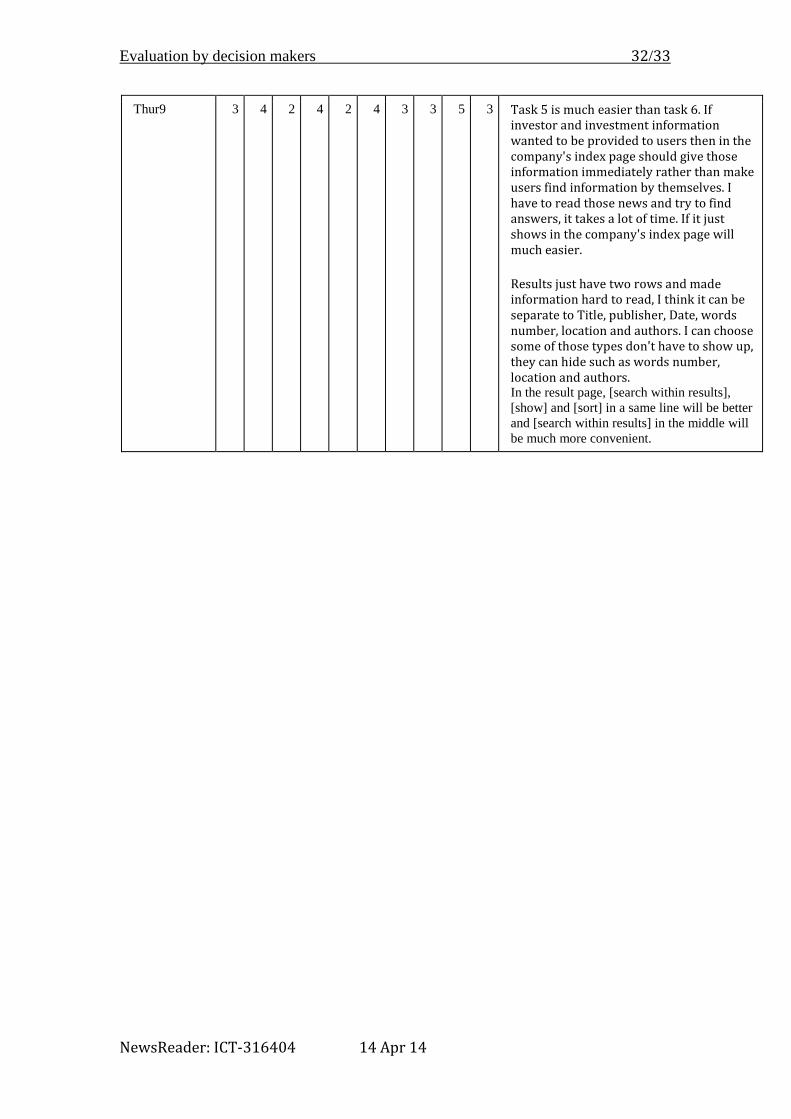
Thur9 3 4 2 4 2 4 3 3 5 3 Task 5 is much easier than task 6. If investor and investment information wanted to be provided to users then in the company's index page should give those information immediately rather than make users find information by themselves. I have to read those news and try to find answers, it takes a lot of time. If it just shows in the company's index page will much easier.
Results just have two rows and made information hard to read, I think it can be separate to Title, publisher, Date, words number, location and authors. I can choose some of those types don't have to show up, they can hide such as words number, location and authors. In the result page, [search within results],
[show] and [sort] in a same line will be better
and [search within results] in the middle will
be much more convenient.
Evaluation by decision makers 33/33
NewsReader: ICT-316404 14 Apr 14
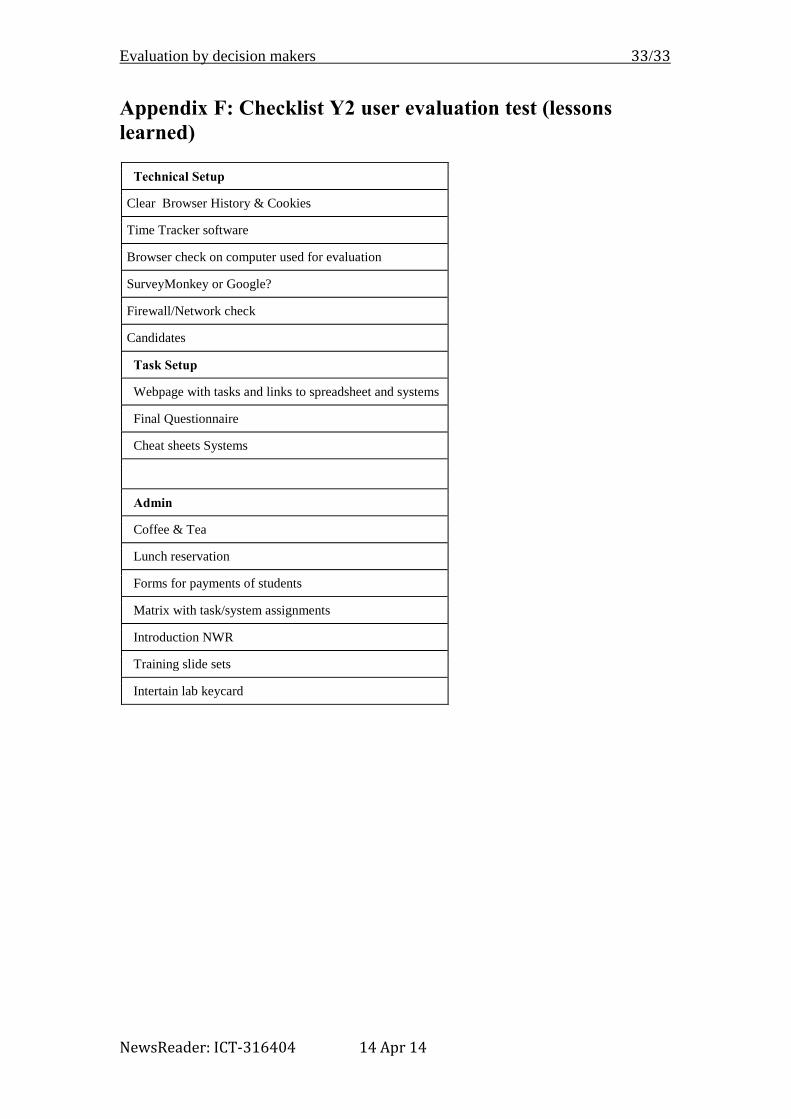
Appendix F: Checklist Y2 user evaluation test (lessons
learned)
Technical Setup
Clear Browser History & Cookies
Time Tracker software
Browser check on computer used for evaluation
SurveyMonkey or Google?
Firewall/Network check
Candidates
Task Setup
Webpage with tasks and links to spreadsheet and systems
Final Questionnaire
Cheat sheets Systems
Admin
Coffee & Tea
Lunch reservation
Forms for payments of students
Matrix with task/system assignments
Introduction NWR
Training slide sets
Intertain lab keycard