evaluation of free fruit in schools initiative
TRANSCRIPT

Educ
atio
nEvaluation of Free Fruit
in Schools Initiative

ii
EVALUATION OF FREE FRUIT IN SCHOOLS
INITIATIVE
Andy MacGregor and Christine Sheehy
Scottish Centre for Social Research
SCOTTISH EXECUTIVE SOCIAL RESEARCH 2005
The views expressed in the report are those of the author(s) and do not necessarily reflect those of the Scottish Executive or any other organisation(s) by which the author(s) is/are employed.
The Scottish Executive is making this research report available on-line in order to provide access to its contents for those interested in the subject. The Executive commissioned the research but has not exercised editorial control over the report.
This web only report is accompanied by web only “Insight 26: Evaluation of Free Fruit in Schools Initiative”.
Both reports are published by Information and Analytical Services Division, Scottish Executive Education Department, Victoria Quay, Edinburgh, EH6 6QQ. If you have any enquiries about these reports please contact the Dissemination Officer on 0131-244-0316.
Both reports were published in December 2005.
iii
TABLE OF CONTENTS ACKNOWLEDGEMENTS ...............................................................................................................................IV EXECUTIVE SUMMARY .................................................................................................................................. 1 1. INTRODUCTION ............................................................................................................................................ 1 2. AIMS AND OBJECTIVES.............................................................................................................................. 2
2.1 AIM OF THE EVALUATION ............................................................................................................................. 2 2.2 EVALUATION OBJECTIVES............................................................................................................................. 2
3. RESEARCH DESIGN AND METHODS ................................................................................................. 3 3.1 SUMMARY OF RESEARCH DESIGN .................................................................................................................. 3 3.2 KEY STAKEHOLDER INTERVIEWS................................................................................................................... 3 3.3 QUALITIATIVE PILOT WORK IN SCHOOLS ....................................................................................................... 3 3.4 LOCAL AUTHORITY SURVEY .......................................................................................................................... 4 3.5 QUESTIONNAIRE SURVEY OF SCHOOLS .......................................................................................................... 4
3.5.1 Sample of schools................................................................................................................................. 4 3.5.2 Telephone follow-up............................................................................................................................. 5
3.6. ANALYSIS .................................................................................................................................................... 5 4. RESULTS.......................................................................................................................................................... 6
4.1 LOCAL AUTHORITY SURVEY .......................................................................................................................... 6 4.1.1 Response rate ....................................................................................................................................... 6 4.1.2 Other similar schemes.......................................................................................................................... 6 4.1.3 The operation of the free fruit initiative in different local authority areas .......................................... 6 4.1.4 Entitlement to free fruit ........................................................................................................................ 7 4.1.5 Producers, suppliers and distribution of fruit ...................................................................................... 8 4.1.6 Satisfaction with the free fruit initiative in local authorities................................................................ 8 4.1.7. Satisfaction with fruit supply and distribution .................................................................................. 12 4.1.8 Evaluation of Free Fruit initiative in local areas .............................................................................. 13 4.1.9 Policy and Guidance from Scottish Executive.................................................................................... 14 4.1.10 Problems encountered by initiative.................................................................................................. 20 4.1.11 Facilitating factors........................................................................................................................... 21 4.1.12 Usefulness of Guidance from the Scottish Executive........................................................................ 22 4.1.13 Costs of free fruit initiative............................................................................................................... 23 4.1.14 Impact on fruit consumption and healthy eating.............................................................................. 24 4.1.15 Perception of success and future of initiative................................................................................... 26 4.1.16 Changes to Free Fruit initiative....................................................................................................... 27
4.2 SURVEY OF SCHOOLS.................................................................................................................................. 29 4.2.1 Response from schools ....................................................................................................................... 29 4.2.2 Current free fruit initiative and previous schemes........................................................................ 30 4.2.3 Implementation of free fruit initiative ........................................................................................... 32 4.2.4 Preparation, storage and distribution of fruit .............................................................................. 33 4.2.5 Health and safety concerns........................................................................................................... 37 4.2.6 Delivery and consumption of fruit within schools......................................................................... 38 4.2.7 Types, quality and quantity of fruit ............................................................................................... 41 4.2.8 Impact of the initiative on the school and pupils .......................................................................... 45 4.2.9 Curricular links and costs to schools............................................................................................ 48 4.2.10 Overall perceptions of scheme and future of the initiative....................................................... 50
5. SUMMARY AND DISCUSSION ............................................................................................................ 53 5.1 BACKGROUND INFORMATION ..................................................................................................................... 53 5.2 VIEWS OF LOCAL AUTHORITY PROFESSIONALS ........................................................................................... 53 5.3 VIEWS OF SCHOOL STAFF RESPONDENTS .................................................................................................... 59 5.4 SCHOOL SURVEY RESPONSES BY ENTITLEMENT TO FREE SCHOOL MEALS.................................................... 63
6. CONCLUSIONS ....................................................................................................................................... 66

iv
ACKNOWLEDGEMENTS The in-depth interviews with key stakeholders and qualitative pilot work were conducted by Andy MacGregor and Christine Sheehy. The interviews with local authority and school staff respondents were carried out by Wendy Blazyca, Irene Miller and Penelope Smirthwaite. Interviewer supervision was carried out by Irene Miller. Administrative and research support was provided by Lesley Birse and Ann Rennie. Transcription was by Ann Rennie and Catriona Yorston.
Many thanks to all those individuals who gave their assistance to the research team, especially those who returned questionnaires or took part in the interviews. In particular, we would like to thank the members of the Evaluation Steering Group for their assistance and advice throughout the project.

1
EXECUTIVE SUMMARY The national Free Fruit in Schools initiative aims to provide one portion of fruit three times a week during term time to all primary I and primary 2 pupils in local authority managed schools. The initiative is an additional measure to the recommendations made by the Expert Panel on School Meals in their Report, Hungry for Success. Both initiatives are part of the Scottish Executive’s Health Improvement Programme which recommends eating more fruit and vegetables. Improving the uptake of school meals and fresh fruit is also an essential part of supporting those children in most need. The Scottish Executive has provided £2m per year for financial years 2003-04 to 2005-06 to introduce the Free Fruit initiative across all publicly funded schools in Scotland. The initiative had been implemented in most schools by December 2003 and the 2005 SEED School Meal census shows that almost 100% of primary schools were giving free fresh fruit to P1 and P2 pupils. Only four local authorities did not report full coverage of the initiative within all of their primary schools. The Scottish Centre for Social Research (ScotCen) was commissioned by the Schools Group Analytical Service Unit in the Education Department of the Scottish Executive in February 2005 to evaluate the implementation of the Free Fruit in Schools initiative in Scotland. ScotCen used a mixed methods approach to evaluate the free fruit initiative. Firstly, a formative phase was carried out which encompassed in-depth interviews with key stakeholders and further qualitative work in pilot schools. This phase helped inform the development of the research instruments for the main survey phase. In the main study phase, semi-structured telephone interviews were conducted with 47 local authority professionals able to comment on both the policy context and the operational aspects of the free fruit initiative. Responses were gathered from all of the 32 local authorities in Scotland. Finally, a questionnaire survey of a representative sample of 510 primary schools was carried out, addressing all aspects of the implementation of the scheme at a school level. After telephone follow-up, 458 questionnaires were completed, a response rate of 90%. Both local authority professionals and school staff members perceived that the national Free Fruit in Schools initiative had been very successful. Indeed, it was argued that it was one of the most successful initiatives of its kind, and that it should be allowed to continue. The views of the vast majority of respondents was that the initiative had resulted in an increased consumption of fruit and an improvement in healthy eating practices more generally in pupils attending schools of different sizes, serving catchment areas from the relatively affluent to the relatively deprived, and from urban to rural settings. For example, 90% of school respondents thought that the initiative had brought about an improvement in general eating habits, and almost 60% perceived that pupils were now consuming more fruit and vegetables as part of their school meals. The most popular suggested modification for the initiative was not for a radical overhaul of its operation, but for its extension to cover more pupils on a more frequent basis. Similarly, one of the few complaints from a minority of local authority respondents was that the money provided by the Scottish Executive for the initiative was not always adequate, especially in that they wanted to cover more pupil years, or improve other elements of the scheme, such as providing a wider variety of fruit. A minority of local authority and school respondents held more negative views. It was said that the initiative was disruptive for schools, the fruit supplied to schools was not always of the highest quality, the storage facilities within schools were not always adequate and school

2
staff should be paid to compensate them for preparing and distributing the fruit. However, the overwhelming consensus was that problems were more common in the early phase of the initiative, and that once these difficulties were addressed a routine had been established which allowed the smooth operation of the scheme. In addition, it was also emphasised that such minor difficulties were a price worth paying as the benefits of the initiative far outweighed any negative features. It should be noted that not one local authority respondent thought that the initiative should not continue, and only 5 schools (1%) called for the initiative to be curtailed. The research only sought the perceptions of local authority and school-based staff, and did not gather the views of pupils and parents or carers. In addition, it was at times difficult to separate the potential impact due to the free fruit initiative and wider policy initiatives, such as Hungry for Success. A minority of respondents argued that the positive effects they had observed were due to a number of factors, and not just the free fruit initiative. Again, though, the broad consensus was that the free fruit initiative had been very successful, and many respondents perceived that the positive impact they observed in relation to the eating behaviour of the pupils was due in no small measure to the initiative alone. Due to the overwhelmingly positive reception to the initiative, it is clear that major modifications to its operation would not appear to be necessary. However, the changes suggested by the respondents tended to call for an expansion of the initiative. Therefore, the provision of free fruit to all or more primary years, or the provision of fruit on a more frequent basis, would find the support of a majority of respondents in this study. Obviously, though, most of the suggested changes would have significant cost implications to the Scottish Executive, and it is beyond the scope of this evaluation to make such recommendations. What is clear, though, is that the Free Fruit initiative has been very favourably received by local authority and school staff, it has been thought to be responsible for increasing fruit consumption and encouraging the adoption of more healthy eating practices in children living in communities of different socioeconomic status across Scotland and is valued very highly at both the local authority and school level alike.

1
1. INTRODUCTION Poor diet is recognised as a significant contributor to Scotland’s poor health record. Improving children’s diet can have a major impact on the health of children with beneficial outcomes for educational attainment, physical well being and improved health later in life. Healthy eating patterns established in childhood are more likely to lead to healthy eating later in life. The national Free Fruit in schools initiative aims to provide one portion of fruit three times a week during term time to all primary I and primary 2 pupils in local authority managed schools. The initiative is an additional measure to the recommendations made by the Expert Panel on School Meals in their Report, Hungry for Success1. Both initiatives are part of the Scottish Executive’s Health Improvement Programme which recommends eating more fruit and vegetables. Improving the uptake of school meals and fresh fruit is also an essential part of supporting those children in most need. The Free Fruit initiative targets younger children where eating fruit is most likely to be habit forming and where health gain might be greatest in the longer term. Many of the primary 1 and primary 2 pupils will have received fruit in nursery school and this initiative continues to encourage children to develop the habit of eating fruit. The initiative may also discourage them from snacking on high fat, sugar or salt alternatives and also contribute to an improvement in dental health. Findings from a similar scheme piloted in England, the National School Fruit Scheme2, (NSFS) reported a positive impact on attention levels, learning ability and children’s behaviour generally. Over half the schools (55%) involved in the scheme also reported an improvement in the ethos and atmosphere in the classroom. The NSFS scheme helped some children overcome a reluctance to eat fruit while others tried fruit they had never eaten before. In some cases children were eating more fruit generally instead of less healthy options. The Scottish Executive has provided £2m per year for financial years 2003-04 to 2005-06 to introduce the Free Fruit initiative across all publicly funded schools in Scotland. The initiative had been implemented in most schools by December 2003 and the 2005 SEED School Meal census shows that almost 100% of primary schools were giving free fresh fruit to P1 and P2 pupils. Only four local authorities did not report full coverage of the initiative within all of their primary schools. The Scottish Centre for Social Research (ScotCen) was commissioned by the Schools Group Analytical Service Unit in the Education Department of the Scottish Executive in February 2005 to evaluate the implementation of the Free Fruit in Schools initiative in Scotland.
1 Hungry for success available on www.scotland.gov.uk/library5/education/hfs-03.asp 2 The National School Fruit Scheme Evaluation Summary available on www.doh.gov.uk/schoolfruitscheme

2
2. AIMS AND OBJECTIVES 2.1 AIM OF THE EVALUATION The main aim of the research was to:
• evaluate the implementation of the Free Fruit initiative, focusing on how local authorities and schools have implemented the scheme.
2.2 EVALUATION OBJECTIVES The main evaluation objectives were:
• to examine issues surrounding supply and distribution to schools within local authorities, such as the nature of the supplier, perceptions of the quality/quantity of fruit and costs incurred.
• to ascertain how schools operationalise the scheme, for example, in terms of storage,
preparation and distribution, any health and safety implications, any wastage of fruit, perceived impact on the work of the school and any additional costs involved.
• to investigate whether the Free Fruit initiative had any perceived impact on the eating
habits and behaviour of the pupils, as well as links between the initiative and the taught curriculum, and any observed effects on classroom behaviour.
• to set the above within a policy context at local authority and school level. For
example, did the local authority and/or schools have healthy eating initiatives before the free fruit scheme, what links exist with other policies or initiatives, such as the health promoting school concept, etc.
3
3. RESEARCH DESIGN AND METHODS 3.1 SUMMARY OF RESEARCH DESIGN The following research design was utilised:
Six in-depth qualitative interviews with key stakeholders, with members of the project steering group, Scottish Executive Education Department staff and local authority respondents.
Qualitative pilot work in schools. Three schools were selected to cover particular study interests (special school, rural school with composite classes, urban “deprived” school) and qualitative interviews carried out with members of school staff, including the head teachers, primary 1 or 2 class teachers, janitors and members of catering staff. Direct observation was also utilised.
Semi-structured telephone interviews with local authority officials. Interviews were conducted with 47 professionals who were able to speak from a policy and operational background.
A questionnaire survey of a representative sample of 510 primary schools. 458 questionnaires were completed, a response rate of 90%.
Each of these research components is described in more detail below. 3.2 KEY STAKEHOLDER INTERVIEWS ScotCen conducted interviews with seven key stakeholders (a joint interview was conducted on one occasion). The key stakeholder interviewees represented Scottish Executive Education Department officials and members of local authority staff. The in-depth interviews covered issues such as the background to the Free Fruit Initiative, the hopes and expectations for the initiative and the evaluation, perceptions of impact and success so far as well as the advisability of the initiative continuing in its current format in the future. Views elicited in these interviews were used to help frame questions for both the pilot qualitative research phase and the following telephone survey of local authority respondents, as well as the questionnaire survey of schools. The interviews were taped, and took place on a face-to-face basis. All of the interviews were conducted in March 2005. 3.3 QUALITIATIVE PILOT WORK IN SCHOOLS Three schools were selected after discussion with the steering group to cover a range of particular interests of this study, namely a special school, an urban deprived school and a rural school with composite class. Researchers visited these schools in order to carry out face-to-face interviews with members of school and teaching staff involved with the implementation of the Free Fruit Initiative. Interviewees included head teachers, primary 1 and 2 teachers, janitors, school secretaries and members of catering staff. In order to minimise disruption to the schools involved, no more than 5 members of staff were interviewed. This qualitative scoping work was carried out in March 2005. These interviews addressed all aspects of the initiative within the school, from distribution of fruit to and within the school to consumption by pupils. These interviews were recorded by the interviewer writing full notes at the time of interview, before writing a near-verbatim

4
account as soon as possible after the completion of the interview. They were tape-recorded to assist this process, with the consent of the interviewee, but were not routinely transcribed. In addition, the researchers were able to witness the fruit scheme in operation in the classroom, dining hall and playground. This direct observation helped inform the research team in relation to the implementation of the initiative and was useful in terms of questionnaire and schedule design. 3.4 LOCAL AUTHORITY SURVEY A letter was sent by the Scottish Executive Education Department to Directors of Education in every local authority area, outlining the project and the proposed nature of the local authority and school surveys and seeking their permission for the research to be conducted. After consent was granted, the researchers contacted the “Hungry for Success” local authority contact in the first instance, and asked for the name and contact details of the individual(s) best placed to comment on both the policy and operational context of the Free Fruit Initiative. Telephone interviews were carried out with these local authority contacts using a semi-structured schedule. In total, 47 interviews were carried out, with 15 local authorities providing two interviewees. A response was received from every local authority area, although not every respondent was able to answer all of the questions. Similarly, additional follow-up was necessary in some cases to complete all of the sections of the interview. Questions addressed previous schemes employed by the council, the supply and distribution to schools within local authorities, the nature of the supplier, perceptions of quality/quantity of fruit, the nature of the distribution chain, any costs incurred and differences in uptake and implementation among schools in the area. As a result a lot of qualitative, as well as quantitative, information was gathered. These interviews were recorded by the interviewer writing full notes at the time of interview, before writing a near-verbatim account as soon as possible after the interview had been completed. They were tape-recorded for back-up purposes, but were not routinely transcribed. These interviews were conducted between April and July 2005. 3.5 QUESTIONNAIRE SURVEY OF SCHOOLS 3.5.1 Sample of schools There are over 2300 local authority publicly-funded primary and special schools in Scotland. After seeking the advice of the steering group, the researchers drew a random sample of 510 mainstream and special primary schools, stratified by the Scottish Executive six point urban-rurality classification. As a result of the relatively large sample size, every local authority area in Scotland was covered, and it was possible to carry out analyses looking at different levels of free school meal entitlement, school size, as well as the urban-rural categorisation. After guidance from the steering group, an eight page questionnaire containing fixed choice responses, as well as five open-ended questions, was designed. Questions addressed every aspect of the implementation of the scheme, as well as the staff’s perceptions of its impact, success and possible continuation and extension.

5
The questionnaires were sent out to schools in late April 2005. They were sent to the Head Teacher in the first instance, with advice on how to complete the form, as well as to which member(s) of staff were the most appropriate respondent(s). 3.5.2 Telephone follow-up After allowing 3 weeks for the questionnaires to be returned, the schools who did not respond were telephoned by specialist research interviewers in order to offer staff members to complete the questionnaire by telephone. These interviews commenced in May 2005 and were completed in late June 2005. 3.6. ANALYSIS The key stakeholder interviews were tape recorded, fully transcribed and entered into N6, a qualitative analysis programme. Semi-structured interviews (telephone and face-to-face) with local authority and school-based staff were recorded by the interviewer taking full notes at the time of interview, before preparing a near-verbatim account as soon as possible after the interview. These accounts were transcribed and entered on Microsoft Access, to aid analysis. Questionnaire data was collated, processed and analysed using SPSS. Frequencies and cross-tabulations were conducted, and statistical significance testing was carried out, where appropriate. Open-ended question data were entered on Microsoft Access to aid analysis.

6
4. RESULTS 4.1 LOCAL AUTHORITY SURVEY 4.1.1 Response rate A total of 46 telephone interviews were conducted with local authority respondents from 31 of the 32 authorities. The respondent from the remaining local authority self-completed the questionnaire. In 15 of the authorities interviews were conducted with two respondents in order to cover both the operational and policy context, whereas in 15 areas one respondent answered questions from both these perspectives. 4.1.2 Other similar schemes Respondents were asked if there were any similar schemes in their area which aimed to provide fruit/vegetables to pupils before the Free Fruit initiative was implemented. Two-thirds of local authorities (n=20) reported that they had had some sort of scheme running before the Free Fruit initiative. These varied from large, well established city wide schemes such as Fruit Plus which provided free fruit to all primary and nursery school children on a daily basis and Snack Attack which provided fruit to all primary classes three times a week, to a number of areas which introduced fruit into school tuck shops for a trial period or offered free fruit one day a week for a limited period. Funding for these schemes came from a variety of sources including the Scottish Executive (Health Improvement Fund, Hungry for Success), Health Boards, Local authorities (Better Neighbourhood Services) and the New Opportunities Fund (NOF). The introduction of the Free Fruit Initiative affected schemes in a number of different ways. In some cases the funding which had been used previously to provide fruit to P1/P2 was used to extend the scheme to other primary years or groups, e.g. a scheme funded by NOF which previously only included some schools was extended to include other schools in the area. In another case, it allowed the local authority to expand and target their resources to areas of greatest need. In one area, the introduction of the scheme increased the number of days P1 and P2 pupils received fruit, from 1 day to 4 days. For the Snack Attack project it was said that free fruit was previously only available free of charge to those who received free school meals; since the introduction of the Free Fruit Initiative fruit was available free of charge to all pupils. Some respondents reported that the introduction of the Free Fruit Initiative had not affected the local scheme either because the target group for their scheme was different or, for example, the fruit tuck shops continued to operate. 4.1.3 The operation of the free fruit initiative in different local authority areas Respondents were asked a series of questions as to how the Free Fruit Initiative was currently run in their area. The first question in this series asked what percentage of primary, special, nursery and secondary schools had been covered by the initiative. All authorities reported that the scheme had been implemented in 100% of their primary schools. (However, most recent figures published by the Scottish Executive suggest that four

7
areas had not yet implemented the initiative in all of their primary schools.) A majority (n=23) said that they had also implemented the scheme in all the special schools in their area. One local authority had introduced the scheme into 75% of their special schools. Conflicting responses were given by the two respondents in two of the authorities, with responses ranging from 0% to 100% of special schools being involved. Of the remaining authorities, two had not introduced it into any of their special schools, a few areas stated that they did not have such schools in their area and one professional did not know whether the initiative had covered special schools. It was stated that nursery schools in the majority of authorities (n=24) were not involved in the initiative. Seven respondents from seven different authorities reported that the Free Fruit Initiative had been introduced into their nursery schools. However in four of these authorities, in which more than one respondent answered questions, conflicting views were given with the other respondent saying that the scheme had not been introduced into the nursery schools. The respondent from the remaining authority did not know whether nursery schools were involved. No local authority appeared to have implemented the scheme in secondary schools. 4.1.4 Entitlement to free fruit In the current Scottish Executive Free Fruit initiative all pupils in P1 and P2 classes are entitled to free fruit in the different local authorities. In addition, local authority professionals stated that P3 pupils in composite P2/P3 classes also received free fruit in 13 of the areas (see Table 4.1). In one of these authorities funding from the ‘healthy’ tuck shop run by the school was used to pay for the additional fruit for the P3 pupils. In six local authority areas all children in schools with a small school roll received fruit and in another area all children up to 7 years of age were included. Respondents in two areas said that all of their primary schools gave free fruit to all pupils. Table Error! No text of specified style in document.4.1 Current entitlement to free fruit in primary schools and frequency of distribution
Number of local authorities Entitlement to free fruit P1& P2 only 10 P1 & P2 plus P3 in composite classes 13 P1 & P2 and additional or all pupils in small schools 7
All primary years 2 Frequency of distribution 1 portion three days per week 28 1 portion five days per week 3 Don’t know 1
In the majority of local authorities (n=28) pupils were given one portion of fruit three times a week. In three authorities pupils received one portion of fruit five days a week (see Table 4.1).

8
4.1.5 Producers, suppliers and distribution of fruit Respondents were asked who produced or supplied the fruit to schools in their area. Respondents in 9 local authority areas said that the school meals service was the supplier of fruit for the initiative and in 4 of these areas local suppliers of fruit were also involved. In the majority of areas (n=18) fruit was supplied by a local fruit or fresh produce wholesaler. A community food initiative and a housing association were involved in supplying fruit in two areas. In the remaining three areas, local shops such as Morrisons, the Co-op and a local greengrocer supplied the fruit for the initiative. Some authorities used a combination of suppliers. Only one respondent did not know who supplied the fruit for the initiative. In nearly all cases the supplier of the fruit also distributed the fruit, although in seven authorities it was also mentioned that local authority transport was involved. Two local authorities who were supplied by the same company stated that another organisation was responsible for distributing the fruit to schools. In the majority of local authority areas (n=26) the fruit supplier was chosen by the local authority alone (Table 4.2). In four areas, schools also had some input into the choice of supplier. Three of these were in rural and remote areas. In one area the primary schools alone chose who supplied their fruit. In the remaining area, one respondent reported that the local authority chose the fruit supplier but the other thought that the external contractor was responsible. Responses were almost identical when the professionals were asked who chose the fruit distributor in the area. The only difference was a respondent from a rural area who said that the fruit distributor was chosen by the local authority only, with schools not being involved in this choice. Table 4.1 Choice of fruit supplier
Number of local authorities
Local authority only 26 Primary school only 1 Both local authority and schools
4
Mixed response 1 Total 32
4.1.6 Satisfaction with the free fruit initiative in local authorities Respondents were asked if they were satisfied with quality and quantity of fruit delivered to schools in their area. The majority of authorities were very or quite satisfied with the quality of fruit delivered to them (Table 4.3). Table 4.2 Satisfaction with quality of fruit delivered to schools
Number of local authorities
Very/Quite satisfied 30* Not very satisfied 3* Total 32 *in one of these areas there was a difference of opinion between the two respondents; one was quite satisfied, the other not very satisfied with quality.

9
Some authorities relied on feedback from head teachers, staff and parents as to the quality of fruit whilst other authorities have carried out more formal surveys/evaluations of the initiative:
“We implemented a survey throughout schools; feedback showed 88% said the quality was good/very good. Questionnaire survey organised by Education Department.” Respondent 9A “We have feedback from schools on a four weekly basis and we have very little problems with the quality of fruit.” Respondent 29B
In some authorities it was said that there had been problems with the quality of fruit but, in most cases, when this was raised with the supplier the problems were resolved. Some authorities have also increased the price they pay for fruit in order to improve the quality.
“We have very good dialogue with them and they know what our requirements are and our standards. If we get a bad batch of fruit then it is picked up and immediately replaced within the hour” Respondent 19A “We have had trouble with the quality of fruit delivered from X Fruit and Veg suppliers and have arranged to have a bag of fruit from Y once a week. We have upped the price from 12p per portion to 18p recently to try and get better quality of fruit coming in.” Respondent 11B
Respondents from four authorities mentioned that the quality of the fruit was not consistent and another nine areas reported that they had problems with ripeness of the fruit delivered. Most of these said that the fruit delivered was not ripe enough and therefore could not be given to the children. A smaller number mentioned that some fruit was over ripe. Although some areas were able to save the unripe fruit until later in the week this was not an option for schools in all areas, presumably because of storage facilities and distribution patterns, and it had to be sent back to the supplier.
“Because we are rural we get a delivery once a week on Tuesdays, sometimes the bananas are green, pears unripe or strawberries soft. We phone them when we are unhappy and if possible get fruit uplifted or the catering staff have to swap the fruits and use later.” Respondent 8B
One respondent stated that although they specified which fruit they wanted, the supplier sometimes changed the order if it was thought that the quality was not good enough or was not ready to eat. Respondents from several authorities mentioned that although they were not unhappy with the quality of the fruit they were currently supplied with they were looking at other potential suppliers to see if they could improve on quality. Respondents in a majority of the local authorities (n=30) felt that the quantity of fruit delivered to the schools as part of the initiative was at least quite sufficient. In the remaining two authorities the two respondents had different opinions regarding the quantity of fruit delivered. In both cases one respondent felt it was quite sufficient but the other felt that it was not very sufficient.

10
Respondents were asked what type of fruits and vegetables were supplied to the schools in their area. A wide range of fruits was mentioned in each area (see Table 4.4) There was no information from one area. Table 4.3 Fruit and vegetables supplied to schools
Number of local authorities Apples 31 Bananas 30 Melon 28 Green Grapes 28 Red Grapes 27 Oranges 26 Pears 26 Satsumas/clementines 25 Kiwi Fruit 24 Strawberries 22 Cherry tomatoes 22 Plums 21 Pineapple 19 Peaches/nectarines 16 Carrots 15 Mango 6 Dried fruit 6 Cucumber 5 Celery 3 Cherries/Raspberries/Blackberries 3 Fruit juice 4 Star fruit 2 Kumquats/ Physalis/ Snap peas 1
Apples, bananas, grapes, melon, oranges, pears and satsumas were supplied to most schools. A few local authorities supplied vegetables including carrots, peppers, celery, cucumber and, in one case, snap peas. Some authorities also have supplied more exotic fruits such as mango and star fruits. The school survey produced similar results (see p**), although there were some differences, such as fruit juice being supplied more frequently and cherry tomatoes less frequently than the local authority survey results would suggest. When asked which fruits were the most popular grapes were mentioned by most authorities (n=24). Other popular fruits included melon (n=10 areas), bananas (n=9), apples (n=9) and strawberries (n=6). Although apples were supplied to schools in every authority only 9 areas mentioned them as being among the most popular fruits, with 2 of these specifically stating that red apples were popular. Those who stated that apples and bananas were popular added that these fruits were more familiar to children who were more likely to know them from home. Other fruits mentioned as being popular by one or two authorities included baby tomatoes, kiwi fruit, satsumas and fruit juice. On the whole, the school survey gave similar results. When the respondents were asked their views for the popularity of these fruits most reported that fruits like grapes, melon and strawberries were sweet and easy to eat. The size of these fruits was also important in their popularity and larger fruits such as melons and apples were more appealing when cut up into a more manageable size. Packaging of fruits was also a factor mentioned by 2 authorities:

11
“The mixed bag of apple and grapes we do once a week is the most popular because it is cut up.” Respondent 11A “Bananas, kiwi fruit, grapes and melon, they are easy to eat and are all prepared in disposable packs.” Respondent 8A
Fruits considered to be least popular included tomatoes (n=15 areas), oranges – particularly big oranges (n=11), apples – again depending on size (n=5) and carrots (n=4). Other unpopular fruits mentioned by one or two authorities included red peppers, vegetable sticks, pineapple, celery, melon, bananas, satsumas, peach, kiwi fruit, dried fruit, and anything that the children were not familiar with, such as peaches, pineapple and mango. Again, the results of the school survey support this, with cherry tomatoes perceived as being the least popular fruit among pupils (see p**). It was reported that tomatoes were unpopular simply because children did not like them. The unpopularity of most of the other fruits cited above was due to the difficulty of eating them either in terms of preparation (eg. peeling oranges) or the size of the fruit. The mess created in peeling oranges or cutting up melon was also a factor in the lack of popularity of these fruits for some. Fruit with stones and pips also caused problems for some authorities.
“Apples, because they are too big, the kids only take a couple of bites and oranges because they are too difficult to peel.” Respondent 21B “Some children are too lazy to eat whole fruit, we tried quartering the apples to make them more appealing but they turned brown too quickly.” Respondent 13B “We tend not to use stoned fruit because of the safety issues, orange pips fall into that category.” Respondent 25A
When asked whether they were satisfied with the variety of the fruit delivered to schools the majority of the authorities reported that they were at least very satisfied (n=29). Two authorities were not very satisfied with the variety of fruits delivered to schools in their area. One of these respondents simply wanted an increase in the range of fruits available whilst for the other respondent the problem with the limited range of fruits was more to do with the way the scheme was operationalised in that area. This procedure for distributing fruit was due to be changed in the following year. In the remaining local authority, the two respondents had differing views concerning the variety of fruit on offer.
“We are limited in the variety of what we can provide because of the way we organise the scheme. The fruit is delivered and washed by the Catering Services centrally on a Friday ready for delivery to schools on a Monday to be given out to the children on Tuesday, Wednesday and Thursday. This means you cannot use fruit which needs to be cut up i.e. melons or pineapples or to be divided e.g. grapes. We can’t use soft fruit either which might go off.” Respondent 5A

12
Some authorities (n=5) reported that the lack of variety in fruits was a result of budget restrictions. A few respondents also reported other problems with the varieties provided.
“We have a dilemma of cost versus what they will actually eat, whole apples are cheaper than strawberries, strawberries are more popular and more expensive.” Respondent 13B “Sometimes the fruit supply may get a little repetitive and it’s good to encourage children to eat a variety of different fruit.” Respondent 3A
“We get a lot of apples and not a high frequency of other types of fruit.” Respondent 11A
Two authorities have tried to introduce a wider variety of fruits with variable success:
“We have tasting sessions and through this we introduce more exotic fruit and enlarge variety.” Respondent 5A “Since we have run the scheme we have tried a free fruit platter with more exotic fruits for the kids to try but they wouldn’t take it.” Respondent 11B
4.1.7. Satisfaction with fruit supply and distribution The majority of local authorities (n=30) were at least quite satisfied with the performance of their fruit suppliers, with only two areas stating that they were not satisfied with their suppliers. One of these respondents did not specify why they were dissatisfied but said they were buying in “quality assurance measures”. The two respondents from the other authority who were not satisfied with their supplier had several complaints about them:
“We have had problems with quality and hassle with late deliveries. It needs to be at the kitchens by 11 am – that hasn’t always happened. We have run a day late; we aim to do it on Tuesday, Wednesday and Thursday but have sometimes and to do it on Wednesday, Thursday and Friday.” Respondent 11B
Another respondent from a rural local authority said that their biggest problem was maintaining supplies to smaller schools. Also, some area respondents, although they were largely satisfied with their supplier, did want to make changes to their arrangements and planned to do this by negotiating with the supplier either informally or when the contract was up for renewal:
“Some suppliers are reluctant to come out to an individual school with what is really a domestic volume of fruit. We have concern that we may struggle to maintain the supply at a realistic cost.” Respondent 20A:
“The next round of tendering that goes out we are going to have to build more flexibility into the supply contract which will permit the supplier to take more advantage of seasonal fruit.” Respondent 23A

13
Many respondents reported that they had good relationships with their supplier and that they were reliable and responded to any problems quickly. One respondent felt that their good relationship with their supplier was due to the fact that they were locally based. Respondents were also asked how satisfied they were with the performance of their fruit distributors. In many cases the suppliers of fruit also distributed fruit to schools and therefore, not surprisingly, the level of satisfaction with the service was similar to that of the supplier. Respondents in 30 local authorities were either very satisfied or quite satisfied with the performance of their fruit distributor. There was no response from one authority and the professionals from the remaining authority reported that they were not very satisfied with their fruit distributor. However when asked why this was the respondent commented on the quality of the fruit distributed rather than distribution per se. Two of the island authorities commented that adverse weather conditions did affect distribution of fruit to schools on some occasions and this meant that sometimes the schools did not receive fruit. Another mainland authority reported that more remote schools did not receive fruit at the most convenient time. A few other authorities had experienced distribution problems initially but these had been resolved.
Problem to outlying schools as they do not get their fruit until the afternoon and these schools would prefer to have the fruit for the morning. Respondent 23A
It works quite well after a rocky start. Some difficulties with some schools but these have settled down. Respondent 32A
4.1.8 Evaluation of Free Fruit initiative in local areas Respondents were asked whether they were evaluating the Free Fruit scheme in their area and if so, how they were conducting the evaluation. It was stated that the majority of authorities (n=25) were carrying out some form of evaluation of the scheme. Four authorities reported that they were not and in the remaining three authorities there was a difference of opinion between the two respondents as to whether they were carrying out any evaluation activities or not. Most of those who were conducting a local evaluation said that were doing this by means of a questionnaire survey (n=14). Local authority catering and education services and health promotion departments within health boards were all mentioned as being involved in carrying out evaluations. In one case an independent consultant was employed to conduct the evaluation. Teaching and catering staff as well as parents and pupils were surveyed. Several respondents mentioned that their scheme was being evaluated as part of Hungry for Success. Ongoing consultation and feedback from school staff and pupils were also used to evaluate the initiative in some local authority areas. Monitoring data on deliveries of fruit to schools and fruit returned from kitchens were mentioned by some respondents as a means of monitoring the initiative in some areas. However, it is very difficult to ascertain from these data the nature of the evaluations conducted, and the quality of research evidence being gathered locally. It is likely that both formal and anecdotal evidence was being used to support the view expressed by local authority respondents that most areas were evaluating the initiative.

14
Schools were sent two questionnaires, one for the teachers and one for the children. Teachers were asked their views and children needed to tick ‘smiley face’ boxes. Respondent 20A We are working with Health Promotion and with schools, we have sent out an extensive questionnaire to schools and we make regular visits which are on-going. Respondent 15A
Not officially evaluating this initiative. We are evaluating Hungry for Success and the Free Fruit initiative can be part of that. Respondent 17A Yes, through the Health Board and it is now the remit of the Hungry for Success Development Officer to evaluate the Free Fruit initiative. She will be going out to schools to speak to pupils, teachers and catering staff. Respondent 27A
4.1.9 Policy and Guidance from Scottish Executive In the guidance issued to local authorities to implement the scheme they were asked to consider local sources of fruit, the variety, quality and presentation of fruit and the methods employed to minimise wastage. This next section presents the local authority respondents’ experiences of the issues covered by this guidance. Selection of fruit suppliers Respondents were asked why they chose the organisation they did to supply fruit and vegetables for the scheme. Most of the authorities reported that they chose the supplier for one of three main reasons:
• That they were already the school meals contractor for the authority (n=23) • That they were already supplying fruit to schools in the area (n=2) • That they won the contract to supply fruit through a tendering process (n=2)
Therefore, most of the areas were being supplied with fruit by the school meals contractors. Three authorities reported that there was only one supplier in the area. Two of these authorities were Island authorities. The third authority reported that the supplier was ‘the only one who could guarantee the volume’. Another authority chose their supplier because it was local. In the remaining authority it was said that some of their schools used the school meal service while other schools in the area used local suppliers. Table 4.5 demonstrates that most suppliers were locally-based. Table 4.4 Where fruit supplier based
Number of local authorities Supplier based in LA area 16 Supplier based outside LA area 11 Suppliers both inside and outside LA area 3
D/K 1 Total 31
Data missing for 1 area

15
Previous experience with working with the contractor as well as the contractor’s food handling experience were important factors in the choice of supplier. Those who were not using the existing school meals supplier chose their fruit supplier for similar reasons. However, one authority chose their non-school meals supplier through a tendering process.
“X Contract chosen because staff are already trained (hygiene etc) mainly with chopped fruit, presentation and their experience of distribution through school meals service.” Respondent 3A “Because they were local suppliers, they already supplied to the Local authority and they are the local supplier.” Respondent 30A “The suppliers were on the basis of tender, looking at quality and price.” Respondent 6A
Provision of seasonal fruit All but one of the authorities reported that where possible they supplied seasonal fruit and vegetables. The only authority that did not supply seasonal fruit and vegetables said that the fruits they supplied were available all year round. The seasonal fruits were mainly limited to strawberries in summer and satsumas in winter. However berry fruits, such as raspberries, kiwi fruits, melons, peaches and nectarines were also mentioned by a few authorities as fruits supplied when in season. Several respondents mentioned that their supplier alerted them to offers on seasonal fruit which helped them to reduce costs as well. One local authority commented that they would like their supplier to have more flexibility so that they could take advantage of seasonal fruit.
“We have updates from the supplier to tell us what is in season or products that are value for money, we then adjust our monthly rota.” Respondent 21A “The Catering Department orders the fruit that they want, we would like the supplier to have more flexibility so that in season fruit could be used more.” Respondent 23A
Respondents from the majority of authorities (n=21) reported that they did not experience any problems in providing seasonal fruit and vegetables. Respondents from eight areas said they did experience difficulties in providing seasonal fruit and five of these cited cost as the problem. This is at odds with some of the responses to the previous question above which mentioned that providing seasonal fruit and vegetables helped reduce costs.
“Cost sometimes makes it difficult for us to purchase good seasonal fruit.” Respondent 17A “Need to balance cost, everything has to be done within the budget.” Respondent 5B
Those who had difficulties in providing seasonal fruit and vegetables due to cost overcame these difficulties in a number of ways, including supplying soft fruit if it could be bought for a ‘good’ price, providing frozen fruit and fruit juices and buying other cheaper fruit to allow more expensive seasonal fruit to be purchased.

16
“We can get more expensive fruit which is in season if other seasonal fruit e.g. apples are becoming cheaper. We can juggle the price around.” Respondent 12A
Professionals in two other authorities stated that that there had been a few problems with storage when providing seasonal fruit, particularly in relation to more perishable fruit (presumably soft fruit). However one of these authorities reported that storage problems had been resolved and the other was addressing the problem by giving schools information on time limits for storage of fruit. Two island communities reported that providing fruit was a problem all year round. Provision of organic fruit The majority of authorities did not supply organic fruit and vegetables and most of these (n=24) cited the higher cost and/or the lack of availability of organic produce as obstacles to its provision. Some of these authorities had actively considered using organic fruit whereas others had not. Three authorities did supply “a low percentage” of organic fruit but in two of these authorities this was limited to one or two schools in their area. It was said in two areas that they were considering introducing organic fruit.
“At the time we didn’t consider it, I think it might be difficult for the suppliers to source at the level and volume we would require and it would be price sensitive.” Respondent 8A “We have not looked at that specifically yet, no demand for it has been raised. It is pricier and the budget is already inadequate for the initiative.” Respondent 11A “Possibly something we haven’t considered. The budget is fairly tight, we are working to 12-14 pence a portion, I don’t think organic fruit would come into that.” Respondent 21B
“Looking at increasing the amount of organic food in schools. We are looking to identify ‘organic schools’ where food is predominately organic. We discussed this at the last implementation group meeting.” Respondent 22A
Preparation of fruit Respondents were asked if the fruit supplied to their schools was prepared in any way. Only professionals in two authorities reported that they did not prepare fruit in some way. In one of these areas the fruit was supplied pre-washed; in the other area the fruit was washed in school. In both these areas children were given whole fruits. In all other areas at least some of the fruit was prepared in some way. This included washing the fruit, fruits such as melons, apples etc being chopped or sliced, oranges being quartered, grapes being de-stalked, strawberries being de-hulled, etc. Fruit was then often portioned in small pots or dishes and, in some cases, bagged. Preparing the fruit in this way made it more attractive to the kids and easier for them to eat.
“Yes, we have 2oz pots to hand out to the children. Melon will be cut into wedges or pieces, depending on what the school prefers, strawberries are

17
washed and hulled, grapes are washed and destalked and all put into pots. Oranges are quartered and pineapple is chopped.” Respondent 8B “Yes we spend a lot of time preparing fruit to make it as attractive to the children e.g. strawberries are cut up and put into pots, cling filmed with a spoon, similarly grapes are portioned.” Respondent 13B
In most authorities it was said that fruit and vegetables were prepared in school by school catering staff. The respondents added that in schools without kitchens fruit was prepared by other school kitchens in the authority area and then delivered to the schools, in a few cases by the fruit supplier. In one local authority area it was stated that all fruit preparation was carried out by the fruit supplier:
“Yes, sometimes fruit is prepared by Catering Staff and delivered to the schools from main kitchens, others it is prepared within our school kitchens.” Respondent 14A “No, we have tried to cause minimum inconvenience to schools, that is part of our success, any portioning that is needed to be done i.e. grapes, that is done by the supplier.” Respondent 25A
Minimising food miles Respondents were asked what guidance they had been given to ensure that the food miles of the fruit provided to schools were minimised. Almost all of the local authority respondents reported that they had received no guidance, were not aware of any guidance or were not sure if they had been given any guidance regarding minimising the ‘food miles’ of the fruit provided. Nevertheless respondents from one of these areas were aware of local guidance relating to this issue. Another two respondents mentioned that they used local suppliers which helped in cutting down food miles. Two local authority professionals felt they could do little to reduce food miles.
“Don’t know of any guidance but adhere to Council’s strategies concerning supply and distribution ‘food miles’. Respondent 5A “No official guidance given but we look at this issue and use local suppliers where necessary.” Respondent 14A “Our fruit comes up from the Central belt, that’s where the markets are. We are aware of it but we are not sitting in the middle of the city.” Respondent 20B
Respondents from the two remaining authorities were aware of guidance issued by the Scottish Executive on this matter. Neither respondent was able to say how the guidance had been implemented although one did say that they took the guidance into consideration when implementing the scheme. Wastage of fruit When asked what percentage of the fruit and vegetables used as part of the initiative within schools ended up as waste estimates varied from 0% to 40%, with one respondent stating that 60% of vegetables in some schools were being wasted. Overall just under one-half of

18
authorities (n=15) said there was very little wastage of fruit. It was said in a further 9 authorities that 20% or less of the fruit was wasted. However, in some authorities respondents found it difficult to give an overall estimate for the area saying that it varied very much from school to school.
“In some schools the waste is as high as 20-30%, whereas in other schools it’s very low… and some have no waste at all.” Respondent 19B “Varies from school to school and the type of fruit offered. Some schools said that approximately 60% of veg was being wasted, some schools much lower.”
Respondent 20A As with guidance on food miles very few authorities had received or were aware of guidance on reducing levels of ‘wastage’ of fruit. Several authorities had introduced their own guidance and measures to reduce waste. These included:
• Not buying too much fruit • Reducing orders for fruit if a lot of children are off due to illness or on school trips
etc. • Providing fruit which the children like so less likely to leave or discard • Encouraging children to eat the fruit in the classroom rather than in the playground
where it could be wasted • Giving left over fruit to other children either in class or at school meals or to take
home • Using left over fruit to make fruit smoothies • Sending some left over fruit goes to the staff room • Composting the waste or giving left over fruit to animals.
The majority of authorities did not think that wastage of fruit was a problem for most schools. Some had experienced a problem when the scheme was first introduced but had dealt with this.
“Fruit not used goes into fruit desserts, wastage is so minimal it’s hardly worthy of consideration.” Respondent 23A “No, because by trial and error we try and meet the needs of the children and hopefully give them what they want to eat.” Respondent 32B
When asked if and how the level of wastage was monitored many respondents said they did not do this or they were unclear whether this was done in their authority. Those that reported that they did monitor wastage did this in a number of different ways. For some this was done quite informally, relying on feedback from teaching and/or catering staff in schools, or by ascertaining what fruit is returned to the supplier. Other authorities carried out more formal surveys or quarterly reviews.
“By questionnaires going out to schools, findings of questionnaires state 94% of fruit supplied is being consumed.” Respondent 9A
19
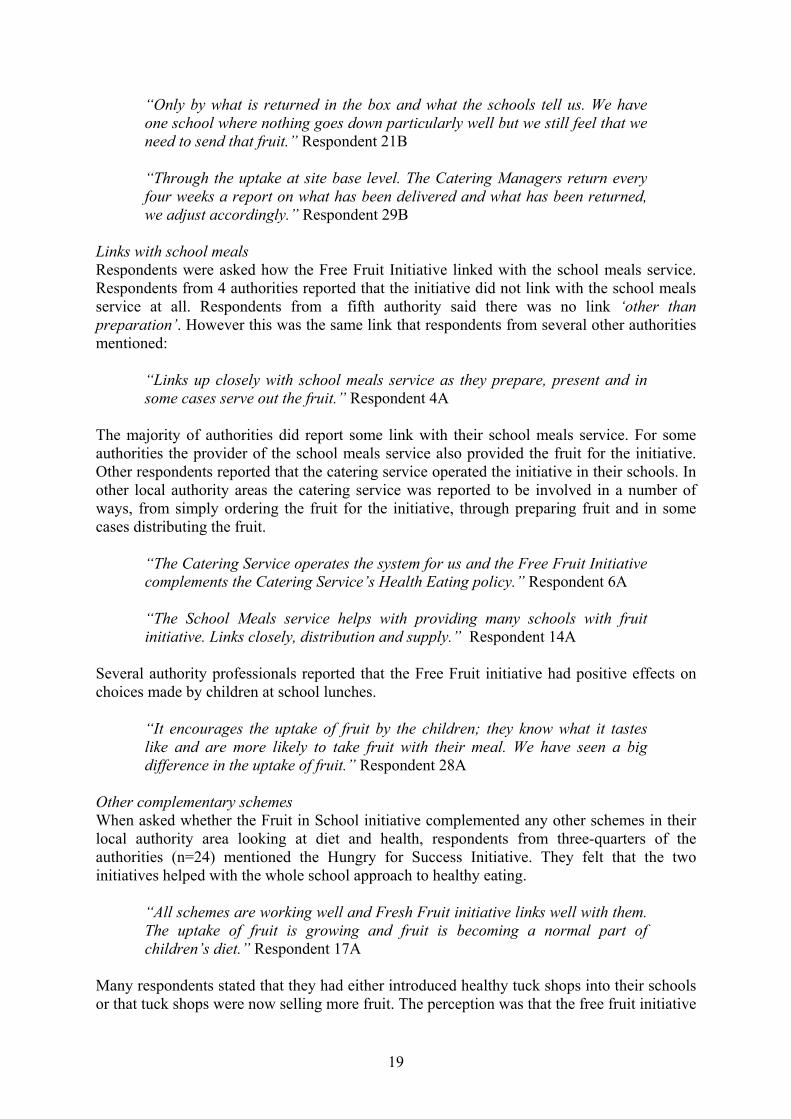
“Only by what is returned in the box and what the schools tell us. We have one school where nothing goes down particularly well but we still feel that we need to send that fruit.” Respondent 21B “Through the uptake at site base level. The Catering Managers return every four weeks a report on what has been delivered and what has been returned, we adjust accordingly.” Respondent 29B
Links with school meals Respondents were asked how the Free Fruit Initiative linked with the school meals service. Respondents from 4 authorities reported that the initiative did not link with the school meals service at all. Respondents from a fifth authority said there was no link ‘other than preparation’. However this was the same link that respondents from several other authorities mentioned:
“Links up closely with school meals service as they prepare, present and in some cases serve out the fruit.” Respondent 4A
The majority of authorities did report some link with their school meals service. For some authorities the provider of the school meals service also provided the fruit for the initiative. Other respondents reported that the catering service operated the initiative in their schools. In other local authority areas the catering service was reported to be involved in a number of ways, from simply ordering the fruit for the initiative, through preparing fruit and in some cases distributing the fruit.
“The Catering Service operates the system for us and the Free Fruit Initiative complements the Catering Service’s Health Eating policy.” Respondent 6A
“The School Meals service helps with providing many schools with fruit initiative. Links closely, distribution and supply.” Respondent 14A
Several authority professionals reported that the Free Fruit initiative had positive effects on choices made by children at school lunches.
“It encourages the uptake of fruit by the children; they know what it tastes like and are more likely to take fruit with their meal. We have seen a big difference in the uptake of fruit.” Respondent 28A
Other complementary schemes When asked whether the Fruit in School initiative complemented any other schemes in their local authority area looking at diet and health, respondents from three-quarters of the authorities (n=24) mentioned the Hungry for Success Initiative. They felt that the two initiatives helped with the whole school approach to healthy eating.
“All schemes are working well and Fresh Fruit initiative links well with them. The uptake of fruit is growing and fruit is becoming a normal part of children’s diet.” Respondent 17A
Many respondents stated that they had either introduced healthy tuck shops into their schools or that tuck shops were now selling more fruit. The perception was that the free fruit initiative

20
had helped break down the barriers for some children and encouraged them to eat more fruit. The free fruit initiative also complemented other schemes in local authority areas including Health Promoting Schools initiative, the provision of drinking water in schools, oral hygiene, school milk projects, breakfast clubs and after school clubs. Several respondents also mentioned that the Free Fruit initiative, as well as other healthy eating initiatives, were also being linked to the curriculum.
“Fruit consumption is popular, children are willing to try out different tastes, tuck shops are selling more fruit and barriers are being broken down.” Respondent 9A “It’s a natural part of Health Promoting Schools, the Hungry for Success and particularly the drive to have healthy tuck shops. The free fruit scheme has been the springboard for developing healthy tuck shops. Respondent 24A
“It has enabled teachers to link fruit with curriculum within the 5-14 health guidelines, integrating messages into lessons.” Respondent 25A
4.1.10 Problems encountered by initiative None of the respondents reported any major problems with the initiative in their area. Some had experienced problems in the initial stages of setting up the scheme but had largely overcome these. The difficulty mentioned most frequently by respondents was the time teachers had to spend on administering the initiative and the consequent loss of class time with the children. In some areas there was initially some resistance from teaching staff to the scheme for this reason. The problem was exacerbated in the view of some respondents by the recommendation that the fruit should be eaten in the classroom rather than in the playground. Time was also a problem in authorities where the catering staff members were involved in the initiative.
“We asked that fruit should be eaten in class, this did not always please the teachers as it often took away teaching time in class.” Respondent 9A “There were difficulties with some teachers seeing it as taking time out of class.” Respondent 13A “The first two months was difficult as it was something that people thought that they didn’t have time to do. The catering staff had to find time to prepare and deliver the fruit into the class room and the school had to find to incorporate it into lessons. Time has been the biggest issue. Respondent 21B
To help address the perceived lack of time school staff had to implement the initiative, respondents said they had to liaise with school staff – with head teachers and teachers – to convince them of the value of the initiative:
“Teachers accepted the importance of children being encouraged to eat fruit in the class room and not in the playground. Respondent 9A

21
“It was a lot of hard work to start with, I needed to pre-empt problems... I had frequent meetings with Head Teachers. There is no denying it’s a workload issue with all the changes with McCrone. A lot of time was spent listening to the concerns of staff.” Respondent 31A
Other difficulties experienced by some authorities included:
• Costs of initiative - funding available not enough to cover costs • Delivery of fruit to all schools, sometimes over large geographical areas • Problems with composite P2/P3 classes • Initial problems with finding reliable supplier(s).
Some of the authorities that experienced problems with cost of the initiative have subsidised it with money from their Hungry for Success budget (see below). Those that had problems with delivery have solved these problems in a variety of ways. One authority improved the packaging of the fruit, whereas another transferred responsibility for preparing the fruit from the supply company to catering staff within schools. In another authority with distribution problems the children receive the fruit in the afternoon rather than the morning. One large urban area which had to cope with the rapid expansion of the fruit scheme solved their problem by helping the company that delivered the fruit to gain access to more vans. 4.1.11 Facilitating factors The willingness, enthusiasm and commitment of both teaching and catering staff involved with the initiative were mentioned most frequently as the factors which facilitated the running of the initiative. The experience of catering staff and the existing school meal providers also greatly assisted the development of the initiative particularly with the preparation and distribution of fruit.
“The organisation by Catering Services, it’s made it easier to get it up and running as they have all the services in place.” Respondent 19B “Support from Head teachers, staff and from Janitors to deliver it.” Respondent 22A “Determination by everyone to make it work. The staff in schools who have embraced the initiative. It’s part and parcel of life now.” Respondent 29A
Others involved in the initiative, such as fruit suppliers, were also thought to contribute to the success of the initiative. Co-operation and partnership working between various council departments such as the catering services and education were also mentioned as factors in assisting the initiative. Funding was mentioned by a few respondents as being vital to the implementation of the initiative. The existence of Hungry for Success and the publicity surrounding it and healthy eating in general was considered by some to have assisted the introduction and acceptance of the free fruit initiative.
“It wouldn’t have come about without the resources from the Executive, resources and funding were absolutely key.” Respondent 25A

22
“Publicity that fruit is good for you and all the publicity that we have had from the Scottish Executive, ‘Hungry for success’ has facilitated it as well.” Respondent 23B
4.1.12 Usefulness of Guidance from the Scottish Executive The majority of authorities (n=26) thought that the guidance provided by the Scottish Executive was very useful or quite useful. Two authorities thought it was not very useful and respondents from three authorities were split on their views of the guidance (quite useful versus not very useful). Respondents in one area were not able to give a view on the usefulness of the guidance. Further probing on this question revealed that many respondents found the guidance clear, concise and helpful particularly when they were setting up the initiative.
“Very clear, it was essential at the start but have not had to pick it up and refer to it once the scheme was running. It was invaluable at the beginning.” Respondent 22A
There was criticism from respondents in some authorities, particularly those in rural areas, who felt that the guidance did not meet the needs in their locality. However, others said that they were able to adapt the guidance to suit their needs. There was criticism too from one respondent who thought the guidance was too prescriptive, although it should be noted that several other professionals disagreed with this view. One respondent felt there needed to be more guidance on portion size. Another suggested that it would have been useful to have a leaflet for parents about the initiative as there had been for Hungry for Success.
“Brilliant if you are sitting in the central belt like any other guidance that comes out but not very good if you are sitting in a semi rural area… It does not relate to the needs of anyone outwith the central belt of Scotland.” Respondent 20B “It is helpful but we have changed parts to make it fit in with our own guidance procedures.” Respondent 15A “It gave some guidance, it was too prescriptive i.e. fruit to be eaten in the class room, schools get very uptight about this.” Respondent 6A “They were fairly useful, we decided what would work best for our Authority within the guidelines were set. They were not prescriptive.” Respondent 32B
Guidance notes for schools Respondents were asked if schools in their local authority areas were given any guidance notes in relation to fruit hygiene, distribution in schools, etc. Some authorities did provide schools with guidance, mostly focusing on fruit handling and food hygiene. In some areas guidance on the storage of fruit was also mentioned. Advice on hand washing for both staff and pupils was also included in some areas. Some areas had previously issued guidance in connection with other fruit schemes in their area and in one area this built on previous training that teachers had received. In some authorities where

23
catering staff were involved in preparation of fruit guidance was not given out to schools as the catering staff members were already trained in hygiene and fruit handling.
“We produced a Fruit File Pack which provided information about how to handle fruit in schools, gave advice about hygiene, food handling and safety issues.” Respondent 12A “Within the schools, the staff have undertaken food hygiene courses in preparation of the scheme, also the structure was mainly in place as the staff do baking etc with the children.” Respondent 24A
4.1.13 Costs of free fruit initiative Respondents were asked to outline the costs of running the scheme in their area, to separate out elements of this into staff and equipment costs and to indicate whether they thought the money provided by the Scottish Executive had been sufficient to run the scheme. Almost every local authority area was able to provide cost data for the operationalisation of the free fruit initiative. However, in a number of areas it was stated that the costs provided were approximate only. Also, several respondents gave costs incurred by the scheme in the current and preceding years, and others identified the Scottish Executive component and gave an indication of the top-up cost met by the local authority. Given the very different areas covered by the local authorities, costs ranged from about £12K to £1000K. In terms of identifying staff and equipment as well as other set-up costs, some respondents were able to give quite a detailed breakdown of figures, whereas others were able to say whether additional costs above the Scottish Executive allocation were incurred, but found it difficult to state what they actually were. In areas in which funding was thought to be sufficient already (see below), it was often said that there had been additional costs at the outset of the initiative, but once the initial outlay had been met costs had reduced or stabilised in the following years. Table 4.6 Costs provided by Scottish Executive sufficient?
Number of local authorities More than sufficient 1 Quite sufficient 15 Not very sufficient 10 Not sufficient at all 2 D/K 1 Total 29*
*total does not add up to 32 as respondents from the same area chose different options. Table 1.6 shows that the majority of local authorities thought that the funding provided by the Scottish Executive was at least quite sufficient to run the initiatives in their schools. However, at least 12 local authorities perceived that this was not the case, although it is difficult to give precise local authority figures as in eight areas with two respondents different views were expressed. Although in most of these instances the second view was a “don’t know”, in three areas the responses were different combinations from the options in Table 1.6, and in one case ranged from “quite sufficient” to “not sufficient at all”. In a number of cases local authority respondents argued that Healthy for Success monies had been used to help subsidise the free fruit initiative. Other examples were given of shortfalls, or what could

24
be achieved with even more funding, for example, by extending the types of fruit supplied to schools. Examples of these open-ended comments are included below.
Yes, some staff had to be given extra hours, don't know what proportion… It was not sufficient in the first year and in the second year we obtained extra money. If we had extra money again, we could extend the range of fruit. Respondent 1A The original budget of £X meant under 16 pence per pupil, which is insufficient to buy a good range of high quality fruit and to cover extra labour costs in preparation. We have subsidised it using money from the Hungry for Success subsidy. Respondent 11A …We spent £500 in the first year on schools who did not have any units. Twenty five percent of funding pays catering staff and 75 percent pays for fruit… Do not have quite enough funding because of composite classes and maintaining seasonal variety, it would be good to get more money. Respondent 17A
4.1.14 Impact on fruit consumption and healthy eating The respondents were asked if they thought the free fruit scheme had increased fruit consumption among pupils attending primary schools in their local authority areas. Almost all (n=45) of the respondents said that fruit consumption had increased, with only two professionals stating that there was no evidence for such an increase. It should be noted that both of these respondents represented authorities in which another individual indicated that fruit consumption had increased among pupils. Those who reported an increase in fruit consumption gave a number of reasons to support their claim. Several respondents said that the results of formal evaluations of the initiative in the local schools demonstrated an increase in fruit consumption. In addition, it was stated that feedback received from school staff, parents and pupils was very positive and again supported the view that more fruit was being consumed. Related to this, it was also pointed out that there was an increased demand for fruit and vegetables from school tuck shops and for school lunches, although a few respondents also argued that this might be due to other initiatives, and not solely the free fruit scheme. A minority of the professionals also based their views on direct observations they made when on school visits. Two respondents reported that any fruit consumption was an increase in certain schools, the base level of consumption being so low or non-existent. The two professionals who argued that consumption had not increased thought that sales of fruit within the dining room remained the same and that pupils had become bored with the scheme.
We have had more requests from schools as a result to change to SNAG tuck provision, parents have also feedback when they have been supermarket shopping that their children have been asking to put fruit into their trolleys. Respondent 8A We have to talk the kids into eating the fruit, there will be some eating it who might not at home but it has not increased sales of fruit from the dining room. Respondent 11B

25
The canteens now order considerably more fruit and veg. Respondent 19B When we go out and about in the schools, talking to catering staff, pupils and teachers there is no doubt that fruit consumption has gone up. On days that fresh fruit is offered, unhealthy play piece is not brought in, on days that free fruit is offered there's definitely a number of children that bring in their own fruit. Respondent 23A 70% of schools noticed an increase of children eating more fruit as the initiative progressed. 53% put this down to the influence of their peers, 90% found at least the children were prepared to try the fruit. Respondent 30A
The question of whether the free fruit initiative also had a role in promoting healthy eating more generally in school pupils was also put to the local authority professionals. Only one respondent perceived that the initiative had no such role – this professional had previously argued that fruit consumption had not increased in pupils attending schools. Every other respondent thought that the initiative did have this wider role, although many of the reasons overlapped with the ones described above. For example, the fact that fruit consumption and demand had increased within schools, and that there had been an impact on pupils’ snacking, as well as food consumption as part of school lunches, was viewed as demonstrating an impact on more general eating habits. In general, the consensus was that awareness of fruit and its relationship to healthy eating had increased, pupils who had never tried fruit or were only aware of a limited range of types were enjoying new tastes, links with the curriculum and health promoting schools had been forged, and the combined impact with other related initiatives, such as Hungry for Success as a whole, was changing the eating habits of children for the better.
It helps develop awareness and breaks down bad eating habits. Playtime is now not full of crisps and chocolate. It also means that some children who do not usually eat fruit now have it made available to them. Respondent 4A This has been a wonderful initiative and goes a long way to help promote the idea of healthy eating. Respondent 17A Not on its own but as part of the Hungry for Success Initiative. Eating an additional piece of fruit is not a big enough change. Whilst eating a piece of fruit is valuable, children need to understand that they need to change their habits in other areas in reducing sugar and fat that they eat. Respondent 20A Absolutely, it raises the profile of fruit, it raises the opportunity for education in its broadest sense around healthy eating and the ‘five a day’ message. Respondent 25A It has the potential for quite a big role here. The children get to taste the fruit and if that is linked into the curriculum, teaching about healthy eating, balanced diet and fruit being an important part of that… you would hope would have an effect… As long as there is some sort of progression, as long as you don't try something for a short period of time and then it disappears. Progression through Hungry for Success. Respondent 28B

26
4.1.15 Perception of success and future of initiative
Table 1.7 demonstrates that two-thirds of the local authorities rated the free fruit initiative as being very successful. Professionals in 7 areas stated that the scheme had been quite successful. In four other areas the two respondents gave different opinions, although in three of these cases they still said that the initiative had been either very or quite successful. Only one of the 47 respondents said that the initiative had not been successful at all – this person had already suggested that fruit consumption had not increased and that there had been no effect on healthy eating in general as a result of the scheme.
Table 4.7 Perceived success of initiative?
Number of local authorities Very successful 21 Quite successful 7 Mixed views 4* Total 32
*In 4 areas two respondents picked different options
Those who suggested that the initiative was very or quite successful tended to give similar views as to those expressed in section 4.1.14. Therefore, the increased fruit consumption and positive impact on healthy eating overall, ascertained by formal evaluation as well as more informal feedback from staff, pupils and parents, and more anecdotal evidence, were thought to be great successes for the initiative. A few of the respondents who reported that the initiative was quite successful spoke of certain difficulties or negative features that they hoped they would overcome, such as the quality of fruit or its preparation, as well as the fact that it should be extended to cover more pupils. Other suggested modifications for the initiative were given, but these are covered in more detail below. The one individual who said that the scheme had not been successful added that staff resented the time they had to spend on fruit distribution and that the children were bored by the initiative.
Schools and pupils see it as part of their day, it is a pity it is only three days a week for P1-2. Respondent 8A It's causing resentment in the teaching staff because they don't have enough time to give out fruit. The children are getting fed up with it and it's too tightly ring fenced. Too narrowly targeted. Respondent 20B Children love it and look forward to it. The schools are using it as a health promotion tool in the curriculum. While eating the fruit they discuss healthy eating in general. Oral Health feel that the oral health in P1 & P2 has improved but this is anecdotal, maybe because less sweets are being eaten at break. Respondent 26A It's been one of the most successful initiatives that we have had from the Scottish Executive. We had full funding for it. Respondent 27A
The 47 local authority respondents, including the individual who had expressed more negative views above, thought that the free fruit initiative should continue to run in their areas in the future. Again, when the respondents were asked to expand on this, there was a fair bit of repetition with views outlined above. The fact that the initiative was thought to impact

27
favourably on the diets of young primary school-aged children, and would then have the capacity to produce health benefits for future generations, in combination with other initiatives, was cited. It was stressed that the initiative had been very successful, should not be stopped, or have its funding cut. As above, most areas wanted the scheme to be extended to cover more pupils or more days of the week. Again, it was argued that the initiative was one of the best to be introduced by the Scottish Executive.
It has been successful in encouraging children to eat and try new fruits. Some never see fruit anywhere else. Respondent 11A Absolutely, the funding helps and we need that funding so we don't have to raid any other money. If the funding disappeared, I would look at ways to fund the scheme by other means. Respondent 22A We have areas of very high deprivation and in those areas, the children are benefiting greatly, even in areas from middle class backgrounds the children are eating more fruit in school than they would at home. Respondent 29A Absolutely. It supports families and young people to make good choices. I think that it is one of the most positive Scottish Executive initiatives and should be encouraged throughout. Respondent 32A
4.1.16 Changes to Free Fruit initiative Respondents were asked what changes they would like to see in the operation of the initiative if it was to continue. A few respondents (n=6) were content with the initiative as it was and did not want any changes to the way the scheme operated. However the majority of respondents were able to suggest some changes they would like to see in the initiative. The most frequently mentioned change (n=27) was an expansion of the initiative so that children received fruit on 5 days a week and/or that children in more or all primary years were included in the initiative. Several respondents also mentioned extending the scheme to include nursery schools and one respondent wanted to see the initiative expanded into secondary schools. These views were supported by school staff in the school survey.
“I would like it to happen on a daily basis and extend it throughout the primary school years.” Respondent 2B “Expand it to a blanket five days a week. Fruit into nurseries, we already offer fruit but there is a parental contribution, it is not free fruit.” Respondent 24A
One respondent was in favour of expansion of the initiative but suggested that the benefits of the scheme should be demonstrated before it was rolled out further. Another individual felt that the local authority had had limited success in linking the initiative with the school curriculum and explaining the value of the initiative to the children. It was thought that showing the children whole fruit rather than pieces of fruit would help:
“Whole fruit will help, if a whole piece of fruit comes into the class it can be shown what it looks like rather than it appearing sliced in a plastic tray. This

28
year we are targeting this as a priority. It’s important that they not only eat the fruit but look at other aspects of their eating.” Respondent 20A
Other suggestions for changes to the initiative, suggested by a minority of respondents, included:
• An increase in the variety of fruit offered • An increase in portion size • Encouraging children to be involved in fruit preparation • Introducing prepared fruit to save on labour costs • Money being made available to allow teachers to eat the fruit with the children so that
it becomes a ‘whole class activity’

29
4.2 SURVEY OF SCHOOLS 4.2.1 Response from schools After 510 questionnaires were distributed to schools, a total of 458 questionnaires were either returned by post or completed by telephone interview. This represents a response rate of about 90%. Responses were received from schools in every local authority in Scotland. The lowest response was not unexpectedly from an Island authority, in which only 4 questionnaires were completed. In one city area, 44 forms were completed. The Scottish Executive urban-rurality scale is defined as follows: 1 = Large urban 2 = Other urban 3 = Accessible towns 4 = Remote towns 5 = Accessible rural 6 = Remote rural. As can be seen in Table 4.1, the vast majority of the schools which responded belonged to one of the urban or rural categories. Only 48 responses were received from schools sited in accessible or rural towns, reflecting the relatively low number of primary and special schools based in these categories throughout Scotland. Table 4.8 also shows that about one-third of the sample of school respondents were based in one of the three categories related to size of the school roll: Low = 1-100 pupils Mid = 101-250 pupils High = 251 pupils and above. Table 4.8 Sample of school respondents by urban-rural scale and school size Size of school roll
Urban-Rurality Scale 1 2 3 4 5 6 TOTAL N (%) N (%) N (%) N (%) N (%) N (%) N (%)
Low 17 (14) 10 (9) 5 (14) 3 (27) 62 (63) 69 (86) 166 (36) Mid 61 (48) 41 (39) 14 (38) 4 (36) 30 (31) 10 (13) 160 (35) High 48 (38) 55 (52) 18 (49) 4 (36) 6 (6) 1 (1) 132 (29)
TOTAL 126 (100) 106 (100) 37 (100) 11 (100) 98 (100) 80 (100) 458 (100) Notes to table Column percentages do not all add up to 100 due to rounding
Table 4.9 shows that 42% of the schools responding to the survey were in the lowest category in terms of pupil entitlement to free school meals. Nineteen special schools responded to the survey, but there were no free school meal entitlement figures available for these schools. Table 4.9 Sample of schools by urban-rural scale and free school meals entitlement
% pupils entitled to free school meals
Urban-Rurality Scale 1 2 3 4 5 6 TOTAL N (%) N (%) N (%) N (%) N (%) N (%) N (%)
Low = 0-10% 23 (20) 24 (24) 10 (29) 5 (46) 65 (66) 56 (70) 183 (42) Mid = 11-30% 33 (28) 50 (51) 20 (57) 5 (46) 29 (29) 21 (26) 158 (36) High = ≥31% 61 (52) 24 (24) 5 (14) 1 (9) 4 (4) 3 (4) 98 (22)
TOTAL 117 (100) 98 (100) 35 (100) 11 (100) 98 (100) 80 (100) 439 (100)* Notes to table Percentages do not all add up to 100 due to rounding.*Missing values = 19.
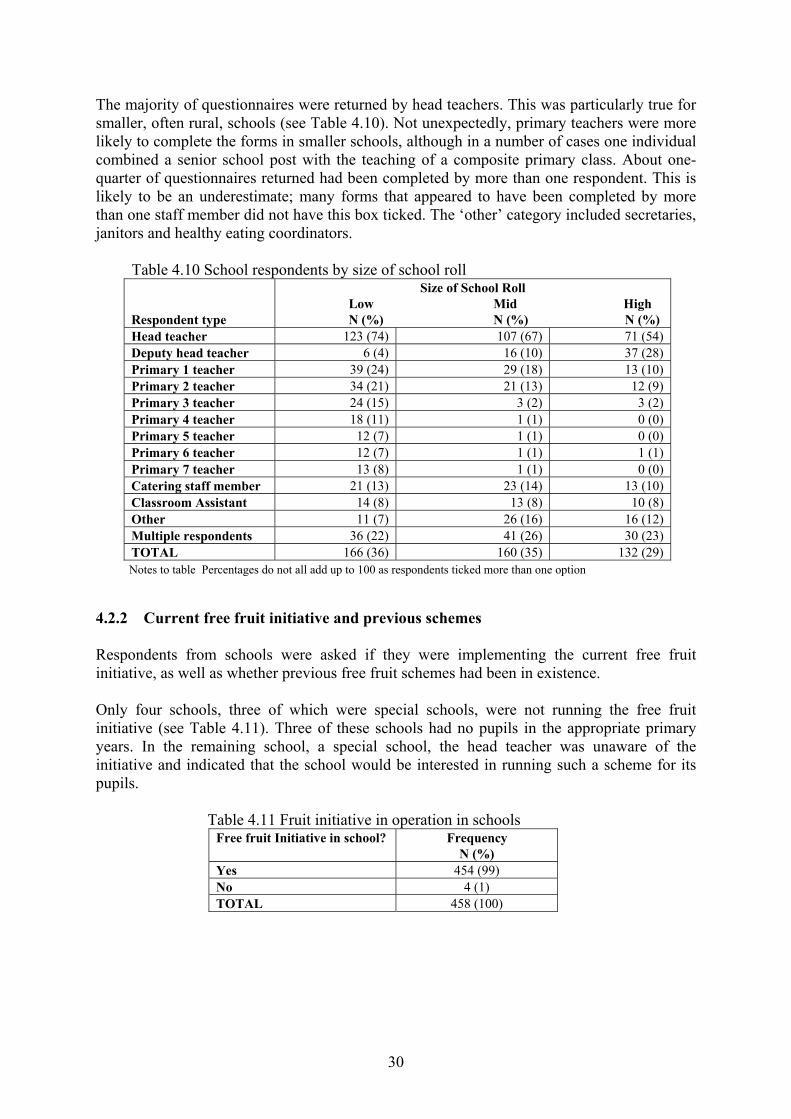
30
The majority of questionnaires were returned by head teachers. This was particularly true for smaller, often rural, schools (see Table 4.10). Not unexpectedly, primary teachers were more likely to complete the forms in smaller schools, although in a number of cases one individual combined a senior school post with the teaching of a composite primary class. About one-quarter of questionnaires returned had been completed by more than one respondent. This is likely to be an underestimate; many forms that appeared to have been completed by more than one staff member did not have this box ticked. The ‘other’ category included secretaries, janitors and healthy eating coordinators. Table 4.10 School respondents by size of school roll
Respondent type
Size of School Roll Low Mid High N (%) N (%) N (%)
Head teacher 123 (74) 107 (67) 71 (54) Deputy head teacher 6 (4) 16 (10) 37 (28) Primary 1 teacher 39 (24) 29 (18) 13 (10) Primary 2 teacher 34 (21) 21 (13) 12 (9) Primary 3 teacher 24 (15) 3 (2) 3 (2) Primary 4 teacher 18 (11) 1 (1) 0 (0) Primary 5 teacher 12 (7) 1 (1) 0 (0) Primary 6 teacher 12 (7) 1 (1) 1 (1) Primary 7 teacher 13 (8) 1 (1) 0 (0) Catering staff member 21 (13) 23 (14) 13 (10) Classroom Assistant 14 (8) 13 (8) 10 (8) Other 11 (7) 26 (16) 16 (12) Multiple respondents 36 (22) 41 (26) 30 (23) TOTAL 166 (36) 160 (35) 132 (29)
Notes to table Percentages do not all add up to 100 as respondents ticked more than one option 4.2.2 Current free fruit initiative and previous schemes Respondents from schools were asked if they were implementing the current free fruit initiative, as well as whether previous free fruit schemes had been in existence. Only four schools, three of which were special schools, were not running the free fruit initiative (see Table 4.11). Three of these schools had no pupils in the appropriate primary years. In the remaining school, a special school, the head teacher was unaware of the initiative and indicated that the school would be interested in running such a scheme for its pupils. Table 4.11 Fruit initiative in operation in schools
Free fruit Initiative in school? Frequency N (%)
Yes 454 (99) No 4 (1) TOTAL 458 (100)

31
Table 4.12 shows that 13% of schools (n=61 including special schools) reported that a similar fruit initiative was in operation before the Scottish Executive scheme was implemented. As might be expected, a higher percentage of these schemes were in operation in schools with a high level of free school meals entitlement (22% in high versus 10% in low; P<0.01). However, this also reflected the fact that a disproportionate number of these initiatives were based within the same, predominantly urban, local authority areas. For example, respondents from 16 schools in one local authority area said that a similar scheme had been in operation prior to the Scottish Executive’s programme, although this is likely to be an underestimate for the area in question. All schools in 11 local authorities reported no previous fruit initiatives. Table 4.12 Previous fruit initiative in operation in schools before current scheme Previous schemes in operation?
Free School Meal entitlement Low Mid High N (%) N (%) N (%)
TOTALN (%)
Yes 18 (10) 17 (11) 21 (22) 56 (13) No 160 (90) 139 (89) 76 (78) 375 (87) TOTAL 178 (100) 156 (100) 97 (100) 431 (100)* Notes to table *Missing values and don’t know/can’t say = 27 Over one-half of the schools reporting previous schemes thought that the local authority had provided the funding. The ‘other’ option included funding from the schools and PTAs themselves, Better Neighbourhood initiatives and health promoting or new community schools. Table 4.13 demonstrates that 23 of the 61 schools with pre-existing schemes perceived that the Scottish Executive scheme had resulted in primary 1 and 2 pupils receiving fruit on more days of the week. Twenty-one schools also thought that the other primary years were now benefiting from free fruit. Other changes included both more and fewer children receiving fruit, fruit being provided more frequently, parents of primary 3 to 7 pupils being asked to pay for fruit portions and the same scheme continuing to run, although now part of the free fruit initiative. Table 4.13 Impact of Free Fruit initiative on existing scheme
Free fruit Initiative in school?
Frequency N
P1/P2 receive fruit more frequently 23 Other primary years now receive fruit 21 Variety of fruit/veg has increased 11 Other 20 Don’t know/can’t say 7
Notes to table Base N=61; respondents could tick more than one option

32
4.2.3 Implementation of free fruit initiative Table 4.14 demonstrates that primary 1 and 2 were indeed the main beneficiaries of the free fruit initiative, as intended. A few small schools with no primary 1 and 2 pupils were the only exceptions to this rule. However, 46% of schools gave fruit to primary 3 pupils, with 65% of schools in the low school roll category doing this, presumably because of the influence of composite classes. Over one-quarter of primary 7 pupils received free fruit, again reflecting the different approaches adopted by individual local authorities. For example, a majority of schools in five local authority areas gave fruit to primary 7 pupils, compared with schools in fifteen local authority areas that reported giving no fruit or vegetables to this year group. Table 4.14 Primary years receiving free fruit
Free fruit Initiative in school?
Frequency N (%)
Primary 1 451 (99) Primary 2 452 (100) Primary 3 207 (46) Primary 4 134 (30) Primary 5 122 (27) Primary 6 122 (27) Primary 7 121 (27)
Notes to table Base N=454; respondents could tick more than one option About three-quarters of school respondents said that the pupils in the relevant years (see above) received one free fruit portion on three days of the week – the programme announced by the Scottish Executive (see Table 4.15). Twenty-nine per cent of schools in the large urban category compared with only 11% of schools in the remote rural category reported giving fruit to pupils on a daily basis (P<0.01). However, this again is probably due to local authority practices, with over 40% of the sample of schools from four local authority areas choosing this option. The other mode of distribution tended to be different frequency of delivery to separate year groups, fruit being provided on two or four days per week and payment being a component of some schemes. Table 4.15 Frequency of fruit distribution by urban-rural scale Frequency of distribution
Urban-Rurality Scale 1 2 3 4 5 6 TOTAL N (%) N (%) N (%) N (%) N (%) N (%) N (%)
3 days/week 71 (56) 79 (76) 28 (78) 9 (82) 84 (87) 65 (81) 336 (74) 5 days/week 36 (29) 14 (14) 6 (17) 1 (9) 8 (8) 9 (11) 74 (16) Other 21 (17) 14 (14) 3 (8) 2 (18) 7(7) 15 (19) 62 (14)
TOTAL 126 (100) 104 (100) 36 (100) 11 (100) 97 (100) 80 (100) 454 (100) Notes to table Column percentages do not all add up to 100 due to rounding and respondents ticking two options
We supplement the free fruit initiative to give fruit to all children. All parents pay 50p per week to supplement free fruit. (School 66; Remote rural, Low roll) Primary 1-3: one portion, 3 days per week and Primary 4-7: one portion, 1 day per week. (School 103; Remote rural, Mid roll) Fruit available twice a day to every pupil. (School 236; Large urban, Mid roll)

33
Table 4.16 demonstrates that, as would be expected, schools with a low pupil roll were much more likely to have primary 2 and 3 pupils within the same class (often with other school years). However, over one-third of those with a pupil roll of over 251 pupils said that their schools had a primary 2/3 composite class. Table 4.16 Primary 2 and 3 pupils in composite class by school size P2 and P3 in same composite class?
Size of school roll Low Mid High N (%) N (%) N (%)
TOTALN (%)
Yes 122 (75) 60 (38) 46 (35) 228 (50) No 40 (25) 100 (63) 86 (65) 226 (50) TOTAL 162 (100) 160 (100) 132 (100) 454 (100)* Notes to table Column percentages do not all add up to 100 due to rounding. It can be seen in Table 4.17 that three-quarters of respondents said that schools with primary 2 and 3 pupils within the same composite class offered fruit to both of these year groups. At least 50% of schools in eight local authorities reported that they only gave fruit to the primary 2 pupils, although the numbers of schools responding from each area tended to be small. About 84% of schools with a high level of eligibility for free school meals distributed fruit to all primary 2 and 3 pupils, although again the numbers involved again were small. Those who ticked the other option gave a variety of responses, including the fact that only primary 1 pupils were given free fruit, and that primary 3 pupils were only given free fruit on certain days of the week. Table 4.17 Primary 2 and 3 pupils in composite class receiving fruit by school size P2 and P3 in same class given fruit?
Size of school roll Low Mid High N (%) N (%) N (%)
TOTALN (%)
Yes 88 (79) 46 (79) 29 (64) 163 (76) No 40 (21) 12 (21) 16 (36) 52 (24) TOTAL 112 (100) 58 (100) 45 (100) 215 (100)* Notes to table *Other = 11 4.2.4 Preparation, storage and distribution of fruit As might be expected, there was a major difference noted between fruit and vegetable deliveries to urban and rural schools, with 34% of large urban schools compared with 3% of remote rural schools receiving fruit deliveries on at least four days per week (see Table 4.18, P<0.001). The size of the school roll also seemed to have some impact on school deliveries, with those with low school rolls more likely to receive weekly deliveries. Table 4.18 Delivery of fruit to schools by urban-rural scale Frequency of delivery
Urban-Rurality Scale 1 2 3 4 5 6 TOTAL N (%) N (%) N (%) N (%) N (%) N (%) N (%)
4-5 days/week 39 (34) 8 (10) 5 (16) 0 (0) 3 (4) 2 (3) 57 (14) 2-3 days/week 46 (40) 46 (55) 14 (44) 6 (55) 47 (56) 28 (40) 187 (47) Once per week 29 (25) 30 (36) 13 (41) 5 (45) 34 (40) 40 (57) 151 (38)
TOTAL 114 (100) 84 (100) 32 (100) 11 (100) 84 (100) 70 (100) 395* (100) Notes to table Column percentages do not all add up to 100 due to rounding and respondents ticking two options *Missing values and don’t know/can’t say = 59

34
Table 4.19 shows that those most frequently involved in fruit and vegetable distribution within the school were members of catering staff, classroom assistants and primary 1 and 2 teachers. The other category included school auxiliaries, nursery nurses, school helpers and primary pupils from years below primary 6 and 7. In one-quarter of the schools only one category of person in Table 4.19 was responsible for fruit distribution; the percentage was slightly higher for respondents from schools with a low school roll (31%). In total, 62% of schools reported that up to two pupil/staff categories only from Table 4.19 distributed fruit in the schools. Table 4.19 Staff/pupils involved in fruit distribution
Staff/pupils distribute fruit in school?
Frequency N (%)
Catering staff 269 (60) Classroom assistants 228 (50) Primary 1/2 teachers 225 (50) Janitor 100 (22) Primary 6/7 pupils 48 (11) School secretary 30 (7) Head/deputy head teachers 25 (6) Other teaching staff 24 (5) Other 49 (11)
Notes to table Base N=452; Don’t know = 2. Respondents could tick more than one option It is clear that large urban schools were much more likely to store fruit in boxes and baskets, and much less likely to use refrigerated units, when compared with remote rural schools (e.g. refrigerated units 25% vs 49% P<0.01; see Table 4.20). This might reflect the different deliveries to schools already identified, with rural schools needing to keep fruit for a longer time period before distributing it to the pupils. However, schools in the “other urban” category followed a similar storage pattern to the rural schools. Those respondents who ticked the “other” option said that the fruit was distributed to classes immediately, was stored in other schools, or was placed in cool boxes, steel bowls or cupboards. Table 4.20 Storage of fruit in schools by urban-rural scale Mode of Storage:
Urban-Rurality Scale 1 2 3 4 5 6 TOTAL N (%) N (%) N (%) N (%) N (%) N (%) N (%)
Box/basket 82 (68) 50 (50) 20 (59) 7 (64) 45 (47) 37 (49) 241 (55) Refrigerated units
30 (25) 50 (50) 17 (50) 5 (45) 55 (58) 37 (49) 194 (44)
Units: Non-refrigerated
25 (21) 18 (18) 8 (24) 2 (18) 18 (19) 19 (25) 90 (21)
Other 6 (5) 4 (4) 1 (3) 0 (0) 2 (2) 5 (7) 18 (4) TOTAL 121 (100) 100 (100) 34 (100) 11 (100) 95 (100) 76 (100) 437* (100)
Notes to table Column percentages do not all add up to 100 due to rounding and respondents ticking two options. *Missing values and don’t know/can’t say = 17

35
Eighty percent of schools were reported to have storage facilities that were at least quite adequate (see Table 4.21). However, 25% of schools based in large urban areas said that storage facilities were inadequate. Table 4.21 Perceptions of storage facilities in schools by urban-rural scale Adequacy of storage?:
Urban-Rurality Scale 1 2 3 4 5 6 TOTAL N (%) N (%) N (%) N (%) N (%) N (%) N (%)
More than adequate
17 (14) 28 (29) 5 (16) 1 (9) 22 (24) 20 (26) 93 (22)
Quite adequate
71 (60) 54 (55) 19 (59) 10 (91) 50 (55) 44 (58) 248 (58)
Not very adequate
19 (16) 12 (12) 7 (22) 0 (0) 16 (18) 11 (15) 65 (15)
Not at all adequate
11 (9) 4 (4) 1 (3) 0 (0) 3 (3) 1 (1) 20 (5)
TOTAL 118 (100) 98 (100) 32 (100) 11 (100) 91 (100) 76 (100) 426* (100) Notes to table Column percentages do not all add up to 100 due to rounding. *Missing values and don’t know/can’t say = 28 Those respondents who perceived that their storage facilities were inadequate were asked to expand on this. About two-thirds of this group made additional comments. The majority of responses indicated that fruit could go off, particularly in warmer weather, and refrigeration of the fruit was necessary to limit this wastage. It was also stated that certain fruit types were distributed quickly as they would go off more quickly without refrigeration. However, many of these schools also said that they managed quite well despite the lack of storage facilities.
We only have one small fridge and that’s for school meals. The fruit is cut up the day before it’s given to the kids so it’s not that fresh. It’s not really a big problem. (School 136; Accessible rural, Mid roll) The fruit is very ripe when it comes, if we had a fridge it would keep better and then maybe the children could have it over 3 days instead of the 2 days. (School 151; Large urban, Mid roll) When the fruit comes in pots chopped up there’s a lot to go in one fridge. I make it work but could do with more space. (School 348; Large urban, Mid roll ) Fruit can go off very quickly, we have learned through experience which fruit to distribute early in the week. (School 457; Accessible town, Low roll)

36
Table 4.22 demonstrates that almost three-quarters of the sample of schools prepared (defined in terms of washing and cutting up) the fruit and vegetables in the school kitchen. This was especially the case in remote rural schools (83% versus 61% ‘large urban’; P<0.01), although it is impossible to know which schools in the overall sample actually had active school kitchens. Large urban based schools were more likely to have fruit prepared within the classrooms, general purpose rooms or “other” places. These “other” places included other school kitchens (often secondary schools), staff rooms, main halls and corridors, as well as the fact that the fruit was prepared by the supplier. Table 4.22 Place of preparation of fruit within schools by urban-rural scale
Where prepared?:
Urban-Rurality Scale 1 2 3 4 5 6 TOTAL N (%) N (%) N (%) N (%) N (%) N (%) N (%)
School kitchen 72 (61) 73 (72) 29 (83) 9 (82) 68 (72) 65 (83) 316 (72) Classroom 18 (15) 9 (9) 3 (9) 1 (9) 7 (7) 1 (1) 39 (9) General purpose room
16 (13) 7 (7) 2 (6) 0 (0) 3 (3) 2 (3) 30 (7)
Other 27 (23) 17 (17) 3 (9) 1 (9) 22 (23) 10 (13) 80 (18) TOTAL 119 (100) 101 (100) 35 (100) 11 (100) 95 (100) 78 (100) 439* (100)
Notes to table Column percentages do not all add up to 100 due to rounding and respondents ticking more than one option. *Missing values and don’t know/can’t say = 15 It can be seen in Table 4.23 that in two-thirds of schools catering staff were involved in preparing the fruit for pupils. However, only 44% of schools in large urban areas had catering staff preparing the fruit and vegetables, although we do not know the numbers of catering staff in the sample of schools. In 83% of schools, only one of the categories outlined in Table 4.23 was involved in fruit preparation – the percentage in remote rural schools was 90%. The “other” category included auxiliaries, nursery nurses, and the fact that fruit came prepared either from the supplier or from other school kitchens. Table 4.23 Staff/pupils involved in fruit preparation
Staff/pupils distribute fruit in school?
Frequency N (%)
Catering staff 302 (67) Classroom assistants 113 (25) Primary 1/2 teachers 37 (8) Janitor 22 (5) School secretary 10 (2) Other teaching staff 9 (2) Head/deputy head teachers 8 (2) Primary 6/7 pupils 4 (1) Other 48 (11)
Notes to table Base N=454. Respondents could tick more than one option.

37
The respondents were asked whether the fruit was cut or packaged in a particular way (e.g. smaller portions, pick ‘n’ mix bar within school) to increase its appeal to pupils. Table 4.24 shows that in almost 40% of schools the fruit was supplied in this way, and that in about 59% of schools the school staff also prepared the fruit in such a way to increase its appeal. Table 4.24 Fruit cut or packaged by supplier/school staff by free school meals entitlement Preparation by supplier or school staff?
Free School Meal entitlement Low Mid High N (%) N (%) N (%)
TOTALN (%)
Yes: Supplier 68 (39) 68 (44) 21 (31) 166 (39)* Yes: School staff 121 (68) 85 (54) 51 (52) 257 (59)** Notes to table *Base N= 427, Don’t know/can’t say = 11. ***Base N= 432, Don’t know/can’t say = 6. Although schools with a high level of entitlement to free schools meals seemed to have less likelihood of giving pupils fruit prepared in such a way, this probably reflects local authority practice, especially with regard to fruit being supplied to schools. In 10 local authority areas at least 50% of the schools reported that the fruit was supplied to them cut up or pre-packaged into smaller portions. 4.2.5 Health and safety concerns Only 63 (14%) schools reported health and safety concerns related to the free fruit initiative, reflecting the fact that fruit and vegetables are relatively low risk foods. This figure was higher in large urban schools (23%), which might be because a higher percentage of respondents from these schools perceived that their storage facilities were inadequate (see Table 4.21). The major concern voiced by the 63 schools was that the hygiene, in terms of handling and cleaning fruit and its preparation, might be inadequate (see Table 4.25). As has already been mentioned, storage facilities within schools were also a concern (n=31), as was the safe storage of fruit (n=29). Respondents from only 15 schools said that fruit stones or fruit allergies were of concern to staff members. Only one special school expressed health and safety concerns with the initiative. The “other” concerns included choking on fruit or vegetables and pupils slipping on dropped fruit. Table 4.25 Staff health and safety concerns
Health and safety concerns:
Frequency N (%)
Hygiene: fruit handling and preparation 35 (56) Storage facilities within school 31 (49) Safe storage of fruit 29 (46) Problems related to fruit stones 15 (24) Problems related to fruit allergies 15 (24) Other concerns 7 (11)
Notes to table Base N=63. Respondents could tick more than one option.

38
4.2.6 Delivery and consumption of fruit within schools Almost one-half of the schools usually gave fruit to the pupils before the morning break (see Table 4.26). Schools with a large number of pupils were more likely to distribute fruit at this time (61% ‘high roll’ versus 38% ‘low roll’; P<0.001). It is difficult to explain this finding, although it might be related to the time of day fruit is supplied to large urban schools which tend to have more pupils, as well as the lack of storage facilities in these schools. The next most common time for fruit to be distributed was after lunch, with 35% of respondents reporting that fruit distribution to pupils took place at this time. About one-quarter of schools often gave fruit to pupils during the morning or lunch breaks. As might be expected, respondents from schools with a high pupil roll were more likely to tick more than one option. Table 4.26 Time of school day fruit given to pupils by school size When fruit usually given to pupils:
Size of school roll Low Mid High N (%) N (%) N (%)
TOTALN (%)
Pre-morning break 62 (38) 80 (51) 79 (61) 221 (49) At morning break 37 (23) 30 (19) 29 (22) 96 (21) Post-break to pre-lunch
11 (7) 17 (11) 23 (18) 51 (11)
Lunchtime 12 (7) 8 (5) 6 (5) 26 (6) After lunch 58 (36) 59 (38) 40 (31) 157 (35) TOTAL 162 (100) 157 (100) 130 (100) 449 (100)* Notes to table Column percentages do not all add up to 100 due to rounding and respondents ticking more than one option. *Don’t know/can’t say = 5. Table 4.27 demonstrates that over three-quarters of schools usually had pupils consuming the fruit within the classroom. About 30% of school respondents also thought that the playground was the usual place of fruit consumption. Schools with a high level of school roll were more likely to allow pupils to eat the fruit in the classroom, and less likely to have pupils eating the free fruit in the dining hall, compared to schools with a low pupil roll (e.g. classroom: 81% versus 69%; P<0.05). This might be partly explained by the usual time of day the fruit was given to the children (see Table 4.26). The “other” places of consumption included on the way home, corridors and entrance halls. Table 4.27 Place of fruit consumption by pupils by school size Place of fruit consumption:
Size of school roll Low Mid High N (%) N (%) N (%)
TOTALN (%)
Classroom 111 (69) 135 (85) 107 (81) 353 (78) Playground 52 (33) 37 (23) 46 (35) 135 (30) Dining hall 23 (14) 5 (3) 8 (6) 36 (8) Other 6 (4) 4 (3) 2 (2) 12 (3) TOTAL 160 (100) 158 (100) 132 (100) 450 (100)* Notes to table Column percentages do not all add up to 100 due to rounding and respondents ticking more than one option. *Don’t know/can’t say = 4.

39
Over two-thirds of the school respondents reported that over 80% of pupils eligible for free fruit were eating it (see Table 4.28). In remote rural schools 83% of schools reported this consumption level, as opposed to only 62% of large urban schools (P<0.01). This might be related in some way to school size – only 52% of schools with over 250 pupils said that over 80% of their pupils eligible for the scheme consumed the fruit. When the results were looked at by different entitlement to free school meals, the figures in schools with low and high levels of entitlement were very similar. Only 2% of respondents (n=7 schools) thought that 21-40% of pupils in their schools consumed the free fruit on offer. Table 4.28 Level of pupil consumption of free fruit by urban-rural scale
% of pupils consuming fruit ?:
Urban-Rurality Scale 1 2 3 4 5 6 TOTAL N (%) N (%) N (%) N (%) N (%) N (%) N (%)
81-100% 77 (62) 64 (64) 23 (64) 7 (64) 66 (69) 66 (83) 303 (68) 61-80% 33 (27) 24 (24) 8 (22) 3 (27) 17 (18) 11 (14) 96 (22) 21-60% 14 (11) 12 (12) 5 (14) 1 (9) 12 (13) 3 (4) 47 (11)
TOTAL 124 (100) 100 (100) 36 (100) 11 (100) 95 (100) 80 (100) 446* (100) Notes to table Column percentages do not all add up to 100 due to rounding. *Missing values and don’t know/can’t say = 8 Table 4.29 shows that over 90% of school respondents able to comment stated that only 0-20% of fruit ended up being discarded as waste. Only two schools reported levels of fruit wastage of over 60%. Again, remote rural and schools with small pupil rolls (obviously there is a relationship between these categories) reported relatively low levels of wastage. Free school meal entitlement seemed to have little bearing on the results. Table 4.29 Wastage of fruit by urban-rural scale
% of fruit discarded:
Urban-Rurality Scale 1 2 3 4 5 6 TOTAL N (%) N (%) N (%) N (%) N (%) N (%) N (%)
21-100% 12 (10) 13 (15) 2 (6) 2 (18) 6 (7) 4 (5) 39 (9) 0-20% 111 (90) 75 (85) 32 (94) 9 (82) 83 (93) 76 (95) 386 (91)
TOTAL 123 (100) 88 (100) 34 (100) 11 (100) 89 (100) 80 (100) 425* (100) Notes to table *Missing values and don’t know/can’t say = 29

40
A majority of the schools gave leftover fruit to other pupils within the same school (see Table 4.30). Although almost one-quarter of the schools reported that fruit ends up as waste, in the “other” option it was pointed out that this only happened occasionally, as Table 4.29 would suggest. Schools with a high level of free school meal entitlement were much more likely to give fruit to pupils who had not brought snacks to school when compared to low entitlement schools (31% versus 11%; P<0.001). Schools with low pupil entitlement to free school meals were also less likely to give children fruit to take home when compared with the mid and high categories combined (12% versus 22%; P<0.01). Given that large urban schools were much more likely to have a high level of free school meal entitlement, unsurprisingly schools based in these areas had a greater tendency to give fruit to those without snacks or for consumption at home. Those who ticked the other option went on to say that nearly all the fruit was eaten (see above), some pupils were given two pieces, fruit was returned to the kitchen for use in meals, teaching staff consumed it and leftover fruit was composted. Table 4.30 What happens to fruit not consumed by free school meals entitlement Fruit not Consumed:
Free School Meal entitlement Low Mid High N (%) N (%) N (%)
TOTALN (%)
Given to other pupils
100 (56) 100 (66) 52 (55) 252 (59)
Ends up as waste 41 (23) 31 (20) 24 (25) 96 (23) Given to pupils without snacks
20 (11) 34 (22) 29 (31) 83 (20)
Given to pupils to take home
21 (12) 35 (23) 19 (20) 75 (18)
Made into other food/drinks
4 (2) 3 (2) 7 (7) 14 (3)
Other 52 (29) 27 (18) 19 (20) 98 (23) TOTAL 177 (100) 152 (100) 95 (100) 424 (100) Notes to table Column percentages do not all add up to 100 due to rounding and respondents ticking more than one option. Don’t know/can’t say = 14.
Some children have two pieces. (School 51; Accessible rural, Low roll) It is all eaten! (School 66; Remote rural, Low roll) To avoid any waste, teachers may take it but only if no children will take it. (School 97; Accessible rural, Low roll ) Used in kitchen for school meals. (School 280; Remote rural, Low roll ) Composted, none is thrown away as waste. (School 461; Other urban, Mid roll)

41
4.2.7 Types, quality and quantity of fruit The questionnaire asked what types of fruit and vegetables were supplied to the schools. Table 4.31 shows what the schools reported being supplied with, although it should be noted that it does not give an indication of the frequency with which each item was supplied, albeit some fruits give an indication of seasonality. A majority of schools reported receiving eight of the fruit categories listed in the table, and indeed most of the schools said that they were supplied with at least eight of the options identified in the table, from apples down to melon, with seven schools ticking 16 of the 17 separate items. There were differences noted by urban-rural classification, school size and free school meal entitlement, but these are likely to reflect local authority practices. Most respondents who ticked the ‘other’ category said that cucumber was also supplied, although a few respondents also mentioned peppers, celery, exotic fruit and tinned fruit, including fruit cocktail. Table 4.31 Types of fruit and vegetables supplied to schools
Types:
Frequency N (%)
Apples 447 (99) Bananas 414 (91) Green/red grapes 370 (82) Oranges 363 (80) Satsumas/clementines 344 (76) Pears 309 (68) Kiwi fruit 286 (63) Melon 282 (62) Plums 191 (42) Dried fruit 171 (38) Cherry tomatoes 161 (36) Strawberries 158 (35) Pineapple 136 (30) Carrots 129 (28) Fruit juice 124 (27) Peaches/nectarines 104 (23) Other 45 (10)
Notes to table Base N=453. Respondents could tick more than one option.

42
Those schools in large urban areas were much less likely to be very satisfied with the variety of fruit and vegetables on offer when compared to the remote rural schools (See Table 4.32, 25% versus 58%: P<0.001). However, 89% of respondents reported that they were at least quite satisfied with the variety of fruit supplied to the schools. Over 30% of schools in five local authority areas were not satisfied with the fruit on offer, but it is important to note that the numbers of schools involved per area were low. Table 4.32 Satisfaction with variety of fruit/veg supplied to schools by urban-rural scale Satisfaction?:
Urban-Rurality Scale 1 2 3 4 5 6 TOTAL N (%) N (%) N (%) N (%) N (%) N (%) N (%)
Very satisfied
31 (25) 28 (27) 14 (39) 7 (64) 49 (51) 46 (58) 175 (39)
Quite satisfied
75 (60) 62 (60) 21 (58) 4 (36) 36 (37) 27 (34) 225 (50)
Not very satisfied
17 (14) 10 (10) 1 (3) 0 (0) 12 (12) 6 (8) 46 (10)
Not at all satisfied
2 (2) 3 (3) 1 (3) 0 (0) 0 (0) 0 (0) 5 (1)
TOTAL 125 (100) 103 (100) 36 (100) 11 (100) 97 (100) 79 (100) 451* (100) Notes to table Column percentages do not all add up to 100 due to rounding. *Missing values and don’t know/can’t say = 28

43
Respondents were asked what the pupils liked most and least in terms of the free fruit and vegetables distributed to them. The original question asked the respondents to name the three types of fruit most and least popular with the pupils, but so many responses came back with over three options ticked that this idea was dropped. However, there will be under-representation in some categories as other respondents did restrict their answers to up to three options only. Also, the fruits supplied more frequently to schools arguably have a better chance of inclusion in both the best and least popular lists (see Table 4.33). Table 4.33 shows that green (and red) grapes, as well as apples and bananas tended to be perceived as the most popular with the pupils. However, apples and bananas also had relatively high percentages of respondents stating that these were least popular with their pupils. Strawberries and fruit juices, obviously only available in some localities, were popular and not thought to be disliked by the pupils. On the other hand, cherry tomatoes, oranges, pears and kiwi fruit appeared to be more disliked than liked, according to the informants. In terms of the most popular types of fruit, the other options included fruit salad, cucumber and grapefruit. The ‘other’ category in the least popular fruit question was dominated by dried fruit (n=21) and cucumber (n=14). Raisins and tinned fruit were also mentioned as being unpopular with pupils. Table 4.33 Perceptions of pupil preferences for types of fruit/vegetables supplied
Types:
Most Popular Frequency
N (%)*
Least Popular Frequency N (%)**
Green grapes 256 (60) 3 (1) Apples 236 (55) 52 (14) Bananas 212 (49) 33 (9) Red grapes 113 (26) 6 (2) Melon 111 (26) 34 (9) Satsumas/clementines 79 (18) 27 (7) Strawberries 62 (14) 0 (0) Oranges 54 (13) 101 (27) Fruit juice 53 (12) 0 (0) Kiwi fruit 37 (9) 77 (20) Pears 30 (7) 87 (23) Pineapple 18 (4) 27 (7) Plums 17 (4) 50 (13) Carrots 7 (2) 64 (17) Peaches/nectarines 4 (1) 25 (7) Cherry tomatoes 0 (0) 111 (29) Other 14 (3) 59 (16)
Notes to table *Base N=430. *Base N=379. Respondents could tick more than one option.

44
Almost one-third of schools were very satisfied with the quality of fruit delivered to them, with only a small minority expressing dissatisfaction (see Table 4.34). Those responding from remote rural schools were almost twice as likely to be very satisfied with the fruit on offer compared with large urban schools (39% versus 21%, P<0.01). Urban schools did seem to be more dissatisfied on the whole, which might reflect individual variation within local authority practice or the difficulty of catering for a larger school roll. Table 4.34 Satisfaction with quality of fruit/veg supplied to schools by urban-rural scale Satisfaction?:
Urban-Rurality Scale 1 2 3 4 5 6 TOTAL N (%) N (%) N (%) N (%) N (%) N (%) N (%)
Very satisfied
27 (21) 30 (30) 13 (36) 3 (27) 35 (37) 31 (39) 139 (31)
Quite satisfied
82 (65) 55 (55) 19 (53) 8 (73) 48 (51) 42 (53) 254 (57)
Not very satisfied
17 (14) 16 (16) 4 (11) 0 (0) 11 (12) 6 (8) 54 (12)
TOTAL 126 (100) 101 (100) 36 (100) 11 (100) 94 (100) 79 (100) 447* (100) Notes to table Column percentages do not all add up to 100 due to rounding. *Missing values and don’t know/can’t say = 7 Only those who were dissatisfied with the quality of the fruit (n=54, 12%) were asked to explain why this was the case by answering an open-ended question. About one-half of these respondents gave additional information. Most of these comments related to the fact that the fruit was of variable quality, was often under- or overripe, could arrive at school in a damaged condition and was sometimes of such poor quality that it had to be returned to the suppliers. A minority of comments focused on the condition of specific fruit types. In addition, the problems associated with storing fruit mentioned above were also thought to affect fruit quality adversely.
Bananas are very green and far too big, apples are sometimes rotten, pears are far too hard and satsumas are often blue/rotten. (School 125; Large urban, Low roll) With some deliveries some of the fruit is either over ripe or not ripe enough, however, the fault is usually rectified by the supplier quickly and efficiently. (School 161; Large urban, High roll) Mostly the fruit is not ripe enough for that day or is `too ripe' to be given to the children. (School 340; Accessible rural, Mid roll) Red apples often very soft, pears very small and hard, fruit (particularly red apples) has a strange smell, children say it's like sickness and apples are not very tasty. (School 432; Accessible rural, Low roll) Fruit can quite often arrive bashed, past its best, mouldy and even fermenting! (School 462; Other urban, High roll)

45
It can be seen in Table 4.35 that the vast majority of schools perceived that they were receiving at least quite a sufficient amount of fruit. Only 13 schools thought that they were not being supplied with enough fruit as part of the initiative. Table 4.35 Views of the quantity of fruit/veg supplied to schools by urban-rural scale How sufficient?:
Urban-Rurality Scale 1 2 3 4 5 6 TOTAL N (%) N (%) N (%) N (%) N (%) N (%) N (%)
More than sufficient
44 (36) 24 (25) 7 (21) 2 (18) 18 (19) 19 (24) 114 (26)
Quite sufficient
74 (61) 71 (72) 26 (79) 9 (82) 74 (79) 56 (71) 310 (71)
Not very/at all sufficient
4 (3) 3 (3) 0 (0) 0 (0) 2 (2) 4 (5) 13 (3)
TOTAL 122 (100) 98 (100) 33 (100) 11 (100) 94 (100) 79 (100) 437* (100) Notes to table Column percentages do not all add up to 100 due to rounding. *Missing values and don’t know/can’t say = 17 4.2.8 Impact of the initiative on the school and pupils It is important to emphasise that this section is based on the perceptions of school staff, and not on more formal evaluations or measures of impact on the pupils and their eating behaviour. Firstly, the survey asked for views of the impact of the free fruit initiative on the sale of fruit in the tuck shop. Table 4.36 shows that a majority of schools in the sample either did not have or did not sell fruit from tuck shops. However, in 11% of schools it was reported that sales of fruit had increased as a result of the initiative. Respondents from 12 schools felt that the sale of fruit and vegetables had decreased since the implementation of the free fruit scheme. Table 4.36 Sale of fruit and vegetables within school tuck shop
Types:
Frequency N (%)
Sale of fruit has increased 45 (11) No effect on sale of fruit 70 (17) Sale of fruit has decreased 12 (3) No tuck shop/tuck shop does not sell fruit 282 (67) Other 13 (3) TOTAL 422 (100)
Notes to table Base N=422. Column percentages do not add up to 100 due to rounding Don’t know/can’t say = 32. The ‘other’ option tended to refer to new or existing related initiatives set up in schools.
All pupils have taken part in a free fruit and veg tuck shop, newly established by the Pupil Council and partially funded by X. (School 67; Remote rural, Low roll) Tuck shop once a week for older children who do not get free fruit. Older children really miss fruit when they no longer qualify. (School 312; Other urban, Large roll)

46
Table 4.37 shows the perceptions of respondents to the impact of the initiative on the consumption of fruit and vegetables by pupils at lunchtime. Not unexpectedly, in that respondents were not always aware of what pupils were eating at lunchtime either as part of school meals or in packed lunches there was a high proportion unable to offer an opinion. However, of those that were, almost 60% of respondents stated that the pupils were now eating more fruit and vegetables as part of their school lunch. This percentage was even higher in schools with a high level of free school meal entitlement compared with those with low entitlement (67% versus 54%; P=0.05). The consumption of fruit and vegetables was thought to have decreased in six schools. Table 4.37 Impact of initiative on pupils’ consumption of fruit/veg at lunchtime by free school meals entitlement Uptake of fruit at lunchtime:
Free School Meal entitlement Low Mid High N (%) N (%) N (%)
TOTALN (%)
Uptake increased 78 (54) 75 (59) 56 (67) 209 (59) No change 64 (44) 50 (39) 25 (30) 139 (39) Uptake decreased 2 (1) 2 (2) 2 (2) 6 (2) TOTAL 144 (100) 127 (100) 83 (100) 354* (100) Notes to table Column percentages do not all add up to 100 due to rounding. Don’t know/can’t say = 84. A majority of respondents perceived that the free fruit initiative had made no difference to the food brought into school by pupils for their snack or lunch (see Table 4.38). However, over 40% of respondents said that pupils were now more likely to bring fruit in to school. This seemed to be particularly true in schools with low free school meal entitlement, although this difference was not statistically significant. Pupils in only 12 schools were thought to be less likely to bring fruit for a snack, presumably because they were already having fruit and vegetables provided as part of the free fruit scheme. Table 4.38 Impact of initiative on pupils’ food brought to school by free school entitlement Likelihood of bringing fruit for snack/lunch :
Free School Meal entitlement Low Mid High N (%) N (%) N (%)
TOTALN (%)
More likely 67 (47) 54 (42) 28 (35) 149 (42) No change 75 (52) 70 (55) 47 (58) 192 (54) Less likely 2 (1) 4 (3) 6 (7) 12 (3) TOTAL 144 (100) 128 (100) 81 (100) 353* (100) Notes to table Column percentages do not all add up to 100 due to rounding. Don’t know/can’t say = 85. Table 4.39 demonstrates that the vast majority of respondents reported that the free fruit scheme had resulted in both increased fruit consumption in pupils eligible for the initiative and a general improvement in their healthy eating habits. Although the first of these points might seem obvious, it was pointed out in the formative research phase that some children were eating the same amount of fruit as they no longer brought in fruit as a snack. Table 4.39 Impact of initiative on pupils’ overall fruit consumption and general eating habits
Impact on pupils:
Frequency N (%)
Increase in fruit consumption 391 (95)* Improvement in general eating habits 349 (90)**
Notes to table *Base N=413, Don’t know/can’t say = 41.** Base N=389, Don’t know/can’t say = 65.

47
There was little variation in these responses when school size, urban-rural differences and free school entitlement were taken into account. Sixty-five respondents were unable to give an opinion on whether the general eating habits of pupils had improved – this was mostly due to the fact that they did not know what the pupils were eating at home. However, the open-ended comments tended to be very positive. It was pointed out that many children who did not eat fruit were now requesting it, peer pressure resulted in most children eating fruit, there was evidence of healthier snacks being brought into school and an increased awareness of healthy eating as a whole. Also, more general trends, such as Hungry for Success, and recent media interest centred on the Jamie Oliver campaign, were thought to complement the initiative. The view that eating habits were changing for the better in the home environment, and that teaching staff were becoming role models and helping foster a more healthy environment within the school. The respondents who argued that there had been no impact on eating habits tended to say that those who did not eat fruit prior to the scheme were still not eating it, sugary snacks were still predominant within school and there was little evidence that the children’s poor diet at home was being modified as a result of the free fruit initiative.
Not on its own, it stands alongside all the work being done with Hungry for Success and the Health Promoting Schools. It is a long term project and should be for the whole school. (School 20; Accessible rural, Low roll) Although most children eat the free fruit, there is little evidence that they eat fruit at other times. (School 54; Accessible rural, Low roll ) This…has really made a difference. Children are very well behaved anyway! Water freely available improves concentration, Hungry for Success and no rubbish ‘play pieces’ improves concentration. (School 66; Remote rural, Low roll) It's a social thing, no-one is left out. A piece of fruit is provided for the member of staff and so we are role models. General children are encouraged to look at food as promoting health and it is habit forming. (School 197; Accessible rural, Mid roll) I doubt that the children get much benefit other than the one piece of fruit three days a week. It's really up to the parents. I am still seeing an awful lot of sweets in the school. (School 204; Accessible rural, Mid roll) Fruit is now freely available in school to pupils who would not have bought fruit at the school meals service in the past (we have a very high free meal entitlement). Our tuck shop used to sell crisps, sales tailed off considerably after the introduction of Fruit Plus and we have now closed the shop. Children may bring crisps to school from home but nothing is sold on site. (School 238; Large urban, Mid roll) Some children from lower income used to steer to crisps/sweets, will now take fruit and if there is some left over, will ask for another piece. (School 424; Other urban, Mid roll) Watching others eating and enjoying fruit has encouraged more reluctant children to have a try. (School 457; Accessible town, Low roll)

48
The vast majority of respondents reported that there had been no change in the behaviour of pupils within the school as a result of the free fruit initiative (see Table 4.40). However, 19% of schools with a high level of free school meal entitlement reported an improvement in behaviour compared to only 9% of low free school meal entitlement schools (P<0.05), although it should be noted that 85 respondents were unable to express a view. Table 4.40 Impact of initiative on pupils’ behaviour by free school entitlement Impact on pupil behaviour:
Free School Meal entitlement Low Mid High N (%) N (%) N (%)
TOTALN (%)
Has improved 11 (9) 14 (13) 13 (19) 38 (13) No change 113 (91) 91 (87) 54 (81) 258 (87) TOTAL 124 (100) 105 (100) 67 (100) 296* (100) Notes to table Don’t know/can’t say = 85. 4.2.9 Curricular links and costs to schools About 88% of schools reported that there were links between the taught curriculum and the free fruit initiative (see Table 4.41). A lower percentage of schools with a high level of free school meal entitlement said that these links had been made (81% versus 90% “low/mid”; P<0.05), but it is possible that this reflects approaches taken by different local authorities. Table 4.41 Links between the taught curriculum and initiative by free school entitlement Links with the curriculum?:
Free School Meal entitlement Low Mid High N (%) N (%) N (%)
TOTALN (%)
Yes 154 (90) 135 (91) 75 (81) 364 (88) No 18 (10) 13 (9) 18 (19) 49 (12) TOTAL 172 (100) 148 (100) 93 (100) 413* (100) Notes to table Don’t know/can’t say = 25. The survey asked respondents to outline ways in which they had forged links between the free fruit scheme and the taught curriculum. The majority of those who had identified links between the initiative and the taught curriculum did make additional comments. However, the vast majority of these were very brief, and stated that there were links with health education topics, the initiative was mentioned as part of environmental studies or personal and social development teaching, or was referred to when health projects were being addressed. A minority of respondents did go into more detail. It was stressed that the initiative was part of the health promoting school ethos and thus the whole school was promoting healthy eating and choices. Also, the scheme (and healthy eating in general) was mentioned in particular subjects such as maths, science or geography. School respondents also gave examples of specific events which highlighted the free fruit initiative and other health-related topics.
Food technology: We have monthly cookery lessons and stress good quality fresh ingredients. Health: Food for growth/healthy eating part of healthy lifestyle. World geography: Where are fruits grown/climate/transportation. (School 13; Remote rural, Low roll) We are applying to become a Health Promoting School and so teaching health topics within the 5-14 health curriculum. We have assemblies that focus on health. The older pupils work with the younger pupils so health is a

49
whole school approach. We think the free fruit is wonderful and would be devastated if it did not continue. (School 166; Remote rural, Low roll) Maths: Children involved in preparation of fruit, counting, graphs etc. Health/Science: Healthy eating discussed regularly. Topic `Healthy Me' for one term. Teachers also share fruit and so provide a positive role model. Impact on social skills by providing a relaxed shared time. (School 211; Other urban, High roll)
X introduced fruit to all pupils through the .. Initiative, which had a strong educational provision, good posters/badges/stickers with teaching resources on healthy eating. All classes start the session with a mini topic on healthy eating in my school. (School 238; Large urban, Mid roll) …we are going for our Silver Award in Health Promotion, healthy eating plays a big part in that. We have had people in to talk to the children about Five a Day, we have had an open day on healthy eating and we are changing our tuck shop from August to have a chilled unit to sell fruit juice and fruit. (School 359; Large urban, High roll ) Fruit links in with topics such as `The Farm', `The Seasons' and `Myself' which we cover at the P1/2 stage. (School 419; Remote town, High roll)
Hungry for Success campaign has highlighted healthy eating. All pupils from age five to 18 are taught about healthy eating as a part of their Health Education Programme. Input from health professionals extends the pupils’ experience. (School 488; Other urban, Mid roll)
About one-tenth of schools had incurred additional financial costs, not met by the local education departments, as a result of implementing the scheme (see Table 4.42). These schools were asked to identify the nature of these additional costs. The costs tended to separate into two main components: staff time in terms of administering the scheme (in some cases this was an indirect cost and in some cases appeared to be met by local authorities) and the purchase of items to assist the operation of the scheme, including chopping boards, knives, corers, bowls, storage units, paper towels and anti-bacterial sprays. The other main source of costs to schools cited was the purchase of additional fruit so that other pupils could benefit from the scheme, and a few respondents also mentioned staff training. Table 4.42 Additional costs incurred by schools by free school entitlement Additional costs met by school?:
Free School Meal entitlement Low Mid High N (%) N (%) N (%)
TOTALN (%)
Yes 21 (12) 18 (12) 6 (7) 45 (11) No 152 (88) 131 (88) 86 (93) 369 (89) TOTAL 173 (100) 149 (100) 92 (100) 414* (100) Notes to table Don’t know/can’t say = 24.
We provide fruit for all children in school. It would not be fair to give to some and not to others. (School 62; Remote rural, Low roll)

50
Knives, kitchen roll, apple corers, chopping boards and storage boxes. (School 159; Large urban, High roll) Staff trained in food handling, attended a two day course… (School 186; Accessible rural, Low roll) Staff costs, don't know amount exactly but approximately 15 pence per child per day. (School 284; Remote town, Mid Roll)
4.2.10 Overall perceptions of scheme and future of the initiative Table 4.43 shows that almost 90% of schools had not experienced major disruption as a result of implementing and running the free fruit scheme. However, 16% of schools with a high school roll compared with 7% of schools with low pupil numbers did report that the initiative had been quite disruptive (P<0.05). Respondents were asked to expand on the level of disruption experienced by the school as a whole. The vast majority of the comments supported the view that whilst the initiative might have caused problems in its early phases, it had become part of the school routine now, and ran very smoothly. Some respondents did add that this was due to the good will of school staff, but that it was a worthwhile initiative and worth the extra effort. Those who had said that the scheme had been disruptive spoke of the time lost in an already overloaded curriculum, the problems in getting staff to prepare or distribute the fruit, as well as the issue of clearing up afterwards. Table 4.43 Disruption caused by initiative to schools by school size How disruptive?:
Size of school roll Low Mid High N (%) N (%) N (%)
TOTALN (%)
Very/quite disruptive 11 (7) 18 (11) 21 (16) 50 (11) Not very disruptive 70 (43) 81 (51) 69 (53) 220 (49) Not at all disruptive 81 (50) 61 (38) 41 (31) 183 (40) TOTAL 162 (100) 160 (100) 131 (100) 453 (100)* Notes to table *Don’t know/can’t say = 1.
Once a routine was established, minimal disruption only. (School 28; Accessible rural, Low roll) It is time consuming, people who should be doing other things are doing the preparing voluntarily, it is not their job, it's a goodwill exercise. We really need extra staff or time/paid to help us with this. (School 95; Accessible rural, Low roll ) We have operated the initiative exactly as guidelines advised which means that the class teachers have had to timetable fruit time into their day. Younger children prefer fruit to be cut etc., which is also time consuming for class teachers. (School 214; Other urban, High roll) Just a small part of our day but one that we value. (School 413; Remote rural, Low roll) Routine has been established and is part of the daily programme of events. (School 453; Large urban, High roll)

51
Not surprisingly, given the positive responses outlined above, a majority of the respondents (55%) stated that the free fruit initiative had been very successful (see Table 4.44). Indeed, only 3% of school respondents thought that the initiative had not been very successful. However, those in schools with a high pupil roll were less likely to say that the initiative had been very successful than those with lower pupil rolls (44% versus 59%; P<0.05), possibly reflecting the greater difficulty and disruption in implementing the scheme in such schools. The 15 schools that perceived the scheme to have been unsuccessful were based in 11 local authority areas. There is some evidence to suggest that those schools who distributed fruit to pupils on five days per week held the most positive views, although due to the relatively low sample size statistical significance was not reached. Table 4.44 Perceptions of the success of the initiative by school size How successful?:
Size of school roll Low Mid High N (%) N (%) N (%)
TOTALN (%)
Very successful 94 (58) 96 (60) 58 (44) 248 (55) Quite successful 62 (39) 58 (36) 69 (52) 189 (42) Not very successful 5 (3) 5 (3) 5 (4) 15 (3) TOTAL 161 (100) 159 (100) 132 (100) 452 (100)* Notes to table Column percentages do not all add up to 100 due to rounding. *Don’t know/can’t say = 2. It can be seen in Table 4.45 that almost all of the schools in the sample wanted the free fruit initiative to continue in the future. Only five schools, based in different local authorities, reported that the initiative should be stopped. In total, eleven respondents either said that the initiative should no longer continue or were unable to comment, nine of these respondents representing schools with a low entitlement to free school meals. However, given the very positive views identified above, it is important to note that almost all schools of different sizes, serving catchment areas from the relatively affluent to the relatively deprived, and from urban to rural settings, wanted the initiative to continue. Table 4.45 Advisability of free fruit initiative running in the future
Should initiative continue to run?:
Frequency N (%)
Yes 443 (99) No 5 (1)
TOTAL 448 (100)* Notes to table *Base N=448, Don’t know/can’t say = 6.

52
The questionnaire asked what changes respondents would make to the free fruit initiative if it continued to run in the future. The most common proposed change was for the scheme to be extended to more primary school children (see Table 4.46). Those in rural schools were much more likely to think this was advisable compared to those responding from large urban schools (80% versus 42%; P<0.001). This supports the fact that pupils of all ages in large urban areas were more likely to be receiving free fruit, also on a more frequent basis (see below). The next most popular proposed change was for the variety of fruit and vegetables on offer to children to be increased. In this instance, 50% of those in large urban schools compared to 30% from remote rural schools called for the variety to be increased (P<0.01). Schools in large urban areas were more likely to want increased storage facilities to be provided than those in remote rural areas which supports the findings in Table 4.21 (34% versus 20%; P<0.05), although this probably reflects the increased school roll size and the greater scope of the initiative in large urban areas. As already noted, large urban area schools tended to give fruit to pupils more frequently, therefore it is not unexpected that twice the percentage of schools in remote rural areas compared with the large urban schools suggested that fruit be given to pupils more often (P<0.01). About one-quarter of the respondents perceived that school staff should be paid for washing and preparing fruit, and one-fifth that the quality of fruit should be improved. About 5% of the sample of schools said that the initiative required no modifications. The ‘other’ changes mainly addressed issues at a local authority or school level. For example, changes to the presentation and packaging of fruit were suggested, to the time of supply to schools, as well as to the food on offer within school tuck shops and the time and place of distribution within school. Table 4.46 Suggested changes to the operation of the free fruit initiative by urban-rural scale Changes?:
Urban-Rurality Scale 1 2 3 4 5 6 TOTAL N (%) N (%) N (%) N (%) N (%) N (%) N (%)
Extend to more pupils
52 (42) 71 (69) 27 (77) 9 (82) 79 (81) 61 (77) 299 (67)
Increase fruit variety
62 (50) 47 (46) 15 (43) 3 (27) 33 (34) 24 (30) 184 (41)
More storage for schools
42 (34) 28 (27) 12 (34) 2 (18) 22 (23) 16 (20) 122 (27)
Give fruit more often
24 (19) 19 (18) 9 (26) 6 (55) 29 (30) 31 (39) 118 (26)
Pay staff 30 (24) 23 (22) 9 (26) 1 (9) 20 (21) 25 (32) 108 (24) Improve fruit quality
28 (23) 27 (26) 6 (17) 0 (0) 15 (15) 10 (13) 86 (19)
Decrease quantity
3 (2) 2 (2) 0 (0) 0 (0) 0 (0) 0 (0) 5 (1)
Other 10 (8) 4 (4) 2 (6) 1 (9) 5 (5) 4 (5) 26 (6) No changes 8 (6) 3 (3) 0 (0) 0 (0) 6 (6) 6 (8) 23 (5)
TOTAL 124 (100) 103 (100) 35 (100) 11 (100) 97 (100) 79 (100) 449* (100) Notes to table Column percentages do not add up to 100 due to rounding and respondents ticking more than one option. *Missing values and don’t know/can’t say = 5

53
5. SUMMARY AND DISCUSSION 5.1 BACKGROUND INFORMATION The national Free Fruit in Schools initiative aims to provide one portion of fruit three times a week during term time to all primary I and primary 2 pupils in local authority managed schools. The initiative is an additional measure to the recommendations made by the Expert Panel on School Meals in their Report, Hungry for Success. Both initiatives are part of the Scottish Executive’s Health Improvement Programme which recommends eating more fruit and vegetables. Improving the uptake of school meals and fresh fruit is also an essential part of supporting those children in most need. The Scottish Executive has provided £2m per year for financial years 2003-04 to 2005-06 to introduce the Free Fruit initiative across all publicly funded schools in Scotland. The initiative had been implemented in most schools by December 2003 and the 2005 SEED School Meal census shows that almost 100% of primary schools were giving free fresh fruit to P1 and P2 pupils. Only four local authorities did not report full coverage of the initiative within all of their primary schools. The Scottish Centre for Social Research (ScotCen) was commissioned by the Schools Group Analytical Service Unit in the Education Department of the Scottish Executive in February 2005 to evaluate the implementation of the Free Fruit in Schools initiative in Scotland. ScotCen used a mixed methods approach to evaluate the free fruit initiative. Firstly, a formative phase was carried out which encompassed in-depth interviews with key stakeholders and further qualitative work in pilot schools. This phase helped inform the development of the research instruments for the main survey phase. In the main study phase, semi-structured telephone interviews were conducted with 47 local authority professionals able to comment on both the policy context and the operational aspects of the free fruit initiative. Responses were gathered from all of the 32 local authorities in Scotland. Finally, a questionnaire survey of a representative sample of 510 primary schools was carried out, addressing all aspects of the implementation of the scheme at a school level. After telephone follow-up, 458 questionnaires were completed, a response rate of 90%. 5.2 VIEWS OF LOCAL AUTHORITY PROFESSIONALS Respondents in a majority of local authorities (n=20) reported that there were fruit and vegetable schemes running in their areas before the implementation of the Scottish Executive free fruit initiative. However, these schemes varied widely, from large, well-established programmes in all primary and nursery schools city-wide to areas which introduced fruit into school tuck shops or offered free fruit on a limited basis. The introduction of the national Free Fruit Initiative affected most of these pre-existing schemes in a number of different ways. For example, in some cases fruit was now given to pupils in other primary years, or given on a more frequent basis. It was reported that the Free Fruit Initiative had been implemented in 100% of primary schools in every local authority, although most recent Scottish Executive figures suggest that four areas have not achieved full coverage as yet. Most areas had also implemented the scheme in all of the special schools in their area, but three-quarters of authorities had not covered nursery schools, and secondary schools were not part of the scheme in any locality.

54
Respondents in two areas said that their primary schools gave free fruit to pupils in every primary year. The other respondents stated that P3 pupils in composite P2/P3 classes also received free fruit in 13 of the local authority areas. In six local authority areas all children in schools with a small pupil roll received free fruit. In the majority of local authorities the pupils were given one portion of fruit three times a week, in accordance with the aims of the Scottish Executive initiative. In three authorities pupils received one portion of fruit five days a week. In terms of the supply of fruit to schools, professionals in 9 local authority areas said that the school meals service was the supplier of fruit for the initiative, although in four of these areas local suppliers of fruit were also involved. In the majority of areas fruit was supplied by a local fruit or fresh produce wholesaler. A community food initiative and a housing association were involved in supplying fruit in other areas, as were local shops. Some authorities used a combination of suppliers. In nearly all cases the supplier of the fruit also distributed the fruit to schools, although in two areas another organisation was responsible for distribution. In the majority of local authority areas the fruit supplier and distributor were chosen by the local authority alone. In four areas, schools also had some input into the choice of supplier. Three of these were in rural and remote areas, suggesting that these areas required a bit more flexibility in terms of implementing the scheme. In one area it was said that the primary schools alone chose who supplied their fruit. Professionals in almost all of the authorities expressed that they were at least quite satisfied with the quality of fruit delivered to their schools. In some areas it was said that there had been problems with the quality of fruit initially, but when this was raised with the supplier the problems were quickly resolved. Only a few respondents still perceived that the fruit quality was, or could be, poor. However, respondents from nine areas reported that there could be problems related to the ripeness of the fruit delivered; this was mostly due to fruit being not ripe enough at the time of delivery. Although it was said that some areas were able to save the unripe fruit this was not an option for schools in all areas, presumably in the main because of inadequate storage facilities, and it had on occasion to be sent back to the supplier. Respondents from several authorities mentioned that although they were not unhappy with the quality of the fruit they were currently supplied with they were continually looking at other potential suppliers to see if they could improve on quality. Quality of fruit was gauged in a variety of ways, from formal surveys and evaluations as well as more anecdotal measures, such as informal feedback from school staff. Although there had been initial problems in ascertaining how much fruit to distribute to schools in each area, at the time of the telephone interviews almost every respondent perceived that the quantity of fruit delivered to the schools as part of the initiative was at least quite sufficient. A wide range of fruits and vegetables was reported as being distributed in each area. Not unexpectedly, apples, bananas, grapes, melon and oranges were supplied to most schools. However, vegetables including carrots, peppers and celery, and more exotic fruits such as mango and star fruit, were mentioned as being supplied in a minority of areas. The perception of the local authority staff was that grapes, melon, bananas, apples and strawberries were most popular among pupils. However, it is likely that the relative popularity of apples and bananas was related in some way to the fact that they were supplied

55
more frequently to schools. The respondents thought that the popularity of fruit such as grapes, melon and strawberries was because they were sweet and easy to eat. In addition, the size was also thought to be important and larger fruit such as melons and apples were said to be more appealing when cut up into a more manageable size, or packaged in a particular way. Fruits considered to be relatively unpopular with pupils included tomatoes, oranges, apples and carrots. Other unpopular fruits ranged from red peppers to dried fruit. Factors related to unpopularity included the size of the fruit, the need for preparation (eg. peeling), the mess created in preparation and the presence of stones and pips. Also, in the case of tomatoes it was argued that the children simply did not like the taste. The respondents were mostly satisfied with the variety of the fruit delivered to schools in their areas. In three authorities some of the respondents felt that the variety of fruit on offer needed to be widened. It was also stated in a few cases that the lack of variety in fruit available was as a result of budget restrictions. Given the generally positive views expressed above, as would be expected professionals in the majority of local authorities said that they were at least quite satisfied with the performance of their fruit suppliers, with staff in only two areas stating that they were not satisfied, for example, because of irregular deliveries. Also, some respondents, although they were largely satisfied with their supplier, did want to make changes to the arrangements and planned to do this in the near future. As has been said, in many cases the suppliers of fruit also distributed it to schools and therefore, not surprisingly, the level of satisfaction with the distribution of fruit was similarly high. Respondents from only one area reported that they were not very satisfied with their fruit distributor. Remote schools did pose challenges in some authorities, and arguably island authorities experienced particular problems, but the consensus was that initial distribution difficulties had been resolved. It was stated that an evaluation of the free fruit initiative was being carried out in some form in 25 local authority areas. Respondents in only four areas said that they were sure that no evaluation was being conducted. Most of those who were conducting local evaluations said that were doing so through questionnaire surveys; these were being sent to a mixture of school staff, parents and pupils. Several respondents also stated that the initiative was being evaluated as part of Hungry for Success. In a few instances, catering and education services, health promotion departments and independent consultants were carrying out evaluations. Other measures being utilised included ongoing consultation and feedback from school staff and pupils, as well as monitoring data on deliveries of fruit to schools and fruit returned from kitchens. However, it is very difficult to ascertain from the interviews with local authority staff the nature of the evaluations conducted, and the quality of research evidence being gathered locally. It is likely that both formal and anecdotal evidence was being used to justify the view expressed by the respondents that most areas were evaluating the initiative. The Scottish Executive issued guidance to local authorities in order that issues such as local sources of fruit, supply of seasonal fruit, reducing levels of wastage, organic fruit and links with school meals were considered. It was reported that most of the areas were being supplied with fruit by the school meals contractors. Although most suppliers were locally-based, some areas used suppliers from outwith the area, for example, in order to guarantee the volume of fruit necessitated by the initiative. Almost all of the authorities reported that where possible they supplied seasonal fruit and vegetables. The seasonal fruits were mainly limited to strawberries in summer and satsumas

56
in winter, but other berry fruits were also mentioned. Several respondents mentioned that their supplier alerted them to offers on seasonal fruit which helped them to reduce costs. However, respondents from five areas cited cost as a problem in providing seasonal fruit. Island respondents reported that providing fruit was not just a seasonal problem in their areas. The majority of authorities did not supply organic fruit and vegetables at the time of the research, with most citing the higher cost and/or the lack of availability of sufficient amounts of organic produce as obstacles to its provision. It was reported that three authorities did supply a low percentage of organic fruit, but in two of these authorities this was limited to very few schools. It was said in two areas that they were considering introducing organic fruit.
In almost all local authority areas at least some of the fruit was prepared in some way. This included fruit being washed, chopped or sliced, grapes being de-stalked, etc. Fruit was then often portioned in small pots or dishes and, in some cases, bagged. Preparing the fruit in this way was thought to increase its appeal to the pupils and make it easier to eat. In two authorities the respondents said that they did not prepare fruit, yet in one of these areas the fruit was supplied pre-washed; in the other area the fruit was washed in school. In both these areas children were given whole fruit. In a majority of authorities it was said that fruit and vegetables were prepared in school by school catering staff. The respondents added that in schools without kitchens fruit was prepared by other school kitchens in the authority area and then delivered to the schools. In one local authority area it was pointed out that all fruit preparation was carried out by the fruit supplier. Respondents seemed to be unaware of the guidance from the Scottish Executive to ensure that the food miles of the fruit provided to schools were minimised. Only a few respondents were aware of this guidance, or local guidance related to the same issue. Apart from the use of local suppliers, as noted above, there did not appear to have been a great deal of consideration of this element of the Scottish Executive guidance. About three-quarters of local authority areas were said to have levels of fruit wastage of less than 20%. One respondent thought that 60% of vegetables in some schools were being wasted. However, respondents found it difficult to give an overall estimate for their area in that it varied from school to school. As with Scottish Executive guidance related to food miles, very few respondents were aware of specific guidance on reducing levels of wastage of fruit. However, many measures had been introduced locally, including limiting fruit supplied to schools, encouraging children to eat fruit in the classroom setting, distributing leftover fruit to other pupils or school staff and composting any fruit waste. As a result, the majority of authorities did not think that wastage of fruit was a problem for most schools. The majority of authorities did report some link with their school meals service. For some authorities the provider of the school meals service also provided the fruit for the initiative. In addition, the catering service was reported to be involved in a number of ways, from simply ordering the fruit for the initiative, through preparing fruit and in some cases distributing the fruit. Respondents from only four authorities reported that the initiative did not link with the school meals service at all. One other link mentioned was that the initiative had had a positive impact on the choices made by pupils for their school lunches. In addition, respondents from three-quarters of the authorities spoke of Hungry for Success, and that the whole school approach to healthy eating had been assisted by more than the Free Fruit initiative operating in isolation. Similarly, links with the health promoting schools concept and the provision of

57
drinking water in schools, as well as links with curricular teaching, were also viewed as beneficial. Despite the lack of awareness of certain issues outlined above, informants in the majority of authorities reported that the guidance provided by the Scottish Executive was at least quite useful. Many respondents found the guidance clear, concise and helpful, particularly when they were setting up the initiative. There was occasional criticism, particularly from those in rural areas, who thought that the guidance did not meet the needs in their locality. However, others said that they were able to adapt the guidance to suit their needs locally. In addition, it was said that some authorities provided schools with guidance, mostly focusing on fruit handling and food hygiene, and in a few instances storage of fruit. In relation to difficulties encountered by the initiative, not one respondent thought that there had been any major problems with the running of the schemes in their areas. Inevitably, some said that there had been initial teething problems in the early phases of setting up the scheme, but these had been largely overcome. The main hurdle that had to be overcome was the time teachers had to spend on administering the initiative and the consequent loss of class time with the children. In some areas there was initial resistance from teaching staff to the scheme, the problem scarcely ameliorated by the recommendation that the fruit should be eaten in the classroom rather than in the playground. However, local authority respondents stressed that they had liaised with school staff – with head teachers and teachers – to convince them of the value of the initiative. Other difficulties experienced in the different areas included the costs of the scheme, delivery of fruit across a wide geographical area, occasional problems with the quality of fruit and implementing the initiative in areas with many composite classes containing P2 and P3 pupils. These problems had been dealt with in a number of ways. On the other hand, the willingness, enthusiasm and commitment of both teaching and catering staff involved with the initiative were mentioned most frequently as the factors which facilitated the operation of the initiative. The experience of catering staff and the existing school meal providers, particularly in terms of the preparation and distribution of fruit, was perceived as being invaluable. Funding was mentioned by a few respondents as being vital to the implementation of the initiative. The existence of Hungry for Success and the publicity surrounding it, and healthy eating in general, was considered by some to have assisted the introduction and acceptance of the free fruit initiative within schools. Almost every local authority area was able to provide cost data for the operationalisation of the free fruit initiative, even if the costs were approximate only. Given the very different areas and school rolls covered by the local authorities, costs ranged from about £12K to £1000K per annum. Respondents in the majority of local authorities thought that the funding provided by the Scottish Executive was at least quite sufficient to run the initiatives in their schools. However, at least 12 local authorities perceived that this was not the case, although it is difficult to give precise local authority figures as in eight areas different views were expressed. In areas in which funding was thought to be sufficient already, it was often said that there had been additional costs at the outset of the initiative, but once the initial outlay had been met costs had reduced or stabilised in the following years. In a number of cases local authority respondents argued that Healthy for Success monies had been used to help subsidise the free fruit initiative. Other examples were given of shortfalls, or what could be achieved with even more funding, for example, by extending the types of fruit supplied to schools.

58
Almost all (n=45) of the respondents said that fruit consumption had increased among pupils as a result of the initiative, with only two professionals stating that there was no evidence for such an increase. It should be noted that both of these respondents represented authorities in which another individual indicated that fruit consumption had increased among pupils. However, the fact that the Free Fruit initiative was part of Hungry for Success, and not operating in isolation, was a point raised during every phase of the research, and it is important to note that many of the perceived impacts identified in this evaluation are likely to be due to a Hungry for Success component, and not solely a free fruit initiative effect. Reasons given to support the claim that fruit consumption had increased included the results of formal evaluations in the local schools, feedback received from school staff, parents and pupils, direct observation during school visits and an increased demand for fruit and vegetables from school tuck shops and for school lunches. Only one local authority professional thought that the initiative had no place in promoting healthy eating more generally in school pupils. Every other respondent thought that the initiative did have this wider role, the general consensus being that the awareness of fruit and its relationship to healthy eating had increased, pupils who had never tried fruit or were only aware of a limited range of types were enjoying new tastes, links with the curriculum and health promoting schools had been forged, and the combined impact with other related initiatives, such as Hungry for Success as a whole, was changing the eating habits of children for the better. As might be expected, given the positive views expressed above, two-thirds of the local authorities rated the free fruit initiative as being very successful, with professionals in seven areas stating that the scheme had been quite successful. In the remaining areas the two respondents gave different opinions, although only one of the 47 respondents said that the initiative had not been successful at all. All of the 47 local authority respondents, including the individual who had expressed more negative views, thought that the free fruit initiative should continue to run in their areas in the future. The fact that the initiative was thought to impact favourably on the diets of young primary school-aged children, and would then have the capacity to produce health benefits for future generations, in combination with other initiatives, was cited. It was stressed that the initiative had been very successful, and it should be allowed to continue and not have its funding cut. It was also argued that the initiative was one of the best to be introduced by the Scottish Executive. The most frequently mentioned change to the running of the free fruit initiative, given its very positive reception among local authority informants, was to expand the initiative so that children received fruit on 5 days per week and/or pupils in more or all primary years were covered by the scheme. Several respondents also mentioned extending the scheme to include nursery schools and one respondent wanted to see the initiative expanded into secondary schools. A few respondents were content with the initiative as it was and did not want any changes to the way the scheme operated. Other suggestions for changes to the initiative, suggested by a minority of respondents, included increasing the variety of fruit offered, increasing the portion size and encouraging children to be involved in fruit preparation. Again, the fact that most of the requested modifications to the initiative would actually increase its scope emphasises the very positive reaction to the initiative among the local authority professionals.
59
5.3 VIEWS OF SCHOOL STAFF RESPONDENTS After 510 questionnaires were distributed to schools, a total of 458 questionnaires were either returned by post or completed by telephone interview. This represents a response rate of almost 90%. Responses were received from schools in every local authority in Scotland, with the response ranging from four schools in an Island authority to 44 forms in an urban area. As a result of this very encouraging response rate, it was possible to analyse responses by the urban-rurality scale, the size of the school roll and the pupils’ entitlement to free school meals. Not unexpectedly, the vast majority of the schools which responded belonged to one of the urban or rural categories – few schools were based in towns. Also, schools based in urban areas were more likely to have high school rolls and high levels of pupil entitlement to free school meals when compared with their rural counterparts. The majority of questionnaires were returned by head teachers. This was particularly true for smaller, often rural, schools. Primary school teachers were more likely to complete the forms in smaller schools, although in a number of cases one individual combined a senior school post with the teaching of a composite primary class. About one-quarter of questionnaires returned had been completed by more than one respondent. Only four schools (1%), three of which were special schools, were not running the free fruit initiative, and three of these schools had no pupils in the appropriate primary years. Also, 13% of schools reported that a similar fruit initiative was in operation before the Scottish Executive scheme was implemented. Schools in about one-third of local authority areas reported no previous fruit-related schemes, which supports the views expressed by the local authority respondents. In addition, school staff stated that the Scottish Executive inspired initiative had resulted in the pre-existing scheme being extended in some way, such as covering more pupils or fruit being distributed more frequently. This again is in accordance with the views of the local authority respondents. Primary 1 and 2 pupils were indeed the main beneficiaries of the free fruit initiative, as intended. However, 46% of schools gave fruit to primary 3 pupils, with 65% of schools in the low school roll category doing this, presumably because of the influence of composite classes (75% of schools with primary 2 and 3 pupils within the same class offered fruit to both year groups). Over one-quarter of primary 7 pupils received free fruit, with a majority of schools in five local authority areas giving free fruit to this year group. About 75% of school respondents reported that the pupils in the relevant years received one free fruit portion on three days of the week – the programme announced by the Scottish Executive. However, 29% per cent of schools in the large urban category compared with only 11% of schools in the remote rural category reported giving fruit to pupils on a daily basis (P<0.01), again reflecting the different approaches adopted by individual local authorities. There was a major difference noted between fruit and vegetable deliveries to urban and rural schools, with 34% of large urban schools compared with 3% of remote rural schools receiving fruit deliveries on at least four days per week (P<0.001). The size of the school roll also seemed to have some impact on school deliveries, with those with low school rolls more likely to receive weekly deliveries. Those most frequently involved in fruit and vegetable distribution within the school were members of catering staff, classroom assistants and primary 1 and 2 teachers.

60
Those in remote rural schools were much more likely to report storing fruit in refrigerated units compared with respondents in large urban schools (49% vs 25% P<0.01) – large urban schools were more likely to use boxes and baskets. This might reflect the different deliveries to schools outlined above, with rural schools needing to keep fruit for a longer time period before distributing it to the pupils. However, schools in the “other urban” category followed a similar storage pattern to the rural schools. Eighty percent of schools were reported to have storage facilities that were at least quite adequate, but 25% of schools based in large urban areas said that storage facilities were inadequate. Those who thought that the storage facilities were inadequate tended to say that refrigeration of the fruit was necessary to limit wastage, and certain fruit types were distributed as soon as practicable as they had a greater propensity to decompose. However, many of these schools also said that they managed quite well despite the lack of storage facilities. Almost 75% of the sample of schools prepared (as in washed and cut up) the fruit and vegetables in the school kitchen. This was especially the case in remote rural schools, with large urban based schools more likely to have fruit prepared within the classrooms, general purpose rooms or “other” places. In two-thirds of schools catering staff were involved in preparing the fruit for pupils. However, only 44% of schools in large urban areas had catering staff preparing the fruit and vegetables. Others involved in fruit preparation included classroom assistants, primary 1 and 2 teachers and the fact that fruit came prepared either from the supplier or from other school kitchens. In addition, in almost 40% of schools the fruit was cut or packaged in a particular way by suppliers, and in about 59% of schools the school staff also prepared the fruit in such a way (e.g. smaller portions, pick ‘n’ mix bar) to increase its appeal to pupils. Only 63 (14%) schools reported health and safety concerns related to the free fruit initiative, reflecting the fact that fruit and vegetables are relatively low risk foods. This figure was higher in large urban schools (23%), which might be because a higher percentage of respondents from these schools perceived that their storage facilities were inadequate, as identified above. The major concern voiced by the 63 schools was that the hygiene, in terms of handling and cleaning fruit and its overall preparation, might be inadequate. The safe storage of fruit was also a concern. Respondents from only 15 schools said that fruit stones or fruit allergies were of concern to school staff members. Almost one-half of the schools usually gave fruit to the pupils before the morning break. Schools with a large number of pupils were more likely to distribute fruit at this time (61% ‘high roll’ versus 38% ‘low roll’; P<0.001). This might be partly explained by the time of day fruit is supplied to large urban schools which tend to have more pupils, as well as the lack of storage facilities in these schools. The next most common time for fruit to be distributed was after lunch, with 35% of respondents reporting that fruit distribution to pupils took place at this time. About one-quarter of schools often gave fruit to pupils during the morning or lunch breaks. According to the respondents, over 75% of schools usually had pupils consuming the fruit within the classroom. About 30% of school respondents also thought that the playground was the usual place of fruit consumption. (Some schools gave fruit out at different times and places for the various primary years covered by the initiative.) Schools with a high level of school roll were more likely to allow pupils to eat the fruit in the classroom, and less likely to have pupils eating the free fruit in the dining hall, compared to schools with a low pupil roll. This probably relates to the different distribution pattern within school described above.

61
About 68% of the school respondents reported that over 80% of pupils eligible for free fruit were eating it. In remote rural schools 83% of schools reported this consumption level, as opposed to only 62% of large urban schools (P<0.01). Respondents from only 7 schools perceived that between 21-40% of eligible pupils in their schools consumed the free fruit on offer. Over 90% of school respondents reported that between 0-20% of fruit ended up being discarded as waste. Only two schools reported levels of fruit wastage of over 60%. Again, remote rural and schools with small pupil rolls reported relatively low levels of wastage. A majority of the schools gave any leftover fruit to other pupils within the same school. It was stressed that fruit only ended up as waste occasionally, with fruit being given to those without snacks, for consumption at home, made into fruit “smoothies” and used for compost, again supporting the views expressed by local authority respondents. A similar list of fruit and vegetables supplied to schools was given in the questionnaire survey when compared with the local authority survey. The questionnaire asked what types of fruit and vegetables were supplied to the schools. Apples, bananas, grapes, oranges, satsumas, pears, kiwi fruit and melon appeared to be supplied most commonly to primary schools. However, a wide range of fruit and vegetables were reported as being supplied to schools. Indeed, 89% of respondents reported that they were at least quite satisfied with the variety of fruit provided to schools. However, school respondents in large urban areas were much less likely to be very satisfied with the variety of fruit and vegetables on offer when compared to the remote rural schools (25% versus 58%: P<0.001). Green grapes, and to a lesser extent red grapes, as well as apples, bananas and melon were perceived as being most popular with the pupils. However, apples and bananas also had relatively high percentages of respondents stating that these were least popular with their pupils, and the fruits supplied more frequently to schools arguably have a better chance of inclusion in both the best and least popular lists. Strawberries and fruit juices, obviously only available in some localities, were popular and not thought to be disliked by the pupils. On the other hand, cherry tomatoes, oranges, pears and kiwi fruit appeared to be more disliked than liked, according to the informants. On the whole, these perceptions of the school respondents were shared by the local authority professionals. Almost one-third of schools were very satisfied with the quality of fruit delivered to them, with only 12% of school respondents expressing some form of dissatisfaction. Those responding from remote rural schools were almost twice as likely to be very satisfied with the fruit on offer compared with large urban schools (39% versus 21%, P<0.01). Respondents from urban schools did seem to be more dissatisfied on the whole, which might reflect individual variation within local authority practice or the difficulty of catering for a larger school roll. The minority of school staff members who expressed dissatisfaction added that the fruit was often of variable quality, was often under- or overripe, could arrive at school in a damaged condition and was sometimes of such poor quality that it had to be returned to the suppliers. In relation to the quantity of fruit delivered to schools, informants from only 13 schools thought that they were not being supplied with enough fruit as part of the initiative. In terms of the impact of the initiative, of those respondents able to give a view, almost 60% thought that the pupils were now eating more fruit and vegetables as part of their school lunch. The consumption of fruit and vegetables for school lunches was said to have decreased in only six schools. However, a slight majority of respondents perceived that the free fruit initiative had made no difference to the food brought into school by pupils for their snack or lunch. Despite this, over 40% of respondents thought that pupils were now more likely to

62
bring fruit in to school for lunch or a snack. Respondents in only 12 schools stated that pupils were less likely to bring fruit for a snack, possibly because they were already having fruit and vegetables provided as part of the free fruit scheme. In addition, in 11% of schools it was reported that sales of fruit from the school tuck shop had increased as a result of the initiative, with only 12 schools reporting a decrease in sales. However, over two-thirds of schools either had no tuck shops or did not sell fruit from tuck shops. The vast majority of school staff members reported that the free fruit scheme had resulted in both increased fruit consumption in pupils eligible for the initiative (95% of respondents) and a general improvement in their healthy eating habits (90% of respondents). Although the first of these points might seem obvious, it was pointed out in the formative research phase that some children were eating the same amount of fruit as they no longer brought in fruit as a snack. Also, 65 respondents were unable to give an opinion on whether the general eating habits of pupils had improved, mostly because they did not know what the pupils were eating at home. Others stressed that many children who did not eat fruit were now requesting it, peer pressure resulted in most children eating fruit, there was evidence of healthier snacks being brought into school and an increased awareness of healthy eating as a whole. Not unexpectedly, the vast majority of respondents reported that there had been no change in the behaviour of pupils within the school as a result of the free fruit initiative. However, of those able to give an opinion, 13% of respondents argued that pupil behaviour had actually improved. The perceptions of respondents to the overall impact of the free fruit initiative are therefore very positive. However, it must be stressed that the views of parents and pupils were not sought as part of this evaluation. In addition, these findings are based on the perceptions of school staff, and not on more formal evaluations or measures of impact on the pupils and their eating behaviour. As has already been pointed out, at least some of these reported changes are unlikely to be due to the free fruit scheme on its own, and Hungry for Success and other initiatives have probably been a factor in some of the perceived effects. Nevertheless, these positive perceptions support the views expressed by the local authority respondents, with both surveys suggesting that the impact of the free fruit initiative has been favourable in terms of the healthy eating practices of pupils more generally. About 88% of schools said that links had been made between the taught curriculum and the free fruit initiative. The links identified included the initiative being mentioned as part of health education topics, environmental studies or personal and social development teaching, as well as being referred to when health projects were being addressed. It was also argued that the initiative was part of the health promoting school ethos and thus the whole school was promoting healthy eating and choices. The scheme, and healthy eating in general, was addressed in subjects as diverse as maths, science or geography. About one-tenth of schools reported incurring additional financial costs, supposedly not met by the local education departments, as a result of implementing the scheme. These costs tended to separate into two main components: staff time in terms of administering the scheme (in some cases this was an indirect cost and also appeared to be met by local authorities), and the purchase of items to assist the operation of the scheme, including chopping boards, knives, and anti-bacterial sprays. The other main source of costs to schools cited was the purchase of additional fruit so that other pupils could benefit from the scheme.

63
Almost 90% of schools had not experienced major disruption as a result of implementing and running the free fruit scheme. However, 16% of schools with a high school roll compared with 7% of schools with low pupil numbers did report that the initiative had been quite disruptive (P<0.05). The vast majority of respondents supported the view put forward by the local authority professionals that the initiative might have caused problems in its early phases, but had become bedded in as part of the school routine, and tended to run very smoothly. Some respondents did stress that this was due to the good will of school staff, but that it was a worthwhile initiative and worth the extra effort. Those who had said that the scheme had been disruptive spoke of the time lost in an already overloaded curriculum, the problems in getting staff to prepare or distribute the fruit, as well as the issue of clearing up afterwards. As would be expected, given the very positive views described above, a majority of the respondents (55%) stated that the free fruit initiative had been very successful, with only 3% of school respondents perceiving that the initiative had not been very successful. Those respondents in schools with a high pupil roll were less likely to say that the initiative had been very successful than those in schools with lower pupil rolls (44% versus 59%; P<0.05), possibly reflecting the greater difficulty and disruption in implementing the scheme in such schools. The 15 schools that perceived the scheme to have been unsuccessful were spread across 11 local authority areas. There is some evidence to suggest that those schools who distributed fruit to pupils on five days per week held the most positive views, although the sample size was relatively low and other factors might also have been responsible. Almost all of the schools surveyed (99%) wanted the free fruit initiative to continue in the future. Respondents in only five schools, based in different local authorities, reported that the initiative should be stopped, and six other schools were unable to give an opinion. However, it is important to note that almost all schools of different sizes, serving catchment areas from the relatively affluent to the relatively deprived, and from urban to rural settings, wanted the initiative to continue. This reflects the views of the local authority professionals, and is arguably also supported by the fact that the response rate to the questionnaire survey was so encouraging. In that the initiative had been received so warmly by the majority of respondents, the most commonly proposed change was for the scheme to be extended to cover more primary school children. The next most popular proposed change was for the variety of fruit and vegetables on offer to children to be increased. About one-quarter of respondents wanted the storage facilities to be improved, for free fruit be given to pupils on a more frequent basis and that school staff should be paid for washing and preparing fruit. About 19% of the sample said that the quality of fruit delivered to schools could be improved. Again, these views were similar to the ones elicited from the local authority professionals, and it is important to note that both surveys gave quite similar results, albeit from different perspectives. 5.4 SCHOOL SURVEY RESPONSES BY ENTITLEMENT TO FREE SCHOOL MEALS Responses to the school survey were analysed by the urban-rurality scale, size of the pupils roll and the level of entitlement to free school meals. As has been pointed out, there is a relationship between these factors, with urban schools more likely to have a high pupil roll and high pupil entitlement level to free school meals. Also, the fact that local authorities have implemented the initiative in different ways is likely to mean that some of the statistically
64
significant differences identified above are actually due in part to a local authority effect. However, in that the initiative is a component of the Scottish Executive’s Health Improvement Programme which recommends eating more fruit and vegetables, and poor diet and poor oral health is more common in communities with lower socioeconomic status, it is important to look at some of the school survey results by entitlement to free school meals. Schools with 0-10% of pupils entitled to free meals were said to have low entitlement, those with 11-30% of pupils entitled to free meals were said to have mid entitlement, whereas those with entitlement levels of over 30% had high levels of entitlement to free school meals. As might be expected, a higher percentage of pre-existing fruit schemes, before the Scottish Executive launched the national initiative, were in operation in schools with a high level of free school meals entitlement (22% in high versus 10% in low, P<0.01). It is possible, though, that this reflects the approaches taken by individual local authorities. When consumption and wastage of fruit were considered, there was little difference reported between schools with low entitlement to free school meals compared to schools with high entitlement, suggesting that children from different backgrounds were benefiting from the initiative. Also, schools with a high level of entitlement to free school meals were more likely to give leftover fruit to pupils without snacks (31% high versus 11% low, P<0.001) and also for pupils to take home. 67% of respondents from high entitlement schools, compared with 54% of those in low entitlement schools, perceived that the pupils were eating more fruit and vegetables at lunchtime (P=0.05). A higher percentage of staff from low entitlement schools thought that pupils were now more likely to bring fruit in as part of their snack or lunch, although 35% of those from high entitlement schools also felt that this was the case. As has already been reported, 95% and 90% of respondents thought that pupils were consuming more fruit and had improved their healthy eating behaviour respectively. These results were very similar across the different entitlement levels to free school meals. Respondents from schools with a high entitlement to free school meals were twice as likely as those in schools with low entitlement to report that pupil behaviour had improved as a result of the initiative (19% versus 9%, P<0.05). However, this should be treated with some caution as a relatively high percentage of respondents were unable to give an opinion. Schools with a high entitlement to free school meals appeared to be less likely to have made links between the initiative and the taught curriculum. Even so, 81% of those in high entitlement schools said that such links had been forged. When responses to questions related to disruption within schools, perceptions of success and the advisability of the initiative continuing were analysed, there was little variation in the results elicited from schools with different levels of entitlement to free school meals. (However, all five of the schools calling for the initiative to be stopped were low entitlement schools.) There were differences noted in relation to suggested modifications with, for example, high free entitlement schools more likely to want the variety of fruit and vegetables to be increased, but again this probably reflects variation within local authority practice. In conclusion, those representing schools with a high pupil entitlement to free school meals were at least as positive in their views of the free fruit initiative as their counterparts from other schools. In some cases, they perceived that the impact of the initiative had been even

65
more positive than those individuals responding from schools with lower levels of entitlement to free school meals.

66
6. CONCLUSIONS Both local authority professionals and school staff members perceived that the national Free Fruit in Schools initiative had been very successful. Indeed, it was argued that it was one of the most successful initiatives of its kind, and that it should be allowed to continue. The views of the vast majority of respondents was that the initiative had resulted in an increased consumption of fruit and an improvement in healthy eating practices more generally in pupils attending schools of different sizes, serving catchment areas from the relatively affluent to the relatively deprived, and from urban to rural settings. For example, 90% of school respondents thought that the initiative had brought about an improvement in general eating habits, and almost 60% perceived that pupils were now consuming more fruit and vegetables as part of their school meals. The most popular suggested modification for the initiative was not for a radical overhaul of its operation, but for its extension to cover more pupils on a more frequent basis. Similarly, one of the few complaints from a minority of local authority respondents was that the money provided by the Scottish Executive for the initiative was not always adequate, especially in that they wanted to cover more pupil years, or improve other elements of the scheme, such as providing a wider variety of fruit. A minority of local authority and school respondents held more negative views. It was said that the initiative was disruptive for schools, the fruit supplied to schools was not always of the highest quality, the storage facilities within schools were not always adequate and school staff should be paid to compensate them for preparing and distributing the fruit. However, the overwhelming consensus was that problems were more common in the early phase of the initiative, and that once these difficulties were addressed a routine had been established which allowed the smooth operation of the scheme. In addition, it was also emphasised that such minor difficulties were a price worth paying as the benefits of the initiative far outweighed any negative features. It should be noted that not one local authority respondent thought that the initiative should not continue, and only 5 schools (1%) called for the end of the initiative. Of course, the research only sought the perceptions of local authority and school-based staff, and did not gather the views of pupils and parents or carers. In addition, it was at times difficult to separate the potential impact due to the free fruit initiative and wider policy initiatives, such as Hungry for Success. A minority of respondents argued that the positive effects they had observed were due to a number of factors, and not just the free fruit initiative. Again, though, the broad consensus was that the free fruit initiative had been very successful, and many respondents perceived that the positive impact they observed in relation to the eating behaviour of the pupils was due in no small measure to the initiative alone. Due to the overwhelmingly positive reception to the initiative, it is actually quite difficult to make recommendations as to how it should operate in the future. Certainly, major modifications would not appear to be necessary. However, the changes suggested by the respondents tended to call for an expansion of the initiative. Therefore, the provision of free fruit to all or more primary years, or the provision of fruit on a more frequent basis, would find the support of a majority of respondents in this study. Obviously, though, most of the suggested changes would have significant cost implications to the Scottish Executive, and it is beyond the scope of this evaluation to make such recommendations. What is clear, though, is that the Free Fruit initiative has been very favourably received by local authority and school staff, it has been thought to be responsible for increasing fruit consumption and encouraging the adoption of more healthy eating practices in children living in communities

67
of different socioeconomic status across Scotland and is valued very highly at both the local authority and school level alike.

9 780755 928859
ISBN 0-7559-2885-7
ISSN 0950 2254ISBN 0 7559 2885 7 (web only publication)
www.scotland.gov.uk/socialresearch
Astron B44739 12/05