evaluation of two-layer pavements using dimensional...
TRANSCRIPT

TRANSPORTATION RESEARCH RECORD 1307 99
Evaluation of Two-Layer Pavements Using Dimensional Analysis
LUTFI RAAD AND LYLA K. MARHAMO
Chart solutions for critical response parameters in two-layer pavements are developed using dimen ional analy is. Multilayer ela -tic theory is applied , and simple dirnen. ionles variable for cdtical respon e parameter are related to pavement geometry, material propertie , and loading c nditions. Tbe solutions presented provide a compre'hen ive a sessment of the physical behavior of two-layer y rems under a wide variety of input variables. The p.ropo ed so.lution are applied in the design and analysis of pa emcnt using both functional and structural fai.lure considerations.
Many transportation support systems could be modeled as two-layer structures. These structures could include, for example, a stabilized layer over subgrade or an existing pavement overlaid by a new surface layer. In general, pavements exhibit a wide range of material characteristics, such as complex particulate structure, stress-dependency, viscous and damping behavior, nonhomogeneity, and anisotropy. Although improved material models that simulate stressdependent resilient behavior have been proposed and incorporate advanced numerical algorithms, such as the finite element method (1,2), the linear elastic theory is still considered by many to provide an acceptable approximation of real conditions. This theory, for example, is incorporated in a number of widely used design procedures, including those by Shell International Petroleum Company (3) and the Asphalt Institute ( 4). Moreover, a number of pavement evaluation methods that include nondestructive testing techniques use elastic theory to backcalculate average layer moduli that best fit surface deflection basins under applied loads (5- 7). For pavement performance predictions, a number of limiting criteria have been expressed in terms of critical response parameters and number of load repetitions. These criteria are often determined from backcalculated stresses, strains, and deflections of existing field pavements using elastic theory (8,9). If such criteria are to be used in assessing pavement performance, the corresponding critical response parameters should be determined using similar analytical procedures, which will yield more meaningful and consistent predictions.
Dimensional analysis has been recognized by many investigators as a powerful tool for representing pavement analysis results (10-13). This method involves grouping analytical data into dimensionless parameters to provide an improved engineering approach for data presentation and interpretation. Chart solutions for critical response parameters in two-layer
L. Raad, Institute of Northern Engineering, University of Alaska, Fairbanks, Alaska 99775. L. K. Marhamo, Department of Civil Engineering, Massachusetts Institute of Technology , Cambridge, Mass. 02139.
pavements are developed in the following paragraphs using dimensional analysis. Multilayer elastic theory is used, and simple dimensionless variables of critical pavement response parameters are related to pavement geometry, material properties, and loading conditions. The developed chart solutions, although complementary to other solutions and computer codes for predicting the response of pavement structures, have the added advantage of providing a simple and quick tool for the direct determination of critical response parameters in twolayer pavements. Moreover, they represent a comprehensive assessment of the physical behavior of two-layer pavements under a wide variety of input variables. The proposed solutions are applied here in the design and analysis of pavements using both functional and structural failure considerations.
ANALYSIS
Mechanistic methods of pavement design and evaluation require the determination of such critical response parameters as pavement stresses, strains, and deflections. In the two-layer systems analyzed, the response parameters include the following:
1. Tensile stresses and strains on the underside of the stabilized layer,
2. Vertical stresses and strains on top of the subgrade layer, 3. Surface deflections at the center of the applied load, and 4. Maximum shear stress in the subgrade.
These parameters are chosen on the basis of a number of pavement performance models (3,8,9). The two-layer system considered is shown in Figure 1.
Materials are assumed to be linear elastic, isotropic, and homogeneous. The surface layer is infinitely wide and has a uniform thickness H, a modulus of elasticity £ 1 , and Poisson's ratio v1 • The subgrade layer is an elastic halfspace with elastic modulus £ 2 and Poisson's ratio v2 • The two-layer system is subjected to a uniform circular load having a radius R and intensity q. A summary of the cases analyzed is presented in Table 1. The following response parameters were determined using ELSYM5, a computer program for the analysis of elastic layers (14):
ax, Ex = tensile stress and strain, respectively, on the underside of the stabilized layer;
a,, E, = vertical stress and strain, respectively, on top of the subgrade;

100
U = surface deflection at the center of the applied load; and
T = maximum shear stress in the subgrade defined as (cr1 - cr3)/2, in wh.ich cr1 and cr3 are major and minor principal stresses, re pectively.
These parameters were computed along the centerline of the applied urface load.
DIMENSIONLESS GROUPING OF RESPONSE PARAMETERS
Dimensional analysis was con.ducted to provide simple engineering olution for pavement re ponse parameters. The e independent variable arc grouped into (a) ingle-parameter correlations and {b) double-parameter correlations.
For single-parameter correlations, the required re ponse parameters (i.e., st ress, strain , and deflection) are expressed as follows:
i = 1 to 6 (1)
where X; is a dimensionless parameter treated as an independent variable that could have the following forms:
X 2 = a,lq;
x3 = Tlq;
X 4 = E2e)q;
X 5 = E2e,lq; and
H E1,V1
00
FIGURE 1 Representation of two-layer system.
TRANSPORTATION RESEARCH RECORD 1307
Results of the analysis are shown in single-parameter charts (see Figures 2-7). These charts could be used to determine any of the response parameter· defined in Equation 1. They also illustrate the trend of variation of these parameters in the practical ranges of £ 1/Ei and HIR .
Dimensional analysis was also conducted to develop doubleparameter charts that wou ld provide a more direct a ppr ach in the design and eval uation of two-layer pavements, particularly in relation to fail ure in the stabilized base or the sub grade. The dimensionless groupings are expre sed as fo llow :
or
where
Y1 = qla,; Y2 = qla,; Y3 = qh; Y4 = qh; Ys = q!E2E,; Y6 = q/Ezf.,; Z 1 = a)a,; Z2 = E2e)a,; Z3 = a)T; Z4 = E2E)T; Z5 = a)E2e,; and Z6 = E)E,.
10
~
A"'"
7--1.0
-10-1
sx10-2
10
--
i = 1 to 6
i = 1 to 6
--...,.. ... _,. e--- ~
- i---
---104
FIGURE 2 Solution chart for <rx-two-layer theory.
(2)
.25
.50
.75 1.0 1.5 2.0
3.0 4.0
6.0
H/R
TABLE 1 SUMMARY OF CASES ANALYZED
H/R
0.25, 0.50, 0.75 , 1.0, 1.5, 2.0 , 3.0, 4.0, 5.0
E1/E2
10,20,30,40,50,60,70,100,150, 200,300,400,500,500,700,1000, 1500, 2000,3000,4000,5000, 5000,7000,10000,15000 20000,30000,40000,5000
0.30 0.45
Raad and Marhamo
CT
~
1.0
-io-1 -
~
10-2 --10-3
10-"
10·5 10
---
102
'i-LJ 11 -i-.1. I
- ~
..... ---1ti ~ ~ -
~ ~ .... ....._ -....
........
I I
104
E1 / E2
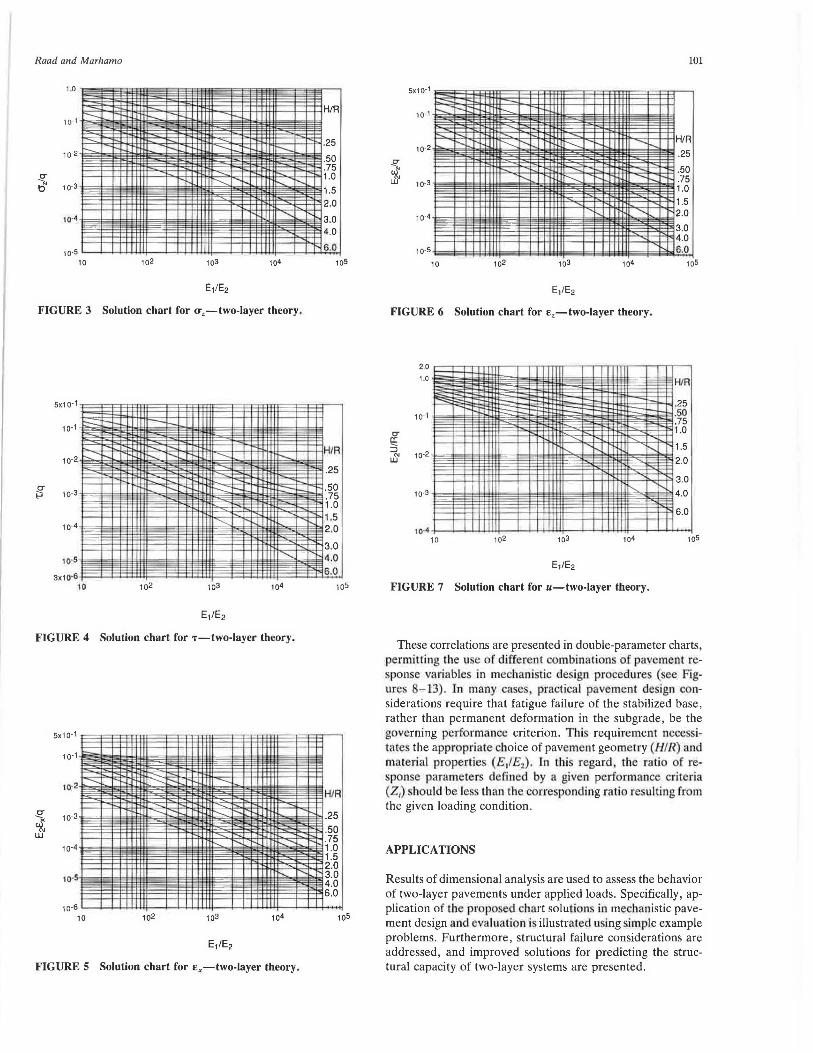
FIGURE 3 Solution chart for <r,-two-layer theory.
sx10-1 -10-1 ::--::::: - i- ~- I I
- -- -~ - ~ I 1--
- -10-2
I 111 ..... - r-
~
-f; 10-3
- '
-
.....
I Ill ~ ' 10-4
10·5
3x10·6 10
I 11111
102
-
1 1 II ........ -
104
E, I E 2
FIGURE 4 Solution chart for T-two-layer theory.
'j
H/R
.25
.50 .75 1.0 1.5 2.0
3.0 4.0
6.0
105
H/R
.25
.50 .75 1.0 1.5 2.0
3.0 4.0 6.0
sx10-1 '~=E!lr!!!!:=~~~M=~-am·~- ~=!=~!fl 10
. 1 - I 111 I I 11 I
FIGURE 5 Solution chart for Ex-two-layer theory.
101
Sx10-1 -~-,...._, ~
10-1 -- l'-l:'1- --10-2
- - - ~
H/R i-LT' ['--... ' ............ .... ..... .25
~ 10-3
- .50 - ~
I I I ....._ -.... ..... -- ..... .75 1.0
.... ~ 1.5 10-4 I I I ..... 111'11.' 2.0
3.0 .. 4.0 10-5 I I I I ll 6.0
10 105
FIGURE 6 Solution chart for E,-two-layer theory.
2.0
1.0 ~§ - - H/R
.25 10-1
..... -- - - .50 .75
CT .... 1.0 a: 3
10-2 "' U.J
' .... ....... ..... ' 1.5
2.0
3.0 10-3 ' '
1-.. 4.0
" 6.0
10·4 I 11 Ill
10 102 104 105
FIGURE 7 Solution chart for u-two-layer theory.
These correlations are presented in double-parameter charts, permitting the u e of diffe rent combinations of pavement response variables in mechani tic design procedure (see Figures 8- 13). In many cases , practica l pavement design considerations require that fatigue failure of the stabilized base, rather than permanent deformation in the subgrade, be the governing perfo rmance criterion. Thi requirement necessita tes the appropriate choice of pavement geometry (HI R) and material properties (E/£2 ) . Ln tbis regard , the ra tio of respon e parameters defined by a given perfo rmance criteria (Z1) should be less than the corresponding ratio re ult ing from the given loading condition .
APPLICATIONS
Results of dimensional analysis are used to assess the behavior of two-layer pavements under applied loads. Specifically, application of the pr po ed chart solution. in mechanistic pavement design and eva luation i illustra ted using simple example problems. Furthermore , structural failure considerations are addressed, and improved solutions for predicting the structural capacity of two-layer systems are presented.
102 TRANSPORTATION RESEARCH RECORD 1307
1Si>O "' !/!YI! /1
1000 \ v fl/ ~ I 1-'r'I ·' 0
I I 0.25 - /A'++-__,f---+--t-i1-t-t-1-H YI/ /I I I .11 I I v -/IY I y ,11 f.Y
J.._.-1 '-'- r-7// I l :..>
~~l:/v::'.i.::/ ~~ 1 L___.!:/:...d6:±:::t:[l.1l_l__~L-Ll_LJ-1.LLJ_~1-..L.JLLLUlL~_L__L..L.1...LLl..ll~__l_-1..._J_JLU..l.l..J 1 5 10 1 02 103 1 04 1 05
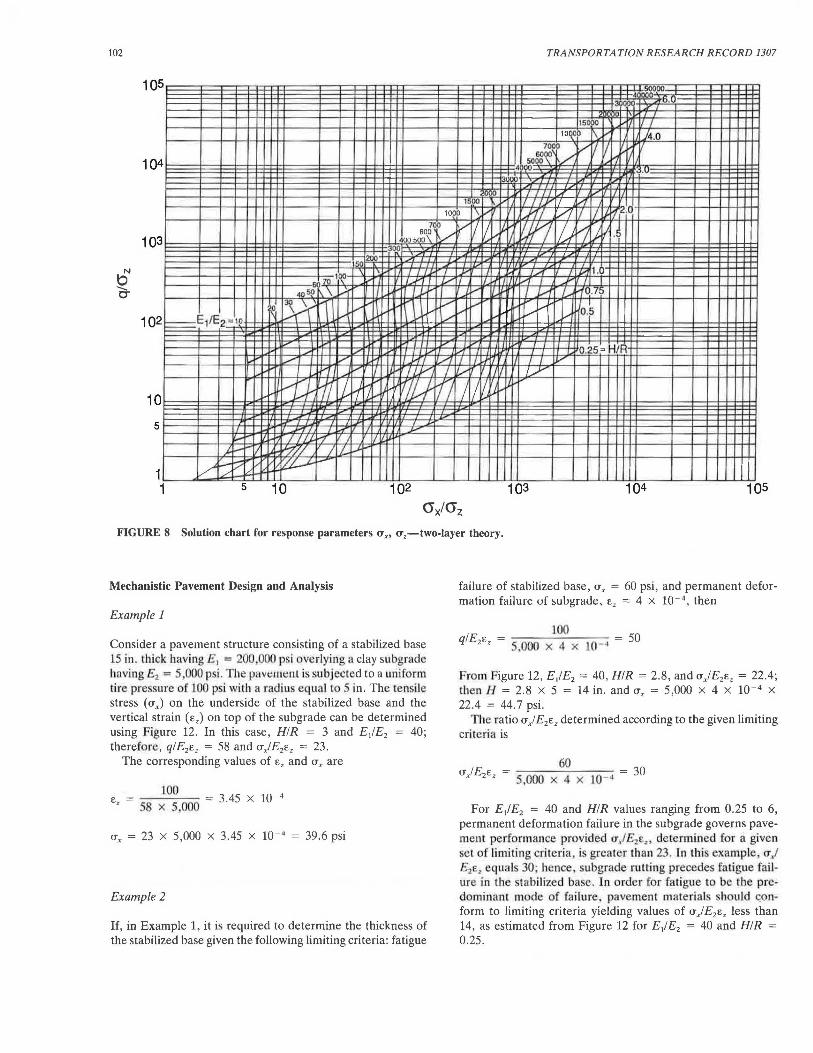
FIGURE 8 Solution chart for response parameters fJ'x, fJ',-two-layer theory.
Mechanistic Pavement Design and Analysis
Example 1
Consider a pavement structure consisting of a stabilized base 15 in. thick having E, = 200,000 psi verlying a clay subgrade hnving £2 = S 000 psi. The p11v1;1m:nl is subjected to a uniform tire pre sure o.f 1 0 psi with a radiu equal to 5 in. The tensile stress (ux) on the underside of the stabilized base and the vertical strain (e,) on top of the subgrade can be determined using Figure 12. In this case, HIR = 3 and E/E2 = 40; therefore, q/E2e, = 58 and u)E2e, = 23.
The corresponding values of e, and ux are
100 Ez = 58 X 5.QQO = 3.45 X lQ-
4
CTx = 23 X 5,000 X 3.45 X 10- 4 = 39.6 psi
Example 2
If, in Example 1, it is required to determine the thickness of the stabilized base given the following limiting criteria: fatigue
failure of stabilized base, ux = 60 psi, and permanent deformation failure of su!Jgrade, E, = 4 x 10- 4
, then
JOO q/EzEz = 5,000 X 4 X J0 -4 = SQ
rom Figure 12, E,IE2 = 40, H/R = 2.8, and u)E2e, = 22.4; then H = 2.8 x 5 = 14 in. and ux = 5,000 x 4 x 10- 4 x 22.4 = 44. 7 psi.
The ratio u) E2e, determined according to the given limiting criteria is
60 u)EzEz = 5,000 X 4 X 10- 4 = 30
For E/£2 = 40 and HIR values ranging from 0.25 to 6, permanent deformation failure in the subgrade governs pavement performance provided uJ E,,e. ,, determined for a given set of limiting ciiteria i. greater than 23. ln thi example er/ E2 E, equals 30· hence ·ubgrade rutting precede· fatigue failure in the stabilized base. In order for fatigue to be the predominant mode f fai lure. pavement material ho'Uld «Onform to limiting criteria yielding values of u)E2e, less than 14, as estimated from Figure 12 for E/E2 = 40 and H/R = 0.25.

Raad and Marhamo 103
105 -s.07.0000
- :IOOOO ,/ I I
v ....-,, 20000
4.0 ./' / v / /15000
/~ v- '/ / v v ./' /10000
3.0 / / ,,.. v / /~ooO 5000 104
- - / -,.,- - 3COO / I/ - _/ - ;"I./~ :iooli 2.0,, / I/ / / v -- v v --
/ / v v ./ / .... / -- -::;...- :,... v
/ 150!)
/1oho 1.5,u '.;) e::::
v ./ ~ ~ v ./' ./' / ......... ./ / / \ l/ v v /.1bo = E1tE2 / / / ,,.. c;609_ 103 3
1.0~: / ,, I/ ,/ / / ,..- -/' / 1.0
/ If ~ / / "' v - /' / '' N' /'1 I / x / I/ / _/'...._ / """'
_.,.. '/ v ..,£ 00 0.751. J'f.. I Y.,~ / r ..._/ / I -....£_ I// ,........ .c v J
.,,.... ,10 60 so
' ,_[' 0.5 ... I 102
:=HJA,..o.2s '\ I
u I
10 "~
5
1 0.0 0.05
..., f, ~ :-._ \" .... t--~
'--.,.
/ '/.,/ / /!'-... V/ / /' v / I/
'i / v ) / ,;:, / .,..._,
y / / - -/,. -.... / /,.. ,,..
'< ...-V:.,. '-""
'ti ;::;;;; 0.1
- J ~ :---(
'\"" ::-.. -, ,
/ ..... -...., ,, / /
,,,,... /' v >< v / / / I><
..... _/
- _.....- r-.... .-- ::::..--: ::;:::::: :::;:: ~ ~ ;:::::::: --:::
..___
0.15
-....t--
~ -l ~ ~ ~ "' ~ ~ "' -~ - ~ 20 - ""' - I 10
-~ - ' / " / -"'- v ---.. I / ,..._ -.....
v __,v ,,.... ..... -....... v / / /'"~ / / --- " J I?' ><v / ~ :> ~ v /' -b><:'.
/
v ,,.. ....... ,........, / ~ _,... ,.__ / / " /
- ~ -- .....- I>'
.....-.- ~- ~
r:;... i.--- i- -- ,.__ ---~ "' .--p !:::.-- -- -... ~ -
'--'" -, -~ 0.25 0.3 0.35 0.4
FIGURE 9 Solution chart for response parameters £,, <J,-two-layer theory.
Structural Capacity Considerations
The overriding consideration in many pavement design problems is the serviceability and performance of the pavement structure under long-term repeated loading conditions. Mechanistic design procedures aim at minimizing fatigue and permanent deformation in the pavement system . In many cases, the structural adequacy of the pavement to support static loads or slowly moving loads needs to be addressed. Of particular significance in this case is the bearing capacity of the pavement structure. The bearing capacity of two-layer pavements consisting of a stabilized base over subgrade have been investigated by a number of researchers (15 - 17). The mo. 1 comprehensive and complete work co date ha. been presented by Meyerhof (15), who used rigid-plastic analysis to determine the collapse load f concrete pavements . Meyerhof' work is applied here, together with results of dim n ionaJ analysis, to develop improved pr cedure of bearing capacity analysis.
The analysis assumes the following failure conditions:
1. Flexure failure initiation in the stabilized base, 2 . Bearing capacity failure of the fine-grained subgrade,
and 3. Ultimate collapse of the stabilized base.
Linear elastic analysis is used to address the first and second possible failure conditions. Flexure failure in the stabilized
base occurs when the tensile stress (a J on the underside of the base becomes equal to the flexure strength (Tr)· Subgrade failure occurs when the vertical stress ( cr,) becomes equal to 6C, where C is subgrade cohesion. This is consistent with bearing capacity estimates for saturated clays.
Flexure failure in the stabilized base and bearing capacity failure of the subgrade can be determined using the results of dimensional analysis presented previously. For example, chart solutions shown in Figure 8 can be used to determine the maximum and minimum ratios of cr)cr, for a given E,1£2
and HIR ranging from 0.25 to 6. The maximum and minimum ratios of a)a, are used to define the corresponding maximum and minimum values for the ratio of flexural strength of the stabi lized base (T1) to the cohesion of the subgrade ( ~ (i.e. O' = T1• O", = 6C). This ratio is denoted a (T11 )1, and it variation with E / £ 2 is shown in Figure L4. For a given £ / £ 2 , bearing capacity failure will initiate in the subgrade if the ratio TrlC of the fie ·ural strength of the stabilized layer to subgrade cohesion is greater than the maximum value of (T/ C),. On the other hand, flexural failure initiation will occur if Tr!C is maUer than the minimum value of (T/ C),. The ultimate surface pressure (q,,), associated either with bearing capacity failure of subgrade or with flexural failure of the base , is determined using the data in Figure 8. The variation of q., with E,1£2 is shown in Figures 15 and 16. Estimates could be made for both interior and edge loading of base failure (Figure 15) and subgrade failure (Figure 16) . Stresses

J50~ 301 o"gooi: r6.0
20 ID/ 7, 15000
1 .0 105
6000 - I 5000 7000 / I
dOOO I ..I' I ..13.0 30 )Q r II j/f I
2000 vd " t11 /J2.0 1500 ./
10 104
600 -700 ~ ,_, I 1.5 ,,. "
103
102
10 5
1 1
L1/E
5
-10 ,,.,.....
-.....
.......-l,....--""""
.......
-
10
3\ ,,, 150 r ,,,,,,..11
100 \ ... _,,." 60 0
50
3~ 2~
,,, ~ ~ .. ..... ... ·-'
v / ... ... Vi,; ........ v ""v
/ .. 11 ' .. ~
- _.,,., ~
l1 I ... ... J;' I
I.,,;' " I L --1"1 !1 I I
1/ ...... i 71) '» 'jJ I/
~-- L.-1
./ ,
102
FIGURE 10 Solution chart for response parameters crx, T-two-layer theory.
J/ J I I I f f/
/ ·-"1 I 1..-1 I I I l..-1'
,, ,,,,,..- .,..,.. 71.0 / I
" _,. i.... 0.75
0.5 - --I I
/} ,,,,. /, l-1 j)o.2~ = H/R ~flJ If; I I I ,.,.
,_ J -I
"' ~
'""
103 104 105

105
104
103
102
10
5
1 0. 1
HI
1. ,, >,
0.7 ),II I
l . ~
II / /
~ ~ 0.2 !I
l'<I< ) "
0.2
2.0
1.5
v I- >o I- .... _,,. ... I- ,,ic v
v I- ii ' ( < ..... !""-. /
I-
!/ / I- ,., v v"' ,,. _, '-' ,.,,, 1-"' ,,.,_1-"
....
..... --I< I-
.......
0.3
,_ 1- "' ,_i.- I-'-
........ .... i..- 1.-- i..- ~ : i.. ....... i.- '"" .....
..... i.- ..... ,_. !.--
,_ ....
'\ ' - '-c.. 1-- I-'
..... i.- ,_i-- i..- 1-- v I- ,, b< i.--"' (/
~ "" / J 1'- ..--""
I/
"" i-.ll' L/
v ,_. I-- " .... I-
"'> ""1 .... - ><: ... .... ... i..- '- i.--"' ,,. ..... ..... '"'
~~
..... ..... ..... ..... ,.. .... ..... ..... ..... 1-- i.--1--
.... -- _. .... - ..... I- _.
<c:: I- '"" ......... c-1--'""" i.-- c-1-- ..... ..... i.-- .....
~i ~~~
0.4
FIGURE 11 Solution chart for response parameters Ex, T-two-Iayer theory.
s' ., .... .,,; lr:; ~fl!XJ!J
i..L-- ~(.....[.... ..... l/f I I 1-- i..
4. '"" /fOfXJ!J
·- ..... ,_ I ODO
'" ,
!.-- i.. ,_ [... i.. /,o!lo I-
i..-1.- '-" 1-- 13CJ°1 .......... '"" _. !.-- ,_ i.-i.. ......... 1-- ..... 2000 ,, .
,_ 000 700 600
!.-- 1-- .... .... [,, 500
'"' 1.-- ..... , _ i.- .... ... t,-1-i,. 14 ii!
1 ............... I/ ~1-[.,il / 200
\ < I/ ~ /IS 100 1,
50 .. -:: ,,, ..l '\'...i .I~
!.--'°' 1-..._1:;;; -'1 ,, \ " l\L\ :-. 1
i..- 1-- t.-'"" bo t>-v / / ;/ ,, ,, .... 'I.
bi< ..... -- f\ "-L.! ' '
-..... "' ~,., .... I- :> I-
' ._.i.--'-" ,.., _. ~ ~~,, ~~l.1 y ~ki-.. :,L..-,_ ......... ..... ... ,,. /
0.6 0.7 0.8 0.9

105
104
103
102 _f.1L
10
5
1 1
,.2_ = 10
.......
.......
~ -5
1 71) 1"" :I'
Rnn '> v
300 4~~ rr / I,/ r 150
200
100 ~
so 50·1~ - ~ ,_ .....-
30 4,~ ~ _......- ,....- .......... ''"_...Y ,....v _.i-- v v ~ ........ ..........
/ --- ---_ ....
- - LA --...- ~I I I le---
I--' '-1 J ........r I u ,....., I
i--c::.-,1--" --j. ~ v _ .... J.!17 I I l- IJ.. ......
-I / ,__..,,.. / // --,
10 102
FIGURE 12 Solution chart for response parameters <r,, E,-two-layer theory.
50000
~oooc \ 6.0
~ ,,, I
I 14.0-.... I ,,, 70~ - l / ,,VJ
si~~ ..... ... ~
.o-4000 - I J ..-1
~ -".,,.,,, ,Q_ - -' ' I --"' I v I ...- /.../1 .5
..A' '/("/ I / 1 'ff
'vnl /j...... r rt' 1_ I 0.75 - - p.5
'--"'" l./' ..... i.-- ....- .... v,,... ......-
d .25= H/R y I I ,... I-- -
-I I__,..
.....
103 104

Raad and Marhamo
N w C\J
w ........ 0-
105
104
103 - - - .75
>---- - o.5~ >---- - I
H/R = 0.25 k 102
10
1 0.1
~·% v /
~
-...... I 1)1-
I I /
'" /
1.5 v ,/ ,,.,,-,,.
/ / . ./ ,/
v v > / / / <'
/ -~ - I
I I -/ .......... I /._ /
.......
/
,/ /
// / // / /
"'-<' / ........ v
'<
0.2
6.0
- ,, 4.0/ ~ -_,.
./ ,... _,. v / ,,
3.0/ ~ / v v:, v ./ ./
::::: r:= v ..... ,,..-" / v ~ / /
/ ./ v 1-'v / v ;...::::
2.0 ~ - ,,
..... ./ / ,, / ,r _,. / ~ / ,, l/ - ,, ,,v ,,.
v \ v [/ v I v_,. :,...- ,, ,,... ..... / /
,/ ..--J v ./
v / ~ v::: v / ,,V v
v K ~ /' ::,.> k: v v ,,- v v ,,-
~ I( :::::::'. / v / / v / / /
- /
f / , / ' / ~
/ / "' / ,,
~ ' / / ,... / - - I \'"'-. I \'-- ....... h.: r-- - -- '\ r-. .._\ \ N
~
~/ v ........ ....... 1 ~ ~ ~ !.)' I .......... ......... I'---. ,• I
/ - / - / / ~ " / - / '~ ~ /
/ _/'"- v / IK / 'X /
/ v "-. / Vv .... / ,, r-.... ,, / ,,,v ,,.v " -:;::... v_,... v / ~ / "' / v ~ -;::, ;><
~ v K v
/ ~ / K / P>< ,/ r--..... / k--" _, / v -
I'<' - -- -~ ......- --= --- ,
"- ->=- ~ ...
0.3
FIGURE 13 Solution chart for response parameters Ex, £,-two-layer theory.
107
J I E1 E /sqooo= ~/ 2 ·,,40000 0000
2000-0 "l rn 0
1dooo V I
7000 l/,6600
~~ 3000
,,2000 1500
I /1QOO
}00
~ / 300 200
'/ , 150 '
/ " 1007(> / I [""" / ;o
""' I K ,so 40 ..._
"""' \ ~ ~ ~
/30
~x.20 r---.... ""-- 10
- ' - --/ "" I/ .,.._ \ '\. / "' ' II NI
v ,,.,v ~ '/ .A I ~
l)< ~ v ~ ~ )< ~ ~ v /
.....- ~ _,. " -- ,_,, ' / I-
_ ..... ,__..
0.4

108 TRANSPORTATION RESEARCH RECORD 1307
SUBGAAOE FAILURE
102 103 104
FIGURE 14 Limiting values for T1/C associated with subgrade or base failure.
associated with edge loading are assumed to be 50 percent greater than those obtained for interior loading, as suggested by Mitchell et al. (8).
The ultimate collapse of the stabilized base follows flexural l:rack initiation on its underside or subgrade bearing capacity failure. The ultimate collapse load intensity (quc) is estimated using Meyerhof's approach (15). Meyerhof's equations could be rearranged and expressed as follows:
For interior loading,
quc 2/3 lf ( )
2
Tf = (1 - R/3L) R (3)
For edge loading,
(4)
where L , the stiffness radius, is given by
(5)
If failure initiation occurs in the stabilized base , the ultimate collapse load could be determined from Equation 3 or 4. In
thi ca e, it i. assumed that as cracking initiates n the unde rside of th ba e, both £ 1 and £ 2 will reduce and the ra tio E/ Ei will rema in e entially unchanged. Consequently. L will not change and q"" wi ll approach the s;ime: va l11e predicted in Equation 3 and 4.
lf, on the other hand fa ilure occurs first in the sub rade , then the subgrade modulus will decrease and approach zero and the corresponding value of RIL wi ll a lso approach zero. For these conditions, u rigid-plastic behavior of t l 1~ stabilized base will yield the following:
For interior loading,
(6)
For edge loading,
q UC = (~) (!!_) 2
T1 12'TT R (7)
The collapse load , determined using rigid-pla tic analysis , will correspo1 d Lo the ult imate structural capacity of the sy -tern . A comparison between lower b und solutio n fo r fa ilure initiation q .. and ultimate collapse load intensity quc for the case presented in Table 1 indicates that the ratio quJq .. varies between 1 and 3.

Cl c 'g .3 0 -~
c
t:" ::l
C"
102
) 10
1 10-1
5 )
10-2 0
L L ~
I;
" liv " v
~
~
2
L
1
~ ,I
~ II fiT
1ho
3 H/R
'-1/E
1101 , ,
20
50· 1g~ 20 500
4 5 6
FIGURE IS Surface load associated with flexure failure of base.
10
Ol c 15 Cll
.3 Q) Ol ~
~
t:" ::l
C"
10-1
5
10-2
Cl c
15 Cll 0
...J
.Q Qi £ ~
() ...._ ::l
C"
105
104
, 103
102
10 )
5
3 0
II
v v
~
I;
Ii
•"
~
Ii v v
/ v II ~
I;
~
2
10000
5oo' ' ,., 0
~ 11
~ ii° 104
100'
~· ii ~do 11J01 103 11
50
Cl c
I
'1~ 15 Cll 0
.... ~ ' 1 2 ...J Q) Cl
102 (i3
Q ::l
C"
10
5
2 3 4 5 6
H/R
FIGURE 16 Surface load associated with bearing capacity failure of subgrade.

110
SUMMARY AND CONCLUSIONS
Dimensional analysi wa applied to develop solutions for critical response parameters in two-layer pavements using linear elastic theory. Pavement re pon e parameters, such as stresses strain and deDections, were grouped into dimen-ionless variables. Solutions were pre en1ed in charts that
would allow ·imple determination of these parameters. The e solution could al o be used to predict the performance of two-layer sy ·te rns using available meehanistic models. Furthermore, these solutions could be impl mented to assess whether fatigue failure in th surface layer or permanent deformation failure in the subgrade dominates the performance of tbe pavement under long-term repeated load . Result of the analysis were al o applied in developing an improved method to predict rhe structural capacity of stabilized layer over fine-grained ubgrades under tatic or lowly moving loads .
The power of dimensional analysis in providing representative and simple engineering solutions for a wide range of pavement variables, including geometry, materials, and loading conditions, was illustrated. This capability is significant because of the need to develop meaningful interpretations of extensive experimental and analytical data as a result of ongoing pavement research programs.
REFERENCES
1. . F. Brown and J_ W. Pappin. Analy is or Pavements With Granular Ba ·i . In Tra11spon111io11 Research Record 810. TRB . National Research Council , Washington, 0 . . 1981. pp. 17-23.
2. L. Ru ad and J . L. Figueroa. Lond Response of Transportation upport Systems. Journal of the Trt111sportatio11 Engineering Di
vision. ASCE, Vol. 106, No. TEL 1980, pp. l ll- l28. 3. Shell Pavemem Design Mamwl-Asphalt Pavemem and Over
lays for Road Traffic. Shell Jnrcrna tional Petroleum Company Limited, London , Engla11J , 1978.
4. Thickness Design-Asphalt Design for Air Carrier Ait11orts. Manual Series 11. 3rd ed. , Asphah Institute, 'ollege Park, Md., 1987.
TRANSPORTATION RESEARCH RECORD 1307
5. R. L. Lytton . Backca/culation of Pr1ve111e1u Layer Properties. STP 1026. ASTM. Philadelphia , P1t., 1989. pp. 7- 3 .
6. L. H. trwin . User's Guide co MODCOMP2. orncll Local Roads Program Report 3-8. ornell University, Ithaca. . Y .. 1983.
7. J. P. Mahoney, N. F. Coetzee. and R. N. tub tad. A Performa11ce Compt1Tiso11 of Se/l!cuul 8ackcalc11latio11 omp111er Program . STP 1026. A TM. Pl:liladelphiu, Pa. , 1989 pp. 452- 417.
8. M. I. D·1ner and A. J. Devos. true/I/ml Analysis of Asphaltic Colt/ Mixt11res Used in Pavement Bases. Research Report 5054. Engineering Experiment tution, Univer ity of Illinois Urbana . Aug. 1977.
9. M. W. Witczak. De ign f Full Depth Asphalt Airfield Pavements. Proc., 3rd 1111ema1io11al Co11fcre11cc 011 tlte Slrucwm/ Dttsign of Asphalt Pavements London, England. 1972, pp. 550-567.
10. D. M. Burmister. The Theory of tresses and Displacements in Laye red Systems m1d Application to the De ign of Airp rt Run· ways. HRB Proc .• Vol. 23, 1943, pp. 126-144.
11 . H. M. We tergaard . New Formulas for Stresses in Concrete Pave-ment of Airfields. Transactions, A CE, Yul. ll , 194 pp. 425-439.
12. K. R. Peattie. Sire and Strain Factors for Three Layer Elastic Sy 1em . B11/leri11342. HRB. National Res arch Council. Wa hington , D .C .• 1962.
13. A. M. loannide and R. A. Salsilli-Murua. Temperatur urling in Rigid Pavements: An Application of Oimen ional naly i . In Tra11spOl'lfltio11 Re et1rc/1 Record 1227, TRB, NatioL1al Reea rch Council , Wa hington. D. • .. 1989. pp. 1- 11.
14. G. Ahlborn . ELSYM5. A Computer Program for the Analy i of Elastic Layerc<I Sy!items with Normal Loads. !TIE, University of California. Berkeley. 1972.
15. G. G. Meyerhof. Load arrying apnci ty of oncrerc Paven1cms. Jo11mfll of the oil Mechanic (Ill(/ Fo11J1datio11 Division, ASCE, Vol. 88, o. M3 , June J 962, pp. 89- 116.
16. L. Raad. Behavior of tabilizcd Layer Under Repeated L ad . lo Tra11sport11tio11 Rl!Search Record 1002, TRB , Na1ional Rccarch Council , Wa hington , D . ., 19 ·.pp. 72- 79.
17. L. K. Marhamo. Bearing apacity of Ceme111-Trea11:d Layers Over ofr. 1m1111d. M.E. lhc i . American ni ersity o.r Beirut.
. J. K. Mitchell , P. Dzwilcwski , and . L. Monismith. Behavior of Stabilizeti Soil Under Repemctl Lo11di11g: A Summary Repon wirlr S11gge 1e1J Structural Design Pro ed11re. Report 6. U.S. Army Engineer Waterway · Expcri ment · !ittion, Vicksburg, Miss., J unc 1974.
Publication of this paper sponsored by Committee on Flexible Pavement Design.