evaluation ofthe dacos 3.0 analyser - semantic scholarthe dacos 3.0 analyser (coulter electronics...
TRANSCRIPT

Journal of Automatic Chemistry, Vol. 12, No. 4 (July-August 1990), pp. 153-162
Evaluation of the Dacos 3.0 analyser
Joan Farr6 Pons, Alba Alumni, Felipe Antoja, CarmenBiosca, Marla-Jestis Alsina and Romin GalimanyServei d’Analisis Cliniques, Centre d’Assistncia Primria ’Dr. Robert’, Plafa dela Medicina, s/n 08915 Badalona, Barcelona, Spain
The selective multitest Coulter Dacos 3.0 analyser was evaluatedaccording to the guidelines ofthe Comisidn de Instrumentaci6n de laSociedad Espaola de Qulmica Clinica and of the EuropeanCommitteefor Clinical Laboratory Standards.
The evaluation was performed in four steps: examination of theanalytical units; evaluation of routine working; study ofinterferences; and assessment ofpracticability.The evaluation included a photometric study. The inaccuracy isacceptable for 340 nm and 420 nm, and the imprecision atabsorbancesfrom 0"05 to 2"00 rangedfrom 0"06 to 0"28% at 340nm andfrom 0"06 to 0"08% at 420 nm. The linearity showed somedispersion at low absorbancefor PNP at 420 nm and the drift wasnegligible.
The imprecision of the pipette delivery system, the temperaturecontrol system and the washing system were satisfactory.
In routine work conditions, seven analytical methods were studied:glucose, creatinine, iron, total protein, AST, ALP and calcium.Within-run imprecision ranged, at low concentrations, from 0"9%(CV) for glucose, to 7"6% (CV) for iron; at mediumconcentrations,from 0"7% (CV)for totalprotein to 5"2% (CV) tocreatinine; and at high concentrations, it rangedfrom 0"6% (CV)for glucose to 3"9% (CV) for ALP.Between-run imprecision at low concentrations rangedfrom 1.4%(CV) for glucose to 15.1% (CV) for iron; at mediumconcentrations it ranged from 1.2% (CV) for protein to 6"7%(CV) for iron; and at high concentrations the range isfrom l’2forAST to 5"7% (CV) for iron.
No contamination wasfound in the sample carry-over study. Somecontamination was found in the reagent carry-over study (totalprotein due to iron and calcium reagents). Relative inaccuracy isgood for all the constituents assayed. Only LDH (high and lowlevels) and urate (low level) showed weak and negative interferencecaused by turbidity, and y-GT (high level) and amylase, bilirubinand ALP (two levels) showed a negative interference caused byhaemolysis.
Introduction
The Dacos 3.0 analyser (Coulter Electronics Inc.) wasevaluated according to the guidelines of the EuropeanCommittee for Clinical Laboratory Standards (ECCLS)
Servei d’AnMisis Clniques, Hospital ’Germans Tras Pujol’,Carretera de Canyet, s/n 08916 Badalona, Barcelona, Spain.Non-standard abbreviations used in this paper are: CD, Coulter Dart;TCN, Technicon; B, Behring; AST, aspartate aminotransferase (EC2.5.1.2); ALP, alkaline phosphatase (EC 3.1.3.1); AMP, 2-amino-2-methyl-l-propanol buffer; PNP, p-nitrophenol; NADH, [3-nicotinamideadenine dinucleotide, reduced fo{m; NaOH, sodium hydroxide; TPTZ,tripiridyltriazine; c.l., confidence limits.
and the protocol of the Comisidn de Instrumentacidnde la Sociedad Espafiola de Qulmica (SEQC) [2].
The evaluation was performed in four steps: examinationof the analytical units, evaluation in routine operation,study of turbidity and haemolysis interferences, andassessment of practicability.
The evaluation of the analytical unit included a photo-metric study: inaccuracy, imprecision, drift and linearity,as well as the imprecision of the pipette delivery system,the carry-over of both the sample and reagent deliverysystems and the temperature control system.
Imprecision (within-run and between-run), carry-overand relative inaccuracy were studied in routine workingconditions. Seven analytical methods: creatinine, protein,aspartate aminotransferase, glucose, alkaline phos-phatase, iron (II + III) and calcium (II) were chosen inorder to test nearly all of the performance criteria of theinstrument. The relative inaccuracy was studied incomparison with the results obtained with the TechniconChem and Ultralab-Aurora analysers.
A study of interferences caused by haemolysis andturbidity was also made, according to the protocols of theComission Validation de techniques de la Soci& Fran-gaise de Biologie Clinique [3] and the InternationalUnion of Pure and Applied Chemistry [4].
The analyser’s practicability was also evaluated bychecking performance, analytical procedure control,maintenance and other aspects.
Materials and methods
Analytical units
Instruments
The Coulter DACOS 3.0 (Discrete Analyser with Con-tinuous Optical Scanning) is manufactured by CoulterElectronics, Inc. The instrument is designed for determi-nation ofenzymes, substrates and therapeutic drugs. Theroutine procedure can be interrupted by stat samples atany time, returning afterwards to the original sequence.
The individual reagents are pipetted directly into theplastic reaction cuvette, incubated and read by aphotometer with six fixed wavelengths and two optionalwavelengths.
The sample pipettor allows a smooth adjustment to anyvolume between 2-20 tl. Subsequently, pipetting of twodifferent reagents can be performed. The range of thereagent dispensing volume is 80-300 tl (reagent arm 1),
0142-0453/90 $3.00 (C) 1990 Taylor & Francis Ltd.153

J. Farr Pons et al. Evaluation of the Dacos 3.0 analyser
20-200 1 (reagent arm 2) and 20-200 tl (sample diluentdelivery system).
The instrument is microprocessor-controlled. It enablesthe operator to have an overview of mechanics, electron-ics and chemistries at any time.
Mettler AC 100 Precision Balance;Kontron-Uvikon 810 Spectrophotometer;Fluka E/J Digital Thermometer.
Reagents
PNP 709"5 gmol/1 (Sigma 104-8); NaOH (Merck 6498);fi’om a solution of 0"36 mmol/1 of PNP in NaOH (20mmol/1) different concentrations were obtained by dilu-tion; NADH disodium salt (Sigma N8129);Tris-(hydroxymethyl) methylamine (Merck 8382); allthe other solutions were prepared from mmol/1 solutionof NADH in Tris 80 mmol/1; Amido Black (CromatestP722).
For comparison studies"
Instrument: Coulter Dacos 3.0 analyser
Reagents
Glucose (CD 7546860) (hexokinase); creatinine (CD7546860) (Jaffd, without deproteinization); iron (BAU40T) (tripyridyltriazine); total protein (CD 7546781)(Biuret, Gordnall); AST (CD 7546051) (IFCC, modi-fied); ALP (CD 7546781) (AMP); calcium (CD 7546058)cresolphtaleine).
Technicon Chem (Tarrytown, New York)
Reagents
Glucose (TCN-T01-1460-53) (hexokinase); creatinine(TCN-T01-1456-53) (Jaffd without deproteinization);AST (TCN-T01-1631-53) (IFCC); total protein (TCN-T01-1480-53) (Biuret, Gordnall); calcium (TCN-T01-1614-53) (cresolphtaleine); ALP (TCN-T01-1457-53)(AMP).
Instrument
Ultrolab-Aurora (Ultrolab, Sweden).
Reagent
Iron (g AU407) (TPTZ). For interference studies thereagent was lntralipid 20% (896449) (Fides).
Evaluated parameters
The following parameters were studied during theevaluation of the instruments.
Photometric inaccuracy
Photometric inaccuracy was studied at 340 nm with asolution of disodium NADH (333 tmol/1) in Tris buffer(80 mmol/1), and at 420 nm with PNP solution (143"8tmol/1) in NaOH (20 mmol/1). Dilutions were preparedmanually. Up to three consecutive measurements weremade for each absorbance, using the same cuvette.
154
Inaccuracy was calculated from the obtained values andthe theoretical values calculated from the coefficient ofmolar absorptivity of NADH and PNP, and verified in areference spectrophotometer.
Photometric imprecision
From solutions prepared as previously, 30 successivemeasurements were obtained in the same cuvette, andfrom these, the mean, standard deviation and coefficientof variation, at both 340 and 420 nm, were calculated.
Photometric linearity
Using serial dilutions prepared as before, three successivedeterminations were made for each absorbance, always inthe same cuvette. Theoretical absorbances were calcu-lated as described in the accuracy study.
Photometric driftPhotometric stability was studied over the first 30 min atintervals of min, and over 8 h, at intervals of h, at 550nm, using a Black Amido solution of absorbance 0’590.
Delivery systems’ imprecision and reagent delivery systems’ relativeinaccuracy
This study was made according to the following combina-tions" (1) sample and sample diluent delivery systems; (2)sample, sample diluent and reagent delivery systems;(3) sample, sample diluent and reagent 2 deliverysystems; (4)sample, sample diluent, reagent andreagent 2 delivery systems. Different dispensing volumeswere evaluated using PNP and NaOH solutions, at 420nm. The coefficients of variation were calculated from 20determinations.
Carry-over
This study was made according to the Broughton [5] andBennet, modified [6], protocols, using PNP solutions at420 nm. The sample delivery system and the reagentdelivery systems were separately evaluated.
Thermostatic system study
This study was made by measuring the temperature ofthe reaction vessel containing destilled water using theprobe of a digital thermometer.
Warm-up time was studied making readings every 20 s,until three consecutive readings with a deviation of+0" C were obtained.
Working temperature stability" 30 readings were made at20 s intervals for 10 min, 45 min after power-on. Themean and coefficient of variation were calculated.
Room temperature influence: the protocol described forthe working temperature stability study was applied attwo different room temperatures (25"5 C and 31"9 C).
Temperature variation during the reaction’ 45 min afterpower-on, the reaction warm-up time to reach 37 C wasstudied using 123 tl of sample and diluent at 26"5 C and

J. Farr6 Pons et al. Evaluation of the Dacos 3.0 analyser
300 tl of reagent at 16C (distilled water was used assample, diluent and reagent). The temperature wasmeasured every 10 s, and this study was made intriplicate.
Washing station study
The effectiveness of the automatic washing ofthe reactionvessels was evaluated by reading the absorbances ofdistilled water before and after filling with a PNP solutionof 1’6 absorbance at 420 nm. This study was made in 30different reaction vessels.
Between-reaction vessel imprecision
The absorbances in 20 different reaction-vessels weremeasured, with blank correction, at 420 nm, filling eachreaction-vessel with 400 tl of a 0"48 absorbance PNPsolution. The mean and the coefficient of variation werecalculated.
In the routine working evaluation, the parametersstudied were:
Chem and Ultrolab-Aurora. The statistical evaluationwas done by a linear regression and correlation and non-parametric Passing-Bablok’s regression [7-9].
InlerferencesThe effects of in vitro haemolysis and turbidity wereevaluated on 16 constituents, according to the Commis-sion for validation of methods of the Socidtfi Franaise deBiologie Clinique and IUPAC protocols.
These potential interferents were studied by overloadinga human sera pool at different concentration levels of theanalytes checked, with haemoglobin (up to 200 tmol/1)and lipid (up to 6 mmol/1 oftriglyceride). The assay valuefor each specimen was calculated as a percentage of theoriginal (before overloading) concentration or activity.
Practicability
The practicability was evaluated in daily routine condi-tions of the authors’ laboratory (350 samples/day with amean of five tests/sample, without ISE module).
Imprecision
Within the same run, 20 samples of control sera weretested at three levels, in order to study the within-runimprecision. To evaluate between-run imprecision, afurther 20 samples were distributed in different runs.
Reagent-related carry-over
All eombinations of method sequences were checked inorder to study the reagent probe carry-over, using a poolofspecimens in a pre-determined sequence run over threedays. The carry-over effect measured was compared withtwice the within-run imprecision of the method inquestion ].
For example, the sequence employed to the glucosereagent (G) carry-over study was: GI-G2-G3-G4-G5-G6-IRON-G7-AST-G8-ALP-G9-CREATININE-G10-2PROTEIN-G11-CALCIUM-G12-G13-G14-G 15-G 16-G 17, and the carry-over caused by iron reagent wascalculated according to:
(G7 Gm) x 100/Gm
Gm= (G2 + G3 + G4+ G5 + G6 + G13+ G14 + G15 + G16 + G17)/10.
Sample-related carry-over
Following a permutation order, two control samples withdifferent concentrations were distributed along thesample disk. Three high specimens followed by three lowspecimens were processed and the carry-over was calcu-lated according to the Broughton and Bennet, modified,protocols.
The following aspects were considered: system perform-ance, environmental factors, maintenance, computercapabilities, operator’s training, disadvantages and poss-ible improvements, and failures of the system during theevaluation.
Results and discussion
Evaluation of the analytical modules
Photometric inaccuracy
The photometric inaccuracy for NADH solution at 340nm, expressed as percentage accuracy was -4"3% for2" 197 absorbance and 7"0% for 0’400 absorbance. ForPNP solution at 420 nm it was 6’9% for 2’ 137 absorbanceand 5’8% for 0"500 absorbance. The photometric inaccu-racy is acceptable for both 340 and 405 nm (see table 1).
Table 1. Photometric inaccuracy.
MeanTheoretical observed Inaccuracyabsorbance absorbance (%)
NADH (340 nm) 0"400 0’ 372 7"00"800 0’751 -5’81’200 1’ 137 -5’21"600 1"534 -4’11"997 1’923 -3"72"197 2’102 -4"3
PNP (420 nm) 0’500 0"529 5"81"000 1"069 6"91"500 1"617 7’82"000 2"137 6"9
Method.comparison with patients’ specimens
One hundred fresh human sera were analysed (indifferent analytical series) covering the entire analyticalrange for each of the seven analytes, with the CoulterDacos 3"0, and the comparison instrurnents Technicon
Photometric imprecision
The coefficients ofvariation were always less than 0’30%.They ranged from 0"06 to 0"28% at 340 nm and from 0"06to 0"08% at 420 nm (see table 2).
155

j. Farr Pons et al. Evaluation of the Dacos 3.0 analyser
Table 2. Photometric imprecision (N 30).
Mean CVabsorbance (%)
NADH (340 nm)
PNP (420 nm)
0.039 0.280.167 0.150.411 0.080.835 0.061.706 0.070.062 0.080.227 O.080.529 O.O81.069 0.062.137 0.07
Photometric linearity
The linearity obtained is acceptable for NADH at 340 nm(r 0"99,y -0"01 + 0"96x and for PNP at 420 nm (r0"99,y -0"05 + l’07x). The results are shown in table3. There is some deviation at low absorbances for PNP at420 nm.
Photometric driftFor the photometric stability test, Black Amido solutionwas read at 550 nm for 30 min, using a solution with amean absorbance of 0"590. The coefficient of variationobtained was 0"08%, and -0" 16% absorbance deviationin this period. With the same solution read over 8 h, thecoefficient of variation was 0"17%, and the absorbancedeviation was -0"50% in this period. For both periods,the photometric drift (short-term and long-term) wasnegligible.
Delivery systems’ imprecision
In both systems, sample and reagent delivery, theimprecision was less than 1"20% for all volumes andcombinations evaluated (see table 4).
Delivery systems’ relative inaccuracy
The delivery systems’ relative inaccuracy was acceptable(see table 5).
The carry-over found in the sample delivery system was0"005 (1" 72% ), and 0" 197 (2" 15% in the reagent deliverysystems, according to the Broughton and to the Bennet,inodified, protocols respectively (see table 6). Carry-overis negligible in both systems.
Temperature control
Testing each 20 s, warm-up time to attain 37C was 43min from the point at which the power was switched on
(the results are shown in figure at 5 min intervals).
Findings for attained temperature were as follows: maintemperature, 37"4C; coefficient of variation, 0.134%,when the room temperature was 25"5 C. Main tempera-ture, 38"1 C; coefficient of variation, 0"i37%, when theroom temperature was 31 "9 C. The working temperatureseems to be affected by a high room temperature.
156
The warm-up time to reach the working temperature inthe reaction vessel is 2 min (figure 2).
The temperature control system operates successfully asshown by the stability of the temperature, although thetime to attain a stable temperature from power-up is long.The warm-up time to reach the working temperature inthe reaction vessel is short.
Washing station study
The mean absorbance of 30 reaction vessels filled withdistilled water before and after their filling up with a PNPsolution was 0’10688 and 0"10784 respectively, with0"00096 of mean absorbance increment. The range ofindividual vessel increments was between -0.004 and0"003.
The automatic washing of the reaction vessels is satisfac-tory.
Between-reaction vessel imprecision
The coefficient of variation for a mean absorbance of0"477 was 1"48%. (The spectrophotometric imprecisionfor this absorbance was 0"075%.)
The between-reaction vessel reading imprecision is good.
Routine working evaluation
Imprecision
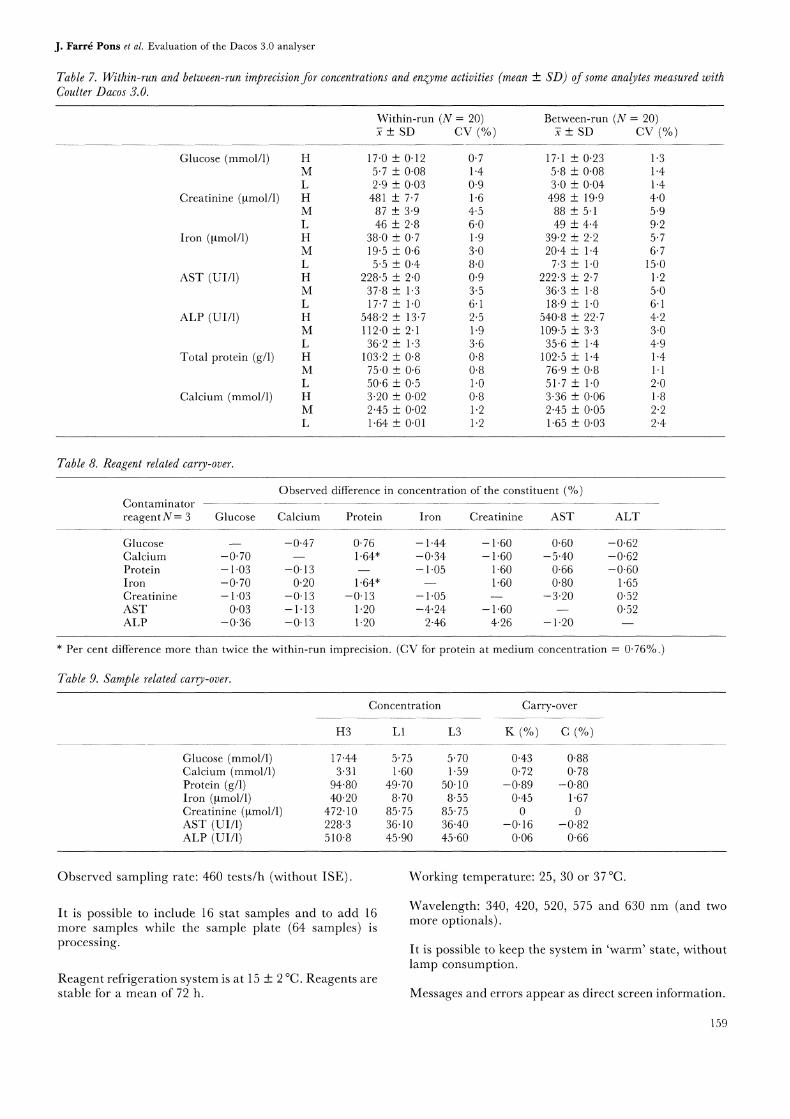
Table 7 summarizes the studies of within-run andbetween-run imprecision. Within-run imprecision isacceptable for all the assayed analytes. Between-runimprecision is acceptable for all the assayed analytes,except for iron at low concentration.
Reagent related carry-over
In the study of the reagent related carry-over, nocontamination was found, except a possible and smallinterference in the total protein by iron and calciumreagents. A more exhaustive study should be carried out
(see table 8).
Sample-related carry-over
The results are shown in table 9. The means of theobtained K and C values are lower than 2’0% for all theanalytes assayed. No significative contamination wasfound. The results are similar to those shown in table 6(sample delivery systems) using aqueous sample solu-tions.
Method c,mparison with patients’ specimens
The regression study for each of the analytes evaluated isshown in table 10. The results reflect good agreementwith the comparison instruments. The coefficients ofcorrelation (r) ranged from 0’897 (calcium) to 0’999(glucose). Proportional and constant systematic differ-ences (p <0"05) in glucose, AST and ALP and constantdifferences only for creatinine, were found in methodcomparison study according to Passing-Bablok re-gression.

j. Farr Pons et al. Evaluation of the Dacos 3.0 analyser
Table 3. Photometric linearity.
NADH (340 nm) PNP (420 nm)
Mean MeanTheoretical observed Difference observed Differenceabsorbance absorbance (%) absorbance (%)
0’050 0.044 12"0 0"062 24"00" 100 0’090 10.0 0" 119 19"00"200 0’189 -5"5 0"227 13"50’400 0"372 7"0 0"423 5"70"600 0"558 7.0 0"637 6"20"800 0’753 -5’8 0"853 6"61.000 0.940 -6.0 1"069 6"91"200 1"137 -5"2 1"288 7’31"400 1’332 -4’8 1"505 7"51’600 1.534 -4.1 1"726 7.91’800 1"726 -4.1 1’935 7"52"000 1"926 -3"7 2" 137 6’9
Table 4. Imprecision of delivery systems. N 20, 420 nm.
Sample delivery system Reagent delivery systems
Sample Diluent Reagent Reagent 2 Mean CV(1) (tl NaOH) (1) (tl) absorbance (%)
3 (PNP) 120 0.972 0.758 (pNP) 40 80 (NaOH) 1.205 0.813 (NaOH) 120 100 (PNP) 0.553 0.723 (NaOH) 120 200 (PNP) 0"758 1"053 (PNP) 120 100 (NaOH) 0.567 0"728 (PNP) 40 80 (NaOH) 200 (NaOH) 0.487 1"17
Table 5. Delivery system’s relative inaccuracy. N 20, 420 nm.
AbsorbanceSample Diluent Reagent Reagent 2 Inaccuracy(1 PNP) (tl NaOH) (1 NaOH) (tl NaOH) Observed Calculated (%)
3 120 100 0"567 0"530 (A) 6"898 40 80 200 0"487 0"470 (B) 3"50
Calculated absorbance according to the dilution factor due to reagent volume knowing the sample + diluent (A) and the sample +diluent + reagent (B) absorbances.
Table 6. Delivery system’s carry-over. PNP at 420 nm.
Sequence: H -H2 -H3 -L1 -L2 -L3. H, high; L, low, N 10
L1 L3Broughton: K (%) x 100
H3- L3
L1 L3Bennet: C (%) x 100
L3
Mean absorbances
H3 L1 L3
Carry-over
K(%) C(%)
Sample delivery systemReagent delivery system
1"680 0’00532 0"005231.290 0" 1111 0’ 1098
0’005 1’720"197 2"15
157

J. Farr6 Pons et al. Evaluation of the Dacos 3.0 analyser
Temperature (C)4O
WARM-UP TIME TO REACH 37 =C: 43 MINUTES
25
20
15
0 o o o 40 ,o eoTime (minutes)
Figure 1. Working temperature in reaction vessels. Warm-up time
from power-on.
InterferenceA significant interference was considered to haveoccurred when the results obtained on the adulteratedserum differed by at least three times the coefficient ofvariation (%) of the within-run imprecision for the leveltested [4].
The interference study was made on AST, ALT, ALP,LDH, amylase, y-GT, creatinine, urea, calcium, glucose,cholesterol, triglyceride, protein, phosphate, urate andtotal bilirubin at two concentration levels.
Haemoglobin interference study
At the maximum haemoglobin concentration of 200mol/1 tested, a negative interference was observed inamylase at low concentration level 58 U/1 (-34.0%) andhigh concentration level 533 U/1 (-4" 1%), total bilirubinat low concentration level 10"3 tmol/1 (-33"0%) andhigh concentration level 39"3 mol/1 (-30"4%), ALP atlow concentration level 75 U/1 (-33"0%) and at highconcentration level 582 U/1 (-8.4%) and y-GT at highconcentration level 182 U/1 (-5"5%) (see figure 3). Nointerference was noted for all the other analytes exam-ined.
Temperature ( C)
WARM-UP TIME TO REACH 37 =C: 2 MINUTES
SAMPLE + DILUENT 123 pl (26.5 C)REAGENT: 300 pl (16 C)
0 2 4 6 8 10 12 14 1616
Time (minutes)Figure 2. Working temperature in reaction vessels. Variationduring the reaction.
Turbidity interference study
At the maximum triglyceride concentration (6 mmol/1), a
negative interference was observed with urate at 244mol/1 (-4"8%), and with LDH at low concentrationlevel 150 U/1 (-6"6%) and high concentration level 382U/1 (-4" 1%) (figure 4). No interference was noted for allthe others analytes examined.
PracticabilityEnvironmentalfactorsThe Dacos 3"0 requires adequate environmental control:16-32 C for room temperature with a variation less than6C, 30-80% humidity without condensation, and 10times/h air recycling.
It requires protection against bright light because ofinterference with the photometric system.
Water supply: maximum needed 40 1/h. NCCLS water
requirement type II. Resistance 2Mff2/cm at 25C.Waste drain connection should be able to eliminate 551/h.
The system produces some noise due to delivery systems,washing station, compressor and printer.
System performanceOpen system: different methods and reagents can beused. ISE and therapeutic drug monitoring are optional(not evaluated). Primary sample tube identification maybe by bar-coding.
158
J. Farr6 Pons et al. Evaluation of the Dacos 3.0 analyser
Table 7. Within-run and between-run imprecision for concentrations and enzyme activities (mean + SD) ofsome analytes measured withCoulter Dacos 3.0.
Within-run (N 20) Between-run (N 20)+ SD CV (%) + SD CV (%)
Glucose (mmol/1) H 17"0 + 0" 12 0"7 17" + 0"23 1"3M 5"7 + 0"08 1"4 5’8 + 0’08 1"4L 2"9 + 0"03 0"9 3’0 + 0"04 1"4
Creatinine (btmol/1) H 481 + 7"7 1"6 498 + 19"9 4"0M 87 + 3"9 4"5 88 + 5"1 5"9L 46 + 2"8 6"0 49 + 4"4 9"2
Iron (btmol/1) H 38’0 + 0"7 1"9 39"2 + 2"2 5"7M 19’5 + 0"6 3"0 20"4 + 1"4 6"7L 5"5 + 0"4 8’0 7’3 + 1"0 15"0
AST (UI/1) H 228"5 + 2"0 0"9 222"3 + 2"7 1"2M 37"8 + 1’3 3"5 36"3 + 1’8 5"0L 17"7 + 1.0 6’1 18"9 + 1"0 6"1
ALP (UI/1) H 548"2 + 13"7 2’5 540"8 + 22"7 4’2M 112"0 + 2"1 1"9 109’5 + 3’3 3"0L 36"2 + 1"3 3"6 35’6 + 1"4 4"9
Total protein (g/l) H 103’2 + 0"8 0"8 102"5 + 1"4 1"4M 75"0 + 0"6 0’8 76"9 + 0"8 1"1L 50"6 + 0"5 1"0 51"7 + 1"0 2"0
Calcium (mmol/1) H 3"20 + 0"02 0"8 3"36 + 0"06 1"8M 2’45 + 0"02 1"2 2"45 + 0"05 2’2L 1.64 + 0"01 1"2 1"65 + 0"03 2"4
Table 8. Reagent related carry-over.
Observed difference in concentration of the constituent (%)ContaminatorreagentN 3 Glucose Calcium Protein Iron Creatinine AST ALT
Glucose -0"47 0"76 1"44 1"60 0"60 -0"62Calcium -0"70 1"64" -0’34 1"60 -5’40 -0"62Protein 1"03 -0" 13 1"05 1"60 0"66 -0"60Iron -0" 70 0" 20 "64" "60 0’80 "65Creatinine -1"03 -0"13 -0"13 -1"05 -3"20 0"52AST 0"03 1" 13 1"20 -4’24 1"60 0"52ALP -0"36 -0"13 1"20 2"46 4"26 -1’20
* Per cent difference more than twice the within-run imprecision. (CV for protein at medium concentration 0"76%.)
Table 9. Sample related carry-over.
Concentration Carry-over
H3 L1 L3 K (%) C (%)
Glucose (mmol/1)Calcium (mmol/1)Protein (g/l)Iron (btmol/1)Creatinine (btmol/1)AST (UI/1)ALP (UI/1)
17"44 5"75 5’70 0’43 0"883"31 1"60 1’59 0"72 0"78
94’80 49" 70 50’ 10 -0"89 -0"8040"20 8"70 8"55 0"45 1"67
472"10 85"75 85"75 0 0228"3 36"10 36"40 -0"16 -0’82510"8 45"90 45"60 0"06 0"66
Observed sampling rate: 460 tests/h (without ISE).
It is possible to include 16 stat samples and to add 16more samples while the sample plate (64 samples) isprocessing.
Reagent refrigeration system is at 15 + 2 C. Reagents arestable for a mean of 72 h.
Working temperature: 25, 30 or 37 C.
Wavelength" 340, 420, 520, 575 and 630 nm (and twomore optionals).
It is possible to keep the system in ’warm’ state, withoutlamp consumption.
Messages and errors appear as direct screen information.
159

J. Farr Pons et al. Evaluation of the Dacos 3.0 analyser
Table 10. Relative inaccuracy. Results comparison of 100 human sera in (y) Coulter Dacos 3.0 versus (x) other analysers: (1) TechniconChem 1 and (2) Ultrolab Aurora.
Range
Coefficient ofcorrelation
()
Passing-Bablok’s regression
b (c.1.95%) a (c.1. 95%)
Glucose (mmol/1) (1) 2"8-23"5 0"999Calcium (retool/l) (1) 1"67-4’68 0’897Protein (g/l) (1) 41"0-87"4 0"964Iron (bmol/1) (2) 2"68-27"7 0’913Creatinine (btmol/1) (1) 30-743 0"997AST (UI/1) (1) 8-3440 0.998ALP (UI/1) (1) 43-764 0.998
1.02 (1.01, 1.04)*1.08 (1.00, 1.18)1.05 (0.99, 1.11)0.97 (0.89, 1.05)0.98 (0.93, 1.00)0.91 (0.88, 0.94)*0"90 (0"89, 0’92)*
0.21 (0.06, 0.28)*-0.08 (-0.28, 0.10)-0"40 (-3’97, 2"63)2’88 (-2"92, 8"89)5.68 (2.85, 10.41)*
-2.33 (-3.39,-1.41)*-2’36 (-3"61, -1’00)*
y a + b x; * differences (p <0.05), constant (a), proportional (b).
Variation ()0
Variation ()
-400 50 100 150
Haemoglobin mol/I200
g-GT(H) -+-- T.BIL.(L)+ T-BIL.(H)--E- AMY.(L)
--->4- AMY.(H) + ALP(L) + ALP(H) L= low H= high
Figure 3. Haemolysis interference.
Calibration
Optional and selective. Optional inclusion of controls. 16Positions/plate capacity for calibrators or controls. Mini-mal frequency: weekly, and on new reagent lot.
Fixed volumes per test:
Sample: 2-20
Sample diluent: 20-200 btl.Reagent: 80-300 btl.Sample well capacity: 400 bd.
0 2 3 4 5 6
Triglyceride mmol/I
LDH (low) --F- LDH (high)
Figure 4. Turbidity interference.
+ URATE (low)
Calibrators and controls well capacity: 800 btl.Residual volume: 50 1.Reaction vessel: 120-450 bd.
Operational times
Calibration and baselines: 11 min.
Switch on to ’ready’ state: 15 min.
Switch on to first sample aspiration: 19 min.
’Off’ state to ’warm’ or ’ready’ state: 10 min.
(The different states are displayed in .the screen of theanalyser. The instrument takes 43 min to reach workingtemperature in the reaction vessels.)
160
j. Farr Pons et al. Evaluation of the Dacos 3.0 analyser
Reagents’ preparation: 10 min.
Sample plate full programming (without reading manualbar-coded): 15 min.
Filling of samples and calibrators (without primarysample tube): 10 min.
Working list editing: 2 min.
Reaction process: 12 min 40 s for single reagent tests, and9 min 52 s for two reagent tests.
Computer capabilities
Customized-order entry.
Fully flexible report format.
Search-and-sort data capabilities.
Includes the ability to store 3000 patient reports.
Real-time quality control, accumulates up to 61 workingdays. Levey-Jennings graphics.
Can be connected with other devices, to order entry,reception and editing results (not evaluated).
Two-way host computer interface (RS 232-C connection)(not evaluated).
Alarm systems
Information about system operation.
Information about control, calibration and patientresults.
Efficacy of alarm systems has been checked and theresults were satisfactory.
Maintenance
Daily: automatic washing (5 min).
Weekly: Cleaning of analyser and disk drive air filters.Sample plate cleaning.
Monthly: Control unit air filter cleaning. Washing stationcleaning. Thermostatic system bath water change. Dilu-ent container cleaning. Changing reaction vessels.
Every 15 000 cycles: Sample syringe change. Diluentsyringe change. Diluent container cleaning.
Every 30 000 cycles: Reagent syringes change.
Personnel
Direct personnel: one technician for the analytical work.
Indirect personnel: one technician for sample preparation(if a primary blood sample tube is not available). Onesecretary (if on-line connection to the main computer isnot available).
Operator’s training
Routine operator: five days.
For complete knowledge of the system: 15 days.
Operator’s manuals
Three volumes with exhaustive description of the system,including two different alarm codes indicating suggestedsolutions to any problems.
System failures during the evaluation
During the four months’ evaluation:
Short-term
Fault in the lighting of the spectrophotometer lamp (thisresolved itself).
Falling absorbance readings with the 420 nm filter (thiswas solved by changing the corresponding electroniccircuit).
(These incidents were attributed to the transport of theequipment.)
Medium-term
Increasing aleatory error in the techniques using a highsample volume (solved by fixing the position of thesample pipette more accurately).
Isolated errors in pipette arm 2 when measuring thereagent volume (solved by priming).
Disadvantages and possible improvements
Where the water quality is poor, the life of the deionizingcolumns can be short, due to the high consumption ofdeionized water by the analyser.
Environmental control is necessary. The analyser gener-ates enough heat to increase the room temperature.
It would be helpful to incorporate the patients’ dailymeans and the Westgard algorithms in the quality-control program.
It would be useful to be able to detect errors in the samplepipette position when delivering into the reaction vessel.
A facility for automatic starting should be made avail-able.
The warm-up time to reach the working temperature inthe reaction vessel should be shorter.
References
1. EUROPEAN COMMITTEE FOR CLINICAL LABORATORY STAN-DARDS. Guidelines for the evaluation ofanalysers in ClinicalChemistry, ECCLS Document, Vol. 3, No. 2 (June 1986).
2. COMISSIdN DE INSTRuMENTACIdN DEL COMITt CIENTfFICO DE
LA SOCIEDAD ESPAIIOLA DE QUfMICA CLfNICA. Protocolo deEvaluaci6n de analizadores automiticos: evaluaci6n de
161
J. Farr Pons et al. Evaluation of the Dacos 3.0 analyser
los m6dulos analfticos, Doc. E, ver. 3; Bol. Inf. SEQC(1986), no. 34, 3.
3. SocIITI FRANAISE DE BIOLOGIE CLINIQUE. ComissionValidation de techniques’, Protocole de validation detechniques. Document B, stade 3. Annales de biologie clinique,44 (1986), 716.
4. INTERNATIONAL UNION OF PURE AND APPLIED CHEMISTRY,Pure and Applied Chemistry, 61 (1989), 91.
5. BROUGHTON, P.,Journal ofAutomatic Chemistry, 6 (1984), 94.
6. BENNET, A., GASTELMANN, D., MASON, J. I., and OWEN,J. A., Clinica Chimica Acta, 29 (1970), 161.
7. PASSING, H. and BABLOK, W.,Journal of Clinical Chemistry andClinical Biochemistry, 21 (1983), 709.
8. PASSING, H. and BABLOK, W.,Journal of Clinical Chemistry andClinical Biochemistry, 22 (1984), 431.
9. BABLOK, W., PASSING, H., BENDER, R., and SCHNEIDER, B,,Journal of Clinical Chemistry and Clinical Biochemistry, 26(1988), 783.
162