event impacts - college of agriculture & natural resources
TRANSCRIPT
Quantifying the Economic Impact
of Community Events
Steven R. Miller: Director Center for Economic Analysis
Presented at: MSU Extension Conference 2007
October 9-11, 2007 Michigan State University Kellogg Center
East Lansing, MI


Table of Contents Quantifying the Economic Impact ...................................................................................... 1 of Community Events ......................................................................................................... 1 Table of Contents................................................................................................................ 2
Economic Impacts........................................................................................................... 1 Estimating the Direct Impacts of a Community Event ................................................... 4
Facilities Preparation .................................................................................................. 4 Estimating Patron Spending Impacts .......................................................................... 5
Estimating the Number of Attendees...................................................................... 5 Estimating the Direct Impact of Attendee Spending with Visitor Surveys ............ 7
Surveys................................................................................................................ 9 Mail Surveys ..................................................................................................... 11 On-Site Self-Administered Surveys.................................................................. 12 On-Site Interviews ............................................................................................ 13 Optional On-Site or Mail-In Survey ................................................................. 13 Two-Part Surveys.............................................................................................. 14 Telephone Interviews........................................................................................ 15
Estimating Vendor Spending Impacts ...................................................................... 16 Writing Survey Questions......................................................................................... 17 Administering the Survey ......................................................................................... 19
On-Site Surveys and Collecting On-Site Contact Information for Mail and Phone Surveys.................................................................................................................. 20 Mail and Phone Surveys ....................................................................................... 21
Michigan Tourism Spending and Economic Impact Model ......................................... 21 Closing .......................................................................................................................... 23 References..................................................................................................................... 24 Appendices.....................................................................................................................25

1
The purpose of this bulletin is to discuss cost effective ways to estimating the economic impacts of community events that draw attendance from regions outside of the host community. There are many options for estimating economic impacts of events, ranging from simplistic methods based on expert judgment, to stringent use of surveys and impact assessment models. This bulletin discusses a range of options and borrows heavily from the work of Daniel J. Stynes (1999). This bulletin differs from Daniel J. Stynes’ bulletins which discusse estimation methods of tourism activity, by focusing on estimating individual events rather than assessing impacts of all tourist activities. This bulletin defines an event as any event that takes place within discrete intervals as opposed to a constantly occurring attraction such as a museum. However, the definition of an event should be flexible enough to accommodate limited time exhibits or special events at existing venues such as a traveling exhibit hosted at a local museum or library. Recurring events such as weekend open markets and continuous attractions will generally require a different process of evaluation for estimating their economic impacts. Such impacts are generally categorized as tourism impacts (see for example; Stynes 1999). Organizations of all types have faced increasing pressure to be accountable for their programs with respect to their impact on economic development. Hosts of events such as conferences, festivals, and other special events are often requested to provide an economic impact assessment of their events on the local community in return for community support. Such evaluations are becoming more commonplace today (Woods and Barta 2002) and have been applied to state fairs, arts shows, entertainment events, livestock shows, and sporting events, to name a few. The following bulletin describes the methodology for estimating the local economic impact of tourist events. The presentation is delineated by first:
• Defining the concept of economic impact • Describing methodologies for measuring economic impacts.
This bulletin emphasizes the methods toward estimating direct effects and summarizes the method of transforming visitor spending into community-wide economic impacts. Much of the latter is covered in Daniel J. Stynes’ bulletins on conducting tourist impact studies. The bulletin first describes what is meant by an economic impact. This is followed by a detailed introduction to methods of obtaining direct impacts of visitor spending including a discussion of surveying event attendees. It concludes with a brief discussion of how those direct impacts are used to form overall community impacts.
Economic Impacts Economic impact studies provide a dollar-value assessment of an event, attraction, business or industry. Such dollar-valued impacts are derived from three separate components. The direct impact measures the direct or actual revenues generated by the activity including the local spending by participants throughout the community. It is

2
important to note where the revenues come from as well as where the revenues are expected to go. Directing consideration to only revenues generated by event patrons or spectators, only those patron purchases from visitors outside of the community should be considered as producing a direct effect. For simplicity, we will denote those visitors from outside the local community as tourists generated by the event. These tourist-related purchases represent an influx of wealth to the community, while revenues generated from local residents represent a recirculation of existing wealth within the community. Hence purchases of tickets, restaurant meals, groceries and souvenirs, for example, should be delineated between purchases by tourist and purchases by local residents. Local residents who spend money outside of their home community produce a leakage by transferring wealth away from the community. Therefore events that entice local residents to remain in the community also contribute to the community’s economy. Turning to events that draw in tourist exhibitors, the analyst should take similar note from where these vendors arrive. Outside vendors will make local purchases of goods and services during their stay. These local purchases of tourist-vendors represent wealth transfers from outside the region to the local community. Vendor revenues should also be considered. Revenues earned by vendors who live outside of the community are likely to leave the region, having little impact on the local economy. Alternatively, sales by vendors residing within the community are likely to produce a measurable impact on the local economy. These direct revenues, representing net wealth inflows, will drive a second impact known as the indirect impact. The indirect impact represents additional input purchases made by local businesses (not necessarily involved in the event) as a result of the direct impact. To exemplify, tourist participants purchase meals in local restaurants that in turn prompt local restaurant owners to purchase more inputs from suppliers and hire more workers. A proportion of the revenues will go toward the purchase of inputs supplied by local businesses. These local businesses similarly re-spend a proportion of their revenues within the community. This process continues until the amount re-spent diminishes. The final impact is the induced impact, which is created when local business owners, suppliers, and employees spend the additional income that they earned as a result of the direct and induced impacts. Similar to the indirect impact, only a portion of their income will be re-spent in the local economy. Recipients of this income will, in turn, re-spend a portion of it locally until the total amount re-spent diminishes. The indirect and induced impacts replicate throughout the local economy, creating a multiplicative effect. Hence, the total local impact is a multiple of the direct effect. This multiple impact always takes a value greater than one and represents the sum of the direct, indirect, and induced impacts or,

3
⎟⎟⎠
⎞⎜⎜⎝
⎛+⎟⎟
⎠
⎞⎜⎜⎝
⎛+⎟⎟⎠
⎞⎜⎜⎝
⎛=⎟⎟
⎠
⎞⎜⎜⎝
⎛ImpactInduced
ImpactIndirect
ImpactDirect
ImpactTotal
.
In practice, the total impact is calculated as a multiple of the direct effect as,
( ) ⎟⎟⎠
⎞⎜⎜⎝
⎛×=⎟⎟
⎠
⎞⎜⎜⎝
⎛ImpactDirect
multiplierImpactTotal
.
Multipliers are generally provided through expert judgment, a third-party provider, or a model for impact assessment like IMPLAN Pro or the Michigan Tourism Economic Impact Calculator (MITEIM)1. The economic structures that give rise to the multiplier are complex and generally require specialized computer software for estimates. The remainder of this bulletin describes the process of collecting estimates of the direct effects necessary for an estimate of the total economic impact of community events. Large communities with diverse economies are likely to have larger multipliers than smaller communities because a larger proportion of indirect and induced expenditures will be spent locally the larger the local economy. Expenditures outside of the community are termed leakages, because they result in wealth transfers outside of the community. Each industry within any given region is likely to produce different multipliers depending on the availability of inputs for that industry within the community. IMPLAN Pro is a common source of such multipliers. The IMPLAN Pro system provides multiplier estimates at the county level of aggregation for up to 509 industries (Appendix A) through a series of equations relating local economic spending to total regional production. Such estimates provide best approximations to actual impact multipliers using actual and estimated local information. One benefit of the IMPLAN Pro system is that it provides estimates of total regional sales, employment and earnings attributed to the event from single input values2. A second option that provides similar impact multipliers is provided by the United States Department of Commerce RIMS II regional multipliers3. The RIMS II system allows the analyst to combine sales into employment terms and earnings terms. Thus allows the calculation of total sales, earnings and employment impacts. Thirdly, the Michigan Tourism Spending and Economic Impact Model provided by Daniel J. Stynes of Michigan State University, is based on the IMPLAN Pro multipliers. The MITEIM expands on the IMPLAN model by formulating impacts specific to tourism
1 For information on the Michigan Tourism Economic Impact Calculator go to the following web link; http://www.msu.edu/course/prr/840/econimpact/michigan/ecimpest.html. 2 The Center for Economic Analysis can provide event impacts through the IMPLAN Pro system. 3 The US Department of Commerce’s RIMS II multipliers can be purchased at the county level at the Bureau of Economic Analysis website http://bea.gov/regional/index.htm.
4
behavior. It also adds a tax impact assessment that better represents Michigan tax revenues than the IMPLAN Pro system.
Estimating the Direct Impacts of a Community Event Accurate estimates of the direct impacts of an event are pivotal to providing an accurate estimate of the total impact of that event. An event evaluation may produce more than one direct impact. There is the direct impact of the facilities preparation, the direct impact of patron spending and the direct impact of vendors and exhibitors. A complete impact assessment will account for all direct impacts. However, it may not be advisable to pursue all sources of direct impacts. Many event impact studies focus on patron spending while overlooking vendor impacts and facilities preparation impacts. Depending on the event, patron spending may be the only viable economic impact. Omitting any positive direct impact will ultimately lead to conservative impacts. However, the cost of collecting data necessary to estimate all impacts may outweigh the expected benefit of greater completeness. This issue must be addressed by evaluators before designing the impact evaluation.
Facilities Preparation Direct impact of facilities preparation represents the additional activity necessary to prepare the site for the event. If the event in question is a rodeo, for example, there will be set-up costs incurred by the facilities owner including supplying wood shavings for livestock bedding, hauling dirt to cover the arena floor, fencing, and other expenses. Many of these requisite products and services will be purchased from local vendors. The direct impact of facilities preparation may be the easiest impact to measure. Generally, the facilities owner or manager will be able to provide receipts of the necessary expenditures for event preparation. If details of expenditures are available, this detail will provide greater accuracy of the total impact. Since industries within a given community will have different multipliers, expenditures can be allocated to their respective industry if sufficient detail is provided. Greater expenditure detail allows greater multiplier accuracy. Next the analysis must take into consideration that not all of the purchases of facility preparation will be made from local providers. Only purchases of locally provided preparation material and services should be used in forming the direct impact of site preparation. Generally the location of vendors can be ascertained from receipts. For example, tent equipment and setup may be purchased from a vendor in a surrounding community, while tables and folding chairs may be provided locally. Expenditures for the tables and folding chairs should be accounted for as part of the direct impact of site preparation. Since payment for tent rental and setup went to an out-of-community vendor, this component of the setup expense will not contribute to the community’s economy. In the rare event that it is not possible to discern locally provided goods and services from those provided from outside vendors, use expert judgment. Evaluators should be mindful of non-priced donations and in-kind transactions. Many groups volunteer time, effort and material toward community events that are often

5
overlooked in calculating economic impacts. Furthermore, sponsors may contribute to the event by supplying products and services at a reduced price or for free. Evaluators should be mindful of these potential impacts. Volunteer hours should be assessed against estimates of the dollar value of volunteer work. In-kind transactions should be valued at the selling-price and subject to the same adjustments described below that include adjustment for local capture rates and exclusion of transactions outside of the local community.
Estimating Patron Spending Impacts Patron expenditures require greater involvement on behalf of evaluators. The economic impact of tourist patron spending is generally calculated on a per-visit, or per-party visit basis as,
( )MultiplierVisitper
spendingAverageVisitsof
NumberspendingpatronofimpactEconomic
×⎟⎟⎠
⎞⎜⎜⎝
⎛×⎟⎟⎠
⎞⎜⎜⎝
⎛=⎟⎟
⎠
⎞⎜⎜⎝
⎛
This suggests three measurements necessary for forming an economic impact evaluation of visitors (Stynes 1999):
1. Estimate the number of tourist patron/parties attending the event 2. Estimate the average expenditures of tourist patrons/parties 3. Estimate the multiplier that reflects the secondary impacts of patron expenditures.
The next section focuses on estimating the total number of patrons/parties, while the subsequent section discusses estimating spending. Much of the discussion on applying correct multipliers to spending profiles will be directed to other sources. However, a section is introduced toward the end to discuss the options for estimating the multiplier.
Estimating the Number of Attendees There exist a number of methods to estimating the total number of attendees at events. Unfortunately, not all the methods work for every situation. Gated events, where the event takes place in a venue with controlled access, allows attendance counts at the point of entry. Patrons can be counted at the point of entry or by ticket sales where the event requires admission. Unfortunately, many community events are open to the public and take place in venues such as public parks or downtown areas where no such controlled access points are possible. Indirect methods to gain attendance counts are required for such events. The challenge of quantifying the number of visitors is expounded when the event is a multi-venue event as apposed to a single-venue event. Single-venue events isolate all activities in a single site or an area that is contiguous. Such sites include the county fairgrounds or parks that have specified locations for activities. Multi-venue events spread activities over non-contiguous areas. A music festival with both indoor and outdoor stages located throughout the event region is an example of a multi-venue event. Attendance estimates of multi-venue events are considerably more complex and may required concerted efforts of many surveyors. While multiple methods are available to estimate attendance counts, this bulletin focuses on a single approach augmented by other options. The proposed approach is to break the
6
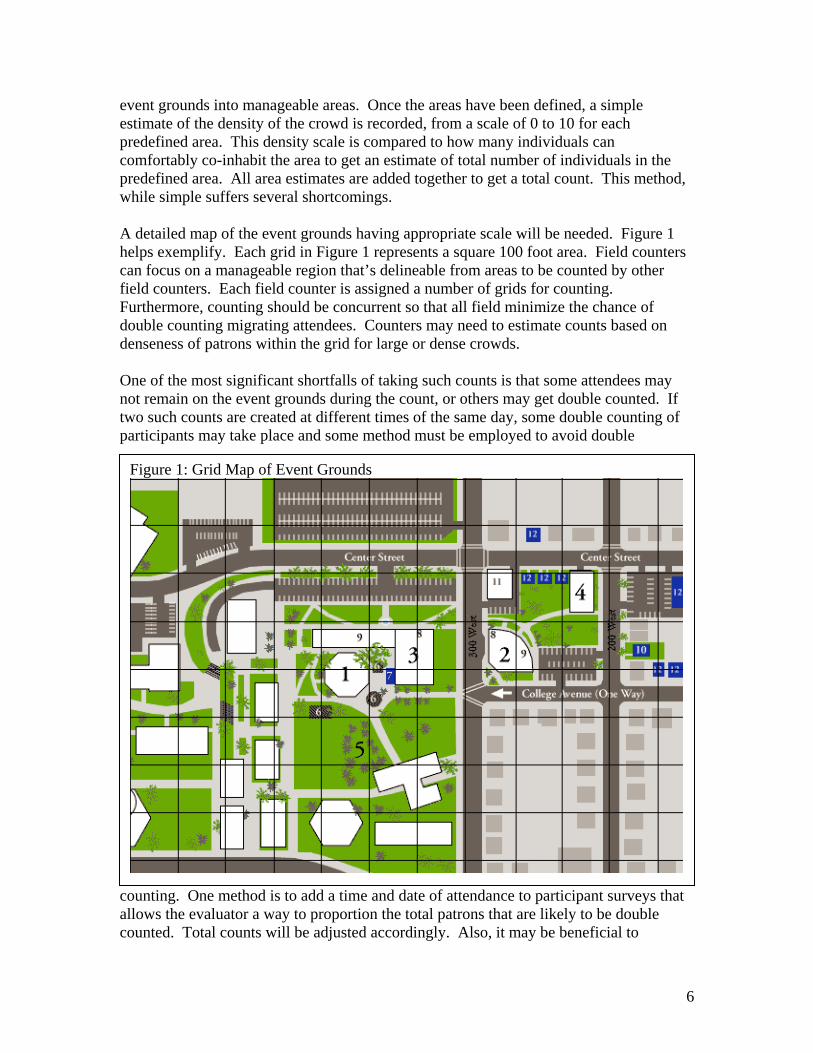
event grounds into manageable areas. Once the areas have been defined, a simple estimate of the density of the crowd is recorded, from a scale of 0 to 10 for each predefined area. This density scale is compared to how many individuals can comfortably co-inhabit the area to get an estimate of total number of individuals in the predefined area. All area estimates are added together to get a total count. This method, while simple suffers several shortcomings. A detailed map of the event grounds having appropriate scale will be needed. Figure 1 helps exemplify. Each grid in Figure 1 represents a square 100 foot area. Field counters can focus on a manageable region that’s delineable from areas to be counted by other field counters. Each field counter is assigned a number of grids for counting. Furthermore, counting should be concurrent so that all field minimize the chance of double counting migrating attendees. Counters may need to estimate counts based on denseness of patrons within the grid for large or dense crowds. One of the most significant shortfalls of taking such counts is that some attendees may not remain on the event grounds during the count, or others may get double counted. If two such counts are created at different times of the same day, some double counting of participants may take place and some method must be employed to avoid double
counting. One method is to add a time and date of attendance to participant surveys that allows the evaluator a way to proportion the total patrons that are likely to be double counted. Total counts will be adjusted accordingly. Also, it may be beneficial to
Figure 1: Grid Map of Event Grounds

7
estimate the peak time of day attendance beforehand and conduct a single count at that time. However, this has the potential risk of providing a most conservative estimate as some attendees will be on the grounds only before or after this count4. Attendance counts may be used along with other approaches to gauge event participation. Comparing expert judgment, concession sales figures and vehicle counts will help pinpoint an accurate estimate of total event attendance. For example, taking the total concession receipts divided by the estimated total attendance provides an expected concession expense per attendee. Attendance per vehicle can also be used with vehicle counts. These figures can be used as a check for reasonableness. If either number appears out of line, the evaluation administrator should seek to resolve the discrepancy.
Estimating the Direct Impact of Attendee Spending with Visitor Surveys To get the direct impact of patron expenditures, two measures are required. First an estimate of the number of attendees that come from outside of the community must be separated from those that come from within the community. Recall that local impacts require the injection of outside revenue to the local economy or prevention of local revenue from being spent outside of the community. Hence, simply estimating total attendance times expenditures will likely over estimate the impact of the event. Expert judgment can be used to breakout tourist attendance from local attendance and is more common for events where ticketed admission is not possible. It may be preferable to conduct a separate tally of local versus tourist attendees to derive weights, but the added cost of conducting a separate tally and a detailed survey may not outweigh the convenience of collecting both the proportion of attendees that are tourist patrons and the spending estimates simultaneously. Surveys provide the means to do both simultaneously. The general approach of surveys is to take a sample of the total number of attendees that will represent all attendees. A sample is a sub-set of the total number of people that could otherwise be surveyed. Surveys generally rely on samples because samples require less time and expense to survey than the total population of attendees. Samples should be random. This is another way of saying that the survey respondents should all have an equal chance of being selected. If the sample is not random, there is a risk that some systematic bias may be introduced in the result. For example, if interviewers avoid approaching patrons with children, then an unrepresentative concentration of childless profiles will be collected that does not fully reflect the spending of the typical event attendee. Representative sample selection at events can be difficult. If samples are only collected at a single location, then not all attendees will have an equal chance of being surveyed. For example, if the interview booth is located next to a particular attraction, say a concert 4 For a complete treatment on estimating visitors see the Research Resolutions & Consulting Ltd. document entitled Guidelines: Survey Procedures for Assessment of On-Site Spending at Ungated or Open Access Events and Festivals at http://www.tourismbc.com/pdf/Guidelines%20On-site%20Ungated%20Events.pdf.

8
stage, then there is a greater concentration of music enthusiasts in the sampling area. Depending on the act and the overall attendance at the event, these individuals may not be representative of the overall event patrons. Also, people who attend the event longer have a greater chance of being surveyed. This is likely to under-represent those event patrons who attend for a short period of time. Surveying or interviewing at the points of entry will likely reduce the chance that the survey sample is overly weighted by patrons who spend more time at the event. Parties that spend a small amount of time at the event are equally likely to be surveyed as patrons that spend a significant time at the event at the point of entry or exit. However, patrons around the entry point are more likely to be heading to a desired destination and less likely to volunteer for the survey. Hence, surveying at entry points may require a greater amount of effort to get a sufficient number of surveys for the evaluation goals. Evaluator may consider selecting key entry areas as well as internal areas where event attendees are more likely to be approachable by surveyors. Evaluators may want to separate spending patterns of those attending the event on multiple days from those making a single day visit. With representative sampling, no weights are required to be applied to responses. Weights are used so that a single estimate is weighted such that responses of particular groups are extrapolated to reflect the true proportion of the population visitors that fit that group. With representative samples, each party type has an equal chance of being selected for an interview. Hence, if it is found that 20 percent of the tourist patrons indicate that they will stay overnight and 80 percent indicate they will not, the weights are inherent in the proportions as they are reported. Furthermore, if 10 percent of the respondents indicate that they are from out of town and 90 percent indicate that they are local residents, then 10 percent of the total counts should be considered from out of town. For example, assume that the event counts produce the unusually nice round number of 1,000 patrons. From the above examples, the total number of tourist-patrons is easily determined to be 100 as 10 percent of 1,000. Of those 100 tourist patrons, 20 (20 percent of 100) intend to stay the night. The survey, with the right questions and counts, provides the necessary delineation of attendees to deduce which produce an economic impact on the community if a representative random sample is collected. Visitor surveys can provide valuable insights to visitor expenditures at local events as well as visitor characteristics. Such information provides information useable for forming economic impact evaluations of attendees and may be useful for future marketing efforts of local area events. A carefully designed and administered visitor survey can provide very accurate and useful information. However, surveys that are not carefully designed or are improperly conducted can provide information that is inaccurate and even misleading (Leones 1998). It may be tempting to only survey tourist patrons, since only tourist spending is relevant to the local economic impact of the event. However, doing so negates the ability to accurately apportion total attendance into tourist and local components. Withholding local resident survey responses will cause the evaluation to overstate the proportion of

9
total attendees that are tourist. For example, if 10,000 attendees are estimated, a representative sample survey of attendees show that 30 percent of those surveyed were tourist patrons, and the average tourist patron spent $100 over the course of their visits, then the total direct impact is,
100$30.000,10000,300$ ××= . Or more succinctly, 3,000 tourist patrons spent $100 each. If on the other hand, when survey takers avoid counting local patrons by filtering out local attendees before administering the survey, then the proportion of surveyed attendees will be higher than 30 percent to, let us say 60 percent. The total direct impact assuming all else constant would be overstated as,
100$60.000,10000,600$ ××= . Furthermore, surveys of local attendees may be desired if the local attendees choose to stay in the community to attend the event rather than travel outside of the community for an alternative out-of-town event. In which case, the event saved a measurable loss of community economic activity by enticing local residents to spend locally rather than outside of the region.
Surveys Visitor surveys can be self administered or surveyor administered as interviews. They can be conducted at the event, prior to or after the event. They can also be conducting at multiple times with the same respondent; possibly during and after the event. This section provides basic information about conducting visitor surveys and describes strengths and weaknesses of various methods of collecting visitor surveys. A sample visitor survey is provided in Appendix B. Surveys are very flexible means of collecting detailed information about patrons, their experiences at the event, and how much they intend to spend or spent within the community during their visit. Surveys do require a great deal of planning however. Borrowing from Julie Leones’ guide to designing visitor surveys5, the first task is to define the main purpose of the survey. For our purposes, the principal goal of the survey is to determine how much direct expenditures are created within the local community because of an event. A two-fold schema is necessary to create such measures. An accurate count of total visitors is required as described above. This count must also be delineated between local and tourist attendance. Hence any event impact survey must ask the respondent where they live. Also, spending profiles of attendees are required to ascertain how visitors spend money within the community. Other goals may be associated with the survey to help event planners better market this event. Such additional goals may include:
• Identifying where else visitors go outside of the community • Understanding visitor characteristics for marketing purposes such as
o Age o If traveling with family
5 See Leones, J. (1998). A Guide to Designing and Conducting Visitor Surveys. Tucson, Arizona, Arizona Cooperative Extension. At http://cals.arizona.edu/pubs/marketing/az1056/

10
o Income levels o Hobbies and other interests o Their primary purpose for visiting the community
• Gaining feedback from visitors about desired improvements they feel are important
• Determining how many visitors stay overnight. Other interest that suits the needs of the community can be added. However, it should be strongly noted that questions of interest that are not vital to the overall goals of the evaluation should be scrutinized severely. Overly ambitious surveys have the potential to alienate survey respondents (Posavic and Carey 1997). The necessary sample size of the survey depends on the information, scope, and rigor the evaluation is to take. The scope of the survey confers the extent of information that is desired. The simplest scope is to assess the simple total economic impact over all attendees. More complex designs may seek to quantify the difference in spending patterns amongst attendees. We will maintain focus on the simple economic impact over all attendees. If the goal of the survey is to sustain scientific rigor, a larger sample size is generally necessary than one would require of a survey that is representative of the population of event patrons. A generalized approach to estimating the necessary sample size is provided by Snedecor and Cochran (1989). First, the anticipated variance of the total expenditures is necessary. Prior studies can be used to derive estimated variances. However, most likely the variance will have to be inferred by an anticipated range of total party expenditures using the following formula:
( ) ( ) ( )2161 Rangevarianceestimated ×= .
If prior experience posits that the typical party will spend somewhere between $100 and $200 dollars in the community during their stay, then the estimated variance will be calculated as:
( ) ( ) ( )2100200161625 −×==varianceestimated .
The estimated variance will then be combined with an acceptable tolerance for error to produce the sample size necessary to produce estimates of expenditures with a degree of certainty within the tolerable range. To calculate the minimum sample size, use the following formula:
2
4tolerance
variancen ×= .
The variance is the anticipated variance of spending calculated above, or from prior studies. The tolerance is the inaccuracy plus or minus the amount of total expenditures that evaluators well tolerate in their estimate. For example, if the evaluators want to be reasonably assured that the true mean expenditures of visitors is within $10 of the sample estimate, then using the estimated variance of 625, the necessary sample size is calculated as:

11
210625425 ×
==n .
For this example, the local evaluators will want to collect no less than 25 completed surveys to be assured that they will derive estimates that are accurate within $10 of the true average party expenditures. However, since only expenditures of tourist patrons will produce an impact, the surveyors will need to collect 25 tourist patron surveys to reach this goal of tolerance. If 25 percent of the attendee visits are tourists, then 100 (=25/.25) total surveys must be completed to get 25 completed tourist surveys. The evaluator will most likely seek to collect more than 100 samples as some surveys will be returned invalid or incomplete and the actual variance used to estimate the sample variance may be too narrow. Next the evaluator should select the most appropriate survey method. The most appropriate survey method may vary depending on circumstances within and outside the control of the event host. For example, if advance purchase of event tickets is necessary, the event hosts will likely have contact information of ticket purchasers. This contact information could then be used to contact event attendees for phone or mail surveys. If such information is not available, attendees will need to be contacted on site for contact information for a phone or mail survey. Alternatively, the survey can be conducted at the site with no contact information if it is deemed that patrons are less likely to provide contact information. Other considerations may also lead evaluators to one method over others. The next step to the evaluation is to determine the best method to collect the survey. Surveys may be collected through:
• Mail, with or without short contact with the visitor at the site • Self administered while at the site • On-site interview • Phone interview.
The choice of survey collection method depends on the situation. If complete contact information exists for event attendees, then a mail survey may be the most economical survey method. If this is not the case, then on-site contact will be necessary, where the respondent completes the survey on site, or completes it after the event and mails the completed survey to evaluators. There are both advantages and disadvantages to each survey method.
Mail Surveys Mail surveys require visitor contact information that may or may not include the phone numbers of attendees. If advanced purchase of tickets are necessary to attend the event, this information is likely to be collected already. If not, evaluators need to contact event attendees on site to ask for permission to include them on the post-event survey. Additionally, tallies of local and tourist patrons should be made with this contact. Attendees who agree to participate in the survey then provide their name, address, and potentially a phone number. Generally, the phone number provides an opportunity to remind the attendee to complete the survey and send it in. It also allows evaluators a

12
chance to call on non-respondents to gauge whether there exists a systematic bias in the collected surveys. Mail surveys generally follow the Dillman approach, which involves sending out a copy of the survey, sending a reminder postcard if no response is received, and possibly phone contact and/or sending a second and third copy of the survey. The Dillman approach seeks to increase response rates while managing non-response bias that can occur if non-respondents share a common trait that respondents don’t share. For example, those that only attended a single day of a two-day event may be less inclined to complete the survey. The absence of their responses is likely to bias the direct impacts toward higher expenditure estimates, as attendees staying overnight are likely to experience higher expenditures during the event than single-day attendees. Finally, be sure to include a personalized (where possible) cover letter with every mail survey that explains the purpose of the survey, how the survey will be used, and the date by which the survey needs to be received. Failing to include a completion deadline will prompt recipients to set it aside for later completion. The longer the respondent holds the survey before completing it, the more difficult it will be for the respondent to recall specifics of the event. Most importantly, be sure to thank the respondent for their time and effort in completing the survey. Advantages:
• May be the least expensive option • Can be mailed over a large geography • Can be administered after the event has taken place to account for all expenditures
Disadvantages: • Can result in low response rates • Some questions may be misunderstood • Requires a representative list of participants.
On-Site Self-Administered Surveys Self-administered surveys can be provided at the site for respondents to complete. Respondents are asked to leave the completed survey at the site. Such surveys can be distributed by survey assistants, or placed on a kiosk for respondents to complete. However, stand-alone kiosks should not be left unattended. Unattended kiosks for event attendees to retrieve a survey and complete may not be enough to collect the necessary sample size. Some coaxing may be warranted to assure that a large number of responses are obtained. Hence, survey kiosks accompanied by a survey recruiter will produce more respondents than an unattended kiosk. Furthermore, having an attendant on hand will provide survey respondents a source for clarifying confusing questions. On-site surveys should remain short to facilitate completion. Many survey participants will be distracted with family and children, or on their way to a destination, and do not want to be distracted. However, a representative sample should sample all attendees. Alienating those with distractions through an overly long survey will likely provide misleading statistics.

13
Advantages:
• Response rates may be higher than mail surveys • Less expensive than personal interviews or telephone interviews • Does not require visitor contact information before conducting the survey
Disadvantages: • May be more expensive than mail surveys • Possible selection bias of survey participants • Event attendees may be limited to providing expected expenditures for their visit
rather than actual expenditures, as their visit is not completed.
On-Site Interviews On-site interviews may be the most flexible method for collecting survey responses by allowing skilled interviewers to interact with respondents. During the on-site interview the interviewer will ask the interviewee the survey questions and record the responses. This provides an opportunity for the interviewer to interact with the interviewee. However, skilled interviewers are careful not to color the interviewees’ responses. On-site interviews tend to be amongst the highest survey collection methods in terms of cost. Such surveys should be limited to small surveys that can be completed in a short amount of time and/or have complex questions that may require guidance. Since a surveyor is present, the respondent has the ability to ask for clarifying instruction to the questions. Advantages:
• Tend to have high response rates • Can ask more complex questions • Can enter responses directly into a computer saving data input time and reducing
potential inputting errors • Facilitates recording of time the survey was taken • Does not require visitor contact information before conducting the survey
Disadvantages: • Generally expensive • Bias may be introduced by the interviewer • It may be difficult to identify locations and times to interview to assure a
representative sample • Event attendees may be limited to providing expected expenditures for their visit
rather than actual expenditures, as their visit is not completed
Optional On-Site or Mail-In Survey Not all individuals who are approached for an on-site survey will be able to complete the survey on site. Hindrances to completion may include time constraints, pre-occupation with children, or simply the lack of desire to interrupt their current experience by taking a survey. In such cases, an optional mail-in survey may be appropriate that allows the survey respondent to complete the survey at the event or mail it later. Either a self-

14
addressed postage-paid envelope or appropriate business reply envelope will help to facilitate high response rates. Be sure to include a completion deadline to influence a quick response. The longer the respondent holds the survey before completing it, the more difficult it will be for the respondent to recall specifics of the event. To gauge for biased results, surveys mailed after the event can be compared to surveys completed on site. If spending patterns appear different, holding all else constant, then there exists evidence that those surveys produced on site may not accurately reflect the total expenditures. This statement presupposes that post-event surveys are more accurate because respondents were able to provide actual expenditures rather than speculate on future expenditures. In such case, the discrepancy should be noted in the final report with appropriate adjustments fully documented. Advantages:
• High response rates with two options for completing the survey • Less expensive than personal interviews or telephone interviews • Does not require visitor contact information before conducting the survey • Provides a check for biased results of on-site completed surveys
Disadvantages: • May be more expensive than mail surveys • Possible selection bias of survey participants • Must delineate between surveys completed on site and surveys mailed
o On-site surveys speculate on total expenditures o Mailed in surveys may provide actual expenditures
• Some question may be misunderstood.
Two-Part Surveys When seeking spending profiles of event attendees, on-site surveys will generally require the participant to speculate on total expenditures. Such speculative estimates may result in systematic over- or under-estimates of actual expenditures that will lead to misleading results. In essence the degree of certainty of the quality of the survey responses may be in question. One approach to gauging or even correcting for such speculative error is to conduct a post-event mail survey to accompany the on-site interview or self-administered survey. This post survey may be provided to all or part of the total on-site surveys collected. Of course, a post survey follow-up requires that the on-site survey collects complete contact information. The follow-up survey of a two-part survey should be conducted or mailed immediately after the event takes place and should include the same expenditure questions as the on-site survey. The mail survey should be accompanied by a personalized cover letter that reminds the respondent that this is a follow-up survey, the purpose of the survey, and the deadline for completion. Delaying the follow-up survey is not recommended, as attendees will likely not be able to recall their expenses accurately well after the fact. It can be administered as a phone interview or a mail-in survey. If respondents of the on-site survey are to be re-surveyed with a follow-up survey, the second survey should be

15
considered more accurate as the respondent will be able to gauge all expenditures (even the unexpected ones) that took place in the host community. This two-part approach also allows for the inclusion of more questions than may be appropriate in on-site interviews alone. That is because there are two different surveys on the same sample and questions can be changed in the two surveys. However, the leading questions on the two surveys should be identical to retain compatibility between the two surveys. For example, if the on-site survey does not lead with questions about other activities in the community, but the post-event survey does, this lead-in question may jog the respondent’s memory about other expenditures not taken into account on the first interview or may lead them to not consider expenses reported on the on-site interview. The two interviews in essence will be asking two different questions regardless of the similar wording of the questions. Save changes in questions for the last part of the surveys so as to not taint the responses. On-site responses can be compared to their post-event survey if the mailed surveys are properly coded to match the on-site survey. Relying on name fields and/or address fields to match on-site and mail surveys will likely create several surmountable complications such as different name or address spellings, or spousal confusion. The best way to match the two surveys is to code the on-site entries and apply that code to the mail survey sent after the event. Returned mail surveys are then matched with their corresponding on-site survey though this code. Furthermore, the same Dillman approach for following up on non-respondents can be employed to increase the rate of response. Advantages:
• Increased response rates • May provide greater insight to spending patterns through the post-event survey
while retaining the ease of on-site surveys • Can provide more survey questions • Greater flexibility where on-site surveys may be administered as self –
administered, or as interview surveys. Post surveys can be mail or phone interviews.
Disadvantages: • Complications arising from matching post event surveys to on-site surveys • More expensive than on-site surveys • Require visitor contact information before conducting the survey • On-site selection bias carries over to post-event selection bias.
Telephone Interviews If patron telephone numbers are available, telephone surveys may be an option. Similar to mail surveys, place of residence of patrons is needed to tally the number of visitors that come from outside the region relative to local residents. Because of the popularity of cell phones, relying on the local exchange to delineate local and tourist patrons may produce misleading results. Also, it is becoming more difficult to reach people by phone because many people use answering machines and caller ID to screen calls. Even when the

16
evaluators gain the permission of attendees to be surveyed, attendees may still screen calls from numbers they are not familiar with. Telephone interviews combine the benefits of interviews and mail surveys. They allow more complex questions to be asked since the interviewer can clarify confusion and can be administered over a wide geography. However, phone surveys tend to be expensive and taxing on interviewers. Advantages:
• Relatively easy to supervise staff • Information is generally keyed into a computer for easy evaluation • Can address more complex questions • Can be conducted over a large geography • Can be administered after the event has taken place to account for all
expenditures. Disadvantages:
• People with no phones are excluded • The best person to respond to the survey may not be the respondent • Households may screen their calls • Bias may be introduced by the interviewer • Projected response rate is difficult to estimate.
Estimating Vendor Spending Impacts Vendor spending impacts while in the community also contribute to the overall impact of community events. Similar to patron impacts, the economic impacts of vendors depend on their geography. However, there exist two components to vendor impacts. The first is the spending that tourist vendors spend while in the community. Expenditures of local vendors should not be counted toward the economic impact, since this represents a reallocation of existing community wealth. However, sales of local vendors remain in the community while sales of tourist vendors leave the community. Hence this two-part impact presents itself with unique challenges. Vendor surveys are generally undemanding to administer as interviews or on-site self-administered surveys. There is less concern about estimating the total number of vendors, since that information is readily available to event hosts. There is, though a question of how many people the vendor uses to support their activity during the event. However, vendors can be treated as parties just as patrons can be. All the survey methods described for surveying patrons above are viable options. While a small proportion of total patrons are generally surveyed, most all vendors can be surveyed as they make up a much smaller group than patrons. Hence a census of vendors should be sought rather than a sample. That is not to say that a complete census is possible. However, event planners will generally have much more information about vendors than they do about patrons. So it will likely be less costly to conduct surveys on the majority of vendors.

17
When collecting vendor sales estimates, note that vendors may have multiple incentives to under-report sales. Vendors may understate their sales for tax purposes and if the event host charges royalties on sales, then they have the additional incentive of reducing their expense by under-reporting sales. Furthermore, vendors may perceive that under-reporting sales is a strategic move to assure that next year’s vendor fees will remain low. Therefore, vendor sales reports will tend to be conservative estimates. Like patrons, tourist-vendors purchase food, souvenirs, and lodging during their stay. These should be counted as direct impacts to the local economy if these purchases take place because of the event. Those purchases from local vendors should not be counted toward the direct impact of the event. However, if the local event prevents a local vendor from going to another location, their expenditures within the community represent direct impacts that the event saved from being spent outside of the community.
Writing Survey Questions Writing survey questions that generate productive responses can be challenging. The process of writing survey questions tends to be tedious, requiring writing, reviewing, re-writing, reviewing… Anyone who feels that their questions are sufficient after the first writing has not put enough consideration into what information can be gleaned from the questions and how the survey respondent may interpret the questions. While the questions may be clear to the drafter, the respondent will view the questions through a completely different lens than the drafter. Hence it is important that pilot runs be conducted to test the interpretation of the questions and to test the information that can be derived from the responses. To facilitate responses, the wording of survey questions should be concise, yet easy to understand. If complex instructions are necessary, consider breaking the question down into multiple parts. For example, replace the following question,
Q1. If you live within 25 miles of event, what mode of transportation did you use to get to this event?
with Q1. Do you live within 25 miles of event? Yes___ No____ (If you answered no to Q1, skip question Q2. and proceed to Q3.) Q2. What mode of transportation did you use to get to the event?
The first question leaves the respondent confused as to what to do if they do not live within 25 miles of the event. It also asked two things of the respondent in one question, making it more difficult for the respondent to interpret the question. Furthermore, avoid imprecise wording that, while providing the respondent with direction, will lead to wordy questions. Minimize the use of adjectives and descriptive wording where more precise wording will suffice. Lengthy questions become more difficult to interpret and can also lead to confusion. As surveyors, we are tempted to direct the respondent to the purpose of the question. However, this often leads to guiding the respondent toward a pre-conceived response.

18
Survey questions should be scrutinized for coaxing questions and non-neutral wording should be replaced with wording that does not color the question. For example,
Q3. To assess the impact of your attendance, please indicate how much you spent in local restaurants during your visit.
The wording in question Q3. may influence the respondents’ responses toward higher estimates. Consider instead,
Q3. How much did you spend, or expect to spend in local restaurants during your visit?
The second example does not lead the respondent toward a biased estimate with the unnecessary lead-in. Negative wording should be excluded as it tends to make the question difficult to interpret. Replace,
Q4. Did you not spend more than two days at this event? to
Q4. Did you spend less than two days at this event? The second question is much easier for the respondent to interpret. Finally, be cognizant to the best response format to facilitate both the respondent and measurement for analysis. The best response format may change the way the question should be worded. If the goal is to identify those who must travel 25 or more miles to the event, asking for the respondents’ place of residence, will require additional calculations to delineate tourist patrons from local patrons without additional useful information. However, if it is important to the goals of the survey to know the residence of respondents, then asking for this information is appropriate. Survey questions should start from simple and interesting questions. Respondents will be more interested in answering questions about where they have been or what they have done on their trip. These questions, while informative, also serve as warm-up questions. The most important questions should follow directly so that their responses do not suffer from respondent fatigue later in the survey. Save uninteresting questions such as demographics, age, education and income for the last (Leones 1998). The questions of the survey should flow much like a storyline. Keep similar questions together, or form categories of questions that allow the respondents to focus on one particular subject matter at a time. For example, questions about the group the respondent traveled with should be grouped. Similarly, questions about length, spending, mode of travel, and others should be grouped so that topics do not reappear later or jump from topic to topic in the survey. Survey drafters may also seek to group questions that use the same response category where possible. Finally, keep the survey as short as possible. Surveys should not take more than 10 minutes to complete. Removing unnecessary and redundant questions is the first step toward reducing the size of the survey. Long surveys, while extracting more information, may lead to lower response rates. The number of pages the survey has is likely to have an impact on the potential respondents’ choice to participate in the survey.

19
If the information gained from the survey is to be used in another process to derive an overall impact assessment, be sure that the questions and the format of the answers are consistent and will be useful in the next step. For example, if the direct impacts are to be used in the Michigan State University Michigan Tourism Spending and Economic Impact Model (MITEIM), then spending profiles should match those required to feed the model. Once the survey is completed, have several experienced people critique your questionnaire. Their insights may help to avoid technical issues that the original drafters failed to recognize. The survey draft should be pilot-tested on a small group of people representative of the targeted respondents. You may do this by attending a small community event and asking participants to participate in your survey. Seek different groups within this event to understand what challenges will exist surveying a group with children or other challenges. Seek respondents of various ages or other characteristics that you anticipate to be the target so that contingencies will be well recognized before launching the actual survey. Furthermore, encourage pilot respondents to make comments on each question as well as about the flow of the survey. Take note of questions that tend to be left unanswered or are frequently misunderstood. These questions may require rewording. Time respondents and modify the survey if it generally takes more than 10 minutes to complete the survey. If final questions tend to be left unanswered, then it is possible that the survey is too long and should be shortened. After pilot testing the survey on respondents, enter the responses for analysis to assure the responses are sufficient to address the desired information necessary to fulfill the goals of the evaluation. Evaluation challenges may imply that the questions and responses need modified. Sample surveys are provided at the end of this document. Evaluators are encouraged to borrow from other surveys in the field to reduce the time-cost of developing surveys. Many impact reports also provide details of the survey and methods used to collect responses. These reported surveys often go through the same rigor developed here in testing and implementation.
Administering the Survey Regardless of the method of survey chosen, several factors must be considered when administering the survey including whether to outsource surveying services, how many surveyors to administer the survey, timing of surveys, and how many surveys to collect for valid results. All factors must be considered with reference to budgets, audience, possible contingencies, and factors particular to the event. Administering and evaluating surveys can be expensive. In the case of producing an evaluation, the expense of the survey is added on to the expense of providing an evaluation. The cost of doing the evaluation in-house should be weighed against hiring a professional evaluation firm to provide the evaluation service instead. Professional evaluative services can be expensive, but the difficulties of producing a defensible evaluation rest on the hired evaluator rather than the event stakeholders. This provides a

20
level of neutrality in the evaluators that will likely ease skepticism of the results. In-house evaluations are often subject to the additional scrutiny that evaluators have an incentive to report the results in the most favorable light. Some concerns may be well grounded, but there is no reason to assume that an in-house evaluation team cannot produce a neutral impact assessment. Generally, surveys can cost between $7 and $50 dollars per survey (Woods and Barta 2002). At the minimum, anticipate that a 1,000-sample survey will cost about $7,000 to produce. Any additional analysis will add to this cost. This cost and others should be weighed against the expected benefits of conducting the study. If the expected cost of producing the evaluation outweighs the projected benefit, an alternate approach may still be valid. Events that have low expected impacts should also have a low cost of evaluation. Greater use of expert judgment or other less stringent approaches may be in order for these smaller events.
On-Site Surveys and Collecting On-Site Contact Information for Mail and Phone Surveys On-site surveys require greater planning than mail and phone surveys. However, mail and phone surveys that require evaluators to contact event attendees to collect contact information require much of the same planning as on-site surveys. Working with event hosts to develop a well planned system will help assure that representative sampling takes place. Event hosts can draw on experience to predict the best times and locations to conduct on-site surveys and interviews. They can help to predict patron participation based on attraction timing. Events that draw multiple bands within a multi-venue concert event will likely lead different demographic groups to different areas of the event at different times. Knowing the likely demographic participation in advance will help evaluators time the best survey times and locations to assure a representative sample of the patrons are contacted. Coordinating interviewers and any business or organization cooperating with evaluators with event hosts helps avoid surprise situations like taking on-site interviews in areas that are too noisy to effectively communicate or surveying in the most remote location in terms of number of patrons. Event planners will be able to identify high traffic areas and times that contribute to both accurate counts and representative samples. Furthermore, event planners can be instrumental in identifying times of peak attendance that may be desired for attendance counts. Surveyors should be trained before collecting surveys and should be outgoing and pleasant individuals who interact well with strangers. They may find themselves administering multiple self-administered surveys and find unforeseen events along the way. During training, interviewers and/or surveyors should be well aware of the goals of the survey and should be very aware of what each survey question seeks to address. Interviewers should conduct mock interviews before interviewing event patrons. If a point of contact data entry system is used be sure the user is well versed with the software.

21
Finally, a small token gift or entry for a raffle prize should be considered to motivate respondents to take the time to complete the survey. This enables the on-site surveyors to introduce themselves in a manner that is more likely to capture potential respondents’ attention. If a raffle prize is to be provided, the prize should be of neutral characteristics unless it is ideal for the target event goers. A bicycle event, for example, may call for a new 10-speed or other bicycling paraphernalia as raffle prizes. But such a raffle prize at an arts show is likely to entice survey respondents that include only those interested in the bike. This will likely lead to a systematic bias in the sample toward younger event patrons who are interested in out-doors activities. Multiple smaller size prizes that span interests will help capture more respondents.
Mail and Phone Surveys Even if all contact information is fully available such that a representative sample is not needed, there exist factors that need to be contemplated before embarking on a mail or phone survey. First, the choice as to whether to administer such surveys internally or hire out survey services. Call centers can be hired to do phone surveys and mass mailing services can be used to send and collect mail surveys. Hiring out such services may be less expensive than doing them internally. Under some strategies, components of the evaluation process are hired out, but control of the evaluation process remains under the guidance of the evaluators. This allows the evaluators to focus on those component parts they have a comparative advantage in. If off-site surveys or phone interviews are to be conducted in house, ample preparation should be planned. The method of coding surveys to keep record of patrons who have responded should be considered in light of information that is available. Some existing contact information may not be in a format that is readily useable. Often, contact information is in hard-form and must be re-entered into electronic form. A proper cover letter should be drafted that fully explains the nature of the survey and expected completion date. If phone interviews are to be performed, the interviewers’ script should be prepared. Finally, interviewers and/or coders should be well trained.
Michigan Tourism Spending and Economic Impact Model This bulletin recommends applying the Michigan Tourism Spending and Economic Impact Model (MITEIM) for forming the community impact assessment. If using the MITEIM to form community impacts, the survey spending categories should be consistent with the entries used by the MITEIM. The MITEIM model breaks visitor spending into the following categories:
• Motel, hotel cabin or bed and breakfast • Camping fees • Restaurants & bars • Groceries, take-out food/drinks • Gas & oil • Other vehicle expenses • Local transportation

22
• Admissions & fees • Clothing • Sporting goods • Gambling • Souvenirs and other expenses.
The MITEIM model breaks categories out because each category is likely to have a different impact on the local economy. Restaurants and bars are likely to have a deeper supply chain within the local economy than gas stations. Hence, a quantity spent at a local restaurant is likely to produce more local economic activity than the same amount spent on gasoline. Not all categories are necessary for all community event impacts. For example, a concert event is not likely to produce visitor purchases of sporting goods. In such case, the evaluator may opt to reduce the size of the survey by eliminating sporting goods purchases from the categories of expenditures. The MITEIM model uses generic multipliers for the state, small metropolitan communities, and rural communities. More specific multipliers reflecting the event’s regional economy can be used in their place by contacting Daniel J. Stynes at Department of Community, Agriculture, Recreation, and Resource Studies (CARRS) at Michigan State University or other IMPLAN Pro resources like the Center for Economic Analysis in the Department of Agricultural Economics; also at Michigan State University. The MITEIM model also supplies typical spending patterns of visitors based on the 1998 Michigan Welcome Center Visitor Survey and other recent studies. These spending profiles apply best to general tourism impacts. They may be applied to particular events if it is deemed too expensive to generate spending profiles of event patrons. However, they may need modifying as event participants are likely to have different agendas and expenditures than general Michigan tourists. It is preferable to generate spending profiles for each event, but the costs of doing so should be weighed against the benefits in light of alternative methods for estimating spending. There exist several strengths to using the MITEIM model for assessing event impacts. The MITEIM model is designed to measure the economic impacts of tourist-related activities. Such activities are inherent to community impacts of events. Also, the MITEIM marginalizes the direct effects to account for local margins or capture rates. The capture rate of spending isolates the direct impacts that benefit the local economy. Not all visitor expenditures will produce an economic impact. For example, when a visitor spends money on gasoline, only the markup representing local profits should be accounted for as the gasoline is generally imported from outside the region. In the case of transportation fuel, the capture rate is likely to be extremely. Generally, capture rates are broadly applied to industry groups. Restaurants tend to have larger capture rates than retail establishments because restaurants or more likely to purchase inputs from local

23
suppliers than retail establishments. For a complete discussion of capture rates, see Daniel J. Stynes’ report Economic Impacts of Tourism (1997)6. However, using the MITEIM model has a drawback when assessing the impacts of isolated community events. This is because the MITEIM model is based on annual multipliers. When the multipliers are produced, they are created on the assumption that any increase in industry activity is ongoing for the course of the year. Because of this assumption, the MITEIM model is likely to overstate employment impacts. For example, the MITEIM model may report that it requires restaurants to employ one employee for every $100,000 of sales. If a single event takes place that produces $100,000 of new restaurant sales in the community, then the model will report an additional job. Over sustained periods of increased sales, restaurants are likely to increase employment. But these sales will be sustained over a very short period of time. Rather than hiring additional workers, existing workers may be called to work more hours, or restaurant staff may accommodate the additional sales by filling in excess capacity during their regular shifts. Furthermore, these sales are likely to be spread over many restaurants in the community, with no single restaurant generating enough sales for an additional hire. It is therefore recommended to avoid reporting employment impacts, with the possible exception of the direct employment impacts. Direct employment impacts will be those temporary positions known to exist because the event hosts or vendors hires them during the event.
Closing Undertaking studies of the economic impacts of community events can be a challenging venture. In light of increasing scrutiny of public funding for such events, these studies are becoming more common and more important for winning public support. This bulletin introduces the process of estimating direct impacts of community events and discusses the process of putting these direct impacts into community economic impacts. Several safeguards should be implemented to assure sound results. However, these safeguards introduce rigor to the process that in turn increases the time-cost and pecuniary cost of producing an economic impact. Such costs should be weighed against the expected gains realized by increased rigor and scope. Stakeholders should also consider whether it is preferable to outsource evaluative studies on both cost grounds and to assure actual or apparent impartiality in the study results. Components of the evaluation process may be outsourced as well to save costs. However, appraise these decisions in light of the intended audience, goals of the evaluation, and internal resources for conducting evaluative studies. Expertise at local universities and community colleges can also be tapped for assistance.
6 Daniel J. Stynes has a complete library of articles on measuring the impact of tourism for downloading at http://www.msu.edu/user/stynes/pubs.htm

24
References Leones, J. (1998). A Guide to Designing and Conducting Visitor Surveys. Tucson, Arizona, Arizona Cooperative Extension. Posavic, E. J. and R. G. Carey (1997). Program Evaluation: Methods and Case Studies: Fifth Ed. Upper Saddle River, New Jersey, Prentice Hall. Snedecor, G. W. and W. G. Cochran (1989). Statistical Methods: Eighth Ed. Ames Iowa, Iowa State University Press. Stynes, D. J. (1997). Economic impacts of Tourism: A handbook for tourism professionals. Urbana, IL, University of Illinois: Tourism Research Laboratory. Stynes, D. J. (1999). Approaches to Estimating the Economic Impacts of Tourism: Some Examples. Economic Impact Approaches. East Lansing, MI. Woods, M. and S. Barta (2002). Estimating Impacts of Tourism Events: Methodology and a Case Study. National Extension Tourism Conference, Traverse City, Michigan.

Appendix A: IMPLAN Pro Categories
Description Description
1 Oilseed farming 73 Soybean processing2 Grain farming 74 Other oilseed processing3 Vegetable and melon farming 75 Fats and oils refining and blending4 Tree nut farming 76 Breakfast cereal manufacturing5 Fruit farming 77 Sugar manufacturing6 Greenhouse and nursery production 78 Confectionery manufacturing from cacao beans7 Tobacco farming 79 Confectionery manufacturing from purchased ch8 Cotton farming 80 Nonchocolate confectionery manufacturing9 Sugarcane and sugar beet farming 81 Frozen food manufacturing
10 All other crop farming 82 Fruit and vegetable canning and drying11 Cattle ranching and farming 83 Fluid milk manufacturing12 Poultry and egg production 84 Creamery butter manufacturing13 Animal production- except cattle and poultry 85 Cheese manufacturing14 Logging 86 Dry- condensed- and evaporated dairy products15 Forest nurseries- forest products- and timber 87 Ice cream and frozen dessert manufacturing16 Fishing 88 Animal- except poultry- slaughtering17 Hunting and trapping 89 Meat processed from carcasses18 Agriculture and forestry support activities 90 Rendering and meat byproduct processing19 Oil and gas extraction 91 Poultry processing20 Coal mining 92 Seafood product preparation and packaging21 Iron ore mining 93 Frozen cakes and other pastries manufacturing22 Copper- nickel- lead- and zinc mining 94 Bread and bakery product- except frozen- manu23 Gold- silver- and other metal ore mining 95 Cookie and cracker manufacturing24 Stone mining and quarrying 96 Mixes and dough made from purchased flour25 Sand- gravel- clay- and refractory mining 97 Dry pasta manufacturing26 Other nonmetallic mineral mining 98 Tortilla manufacturing27 Drilling oil and gas wells 99 Roasted nuts and peanut butter manufacturing28 Support activities for oil and gas operations 100 Other snack food manufacturing29 Support activities for other mining 101 Coffee and tea manufacturing30 Power generation and supply 102 Flavoring syrup and concentrate manufacturing31 Natural gas distribution 103 Mayonnaise- dressing- and sauce manufacturing32 Water- sewage and other systems 104 Spice and extract manufacturing33 New residential 1-unit structures- all 105 All other food manufacturing34 New multifamily housing structures- all 106 Soft drink and ice manufacturing35 New residential additions and alterations-all 107 Breweries36 New farm housing units 108 Wineries37 Manufacturing and industrial buildings 109 Distilleries38 Commercial and institutional buildings 110 Tobacco stemming and redrying39 Highway- street- bridge- and tunnel construct 111 Cigarette manufacturing40 Water- sewer- and pipeline construction 112 Other tobacco product manufacturing41 Other new construction 113 Fiber- yarn- and thread mills42 Maintenance and repair of farm and nonfarm re 114 Broadwoven fabric mills43 Maintenance and repair of nonresidential buil 115 Narrow fabric mills and schiffli embroidery44 Maintenance and repair of highways- streets- 116 Nonwoven fabric mills45 Other maintenance and repair construction 117 Knit fabric mills46 Dog and cat food manufacturing 118 Textile and fabric finishing mills47 Other animal food manufacturing 119 Fabric coating mills48 Flour milling 120 Carpet and rug mills49 Rice milling 121 Curtain and linen mills50 Malt manufacturing 122 Textile bag and canvas mills51 Wet corn milling 123 Tire cord and tire fabric mills52 Other miscellaneous textile product mills 124 Noncellulosic organic fiber manufacturing53 Sheer hosiery mills 125 Nitrogenous fertilizer manufacturing54 Other hosiery and sock mills 126 Phosphatic fertilizer manufacturing55 Other apparel knitting mills 127 Fertilizer- mixing only- manufacturing56 Cut and sew apparel manufacturing 128 Pesticide and other agricultural chemical man57 Accessories and other apparel manufacturing 129 Pharmaceutical and medicine manufacturing58 Leather and hide tanning and finishing 130 Paint and coating manufacturing59 Footwear manufacturing 131 Adhesive manufacturing60 Other leather product manufacturing 132 Soap and other detergent manufacturing61 Sawmills 133 Polish and other sanitation good manufacturin62 Wood preservation 134 Surface active agent manufacturing63 Reconstituted wood product manufacturing 135 Toilet preparation manufacturing64 Veneer and plywood manufacturing 136 Printing ink manufacturing65 Engineered wood member and truss manufacturin 137 Explosives manufacturing66 Wood windows and door manufacturing 138 Custom compounding of purchased resins67 Cut stock- resawing lumber- and planing 139 Photographic film and chemical manufacturing68 Other millwork- including flooring 140 Other miscellaneous chemical product manufact69 Wood container and pallet manufacturing 141 Plastics packaging materials- film and sheet70 Manufactured home- mobile home- manufacturing 142 Plastics pipe- fittings- and profile shapes71 Prefabricated wood building manufacturing 143 Laminated plastics plate- sheet- and shapes72 Miscellaneous wood product manufacturing 144 Plastics bottle manufacturing
A.1

Appendix A: IMPLAN Pro Categories
Description Description
145 Pulp mills 217 Resilient floor covering manufacturing146 Paper and paperboard mills 218 Plastics plumbing fixtures and all other plas147 Paperboard container manufacturing 219 Foam product manufacturing148 Flexible packaging foil manufacturing 220 Tire manufacturing149 Surface-coated paperboard manufactuing 221 Rubber and plastics hose and belting manufact150 Coated and laminated paper and packaging mate 222 Other rubber product manufacturing151 Coated and uncoated paper bag manufacturing 223 Vitreous china plumbing fixture manufacturing152 Die-cut paper office supplies manufacturing 224 Vitreous china and earthenware articles manuf153 Envelope manufacturing 225 Porcelain electrical supply manufacturing154 Stationery and related product manufacturing 226 Brick and structural clay tile manufacturing155 Sanitary paper product manufacturing 227 Ceramic wall and floor tile manufacturing156 All other converted paper product manufacturi 228 Nonclay refractory manufacturing157 Manifold business forms printing 229 Clay refractory and other structural clay pro158 Books printing 230 Glass container manufacturing159 Blankbook and looseleaf binder manufacturing 231 Glass and glass products- except glass contai160 Commercial printing 232 Cement manufacturing161 Tradebinding and related work 233 Ready-mix concrete manufacturing162 Prepress services 234 Concrete block and brick manufacturing163 Petroleum refineries 235 Concrete pipe manufacturing164 Asphalt paving mixture and block manufacturin 236 Other concrete product manufacturing165 Asphalt shingle and coating materials manufac 237 Lime manufacturing166 Petroleum lubricating oil and grease manufact 238 Gypsum product manufacturing167 All other petroleum and coal products manufac 239 Abrasive product manufacturing168 Petrochemical manufacturing 240 Cut stone and stone product manufacturing169 Industrial gas manufacturing 241 Ground or treated minerals and earths manufac170 Synthetic dye and pigment manufacturing 242 Mineral wool manufacturing171 Other basic inorganic chemical manufacturing 243 Miscellaneous nonmetallic mineral products172 Other basic organic chemical manufacturing 244 Iron and steel mills173 Plastics material and resin manufacturing 245 Ferroalloy and related product manufacturing174 Synthetic rubber manufacturing 246 Iron- steel pipe and tube from purchased stee175 Cellulosic organic fiber manufacturing 247 Rolled steel shape manufacturing176 Steel wire drawing 248 Construction machinery manufacturing177 Alumina refining 249 Mining machinery and equipment manufacturing178 Primary aluminum production 250 Oil and gas field machinery and equipment179 Secondary smelting and alloying of aluminum 251 Sawmill and woodworking machinery180 Aluminum sheet- plate- and foil manufacturing 252 Plastics and rubber industry machinery181 Aluminum extruded product manufacturing 253 Paper industry machinery manufacturing182 Other aluminum rolling and drawing 254 Textile machinery manufacturing183 Primary smelting and refining of copper 255 Printing machinery and equipment manufacturin184 Primary nonferrous metal- except copper and a 256 Food product machinery manufacturing185 Copper rolling- drawing- and extruding 257 Semiconductor machinery manufacturing186 Copper wire- except mechanical- drawing 258 All other industrial machinery manufacturing187 Secondary processing of copper 259 Office machinery manufacturing188 Nonferrous metal- except copper and aluminum- 260 Optical instrument and lens manufacturing189 Secondary processing of other nonferrous 261 Photographic and photocopying equipment manuf190 Ferrous metal foundaries 262 Other commercial and service industry machine191 Aluminum foundries 263 Automatic vending- commercial laundry and dry192 Nonferrous foundries- except aluminum 264 Air purification equipment manufacturing193 Iron and steel forging 265 Industrial and commercial fan and blower manu194 Nonferrous forging 266 Heating equipment- except warm air furnaces195 Custom roll forming 267 AC- refrigeration- and forced air heating196 All other forging and stamping 268 Industrial mold manufacturing197 Cutlery and flatware- except precious- manufa 269 Metal cutting machine tool manufacturing198 Hand and edge tool manufacturing 270 Metal forming machine tool manufacturing199 Saw blade and handsaw manufacturing 271 Special tool- die- jig- and fixture manufactu200 Kitchen utensil- pot- and pan manufacturing 272 Cutting tool and machine tool accessory manuf201 Prefabricated metal buildings and components 273 Rolling mill and other metalworking machinery202 Fabricated structural metal manufacturing 274 Turbine and turbine generator set units manuf203 Plate work manufacturing 275 Other engine equipment manufacturing204 Metal window and door manufacturing 276 Speed changers and mechanical power transmiss205 Sheet metal work manufacturing 277 Pump and pumping equipment manufacturing206 Ornamental and architectural metal work manuf 278 Air and gas compressor manufacturing207 Power boiler and heat exchanger manufacturing 279 Measuring and dispensing pump manufacturing208 Metal tank- heavy gauge- manufacturing 280 Elevator and moving stairway manufacturing209 Metal can- box- and other container manufactu 281 Conveyor and conveying equipment manufacturin210 Hardware manufacturing 282 Overhead cranes- hoists- and monorail systems211 Spring and wire product manufacturing 283 Industrial truck- trailer- and stacker manufa212 Machine shops 284 Power-driven handtool manufacturing213 Turned product and screw- nut- and bolt manuf 285 Welding and soldering equipment manufacturing214 Metal heat treating 286 Packaging machinery manufacturing215 Metal coating and nonprecious engraving 287 Industrial process furnace and oven manufactu216 Electroplating- anodizing- and coloring metal 288 Fluid power cylinder and actuator manufacturi
A.2

Appendix A: IMPLAN Pro Categories
Description Description
289 Metal valve manufacturing 361 Fluid power pump and motor manufacturing290 Ball and roller bearing manufacturing 362 Scales- balances- and miscellaneous general p291 Small arms manufacturing 363 Electronic computer manufacturing292 Other ordnance and accessories manufacturing 364 Computer storage device manufacturing293 Fabricated pipe and pipe fitting manufacturin 365 Computer terminal manufacturing294 Industrial pattern manufacturing 366 Other computer peripheral equipment manufactu295 Enameled iron and metal sanitary ware manufac 367 Telephone apparatus manufacturing296 Miscellaneous fabricated metal product manufa 368 Broadcast and wireless communications equipme297 Ammunition manufacturing 369 Other communications equipment manufacturing298 Farm machinery and equipment manufacturing 370 Audio and video equipment manufacturing299 Lawn and garden equipment manufacturing 371 Electron tube manufacturing300 Semiconductors and related device manufacturi 372 Upholstered household furniture manufacturing301 All other electronic component manufacturing 373 Nonupholstered wood household furniture manuf302 Electromedical apparatus manufacturing 374 Metal household furniture manufacturing303 Search- detection- and navigation instruments 375 Institutional furniture manufacturing304 Automatic environmental control manufacturing 376 Other household and institutional furniture305 Industrial process variable instruments 377 Wood office furniture manufacturing306 Totalizing fluid meters and counting devices 378 Custom architectural woodwork and millwork307 Electricity and signal testing instruments 379 Office furniture- except wood- manufacturing308 Analytical laboratory instrument manufacturin 380 Showcases- partitions- shelving- and lockers309 Irradiation apparatus manufacturing 381 Mattress manufacturing310 Watch- clock- and other measuring and control 382 Blind and shade manufacturing311 Software reproducing 383 Laboratory apparatus and furniture manufactur312 Audio and video media reproduction 384 Surgical and medical instrument manufacturing313 Magnetic and optical recording media manufact 385 Surgical appliance and supplies manufacturing314 Electric lamp bulb and part manufacturing 386 Dental equipment and supplies manufacturing315 Lighting fixture manufacturing 387 Ophthalmic goods manufacturing316 Electric housewares and household fan manufac 388 Dental laboratories317 Household vacuum cleaner manufacturing 389 Jewelry and silverware manufacturing318 Household cooking appliance manufacturing 390 Sporting and athletic goods manufacturing319 Household refrigerator and home freezer manuf 391 Doll- toy- and game manufacturing320 Household laundry equipment manufacturing 392 Office supplies- except paper- manufacturing321 Other major household appliance manufacturing 393 Sign manufacturing322 Electric power and specialty transformer manu 394 Gasket- packing- and sealing device manufactu323 Motor and generator manufacturing 395 Musical instrument manufacturing324 Switchgear and switchboard apparatus manufact 396 Broom- brush- and mop manufacturing325 Relay and industrial control manufacturing 397 Burial casket manufacturing326 Storage battery manufacturing 398 Buttons- pins- and all other miscellaneous ma327 Primary battery manufacturing 399 Wholesale trade328 Fiber optic cable manufacturing 400 Air transportation329 Other communication and energy wire manufactu 401 Rail transportation330 Wiring device manufacturing 402 Water transportation331 Carbon and graphite product manufacturing 403 Truck transportation332 Miscellaneous electrical equipment manufactur 404 Transit and ground passenger transportation333 Automobile and light truck manufacturing 405 Pipeline transportation334 Heavy duty truck manufacturing 406 Scenic and sightseeing transportation and sup335 Motor vehicle body manufacturing 407 Postal service336 Truck trailer manufacturing 408 Couriers and messengers337 Motor home manufacturing 409 Warehousing and storage338 Travel trailer and camper manufacturing 410 Motor vehicle and parts dealers339 Motor vehicle parts manufacturing 411 Furniture and home furnishings stores340 Aircraft manufacturing 412 Electronics and appliance stores341 Aircraft engine and engine parts manufacturin 413 Building material and garden supply stores342 Other aircraft parts and equipment 414 Food and beverage stores343 Guided missile and space vehicle manufacturin 415 Health and personal care stores344 Propulsion units and parts for space vehicles 416 Gasoline stations345 Railroad rolling stock manufacturing 417 Clothing and clothing accessories stores346 Ship building and repairing 418 Sporting goods- hobby- book and music stores347 Boat building 419 General merchandise stores348 Motorcycle- bicycle- and parts manufacturing 420 Miscellaneous store retailers349 Military armored vehicles and tank parts manu 421 Nonstore retailers350 All other transportation equipment manufactur 422 Newpaper publishers351 Wood kitchen cabinet and countertop manufactu 423 Periodical publishers352 Book publishers 424 Other educational services353 Database- directory- and other publishers 425 Home health care services354 Software publishers 426 Offices of physicians- dentists- and other he355 Motion picture and video industries 427 Other ambulatory health care services356 Sound recording industries 428 Hospitals357 Radio and television broadcasting 429 Nursing and residential care facilities358 Cable networks and program distribution 430 Child day care services359 Telecommunications 431 Social assistance- except child day care serv360 Information services 432 Performing arts companies
A.3

Appendix A: IMPLAN Pro Categories
Description Description
433 Data processing services 472 Spectator sports434 Nondepository credit intermediation and rela 473 Independent artists- writers- and performers435 Securities- commodity contracts- investments 474 Promoters of performing arts and sports and a436 Insurance carriers 475 Museums- historical sites- zoos- and parks437 Insurance agencies- brokerages- and related 476 Fitness and recreational sports centers438 Funds- trusts- and other financial vehicles 477 Bowling centers439 Monetary authorities and depository credit in 478 Other amusement- gambling- and recreation ind440 Real estate 479 Hotels and motels- including casino hotels441 Automotive equipment rental and leasing 480 Other accommodations442 Video tape and disc rental 481 Food services and drinking places443 Machinery and equipment rental and leasing 482 Car washes444 General and consumer goods rental except vide 483 Automotive repair and maintenance- except car445 Lessors of nonfinancial intangible assets 484 Electronic equipment repair and maintenance446 Legal services 485 Commercial machinery repair and maintenance447 Accounting and bookkeeping services 486 Household goods repair and maintenance448 Architectural and engineering services 487 Personal care services449 Specialized design services 488 Death care services450 Custom computer programming services 489 Drycleaning and laundry services451 Computer systems design services 490 Other personal services452 Other computer related services- including fa 491 Religious organizations453 Management consulting services 492 Grantmaking and giving and social advocacy or454 Environmental and other technical consulting 493 Civic- social- professional and similar organ455 Scientific research and development services 494 Private households456 Advertising and related services 495 Federal electric utilities457 Photographic services 496 Other Federal Government enterprises458 Veterinary services 497 State and local government passenger transit459 All other miscellaneous professional and tech 498 State and local government electric utilities460 Management of companies and enterprises 499 Other State and local government enterprises461 Office administrative services 500 Noncomparable imports462 Facilities support services 501 Scrap463 Employment services 502 Used and secondhand goods464 Business support services 503 State & Local Education465 Travel arrangement and reservation services 504 State & Local Non-Education466 Investigation and security services 505 Federal Military467 Services to buildings and dwellings 506 Federal Non-Military468 Other support services 507 Rest of the world adjustment to final uses469 Waste management and remediation services 508 Inventory valuation adjustment470 Elementary and secondary schools 509 Owner-occupied dwellings471 Colleges- universities- and junior colleges
A.4

Appendix B: Patron Survey
Center for Economic Analysis: 88 Agriculture Hall, East Lansing, MI 48824 Phone: (517) 355-2153 Fax: (517) 432-1800
B.1
Thank you for agreeing to complete this survey. It should take approximately five minutes of your time to complete. This survey will help identify and quantify the economic impact of the Festival to the Region. The information you provide will remain completely confidential, and the results of the survey will only be released in the form of totals and percentages for large groups of people. 1. Including yourself, how many people are in your group today? Adults Children 1a. Your group includes: ( check all that apply) _____(2) Your Children _____(3) Friends/relatives (18 years or older) _____(4) Child(ren) of friends/relatives _____(5) Spouse/partner 2. What was the main transportation method you used to get to this event? ( check one) Car Car-pool Bike/Walk Bus Airplane Other__________ 3. Please check one. You live… 3a. Within 50 miles of the event grounds (Go to 4a and 4b below) 3b. Farther than 50 miles from the event grounds (Go to 5a and 5b below) Complete this section if you Marked 3a above only. That is if you live within 50 miles of the event grounds 4. If you marked 3a. above only. 4a. If the festival did not happen, would you have left the area for other entertainment? Yes No Don’t know 4b. if you left for other entertainment, how long would you have been gone? _________Days Complete this section if you Marked 3a above only. That is if you live farther than 50 miles of the event grounds 5. If you marked 3b. above only. 5a. How important was the event in you decision to come to the area?
Not
important Neutral Very
important
5b. How many nights will you stay in this area?________
Continue with question 6
Continue with question 6

Appendix B: Patron Survey
Center for Economic Analysis: 88 Agriculture Hall, East Lansing, MI 48824 Phone: (517) 355-2153 Fax: (517) 432-1800
B.2
6. Are you attending with friends/family who live 50 miles or farther from you? Yes No 7. How many hours do you plan on spending at the event today?_________ 8. How many total days do you plan to attend at this event this year?_________ 9. How many years have you attended this event?________ 10. In the spaces provided, please estimate the total expenditures in [replace with city] during this
visit. If a visitor to the region, what is your total expenditures during your stay? If a resident of the region, what is your expenditures associated with the event? Please include all spending made by you or likely to be made by you and all members of
your party including prepaid expenses. 10.a Motel, hotel cabin or B&B $
10.b Camping fees $
10.c Restaurants & bars $
10.d Groceries, take-out food/drinks $
10.e Fuel and other automobile expenses $
10.f Local transportation $
10.g Admissions & fees $
10.h Clothing $
10.i Gambling $
10.j Souvenirs and other expenses $ 11. May we contact you with a follow up survey about this trip? Yes No 12. If you responded Yes to question 11. above, please provide the best contact information where we
can contact you.
Name:
Mailing Address:
City, State, Zip
Phone:
( ) Thank you for your time and consideration. Your responses will provide us with valuable information as to how this event impacts your community.

Appendix C: Vendor Survey
Center for Economic Analysis: 88 Agriculture Hall, East Lansing, MI 48824 Phone: (517) 355-2153 Fax: (517) 432-1800
C.1
Thank you for agreeing to complete this survey. It should take approximately five minutes of your time to complete. This survey will help identify and quantify the economic impact of [Event Name] to the Region. The information you provide will remain completely confidential, and the results of the survey will only be released in the form of totals and percentages for large groups of people.
1. Including yourself, how many people are in your group today?_________ 2. Please indicate which category best describes your venture. Home Business Sole Proprietorship Joint Partnership or S-Corporation Corporation Non-profit Government Other (please describe)____________________________________________ 3. Your goal at this event is to ( check all that apply)
Sell a product Recruiting Sell a service Distribute Information Create sales leads Marketing
Other(please describe)________________________________________ 4. Please check one. You live or your firm is… 4a. Within 50 miles of the event grounds (Go to 5a and 5b below) 4b. Farther than 50 miles from the event grounds (Go to 6a and 6b below) Complete this section if you Marked 3a above only. That is if you live within 50 miles of the event grounds 5. If you marked 2a. above only. 5a. If the festival did not happen, would you have left the area for another venue? Yes No Don’t know 5b. if you left for another venue, how long would you have been gone? _________Days Complete this section if you Marked 3a above only. That is if you live farther than 50 miles of the event grounds 6. If you marked 3b. above only. 6a. How important was the event in you decision to come to the area?
Not
important Neutral Very
important
6b. How many nights will you stay in this area?________
Continue with question 7
Continue with question 7

Appendix C: Vendor Survey
Center for Economic Analysis: 88 Agriculture Hall, East Lansing, MI 48824 Phone: (517) 355-2153 Fax: (517) 432-1800
C.2
7. How many total days do you plan to present at this event this year?_________ 8. How many years have you contributed to this event?________ 9. In the spaces provided, please estimate the total expenditures in [replace with city] during this
visit. If a visitor to the region, what is your total local expenditures during your stay? If a resident of the region, what is your local expenditures associated with the event? Please include all spending made by you or likely to be made by you and all members of
your party including prepaid expenses. 9.a Motel, hotel cabin or B&B $
9.b Camping fees $
9.c Restaurants & bars $
9.d Groceries, take-out food/drinks $
9.e Fuel and other automobile expenses $
9.f Local transportation $
9.g Admissions & fees $
9.h Clothing $
9.i Gambling $
9.j Souvenirs and other expenses $
9.k Set-up, tent rental, and fixture rental $ 10. If you are selling goods or services please estimate total sales into the respective categories.
$______________ Sales to local residents
$______________ Sales to tourist attending the event 11. May we contact you with a follow up survey about this trip? Yes No 12. If you responded Yes to question 11. above, please provide the best contact information where we
can contact you.
Name:
Mailing Address:
City, State, Zip
Phone: ( ) Thank you for your time and consideration. Your responses will provide us with valuable information as to how this event impacts your community.