everyman’s deficit - mercatus
TRANSCRIPT

EvEryman’s DEficit:spending Beyond Our means
BrUcE yanDLE | JULy 2010
Bruce Yandle
Bruce Yandle is a distinguished adjunct professor of economics with the Mercatus Center atGeorge Mason University and dean emeritus of Clemson University’s College of Business andBehavioral Science.
Dr. Yandle is the author or coauthor of numerous works, including Taking the EnvironmentSeriously, The Political Limits of Environmental Quality Regulation, Environmental Use and theMarket, and most recently, Regulation by Litigation. He served as a member and chairman ofthe South Carolina State Board of Economic Advisors.
From 1976 to 1978, Dr. Yandle was a senior economist on the staff of the President’s Council on Wage and Price Stability, where he reviewed and analyzed newly proposed regulations. From 1982 to 1984, he was executive director of the Federal Trade Commission. Before entering a career in university teaching, Dr. Yandle was in the industrial machinery business in Georgia for fifteen years.
Dr. Yandle earned his PhD and MBA from Georgia State University and his AB degree from Mercer University.
MER
CA
TU
S C
ENT
ER A
T G
EOR
GE
MA
SON
UN
IVER
SIT
Y
1
EVERYMAN’S DEFICIT: Spending Beyond Our Means
EXECUTIVE SUMMARY
The United States is at a fiscal crossroads. Driven by taxpayer bailouts of banks, insur-ance companies, auto companies, and other financial institutions, as well as wars and economic stimulus to counter the “Great Recession,” the U.S. annual deficit has tripled since 2007. According to 2010 OMB estimates, the deficit will reach 1.4 trillion dollars this year, which is a whopping 10 percent of Gross Domestic Product (GDP).
A growing deficit and the related interest cost automatically add to total federal debt and increase the amount owed by each man, woman, and child in the U.S. population. In March 2010, the total federal debt stood at almost $14 trillion. With each person’s share of the debt now about $40,000, the debt and the deficit now belong to families like the Everymans.
Two combined forces yield a stout formula for endless deficits. To keep their jobs, politicians want to bring home the bacon to their constituents. This means they will almost always prefer increased spending to spending reductions. And to get (and keep) their jobs, politicians always promise not to raise taxes. The result is systematic defi-cits. Without constraints, the body politic will always tend to increase spending while avoiding the pain of raising taxes.
Reining in spending and reducing regulatory burdens along with increasing GDP growth can eventually close the deficit gap. But under the best of circumstances, this will take time. The budget deficit is still a commons; it is owed by all in general, but no one in particular. If meaningful progress occurs, it will be in spite of the normal politi-cal forces that cause politicians to want to bring home the bacon while never raising our taxes. There have been times and places where human communities organized themselves to avoid fiscal crises. It needs to happen again.
The author expresses appreciation to Adam Smith and Tate Watkins for research assistance.

EVER
YM
AN
’S D
EFIC
IT
2

MER
CA
TU
S C
ENT
ER A
T G
EOR
GE
MA
SON
UN
IVER
SIT
Y
3
CONTENTS
Executive Summary 1
1. Overspending, Deficits, and Debt: Who Cares? 5
1.1. Why Do We Get Deficits and Debt? 6
1.2. How This Paper Is Organized 6
2. Why Is Overspending the Norm? 7
Figure 1: Federal Deficit, 1940–2010 (Estimate), Billions of 2009 Dollars 8
2.1. Do We Always Spend More Than We Take In? 8
Figure 2: Federal Revenues and Outlays, 19-Year Increments, 1950–2009 9
Figure 3: Growth Rates of Revenues and Outlays, Five-Year Moving Average, 1970–2008 9
Figure 4: Gross Federal Debt Per Capita, 1940–2010 (Estimate), 2009 Dollars 10
Figure 5: Per Capita Gross Federal Debt as Share of Per Capita Income, 1969–2009 11
2.2. Why the Post-1970s Deficit Growth? 11
Figure 6: Federal Government Spending on Traditional Functions and Welfare and Social Programs as a Percentage of Total Expenditures, 1962–2015 (Estimate) 12
2.3. How Deficits Change the Composition of Government Services 12
3. The Everyman Family: So What? 14
3.1. Private Enterprise, Charity, and Financial-Market Effects 14
Figure 7: Number of Pages in the Federal Register, 1940–2009 17
3.2. Deficits, Regulation, and a Muffled Economy 17
Figure 8: Real GDP Growth, 1948Q1–2009Q4, Four-Quarter Moving Average with Trend Line 19
3.3. Taxpayer-Supported Debt Is Larger Than “Official” Federal Debt 19
4. President Obama: Doing Something about the Deficit Habit 20
4.1. What the Polls Tell Us 20
Figure 9: Percentage of Respondents Noting Federal Budget Deficit as Most Important Problem Facing the United States. 21
Figure 10: Budget Deficit as a Percentage of Real GDP 22
4.2. The Bipartisan Deficit Commission and the 3 Percent Constraint 22
Figure 11: Deficits as a Percentage of GDP, G-20 Countries 2007, 2010 (estimated), and 2014 24
4.3. Crossing the Red Line 24
5. At the Crossroads: What Now? 25
5.1. Looking for Golden Handcuffs 25
5.2. Putting on the Golden Handcuffs 26
6. Final Thoughts 27

EVER
YM
AN
’S D
EFIC
IT
4

MER
CA
TU
S C
ENT
ER A
T G
EOR
GE
MA
SON
UN
IVER
SIT
Y
5
1. OVERSPENDING, DEFICITS, AND DEBT: WHO CARES?
According to 2010 Office of Management and Budget (OMB) estimates, the federal government’s deficit will reach $1.4 trillion this year—a whopping 10 percent of gross domestic product (GDP).1 Ten percent may not sound like a lot, but it is the high-est level of debt relative to GDP since 1945. And, of course, 1945’s huge debt was built up winning World War II. Today, driven by taxpayer bailouts of banks, insurance companies, auto makers, and other finan-cial institutions, as well as by wars and economic stimuli to counter the “Great Recession,” our annual deficit has tripled just since 2007. But the United States had a large underlying debt long before 2007. Spending beyond our means, deficits, and debt seem to be part of the U.S. government habit. It is just that the numbers have exploded in the last few years.
In 2008, total interest paid on the federal debt was $252 billion, almost 8.5 percent of the federal bud-get.2 This sounds like a lot of money, and it is. But consider this: In 2008, the Everymans, a family with two children, earned an income of $78,767, which was exactly the nation’s median income for a family like theirs.3 They and the median family paid $4,767 in federal income taxes. The Everymans’ 8.5 percent of taxes devoted to interest on the federal debt turns out to be $406—not a huge amount of money in the great scheme of things. But the Everymans never get a statement telling them how much the federal debt costs them—or worse, what today’s decisions are going to cost them in the future. If they did, based on the rate of spending going on today, that statement would terrify them.
Should the Everymans be worried? I think so.
Most Americans do not yet understand the implica-tions of past excessive spending and the resulting high levels of debt, but the time for understanding is fast approaching. As our debt rises to 100 per-cent of our annual income and rating agencies such as Moody’s and Standard and Poor’s begin to send warnings about our profligate ways, more of us will become alarmed. Things will be even worse when some of the countries now buying our debt begin to require much higher interest rates.
The growing deficit and the related interest auto-matically add to the total federal debt and to the amount owed by each man, woman, and child in the U.S. population. In March 2010, the total federal debt stood at almost $14 trillion. Each person’s share of the debt is now about $40,000—that’s getting to be real money!
How many people list $40,000—their part of the federal deficit—as a liability on their personal bal-ance sheets when applying for a loan and tallying their net worth? And how many people gather the family around the kitchen table each year and pore over government reports to see how much the family owes as its share? How many people leave notes in their wills instructing their heirs to set aside part of the estate to cover their portion of the national debt?
None.
1. Office of Management and Budget, Budget of the United States Government, Fiscal Year 2011” (Washington, DC: U.S. Gorernment
Printed Office (GPO), February 1, 2010), http://www.whitehouse.gov/omb/budget/historicals.
2. Ibid.
3. Tax Policy Center, “Historical Federal Income Tax Rates for a Family of Four” (Washington, DC: Urban Institute and Brookings Institution,
2010), http://www.taxpolicycenter.org/taxfacts/displayafact.cfm?Docid=226.

EVER
YM
AN
’S D
EFIC
IT
6
1.1. Why Do We Get Deficits and Debt?
Mr. and Mrs. Everyman hear about deficits con-stantly, but it is doubtful that they feel obligated for any real part of them. And why should they? Deficits emerge from a budgetary commons.4 A commons is a kind of no-man’s-land; it is a valuable resource not subject to property rights or other rules to ration its use and so maintain the underlying resource. A com-mons is everyone’s property and therefore no one’s property. No one individual has his or her name on a piece of the deficit, but everyone collectively owes it. Since no one really has individual responsibility for caring for them, commons are typically not man-aged very well; deficits are no exception. Indeed, the incentives involved work in the opposite direction. It pays each individual to gain as much from defi-cits as possible, a behavior Garrett Hardin famously described as a “tragedy of the commons.”5 Hardin predicted that, left unattended, the ability of a com-mons to produce life and wealth would be destroyed. He also recognized that people are pretty smart; they generally find ways to address a commons problem before the problem destroys them.
There is another reason the Everymans might not be too worried. They believe that as long as the debt can be financed—as long as people somewhere will lend to America—we can go on issuing new debt to pay off old, selling bonds to cover any expansion, and living in debt. Of course, the Everymans know that interest on debt has to be paid. They see their credit card statements each month. There is far more to the story, however, when it comes to government over-spending and debt.
1.2 How This Paper Is Organized
Overspending, deficits, and debt. Why? How do they happen? What difference do they make? What can be done? We face a lot of questions. To begin to address these questions, this paper’s next section offers a public choice explanation for systematic over-spending and reviews data that show how growth in spending has typically outpaced revenue growth to generate red ink.6 The section shows that deficits have an almost invisibly slow but ultimately massive effect on what our government does, how it operates, and how we, as citizens, adapt to the changed politi-cal economy.
Section 3 relates the effects of overspending, deficits, and debt to the Everyman family, speaks to crowd-ing-out effects that occur when government expands activities, and shows how federal regulation is fed partially by borrowed money. The overall effect is slower economic growth. And Americans face still more debt risk from government-sponsored enter-prises and federal deposit insurance.
Section 4 focuses on actions proposed by President Barack Obama and other options that might be con-sidered for dealing with the yawning deficit. Section 5 addresses the difficult choices we face, some options for dealing with the deficit crisis, and the need to equip politicians with golden handcuffs that will restrict their tendency to overspend. Finally, section 6 offers some closing thoughts.
4. Earl R. Brubaker, “The Tragedy of the Public Budgetary Commons,” The Independent Review 1, no. 3 (1997): 353–71.
5. Garrett Hardin, “The Tragedy of the Commons,” Science 162, no. 3859 (1968): 1243–48.
6. Public Choice is a branch of economics that studies political institutions using standard microeconomic tools to explain how individual
incentives shape policies. The approach assumes that when making public choices, politicians behave just as they and others do when mak-
ing private choices; they seek to satisfy their personal goals and ambitions. This means that keeping their jobs is important to them. Public
Choice then assumes that to keep their jobs, politicians will seek opportunities to provide concentrated benefits to key constituencies at public
expense, which means spreading the cost of those benefits across a vast number of taxpayers.
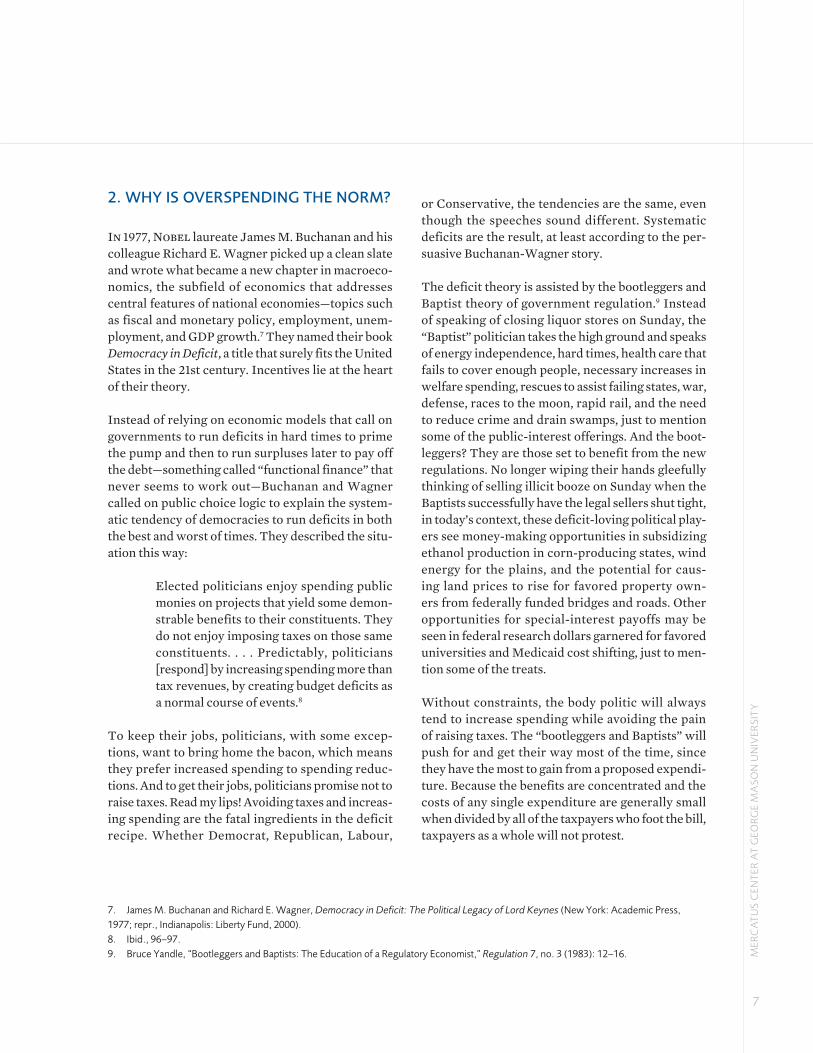
2. WHY IS OVERSPENDING THE NORM?
In 1977, Nobel laureate James M. Buchanan and his colleague Richard E. Wagner picked up a clean slate and wrote what became a new chapter in macroeco-nomics, the subfield of economics that addresses central features of national economies—topics such as fiscal and monetary policy, employment, unem-ployment, and GDP growth.7 They named their book Democracy in Deficit, a title that surely fits the United States in the 21st century. Incentives lie at the heart of their theory.
Instead of relying on economic models that call on governments to run deficits in hard times to prime the pump and then to run surpluses later to pay off the debt—something called “functional finance” that never seems to work out—Buchanan and Wagner called on public choice logic to explain the system-atic tendency of democracies to run deficits in both the best and worst of times. They described the situ-ation this way:
Elected politicians enjoy spending public monies on projects that yield some demon-strable benefits to their constituents. They do not enjoy imposing taxes on those same constituents. . . . Predictably, politicians [respond] by increasing spending more than tax revenues, by creating budget deficits as a normal course of events.8
To keep their jobs, politicians, with some excep-tions, want to bring home the bacon, which means they prefer increased spending to spending reduc-tions. And to get their jobs, politicians promise not to raise taxes. Read my lips! Avoiding taxes and increas-ing spending are the fatal ingredients in the deficit recipe. Whether Democrat, Republican, Labour,
or Conservative, the tendencies are the same, even though the speeches sound different. Systematic deficits are the result, at least according to the per-suasive Buchanan-Wagner story.
The deficit theory is assisted by the bootleggers and Baptist theory of government regulation.9 Instead of speaking of closing liquor stores on Sunday, the “Baptist” politician takes the high ground and speaks of energy independence, hard times, health care that fails to cover enough people, necessary increases in welfare spending, rescues to assist failing states, war, defense, races to the moon, rapid rail, and the need to reduce crime and drain swamps, just to mention some of the public-interest offerings. And the boot-leggers? They are those set to benefit from the new regulations. No longer wiping their hands gleefully thinking of selling illicit booze on Sunday when the Baptists successfully have the legal sellers shut tight, in today’s context, these deficit-loving political play-ers see money-making opportunities in subsidizing ethanol production in corn-producing states, wind energy for the plains, and the potential for caus-ing land prices to rise for favored property own-ers from federally funded bridges and roads. Other opportunities for special-interest payoffs may be seen in federal research dollars garnered for favored universities and Medicaid cost shifting, just to men-tion some of the treats.
Without constraints, the body politic will always tend to increase spending while avoiding the pain of raising taxes. The “bootleggers and Baptists” will push for and get their way most of the time, since they have the most to gain from a proposed expendi-ture. Because the benefits are concentrated and the costs of any single expenditure are generally small when divided by all of the taxpayers who foot the bill, taxpayers as a whole will not protest.
MER
CA
TU
S C
ENT
ER A
T G
EOR
GE
MA
SO
N U
NIV
ERSI
TY
7
7. James M. Buchanan and Richard E. Wagner, Democracy in Deficit: The Political Legacy of Lord Keynes (New York: Academic Press,
1977; repr., Indianapolis: Liberty Fund, 2000).
8. Ibid., 96–97.
9. Bruce Yandle, “Bootleggers and Baptists: The Education of a Regulatory Economist,” Regulation 7, no. 3 (1983): 12–16.

But what constrains the political process when gen-erating more spending and more deficits? In earlier times, social norms said the public weal should be managed the way people manage their households. Across time, you balance the books. If you must go into debt, you do so only in emergencies or to pur-chase assets that will produce long-term benefits. Social norms matter a lot, but they can gradually be eroded when people learn that life can go on when the old rules are broken. With a new ethic in place—one that says that deficits are okay even when used to fund tomorrow’s expenditures on food, housing, and health care—the old constraints are relaxed. From time to time, after serious bouts with deficits and other fiscal problems, politicians will shut down the punch bowl and write laws that handcuff those who want to spend more. Somehow, the constraints always turn out to be temporary.
2.1 Do We Always Spend More Than We Take In?
Data support the assertion that there is a system-atic tendency to overspend. Figure 1 shows the record for annual federal budget deficits and surpluses from 1940 to an estimate for 2010. These OMB data are in 2009 constant dollars.10 The figure shows deficits above the line and surpluses below; it is easy to pick out the brief periods of surplus because there are few.
A quick scan of the figure shows the deficits asso-ciated with World War II in the 1940s and reveals how quickly the U.S. government reined in spending following the war. Yet, in the 1950s and 1960s, the government still had a tendency to run deficits with high frequency. The late 1970s appear to mark the beginning of a new age for deficits. The magnitudes grow larger until the turn of the century brings a brief
FIGURE 1: FEDERAL DEFICIT, 1940–2010 (ESTIMATE), BILLIONS OF 2009 DOLLARS
Source: Author’s calculations based on OMB, Budget of the United States Government, Fiscal Year 2011 (Washington, DC: U.S. Government Printing Office, February 1, 2010), table 1.3, http://www.whitehouse.gov/omb/budget/historicals.
-$400
-$200
$0
$200
$400
$600
$800
$1,000
$1,200
$1,400
$1,600
1940 1950 1960 1970 1980 1990 2000
Figure 1: Federal Deficit: 1040--2010e Billions of 2009 Dollars
20
09
Do
llars
(B
illio
ns)
EVER
YM
AN
’S D
EFIC
IT
8
Year
2010
10. Constant dollars are dollars adjusted for inflation, unlike current dollars. This means, for example, that 1940 dollar amounts can be com-
pared directly with 1990 amounts. In each case, a dollar has the same amount of purchasing power.

period of surpluses. Since then, the deficit machine has been operating in overdrive.
The deficits and surpluses shown in figure 1 repre-sent the difference between two very large numbers. One of those numbers is revenues; these come from all economic activity that generates taxable income. The other number, which is subtracted from the
first to find the deficit, is federal outlays, or the total spending generated when congressionally autho-rized expenditures occur. The difference between these numbers can expand or contract for multiple reasons, including changes in the tax code, restric-tions on spending, and economic recessions, recover-ies, and expansions.
FIGURE 2: FEDERAL REVENUES AND OUTLAYS, 19-YEAR INCREMENTS, 1950–2009
FIGURE 3: GROWTH RATES OF REVENUES AND OUTLAYS, FIVE-YEAR MOVING AVERAGE, 1970–2008
Source: Author’s calculations based on OMB, Budget of the United States Government, Fiscal Year 2011 (Washington, DC: GPO, February 1, 2010), table 1.3, http://www.whitehouse.gov/omb/budget/historicals.
Source: Author’s calculations based on OMB, Budget of the United States Government, Fiscal Year 2011 (Washington, DC: GPO, February 1, 2010), table 1.3, http://www.whitehouse.gov/omb/budget/historicals.
0
10
20
30
40
50
60
1950-69 Receipts
1950-69 Outlays
1970-89 Receipts
1970-89 Outlays
1990-09 Receipts
1990-09 Outlays
Trill
ion
2009
Dol
lars
Figure 2: Federal Receipts and Outlays 19-Year Increments
Source: Author's calculations based on OMB data (2010, Table 1.3). 1789–18491850–19001901190219031904190519061907190819091910191119121913191419151916191719181919192019211922192319241925192619271928
Table 1.1—SUMMARY OF RECEIPTS, OUTLAYS, AND SURPLUSES OR DEFICITS (−): 1789–2015(in millions of dollars)
Year
-3%
-2%
-1%
0%
1%
2%
3%
4%
5%
6%
7%
1970 1980 1990 2000
Gro
wth
Rat
e
Figure 3: Receipts and Outlays Growth, 5 -Year Moving Average, 1970--2008
Receipts
Outlays
!"#$%&'()#*+"$,-(%./%#/.0"1-(2.-&3("1(456(3.*.(789:9;(<.2/&(:=>?=(
Revenues
Outlays
1950–69Revenues
2009
Dol
lars
(Tri
llion
)
1950–69Outlays
1970–89Revenues
1970–89Outlays
1990–2009Revenues
1990–2009Outlays
MER
CA
TU
S C
ENT
ER A
T G
EOR
GE
MA
SO
N U
NIV
ERSI
TY
9
$60
$50
$40
$30
$20
$10
$0
1789–18491850–19001901190219031904190519061907190819091910191119121913191419151916191719181919192019211922192319241925192619271928
Table 1.1—SUMMARY OF RECEIPTS, OUTLAYS, AND SURPLUSES OR DEFICITS (−): 1789–2015(in millions of dollars)
Year
-3%
-2%
-1%
0%
1%
2%
3%
4%
5%
6%
7%
1970 1980 1990 2000
Gro
wth
Rat
e
Figure 3: Receipts and Outlays Growth, 5 -Year Moving Average, 1970--2008
Receipts
Outlays
!"#$%&'()#*+"$,-(%./%#/.0"1-(2.-&3("1(456(3.*.(789:9;(<.2/&(:=>?=(
Revenues
Outlays
1950–69Revenues
2009
Dol
lars
(Tri
llion
)
1950–69Outlays
1970–89Revenues
1970–89Outlays
1990–2009Revenues
1990–2009Outlays
MER
CA
TU
S C
ENT
ER A
T G
EOR
GE
MA
SO
N U
NIV
ERSI
TY
9
$60
$50
$40
$30
$20
$10
$0

EVER
YM
AN
’S D
EFIC
IT
10
Still, a question remains: Are U.S. deficits caused more by slower growth in revenues or faster growth in expenditures? We can begin to answer this ques-tion by examining figure 2, which reports real revenues and outlays for three 19-year periods: 1950–1969, 1970–1989, and 1990–2009. Although both revenues and outlays grow over each period, outlays exceed revenue every time. There is a small deficit gap in the first period, and the gap expands in the second and third periods.
Of course, this figure could reflect a bias based on the years selected for examination. We get a closer look at the budget process that generated the defi-cit gaps from 1970 forward in figure 3, which shows a five-year moving average annual growth rate for federal government outlays and revenues. The mov-ing average simply smoothes some of the sharp peaks and valleys.
The figure reveals jagged outlay growth rates that rise in the 1970s and then begin a long, uneven descent through the 1980s and into the 1990s. The outlay growth rate accelerates from 1995 forward, reaching a post-1970 high in 2008. The outlay growth
rate is positive for all 39 years shown in the figure. Federal expenditures are always growing.
The revenue growth rate, which reveals periods when income taxes rose and fell and times of reces-sion and recovery, varies much more widely than the outlay growth rate. A high rate of revenue growth reveals the tax increases and prosperity of the 1990s. A period of tax cuts and recession that relate to fall-ing receipts after 2001 follows this growth. Then, revenue growth rates rise after economic recovery begins and continue to rise until the financial-market meltdown and “Great Recession,” which began in December 2007. Since then, we see declining growth rates. The revenue growth rate was negative for four of the 39 years reported in the figure.
From these data, we can conclude that U.S. federal debt is more about excessive spending than insuffi-cient revenues.
To summarize, an examination of federal revenues and expenditures from 1950 forward tells us that def-icits are a systematic part of the budgeting process. A closer look at the last 39 years tells us that the 1970s
FIGURE 4: GROSS FEDERAL DEBT PER CAPITA, 1940–2010 (ESTIMATE), 2009 DOLLARS
Author’s calculations based on OMB, Budget of the United States Government, Fiscal Year 2011 (Washington, DC: GPO, February 1, 2010), table 1.3, http://www.whitehouse.gov/omb/budget/historicals.
$0
$5,000
$10,000
$15,000
$20,000
$25,000
$30,000
$35,000
$40,000
$45,000
1940 1950 1960 1970 1980 1990 2000
Figure 4: Gross Federal Debt Per Capita, 1940-2010e, $2009
2010
20
09
Do
llars
Year

MER
CA
TU
S C
ENT
ER A
T G
EOR
GE
MA
SO
N U
NIV
ERSI
TY
11
0%
20%
40%
60%
80%
100%
1969 1979 1989 1999 2009
Perc
ent
Year
Figure 5: Per Capita Gross Federal Debt as share of Per Capita Income
and early 1980s defined a time when the growth rate of real outlays far exceeded the growth of revenues. We see a similar pattern from 2000 to 2008. War, a deep recession, and extended unemployment char-acterize the more recent period. Part of the current deficit picture is driven by emergency actions that may be considered temporary even if the debt is not. Even so, there is a structural deficit in the political process that does not seem to go away.
2.2. Why the Post-1970s Deficit Growth?
What happened in the early 1970s that may have triggered so much spending? We can point to the beginning of major health, housing, nutrition, and urban-renewal initiatives associated with the ramp-ing up of the Great Society programs. These were followed by an expansion of urban-transportation and water-and-sewer programs and a correspond-ing expansion of newly born agencies to oversee the expanding programs. These agencies include the Office of Housing and Urban Development, the U.S. Environmental Protection Agency, the Occupational Health and Safety Administration, the
Department of Energy, and the National Highway Safety Administration. And, of course, there were wars that called for funding. When the deficit num-bers were divided by the population, the amount of debt per capita, again stated in 2009 dollars, rose from $5,800 in 1940 to $38,600 in 2010, an almost sevenfold increase. Figure 4 shows this increase.
Another picture develops when the debt per capita is considered as a share of per capita income. The next chart shows this relationship. Yes, real per capita income has been rising, but not as fast as per capita debt. As indicated in figure 5, the debt burden is approaching 100 percent of per capita income. This means that if the federal debt had to be paid in the coming year, it would take every dime earned on average by every man, woman, and child in the United States to balance the books.
No one is talking about a great day of reckoning when the debt might come due and have to be paid off all at once, but it is wise for us to understand what has hap-pened to the amount we owe in just the last 40 years. Figure 5 tells the tale, and it is not pretty.
FIGURE 5: PER CAPITA GROSS FEDERAL DEBT AS SHARE OF PER CAPITA INCOME, 1969–2009
Source: Author’s calculations based on OMB, Budget of the United States Government, Fiscal Year 2011 (Washington, DC:GPO, February 1, 2010), table 7.1, http://www.whitehouse.gov/omb/budget/historicals; and Bureau of Economic Analysis, “Regional Economic Accounts: State Annual Personal Income” (U.S. Department of Commerce, Washington, DC, 2010), http://www.bea.gov/regional/spi.

EVER
YM
AN
’S D
EFIC
IT
12
2.3. How Deficits Change the Composition of Government Services
The overspending story predicts systematic growth in deficits and more. With deficit-inspired government expansion of consumer services, people shopping for services can choose attractively priced, government-subsidized offerings. The perceived price at the margin for these services is often zero! People do not have to pay a dime to receive the ben-efit. As a result, subsidized food, housing, health care, education, and transportation services, just to name some larger items, crowd out private-sector offerings. With the link broken between paying and receiving, consumers of government-subsidized and government-provided services are no longer informed about the real costs of their behavior. The ensuing lack of competition among providers breaks the link between providing service and earning patronage on the supply side of the market. Because the price and costs of government-provided services are disguised, broad-based government services tend to squeeze out more specialized private providers. The structure of economic activity changes as defi-cits and debt expand the public sector.
Another consequence of increased government spending on what can be called consumer goods and services is that the share spent on traditional govern-ment activities has to be smaller. It is also possible that the amount spent on parks, bridges, and trans-portation services—and the quality of the services provided—falls below what voters or consumers actually want. Since government provides complex and large bundles of goods and services, voters can-not easily open the bundle and alter a few preferred parts. Meanwhile, politicians hoping to be reelected understandably become more focused on deliver-ing broad-based services that the recipients can see, feel, and consume during an elected politician’s brief term. As a result, subsidized food, shelter, and health care services may become more important to politicians than improving transportation sys-tems, modifying old bridges, and even providing national defense.
Let us consider some data and then return to the discussion about the government bundle of goods and services. In 2007, Jody Lipford and Jerry Slice studied federal-government spending patterns from
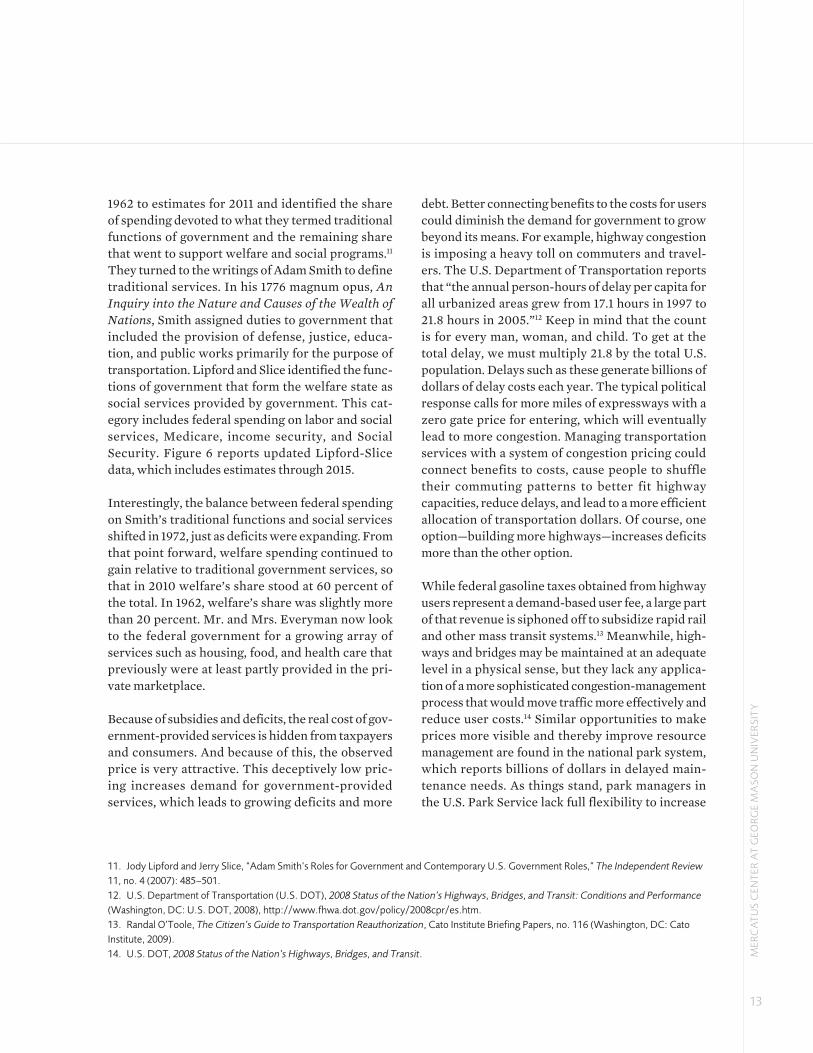
FIGURE 6: FEDERAL GOVERNMENT SPENDING ON TRADITIONAL FUNCTIONS AND WELFARE AND SOCIAL PROGRAMS AS A PERCENTAGE OF TOTAL EXPENDITURES, 1962–2015 (ESTIMATE)
Source: Jody Lipford and Jerry Slice, “Adam Smith’s Roles for Government and Contemporary U.S. Government Roles,” The Independent Review 11, no. 4 (2007): 485–501 with author’s updates using OMB, Budget of the United States Government, Fiscal Year 2011 (Washington, DC:GPO, February 1, 2010), http://www.whitehouse.gov/omb/budget/historicals.
Figure 6: Federal Government Spending on Smith's Traditional Duties and Social Expenditures as a Percent of
Total Expenditures, 1962-2015 Estimate
Share
%
Source: Lipford and Slice (2005) with author's updates using OMB data (2010).
Traditional functions
Welfare and social programs
MER
CA
TU
S C
ENT
ER A
T G
EOR
GE
MA
SO
N U
NIV
ERSI
TY
13
1962 to estimates for 2011 and identified the share of spending devoted to what they termed traditional functions of government and the remaining share that went to support welfare and social programs.11 They turned to the writings of Adam Smith to define traditional services. In his 1776 magnum opus, An Inquiry into the Nature and Causes of the Wealth of Nations, Smith assigned duties to government that included the provision of defense, justice, educa-tion, and public works primarily for the purpose of transportation. Lipford and Slice identified the func-tions of government that form the welfare state as social services provided by government. This cat-egory includes federal spending on labor and social services, Medicare, income security, and Social Security. Figure 6 reports updated Lipford-Slice data, which includes estimates through 2015.
Interestingly, the balance between federal spending on Smith’s traditional functions and social services shifted in 1972, just as deficits were expanding. From that point forward, welfare spending continued to gain relative to traditional government services, so that in 2010 welfare’s share stood at 60 percent of the total. In 1962, welfare’s share was slightly more than 20 percent. Mr. and Mrs. Everyman now look to the federal government for a growing array of services such as housing, food, and health care that previously were at least partly provided in the pri-vate marketplace.
Because of subsidies and deficits, the real cost of gov-ernment-provided services is hidden from taxpayers and consumers. And because of this, the observed price is very attractive. This deceptively low pric-ing increases demand for government-provided services, which leads to growing deficits and more
debt. Better connecting benefits to the costs for users could diminish the demand for government to grow beyond its means. For example, highway congestion is imposing a heavy toll on commuters and travel-ers. The U.S. Department of Transportation reports that “the annual person-hours of delay per capita for all urbanized areas grew from 17.1 hours in 1997 to 21.8 hours in 2005.”12 Keep in mind that the count is for every man, woman, and child. To get at the total delay, we must multiply 21.8 by the total U.S. population. Delays such as these generate billions of dollars of delay costs each year. The typical political response calls for more miles of expressways with a zero gate price for entering, which will eventually lead to more congestion. Managing transportation services with a system of congestion pricing could connect benefits to costs, cause people to shuffle their commuting patterns to better fit highway capacities, reduce delays, and lead to a more efficient allocation of transportation dollars. Of course, one option—building more highways—increases deficits more than the other option.
While federal gasoline taxes obtained from highway users represent a demand-based user fee, a large part of that revenue is siphoned off to subsidize rapid rail and other mass transit systems.13 Meanwhile, high-ways and bridges may be maintained at an adequate level in a physical sense, but they lack any applica-tion of a more sophisticated congestion-management process that would move traffic more effectively and reduce user costs.14 Similar opportunities to make prices more visible and thereby improve resource management are found in the national park system, which reports billions of dollars in delayed main-tenance needs. As things stand, park managers in the U.S. Park Service lack full flexibility to increase
11. Jody Lipford and Jerry Slice, “Adam Smith’s Roles for Government and Contemporary U.S. Government Roles,” The Independent Review
11, no. 4 (2007): 485–501.
12. U.S. Department of Transportation (U.S. DOT), 2008 Status of the Nation’s Highways, Bridges, and Transit: Conditions and Performance
(Washington, DC: U.S. DOT, 2008), http://www.fhwa.dot.gov/policy/2008cpr/es.htm.
13. Randal O’Toole, The Citizen’s Guide to Transportation Reauthorization, Cato Institute Briefing Papers, no. 116 (Washington, DC: Cato
Institute, 2009).
14. U.S. DOT, 2008 Status of the Nation’s Highways, Bridges, and Transit.
EVER
YM
AN
’S D
EFIC
IT
14
gate fees to match consumer demand with the cost of providing recreational services. In general, federal park managers do not get to keep gate-fee revenues that might then be channeled directly to park improvements.15
In 2005, the U.S. Government Accountability Office (GAO) took a broad view of federal-government activities and examined what the agency termed the base functions of government.16 Among the 12 items examined were defense, education, and transporta-tion, functions included in Adam Smith’s definition of basic government activities. The GAO did not offer specific recommendations for dollar changes in these areas, but instead raised probing questions about how government might restructure efforts to sup-port a 21st century economy. For defense, the larger questions related to reshaping a rapidly growing defense enterprise to provide security for the home-land while engaging in antiterrorism efforts world-wide. Suggested transportation reforms included considering new technologies for managing urban transportation systems with congestion pricing. And education reforms addressed the need for basic data to examine and assess welfare programs tar-geted to support young schoolchildren. Apparently, federal education programs have grown rapidly but lack a coordinated way to assess their effective-ness. In a way, the GAO report signals the difficulty faced when deficit-subsidized government services expand so rapidly that we lose the ability to know what is being done and how government-provided services can be improved.
3. THE EVERYMAN FAMILY: SO WHAT?
We have seen that systematic U.S. federal govern-ment overspending has generated a high debt burden for the Everyman family. Along with the heavier debt
has come a bias toward consumption and away from private investment, plus dimmer prospects for future wealth creation. These findings begin to speak to the question: So what? But we have more crowding out to consider.
Crowding out can occur when federally provided services compete with private firms, charities, and religious organizations in serving community needs. Since private firms, charities, and religious groups cannot print money and continuously run deficits, they may shrink to make room for better-funded fed-eral programs. Few people may realize that expan-sion of government welfare services reduces the field of service for private charities and religious organi-zations. The need to finance a growing federal debt can also crowd out private borrowers who compete for the same pool of savings that may be invested in either government or private bonds and equities, depending on interest rates and relative risk. At the margin, the share of the economy controlled and managed by government expands.
Because these crowding-out effects occur slowly, hardly anyone is concerned enough to sound an alarm, but eventually people will become aware of more congested highways, lagging public-transpor-tation systems, longer lines at health care centers, and deteriorating national parks.
3.1 Private Enterprise, Charity, and Financial-Market Effects
Entrepreneurial government agents are like operators of entrepreneurial firms. When they sense a growing demand for their services, they tend to expand beyond their initial product and service offerings and beyond their initial markets. Unlike private firms that face a bankruptcy constraint, an
15. Brian Yablonski, The National Parks: America’s Best Idea, PERC Reports 27, no. 3 (Bozeman, MT: Property and Environment Research
Center, 2009), http://www.perc.org/articles/article1191.php.
16. U.S. Government Accountability Office (GAO), 21st Century Challenges: Reexamining the Base of the Federal Government, GAO-05-
325SP (Washington, DC: GAO, February 2009).
MER
CA
TU
S C
ENT
ER A
T G
EOR
GE
MA
SO
N U
NIV
ERSI
TY
15
expanding government agency can enter markets and support services that might not be provided by firms and individuals who otherwise must find ways to cover the full cost of their activities. This leads to competitive challenges that are difficult for private firms to meet. For example, producers of unsubsi-dized, fuel-efficient, diesel-equipped automobiles must compete with builders of hybrid or electric vehicles that receive large government subsidies. When purchasing an automobile, consumers sim-ply look at the negotiated price they pay; they do not consider the subsidy they and someone else may be paying in taxes.
As another example, operators of daycare services provided privately for a fee may find themselves com-peting with public-sector providers who charge no fee. The private provider may choose not to expand, to contract, or even to go out of business in the face of public-sector competition. Businesses that may have previously served niche markets for particular products, neighborhoods, or ethnic groups may give way to subsidized enterprises that must follow a stan-dard government recipe. As a result, competition in the market is chilled or distorted. The definition of the appropriate product or service becomes altered, since politically organized providers must appeal to voters and respond to organized interest groups. This political behavior will tend to eclipse the former private provider’s necessity to earn voluntary patron-age in each market served. Creativity and innovation previously based on attempts to contain cost and gain paying customers are modified to attract political support and increase budget allocations.
Government expansion of activities that previously represented the work areas of charitable not-for-profit organizations can also lead to some interest-ing substitution effects. In some cases, the private
producer will shift to make room for taxpayer- (or deficit-) supported welfare activities. In other cases, the not-for-profit firms will be absorbed by the gov-ernment and become public providers. Economists have attempted to estimate these effects. In his 2008 survey of related literature, James Andreoni reports that some studies show no crowding out; others show that private charities expand with increased government activities; and still other studies show that for every additional dollar of public support that goes to an activity area, there is a two-dollar reduc-tion in privately supported activity.17 To explain these outcomes, some analysts point out that the people who lobby government for expanded services are the same people who support private charities. In other words, they may either look for ways to expand the total level of charity activities, which leads to some or no crowding out, or seek ways to substitute taxpayer funding for activities that were previously supported with private money, which leads to sig-nificant crowding out.
In an investigation of private versus public produc-tion, J. Stephen Ferris and Edwin G. West examined the effect on private charitable donations to needy individuals when the federal government expands programs that target the same category of individu-als.18 They argued that local private organizations, being closer to the needy, are better able to assess individual situations and to tailor donations to match individual needs. Government programs, on the other hand, are more likely to take a more uniform approach. The two authors refer to other research that estimates the government’s cost of obtaining an additional dollar of tax revenues and then transform-ing the dollar into potential welfare benefits. They note that it generally costs the government $1.60 to provide $1.00 in benefits through a federal program.19 To obtain tax revenues, the government must operate
17. James Andreoni, “Charitable Giving,” in The New Palgrave Dictionary of Economics, 2nd ed., Steven N. Durlauf and Lawrence E. Blume,
(New York: Palgrave Macmillan, 2008), http://econ.ucsd.edu/~jandreon/WorkingPapers/Palgrave%20on%20Charitable%20Giving.pdf.
18. J. Stephen Ferris and Edwin G. West, “Private versus Public Charity: Reassessing Crowding Out from the Supply Side,” Public Choice 116,
nos. 3–4 (2003): 399–417.
19. Ibid., 402.
EVER
YM
AN
’S D
EFIC
IT
16
the Internal Revenue Service. Once revenues are gen-erated, the federal agency that oversees a particular program must cover the cost of offering and admin-istering subsidy programs. Finally, once a grant or subsidy is provided, the operating organization that receives the grant or subsidy must cover its costs. The opportunity cost of government action is high.
Ferris and West examined data on private dona-tions for the years 1975–1994. They found that a 10 percent increase in government contributions to the poor, which cost $1.60 for every $1.00 transferred, led to a 5.84 percent reduction in private contribu-tions.20 In another example, Jane K. Dokko exam-ined the crowding-out effects of changes in National Endowment for the Arts (NEA) funding for local art programs.21 Dokko’s data cover 1990–1995, when there was significant variation in NEA funding. Her empirical findings indicate that a $1.00 increase in NEA funding is associated with an $0.80 decrease in private contributions,22 and recall that it costs the government approximately $1.60 to provide the $1.00 increase.
The empirical record is spotty, but common sense suggests that charitable organizations will change the composition of their services in response to competition from the government. Churches, for example, will be less likely to continue to operate soup kitchens and shelters but more likely to lobby for increased government activity in these areas. Medical practitioners will be less likely to continue to provide pro-bono services to the poor when subsi-dized local hospital emergency rooms provide those
services at no charge. Private operators of daycare centers and kindergartens will have a hard time com-peting with “free” services provided through govern-ment grants. In some cases, instead of going out of business entirely, formerly private operators will pursue government grants.
The crowding out of private-sector activity by way of financial-market activity is another risk associ-ated with increased government borrowing. This stems from the idea that there is one potential pool of lendable funds available at any one time for equally risky borrowers at a particular rate of interest. When any large borrower increases its demand for funds, interest rates will rise for all risk categories, and some loans that may otherwise have been made get crowded out. A large increase in private-sector bor-rowing can crowd out public-sector borrowing and vice versa.
The evidence on fiscal crowding out is mixed but worth considering. Jeffrey A. Frankel responded to work that claimed to have found crowding out of pri-vate investment because of government borrowing.23 He searched across 120 years of data and detected significant crowding out of U.S. private investment during the 1980s when the federal government ran a large structural deficit. In later work, Frankel indi-cated that U.S. housing markets would suffer from these large and growing U.S. deficits.24 R. J. Cebula found that federal deficits in the period 1974–2007 were systematically associated with higher home mortgage interest rates, all else being equal.25 Writing on the subject recently, Martin Feldstein indicated
20. Ferris and West, “Private versus Public Charity,” 411.
21. Jane K. Dokko, Does the NEA Crowd Out Private Charitable Contributions to the Arts? Finance and Economics Discussion Series,
Divisions of Research and Statistics and Monetary Affairs (Washington, DC: Federal Reserve Board, November 2007), http://www.federalre-
serve.gov/Pubs/feds/2008/200810/200810pap.pdf.
22. Ibid., 30.
23. Jeffrey A. Frankel, “International Capital Mobility and Crowding-out in the U.S. Economy: Imperfect Integration of Financial Markets or of
Goods Markets?” in How Open Is the U.S. Economy? R. W. Hafer, ed. (Lexington, MA: Lexington Books, 1986), 33–67; Martin Feldstein and
Charles Horioka, “Domestic Saving and International Capital Flows,” Economic Journal 90, no. 358 (1980): 314–329.
24. Jeffrey A. Frankel, “Could the Twin Deficits Jeopardize US Hegemony?” Journal of Policy Modeling 28, no. 6 (2006): 659.
25. R. J. Cebula, “Impact of the Federal Budget Deficit on the Nominal Interest Rate Yields on New 30-Year Fixed-Rate Home Mortgages:
Recent Evidence,” Journal of Housing Research 17, no. 2 (2008): 155–64.

MER
CA
TU
S C
ENT
ER A
T G
EOR
GE
MA
SO
N U
NIV
ERSI
TY
17
that crowding out in financial markets might occur sometime in the future when the economy is again operating closer to capacity.26 We can conclude that the risk of federal debt crowding out private invest-ment is real.
In summary, growing deficits and public debt affect the performance of the entire economy—private and public. As the private sector becomes relatively smaller, real GDP growth becomes less vibrant. Taken together, the two forces—growing deficits and debt and growing provision of once-private services by government—create a society that is marginally more dedicated to consumption than to investment and that is looking more frequently to the federal government to address problems previously dealt with privately or at the state and local level.
3.2. Deficits, Regulation, and a Muffled Economy
The growth of federal deficits that began in the late 1970s was partly fueled by the activities of the newly formed agencies charged with overseeing the new programs. To accomplish their missions, the new agencies had to write rules and regulations establish-ing programs and their procedures. With growth in budgets and deficits came growth in the number of pages of new and revised rules published in the Federal Register, the federal publication that daily announces new and modified federal regulations. Figure 7 shows the page count from 1940 through 2009.
In 1970, budgets for all federal regulatory agencies totaled $5.7 billion in 2000 dollars.27 Some 90,000 workers were employed in the agencies that year. By 2009, there was a whopping increase in regula-
FIGURE 7: NUMBER OF PAGES IN THE FEDERAL REGISTER, 1940–2009
Source: Clyde Wayne Crews Jr., Ten Thousand Commandments: An Annual Snapshot of the Federal Registry State, Competitive Enterprise Institute Issue Analysis (Washington, DC: Competitive Enterprise Institute, April 2010), 36, http://cei.org/issue- analysis/2010/04/15/ten-thousand-commandments-2010.
0
10000
20000
30000
40000
50000
60000
70000
80000
90000
100000
1940
1942
1944
1946
1948
1950
1952
1954
1956
1958
1960
1962
1964
1966
1968
1970
1972
1974
1976
1978
1980
1982
1984
1986
1988
1990
1992
1994
1996
1998
2000
2002
2004
2006
2008
Figure 7: Federal Register Pages: 1940-2009
Source: Crews (2010, 38).
26. Martin Feldstein, The Case for Fiscal Stimulus (Cambridge, MA: National Bureau of Economic Research, 2009), http://www.nber.org/
feldstein/projectsyndicate_fiscalstimulus.pdf.
27. Veronique de Rugy and Melinda Warren, Expansion of Regulatory Budgets and Staffing Continues in the New Administration: An
Analysis of the U.S. Budget for Fiscal Years 2009 and 2010 (Arlington, VA: Mercatus Center at George Mason University, October 2009).
Year
Pag
es

EVER
YM
AN
’S D
EFIC
IT
18
tory activities. The estimated budgets totaled $43.4 billion, and regulatory agencies employed 266,000 workers. Across the 39 years, real regulatory budgets grew at an annual rate of 5.2 percent. By comparison, the rate of growth across these years for all federal spending was 3 percent. Regulation was a high-growth industry.
The growth came with mandated costs imposed on U.S. firms and organizations, costs that are passed on and ultimately borne by consumers. In 2005, Mark W. Crain estimated that the annual cost of all federal regulations was $1.1 trillion in 2004 dollars,28 equal to about 50 percent of federal spending that year. There are obviously some benefits from the regula-tory process, but however great the benefits may be, they were obtained in part with borrowed money.
It is difficult, if not impossible, to identify cause and effect with respect to deficits, regulation, and over-all economic performance; many events and vari-ables influence outcomes. However, in an empirical study of deficits and economic growth for the 50 states over the years 1962–1992, Laura Razzolini and William F. Shughart II found strong evidence that deficits significantly reduced economic growth.29 In January 2007 testimony to Congress, Federal Reserve Board chairman Ben S. Bernanke spoke about deficit projections made by the Congressional Budget Office (CBO), which indicated that the ratio of public debt to GDP could rise to 100 percent by 2030. (We arrived early. The federal debt is already approximately 100 percent of GDP.) He noted,
The CBO projections, by design, ignore the adverse effects that such high deficits would likely have on economic growth. But if gov-ernment debt and deficits were actually to
grow at the pace envisioned by the CBO’s scenario, the effects on the U.S. economy would be severe. High rates of government borrowing would drain funds away from private capital formation and thus slow the growth of real incomes and living standards over time. Some fraction of the additional debt would likely be financed abroad, which would lessen the negative influence on domestic investment; however, the neces-sity of paying interest on the foreign-held debt would leave a smaller portion of our nation’s future output available for domes-tic consumption. Moreover, uncertainty about the ultimate resolution of the fiscal imbalances would reduce the confidence of consumers, businesses, and investors in the U.S. economy, with adverse implications for investment and growth.30
In 2007, Bernanke had no way of knowing that the then-pessimistic CBO forecasts for 2030 would arrive 20 years early. But the Federal Reserve Board analysis he relied upon was unambiguous: Large def-icits reduce economic growth and prosperity.
When we look at the U.S. economy for a longer period, it is clear that performance as measured by real GDP growth has fallen in recent years. Figure 8 shows four-quarter moving-average growth rates for real GDP from 1948 through 2009 and their relation-ship to a trend line. Real economic growth clearly has fallen across time, and the path has become less vola-tile. Arguably, the growing public-debt burden and accompanying regulation have buffered economic activity so that private-sector activity is less vibrant and wealth creation is muffled.
28. Mark W. Crain, The Impact of Regulatory Costs on Small Firms (Washington, DC: Office of Advocacy, Small Business Administration,
September 2005), 49.
29. Laura Razzolini and William F. Shughart II, “On the (Relative) Unimportance of a Balanced Budget,” Public Choice 90, nos. 1–4 (1997):
215–33.
30. Senate Committee on the Budget, Long-Term Fiscal Challenges Facing the United States, 110th Cong., 1st sess., January 18, 2007,
http://www.federalreserve.gov/newsevents/testimony/bernanke20070118a.htm.

20%
15%
10%
5%
0%
-5%
-10%
-15%
MER
CA
TU
S C
ENT
ER A
T G
EOR
GE
MA
SO
N U
NIV
ERSI
TY
19
3.3. Taxpayer-Supported Debt Is Larger Than “Official” Federal Debt
Unfortunately, there is more to the government-debt story. The numbers discussed so far relate strictly to federal-government debt. This is debt represented by United States government bonds, bills, and notes. Although we will keep our focus on the U.S. government debt and deficits narrowly defined, there is another category of debt, issued by government-sponsored enterprises (GSEs), that we need to recognize. GSEs are organizations formed by Congress to achieve a specialized lending function. While their debt issue is not officially guaranteed by U.S. taxpayers, the recent taxpayer takeover of two GSEs, Fannie Mae and Freddie Mac, suggests that taxpayers may be on the hook for the GSEs’ debt also, albeit not in the same way as for U.S. government bonds. Just how much debt are we talking about?
Now that the huge mortgage lenders Fannie and Freddie have been bailed out using $125 billion of taxpayer money (or deficit) to nationalize them, the GSEs that remain include 12 Federal Home Loan Banks, the Government National Mortgage Association, the Federal Farm Credit Banks, and the Federal Agricultural Mortgage Corporation. Notice that all of these organizations specialize in mortgage lending. In 2009, total debt outstanding for Fannie, Freddie, and the other GSEs was more than $8 trillion.31 When combined with the $12.7 tril-lion in federal debt, the total becomes a staggering $20.7 trillion in federal and government-sponsored debt. And even this does not end the debt story. As pointed out by Carmen M. Reinhart and Kenneth S. Rogoff, a full calculation of debt could include all deposits insured by the Federal Deposit Insurance Corporation (FDIC) in financial institutions nation-wide.32 As we learned during the 2008–2009 credit meltdown, if the FDIC runs low on funds, U.S. tax-
FIGURE 8: REAL GDP GROWTH, 1948Q1–2009Q4, FOUR-QUARTER MOVING AVERAGE WITH TREND LINE
Source: Author’s calculations based on Bureau of Economic Analysis, “National Economic Accounts: National Income and Product Accounts Table” (U.S. Department of Commerce, Washington, DC, 2010) http://www.bea.gov/national/nipaweb/TableView.asp?SelectedTable=1&FirstYear=2008&LastYear=2009&Freq=Qtr.
31. Federal Reserve Board, Federal Reserve Statistical Release, “Flow of Funds Accounts of the United States: Credit Market Debt
Outstanding” (Washington, DC, March 11, 2010), http://www.federalreserve.gov/releases/z1/Current/accessible/l1.htm.
32. Carmen M. Reinhart and Kenneth S. Rogoff, This Time is Different: Eight Centuries of Financial Folly (Princeton, NJ: Princeton University
Press, 2009), xxxii.

EVER
YM
AN
’S D
EFIC
IT
20
payers may find themselves on the hook for that debt, too.
In late 2009, the total deposits insured came to more than $4 trillion.33 This brings us to more than $24 trillion of debt potential. And we have not added the unfunded liabilities associated with Social Security, Medicare, and government-employee retirement programs. Nor have we even scratched the surface of the debt owed by state and local governments. Even so, the amount owed by every man, woman, and child in the United States is now hitting $80,000. Keep in mind that the $80,000 is not going to be called for in one fell swoop, but if it were, it would take more than the Everymans earn in a year, before taxes, to pay it off.
Now we are talking about serious money, indeed.
For the Everyman family and most other American families, the federal debt and the deficits that drive the debt may be something to be concerned about, but not to the point of lying awake at night worrying about the matter—at least not yet. Is there a breaking point where the magnitude of the government deficit breaks through consciousness and causes America’s unorga-nized taxpayers to engage with the body politic?
4. PRESIDENT OBAMA: DOING SOME-THING ABOUT THE DEFICIT HABIT
The deficit problem seems to be so serious that it was a key focus of Obama’s 2010 State of the Union address. He spoke about the tough fiscal situation passed to him by the previous administration; the exploding deficit associated with war, bailouts, and increased spending to jump-start the economy; and announced the steps he was taking to freeze discre-tionary spending and to encourage Congress to adopt
a pay-as-you-go legislative process. Making refer-ence to how a family would react to tough times, the president said,
Starting in 2011, we are prepared to freeze government spending for three years. Spending related to our national security, Medicare, Medicaid, and Social Security will not be affected. But all other discre-tionary government programs will. Like any cash-strapped family, we will work within a budget to invest in what we need and sacri-fice what we don’t.34
The call to freeze discretionary spending brought a few chuckles, since that part of the budget accounts for just 17 percent of the total. But 17 percent matters in a 2010 budget that totals more than $3 trillion. We have to start somewhere.
4.1. What the Polls Tell Us
For whatever reason, it is clear from polling data that somebody is worried about deficits. Of course, we can never really know what might be causing rank-and-file opinion to form and shift on deficits or anything else. Is it the constant discussion of the deficit? The misery associated with the “Great Recession” and the question of how the stimulus will be paid for? The news about the possibility that Greece will default on its debt? Because of Obama’s baleful expressions of concern about the deficit out-look? For whatever reasons, the Gallup poll con-ducted February 1–3, 2010, reported that 11 percent of those responding listed the Federal Budget Deficit as the most important problem facing the country. This result is significant since it marks the first time since 1996 that the federal budget deficit has been mentioned in double digits.35
33. Viral Achcarya, “Systemic Risk and Deposit Insurance Premiums,” VoxEU, September 4, 2009, http://www.voxeu.org/index.
php?q=node/3941.
34. Barack Obama, “2010 State of the Union Address” (speech, U.S. Capitol, Washington, DC, January 27, 2010), http://www.whitehouse.
gov/the-press-office/remarks-president-state-union-address.
35. Gallup, “In U.S., Unemployment Jumps to Top Problem Status,” February 12, 2010, http://www.gallup.com/poll/125846/
Unemployment-Jumps-Top-Problem-Status.aspx.
MER
CA
TU
S C
ENT
ER A
T G
EOR
GE
MA
SO
N U
NIV
ERSI
TY
21
A Gallup poll conducted just one month later, March 4–7, 2010, reported that 14 percent of those responding named federal budget deficits the most important problem facing our nation in 25 years. Deficit was, in fact, the most common response to this open-ended question. Not only was this the first time deficits have been mentioned most often, this was the first time deficits have even been in the top three most-mentioned categories.36 Clearly, deficits are on Americans’ minds in a way they have rarely been before.
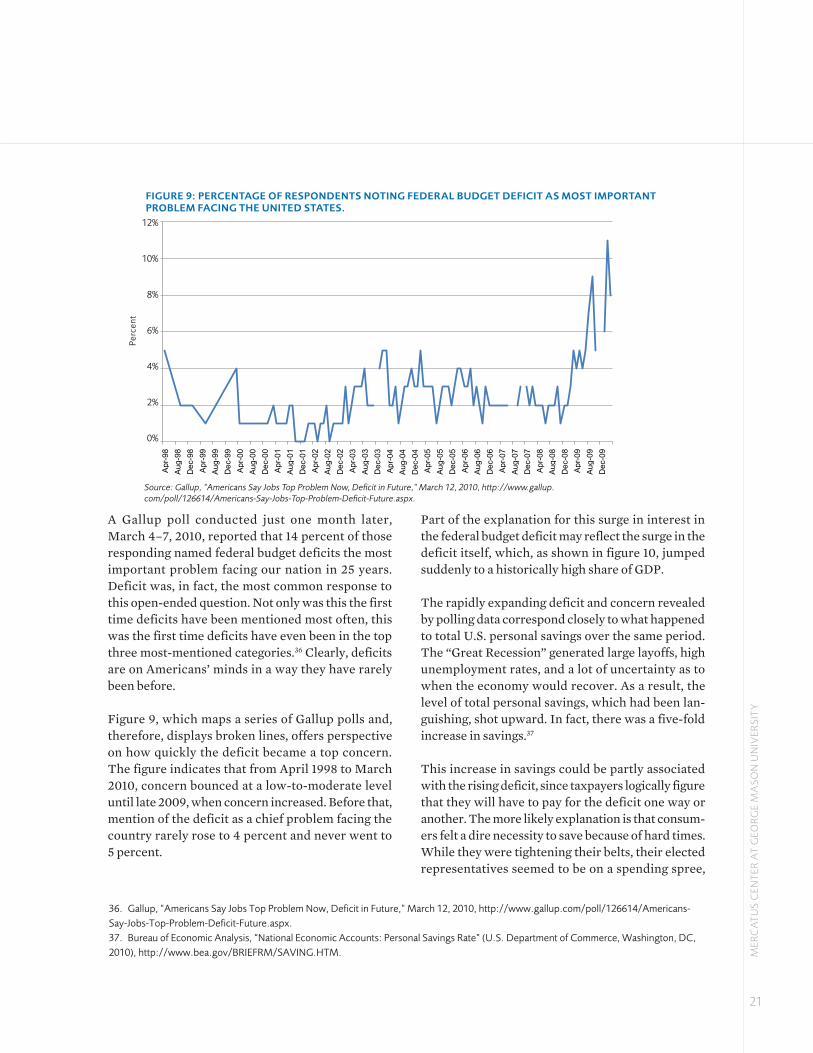
Figure 9, which maps a series of Gallup polls and, therefore, displays broken lines, offers perspective on how quickly the deficit became a top concern. The figure indicates that from April 1998 to March 2010, concern bounced at a low-to-moderate level until late 2009, when concern increased. Before that, mention of the deficit as a chief problem facing the country rarely rose to 4 percent and never went to 5 percent.
Part of the explanation for this surge in interest in the federal budget deficit may reflect the surge in the deficit itself, which, as shown in figure 10, jumped suddenly to a historically high share of GDP.
The rapidly expanding deficit and concern revealed by polling data correspond closely to what happened to total U.S. personal savings over the same period. The “Great Recession” generated large layoffs, high unemployment rates, and a lot of uncertainty as to when the economy would recover. As a result, the level of total personal savings, which had been lan-guishing, shot upward. In fact, there was a five-fold increase in savings.37
This increase in savings could be partly associated with the rising deficit, since taxpayers logically figure that they will have to pay for the deficit one way or another. The more likely explanation is that consum-ers felt a dire necessity to save because of hard times. While they were tightening their belts, their elected representatives seemed to be on a spending spree,
FIGURE 9: PERCENTAGE OF RESPONDENTS NOTING FEDERAL BUDGET DEFICIT AS MOST IMPORTANT PROBLEM FACING THE UNITED STATES.
Source: Gallup, “Americans Say Jobs Top Problem Now, Deficit in Future,” March 12, 2010, http://www.gallup.com/poll/126614/Americans-Say-Jobs-Top-Problem-Deficit-Future.aspx.
0
2
4
6
8
10
12
Apr
-98
Aug
-98
Dec
-98
Apr
-99
Aug
-99
Dec
-99
Apr
-00
Aug
-00
Dec
-00
Apr
-01
Aug
-01
Dec
-01
Apr
-02
Aug
-02
Dec
-02
Apr
-03
Aug
-03
Dec
-03
Apr
-04
Aug
-04
Dec
-04
Apr
-05
Aug
-05
Dec
-05
Apr
-06
Aug
-06
Dec
-06
Apr
-07
Aug
-07
Dec
-07
Apr
-08
Aug
-08
Dec
-08
Apr
-09
Aug
-09
Dec
-09
36. Gallup, “Americans Say Jobs Top Problem Now, Deficit in Future,” March 12, 2010, http://www.gallup.com/poll/126614/Americans-
Say-Jobs-Top-Problem-Deficit-Future.aspx.
37. Bureau of Economic Analysis, “National Economic Accounts: Personal Savings Rate” (U.S. Department of Commerce, Washington, DC,
2010), http://www.bea.gov/BRIEFRM/SAVING.HTM.
Per
cen
t
12%
10%
8%
6%
4%
2%
0%

EVER
YM
AN
’S D
EFIC
IT
22
with bank, insurance-company, and auto-producer bailouts leading the way. Thus, the sharp concern about deficits may indeed be more a reflection of the recession and unhappiness with government than with deficits per se. If this is the case, Americans’ concerns are misplaced. The deficit problem is real, and it is not going away any time soon.
4.2. The Bipartisan Deficit Commission and the 3 Percent Constraint
Obama also told of plans to appoint a bipartisan deficit commission to study the problem and return with recommendations by late 2010 to reduce the red ink to 3 percent of GDP by 2015. Senator Judd Gregg (R-NH), ranking member on the Senate Budget Committee, was one of those named to the Obama deficit commission. Referring to the serious deficit problem, he said, “I believe fervently if we don’t step up and do something, the U.S. is going to go bank-rupt.”38 Later, in comments to a March meeting of
the National Association of Business Economists, Christina Romer, chairman of the Obama adminis-tration’s Council of Economic Advisers, in a tamer mood, termed the growing deficit “unacceptable and unsustainable,” and said, “No one can look at these numbers and not be concerned.”39
But achieving a goal of restraining the deficit to 3 percent of GDP by 2015 when it is currently 10 per-cent of GDP means closing a 7 percent gap, and that is equivalent to cutting spending by more than $1 tril-lion or holding spending constant and growing real GDP by an additional 7 percent. Neither of these fis-cal mountains will be an easy climb.
The 3 percent goal Obama announced happens to meet the deficit standard set for members of the European Union (EU).40 This guideline has some strong economic logic associated with it. The idea is this: If economies on average grow real GDP at 3 per-cent a year or more, then, holding tax rates constant, a running structural deficit of about 3 percent a year
FIGURE 10: BUDGET DEFICIT AS A PERCENTAGE OF REAL GDP
Source: Author’s calculations based on OMB, Budget of the United States Government, Fiscal Year 2011 (Washington, DC,: GPO, February 1, 2010), table 1.3, http://www.whitehouse.gov/omb/budget/historicals.
38. Cory Boles, “Republicans Name Lawmakers to Sit on US Fiscal Commission,” Fox News, March 12, 2010, http://www.foxbusiness.com/
story/markets/republicans-lawmakers-sit-fiscal-commission (accessed March 31, 2010).
39. Jill Lawrence, “Christina Romer on Why We Don’t Need Another WPA,” Politics Daily, February 12, 2010, http://www.politicsdaily.
com/2010/02/12/christina-romer-on-putting-workers-on-sale-and-why-we-dont-ne (accessed March 31, 2010).
40. Desmond Lachman, “Greece’s Threat to the Euro,” Intereconomics, March 29, 2010, http://www.aei.org/article/101852 (accessed
March 30, 2010).
Per
cen
t
MER
CA
TU
S C
ENT
ER A
T G
EOR
GE
MA
SO
N U
NIV
ERSI
TY
23
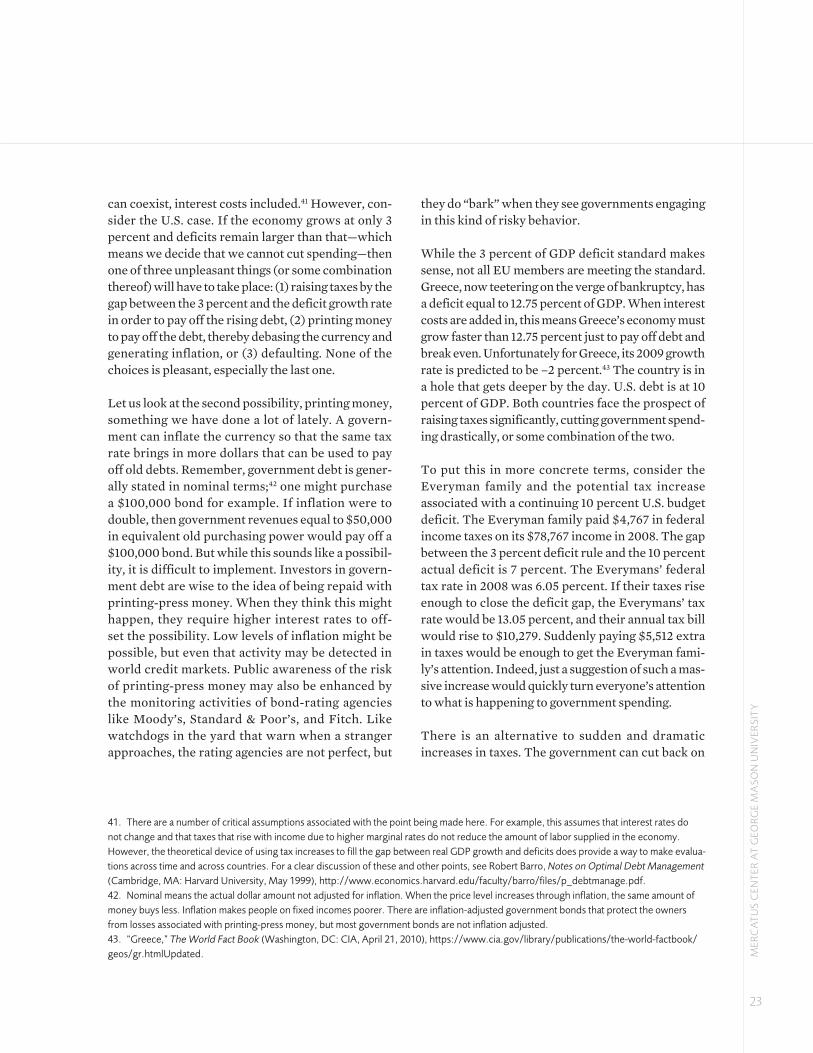
can coexist, interest costs included.41 However, con-sider the U.S. case. If the economy grows at only 3 percent and deficits remain larger than that—which means we decide that we cannot cut spending—then one of three unpleasant things (or some combination thereof) will have to take place: (1) raising taxes by the gap between the 3 percent and the deficit growth rate in order to pay off the rising debt, (2) printing money to pay off the debt, thereby debasing the currency and generating inflation, or (3) defaulting. None of the choices is pleasant, especially the last one.
Let us look at the second possibility, printing money, something we have done a lot of lately. A govern-ment can inflate the currency so that the same tax rate brings in more dollars that can be used to pay off old debts. Remember, government debt is gener-ally stated in nominal terms;42 one might purchase a $100,000 bond for example. If inflation were to double, then government revenues equal to $50,000 in equivalent old purchasing power would pay off a $100,000 bond. But while this sounds like a possibil-ity, it is difficult to implement. Investors in govern-ment debt are wise to the idea of being repaid with printing-press money. When they think this might happen, they require higher interest rates to off-set the possibility. Low levels of inflation might be possible, but even that activity may be detected in world credit markets. Public awareness of the risk of printing-press money may also be enhanced by the monitoring activities of bond-rating agencies like Moody’s, Standard & Poor’s, and Fitch. Like watchdogs in the yard that warn when a stranger approaches, the rating agencies are not perfect, but
they do “bark” when they see governments engaging in this kind of risky behavior.
While the 3 percent of GDP deficit standard makes sense, not all EU members are meeting the standard. Greece, now teetering on the verge of bankruptcy, has a deficit equal to 12.75 percent of GDP. When interest costs are added in, this means Greece’s economy must grow faster than 12.75 percent just to pay off debt and break even. Unfortunately for Greece, its 2009 growth rate is predicted to be –2 percent.43 The country is in a hole that gets deeper by the day. U.S. debt is at 10 percent of GDP. Both countries face the prospect of raising taxes significantly, cutting government spend-ing drastically, or some combination of the two.
To put this in more concrete terms, consider the Everyman family and the potential tax increase associated with a continuing 10 percent U.S. budget deficit. The Everyman family paid $4,767 in federal income taxes on its $78,767 income in 2008. The gap between the 3 percent deficit rule and the 10 percent actual deficit is 7 percent. The Everymans’ federal tax rate in 2008 was 6.05 percent. If their taxes rise enough to close the deficit gap, the Everymans’ tax rate would be 13.05 percent, and their annual tax bill would rise to $10,279. Suddenly paying $5,512 extra in taxes would be enough to get the Everyman fami-ly’s attention. Indeed, just a suggestion of such a mas-sive increase would quickly turn everyone’s attention to what is happening to government spending.
There is an alternative to sudden and dramatic increases in taxes. The government can cut back on
41. There are a number of critical assumptions associated with the point being made here. For example, this assumes that interest rates do
not change and that taxes that rise with income due to higher marginal rates do not reduce the amount of labor supplied in the economy.
However, the theoretical device of using tax increases to fill the gap between real GDP growth and deficits does provide a way to make evalua-
tions across time and across countries. For a clear discussion of these and other points, see Robert Barro, Notes on Optimal Debt Management
(Cambridge, MA: Harvard University, May 1999), http://www.economics.harvard.edu/faculty/barro/files/p_debtmanage.pdf.
42. Nominal means the actual dollar amount not adjusted for inflation. When the price level increases through inflation, the same amount of
money buys less. Inflation makes people on fixed incomes poorer. There are inflation-adjusted government bonds that protect the owners
from losses associated with printing-press money, but most government bonds are not inflation adjusted.
43. “Greece,” The World Fact Book (Washington, DC: CIA, April 21, 2010), https://www.cia.gov/library/publications/the-world-factbook/
geos/gr.htmlUpdated.
EVER
YM
AN
’S D
EFIC
IT
24
spending and adopt policies to increase economic activity. A faster-growing economy will generate more revenue with unchanged or even lower tax rates. But this takes time.
4.3. Crossing the Red Line
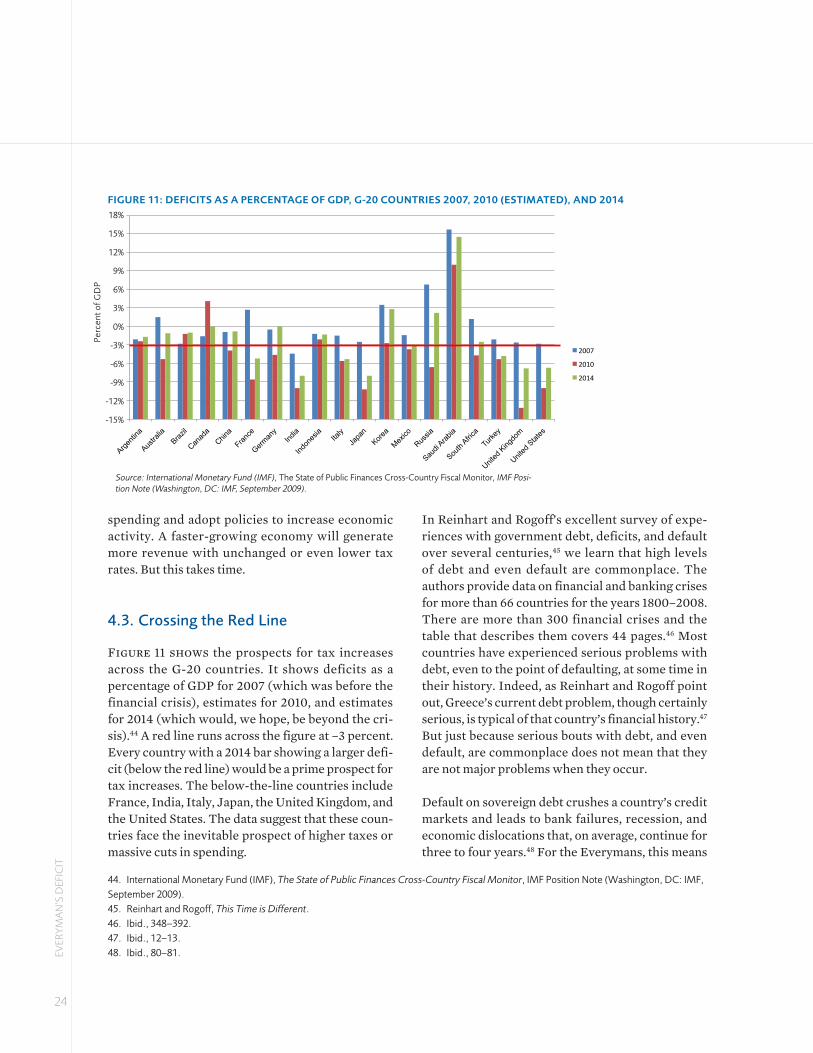
Figure 11 shows the prospects for tax increases across the G-20 countries. It shows deficits as a percentage of GDP for 2007 (which was before the financial crisis), estimates for 2010, and estimates for 2014 (which would, we hope, be beyond the cri-sis).44 A red line runs across the figure at –3 percent. Every country with a 2014 bar showing a larger defi-cit (below the red line) would be a prime prospect for tax increases. The below-the-line countries include France, India, Italy, Japan, the United Kingdom, and the United States. The data suggest that these coun-tries face the inevitable prospect of higher taxes or massive cuts in spending.
In Reinhart and Rogoff’s excellent survey of expe-riences with government debt, deficits, and default over several centuries,45 we learn that high levels of debt and even default are commonplace. The authors provide data on financial and banking crises for more than 66 countries for the years 1800–2008. There are more than 300 financial crises and the table that describes them covers 44 pages.46 Most countries have experienced serious problems with debt, even to the point of defaulting, at some time in their history. Indeed, as Reinhart and Rogoff point out, Greece’s current debt problem, though certainly serious, is typical of that country’s financial history.47 But just because serious bouts with debt, and even default, are commonplace does not mean that they are not major problems when they occur.
Default on sovereign debt crushes a country’s credit markets and leads to bank failures, recession, and economic dislocations that, on average, continue for three to four years.48 For the Everymans, this means
FIGURE 11: DEFICITS AS A PERCENTAGE OF GDP, G-20 COUNTRIES 2007, 2010 (ESTIMATED), AND 2014
Source: International Monetary Fund (IMF), The State of Public Finances Cross-Country Fiscal Monitor, IMF Posi-tion Note (Washington, DC: IMF, September 2009).
-15
-12
-9
-6
-3
0
3
6
9
12
15
18
% o
f GD
P
Figure 11: Deficits as a Percent of GDP, G-20 Countries 2007, 2010e, 2014e
2007
2010
2014
Source: International Monetary Fund (2005, 35).
44. International Monetary Fund (IMF), The State of Public Finances Cross-Country Fiscal Monitor, IMF Position Note (Washington, DC: IMF,
September 2009).
45. Reinhart and Rogoff, This Time is Different.
46. Ibid., 348–392.
47. Ibid., 12–13.
48. Ibid., 80–81.
Per
cen
t of G
DP
18%
15%
12%
9%
6%
3%
0%
-3%
-6%
-9%
-12%
-15%

MER
CA
TU
S C
ENT
ER A
T G
EOR
GE
MA
SO
N U
NIV
ERSI
TY
25
living in a high-unemployment economy where their jobs and those of their family members and neighbors are at risk. This situation is something the Everyman family and everyone else hopes to avoid.
Perhaps we might now better understand Obama’s concern for deficits. The deficit study commission announced in Obama’s State of the Union address is to be made up of six members of Congress from each party and six members named by the president. Referring to the debt burden future generations face, Obama said, “I refuse to pass this problem on to another generation of Americans.” We have crossed the red line.
5. AT THE CROSSROADS: WHAT NOW?
If the U.S. fiscal picture were a hurricane, we would probably call it a category three, meaning devastating damage will occur unless the frightening winds are somehow calmed. With excuses galore, we continue to spend beyond our means, borrowing from all who will lend to us and occasionally printing money to fill the gaps. Granted, there are two parts to the deficit problem. The first part relates to the structural defi-cit, that part of systematic overspending that goes with good times and bad. The second part reflects the recent effects of stimulus spending, bailouts of financial and automotive firms, and recession-related unemployment and welfare expenditures. This second component of the deficit will likely slip away, at least partly, leaving a newly defined structural deficit, perhaps enhanced by permanent spending increases that remain long after the “Great Recession” has passed. History tells us that once our government expands to meet the challenge of a cri-sis, it never returns to its precrisis level of spending.49
The American people are now saving a bit more than $500 billion annually, close to 5 percent of national income and up from 1 percent just a few years ago.50 Hard times and plummeting asset values have a way of making us prudent. Spending beyond our collec-tive means is now confined to the public sector. No, the United States is not the last of the big spend-ers, but we are platinum-club members. But if the Chinese, the second largest creditors to the United States are willing to lend so that we can buy their goods, why not let the good times roll?
On this, Heritage Foundation economist Derek Scissors recently pointed out,
The data for official Chinese purchases of Treasury bonds in 2009 were published yesterday. Verdict: the PRC [People’s Republic of China] bought practically noth-ing. In 2008, official Chinese purchases of U.S. Treasury bonds were equal in size to half our federal budget deficit. Last year they were equal to 2%. That’s not a typo, that’s a “2.”51
That is just one small bit of evidence that others are beginning to see the United States as a credit risk. Scissors goes on to argue that even if we can borrow away our deficits, doing so will necessarily make the country worse off. His concern is about the transfor-mation of the economy of the sort described earlier with the Lipford-Slice data.
5.1 Looking for Golden Handcuffs
Modern democracies’ efforts to constrain the growth of deficits by choosing to put on golden
49. Robert Higgs, Crisis and Leviathan (New York: Oxford University Press, 1989).
50. Bureau of Economic Analysis, “National Economic Accounts: Personal Savings Rate.”
51. Derek Scissors, “China Stops Buying Treasuries: Who Cares?” The Foundry, Heritage Foundation, February 17, 2009, http://blog.heri-
tage.org/2010/02/17/china-stops-buying-treasuries-who-cares.

EVER
YM
AN
’S D
EFIC
IT
26
handcuffs that constrain political spending yield mixed results. In their recent survey of these efforts, Maurice P. McTigue, Christina Forsberg, and Stefanie Haeffele-Balch applied the EU’s official goal of holding deficits to 3 percent of GDP and national debt to 60 percent of GDP to a 26-country sample and then rated countries for which they had com-plete data on whether they achieved these goals.52 Those countries reaching the goal were placed in a category they termed “Success!”, those getting close were termed “Not Quite”, and those hopelessly behind were termed Not “Close”. They describe their findings this way:
Our analysis shows that the countries in the “Success!” category include the Netherlands, Ireland, and Finland from the EU, as well as Canada, South Korea, Australia, Switzerland, Hong Kong, and New Zealand. The countries within the “Not Quite” category include the United Kingdom, France, Spain, Belgium, Sweden, Austria, Denmark, Poland, and Czech Republic from the EU, and the United States, Japan, Brazil, and India. Finally, the “Not Close” countries are Italy, Greece, Portugal, and Hungary from the EU.53
The McTigue, Forsberg, and Haeffele-Balch assess-ment (1) considered the extent to which countries adopted accrual accounting standards so that the present value of unfunded liabilities is counted, (2) used quantitative standards and goals, such as the EU standards, and (3) provided transparency to the electorate to reduce monitoring costs. When the “Success!” countries were evaluated using the three-part analysis, it was not clear whether adopting strong fiscal rules and procedures led to an improved fiscal result or if countries that were strong fiscally
happened to adopt the strong rules. Causality could run either way. Their analysis suggests a tendency for countries to backslide after putting on the golden handcuffs.54
5.2 Putting on the Golden Handcuffs
Obama’s appointment of a deficit-review commis-sion and announcement of a freeze on discretionary spending mark the beginning of another U.S. effort to don a pair of golden handcuffs. Unfortunately, past efforts at imposing legislative constraints have not been marked with great success. The Balanced Budget and Emergency Deficit Control Act of 1985, better known as the Gramm-Rudman-Hollings Act (GRH), is the most rigorous and recent effort. When passed in 1985 under the Reagan administration, the federal deficit stood at $212 billion, or 5.4 percent of GDP, about half the current deficit share of GDP.55 The legislation set annual $36 billion deficit-reduc-tion goals so that the deficit would hit zero in 2001. Both the president’s budget proposal and the con-gressional budget resolution were required to meet the reduction goals. If deficit-reduction goals were not met, the legislation mandated trigger points ($10 billion over the required reduction) that sequestered most budgeted funds so they could not be spent. Escape clauses allowed Congress to suspend GRH in the event of a recession. Through difficult con-gressional action, golden handcuffs were placed on the wrists of the budget builders and spenders and locked. But the key was not thrown away.
As it turns out, there was some initial progress under GRH, but not enough. And hardly anyone liked sequestration. All told, GRH did not work well.56 By 1990, the deficit was almost as large as it had been in
52. Maurice P. McTigue, Christina Forsberg, and Stefanie Haeffele-Balch, “The Factors and Motivations of Fiscal Stability: A Comparative
Analysis of 26 Countries” (Working paper 10-03, Mercatus Center at George Masn University, Arlington, VA, January 2010).
53. Ibid., ii.
54. Ibid., 5.
55. Economic Report of the President, 1989 (Washington, DC: Government Printing Office, 1989), 94–95.
56. Robert D. Reischauer, “Taxes and Spending Under Gramm-Rudman-Hollings,” National Tax Journal 43, no. 3 (1990): 223–32.

MER
CA
TU
S C
ENT
ER A
T G
EOR
GE
MA
SO
N U
NIV
ERSI
TY
27
1985 when the process started. Meanwhile, President Ronald Reagan unsuccessfully endorsed amending the Constitution to require a balanced budget.57 With deficits continuing, but reduced by GRH, the Clinton administration acted to rein in the deficit with the Balanced Budget Act of 1997. The law, passed by a margin of two votes in the House and one vote in the Senate, replaced GRH with higher taxes, capped Medicare expenditures, and brought welfare reform that sharply reduced welfare expenditures.58 When combined with a recovering economy, the resulting higher GDP growth and higher tax revenues con-verted deficits to a surplus in 1998. For the first time in 50 years, the U.S. economy was in the black, and future prospects were bright. There was a pot of gold at the end of the rainbow. The 2001 Economic Report of the President described the picture this way:
Where Federal deficits were once projected to grow from 4.6 percent of GDP in 1992 to double-digit percentages by 2009, the current outlook is for a long string of sur-pluses in excess of 2 percent of GDP. The national debt, which had reached almost of half of GDP in 1992 and was projected to surpass GDP by 2009, has instead begun to decline and, under June 2000 projections, will be eliminated before the middle of the next decade.59
Unfortunately, the old forecast was the better of the two. No one could have predicted 9/11, Katrina, the financial-market meltdown, and war escalation. Deficits and debt have soared. Meanwhile, federal outlays as a share of GDP have risen from 22 percent in 1992 to 25.4 percent estimated for 2010.60 The share of spending devoted to welfare activities has risen from 51 percent of the budget in 1992 to 61 percent in 2010. Unfortunately, the Buchanan-Wagner forecast for systemic deficits has been an accurate one.
6. FINAL THOUGHTSThe United States is at a fiscal crossroads. The nation’s deficit as a share of GDP is now reaching his-toric proportions. With GDP growth running less than the deficit share of GDP and with accumulated inter-est that must be paid each year, the deficit as a share of GDP is destined to rise. Reining in spending and reducing regulatory burdens along with increasing GDP growth can eventually close the deficit gap. But under the best of circumstances, this will take time.
A number of indicators tell us that the American people have gotten the message. The polling data suggest it is time to get our house in order. Recent warnings from Greece, Portugal, and Spain tell us what continued deficit spending can cause. Obama has called for recommendations and congressional action that will place some clamps on future defi-cit growth. But at the same time, he is appealing for additional spending to assist hard-strapped state and local governments. Conflicting messages reso-nate across the land; the prospects for meaningful improvement are not very bright.
Public Choice analysis tells us that political incen-tives systematically work against the prospects of making meaningful deficit-reduction progress. The budget deficit is still a commons; it is owed by all in general, but no one in particular. Saying this does not imply that there can be no meaningful progress in reducing the deficit. Instead, the forecast tells us that if meaningful progress occurs, it will be in spite of the normal political forces that cause politicians to want to bring home the bacon while never raising our taxes. There have been times and places where human communities organized themselves to avoid fiscal crises. It can happen again.
And what about Mr. and Mrs. Everyman? The
57. Economic Report of the President, 1987 (Washington: Government Printing Office, 1987), 78.
58. Economic Report of the President, 2000 (Washington: Government Printing Office, 2000), 52–57.
59. Economic Report of the President, 2001 (Washington: Government Printing Office, 2001), 80.
60. OMB, Budget of the United States Government, Fiscal Year 2011.
EVER
YM
AN
’S D
EFIC
IT
28
Everyman family, like others across the United States, will not likely read about a serious finan-cial crisis caused by U.S. deficits and debt. The Everymans will not be shocked by suddenly rising taxes or a severe debt-induced recession. Instead, this family and every other family will bear gradually higher taxes, experience slower income growth, bear the cost of more regulation, and see expanded public funding of goods and services, even though it may cost $1.60 for every $1.00 transferred through gov-ernment. Their private world will contract while the public sector expands. Their expectations for future wealth and prosperity will gradually be revised. And they will not likely know that deficits and public debt led to these results.

About the Mercatus Center at George Mason University
The Mercatus Center at George Mason University is a nonprofit university-based research, educa-tion, and outreach organization that works with scholars, policy experts, and government officials to bridge academic learning and real-world practice.
Our mission is to generate knowledge and understanding of how institutions affect the freedom to prosper and hold organizations accountable for their impact on that freedom. The aim of our work is to enable individuals to live free, prosperous, and peaceful lives.
The ideas presented in this study do not represent an official position of George Mason University.
About the Spending and Budget Initiative
The Spending and Budget Initiative draws on a team of university economists and policy practi-tioners with diverse expertise in government spending and budget reform, assembled to provide policy makers an honest understanding of budgets, spending, deficits, debt, and how these issues relate to economic growth and progress. Mercatus scholars work alongside policy makers to iden-tify fiscally responsible policies and actionable options for budget reform.
Policy Regarding Independence of Research
The Mercatus Center is committed to the highest standards of academic quality and to ensur-ing that our work stands up to rigorous peer review. Mercatus scholars independently pursue a research agenda and educational activities that advance our mission. Mercatus does not engage in research or educational activities directed or influenced in any way by financial supporters. To view our full policy regarding independent research, visit our website at www.mercatus.org.

3301 North Fairfax Drive, Suite 450
Arlington, Virginia 22201
Tel: 703-993-4930
Fax: 703-993-4935
www.mercatus.org