mercatus tax lecture
DESCRIPTION
TRANSCRIPT

Principles of Tax Reform
Dr. Jason J. FichtnerSenior Research Fellow
Mercatus CenterMercatus CenterApril 19, 2011
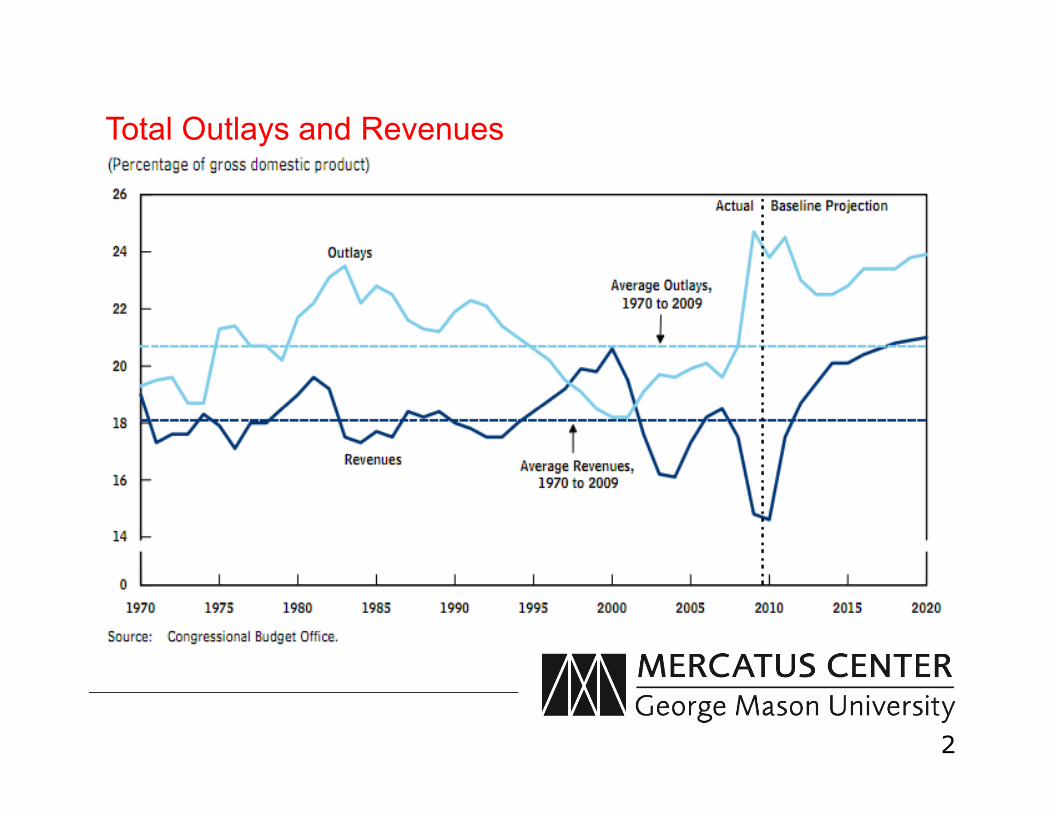
Total Outlays and Revenues
2

Congressional Budget Office - Budget Surplus/Deficit
Source: Congressional Budget Office
3

Federal Revenues by Fiscal Year
Source: CBO
4

Taxes – What you don’t know can cost you
$$$
5

How do we evaluate tax policy?� Why is tax policy important?
� What are the main tools used to evaluate tax policy?
� Estimates of Macroeconomic Effects
� Revenue Tables
� Tax Distribution Tables
� How do we evaluate tax policies?
� Efficiency, Simplicity (Complexity), Equity (Fairness)
� What is Fairness?
� Horizontal versus Vertical Equity� Horizontal versus Vertical Equity
� Generational Equity
� Point of Payment versus Incidence
� Direct vs. Indirect Taxes
� Importance of Marginal Rates vs. Effective Rates
� Inclusive Rate vs. Exclusive Rate (23% NRST vs. 30%)
� What is the tax base? Wider base and lower rates more efficient
� Social policy – tax expenditures versus government programs
� Taxes distort behavior
� Only PEOPLE can pay taxes!!!
6

What is a Distribution Table?
Example of Basic Distribution Table -
Average Tax Change
Present Law Proposed Law
$ (millions) Percent Percent Percent
Less than $10,000 -20 -0.2 7.1 7.0 -300
Income CategoryChange in Federal Taxes
Effective Tax Rate
$
10,000 to 20,000 -365 -1.0 8.1 8.0 -400
20,000 to 30,000 -1,300 -1.5 15.2 15.0 -500
30,000 to 40,000 -2,150 -1.9 17.6 17.3 -750
40,000 to 50,000 -2,750 -2.1 19.3 18.9 -1,100
50,000 to 75,000 -7,200 -2.3 21.2 20.7 -1,500
75,000 to 100,000 -6,600 -2.4 23.9 23.2 -2,000
100,000 to 200,000 -8,100 -2.2 26.2 25.5 -3,500
200,000 and over -13,500 -3.1 29.2 27.6 -5,000
Total, all taxpayers -$41,985 -2.4% 22.2% 21.5% -$650
7

Why Are Distribution Tables Important to
Tax Policy Debates
Graphics: (1) Wall Street Journal, 10/05/00 & (2) New York Times, 1/14/03
8

How Inclusion/Omission of Data Can Lead to Different Perceptions of
Fairness
Slide 1
9
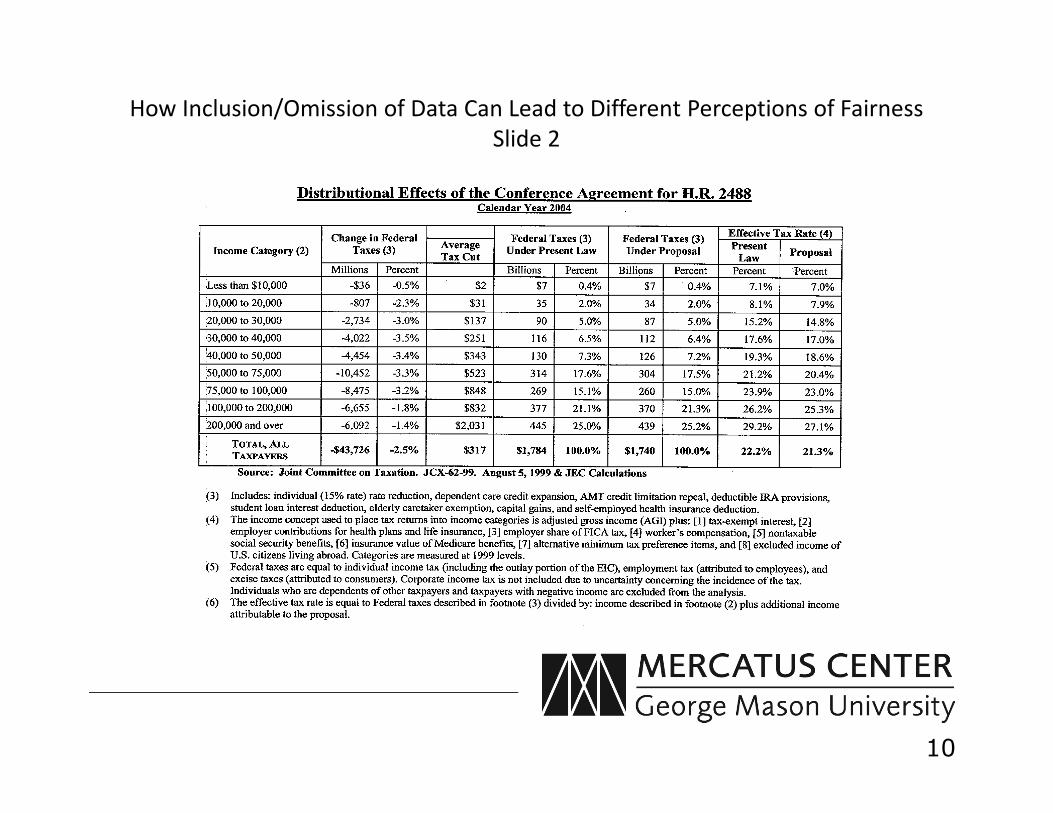
How Inclusion/Omission of Data Can Lead to Different Perceptions of Fairness
Slide 2
10

How Inclusion/Omission of Data Can Lead to Different Perceptions of Fairness
Slide 3
11

Distribution of Tax Burden
Percentage of Federal Personal Income Tax Paid by Different
58.72%
69.94%
86.34% 97.30%100 %
90 %
80 %
60 %
70 %
50 %
Source: Department of the Treasury, Internal Revenue Service
12
Top1%
Top5%
Top10%
Top25%
Top50%
Bottom50%
38.02%
2.70%
20 %
40 %
50 %
30 %
10 %

Percentage of Federal Personal Income Tax Paid by Ranked AGI Percentiles
Percentiles Ranked by AGI
Adjusted Gross Income Threshold on Percentiles
Percentage of Federal Personal Income Tax
PaidPercentage of Federal
Adjusted Gross Income
Top 1% $380,354 38.02% 20.00%
Top 5% $159,619 58.72% 34.73%
13
Top 10% $113,799 69.94% 45.77%
Top 25% $67,280 86.34% 67.38%
Top 50% $33,048 97.30% 87.25%
Bottom 50% < $33,048 2.70% 12.75%
Source: IRS (Tax Year 2008)

Distribution of Tax BurdenTax Shares by AGI: 2000 and 2005
84.0%
67.3%
56.5%
86.0%
70.3%
59.7%
50%
60%
70%
80%
90%
100%
Tax Year 2000
Tax Year 2005
Source: Department of the Treasury, Internal Revenue Service
3.9%
37.4%
3.1%
39.4%
0%
10%
20%
30%
40%
Bottom 50 percent Top 25 percent Top 10 percent Top 5 percent Top 1 percent
14

70.2
60
80
100
Distribution of Tax Burden: Current
Policy Baseline Law
Percent of
0.4 2.4
8.5
18.5
0
20
40
Lowest Quintile Second Quintile Third Quintile Fourth Quintile Highest Quintile
Source: President’s Advisory Panel On Tax Reform, Staff Presentation,
July 20, 2005 - Department of the Treasury, Office of Tax Analysis
Note: Estimates of 2006 law at 2004 income levels.
Percent of
federal
taxes paid
15

64.0
69.071.7
60
80
100
Flat Tax
Modified Flat Tax
Modified Flat Tax with top tax expenditures
Distribution of Tax Burden:
Flat Tax Proposals
Percent
0.73.7
10.5
21.0
0.32.6
9.2
18.7
0.3 2.1
8.1
17.6
0
20
40
Lowest Quintile Second Quintile Third Quintile Fourth Quintile Highest Quintile
Percent
of federal
taxes paid
Source: President’s Advisory Panel On Tax Reform, Staff Presentation,
July 20, 2005 - Department of the Treasury, Office of Tax Analysis
Note: Estimates of 2006 law at 2004 income levels. 16

Distributional analysis: National Sales
Tax with Prebate
70.2 69.3
40
60
80
100
Current law
Sales tax with prebate
Percent
0.4 2.4
8.5
18.5
-2.5
2.0
10.1
21.0
-20
0
20
40
Second Quintile Third Quintile Fourth Quintile Highest Quintile
Lowest Quintile
Percent
of federal
taxes paid
Source: President’s Advisory Panel On Tax Reform, Staff Presentation,
July 20, 2005 - Department of the Treasury, Office of Tax Analysis
Note: Estimates of 2006 law at 2004 income levels. 17

How the “Design” of Tax Policy Can Influence Results &
Bias Debate
� Different Measures of Income
�AGI v. FEI
� Variables to Include / Exclude
�Tax Cut Amount, Change in Effective Tax Rate, Change in
After-tax Income, Change in Taxes Paid, Tax Shares
18
After-tax Income, Change in Taxes Paid, Tax Shares
� Rates vs. Base
� Assumptions of Tax Incidence
� Tax Expenditures
� What’s the One Key Thing to Remember?
Tax Expenditures
• The tax expenditure budget comprises the estimated revenue losses attributable
to various exclusions, exemptions, deductions, nonrefundable credits, deferrals,
and preferential rates in the tax code.
• These provisions reduce the income tax liabilities of individuals or businesses
that undertake certain types of activities. For instance, people who donate to
charities often deduct their donations on their tax returns and thus reduce their charities often deduct their donations on their tax returns and thus reduce their
income tax.
• Tax expenditures operate essentially like direct expenditures, even though they
appear as tax breaks. They benefit hundreds of different types of activities and
individuals and currently account for one-fourth to one-third of all benefits and
subsidies granted to the public.
19

Tax Expenditures
• The Congressional Budget Act of 1974 requires that the budget include estimates
for tax expenditures, but only for those provisions that affect the federal income
taxes of individuals and corporations. The government could, but does not,
formulate tax expenditure budgets for Social Security and other taxes.
• Both the Office of Tax Analysis in the Treasury Department and the congressional
Joint Committee on Taxation (JCT) estimate tax expenditures; the items that each Joint Committee on Taxation (JCT) estimate tax expenditures; the items that each
includes and the estimated values are generally similar but do not always match.
• The Office of Management and Budget (OMB) publishes the Treasury’s estimates
in its Analytical Perspectives volume that accompanies each year’s publication of
the Budget of the U.S. Government. Each year JCT issues estimates covering the
current and four subsequent fiscal years.
20
Tax Expenditures
Major forms of tax expenditures
• Tax expenditures may take any of the following forms:
� 1. Exclusions, exemptions, and deductions, which reduce taxable
income;
� 2. Preferential tax rates, which apply lower rates to part or all of a � 2. Preferential tax rates, which apply lower rates to part or all of a
taxpayer’s income;
� 3. Credits, which are subtracted from taxes as ordinarily computed;
� 4. Deferrals of tax, which result from delayed recognition of income or
from allowing in the current year deductions that are properly
attributable to a future year.
21

22http://www.whitehouse.gov/sites/default/files/omb/budget/fy2012/assets/spec.pdf

100
150
200
250
Co
un
t Count of Tax Expenditures, 1985-2009
23
0
50
Year
Source: Authors' calculations derived from the Joint Committee on Taxation annual pamphlets on tax expenditures, Estimates of Federal Tax
Expenditures for Fiscal Years (1985 - 2009), various years

1500
2000
2500
3000
3500
4000
To
tal
Am
ou
nt
(Bil
lio
ns
of
Do
lla
rs)
Combined Top 10 Individual & Top 10 Corporate Tax
Expenditures, 1975-2014(Nominal dollars)
24
0
500
1000
1500
1975-1979 1980-1984 1985-1989 1990-1994 1995-1999 2000-2004 2005-2009 2010-2014
To
tal
Am
ou
nt
(Bil
lio
ns
of
Do
lla
rs)
Years (Five Year Intervals)
Source: Authors' calculations derived from Tables 1-8 Section IV of the Joint Committee on Taxation, “Background Information On Tax Expenditure Analysis And
Historical Survey Of Tax Expenditure Estimates”, (JCX-15-11), February 28, 2011

Principles to Keep in Mind ->
Incentives Matter
�Perceived unfairness promotes system abuse
�High tax rates encourage avoidance and
evasion.evasion.
�Bad tax systems chase investors away
�Good tax systems attract investors and jobs
25

�Tax reform should fix the problem!
�Policy positions should be based on clearly articulated principles
�The validity of each decision should be checked against these principles
Principles to Keep in Mind ->
against these principles
�Long term solutions are superior to short term fixes
�The best results come from fixing everything at the same time.
�What’s the One Key Thing to Remember?
26

Any Questions???
27