excited-state dynamics of bacteriorhodopsin · excited-state dynamics of bacteriorhodopsin tsutomu...
TRANSCRIPT

EXCITED-STATE DYNAMICS OF BACTERIORHODOPSIN
TsUTOMu KOUYAMA, KAZUHIKo KINOSITA, JR., AND AKIRA IKEGAMIThe Institute ofPhysical and Chemical Research, Hirosawa 2-1, Wako-shi, Saitama 351, Japan
ABSTRACT Near infrared emission of bacteriorhodopsin at neutral pH and at room temperature was characterized by a
large Stokes shift. This characteristic was lost in an acidic pH (-pH 2) where a remarkable enchancement (more than10 times) in the fluorescence quantum yield accompanied the red shift in the main absorption band. It is suggested fromfluorescence polarization measurements that the emission occurs from the first allowed excited state of the retinylidenechromophore, irrespective of pH. We suggest that the large Stokes shift observed at neutral pH is a result of a chargedisplacement (e.g., proton translocation) that occurs immediately after excitation, and is prevented by protonation (inthe ground state) of an amino-acid residue in the protein.
INTRODUCTION
Bacteriorhodopsin, a single species of protein found in thepurple membrane of Halobacterium halobium, hasrecently attracted many workers, primarily because of itsimportant function as a light-driven proton pump. Bacteri-orhodopsin contains a retinylidene chromophore, exhibit-ing a strong absorption band in the visible region. Lightexcitation of the chromophore in light-adapted bacterio-rhodopsin (bR570) initiates a photochemical reactioninvolving several photointermediates ( - K590 L550-M412 -0640- bR570), through which protons are activelytranslocated across the membrane (Stoeckenius et al.,1979; Ottolenghi, 1980). Recent studies using ultra-fastabsorption spectroscopy have suggested another interme-diate that appears -1 ps after excitation and decays to K590with a time constant of -10 ps (Kaufmann et al., 1976;Applebury et al., 1978; Ippen et al., 1978). Characteriza-tion of this newly discovered intermediate, which is nowcalled J625 (Ottolenghi, 1980), is important to better under-stand the energy conversion mechanism in bacterio-rhodopsin, because it is believed that proton transfer andisomerization of the chromophore occur in the picosecondtime scale (Lewis, 1978; Ottolenghi, 1980).A basic question arises as to whether J625 belongs to the
electronically excited or ground state. Fluorometry can bepowerful in answering this question because bacteriorho-dopsin exhibits a detectable emission in the red (or near-infrared) region (Lewis et al., 1976). A recent developmentof picosecond time-resolved fluorometry has allowed one todirectly measure the fluorescence lifetime of the retinyli-dene chromophore (Alfano et al., 1976; Hirsch et al., 1976;Shapiro et al., 1978). Unfortunately, divergence of thevalues reported for the fluorescence lifetime (ranging from1-14 ps) has left the discussions of the primary photoreac-tion confusing.
Address all reprint requests to A. Ikegami.
BIOPHYS. J. © Biophysical Society * 0006-3495/85/01/43/12Volume 47 January 1985 43-54
In the present work, we found that the quantum yield ofthe near-infrared emission was strongly dependent on thepH of the purple membrane suspension. More extensiveinvestigations of the fluorescence intensity and polarizationspectra under various experimental conditions providedimportant information about the excited-state dynamics ofbacteriorhodopsin. Based on these investigations, we con-structed a model of the primary photoreaction that canexplain a large fraction of the recent data on bacteriorho-dopsin.
MATERIALS AND METHODS
Sample PreparationPurple membrane fragments of Halobacterium halobium were preparedaccording to the established procedure (Oesterhelt and Stoeckenius,1974). A stacked sample of the purple membranes was obtained by dryingthe aqueous solution on a quartz plate in vaccuo (Henderson, 1975). Byspraying a very dilute HCI solution on such a stacked sample and thendrying again, another type of the stacked sample (exhibiting blue) wasobtained. Sodium dodecyl sulfate (Bio Rad Laboratories, Tokyo, Japan),i1690 (lauryl ester of sucrose and 90% monoester; Ryoto Co., Tokyo,
Japan), and glycerol (Merck Co., Inc., Tokyo, Japan) used in the presentstudy were sufficiently nonfluorescent.
FluorometrySteady-excitation fluorometry was done with a photon-counting appara-tus, in which red-sensitive photomultiplier tubes (model R943-02, Hama-matsu Corp., Shizuoka, Japan), were operated at - 200C (Kinosita et al.,1981).
Emission spectra were recorded using a 500 W high-pressure Hg lampas an excitation light source; its emission line at 546 nm was selected by aseries of optical filters (Koshin (Kanagawa, Japan] interference filter,Hoya C-500 and B-460 bandpass filters [Hoya, Tokyo, Japan] andCuS04 solution filter). Fluorescence emission from a thermostaticallycontrolled sample was collected at a right angle to the excitation beam,and then passed through an analyzer (Karl Lambrecht, Tokyo, Japan), alight scrambler (depolarizer), an optical cut-off filter (Fuji-Film [Tokyo,Japan] SC-58 or -60), and an emission monochromator (Jobin Yvon;AX - 4 nm). A corrected emission spectrum, S.., (after excitation withunpolarized light) was computed as follows (Wahl, 1979):
Sem (X) [2IV (X) + Ih(X) - 2I' (X) - I'h (X)]/Dem (X), (1)
43$1.00

where Iv and Ih are two principal components of polarized fluorescence(vertical and horizontal) and I'h(X) are the Raman scattering componentsof the solvent. Dn,(X) represents the wavelength dependence of sensitivityof the detection system, which was calculated using a standard tungstenlamp with a color temperature of 2,870 K.
Excitation spectra of the purple membrane suspensions were recordedusing a 1 50-W Xenon lamp as a light source. A light beam from the lampwas passed through an excitation monochromator (Jobin Yvon; AX = 4nm), a Glan prism polarizer (Eiko Seiki Co., Tokyo, Japan), and a seriesof optical filters (a Hoya U-340 bandpass filter and Ni-, Co-, and Cu-SO4solution filters [between 270 and 330 nm] or a Hoya C-500 bandpassfilter and CUSO4 solution filters [between 330 and 680 nm]). Theexcitation light beam was then split into two beams by a half-mirror. Oneof them was directed into a quantum counter, in which an ethylene-glycolsolution of rhodamine B (Wako Junyaku Co., Tokyo, Japan) (between270 and 600 nm) or of methylene blue (Nakarai Co., Kyoto, Japan)(between 500 and 680 nm) was used as a fluorescent screen. The otherbeam was directed into a sample holder; fluorescence emission from asample was passed through a series of cut-off filters (Hoya R-62 andFuji-Film SC-74 or -82), by which a majority of light-scattering compo-nents (Rayleigh and Raman) were removed. The principal components ofthe polarized fluorescence, IJ(X) and I,h(A), were measured simulta-neously with two photomultiplier tubes. Excitation spectra of totalintensity S¢,(X) and anisotropy rc,(X) were computed as follows:
Se.(X) = [I,,(X) + 2I,h(X) - Iv(X) - 2IVh(X)]/E(X) (2)
V[Ivv(X) - IVh(A) -IVv(X) + IVh(X)I[I,,(X) + 2IVh(A) - I(X) - 2Ivh(X)] (
where I'(X) are the Raman scattering components of the solvent; E(X)denotes the intensity of the excitation light beam, which was measuredwith the quantum counter.
Excitation polarization spectra of oriented purple membranes werealso measured using the same fluorometer mentioned above, after theoptical system had been altered. A stacked sample of the purplemembrane was obliquely irradiated with an excitation light beam (mak-ing an angle of 420 with the plane of the sample), and the fluorescenceemitted in a direction normal to the plate was collected. The followingfluorescence polarizations (p' and pP) were recorded (see Appendix A fordetails):
pS(X) = [IVV(X) -IVh(X)]/[Ivv(X) + Ivh(X)] (4)
pP(X) - [Ihv(X) - Ihh(X)]/[Ihv(X) + Ihh(\)], (5)where the first and second suffixes of I denote the directions (vertical orhorizontal) of polarization plane of the excitation light and of the emissionlight, respectively (both the excitation and emission beams were propa-gating in a horizontal plane).The fluorescence quantum yield measurements were done according to
the method originally developed by Weber and Teale (1957) and thenimproved by Eastman (1967). A dilute solution of Ludox (DuPont Co.,Ltd., Wilmington, DE) was used as a standard light scatterer. By usingthis method, the fluorescence quantum yields of quinine sulfate in 0.1 NH2SO4, and of tryptophan in water were determined to be 0.53 and 0.18,respectively; both of these values agree with those used in most of theprevious papers.
RESULTS
Near-Infrared Emission ofBacteriorhodopsin at Neutral pH
Fluorescence emission spectra of light-adapted bacterior-hodopsin were recorded at room temperature, using an
ID
I
n. 1.To-
lebgo (W)M
FIGURE I Corrected emission spectra of fluorescence from the light-adapted (8) and dark-adapted ([1) purple membranes suspended at pH7.0. A dilute suspension of purple membranes (0.15 mg protein/ml) wasexcited at 546 nm. The broken line shows the wavelength dependence ofdetection sensitivity of the present fluorometer.
emission line at 546 nm from a 500-W Hg lamp as anexcitation light source. The closed circles in Fig. 1 show thespectrum observed for the purple membrane suspension atpH 7.0 (10 mM P04). Owing to a high detection sensitivity(even for near-infrared light) of the present fluorometer, itwas possible to extend the recording region up to 900 nm.The broken line in Fig. 1 shows the wavelength dependenceof the detection sensitivity.
The emission spectrum of dark-adapted bacteriorho-dopsin was also determined. Because a direct recording ofits emission spectrum was difficult (because the excitationlight beam needed for this purpose was too intense), thefollowing method was used. First, a purple membranesuspension was irradiated by an excitation beam (from a1 50-W Xe-lamp) that was weak enough to keep bacterio-rhodopsin in the dark-adapted state, and the fluorescenceemission was viewed only through an optical cut-off filterthat removed the majority of the light-scattering compo-nents (including Raman components of the solvent). Withthis optical system, the change of the fluorescence intensity(above 740 nm) during the dark adaptation was followed.When the excitation wavelength was set at 525 nm, wherethe absorption coefficient of bacteriorhodopsin did notchange with its dark-light adaptation reaction, the fluores-cence intensity observed for dark-adapted bacteriorhodop-sin was 0.74 times as strong as that observed for light-adapted bacteriorhodopsin. Then, the purple membranesuspension was irradiated by an intense excitation beam,and the fluorescence was viewed with two detection sys-tems simultaneously. One of them, the same system as wasjust mentioned above, was used to monitor how much theexcitation beam shifted the equilibrium between the dark-and light-adapted states; the other system was equippedwith an emission monochromator. The outputs of these twosystems were recorded while the sample was graduallylight adapted by the excitation beam, and the fluorescenceintensity of dark-adapted bacteriorhodopsin (relative tothat of the light-adapted one) was calculated at eachemission wavelength. The result is shown by the open
BIOPHYSICAL JOURNAL VOLUME 47 198544

squares in Fig. 1. This emission spectrum basically has thesame features as that of light-adapted bacteriorhodopsin,except for the absolute fluorescence intensity.
The fluorescence quantum yield of light-adapted bacte-riorhodopsin was determined to be 2.5 x 1i-', using themethod shown in Materials and Methods. From this resultand the data shown in Fig. 1, the fluorescence quantumyield of dark-adapted bacteriorhodopsin was estimated tobe - 1.8 x 10o-. It has been reported that the dark-adaptedpurple membrane contains an equimolar mixture of tworetinal isomers (1 3-cis and all-trans retinal), whereas thelight-adapted one contains more than 90% of all-transretinal (Oesterhelt et al., 1973; Sperling et al., 1977;Mowery et al., 1979). Thus the fluorescence quantumyields of 1 3-cis and all-trans retinal isomers in bacteriorho-dopsin are 0.7-1.2 x 10⁻⁴ and 2.5-2.7 x 10⁻⁴,respectively, if the trans component in dark-adapted bacte-riorhodopsin has the same emission as in light-adaptedbacteriorhodopsin.
The fluorescence intensity of dark-adapted bacteriorho-dopsin was almost insensitive to temperatures >0°C (opencircles in Fig. 7).
Near-Infrared Emission ofBacteriorhodopsin at Acidic pH
The efficiency of emission increases considerably at acidicpH. In Fig. 2 c, the fluorescence intensity observed above740 nm after excitation at 540 nm (divided by the proteinconcentration) is plotted as a function of pH. This pHtitration curve was obtained by adding HCl (or NaOH) tothe dark-adapted purple membrane suspension (OD560 -
0.04) containing 1 mM phosphate buffer (200C). Underthese conditions, the most intense emission occurredaround pH 1.7, where the fluorescence intensity was -15times stronger than at neutral pH and the absorbance wassmallest. Such a large enhancement in the fluorescenceintensity at acidic pH was also observed in the presence of67% glycerol, in which aggregation of the purple mem-branes was diminished. A similar result was obtained evenwhen bacteriorhodopsin existed as a monomer in a solutioncontaining 10 mM LI 690 (lauryl ester of sucrose and 90%monoester) (Naito et al., 1981). At higher acidity, thefluorescence intensity decreased again. In contrast to thedramatic change in the acidic pH region, only a smallchange was observed in the alkaline pH region.
The pH dependence of the fluorescence intensity corre-lated strongly with the change in the absorption spectrum.Fig. 2 a shows the pH titration curve of the differenceabsorbance (OD565-OD630) observed under the same sol-vent condition (except for the protein concentration). Thetwo pH titration curves (Figs. 2 a and c) show similarprofiles, except for the inversion, in the acidic pH region. Inaddition, both of these titration curves were stronglyaffected by the composition of the solvent. A large
0 4 8 12pH
FIGURE 2 pH titration of the fluorescence intensity shown in c andanisotropy shown in b of the purple membrane. The purple membranesuspension (0.06 mg protein/ml) containing 1 mM P04 (at 200C) wasexcited at 540 nm and fluorescence emission above 740 nm was collected.a shows the difference (dif.) absorbance (OD55-OD630).
enhancement in the fluorescence intensity was alsoobserved when a very low concentration (0.01%) of sodiumdodecyl sulfate (pH 4.0) was added, which was accompa-nied by a red shift of the absorption peak to 600 nm. On thecontrary, in the presence of a higher concentration of salt(10 mM phosphate buffer), the pH at which the fluores-cence intensity became the most intense was shiftedtowards a lower pH (pH 1.4). A similar effect of ionicstrength has been observed in the pH titration of theabsorption spectrum of bacteriorhodopsin (Fischer andOesterhelt, 1979). As investigated, the large enhancementin the fluorescence intensity was always accompanied bythe red shift of the absorption peak (from 560 to 605-610nm). (Another example was obtained when the purplemembrane suspension was deionized.) According to Mow-ery et al. (1979), the red shift of the absorption peak ofbacteriorhodopsin is caused by the formation of the acidicform bRacid, which is replaced with another acidic formbR565 in a highly acidic pH region. The present resultindicates that the acidic form bRacid exhibits a much higherfluorescence quantum yield than the other forms.
Bacteriorhodopsin emission at the acidic pH region wascharacterized by a small Stokes shift, compared with thatobserved at neutral pH. A typical example of pH depen-dence of the emission spectrum of bacteriorhodopsin isshown in Fig. 3, where the spectra are normalized to havethe same intensity at peak. Although the wavelength of the
KOUYAMA ET AL. Excited-State Dynamics ofBacteriorhodopsin 45

IN@ Too off us
FU 3w (m)
FIGURE 3 Corrected fluorescence emission spectra of the purple mem-brane suspended at pH 2.6 (o), pH 0.2 (0), and pH -0.5 (l). Excitationwavelength was 546 nm. 67% Glycerol and various concentrations of HCIwere used as solvents at 200C.
absorption peak was shifted from 560 to 605 nm when thepH was lowered from neutral to 2.6, the wavelength of theemission peak (750 nm) scarcely changed (the emissionbandwidth itself became narrow; see open circles in Fig. 3compared with closed circles in Fig. 1). Further loweringthe pH, however, was accompanied by a large blue shift inthe emission spectrum as well as the blue shift in theabsorption spectrum.
The fluorescence anisotropy was found to change whenthe pH was lowered. The very high value [r (>740 nm) =0.394 ± 0.003] observed at neutral pH was replaced with alower value [r (>740 nm) = 0.36 ± 0.01] whenever thecolor of the purple membrane suspension turned to blue.Fig. 2 b shows the pH titration curve of the fluorescenceanisotropy that was obtained at the same time as the curveshown in Fig. 2 c. In these figures the fluorescence aniso-tropy has considerably decreased at pH 4.0, where thefluorescence intensity is only twice as strong as that atneutral pH; the low constant value for anisotropy is seenover a wide pH region (between 1.0 and 4.0).
Excitation Spectra of the Purple MembraneSuspension
Information concerning the electronic structure of theretinylidene chromophore in bacteriorhodopsin wasobtained from the excitation polarization spectra of thepurple membrane suspensions. In Fig. 4, the fluorescenceanisotropy in a and total intensity in b that were observedabove 740 nm (or 820 nm) upon excitation of a dilutesuspension of the dark-adapted purple membrane (OD560or OD600 0.02) are plotted as a function of excitationwavelength (Eq. 3). The closed circles and open squares inthe figure represent the data obtained at neutral pH (10mM phosphate) and at an acidic pH (pH 4.0; 10 mMacetate buffer and 0.02% sodium dodecyl sulfate), respec-tively. (Replacement of the latter solvent by 67% glycerol(pH 2.6) essentially did not alter the result.) It can be seenfrom the excitation anisotropy spectra that three differentelectronic-transition bands appear in the wavelengthregion above 300 nm, irrespective of pH. That is, a main
band with an apparent peak at 565 nm (or 605 nm at theacidic pH), a weak band -400 nm (or 420 nm), and a veryweak band just above 300 nm. (Let these three bands becalled a, 8,, and f32 bands, respectively.) There is noindication that another weak band exists in the red side ofthe main band; every excitation anisotropy spectrumshowed a constant value over the corresponding wave-length region. The slope from 320 to 370 nm in theexcitation anisotropy spectrum suggests that the f#2 bandextends to 360 nm. It is unlikely that the,f2 band comesfrom an aromatic residue in the protein. (Note that thecircular dichroism spectrum of the purple membrane sus-pension has a negative peak at -320 nm.) Thus the aboveresult suggests that the retinylidene chromophore has threeabsorption bands above 300 nm. This seems valid for boththe two retinal isomers in dark-adapted bacteriorhodopsin,because the light adapation (at neutral pH) is accompa-nied by only a slight change in the absorption spectrumbetween 300 and 470 nm (a slight increase between 370and 440 nm and a slight decrease between 300 and 350nm).
The excitation intensity spectra (Fig. 4 b) gave informa-tion about the excitation-wavelength dependence of thefluorescence quantum yield. The absorption spectra of thepurple membrane suspension at pH 7.0 and at pH 4.0 (inthe presence of 0.02% sodium dodecyl sulfate) are shown inFig. 4 c, where the broken line represents the contributionfrom the turbidity of the purple membrane suspension (thisline was calculated as shown in a previous paper; Kouyamaet al., 1981). At neutral pH, the excitation intensityspectrum can be superimposed considerably well on theabsorption spectrum (after correction for the turbidity).Small discrepancies between these two spectra resultbecause the dark-adapted purple membrane contains twokinds of retinal isomers, whose fluorescence quantumyields are different from each other. It is thus suggestedthat the fluorescence quantum yield of the retinylidenechromophore is almost independent of the excitation wave-length. On the contrary, at the acidic pH, large discrepan-cies were observed between the excitation and absorptionspectra; e.g., note the position of the peak of the a band orthe relative amplitude of the f1,2 bands with reference tothe a band. It is unlikely that possible aggregation of themembranes caused a large distortion in the absorptionspectrum, because a similar result was obtained for thebacteriorhodopsin monomer in 10 mM L1690 solution.Some parts of the discrepancies (e.g., around the mainband) appear to be caused by an equilibrium between theacidic form bRadd with a high fluorescence quantum yieldand the other forms with low fluorescence quantum yields.It seems probable that the membrane containing only theacidic form bR add would have an absorption peak at 610nm. However, to explain the excitation spectra over theentire wavelength region, we needed to consider the possi-bility of variation in the fluorescence quantum yield withexcitation wavelength. It appears that the excitation of 3,S
BIOPHYSICAL JOURNAL VOLUME 47 198546

FIGURE 4 Excitation spectra of the total fluorescence intensity areshown in b and anisotropy are shown in a of the purple membranesuspensions. Fluorescence emission was collected above 740 nm. Thesolvent conditions were (at 200C) 10 mM phosphate buffer, pH 7.0 (.);0.02% sodium dodecyl sulfate and 10 mM acetate buffer, pH 4.0 (E);and 67% glycerol at pH 2.6 (dots). c shows absorption spectra observedunder the corresponding solvent conditions.
or 12 causes a smaller fluorescence quantum yield than theexcitation of the a band. (Because the two spectra in Fig.4 c can be superimposed on each other in the wavelengthregion between 270 and 450 nm, it may be that theefficiency of energy transfer from the aromatic residues tothe retinylidene chromophore does not change much withpH.)
Fluorescene Polarization of the OrientedPurple Membrane
Information concerning the orientation of the absorptiondipole moments of the chromophore was obtained byinvestigating the polarization degrees of fluorescence from
the oriented purple membrane. A stacked sample of thepurple membranes on a quartz plate was obliquely irra-diated by linearly polarized light, and polarized fluores-cence was viewed from the direction normal to the plate(Fig. 10). Depending on whether the polarization plane ofthe incident beam is perpendicular or parallel to the planeof incidence, two kinds of fluorescence polarizationdegrees, pS and pP, are defined (see Fig. 10 and Appendix Afor details). In Fig. 5, the polarization degrees pS (opencircles) and pP (closed circles, the values were negative),are plotted as a function of excitation wavelength; theupper and lower panels show the data obtained for thesample exhibiting purple (neutral pH) and for the sampleexhibiting blue (acidic pH), respectively.
These spectra (as well as the data in Fig. 4 b) wereanalyzed by using Eqs. A7 and A9. The result of analysis isshown in Table I, where y denotes the angle between thedirections of the absorption and emission dipole momentsand AO4 represents its component within the plane of themembrane. Because some of the assumptions used toderive Eqs. A7 and A9 may not reflect the actual system,the physical meaning of each angle appearing in Table Imust be carefully interpreted (see Eqs. A)O-A13); e.g., inthe case that reorientation of the emission dipole momentoccurs during the excited state, the figures about y and AOare only time averages of the corresponding quantities.
Ms*4. .s..
gtt )
FIGURE 5 Excitation spectra of the polarization degrees ps(o) and |PP(-) of fluorescence from oriented purple membranes. Values of pP arenegative over the entire region. A plate with a stacked sample of thepurple membranes was obliquely irradiated with an excitation beam andfluorescence emission above 740 nm was collected in a direction normal tothe plate. The data shown in the lower and upper panels were obtained forthe stacked samples exhibiting purple (at neutral pH) and blue (at anacidic pH), respectively.
KOUYAMA ET AL. Excited-State Dynamics ofBacteriorhodopsin 47

TABLE IORIENTATIONAL CORRELATION BETWEEN THEABSORPTION AND EMISSION DIPOLE MOMENTSOF THE RETINYLIDENE CHROMOPHORE IN THE
PURPLE MEMBRANE
pH Band X r pS -pP y A40 oex
nm degreeNeutral a 560 0.394 0.480 0.425 7* 8* 70
#I 410 0.328 0.458 0.375 20 12 65I2 310 0.12 0.20 0.13 43 33 54Lb 290 0.08 0.10 0.07 47 39 57
Acid a 610 0.368 0.428 0.388 13* 14* 72#I 440 0.298 0.333 0.298 24 23 7102 310 0.12 0.19 0.14 43 33 59Lb 290 0.08 0.07 0.05 47 41 57
Here -y is the angle between the directions of the absorption and emissiondipole moments, whose value was calculated from the fluorescenceanisotropy (Fig. 4) using the formula: r = 2/5 (3/2 cos2 y - 1/2). Thereis the following relationship: cosy = cosOx cosO.. - sinO,x sinO,e cos A0,where the angles 0ex Oem and AX are defined in Fig. 10. The values of 0"xand A40 were calculated using Eqs. A7 and A8.*These values may be considerably overestimated because fluorescencedepolarization effects due to the light scattering and interference withinthe samples were not taken into account.
For the a band, the angle y, between the absorption andemission dipole moments is significantly larger in theacidic form than in the membrane at neutral pH. Simpleexplanations will be either that the acidification made thechromophore somewhat mobile, or that the transfer ofexcitation energy occurs between neighboring chromo-phores at acidic pH. Of the two, the energy transfer is morelikely for the following reasons. First, the fact that y andA4 had similar values implies that the tilt angle of theemission dipole moment with respect to the membranenormal remained the same as that of the absorption dipolemoment. This is an expected behavior for the case ofenergy transfer. Second, dispersion of the acidic form ofbacteriorhodopsin with the detergent L1690 restored ahigh fluorescence anisotropy value of 0.39. Third, theoverlap between the absorption and emission spectra ismuch larger for the acidic form than it is for the neutralform.
DISCUSSION
pH Dependence of the Emission Kinetics ofBacteriorhodopsin
We found that acidification of the purple membranesuspension causes a remarkable enhancement (>10 times)in the fluorescence quantum yield (Fig. 2). The fluores-cence enhancement always accompanied the red shift inthe main absorption band. This phenomenon was alsoobserved for the bacteriorhodopsin monomer in 10 mML1690 solution. However, the tilt angle of the chromophore
with respect to the membrane (Table I) and the efficiencyof energy transfer from the aromatic residues to thechromophore (Fig. 4) are almost independent of pH. It isthus unlikely that the position of the chromophore changesmuch with the acidic transition (bR560 -- bR65). It isprobable that acidification causes some change in the localstructure around the retinylidene chromophore, conse-quently changing the emission mechanism.
The magnitude of the Stokes shift of bacteriorhodopsinfluorescence emission varies with pH. The fluorescenceintensity spectra (excitation and emission) observed atvarious pHs are summarized in Fig. 6. At pH 2.6, thefluorescence excitation and emission spectra exhibit reflec-tion symmetry. The peaks of these two spectra are sepa-rated by a wavenumber of -3,500 cm-'; this value is veryclose to the bandwidth (3,100-3,300 cm- 1) of each spec-trum. These characteristics suggest that the main absorp-tion band (a band) corresponds to a transition to thelowest-excited singlet state. (The difference between thepeak separation and the bandwidth can give a reliablemeasure of the magnitude of energy relaxation in theexcited state [Berlman, 1971].) On the other hand, thefluorescence spectra observed at neutral pH are character-ized by a large Stokes shift (5,000 cm-'). This is the casefor both types of bacteriorhodopsin (bRfra?s with all-transretinal isomer and bRcis with 1 3-cis retinal isomer; see Fig.1). Because the profile of the excitation anisotropy spec-trum does not depend strongly on pH (Fig. 4 a), it isunlikely that, only at neutral pH, the emission occurs froma forbidden state (e.g., 'A-, as has been shown in the case'
,'/ /
.5/r // /X/'
Soo 600 700 800 nm
26 18 16 14
wavemumber (C-])12 11i
FIGURE 6 Fluorescence excitation (broken lines) and emission (solidlines) spectra of the purple membranes suspended at pH 7.0 (lower panel)and at pH 2.6 (upper). The chain line in the lower panel shows theemission spectrum observed at highly acidic pH (-0.5). The vertical scaleis expressed in the unit of quanta per wavenumber.
BIOPHYSICAL JOURNAL VOLUME 47 1985
M--.
44M0.6-a
ua40
44P
Z
48

of a linear polyene [Hudson and Kohler, 1973]. For theretinylidene chromophore with the protonated Schiff base,recent theoretical studies have suggested that the energylevel of the allowed excited state ('B+) is far below theother excited singlet states (Birge, 1981). It appears thatthe emission originates from the first allowed excited state,irrespective of pH.
It has been shown by Mathies and Stryer (1976) thatexictation of retinal to the first allowed excited state ('B+)is accompanied by a large change in the magnitude of thepermanent dipole moment (or shift of a net positive chargetoward the ionone ring). This change can cause a charge todisplace near the retinylidene moiety, as long as a mobilecharge exists. It is likely that the large Stokes shiftobserved at neutral pH is caused by a charge displacementinduced immediately after excitation. At acidic pH, mostof the negative charges in the protein are neutralized sothat a significant charge displacement (or a large Stokesshift) may no longer be induced.
Excited State Dynamics ofBacteriorhodopsin
We found that the fluorescence intensity is almost indepen-dent of temperature at >OOC (Fig. 7), whereas Shapiro etal. (1978) observed a curious temperature dependence ofthe quantum yield of bacteriorhodopsin emission at lowertemperatures. Their data (the closed circles in Fig. 7)shows a sharp temperature dependence, particularlyobvious at <100 K. To explain both the temperaturedependence and the pH dependence of the emission kinet-
-;I--Scr
t-
80 _
F. 1.
60,- 1.04K0 -0
1 I~~~~~00K 0 0 o oT --Q-.o';
7 \ ~~~~~0.96L I_40 _- L 0 20 40 °C
ol 096
ics, we propose a model of the excited-state dynamics ofbacteriorhodopin, as shown in Fig. 8. The model involvesthe following assumptions.
(a) At neutral pH, proton transfer to a base B1 (from aprotonated residue, B2H) occurs immediately after excita-tion:
bR, (trans) a bRIl (trans) abR (trans),
where bR, represents bacteriorhodopsin with the nega-tively charged base B1, which is protonated in bR11; theresidue B2H is deprotonated in bR,,; and the asterisks (*)on the bRs denote the radiative states.
(b) The transition from bRI lo bR*l can occur via twoprocesses; a thermally-activated process and a quantum-mechanically allowed process (tunneling process). The ratek% of the thermal process can be expressed by an Arrhe-nius-type function: k% = exp(-0/T), where T is theabsolute temperature. The rate kq' of the other process istemperature independent. As soon as the state bR*appears, the chromophore is deactivated. The deactivationrate k' is very large (- 1 ps '), irrespective of temperature.Such a transition may be possible if the conformation ofthe chromophore is strongly perturbed by the ionizedresidue B2. In the acidic form bRacid,the residues B1H andB2H are always protonated and the radiative state decaysmuch more slowly.
Some of the assumptions in the above model have beenalready suggested by other workers: the idea of protontransfer has been proposed by Lewis (1978) and byMathies and Stryer (1976) and the idea of the tunnelingprocess was hinted by the observation of the deuteriumisotope effect on the primary photochemical events ofbacteriorhodopsin (Applebury et al., 1978).Owing to assumption b, the fluorescence quantum yield
can be approximated by the following function of tempera-ture. (Its derivation is given in Appendix B):
Q(T) = Q(o) + [Q(O) - Q(o)]/[1 + exp (0/T - 0T)],
I I.SIBSIm.." o-.
0 100 200 300 K
Temperature
FIGURE 7 Temperature dependence of the fluorescence intensity ( F.L.)observed above 740 nm after excitation at 540 nm of the dark-adaptedpurple membrane (open circles) (data from this paper). Temperaturedependence of the quantum yield Q(T) of bacteriorhodopsin emissionreported by Shapiro et al. (1978) (closed circles). Solid and broken linesare the theoretical curves that were calculated using the parameters Q(O)= 73 x Q(300 K), Q(oo) = 0.76 x Q(300 K), TC = 78 K, and 0 = 600 K. Inderivation of the broken line, it was assumed in Eq. B5 that f (>740nm)/f11(>740 nm) = 0.5. FIGURE 8 A model of the excited state dynamics of bacteriorhodopsin.
KOUYAMA ET AL. Excited-State Dynamics ofBacteriorhodopsin 49

where Q(0) and Q(oo) are the fluorescence quantum yieldsthat would be observed at the two extreme temperatures;T, is a constant with a dimension of temperature; and 0multiplied with a Boltzmann constant kB represents theactivation energy of the proton transfer via the thermalprocess. (The first and second terms in the above equationrepresent the quantum yields of emission from bR* andfrom bR*, respectively.) The solid curve in Fig. 7 repre-sents the fluorescence quantum yield that was predictedfrom this equation, in which the following values of theparameters were assumed; T, = 78 K, Q(0)/Q(300 K) =73, Q(oo)/Q(300 K) = 0.76, and 0 = 600 K. The fluores-cence intensity (above 740 nm) that would be predictedusing the same values of the parameters (and Eq. B5) isshown by the broken line in Fig. 7. There is excellentcoincidence between the theoretical curves and the experi-mental data, suggesting that the present model explains atleast some essential parts of the primary photochemicalevents of bacteriorhodopsin.
At room temperature, emission from bR* is calculatedto be -3 times as intense as emission from bR*. At lowtemperatures, emission from bRT is expected to becomedominant; - 150 K, its emission is expected to be as intenseas emission from the other emitting state (bRf). Thisdependence agrees with previous reports that a sharptemperature dependence of the emission spectrum profileoccurs at 100-150 K, below which the Stokes shiftbecomes smaller. At nitrogen temperature, the gapbetween the absorption peak (at 580 nm) and the emissionpeak (at 720 nm) is -3,500 cm-' (Lewis et al., 1976;Shapiro et al., 1978).
Fluorescence Quantum Yield and LifetimeThe question arises as to whether or not the emittingspecies (at neutral pH) is identical to the excited state fromwhich the K590 intermediate originates. To answer thisquestion, we need to compare the experimentally observedfluorescence lifetime with the lifetime calculated from thefluorescence quantum yield. With respect to the fluores-cence quantum yield Q (at room temperature), Lewis et al.(1976) first estimated the value of _ 10-4, whereas a muchsmaller value (Q -2 x 10⁻⁵) was reported by Govindjee etal. (1978). The latter value is considerably smaller than thevalue of 1-2.5 x 10⁻⁴ reported by Shapiro et al. (1978) andthe value of the present estimation (Q = 2.5-2.7 x 10⁻⁴ forbRlralu). It seems probable that Govindjee et al. (1978)underestimated the contribution from the fluorescenceemitted in the longer wavelength region (e.g., above 700nm; see Fig. 9).'
'Kriebel et al. (1979) reported that the emission peak shifted from 735 to715 nm as the intensity of the excitation light was reduced from 3 W/cm2to 50 MW/cm2. To check whether the emission that we observed comes
from bR or from some photoproduct (e.g., a pseudo-bR proposed byKriebel et al., 1979), we changed the intensity of the excitation light in the
, | f ~i, _Si..wusmgt (urn)
FIGURE 9 Comparison of the fluorescence emission spectra of bacteri-orhodopsin (at neutral pH) reported from the various laboratories: (---)from Lewis et al. (1976); (- *. -) from Gillbro et al. (1977); (-*-)from Govindjee et al. (1978); (-) from Shapiro et al. (1978); and (e)from the present paper. The spectra measured at room temperature (or at250 K for the data of Shapiro et al., 1978) are compared. The verticalscale is expressed in the unit of quanta per wavelength.
By using the present estimation and the radiative life-time of -6 ns (as calculated from the absorption spec-trum), the fluorescence lifetime of -2 ps was calculated forthe case in which there were no branching process in theexcited state (assuming a single-exponential fluorescencedecay). This calculated value is close to the experimentallifetime (1.5-3 ps) inferred by Alfano et al. (1976) and byShapiro et al. (1978), whereas a longer lifetime (15 ps) wasreported by Hirsch et al. (1976). Although the data ofHirsch et al. (1976) seems to show the highest timeresolution, we have noticed that their fluorescence decaycurve can no longer be described with a single-exponentialfunction. The decay constant of 15 ps seems to have beenderived from an analysis of the tail portion of the decaycurve. The moment-method analysis (Isenberg and Dyson,1969) would give a shorter average lifetime ((r') / (r =6 ps), which means that the decay curve consisted ofdominant components with decay constants <<6 ps and aminor component with the decay constant of 15 ps. Veryrecently, Sharkov et al. (1983) reported that the fluores-cence lifetime is <2 ps.
The present model predicts a nonsingle-exponentialfluorescence decay curve, especially at room temperature.The lifetime of bR* is calculated to be -0.4 ps and thelifetime of bR, is expected to be 1-2 ps if the radiativelifetime is not affected by the charge displacement.
range between 10-7 and 10-3 W/cm2 and collected fluorescence passingthrough various optical filters (Fuji-Film SC-66 or -74). We then foundthat the ratio of the fluorescence intensity above 740 nm to the intensityabove 660 nm was always 0.55, independent of the intensity of theexcitation light. This result allowed us to conclude that our spectrumshown in Fig. 9 represents the emission spectrum of bR. Because thesensitivity of the photomultiplier tube used decreases monotonously butslowly with increasing wavelength, the above result indicates that thecenter of the emission spectrum of bR should be around or above 740 nm,which is consistent with our spectrum in Fig. 9.
BIOPHYSICAL JOURNAL VOLUME 47 198550
Because the emission spectra of bR7 and of bRX aresupposed to be different from each other, the fluorescencedecay curve is expected to depend on the emission wave-length. Although this dependence has not been discussed inprevious reports, it may explain the discrepancy among thevalues reported for the fluorescence lifetime at roomtemperature.
The present model can explain quantitatively the fluo-rescence lifetimes observed at various temperatures: r = 40ps at 90 K (Alfano et al., 1976) and T = 60 ± 15 ps at 77 K(Shapiro et al., 1978). Because at low temperature bacteri-orhodopsin emission is expected to come mainly from thebRt, the fluorescence decay curve can be approximatedwith a single-exponential decay, the decay constant ofwhich is expressed as the following function of tempera-ture
Tr(T) = TOQ(0)/[1 + exp(O/Tc - T)],
where r0 is the radiative lifetime of the retinylidene chro-mophore whose value is expected to be -6 ns from theabsorption spectrum. When values of Q(0) = Q(300 K) x73 = 0.02 (±0.002), 0 = 600 K, and Tc = 78 K are used,the fluorescence lifetime at 90 K and at 77 K arecalculated to be 30 (±4) ps and 60 (±10) ps, respectively.Coincidence between the theoretical and experimentalfluorescence lifetimes is good. It is likely that the mainpathway of the trans photocycle involves the excited statesbR* and bRa.
Primary Photochemical Reaction ofBacteriorhodopsin
In Fig. 8, we have supposed that bR,,(cis) corresponds tothe K590 intermediate. According to the above assignment,the photoreaction after excitation of Ksgo does not involvethe excited state bRi. Because bR, is supposed to be themain emitting species at low temperature, the presentmodel is consistent with the observation that K590 is muchless fluorescent than bR570 at low temperature (Govindjeeet al., 1978). It is also easy to explain the recent observa-tion that the reverse reaction Ks90 -, bR570 is much fasterthan the forward reaction (Kryukov et al., 1981).An argument against the identification of the emitting
species as a photochemically important excited state wasproposed previously (Ottolenghi, 1980; Birge, 1981). Suchan argument was based on the interpretation that, espe-cially at low temperature, the rise time of the K590 state isshorter than the fluorescence lifetime. The rates reportedfor K590 formation are, for example, I0 ps at room tempera-ture, 20 ps at 70 K, and 36 ps at 4 K (Applebury et al.,1978). However, it is important to notice that the quantumefficiency of formation of the emitting species is not smallbut rather close to 1, and therefore that its formation anddecay processes should be accompanied by significantabsorption changes. These corresponding changes are not
seen in the data reported by Applebury et al.2 It seemspossible that the kinetics of the primary photoreactiondepend on some parameters other than temperature (e.g.,the intensity of excitation light). We feel that a simulta-neous measurement of fluorescence and absorption kineticsis necessary for quantitative discussion.
APPENDIX A
Fluorescence Polarization in an AnisotropicSystem
Here we shall consider the polarization of fluorescence from the retinyli-dene chromophores in a stacked sample of the purple membranes.Generally, the polarization degree of fluorescence depends on the spatialarrangement of the optical components in a fluorometer as well as theorientational correlation between absorption and emission dipolemoments of a fluorophore. When fluorophores (in the ground state) areisotropically oriented, the most convenient arrangement of optical compo-nents is obvious; i.e., it is usual to measure fluorescence emission at a rightangle to the propagation direction of the excitation light beam (Eq. 3).When fluorophores are anisotropically oriented, the best arrangementdepends on what kind of information must be extracted about thefluorophore. Our present interest is to obtain information about theorientation of the absorption and emission dipole moments of the retinyli-dene chromophore with reference to the purple membrane.
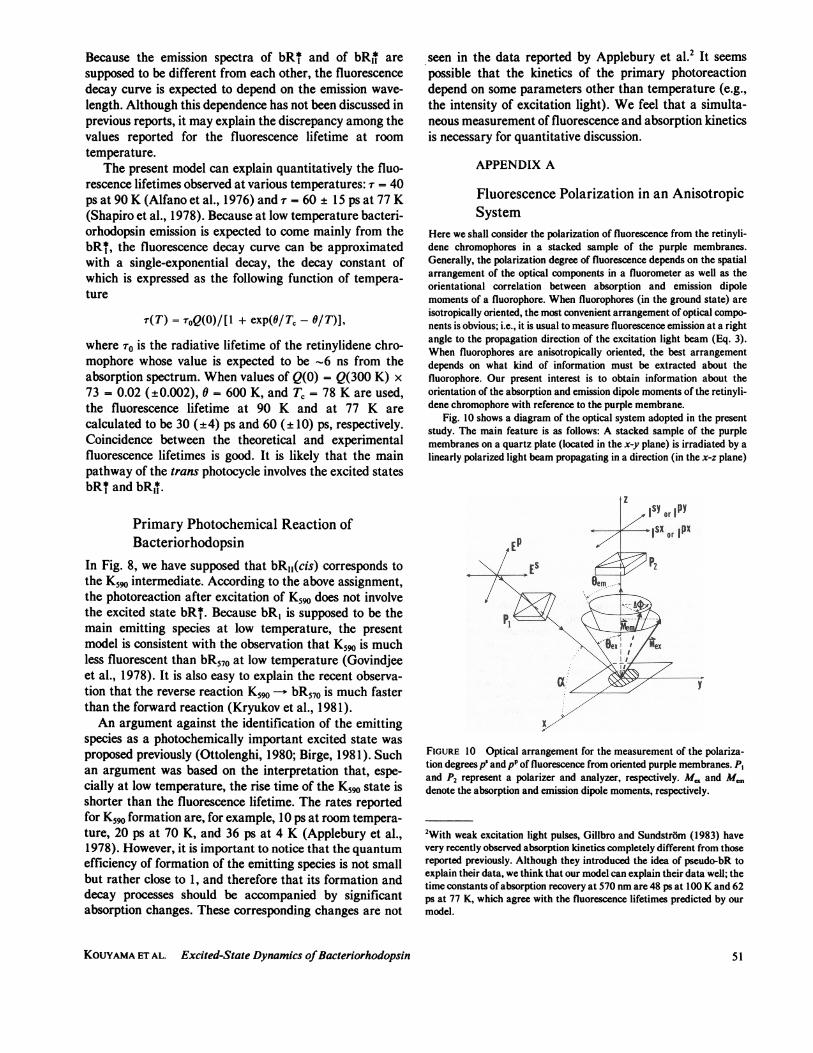
Fig. 10 shows a diagram of the optical system adopted in the presentstudy. The main feature is as follows: A stacked sample of the purplemembranes on a quartz plate (located in the x-y plane) is irradiated by alinearly polarized light beam propagating in a direction (in the x-z plane)
.I
Et ~~~~~z
If>o
FIGURE 10 Optical arrangement for the measurement of the polariza-tion degrees p' and pP of fluorescence from oriented purple membranes. PIand P2 represent a polarizer and analyzer, respectively. M,,, and M,,.denote the absorption and emission dipole moments, respectively.
2With weak excitation light pulses, Gillbro and Sundstrom (1983) havevery recently observed absorption kinetics completely different from thosereported previously. Although they introduced the idea of pseudo-bR toexplain their data, we think that our model can explain their data well; thetime constants of absorption recovery at 570 nm are 48 ps at 100 K and 62ps at 77 K, which agree with the fluorescence lifetimes predicted by ourmodel.
KOUYAMA ET AL. Excited-State Dynamics ofBacteriorhodopsin 51

that makes an angle of a with x-axis. Fluorescence emission is viewedfrom a direction normal to the plate. Now, let us define the followingpolarization degrees of fluorescence:
pS = (Isx - ISY)/(Isx + Isy) (Al)
pP = (IPX - JPY)/(JPx + IPY), (A2)
where ISX and IJY (or IPX and IPY) are the principal components ofpolarized fluorescence that are observed when the polarization plane ofthe incident light beam is perpendicular (or parallel) to the plane ofincidence.
The Simplest Case. We shall first consider the fluorescencepolarizations p' and pP in such a system that (a) all of the purplemembranes are stacked parallel to the plate, (b) the chromophores in thepurple membrane are distributed with perfect C3 symmetry and all ofthem have the same tilt angle with respect to the membrane normal, and(c) energy transfer between the neighboring chromophores is absent.Then the fluorescence intensities appearing in Eqs. Al and A2 can beexpressed as follows
Is =Q'Es sin2 Oex sin2 Om( + cos 2A5) (A3)
Jsy - Q'E5 sin2 OReS sin2 Oem (-4 cos 2A\k) (A4)
I' = Q'E' sin2 exm [2 cos2a' cos24ex
2 +O' 2 2 co 2 cos 2A+)] (AS)
IP-= Q'EP sin2 0em cos2 a' cos2 oex
+ sin2a' sin2 Oex(2 + cos 2/A) , (A6)
where E and EP are the intensities of the excitation light beam within themembrane (ES and EP are not necessarily equal to each other); Oex and 0emare the tilt angles of the absorption and emission dipole moments withrespect to the membrane normal; AO is the angle within the plane of themembrane between the two dipole moments; Q' is a constant, the value ofwhich depends on the fluorescence quantum yield; and the angle a' isrelated to the angle a by the relation, sina = n sina', where n is therefractive index of the membrane (this is valid only when the thickness ofthe stacked sample is much larger than the wavelength of the incidentlight; otherwise, the constant n should have a smaller value). InsertingEqs. A3-A6 into Eqs. Al and A2, we obtain
p5 =I
cos 2Ak (A7)2
PIcos 2AO
sin2 a' sin2 O
pP = -2 2 cos2 a' cos2 9ex + sin2 a sin2 OexThe last equation can be written as follows:
-2(PP + l)tan2a'=ct2Oex, (A9)
Thus measurements of the polarization degrees pS and pP will allow us todetermine the angle AO~ as well as the angle Oex
Actual System. In the above derivation, we have not takeninto account the possibilities of rotational motion of the chromophore inthe membrane, of energy transfer between the neighboring chromo-phores, and so on. Now we shall consider their effect on the polarizationdegrees.
If the chromophore has a rotational mobility, Eq. A7 should be writtenas follows
pS- (sin2' sinO em cos2AO)(2 sin Ocx sin Oem)
(AIO)
where ( ) denotes the average of the possible orientation of the absorptionand emission dipole moments.
If energy transfer occurs between the neighboring chromophores(existing in the same membrane), Eq. A7 should be rewritten as follows(Eq. A9 is unchanged):
p = [1 -2 (7 + 7')] cos 2A5
+ - 7- ')sin 2AO, (All)4
where the sum v + q' is the probability that fluorescence emission comesfrom chromophores other than an initially excited chromophore (andthose oriented parallel to it) and the term q - 7' is a result of thedifference in the efficiency of energy transfer between two acceptorsexisting at the same distance from a donor (Kouyama et al., 1981).
Disorder in the stacking of the purple membranes will cause a slightmodification in Eqs. A7 and A9:
ps =I
cos2A( (O .)m Cot2 0ex) + OD((O) COS Oem) (A 12)2
~j + I)tan a' cot2O0 e
.[1 +- (O' )( (tan Oex
+ Omm
1 - 2 cot'Oex)
(A13)
where Om is the tilt angle of the membrane with respect to the plate, and( ).m denotes the average of the possible orientations of the purplemembranes in a stacked sample.
APPENDIX B
Emission Kinetics of BacteriorhodopsinWe shall consider the emission kinetics of bacteriorhodopsin, assumingthe main processes in the excited state can be described by the scheme asshown in Fig. 8. The time course of the probability of finding each excitedstate after excitation of one molecule of bacteriorhodopsin at time 0 isgiven by the following equations:
bR * (t) = exp(-K2 t)
bR * (t) = kwd [exp (-K,t) - exp (-K2t)]/(K2 -KI).
(Bla)
(Blb)
Here K, = kf + knr + kw and K2 = k + kA,; kf and knr are the rateconstants of radiative (fluorescence) and nonradiative processes to thecorresponding ground states, respectively; and kCd is the rate constant ofthe charge displacement (or the proton transfer; kcd = k" + kcqdj wherek" and kq', represent the rate constants of the thermally activated andthe quantum mechanically allowed processes, respectively). The fluores-
BIOPHYSICAL JOURNAL VOLUME 47 198552

cence intensity that would be observed at time t and at wavelength X, F(t;A), is given by
F(t;X) = k *f1 (X) * bRj(t) + kl' *f11(X) * bR (t), (B2)
where f (X) and f ,(A) represent the profiles of the emission spectra frombRl and from bR*, respectively, and they satisfy the equation: ffjj(X)dA = 1. Substitution of Eq. BI into B2 gives the followingequation
F(t; A) = Cl (X) exp (-Kl t) + C2(X) exp (-K2t), (B3)
where
CI(X) == k' * fi(X) + kfX * kwd * fjj()/(K2 - K) (B4a)
C2 =-kf * kcd *fl (X)/(K2 - K ) (B4b)
The fluorescence emission spectrum and quantum yield are given by
f (X) = Q, fi (X) + (kod/K I ) Qll fil (X) (B5)
Q = Q1 + (kcd/KI) Qll, (B6)where
Ql = kilKI = k ±l(kl+ k4 + kqm + k)th (B7a)
Qll = OIK2 = kl/(k1 + kll). (B7b)
When only the rate constant k" is dependent strongly on temperatureand its temperature dependence can be expressed by an Arrhenius-typefunction [<x exp( -0/7)], Eq. B7a is reduced to
QI(T) = kl/(kf + kX + kqdm)* [1 + exp (/ITc- 0/T)]. (B8)
When the second term in Eq. B6 does not vary much with temperature,the fluorescence quantum yield Q can be approximated as follows
Q(T) = Q(oo) + [Q(O) - Q(mo)]/[1 + exp (/ITc - 0/T)], (B9)
where Q(O) and Q(oo) are the quantum yields that would be observed attwo extreme temperatures.
We are grateful to Drs. W. Stoeckenius, R. R. Birge, T. Kobayashi, R. A.Bogomolni, P. K. Wolber, Y. Kimura, and T. Furuno for their kindsuggestions. We thank Mrs. Nakajima for her skillful assistance.
This work was supported by a research grant for Solar Energy ConversionPhotosynthesis given by Japanese Science and Technology Agency and bygrants-in-aid from the Ministry of Education, Science and Culture ofJapan.
Receivedfor publication 6 June 1983 and infinalform 8 May 1984.
REFERENCES
Alfano, R. R., W. Yu, R. Govindjee, B. Becher, and T. G. Ebrey. 1976.Picosecond kinetics of the fluorescence from the chromophore of thepurple membrane protein of Halobacterium halobium. Biophys. J.16:541-545.
Applebury, M. L., K. S. Peters, and R. Rentzepis. 1978. Primaryintermediates in the photochemical cycle of bacteriorhodopsin. Bio-phys. J. 23:375-382.
Berlman, I. B. 1971. Handbook of Fluorescence Spectra of AromaticMolecules. Academic Press, Inc., New York. 473 pp.
Birge, R. R. 1981. Photophysics of light transduction in rhodopsin andbacteriorhodopsin. Ann. Rev. Biophys. Bioeng. 10:315-354.
Eastman, J. W. 1967. Quantitative spectrofluorimetry: the fluorescencequantum yield of quinine sulfate. Photochem. Photobiol. 6:55-72.
Fischer, U., and D. Oesterhelt. 1979. Chromophore equilibra in bacterior-hodopsin. Biophys. J. 28:211-230.
Gillbro, T., A. N. Kriebel, and U. P. Wild. 1977. On the origin of the redemission of light adapted purple membrane of Halobacterium halo-bium. FEBS (Fed. Eur. Biochem. Soc. ) Lett. 78:57-60.
Gillbro, T., and V. Sundstrom. 1983. Picosecond kinetics and a model forthe primary events of bacteriorhodopsin. Photochem. Photobiol.37:445-455.
Govindjee, R., B. Becher, and T. G. Ebrey. 1978. The fluorescence fromthe chromophore of the purple membrane protein. Biophys. J.22:67-77.
Henderson, R. 1975. The structure of the purple membrane fromHalobacterium halobium. Analysis of the x-ray diffraction pattern. J.Mol. Biol. 93:123-138.
Hirsch, M. D., M. A. Marcus, A. Lewis, H. Mahr, and N. Frigo. 1976. Amethod for measuring picosecond phenomena in photolabile species.The emission lifetime of bacteriorhodopsin. Biophys. J. 16:1399-1409.
Hudson, B. S., and B. E. Kohler. 1973. Polyene spectroscopy: the lowestenergy excited singlet state of diphenyloctatetrane and other linearpolyenes. J. Chem. Phys. 59:4984-5002.
Ippen, E. P., C. V. Shank, A. Lewis, and M. A. Marcus. 1978.Subpicosecond spectroscopy of bacteriorhodopsin. Science (Wash.DC). 200:1279-1281.
Isenberg, I., and R. D. Dyson. 1969. The analysis of fluorescence decay bya method of moments. Biophys. J. 9:1337-1350.
Kaufmann, K. J., P. M. Rentzepis, W. Stoeckenius, and A. Lewis. 1976.Primary photochemical processes in bacteriorhodopsin. Biochem. Bio-phys. Res. Commun. 68:1109-1115.
Kinosita, K., Jr., R. Kataoka, Y. Kimura, 0. Gotoh, and A. Ikegami.1981. Dynamic structure of biological membranes as probed by1,6-diphenyl-1,3,5-hexatriene: a nanosecond fluorescence depolariza-tion study. Biochemistry. 20:4270-4277.
Kouyama, T., Y. Kimura, K. Kinosita, Jr., and A. Ikegami. 1981.Location and orientation of the chromophore in bacteriorhodopsin:analysis by fluorescence energy transfer. J. Mol. Biol. 153:337-359.
Kriebel, A. D., T. Gillbro, and U. P. Wild. 1979. A low temperatureinvestigation of the intermediates of the photocycle of light-adaptedbacteriorhodopsin: optical absorption and fluorescence measurements.Biochim. Biophys. Acta. 546:106-120.
Kryukov, P. G., Yu. A. Lazrev, Yu. A. Matveetz, E. L. Terpugov, L. N.Chekulaeva, and A. V. Sharkov. 1981. Picosecond spectroscopy ofdeuterated bacteriorhodopsin on the primary photochemical event.Stud. Biophys. 83:101-108.
Lewis, A. 1978. The molecular mechanism of excitation in visualtransduction and bacteriorhodopsin. Proc. Natl. Acad. Sci. USA.75:549-553.
Lewis, A., J. P. Spoonhower, and G. J. Perreault. 1976. Observation oflight emission from a rhodopsin. Nature (Lond. ). 260:675-678.
Mathies, R., and L. Stryer. 1976. Retinal has a highly dipolar verticallyexcited singlet state: implications for vision. Proc. Natl. Acad. Sci.USA. 73:2169-2173.
Mowery, P. C., R. H. Lozier, Q. Chae, Y.-W. Tseng, M. Taylor, and W.Stoeckenius. 1979. Effect of acid pH on the absorption spectra andphotoreactions of bacteriorhodopsin. Biochemistry. 18:4100-4107.
Naito, T., Y. Kito, M. Kobayashi, K. Hiraki, and T. Hamanaka. 1981.Retinal-protein interactions in bacteriorhodopsin monomers, dispersedin the detergent L-1960. Biochim. Biophys. Acta. 637:457-463.
Oesterhelt, D., and W. Stoeckenius. 1974. Isolation of the cell membraneof Halobacterium halobium and its fractionation into red and purplemembrane. Methods Enzymol. 31:667-678.
Oesterhelt, D., M. Meentzen, and L. Schuhmann. 1973. Reversibledissociation of the purple complex in bacteriorhodopsin and identifica-tion of 13-cis and all-trans retinal as its chromophores. Eur. J.Biochem. 40:453 463.
KOUYAMA ET AL. Excited-State Dynamics ofBacteriorhodopsin 53

Ottolenghi, M. 1980. The photochemistry of rhodopsin. Advan. Photo-chem. 12:97-200.
Shapiro, S. L., A. J. Campillo, A. Lewis, G. J. Perreault, J. P. Spoon-hower, R. K. Clayton, and W. Stoeckenius. 1978. Picosecond andsteady state, variable intensity and variable temperature emissionspectroscopy of bacteriorhodopsin. Biophys. J. 23:383-393.
Sharkov, A. V., Yu. A. Matveetz, S. V. Chekalin, A. V. Konyashchenko,0. M. Brekhov, and B. Yu. Rootskov. 1983. Fluorescence of bacterior-hodopsin under subpicosecond light excitation. Photochem. Photobiol.38:108-111.
Sperling, W., P. Carl, C. N. Rafferty, and N. A. Dencher. 1977.
Photochemistry and dark equilibrium or retinal isomers and bacterior-hodopsin isomers. Biophys. Struct. Mech. 3:79-94.
Stoeckenius, W., R. H. Lozier, and R. Bogomolni. 1979. Bacteriorhodop-sin and the purple membrane of halobacteria. Biochim. Biophys. Acta.505:215-278.
Wahl, P. 1979. Time-resolved fluorometry. In Biochemical Fluorescence:Concepts. R. F. Chen, and H. Edelhoch, editors. Marcel Dekker Inc.,New York. 1-41.
Weber, G., and F. W. J. Teale. 1957. Determination of the absolutequantum yield of fluorescent solutions. Trans. Faraday Soc. 53:646-655.
54 BIOPHYSICAL JOURNAL VOLUME 47 1985