exergy cost assessment in global mining -...
TRANSCRIPT

2014 55
Rosa Adriana Domínguez Vega
Exergy Cost Assessment in Global Mining
Departamento
Director/es
Instituto Universitario de Investigación MixtoCIRCE
Valero Capilla, AntonioValero Delgado, Alicia
Director/es
Tesis Doctoral
Autor
Repositorio de la Universidad de Zaragoza – Zaguan http://zaguan.unizar.es
UNIVERSIDAD DE ZARAGOZA

Departamento
Director/es
Rosa Adriana Domínguez Vega
EXERGY COST ASSESSMENT IN GLOBAL MINING
Director/es
UNIVERSIDAD DE ZARAGOZAInstituto Universitario de Investigación Mixto CIRCE
2014
Valero Capilla, AntonioValero Delgado, Alicia
Tesis Doctoral
Autor
Repositorio de la Universidad de Zaragoza – Zaguan http://zaguan.unizar.es

Departamento
Director/es
Director/es
Tesis Doctoral
Autor
Repositorio de la Universidad de Zaragoza – Zaguan http://zaguan.unizar.es
UNIVERSIDAD DE ZARAGOZA

Exergy Cost Assessmentin Global Mining
By Rosa Adriana Domínguez Vega
PhD Dissertation
Directed by:
Dr. Antonio Valero CapillaDr. Alicia Valero Delgado
Zaragoza, 2014


Acknowledgements
I want to express my gratitude to CONACYT (Consejo Nacional de Ciencia y Tecnología) Mexicofor the financial support during the development of this dissertation.
I want to thank Profr. Antonio Valero and Dra. Alicia Valero for the opportunity to work withthem and for their guidance and valuable comments during these years, which made possiblethe development of this thesis. I would like to thank Prof. Wojciech Stanek from the Instituteof Thermal Technology in the Silesian University of Technology, who was always willing to helpme during my 3-month stay in his Institute.
I want to thank my colleagues and the administrative staff of CIRCE, of the Mechanical En-gineering Department, and of the University of Zaragoza for the friendly work environmentduring these years.
Finally, I want to thank my parents for their unconditional support.
i


Abstract
Economic, social and technological development of current society is strongly linked to the ex-traction of mineral resources. A society which is constantly growing consumes these resourcesfast and almost unlimited. The continual increase of worldwide demand of mineral resourcesis especially enhanced by the economic growth of China and other Asian countries, which re-quire large amounts of raw materials in the construction, infrastructure and manufacture sec-tors. The depletion of non-renewable natural resources is the consequence of this progress andis the greatest challenge that the mining industry has to face. Consequently, future availabilityof mineral resources is increasingly gaining importance in the strategic government planning.
It is well known that once the minerals have been extracted, several processes which con-sume large amounts of energy are needed in order to produce useful commodities. The energyconsumption in mineral extraction and processing depends mainly on the minerals quality andcomposition. As a consequence of the depletion of mineral deposits, the energy requirementsand environmental burden are constantly increasing due to a general reduction of global oregrades. Accordingly, more materials need to be processed to obtain an equivalent amount ofmetal. In this regard, a critical issue that mineral industry needs to overcome is the energyavailability required for mineral extraction and processing.
Therefore, it is of imperative importance to analyze and understand the processes involvedin the mining industry so as to determine potential improvements while accounting for the de-pletion factor of raw materials. The first activity can be carried out via a thermoeconomic ap-proach. Thermoeconomics has been traditionally used for the optimization of thermal powerplants using exergy as the unit of measure. In this PhD, the thermoeconomic analysis is adaptedand modified to cover the complexities of mining and metallurgical processes, where raw ma-terials in addition to energy flows come into play. That said, if the scarcity factor of mineralresources wants to be taken into account in the analysis, an additional variable needs to be in-cluded. This is done through the exergoecological approach proposed by Valero et al. (2003).Conceptually, the Exergoecological method allows for an evaluation of mineral resources bymeans of the Exergy Replacement Cost, which is the exergy required to return to the initialstate of concentration and composition found in mines, the minerals that have been totallydispersed throughout the crust once their useful lives have come to an end. Accordingly, theaim of this PhD is to adapt and apply thermoeconomic methodologies so as to perform an ab-solute Life Cycle Assessment (LCA) of mineral resources: a conventional one from the cradle tothe entry gate (production of the refined raw material) and an additional one from the grave tothe cradle, thereby accounting for the depletion factor of minerals.
In order to perform an exergy analysis of mining and metallurgical processes, a set of objec-tives were defined. The first specific objective of this PhD thesis was to accomplish a detailedstudy of technologies and associated energy consumptions in the mining and metallurgical in-dustry. A second objective was to analyze the influence of technological learning and declin-
iii

ing ore grades on the availability of world non-fuel mineral resources, to become acquaintedif technological breakthroughs that have occurred can preclude the rising energy demand inthe mining industry. With the results obtained in the first and second activities, an importantimprovement in the exergoecological methodology was presented: exergy replacement costswhich had been traditionally assessed in a static way, could be modified taking into accountthe long-term decline in ore grades. A further improvement carried out in this PhD was to solvethe allocation problem among products, by-products and wastes commonly appearing in themining and metallurgical industry. Accordingly, a new allocation procedure to be used in theThermoecological analysis applied to mining and metallurgical processes has been proposedbased on the newly obtained exergy replacement costs. The fifth objective of this PhD was tomerge the Thermoeconomic analysis with the Thermoecological Cost methodology developedby the ITC group in the Silesian University of Technology, so as to combine the strength of bothapproaches for the analysis of the mineral’s industry. Finally, each of the objectives describedabove were applied to different case studies.
iv

Resumen
El desarrollo económico, social y tecnológico de la sociedad actual está fuertemente ligado a laextracción de recursos minerales. Una sociedad en constante crecimiento que consume estosrecursos rápida e ilimitadamente. El continuo incremento de la demanda mundial de recursosminerales se debe en gran medida al crecimiento económico de China y otros países asiáticos,que demandan una gran cantidad de materias primas en los sectores de la construcción, lainfraestrucuta y la manufactura. El agotamiento de los recursos naturales no renovables es laconsecuencia de este progreso y constituye el mayor reto al que se enfrentará la industria min-era. De ahí que la disponibilidad futura de los recursos minerales está adquiriendo importanciaen los planes estratégicos de los gobiernos.
Una vez que los minerales han sido extraídos, una serie de procesos que consumen grandescantiades de energía son necesarios para producir materias primas utilizables. El requerim-iento energético de la extracción de minerales y en su posterior procesamiento depende princi-palmente de la calidad y composición del mineral. Considerando la disminución en la ley min-eral a nivel global, los consumos energéticos y los impactos ambientales se han venido incre-mentando continuamente. Adicionalmente, es necesario procesar más material para obteneruna cantidad equivalente de metal. En este sentido, uno de los factores críticos que la indus-tria minera tendrá que afrontar será la disponibilidad de energía para la extracción y el proce-samiento de los minerales.
Por lo anterior, es de suma importancia analizar y entender los procesos de la industriaminera para determinar las posibles mejoras cuando se tiene en cuenta el factor de escasezde las materias primas. La primera actividad puede realizarse a través de un enfoque termoe-conómico. La Termoeconomía ha sido utilizada tradicionalmente para la optimización de plan-tas termoeléctricas haciendo uso de la exergía como unidad de medida. En esta tesis doctoral,el análisis termoeconómico es adaptado y modificado, teniendo en cuenta la complejidad delos procesos mineros y metalúrgicos, en los cuales se presentan flujos de materias primas yenergía. Cuando se considera el factor de escasez de los recursos minerales en este tipo deanálisis, es necesario incluir una variable adicional. Esto se lleva a cabo a través del enfoque Ex-ergoecológico propuesto por Valero et al. (2003). Conceptualmente, el metódo Exergoecológicopermite realizar una evaluación de los recursos minerales utilizando los costos exergéticos dereposición, los cuales representan la exergía requerida para restituir los minerales que han sidototalmente dispersados en la corteza terrestre una vez que su vida útil ha terminado, al es-tado inicial de composición y concentración en el que se encuentran en las minas. De ahí queesta tesis tiene como objetivo principal adaptar y aplicar metodologías termoeconómicas quepermitan realizar un Análisis de Ciclo de Vida absoluto de los recursos minerales: un análisisconvencional de la “cuna” a la puerta de entrada (producción de las materias primas refinadas)y un análisis adicional de la “tumba” a la “cuna”, en el cual se cuantifique el factor de escasez delos minerales.
v

El análisis exergético de los recursos minerales y los procesos metalúrgicos de la industirade la minería realizados en esta tesis, requirió el establecimiento de una serie de objetivos. Elprimero de ellos fue realizar un estudio detallado de las tecnologías y los consumos energéticosasociados a la indutria minera y metalúrgica. Un segundo objetivo fue analizar la influencia delaprendizaje tecnológico y la disminución de la ley mineral en la disponibilidad de los recursosminerales, con el objetivo de conocer si la adquisición de experiencia a través del tiempo, hasido capaz de evitar el aumento en la demanda de energía que presentan los procesos extrac-tivos y de metalurgía. Los resultados obtenidos de las dos actividades anteriores, permitieronuna importante mejora del metódo Exergoecológico: los costos exergéticos de reposición quetradicionalmente habían sido evaluados de manera estática, pudieron ser actualizados con-siderando la tendencia del decremento de la ley mineral. Una mejora adicional presentada enesta tesis fue resolver el problema de asiganción de costos entre productos, subproductos yresiduos que comunmente aparecen en la industria minera y metalúrgica. Considerando losnuevos costos exergéticos de reposición obtenidos, se propuso un nuevo procedimiento deasiganción de costos que será utilizado en el análisis termoeconómico aplicado a los proce-sos mineros y metalúrgicos. Otro objetivo the esta tesis, consitió en la integración del análisistermoeconómico realizado a través del Costo Termoecológico desarrollado por el grupo del ITCde la Silesian University of Technology, para combinar las ventajas de ambos enfoques para elanálisis de la industria minera. Finalmente, cada objetivo descrito anteriormente fue aplicadoa diferentes casos de estudio.
vi

Contents
1 Overview of mineral resources and the mining industry 1
1.1 Minerals as resources . . . . . . . . . . . . . . . . . . . . . . . . . . . . . . . . . . . . . 1
1.2 Overview of world mineral supply . . . . . . . . . . . . . . . . . . . . . . . . . . . . . 3
1.2.1 Critical raw materials . . . . . . . . . . . . . . . . . . . . . . . . . . . . . . . . . 6
1.2.2 The role of recycling . . . . . . . . . . . . . . . . . . . . . . . . . . . . . . . . . 7
1.2.3 Environmental and social implications in the mining industry . . . . . . . . 10
1.3 The fixed stock and opportunity cost paradigm . . . . . . . . . . . . . . . . . . . . . 12
1.4 LCA for abiotic resource depletion assessment . . . . . . . . . . . . . . . . . . . . . . 13
1.5 Summary . . . . . . . . . . . . . . . . . . . . . . . . . . . . . . . . . . . . . . . . . . . . 17
2 Metal Resources and Energy 19
2.1 Mineral processing and extractive metallurgy . . . . . . . . . . . . . . . . . . . . . . 19
2.1.1 Pyrometallurgy . . . . . . . . . . . . . . . . . . . . . . . . . . . . . . . . . . . . 21
2.1.2 Hydrometallurgy . . . . . . . . . . . . . . . . . . . . . . . . . . . . . . . . . . . 21
2.1.3 Electrometallurgy . . . . . . . . . . . . . . . . . . . . . . . . . . . . . . . . . . . 22
2.2 Metal Processing and Energy Requirements . . . . . . . . . . . . . . . . . . . . . . . 22
2.2.1 Aluminum . . . . . . . . . . . . . . . . . . . . . . . . . . . . . . . . . . . . . . . 22
2.2.2 Cadmium . . . . . . . . . . . . . . . . . . . . . . . . . . . . . . . . . . . . . . . 25
2.2.3 Chromium . . . . . . . . . . . . . . . . . . . . . . . . . . . . . . . . . . . . . . . 25
2.2.4 Cobalt . . . . . . . . . . . . . . . . . . . . . . . . . . . . . . . . . . . . . . . . . 26
2.2.5 Copper . . . . . . . . . . . . . . . . . . . . . . . . . . . . . . . . . . . . . . . . . 27
2.2.6 Gold . . . . . . . . . . . . . . . . . . . . . . . . . . . . . . . . . . . . . . . . . . . 29
2.2.7 Iron . . . . . . . . . . . . . . . . . . . . . . . . . . . . . . . . . . . . . . . . . . . 32
2.2.8 Lead . . . . . . . . . . . . . . . . . . . . . . . . . . . . . . . . . . . . . . . . . . . 34
2.2.9 Manganese . . . . . . . . . . . . . . . . . . . . . . . . . . . . . . . . . . . . . . . 35
2.2.10 Molybdenum . . . . . . . . . . . . . . . . . . . . . . . . . . . . . . . . . . . . . 37
2.2.11 Nickel . . . . . . . . . . . . . . . . . . . . . . . . . . . . . . . . . . . . . . . . . . 37
2.2.12 Nickel laterites . . . . . . . . . . . . . . . . . . . . . . . . . . . . . . . . . . . . 38
vii

2.2.13 Nickel sulphides . . . . . . . . . . . . . . . . . . . . . . . . . . . . . . . . . . . 40
2.2.14 Rare Earth Elements . . . . . . . . . . . . . . . . . . . . . . . . . . . . . . . . . 41
2.2.15 Silver . . . . . . . . . . . . . . . . . . . . . . . . . . . . . . . . . . . . . . . . . . 44
2.2.16 Tellurium . . . . . . . . . . . . . . . . . . . . . . . . . . . . . . . . . . . . . . . . 44
2.2.17 Zinc . . . . . . . . . . . . . . . . . . . . . . . . . . . . . . . . . . . . . . . . . . . 45
2.3 Summary . . . . . . . . . . . . . . . . . . . . . . . . . . . . . . . . . . . . . . . . . . . . 47
3 Technical development in the mining industry 49
3.1 Introduction . . . . . . . . . . . . . . . . . . . . . . . . . . . . . . . . . . . . . . . . . . 49
3.2 Ore grade evolution . . . . . . . . . . . . . . . . . . . . . . . . . . . . . . . . . . . . . . 50
3.3 Evolution in technology in the minerals industry . . . . . . . . . . . . . . . . . . . . 51
3.4 The learning curve theory applied to the mining industry . . . . . . . . . . . . . . . 52
3.5 Learning Curves applied to Global Gold Mining . . . . . . . . . . . . . . . . . . . . . 54
3.5.1 Australia . . . . . . . . . . . . . . . . . . . . . . . . . . . . . . . . . . . . . . . . 58
3.5.2 Argentina . . . . . . . . . . . . . . . . . . . . . . . . . . . . . . . . . . . . . . . . 60
3.5.3 Brazil . . . . . . . . . . . . . . . . . . . . . . . . . . . . . . . . . . . . . . . . . . 61
3.5.4 Canada . . . . . . . . . . . . . . . . . . . . . . . . . . . . . . . . . . . . . . . . . 61
3.5.5 Chile . . . . . . . . . . . . . . . . . . . . . . . . . . . . . . . . . . . . . . . . . . 62
3.5.6 Ghana . . . . . . . . . . . . . . . . . . . . . . . . . . . . . . . . . . . . . . . . . 62
3.5.7 Guinea . . . . . . . . . . . . . . . . . . . . . . . . . . . . . . . . . . . . . . . . . 63
3.5.8 Indonesia . . . . . . . . . . . . . . . . . . . . . . . . . . . . . . . . . . . . . . . 63
3.5.9 Laos . . . . . . . . . . . . . . . . . . . . . . . . . . . . . . . . . . . . . . . . . . . 63
3.5.10 Mali . . . . . . . . . . . . . . . . . . . . . . . . . . . . . . . . . . . . . . . . . . . 63
3.5.11 Mexico . . . . . . . . . . . . . . . . . . . . . . . . . . . . . . . . . . . . . . . . . 64
3.5.12 Namibia . . . . . . . . . . . . . . . . . . . . . . . . . . . . . . . . . . . . . . . . 64
3.5.13 Peru . . . . . . . . . . . . . . . . . . . . . . . . . . . . . . . . . . . . . . . . . . . 65
3.5.14 Papua New Guinea . . . . . . . . . . . . . . . . . . . . . . . . . . . . . . . . . . 65
3.5.15 South Africa . . . . . . . . . . . . . . . . . . . . . . . . . . . . . . . . . . . . . . 66
3.5.16 Tanzania . . . . . . . . . . . . . . . . . . . . . . . . . . . . . . . . . . . . . . . . 67
3.5.17 United States . . . . . . . . . . . . . . . . . . . . . . . . . . . . . . . . . . . . . 68
3.6 Progress ratios in the gold mining industry . . . . . . . . . . . . . . . . . . . . . . . . 70
3.7 Summary . . . . . . . . . . . . . . . . . . . . . . . . . . . . . . . . . . . . . . . . . . . . 70
4 Thermoeconomic Analysis 73
4.1 Thermodynamics and the evaluation of natural resources . . . . . . . . . . . . . . . 73
4.2 Fundamentals of Exergy Analysis and Thermoeconomics . . . . . . . . . . . . . . . 74
4.2.1 Exergy . . . . . . . . . . . . . . . . . . . . . . . . . . . . . . . . . . . . . . . . . 74
viii

4.2.2 Exergy balance . . . . . . . . . . . . . . . . . . . . . . . . . . . . . . . . . . . . 75
4.2.3 Exergy Cost . . . . . . . . . . . . . . . . . . . . . . . . . . . . . . . . . . . . . . 75
4.3 Thermoeconomic Input-Output Analysis . . . . . . . . . . . . . . . . . . . . . . . . . 76
4.3.1 The Demand Driven Model . . . . . . . . . . . . . . . . . . . . . . . . . . . . . 77
4.3.2 The Supply Driven Model . . . . . . . . . . . . . . . . . . . . . . . . . . . . . . 79
4.4 Thermoecological Cost (TEC) . . . . . . . . . . . . . . . . . . . . . . . . . . . . . . . . 79
4.5 Similarities and differences between Thermoecological Cost and ThermoeconmicInput-Output Analysis . . . . . . . . . . . . . . . . . . . . . . . . . . . . . . . . . . . . 82
4.6 The exergoecology approach and the degraded Earth Thanatia . . . . . . . . . . . . 83
4.6.1 Reference Environment . . . . . . . . . . . . . . . . . . . . . . . . . . . . . . . 85
4.6.2 Assessment of mineral resource depletion . . . . . . . . . . . . . . . . . . . . 86
4.7 Summary . . . . . . . . . . . . . . . . . . . . . . . . . . . . . . . . . . . . . . . . . . . . 89
5 Exergy analysis of mineral resources and mining by-products 91
5.1 Introduction to exergy analysis of mineral resources . . . . . . . . . . . . . . . . . . 91
5.2 Exergy Replacement Costs of minerals resources . . . . . . . . . . . . . . . . . . . . 92
5.2.1 Cobalt . . . . . . . . . . . . . . . . . . . . . . . . . . . . . . . . . . . . . . . . . 93
5.2.2 Copper . . . . . . . . . . . . . . . . . . . . . . . . . . . . . . . . . . . . . . . . . 93
5.2.3 Gold . . . . . . . . . . . . . . . . . . . . . . . . . . . . . . . . . . . . . . . . . . . 94
5.2.4 Nickel . . . . . . . . . . . . . . . . . . . . . . . . . . . . . . . . . . . . . . . . . . 95
5.2.5 Uranium . . . . . . . . . . . . . . . . . . . . . . . . . . . . . . . . . . . . . . . . 96
5.2.6 Summary of ERC obtained . . . . . . . . . . . . . . . . . . . . . . . . . . . . . 97
5.3 Introduction to Exergy Cost Allocation of by-products in the mining industry . . . 99
5.4 Joint products and by-products in the mining industry . . . . . . . . . . . . . . . . . 101
5.5 Approaches to allocating joint cost . . . . . . . . . . . . . . . . . . . . . . . . . . . . . 102
5.5.1 Tonnage Allocation of by-products . . . . . . . . . . . . . . . . . . . . . . . . . 104
5.5.2 Market Price Allocation of by-products . . . . . . . . . . . . . . . . . . . . . . 104
5.5.3 Exergy Cost Allocation of by-products . . . . . . . . . . . . . . . . . . . . . . . 107
5.6 Cost allocation of by-products applied to mineral deposits . . . . . . . . . . . . . . 109
5.7 Exergy cost allocation applied to mining and metallurgical processes . . . . . . . . 113
5.7.1 Exergy Cost Allocation of Copper and its by-products . . . . . . . . . . . . . 113
5.7.2 Exergy Cost Allocation of Nickel and its by-products . . . . . . . . . . . . . . 116
5.7.3 Exergy Cost Allocation of Lead and its by-products . . . . . . . . . . . . . . . 117
5.7.4 Exergy Cost Allocation of REE . . . . . . . . . . . . . . . . . . . . . . . . . . . . 119
5.8 Summary . . . . . . . . . . . . . . . . . . . . . . . . . . . . . . . . . . . . . . . . . . . . 121
6 Exergy analysis of metal processing 123
ix

6.1 Exergy accounting applied to mineral processing . . . . . . . . . . . . . . . . . . . . 123
6.1.1 The case of nickel processing . . . . . . . . . . . . . . . . . . . . . . . . . . . . 124
6.2 Thermo-Ecological Cost applied to metallurgical systems . . . . . . . . . . . . . . . 132
6.2.1 TEC analysis: the case of nickel production . . . . . . . . . . . . . . . . . . . 132
6.3 Integration of the Thermo-Ecological Cost and Exergy Replacement Cost to assessmineral processing . . . . . . . . . . . . . . . . . . . . . . . . . . . . . . . . . . . . . . 137
6.3.1 TERC analysis of nickel production . . . . . . . . . . . . . . . . . . . . . . . . 138
6.3.2 TERC analysis of aluminium production . . . . . . . . . . . . . . . . . . . . . 142
6.3.3 TERC analysis of chromium production . . . . . . . . . . . . . . . . . . . . . 144
6.3.4 TERC analysis of copper production . . . . . . . . . . . . . . . . . . . . . . . . 145
6.3.5 TERC analysis of gold production . . . . . . . . . . . . . . . . . . . . . . . . . 146
6.3.6 TERC analysis of iron production . . . . . . . . . . . . . . . . . . . . . . . . . 147
6.3.7 TERC analysis of manganese production . . . . . . . . . . . . . . . . . . . . . 148
6.3.8 TERC analysis results of metals production . . . . . . . . . . . . . . . . . . . . 149
6.4 Summary . . . . . . . . . . . . . . . . . . . . . . . . . . . . . . . . . . . . . . . . . . . . 153
7 Conclusions 155
7.1 Synthesis . . . . . . . . . . . . . . . . . . . . . . . . . . . . . . . . . . . . . . . . . . . . 155
7.2 Contributions . . . . . . . . . . . . . . . . . . . . . . . . . . . . . . . . . . . . . . . . . 159
7.3 Scientific publications . . . . . . . . . . . . . . . . . . . . . . . . . . . . . . . . . . . . 160
7.4 Perspectives . . . . . . . . . . . . . . . . . . . . . . . . . . . . . . . . . . . . . . . . . . 160
Appendix A Background of commodities 163
A.1 Metal processing and energy requirements of minerals . . . . . . . . . . . . . . . . . 163
Appendix B Input-Output Analysis 175
B.1 Cost Model . . . . . . . . . . . . . . . . . . . . . . . . . . . . . . . . . . . . . . . . . . . 176
Appendix C Exergy Cost Allocation for deposit models 179
Conclusiones 187
List of Tables 195
List of Figures 199
References 207
x
Chapter 1
Overview of mineral resources and themining industry
The aim of this starting chapter is to provide an overview of mineral resources and the miningindustry. Since this PhD is focused on the assessment of global mining, an overview of worldmineral supply and market price evolution is performed. Additionally issues like internationalreporting, criticality of raw materials, sustainable development in the mining industry and lifecycle assessment of abiotic resource depletion are reviewed.
1.1 Minerals as resources
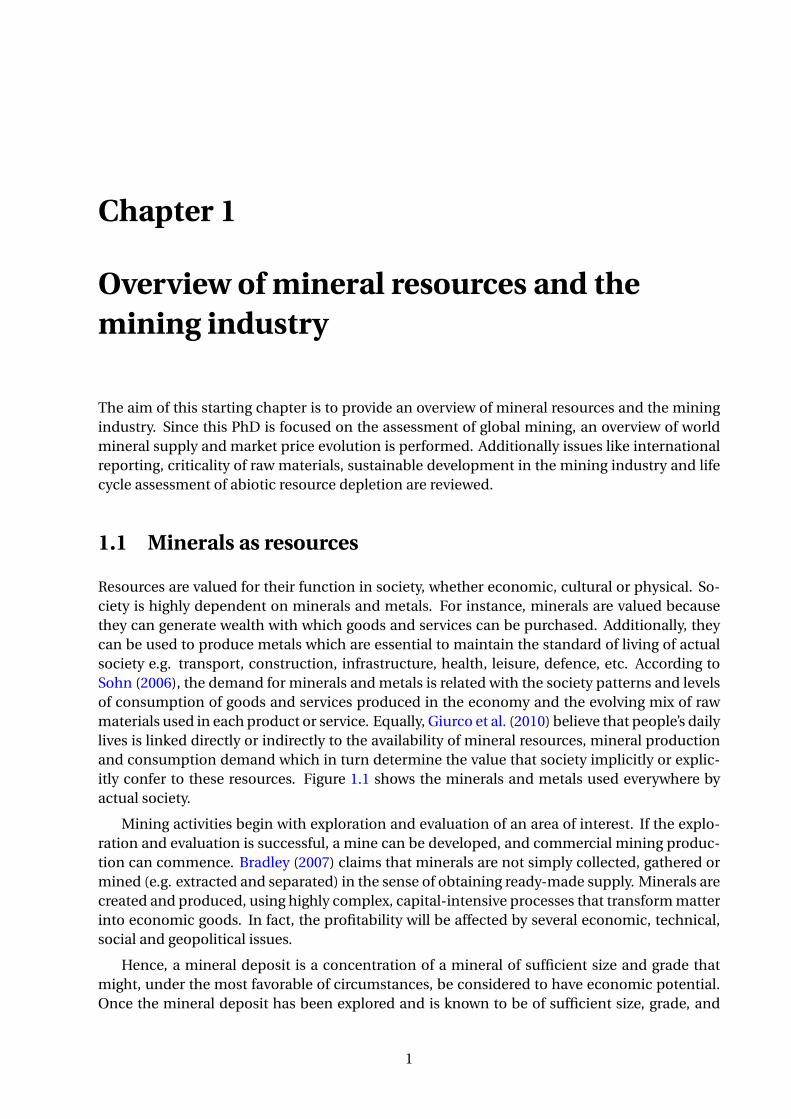
Resources are valued for their function in society, whether economic, cultural or physical. So-ciety is highly dependent on minerals and metals. For instance, minerals are valued becausethey can generate wealth with which goods and services can be purchased. Additionally, theycan be used to produce metals which are essential to maintain the standard of living of actualsociety e.g. transport, construction, infrastructure, health, leisure, defence, etc. According toSohn (2006), the demand for minerals and metals is related with the society patterns and levelsof consumption of goods and services produced in the economy and the evolving mix of rawmaterials used in each product or service. Equally, Giurco et al. (2010) believe that people’s dailylives is linked directly or indirectly to the availability of mineral resources, mineral productionand consumption demand which in turn determine the value that society implicitly or explic-itly confer to these resources. Figure 1.1 shows the minerals and metals used everywhere byactual society.
Mining activities begin with exploration and evaluation of an area of interest. If the explo-ration and evaluation is successful, a mine can be developed, and commercial mining produc-tion can commence. Bradley (2007) claims that minerals are not simply collected, gathered ormined (e.g. extracted and separated) in the sense of obtaining ready-made supply. Minerals arecreated and produced, using highly complex, capital-intensive processes that transform matterinto economic goods. In fact, the profitability will be affected by several economic, technical,social and geopolitical issues.
Hence, a mineral deposit is a concentration of a mineral of sufficient size and grade thatmight, under the most favorable of circumstances, be considered to have economic potential.Once the mineral deposit has been explored and is known to be of sufficient size, grade, and
1

CONCRETE- LIMESTONE/CEMENTSAND/GRAVEL
SAND/GRAVEL
SCHIST
QUARTZ
GRANITE
NATURAL STONE
LARVIKITE
Ice cream:TITANIUM DIOXIDE
WEARINGCOURSE
COVER?}
?WEIGHT FILLER
CONCRETE SLEEPERSFROM LIMESTONE/
CEMENTSAND/GRAVEL
SAND/GRAVEL
AGGREGATE
AGGREGATE
AGGREGATEAGGREGATE
FILTERLAYER
BASE
BASEMENT
Minerals A/S
CONCRETELIMESTONE/CEMENTSAND/GRAVEL
ALUMINIUMSTEEL, TITANIUM
BRICKS FROM CLAYAND OLIVINE
A/S CONCRETE A/S CONCRETE
LIGHTWEIGHT FILLER
(ASPHALT, AGGREGATEOR GRAVEL)
LECA
Light bulb:QUARTZ?
Car/train:IRON
ALUMINIUMLEAD,COPPER
ZINCMAGNESIUM
SAND
Glas:FELDSPAR
NEPHELINE SYENITEQUARTZ
Rubber:DOLOMITELIMESTONE
TALCGRAPHITE
Paintwork:LIMESTONE
TALCMICA
TITANIUM DIOXIDEFROM ILMENITE
RUTILE
BASE COURSE
BEDROCK
TILL TILL
SAND/GRAVEL
OR
LECA
OR
FINE AGGREGATE
LECASAND/GRAVELAGGREGATE
TIGHT WEIGHT FILLER
IRONHEMATITE
BEDROCK
SANDLECA/CLAYROCKWOOL
ROOFING SLATE
CONCRETE ROOFTILES
Paper:LIMESTONEDOLOMITETITANIUM
TALCKAOLIN
Paint:LIMESTONE
TALC,KAOLINTITANIUM
FROM ILMENITE/RUTILE
Pencil:GRAPHITE
CLAY
Tiles:
Environmental liming
Limestone:LIMESTONEDOLOMITE?
PC:COPPER
Floor:MARBLE
Porcelain:LIMESTONENEPHELINESYENITEDOLOMITE
Peer R. Neeb 2006
ANORTHOSITEFELDSPAR
6
Everyday use of mineral resources.
0
500
1 000
1 500
2 000
2 500
3 000
1990 1991 1992 1993 1994 1995 1996 1997 1998 1999 2000 2001 2002 2003 2004 2005 2006 2007 2008
Export value(mill. NOK-2008)
Industrial minerals
Metallic ore
Natural stone
Construction materials
Coal
Figure 1.1: Everyday’s uses of minerals and metals. NGU (2008).
accessibility to be producible to yield a profit, it becomes an ore deposit. According to Cox &Singer (1992) a mineral deposit model is the systematically arranged information describingthe essential attributes (properties) of a class of mineral deposits.
The globalization of the mining industry makes imperative the developing of internationalstandards for reporting mineral reserves, mineral resources and exploration results in order tounderpin the mining industry and its capability to supply the worldwide increasing demandof mineral resources. The mining industry depends on financial investments, hence it is im-portant to define a common terminology in order to enable investors to understand the riskinvolved in estimating mineral resources.
Weatherstone (2008) accomplished an overview of the international standards for report-ing of mineral resources and reserves, claiming that CRIRSCO (Committee for Mineral ReservesInternational Reporting Standards) was established in 1994 to assess mineral resources tak-ing into account; mining, metallurgical, economic, marketing, legal, environmental, social andgovernmental issues. According to the CRIRSCO, the Joint Ore Reserves Committee (JORC)defines mineral resource as a concentration or occurrence of material of intrinsic economicinterest in such form, quality and quantity that there are reasonable prospects for eventualeconomic extraction. Mineral resources are subdivided, in order of increasing geological con-fidence, into inferred, indicated and measured categories. An ore reserve is the economicallyminable part of a measured or indicated mineral resource. Ore reserves are subdivided in orderto increasing confidence into probable ore reserves and proved ore reserves.
The U. S. Geological Survey (USGS) use meanwhile the categories reserve and reserve base,which are similar to JORC’s ore reserves and mineral resources definitions, respectively. Themineral resource classification is shown in Fig. 1.2. Reserves are part of the reserve base whichcould be economically extracted or produced at the time of determination. Marginal Reservesis that part of the reserve base which, at the time of determination, which presents economicuncertainty. Subeconomic Resources is the part of identified resources that does not meet the
2

economic criteria of reserves and marginal reserves. Undiscovered Resources can be classifiedas hypothetical or speculative resources.
Figure 1.2: Mineral Resource Classification (USGS, 1980).
Additionally to land mineral deposits, the existence of deep-ocean minerals deposits hasbeen known for more than a century. However, surveys devoted to understanding their gene-sis, distribution and resource potential began more recently, like those performed by Hein et al.(2013), Massari & Ruberti (2013). The minerals located in these marine deposits are crucial foran assortment of high-tech, green-tech and energy applications. For instance, the rare earthelements are used in plenty of new electronic and advanced components: such as fuel cells,mobile phones, displays, hi-capacity batteries, permanent magnets for wind power generation,green energy devices, etc. Although exploration contracts to develop deep-ocean mineral de-posits have been signed in countries such as: China, France, Germany, India, Japan, Korea andRussia, technical challenges as well as environmental considerations need to be overcome.
1.2 Overview of world mineral supply
This section presents a general review of production and prices of metals. In this regard, thedistribution of global supply and demand of mineral resources has changed significantly inrecent years.
Humphreys (2013) believes that a new mercantilism is reshaping the world metal supply.The major countries consuming metals used to be also the major countries producing them,hence their interest to promote mine development to provide low cost raw materials. However,over the past fifty years the production of commodities of consuming countries has declined,and other countries like China have emerged over a very short time as the largest producer inthe world, using their low cost capital and innovative metallurgical technologies. Now, produc-ing countries are more interested on how to maximise the benefit of metal extraction to theireconomies rather than on how to supply cheap raw materials. Consequently, recent high metal
3

prices have led to increase the number of countries which are looking to metals production inorder to promote their development.
0
500
1,000
1,500
2,000
2,500
3,000
1900 1910 1920 1930 1940 1950 1960 1970 1980 1990 2000 2010
World produ
c*on
, metric
tons [t]
Year
Au
Te
(a) Au and Te
0
20,000
40,000
60,000
80,000
100,000
120,000
140,000
160,000
1900 1910 1920 1930 1940 1950 1960 1970 1980 1990 2000 2010
World produ
c*on
, metric
tons [t]
Year
REE
Ag
(b) Ag and REE
0
50,000
100,000
150,000
200,000
250,000
300,000
1900 1910 1920 1930 1940 1950 1960 1970 1980 1990 2000 2010
World produ
c*on
, metric
tons [t]
Year
Cd
Co
Mo
(c) Cd, Co and Mo
0
1,000
2,000
3,000
4,000
5,000
6,000
7,000
8,000
1900 1910 1920 1930 1940 1950 1960 1970 1980 1990 2000 2010
World produ
c*on
, metric
tons [t]
Millares
Year
Cr
Pb
Ni
(d) Cr, Pb and Ni
0
5,000
10,000
15,000
20,000
25,000
30,000
35,000
40,000
45,000
50,000
1900 1910 1920 1930 1940 1950 1960 1970 1980 1990 2000 2010
World produ
c*on
, metric
tons [t]
Millares
Year
Al
Cu
Mn
Zn
(e) Al, Cu, Mn and Zn
0
200
400
600
800
1,000
1,200
1,400
1,600
1943 1953 1963 1973 1983 1993 2003
World produ
c*on
, metric
tons [t]
Millon
es
Year
Fe
(f) Fe
Figure 1.3: World production of metals. Data from U. S. Geological Survey (USGS).
4

According to Ghosh & Hem (1984), the commercial production of metals depends on factorssuch as: accessibility of ore deposits, richness of ore deposits, nature of extraction and refiningprocess for the metal, physical and chemical properties of the metal as well as the demand forthe metal. These factors depend on economics. A metal becomes a common one if it is readilyavailable and easily produced with low processing cost and if it allows development of attractiveproperties.
The world production of the metals analyzed in this thesis, is presented in Fig. 1.3. It canbe seen that iron ores as steel is by far the most widely produced metal. This is due to the factthat iron ores are available in abundance in easily accessible deposits, the processing of ironores is relatively simple and economical and because alloys of iron have a wide range of usefulproperties. The nonferrous metals which are produced in large quantities include metals suchas aluminium, copper, manganese and zinc. In lesser amounts, metals such as lead, nickel,cadmium, cobalt and molybdenum, are produced. Finally, precious metals such as silver andgold, are produced in minor quantities as well as rare earth metals or less common metals suchas tellurium. Nevertheless, the general trend of all metals is an abrupt increase (exponential-like) in their worldwide production.
0
500
1,000
1,500
2,000
2,500
3,000
3,500
4,000
1900 1910 1920 1930 1940 1950 1960 1970 1980 1990 2000 2010
Unit p
rice, [$
/t]
Year
Al
Mn
Zn
Fe
Pb
Cr
(a) Fe,Mn,Pb,Al,Zn and Cr
0
2,000
4,000
6,000
8,000
10,000
12,000
14,000
16,000
18,000
1900 1910 1920 1930 1940 1950 1960 1970 1980 1990 2000 2010
Unit p
rice, [$
/t]
Year
Cd
Cu
(b) Cd and Cu
0
10,000
20,000
30,000
40,000
50,000
60,000
70,000
80,000
1900 1910 1920 1930 1940 1950 1960 1970 1980 1990 2000 2010
Unit p
rice, [$
/t]
Year
Co
Mo
Ni
REE
(c) Ni,REE,Mo and Co (d) Te,Ag and Au
Figure 1.4: Unit price of metals [$/t]. Data from U. S. Geological Survey (USGS).
The high demand of metals and their consequent depletion has an immediate effect on mar-
5

ket prices. The unit price of internationally traded metals analyzed in this thesis, is presentedin Fig. 1.4. It can be observed that iron ores as steel has the lowest price. The opposite case isthat of gold, which is by far the most expensive of all metals analyzed in this thesis. In generalFig. 1.4 shows that metals price volatility increased in the 1980s, reaching record highs in recenttimes. This fact is driven by the strong demand from emerging economies, such as China andIndia. The magnitude of price fluctuations has increased drastically and in many cases causedcommodity prices to multiply within only few years (e.g. lead or REE).
According to Kriechbaumer et al. (2014), metal prices are the result of complex market dy-namics and stochastic economic processes. Labys et al. (1999) state that metal price depend onmacroeconomic variables such as industrial production, consumer prices, interest rates, stockprices, and exchange rates. Humphreys (2013) based on Goldman Sachs report The Revengeof the Old ’Political’ Economy 1 published in 2008, argues that mineral prices increase becausecompanies are making investments in the most accessible deposits instead of those with high-est quality. The latter leads higher cost and lower efficiency. In the opinion of Humphreys, theworld faces not so much a resource problem but an investment problem.
1.2.1 Critical raw materials
One of the most important issues influencing the use of raw materials in the future is techno-logical change. The high-tech metals (e.g. antimony, cobalt, lithium, tantalum, tungsten andmolybdenum) are indispensable to new environmentally friendly products. For instance, elec-tric cars require lithium and neodymium, car catalysis platinum, solar panels require indium,gallium, selenium and tellurium, energy efficient high-speed trains require cobalt and samar-ium, and new fuel-efficient aircraft needs rhenium alloys. Appendix A shows in Table A.4 themain uses as well as the main driving emerging technologies for the several materials includingthose considered critical raw materials.
A mineral is said to be critical depending on a number of factors such as such as geopoliticaland depletion issues. Achzet & Helbig (2013) give and overview about differences and similari-ties of 15 criticality assessments for metallic raw materials performed by several working groupsaround the world from 2006 until 2011, concluding that there is a lack of consensus aboutwhich indicators give reliable information for raw material supply risk and how these indica-tors should be aggregated. The indicators identified by Achzet & Helbig (2013) for evaluationof supply risk include: country concentration, country risk, depletion time, by-product depen-dency, company concentration in mining corporations, demand growth, recycling/recyclingpotential, substitutability, import dependence, commodity prices, exploration degree, produc-tion costs in extraction, stock keeping, market balance, mine/refinery capacity, future marketcapacity, investment in mining, climate change vulnerability, temporary scarcity, risk of strate-gic use and abundance in earth’s crust.
Other survey is the report performed by the ad-hoc Working Group (2010), which identify alist of critical raw materials for the European Union in regards to the economic importance andsupply risk. The survey analyzes 41 metals, concluding that there are 14 critical raw materialsfor the EU: antimony, beryllium, cobalt, fluorspar, gallium, germanium, graphite, indium, mag-nesium, niobium, PGMs, REE, tantalum and tungsten, as depicted in Fig. 1.5. It is important tohighlight that geological availability was not considered for determining criticality of raw mate-
1The Goldman Sachs Group, Inc. is a global investment banking, securities and investment management firm.http://www.goldmansachs.com
6

Figure 1.5: Critical raw materials for the European Union. The ad-hoc Working Group (2010).
rials because global reserves are not considered as a reliable indicator of long term availability.Instead, according to the aforementioned study, geopolitical and economic changes are issuesthat impact greatly on the supply and demand of raw materials.
It has to be highlighted that slight changes of the parameters of the supply risk metric ofmaterials positioned in the sub-clusters of Fig. 1.5 may lead to a reclassification of these ma-terials as “critical”. The supply risk includes issues such as: political and economic stability ofthe producing countries, the level of concentration of production, the potential to substituteand the recycling rate. The supply risk is attributed mainly to the fact that countries like China,Russia, the Democratic Republic of Congo and Brazil control the worldwide production, as Fig.1.6 shows. This production concentration, generally is heightened by low sustainability and lowrecycling rates.
According to Achzet & Helbig (2013) the aim of criticality assessment methods is to analyzedriving factors, which makes a raw material critical from an economic, ecological, social or evenethical perspective. The criticality assessment methods constitute a starting point for a betterunderstanding of raw material supply and demand. In regards to demand and supply of metalsthere is currently only intransparent and limited data available. It becomes therefore urgent toelaborate comprehensive databases of all raw material supply chain levels from the mining, tothe manufacturing of products and the end of life phase with dissipation and recycling.
1.2.2 The role of recycling
Lee (1998) defines resource depletion as a resource which has been consumed and discardedand can no longer be utilized by human beings. Lee considers that some of the factors thataffect resource depletion are:
• Reserves: The more reserve the resource has, the less tendency for depletion it will have.
7

Figure 1.6: Production concentration of critical raw materials for the European Union. Thead-hoc Working Group (2010).
• Consumption rate: For those resources which have equal reserves, the greater the con-sumption rate, the more serious the depletion.
• Natural replenishment rate: If the consumption rates of renewable resources are smallerthan their replenishment rates, then these resources should have no depletion problems.For non-renewable resources, the natural replenishment rate is so low that it can be ne-glected.
• Recycling rate: Resources can be recycled from discarded products and be re-manufacturedinto new products for human use. Hence, the recycling of a discarded resource can re-duce its consumption rate, a high recycling rate can considerably diminish the resourcedepletion.
• Resource substitution: If a particular resource can be easily and economically substitutedby other resources, its depletion may be reduced.
• Resource distribution: Most of the resources are not distributed equally over earth. Hence,local resource depletion problems depend on the local resource distribution characteris-tics.
• Resource reliability: The reliability of imported resources that some countries need toimport from other countries to support their own development influence the local deple-tion.
Of the aforementioned factors, recycling plays a major role. In order to counteract theworldwide demand for primary mineral resources, it is imperative to recycle materials morewidely and more effectively. Consequently, once the scarcity of “virgin” material becomes acuteand should commodity prices rise, the recovery of secondary resources from technospheric
8

stocks, popularly referred to as urban mining (Brunner & Rechberger 2004) may become a re-alistic option. Indeed, this possibility is gaining increasing attention and has been addressed asa suitable and necessary alternative by the UNEP International Resource Panel (Graedel et al.2010) or the Swedish Environmental Protection Agency (SEPA 2012). Accordingly, in the future,metals will be supplied from a combination of primary metal produced from newly mined oresand recycled metals. Brobech (1996) and Bravard et al. (1972) claim that recycling must playan important role in the life cycle of metals production and should involve issues like educa-tion, research, proposals and targets. Furthermore, recycling operations requires technological,economic and environmental proficiency.
Most metals are recyclable, either easily (e.g. aluminium) or with deliberate programs (e.g.lead, platinum). According to Giurco et al. (2010), the overall stock of recyclable materials isrising, but the availability of various metals for recycling differs widely. In this regard, legislationand product management system like the end of life vehicle legislation often lead to improvedrecycling rates.
Efficient recycling of products as well as all kinds of production residues at various pointsin the life cycle of a product, reduces significantly the demand of raw materials. Furthermore,in several situations recycling leads to energy savings and reduction of climate change impacts.For instance, to obtain steel or aluminium from scrap, already requires less energy than fromprimary raw material. However, depending on how concentrated or dispersed the metal is andthe transport required, recycling may not always have lower energy requirements.
The higher the import dependence on an individual metal, the more important recyclingbecomes, particularly if substitution possibilities are limited. The ad-hoc Working Group (2010)listed a set of actions to improve the efficient recycling of raw materials. The latter includesthe design of products using materials that can be recycled, selecting materials that contain ahigh percentage of recycled content, reducing the number of different materials within an as-sembly, marking parts for simple material identification, using compatible materials within anassembly, selecting materials that do not need to be separated for recycling, making productseasy to disassemble, identifying discarded products with critical raw material for proper collec-tion instead of stockpiling them in households or discarding them into landfill or incineration,improving overall organisation, logistics and efficiency of recycling chains, preventing illegalexports of discarded products containing critical raw materials and increasing transparency inflow and promoting research on system optimisation and recycling of products and substances.
That said, according to Wellmer & Becker-Platen (2002), a recycling rate of 100% is impos-sible to achieve because depending on the application, a very pure metal could be required.Reaching the quality of primary raw materials, would entail higher energy requirements andenvironmental impacts. Heighten recycling together with material efficiency improvementswill play important roles, but for the foreseeable future it is likely that new primary raw mate-rials will continue to be required. Moreover, access to and extraction of primary raw materialswill always be needed, due to market growth or new applications. Even if there is a total re-cycling the breach between the time of product manufacturing and product end of life phaseneeds to be overcome. Finally, recycling is determined by economic issues such as the ratio ofthe prices for recycled and primary raw material.
9

1.2.3 Environmental and social implications in the mining industry
As aforementioned, recycling still constitutes (with the exception of a few metals) a minor prac-tice. Consequently, traditional mining will constitute in the short to medium term the mainmineral supplier with not insignificant consequences to the environment. Indeed, mining isone of the activities with the greatest environmental impact from a cradle to grave perspective.It is a fact that the worldwide increase in production, use and disposal of minerals and metalshas caused harmful environmental impacts, from global warming to local pollution affectingland, air and water. Ayres (2008) states that minerals extracted from the earth and utilized foreconomic purposes are not literally “consumed” because they become waste residuals that donot disappear and may cause environmental damage. Giurco et al. (2010) claim that these im-pacts will likely become unsustainable in the medium to long-term.
The climate change has brought green house gas emission constraints, which are an effortto internalise major global environmental costs. In the mining industry, fossil fuels are the mainsource of energy. Accordingly, mechanisms like carbon trading, is likely to cause increased costfor mining production. Other environmental cost at local level include mine site closure andstoring of waste rock. In the US and Europe, stricter environmental regulations and greaterdifficulty obtaining mining permits has made open cut mining economically unattractive. Toxicemissions from mining are harmful to communities and the natural environment. Besides,mine wastes such as the tailings and waste rock remaining after completion of a project, is achallenge for the mining industry due to given declining ore grades and deeper mines.
Technology plays a key role in addressing the environmental impacts. For instance, imple-menting scrubber systems to capture sulfur dioxide emissions from smelters and convertingthis to sulphuric acid, implementing tall stacks from smelters to ensure adequate dispersionof atmospheric pollutants, methane gas extraction systems prior to coal mining and sulphidicmine waste and acid and metalliferous drainage. However, Giurco et al. (2010) assert that newtechnologies not always led to lower environmental costs. Hence, it is a challenge for futuretechnologies.
A way to counteract environmental but also social problems associated with the mining in-dustry is with sustainable development practices. Indeed, several studies like those performedby Cleveland & Ruth (1997), Shields (1998), Wellmer & Becker-Platen (2002), suggest that sus-tainable development is currently one of the most complex and challenging issues of the min-ing industry, because it involves the preservation, rational use and enhancement of naturalresources.
As is well known, the World Commission on Environment and Development WCED (1987)performed the report “Our Common Future”, where long-term environmental strategies forachieving sustainable development were proposed. In this report, the Commission highlightedthat “Humanity has the ability to make development sustainable to ensure that it meets theneeds of the present without compromising the ability of future generations to meet their ownneeds”. The latter is a widespread definition of sustainable development. Although a more spe-cific mining sustainable development definition could be: “sustainability means the design,construction, operation and closure of mines in a manner that respects and responds to thesocial, environmental and economic needs of the present generations and anticipates thoseof future generations in the communities and countries where it works” according with goldmining company Placer Dome (now Barrick Company). Nappi & Poulin (1998) assert that themajor sustainability issue for metals is the influence on environmental and social conditions.Similarly, Yellishetty et al. (2011) claim that social, environmental and economic objectives of
10
sustainability must be met over the long-term. Accordingly, the main drivers for sustainabil-ity management include: economic management from wise energy use, fulfillment of societalexpectations, improvement of communication and transparency, maximize social benefits, ad-herence to international best practice, industry leadership and improvement business perfor-mance.
In this respect, Giurco & Cooper (2012) have proposed the Mineral Resources Landscapewhich is a practical tool to conceptualize minerals sustainability through five frameworks: eco-logical, technological, economic, social and governance domains, which interact and deter-mine behavior of extraction and use of minerals within a system view.
The role that sustainability is playing in the mining industry has been studied in a number ofsurveys. For instance, Kumah (2006), Mudd (2007b,c) have studied gold, Yellishetty et al. (2011)have analyzed steel and copper. Other studies, conducted by Ayres (2008), Ayres & Ayres (2002),Nappi & Poulin (1998), Prior et al. (2012), Santos & Zaratan (1997), Shields (1998), Wellmer& Becker-Platen (2002) have analyzed the sustainability from a global perspective, coming tothe conclusion that a set of indicators need to be defined to ensure economic, environmentaland social limits to achieve sustainable development objectives. Worrall et al. (2009) proposed72 sustainable development indicators for the mining sector, including environmental, socio-political and economic criteria.
Sustainability can be also considered in terms of endowing future generations with suffi-cient capital stock to ensure their well-being, achieved through a relationship between resourceprices and economic welfare. There are several surveys performed by Svedberg & Tilton (2006),Tilton (2003) and Yaksic (2009) that address sustainability through an economic point of view.Martin & Skinner (1998) for instance, carried out a survey in the Czech Republic, and demon-strated that adjusting resources prices through a revenue neutral shift in taxes can move aneconomy closer to an efficient use of resources, and improve society’s welfare2.
Norgate & Haque (2010) prompt that extended producer responsibility and stewardshipprograms are an effective way to involve producers and/or distributors with commercial goodsat the post-consumer stage, in order to optimise the efficient use of metal resources and stockswhile at the same time minimising their environmental impacts. In the same way, in the opin-ion of Giurco et al. (2010) mining companies respond to social impacts by putting in practice,concepts such as:
• Corporate Social Responsibility (CSR) outline the responsibility of corporations to max-imise the positive and minimise the negative social or environmental impacts associateswith their mining operations.
• Social License to Operate (SLO) encourage companies to maintain their operations in away that does not contradict the values and attitudes of the community members livingin proximity to the mine’s operations.
Environmental and social criticism, as well as changing public perceptions regarding thesustainability of mining practices is modifying the way mining companies operate and interactwith the community.
2However, the sustainability of metal supplies can be overcome from a physical perspective. The physical ap-proach involves the concept of limits of mineral ores. Even if mineral depletion from a geological point of viewwould not be reached, it is important that sustainability indexes includes geological information to assess mineralavailability as is proposed in this PhD.
11

1.3 The fixed stock and opportunity cost paradigm
As was seen in the previous sections, the mining industry is currently undergoing challengessuch as commodity price fluctuation, energy demand rise, increment in water and cyanideconsumption, cost increase, declining ore grades or increasing pollution and waste materialsreleased. Arguably, the greatest challenge to be faced is the depletion of non-renewable naturalresources, as it is this issue what entails economic, environment and social disruptions and notthe way around Skinner (1986), Szargut (2008), Szargut & Stanek (2012), Szargut et al. (2002),Valero, Valero & Domínguez (2011), Valero, Valero & Martínez (2010). In this respect, there isa debate about the long-run availability of mineral commodities since Meadows et al. (1972)asserted in their book Limits to Growth that unrestrained consumption and economic growthwas prompting a surplus in the carrying capacity of the Earth. More recently, in their book Lim-its to Growth: The 30-Year Update, Meadows et al. (2004) reinforced their message about howeconomic and population growth interacts with finite resource supplies.
According to Tilton (2001, 2003), the debate about mineral depletion reflects two perspec-tives. On the one hand, there are the pessimists who fear mineral depletion as well as the en-vironmental and social external costs associated with the production and use of mineral com-modities. On the other hand, there are the optimists, who see no risk because they believe thatas cost and prices go up new technologies will be developed, and more recycling and conserva-tion measures that reduce production cost and consumption will come up. Accordingly, thereis a discourse about the way to assess the long-run availability of mineral resources mainly be-cause there are two models to assess mineral depletion. One based on a physical perspective,known as the fixed stock paradigm. An other one based on an economic perspective, known asthe opportunity cost paradigm. Besides the unpredictability in regards to future developmentsin mineral supply and demand, as well as the shortage of widely accepted methods for assessingthe total social costs of producing and using mineral products.
The fixed stock paradigm is based on the fact that the earth is finite and therefore mineralresources must also be finite. Gordon et al. (2007) found that discovery of new resources ofcopper ore has not kept pace with the amount of ore extracted to supply the increase in thecopper demand. If this situation continues, it will imply eventual scarcity. Notwithstanding,Tilton (2003) highlights some shortcomings of this approach. For instance, the recyclable na-ture of minerals that makes possible to reuse them, substitution between alternative resources,the immensity of the fixed stock of many mineral commodities, and the eventually eliminatingdemand, due to the fact that before the last amount of a particular mineral is extracted from theearth’s crust, cost would rise to the point where they are no longer affordable.
In this respect, Harmsen et al. (2013) asserts that mineral availability is related to accessibil-ity, which in turn is tightly connected with energy consumption. All processes such as mining,land-recovering, transport, crushing and grinding, smelting, refining, etc. require significantamounts of energy. Furthermore, Eckelman (2010) claims that these energy requirements willcontinue to increase as average ore grades decrease and more rock needs to be processed foran equivalent amount of metal.
The opportunity cost paradigm assesses resource availability by what society has to give upin order to produce another unit of a mineral commodity. Tilton & Lagos (2007) are convincedthat this approach gives a better interpretation of resource depletion and availability, throughthe price and the opportunity cost of using the resource. Svedberg & Tilton (2006) do not discardthat economic depletion may occur (because mineral commodities become too expensive touse) but suggest that new technology will cut down the cost and prices of mineral commodities.
12

However, decreasing ore grades entails an increasing in the amount of ore mined and energyintensity, bringing on additional environmental and social cost that have been largely neglectedin mineral costs. Nonetheless, Gordon et al. (2007) believe that economic analysis applied tothe assessment of metal sustainability is most useful to determine materials substitution andrecycling rates, rather than scarcity.
According to Tilton (1996, 2003, 2010), mineral depletion will depend on the race betweenthe cost-increasing effects of depletion and the cost-reducing effects of new technology andinnovations. Gordon et al. (2007) assert meanwhile that assessing the long-run availability ofminerals will depend on several factors such as: potential constraints on traditional miningresulting from the availability of energy sources, water limitations, climate change, legal re-strictions, environmental protection, social disruption, international trade, recycling and reuse,substitution, growth in demand and technology change.
Otherwise, authors like West (2011) highlight that decreasing ore grades is much more amanifestation of improving extractive technologies than of depletion of high grade deposits.However, as estimates of resources vary greatly, there is no way to know whether mineral com-modities will become more or less available in the future. In this respect, Yaksic (2009) claimsthat shortages of mineral commodities can arise for a variety of different reasons like wars, em-bargoes, cartels and other market manipulations, natural disasters, accidents, cyclical boomsin global demand, inadequate investment in new mines and processing facilities and resourcedepletion. Other surveys, like the one developed by the ad-hoc Working Group (2010) suggestthat geological availability is not considered as a problem for determining scarcity of natural re-sources, inasmuch as factors like changes in the geopolitical-economics framework are of ma-jor importance. These changes have an effect on the supply and demand of natural resources,which in turn depends on the growth of developing economies and new emerging technologies.
Although the debate will continue, the challenge is to develop methods that allow to obtainreliable information able to support or refute these paradigms, as well as suitable indicators toassess mineral availability. In this regard, the Exergoecology approach proposed by Valero &Valero (2010a) could shed some light on the debate. It should be noted that the Exergoecologyapproach and consequently this thesis is based on the physical fact that the world is finite insize, meaning that the intensive use of natural resources used to satisfy human activities, isgradually exhausting the planet and its stock, as depicted in studies carried out for differentcommodities like: copper (Valero et al. 2008), gold (Mudd 2007b), nickel (Mudd 2010, Norgate& Haque 2010) and iron (Costa et al. 2001, Michaelis et al. 1998).
One of the most used methods to evaluate mineral resource depletion and the performing ofmining and metallurgical operations is through the well known “Life cycle Assessment” (LCA).The next section makes a critical review of this methodology so as to identify its strengths andweaknesses on this topic and to propose ways to improve it.
1.4 LCA for abiotic resource depletion assessment
An adequate management of resources requires appropriate evaluation techniques, allowingthe quantifcation of the associated impacts. In this context, the Life Cycle Assessment (LCA)is gaining prominence for the evaluation of mining activities . The LCA methodology assessesthe environmental impacts associated with a product, process or service throughout its life byinventorying material resources, energy inputs and environmental issues, through a cradle tograve approach. Two main international standards, ISO 14040 and ISO 14044 describe the re-
13

quired and recommended elements of LCAs. The ISO standards identify four phases for con-ducting a LCA: 1) Goal and Scope; 2) Life Cycle Inventory (LCI); 3) Life Cycle Impact Assessment(LCIA) and 4) Life Cycle Interpretation.
The product life cycle is commonly divided into the following stages (EPA 2003):
• cradle to entry gate (raw material extraction and refining)
• entry gate to exit gate (product manufacture)
• exit gate to grave (product use, recycling and disposal)
Life cycle assessment (LCA) is a promising tool in the pursuit of sustainable mining. Thelatter has two major issues, first the depletion of mineral resources and second the direct en-vironmental effects of mining. As a consequence, the use of life cycle assessments to miningand processing minerals has increased in the last years. For instance, LCA has been appliedto different countries in the mining sector such as in Mexico (Suppen et al. 2006), in Hungary(Durucan et al. 2006) or in China (Xiao et al. 2003). However, a great number of life cycle as-sessments of metal production process do not consider the mining and processing stages inany detail, largely due to lack of publicly available data, according to Norgate & Haque (2010).Hence, LCA generally consider both, mining and processing minerals as one stage in the metallife cycle.
An additional problem with classic LCA is the life cycle impact assessment. LCA assess thecontribution of an input or output flows through different characterisation weighting factorswhich are the contribution per unit of input or output flows for different impact categories.Accordingly, the total contribution to the impact category is the sum of each one. The charac-terisation values for the mineral and energy resources categories and their impact, is usuallyevaluated through the Eco-indicator 99. This indicator is based on current concentrations ofore within the earth’s crust. The variation in these concentrations during an established periodof time, expresses the impacts on the mineral resources category in terms of surplus energy.This indicator takes into account the energy used for mining, the ore grade of presently minedores and the ore grade of future mined ore grades. Strauss et al. (2006) state that this indicatorvalues the concentrations of an ore much more than the scarcity.
However, there are other indicators used for assessing abiotic resource depletion. Accordingto Steen (2006), the existing methods for characterisation and weighting of abiotic resourcesappear to be based on four types of problem definitions. First, considering that mining costwill be a limiting factor. Second, assuming that collecting metals or other substances from low-grade sources is mainly an issue of energy. Third, inferring that scarcity is a major threat. Andfourth, deeming that environmental impacts from mining and processing of mineral resourcesare the main problem.
Besides, several authors such as Steen (2006), Stewart & Weidema (2005) and Yellishetty et al.(2009) assert that there are four types of indicators for abiotic resource depletion in LCA:
Type 1. Energy or mass This assessment method consist in the summation of energy andmaterials on energy and mass basis, focusing on current consumption but without considerthe ore grade.
Type 2. Relation of use to deposits This methodology considers not only the current con-sumption but also the reserve deposits for becoming aware of abundance or scarcity.
14

Type 3. Future consequences of resource extractions This assessment method consist in theaggregation of energy impacts based on future scenarios.
Type 4. Exergy consumption or entropy production This methodology lies in the aggregationof exergy and/or entropy impacts.
In Type 1 methodology, the consumption rates for different abiotic resources are already ag-gregated during characterization into one summarizing indicator. The use of abiotic resourcesis therefore neglected. Type 1 methodology suggest that all abiotic resources are exchangeableand equally important with respect to their mass or energy content. In this respect, Brentrupet al. (2002) proposed to asses the consumption of abiotic resources into separate impact sub-categories and integrating them into one summarizing indicator called the Resource DepletionIndex. Steen (2006) believe that if different substances are added up to obtain a category in-dicator, the total value will depend on how many substances are included and how they weregrouped.
The Type 2 methodology has an additional problem due to the fact that available reservedeposits are defined in the context of economic availability considering the technologies avail-able to exploit them as well as their accessibility (geographically and politically), hence as tech-nologies advance and permit to process ores of lower grades, the reserve base grows. Hence,the major deficiency in Type 1 and 2 methodologies has been their lacking ability to adequatelyreflect the loss in functionality related to their use, as well as their emphases on resource extrac-tion as opposed to an emphasis on product use and disposal, as the human activity responsiblefor resource depletion.
All the factors mentioned above consider that reserves are not static. Type 3 and 4 point outfuture consequences. The Type 3 methodology based on the future consequences of resourceextractions consider that extracting high concentration resources today will force future gener-ations to extract lower concentration resources leading to an increased impact on environmentand economy. Weidema (2000), assert that the main problem involved in valuing resources de-pletion is that the effect or damage occurs in the future. Therefore, the assessment dependson the assumptions on how this future looks like. In this sense, there is a distinction betweenthree types of future affects caused by present resource use: 1) future increase in the energyrequirement for extraction and preparation of those resources, which are presently available asstocks of high quality, 2) future decrease in human consumption opportunities, as a result ofgenetic resources (biodiversity) and 3) future decrease in human consumption opportunities,as a result of reaching an ultimate resource limit which is not energy but is land. This authorbelieves that arable land will be the first resource to become limiting.
The proposal of Finnveden & Ostland (1997) meanwhile could be categorized into Type 4methodologies. Finnveden & Ostland (1997) and McDonough & Braungart (2002) state that theinputs to the technical system studied in LCA should be traced back to extraction of raw mate-rials from the earth. For instance, the electricity or metallic copper should not be an input, butinstead the primary energy sources extracted from the environment used to produce the elec-tricity or the copper ore found in nature are appropriate inputs to a system described in LCA.In this respect, Finnveden & Ostland (1997) suggest that the characterisation weighting factorfor abiotic deposits can be represented by the chemical exergies of ores, calculated for systemboundaries compatible with the LCA methodology. Hence, the exergy consumption may beused as a characterisation parameter. Finnveden & Ostland (1997), Cornelissen & Hirs (2002)and Dewulf & Van Langenhove (2002, 2005) have applied the exergy analysis into the Life Cy-cle Assessment methodology. The exergy instead of energy, is preferred due to its capability
15

to account the quality of the energy and the chemical exergy of non-energetic raw materials.Finnveden & Ostland (1997) have used the exergy in the LCA as a measure of the depletion anduse of energy and material resources. These authors believe that the useful energy (exergy) isthe ultimate limiting resource because it has an associated energy cost that will be limiting tosome extent when it becomes too high. The use of exergy methods in order to accomplish anal-ysis in the mining industry that helps attaining sustainable development is widely supported inDincer (2002), Rosen (2002), Rosen & Dincer (2001), Rosen et al. (2008) because it allows to eval-uate efficiency, improve and reduce inefficiencies and identify environmental and economicsimpacts. The detractors of Type 4 methodologies point out that they involve some conceptualproblems because entropy and exergy are considered as very abstract indicators for loss of func-tionality, which makes it questionable whether they can be generally accepted as representativefor the very specific situations that apply to each type or resource. In this regard, Stewart & Wei-dema (2005) deem that the definition of an entropy baseline on which quantification could bebased is debatable.
Accordingly, Stewart & Weidema (2005), claim that the information required to quantify theeffects of resources depletion should include the functionality/quality, the ultimate quality limitand the backup technologies. There is not an agreement on the quantification of energy con-sumption by backup technologies for the depletion of abiotic resources. However, there is ageneral consensus about the energy requirement for backup technologies which are:
• The lower limit for the energy requirement (the least amount of effort).
• The upper limit for the energy requirement is the energy requirement of existing technol-ogy to convert the resources not directly reusable (extracted and processed) to a initialconditions of the resource mined from ores.
The Exergoecological approach used in this PhD provides an integrated view of the abovemethodologies, with a strong thermodynamic basis. The aim is to keep the strengths of the pre-vious approaches and try to solve some unresolved issues so far encountered for the assessmentof abiotic resource depletion. Accordingly, a thermodynamic approach to perform an absoluteLCA of metal mining and production was been proposed by Valero & Valero (2012). To evaluatethe depletion of non-fuel minerals, the aforementioned method quantifies the exergy costs re-quired to replace the extracted minerals with current available technologies, from a completelydegraded state. This is performed through the inclusion of the “Exergy Replacement Cost”. Inthis way, an absolute LCA (see Fig. 1.7) can be performed by including a new stage in the anal-ysis, namely:
• grave to cradle (concentration process by nature)
In this way, both, the lower and upper limit for the energy requirement mentioned by Stew-art & Weidema (2005) are fulfilled in the proposed absolute LCA approach. The first limit is setthrough using exergy as the unit of measure (minimum thermodynamic value used to obtainthe mineral) and the second one is the real energy of the process through the so called exergyreplacement costs. The use of exergy assures reliability and objectivity to the results. In this re-spect, it shares the same advantages and disadvantages of Type 4 methodologies. However, theproblem with the baseline is solved, as it uses a coherent degraded Earth as the starting pointof the calculations. The details of the methodology will be explained in chapter 4.
16

M E T H O D S , TO O L S , A N D S O F T WA R E
Figure 1 Life cycle assessment from grave to grave. Manuf. = manufacturing; conc. = concentration.
a matter of precision. For many unrefined analyses we may useboth the energy and embodied energy concepts as substitutes forexergy and exergy cost concepts, respectively, but in fact, in noway are they synonymous. Both exergy and exergy cost requireprecise definitions. As is well known, LCA results are relativeto the chosen system’s boundary. Nowadays, no absolute LCAvalues exist for a given good or service. Notwithstanding that,suppose we start our analysis from a hypothetical cradle in whichall the commercial minerals and fossil fuels have been depleted(i.e., Thanatia). This degraded planet serves us both as a bound-ary limit and as an absolute reference system good enough forcalculating the exergy and exergy costs of any commodity atthe industry gate. Theoretically speaking, this is the only wayto get absolute LCA values, by converging LCA with secondlaw analysis through Thanatia as a reference environment.
In the future Thanatia may become the starting point for theassessment of abiotic resource depletion. The exergy measuredfrom Thanatia gives a measure of the quality of the resourceand constitutes a universal, objective, and useful tool for clas-sifying resources according to their depletion states. Presentedover time, exergy can give an indication of the speed at whichdegradation is occurring. However, we must state that evenconsidering a consequent baseline, exergy is still insufficientfor realistically quantifying resource depletion and we shouldadditionally resort to exergy costs.
Hence, from the exergoecological point of view, we proposeto introduce a new stage in the LCA’s cradle-to-grave method-ology, namely the grave-to-cradle approach, as depicted infigure 1. In our view, there is a lack of theory rather than alack of indicators. Partial or total cradle-to-grave assessments
are only half of the cycle. We call them “over the rainbow”accounting methodologies. They lack the other side: the grave-to-cradle assessment. In the same way that imaginary numberscan hardly be explained in real space, some phenomena likedepletion may be better explained in the “down the rainbow”approach. It is important to close the whole material’s cycle,as stated by McDonough and Braungart (2002) in their bookCradle to Cradle. Once extracted, concentrated, and refined (inthe cradle-to-gate stage), minerals are converted into usefulproducts (entry gate to exit gate). Some of these materials arerecycled when their useful life ends and go directly into theentry gate–to–exit gate stage. However, most of them end up aswaste—either as pollution or disposed of in landfills—and be-come degraded and dispersed, arriving at a final depleted state(to the grave)—that is, to Thanatia. In this way, at least fourmain costs in the life cycle of a product come into play (seefigure 1). The first one belongs to the “down the rainbow” part.It is in fact an avoided and imaginary cost, and represents thedebt we acquire with future generations as the effort that na-ture spent in producing minerals in a concentrated state. Theremaining costs belong to the “over the rainbow” part and areassociated with real consumption. The second one is the costassociated with mining, mineral processing, smelting, and re-fining. Next, the manufacturing costs result when the alreadyprocessed raw materials are converted into useful products. Andfinally, recycling costs will eventually appear if scrap and wastesare recycled.
The distances from the horizontal axis of each one of thereservoirs in figure 1 are variable for each material under analy-sis. The same thing happens with the relative distance between
48 Journal of Industrial Ecology
Figure 1.7: Life cycle assessment from grave to grave. Valero & Valero (2012).
1.5 Summary
Mineral resources are finite, therefore they will eventually be depleted by ongoing extraction. Inthis chapter, a general outlook of the mineral situation (world production and price of metals)in the actual society as well as the factors which influence the availability of minerals resourcesand the environmental consequences of mineral extraction were analyzed.
Undoubtedly, sustainable development is one of the most complex and challenging issuesbecause it involves the preservation, rational use and enhancement of natural resources. At thesame time social, environmental and economic objectives of sustainability must be fulfilledover the long-term.
Resource depletion depends on several factors such as: availability of energy sources, waterlimitations, climate change, legal restrictions, environmental protection, social disruption, in-ternational trade, recycling and reuse, substitution, growth in demand and technology change.In this respect, the life cycle assessment is a promising tool in the assessment of mining andprocessing minerals. The chapter ended with a critical analysis of current LCA approaches forthe evaluation of abiotic resource depletion. A new methodology for addressing a good numberfor open issues in conventional LCA was proposed, based on the exergoecological approach.Such methodology involves the inclusion of a new stage in the LCA methodology, namely thegrave to cradle stage, thereby accounting for the depletion degree of minerals. Consequently,an absolute LCA can be performed: from the cradle to the grave and back again to the cradle.
In the next chapter, the first stage of LCA: cradle to entry gate (raw material extraction andrefining) is analyzed, as the first step for an absolute life cycle assessment.
17


Chapter 2
Metal Resources and Energy
Mining industry provides essential raw materials like coal, metals, minerals, sand, and gravelto the manufacturing and construction industries. There is a wide variety of metallurgical pro-cesses in mining industry, which depends on the metal extracted, the ore grade, mining condi-tions, available technology, economic issues, etcetera. The aim of this chapter is to describe themain physical processes applied in mining and metallurgical industry, in order to describe themetal processing and energy consumption of each commodity analyzed and applied in differ-ent case studies in this thesis. The analysis of these processes constitutes the first stage of LCA:cradle to entry gate (raw material extraction and refining).
In this chapter, an introduction of the main physical processes applied in mineral process-ing and extractive metallurgy is presented. The information presented in this section was takenfrom several sources: Ghosh & Hem (1984), Gupta & Mukherjee (1990), Rosenqvist (1983), Wils(2006). Afterwards, the metal processing and energy requirements of selected metals analyzedin this thesis are given. Energy requirements data for metal processing varies greatly, and in-crease substantially due to different factors such as: lower ore grades, deeper mines, complexores and more mine wastes.
2.1 Mineral processing and extractive metallurgy
Production of metals from natural ores is mainly a separation process. The separation pro-cesses can be classified into two stages.Concentration which is the separation of the compoundcontaining the desired metal from other constituents. This stage includes the mining and ben-eficiation processes.Extraction and Refining which is the separation of the desired metal fromother constituents of the metallic compound and further purification of the metal.
There are two basic mining techniques: underground and open-pit mining. The methodselected depends on a variety of factors, including the nature and location of the deposit, andthe size, depth and grade of the deposit. The most common method is the open-pit mining,due to the lower energy consumption. Underground mining requires more energy than sur-face mining due to greater requirements for hauling, ventilation, water pumping, and otheroperations. The mining process can be divided into two general stages, each involving severaloperations. The first stage is extraction, which includes activities such as blasting and drillingin order to remove material from the mine. The second stage is materials handling, which in-volves the transportation of ore and waste away from the mine to the mill or disposal area. A
19

brief description of the operations used in mining follows.
Drilling is the act or process of making a cylindrical hole with a tool for the purpose ofexploration, blasting preparation, or tunneling.
Blasting uses explosives to aid in the extraction or removal of mined material by fracturingrock and ore by the energy released during the blast.
Digging is to excavate, make a passage into or through, or remove by taking away materialfrom the earth. The goal of digging is to extract as much valuable material as possible and re-duce the amount of unwanted materials. Digging equipment includes hydraulic shovels, cableshovels, continuous mining machines, longwall mining machines, and drag lines.
Ventilation is the process of bringing fresh air to the underground mine workings while re-moving stale and/or contaminated air from the mine and also for cooling work areas in deepunderground mines.
Dewatering is the process of pumping water from the mine workings.
Mineral processing (or Beneficiation) follows mining and consists of several operations re-quired to prepare and classify ores before the valuable constituents can be separated or con-centrated for its further use or treatment. In order to separate the minerals from gangue (thewaste minerals), it is necessary to crush and grind the rock to liberate valuable minerals. Thisprocess of size reduction is called comminution. Apart from regulating the size of the ore, it isa process of physically separating the grains of valuable minerals from the gangue minerals, toproduce an enriched portion, or concentrate, containing most of the valuable minerals, and adiscard, or tailing, containing predominantly the gangue material.
There are two fundamental operations in mineral processing: liberation (the release of thevaluable minerals from their waste gangue minerals, by means of comminution) and concentra-tion (separation of these values from gangue). According to Wils (2006), grinding is the greatestenergy consumer, accounting for up to 50% of a concentrator’s energy consumption. The mainphysical methods which are used to concentrate ores are:
• Sorting is the separation based on optical and other properties.
• Gravity concentration is the separation based on differences in density.
• Froth flotation is the separation utilising the different surface properties of the minerals.
• Magnetic separation is the separation dependent on magnetic properties.
• High-tension separation is the separation dependent on electrical conductivity proper-ties.
Extractive metallurgy deals with extraction of metals from their ores. Mining and extractionprocesses consists of some individual sequential steps. For instance, electrolysis is applied toaluminium, zinc, copper and many other metals. Smelting is performed for extraction of ironor lead. The steps can be physical operations like comminution, filtration, casting, distillation,etc., or chemical operations such as leaching, smelting, etc.
The extractive metallurgy classified the methods of extraction and refining into:pyrometallurgywhich is performed at high temperatures, hydrometallurgy which is carried out in aqueous me-dia at or around environment temperature and electrometallurgy which employs electrolysisfor separation at high or environment temperature.
20

2.1.1 Pyrometallurgy
Pyrometallurgical methods of metal production are usually cheaper and suited for large scaleproductions. There are several processes used in pyrometallurgy such as:
Calcination is the thermal treatment of an ore to provoke its decomposition as well as theelimination of volatile products (generally carbon dioxide and/or water).
Roasting usually involves heating of ores below the fusion point in excess of air. It producesa chemical conversion and makes the raw materials more suitable for subsequent reduction.Some roasting operations includes: oxidizing, volatilizing and chloridizing.
Oxidizing roasting: this operation is performed to burn sulphur from sulphides with con-version of sulphides in whole or in part into oxides. For example
PbS(s)+ 3
2O2(g ) = PbO(s)+SO2(g ) (2.1)
Under certain conditions, oxidizing roasting may involve other reactions, leading to forma-tion of sulphates or even the release of the metal itself in elemental form.
Volatilizing roasting: this is carried out to eliminate volatile oxides such as As2O3, Sb2O3
and Z nO.
Chloridizing roasting: this is done to convert certain metal compounds to chlorides fromwhich the metal may be subsequently obtained by reduction. The reaction is of the type
2N aC l (s)+PbS(s)+2O2(g ) = N a2SO4(s)+PbC l2(l ) (2.2)
Smelting is a process for the reduction of a metal oxide to metal, carbon is by far the mostcommon reducing agent because of its easy availability and low cost.
2.1.2 Hydrometallurgy
Hydrometallurgical processes have the objective of isolate and win metals by the use of water oraqueous solutions. It involves a large sort of processes such as cyanidation for treating gold andsilver ores, and the Bayer process for the production of alumina. There are several operationsused in hydrometallurgy such as:
Leaching is a process used to recover metals from ores by dissolving the metal into a solutionin contact with the crushed ore. There are different types of leaching, such as: high temperatureacid or alkaline leaching, cyanide leaching of gold and bioleaching of sulfide minerals.
Precipitation of Impurities is a chemical process in which a dissolved substance separatesfrom solution as a fine suspension of solid particles. Also called crystallisation when the solidsformed are crystals.
Solvent Extraction (SX) is a process to separate dissolved metals (e.g. uranium, copper,nickel, cobalt, etc.) from impurities or between them. A solution of a metal leached from anore is mixed with an organic solvent containing specific extractant chemicals. The aqueousand organic phases form an emulsion in which the extractant chemicals in the organic solventbind to the metal ions and pull the metal into the organic phase. The mixture is left to settle sothat the organic and aqueous phases separate. The organic phase containing the concentrated,
21

purified metal is removed. The metal ions are then transferred from the solvent back into anaqueous solution from which they can be recovered in high purity.
Adsorption and Ion Exchange is the accumulation or concentration of a substance on a sur-face. In physical adsorption, molecules are attracted to a surface by intermolecular forces ofattraction. In chemical adsorption, molecules, atoms or ions are attached to a surface by chem-ical bonds.
2.1.3 Electrometallurgy
Electrometallurgy is the application of electrolysis to the winning and refining of metals. Elec-trometallurgy is usually the last stage in metal production after corresponding pyro or hydromet-allurgical operations. As stated by Rosenqvist (1983), electrowinning is important for the veryreactive light metals aluminum and magnesium, which are almost always produced by elec-trolysis of fused salts. Furthermore, electrorefining is fundamental for the recovery of valuableimpurities, such as silver and gold from copper.
Electrowinning recovers a metal (such as copper, zinc or nickel) from a solution containingthe metal ions. An electrowinning production cell is an electrochemical cell with an appliedelectric current in which metal ions deposit the metal on the cathode.
Electrorefining is the electrolytic purification of the crude metal produced by pyrometallur-gical operations. The basic metal is dissolved from a positive electrode and further, it is reducedon the cathode where the final product is highly pure metal.
2.2 Metal Processing and Energy Requirements
In this section, a brief description of the main uses, physical, chemical and geological charac-teristics, producing countries and the extractive and production processes as well as the energyrequirements of 17 metals used throughout the development of this thesis are presented. Ad-ditional information about uses of these and other metal are presented in Appendix A. A sum-marize table of the energy consumption of each metal is presented, the Emining represents theempirical energy data for mining and concentration processes, whilst the Erefining accounts theadditional energy required to obtain the metal in an average refining grade through the smelt-ing and refining processes.
2.2.1 Aluminum
Aluminium is an important commodity for modern manufacturing, used in construction andautomobile production. It is a lightweight, high-strength, corrosion-resistant metal with highelectrical and thermal conductivity, and it is easy to recycle. Primary aluminum is producedglobally by mining bauxite ore, refining the ore to alumina, and finally, smelting alumina toproduce aluminum. More than 95% of the bauxite today is gained from open mines. Secondaryaluminum is produced by sorting, melting and treating recycled aluminum scrap (Classen et al.2007). The major producers are Australia, Guinea, Jamaica and Brazil.
The total energy for the production of alumina from bauxite ore in the ground includesthe following main processes: mining, crushing, griding, clarification, filtering and calcination.
22

A simplified overview of the processes is given in Fig. 2.1, followed by a brief description ofthe production processes. In chapter 6, section 6.3.2 additional information about aluminiumproduction is presented.
& Q>&7#+'*.-6+"*#& &
1 Introduction This part deals with primary and secondary aluminium production. Because bauxite, aluminium hy-drate and aluminium oxide are mainly consumed in the aluminium production, these chemicals are also included in this report.
A considerable part of the aluminium consumed today is secondary material. Thus also the collection of aluminium scrap and the recycling process are included.
A simplified overview of the processes is given in Fig. 1.1.
mine, bauxiterecultivation, bauxite mine
aluminium hydroxide,
plant
aluminium oxide, plant
aluminium hydroxide, at
plant
aluminium oxide, at
plant
aluminium electrolysis,
plant
cathode, aluminium electrolysis
anode, plantanode,
aluminium electrolysis
aluminium, primary, at
plant
aluminium scrap, new, at
plant
aluminium scrap, old, at
plant
scrap preparation
plant
aluminium, production mix, cast
alloy, at plant
aluminium, production
mix, wrought alloy, at plant
aluminium, production
mix, at plant
bauxite, at mine
aluminium, primary, liquid, at
plant
aluminium, secondary, from new
scrap, at plantaluminium
melting furnace
aluminium casting, plant
aluminium, secondary, from old
scrap, at plant
Fig. 1.1 Simplified overview of the processes for the aluminium production
ecoinvent v2.0 report No. 10& E&Q&E&
Figure 2.1: Simplified overview of the processes for the aluminium production. Classen et al.(2007).
According to Classen et al. (2007), the ore is won in stripes using hydraulic excavators and/ or belt loaders. Drilling and blasting is only needed in some mines with exceptionally hardbauxite. The bauxite is transported to the mobile grinder and possibly to a dryer from whereit is shipped to the aluminium oxide extraction plant. 98% of the world wide production ofaluminium hydroxide and aluminium oxide is based on the Bayer-Process, whilst 98% of theindustrial production of aluminium is done by electrolysis of aluminium oxide (Hall- Heroultprocess). This process requires a big amount of electricity.
As stated by Boustead & Hancock (1979), the concentrating energy requirement in USA sum-marizes 30.52 GJ/t, additionally it has a high energy use about 283.11 GJ/t for the refining pro-cess. The aluminum industry produces ingots of pure aluminum (greater than 99%). Whilst,Yoshiki & Toguri (1993) assert that if mining and ore preparation (crushing, washing or wet
23

screening, and drying) are considered as the concentrating process, the energy consumption is36.63 GJ/t while 127.38 GJ/t is the energy demanded in the refining process (smelting). Takinginto account that for the production of 1 tonne of alumina, which produces about 0.53 tonnes ofaluminum, is required approximately 2 tonnes of bauxite, the energy required in this concen-trating process is 37.37 GJ/t whilst the refining process requires 53 GJ/t for the best operatedanode cells to 61 GJ/t for some traditional cells, on the report of IPPC (2009a).
When aluminum is produced from bauxite, Classen et al. (2007) state that the energy re-quired for both concentrating and refining processes is 78.7 GJ/t. If the production of aluminafrom bauxite ore is done through the Bayer process, Chapman & Roberts (1983) affirm that theenergy requirement is about 50 GJ/t of aluminum correspond to the energy consumption forthe concentrating process and 228 GJ/t are used in the concentrating process to produce alu-minum by the electrolysis of alumina in the Hall cell (Hall-Heroult process is a very electricity-intensive).
Ayres et al. (2002) state that the energy consumption per tonne of aluminum in the refiningprocess through 1997 was 53.43 GJ/t, in 2002 it was 48.922 GJ/t and during 2005 it was reportedas 40.075 GJ/t. These data shows a decrease which is partly due to the closure of some oldersmelters, according to EAA (2006). Either the amount of 175 GJ/t for this process was reported.The most efficient smelters operate with an energy consumption of about 46.8 GJ/t. Margo-lis (1997) argues that the average energy consumption of aluminum reduction will continueto decrease as old and obsolete smelters are shut down, existing smelters are retrofitted andmodernized, and new cells lines with moderns technology are built. This technology renewalis slow, especially due to the high investment costs of new capacity. Otherwise, is not expectedsubstantial energy savings from the Hall-Heroult electrolytic process.
The most accurately data for the aluminum production process involves an energy require-ment for the concentration process of gibbsite from the ground as 37.77 GJ/t, reported in IPPC(2009a), while the energy consumption in the refining process of gibbsite to obtain pure alu-minum is 55.692 GJ/t. Table 2.1 summarize the energy consumption in mining and refining ofaluminium, according to the aforementioned process used to obtain it.
Table 2.1: Energy consumption in the aluminium production. Values expressed in GJ/ton of Al.Emining Erefining Etotal
Boustead & Hancock (1979) 30.52 283.11 313.63
Chapman & Roberts (1983) 50 228 278
Yoshiki & Toguri (1993) 36.63 127.38 164.01
EAA (2006) 40.07–53.43
Classen et al. (2007) 78.7
IPPC (2009a) 37.37 53 90.37
On the report of DOE (2007), it is asserted that the aluminum industry has large opportuni-ties to further reduce its energy intensity, because is constantly evaluating, adopting, and im-proving furnace technologies and practices. This provides not only energy and environmentalbenefits, but also cost savings. According to Margolis (1997), the average energy consumptionof aluminium reduction will continue to decrease as old and obsolete smelters are shut down,existing smelters are retrofitted and modernized, and new cells lines with moderns technologyare built. This technology renewal is slow, especially due to the high investment costs of new ca-pacity. Otherwise, is not expected substantial energy savings from the Hall-Heroult electrolyticprocess.
24

2.2.2 Cadmium
Cadmium applications has shifted away from the market areas of pigments, stabilisers andcoatings to Ni-Cd batteries which have extensive applications in the railroad and aircraft indus-try, cellular telephones and portable computers (Classen et al. 2007). Cadmium is a very scarceelement (0.1 – 0.2 ppm in the earth’s crust) (Ayres & Ayres 1996). It is a by-product of zinc extrac-tion. Nowadays, approximately 80% of world cadmium production was derived from mining,smelting, and refining of zinc, and the remaining 20% came from copper and lead smelting andthe recycling of cadmium products USGS (2011a). According to Ayres & Ayres (1996), Japan wasthe biggest producer of refined metal, followed by Russia, Belgium and USA.
The most common production process for cadmium production is the electrolysis from pro-cessed cadmium sludge from hydrometallurgical zinc operations. This operation includes threestages; precipitation, oxidation and electrolysis. If cadmium is removed with copper by reduc-tion with zinc dust during the hydrometallurgical zinc refining, the metallic sludge constitutesthe most important source for cadmium refining process, Classen et al. (2007) report an energyconsumption of 4.5 GJ/t .
Otherwise, assuming the concentrating process as a chemical leaching, the energy con-sumption will be 103.5 GJ/t, according to Kihlstedt (1975). While, Botero (2000) reports therefining energy requirement as 6.48 GJ/t. Table 2.2 summarize the energy consumption in min-ing and refining of cadmium, according to the aforementioned process used to obtain it.
Table 2.2: Energy consumption in the cadmium production. Values expressed in GJ/ton of Cd.Emining Erefining Etotal
Kihlstedt (1975) 103.5
Botero (2000) 6.48
Classen et al. (2007) 4.5
2.2.3 Chromium
Chromium is one of the modern industry’s essential element and important raw material forthe production of stainless steel, and this is the major form in which chromium is recycled. Ithas a wide range of uses in metals, chemicals, and refractories. Chromium is obtained fromchromite ore. Chromite enhances thermal shock and slag resistance, volume stability, strengthand is used mainly in the ferrous and non-ferrous industry, cement industry and glass manufac-turing. Ayres & Ayres (1996) assert that chromium (along with cobalt) is the archetypical ‘strate-gic metal’ because of its importance in corrosion and heat resistant alloys, especially in theso-called ‘superalloys’ used in aerospace technology. The major chromite ore and concentratesproducing countries are South Africa, India and Kazakhstan, representing 70% of 2008 worldproduction as a whole. South Africa and Zimbabwe hold about 90% of the world’s chromitereserves and resources, according to Murthy et al. (2011).
Chromium metal is a metallurgical industry product. It is produced by one of two processes:electrolysis or aluminothermic reduction (Classen et al. 2007), as shown in Fig. 2.2. The met-allurgical route involves smelting in an electric furnace to yield ferro-chromium. Chromium isconsidered to be made by alumiothermic process (75%) and electrolysis (25%).
25

& a>&/51+(R&4F$'$6+('"1$+"*#&
5 System Characterisation This study focuses on the main processes in the chromium production as shown in Fig. 4.1. As shown in chapter 4 Use / Application of Material no secondary production of chromium has to be considered, since the recycling of chromium occurs directly into the foundries in the form of re-melted alloys from chromium containing scrap.
%*0L6*$%
=\Tm???&+
75%
H(+$%%-'O"6$%&@%$#+
^mT\=mb??&+
high-coal
=m]?Tm???&+
am???&+
(%(6+'*%5+"6&)'*.-6+"*#
Tam???&+ $%-R"#*L
+F('R"6&'(.-6+"*#
17%
Chromite
bm=a[m???&+
4F(R"6$%&@%$#+
C^^m???&+
C^^m???&+
8%
P(,'$6+*'5&7#.-1+'5
^b?m???&+
'(,'$6+*'"(1
^b?m???&+
4F'*R"-R&4F(R"6$%1
=?m???&+
!(''*L6F'*R"-R
Chromium Metal
Fig. 5.1 Scheme of the chromium production system considered. The study focuses on the production of high-carbon ferrochromium, which is based on chromite. Chromite itself is used in different other modules in ecoinvent like “portachrom, at plant” Hischier (2003), “sodium dichromate, at plant” Althaus et al. (2003) and in the cement production. Metallic chromium is won from two different processes. Values shown are in ton-nes of chromium contained and are based on USGS (2003) and Adelhardt & Antrekowitsch (1998).
ecoinvent v2.0 report No. 10& L&T=&L&
Figure 2.2: Scheme of the main processes in the chromium production. Classen et al. (2007).
According to Boustead & Hancock (1979), the energy requirement for producing chromiumwas 0.33 GJ/t. Chapman & Roberts (1983) report the energy requirement for mining and con-centrating ore to produce chromium as 3.11 GJ/t, whilst the smelting and refining processes is129.84 GJ/t . Classen et al. (2007) state that the energy needed for the production of metallicchromium is 0.29 GJ/t during the concentrating by aluminothermic process and 0.025 GJ/t forthe refining step. The consumption of energy for the production of chrome is 0.5 GJ/t, on thereport of IPPC (2009a). Table 2.3 summarize the energy consumption in mining and refining ofchromium, according to the aforementioned process used to obtain it.
Table 2.3: Energy consumption in the chromium production. Values expressed in GJ/ton of Cr.Emining Erefining Etotal
Boustead & Hancock (1979) 0.33
Chapman & Roberts (1983) 3.11
Classen et al. (2007) 0.29 0.025
IPPC (2009a) 0.5
2.2.4 Cobalt
Cobalt is a crucial element in many technological applications. The largest end-use of cobaltis for high-temperature resistant ‘superalloys’ in jet engines. Cobalt is mainly produced as aby-product and recovery of other abundant metals such as copper, platinum or nickel. Ayres& Ayres (1996) states the cobalt is undoubtedly a ‘strategic’ mineral, given the small number ofproducers and the importance of its uses. According to Harper et al. (2012), the three principal
26

cobalt-using countries are China, Japan, and the United States, together account for approxi-mately 65% of cobalt end use products. The ad-hoc Working Group (2010) state that Chinesecompetition regarding primary production and limited options for substitution, cause cobaltto be considered critical material for EU.
0='L#$&)DD
SKC ?+")@$&&+-9)A$#',9)!"(-9#&.$9
$<B(Q8:QB:5<L5B EBQ8:;L<=(HL5B<4LAE
L>(HL55BR>(5<BL5B;(Q8:QB:5<L5BQ>(LAA8=
,LAB9I(58(__^__(j()8
I<Bc5<BL5HB:5aBLQ64:0
%9<474QL548:
@9A/('4(8<()9EBIL<L548:
aBLQ64:0
)8(<BQ8NB<=
%9<474QL548:
V<L:E78<HL548:
%9<474QL548:
,LAB9I(58(__^\G(j()8
@.%-&$)DDIDD\)W$"$&.5)4,+V)9=$$#)9=+V."%)L+99.;,$)L&+5$99)9#$L9)4+&)5+;',#)L&+(-5#.+"Figure 2.3: Generic flow sheet showing possible process steps for cobalt production. IPPC(2009a).
Cobalt can be produced during the recovery of nickel after separation by solvent extraction(SX). Cobalt can be electro-won, recovered by hydrogen reduction or precipitated for furtherrefining using atmospheric and oxygen pressure leaching. Figure 2.3 shows a generic route ofpossible process steps for cobalt production.
Cobalt can be extracted from spend liquor of cooper mine, therefore the energy for miningand concentrating ore is disregarded. Chapman & Roberts (1983) report that the smelting andrefining processes require 129 GJ/t. Botero (2000) indicates that the energy needed for min-ing and concentrating cobalt from sulphide ore is 193 GJ/t. Table 2.4 summarize the energyconsumption in mining and refining of cobalt.
Table 2.4: Energy consumption in the cobalt production. Values expressed in GJ/ton of Co.Emining Erefining Etotal
Chapman & Roberts (1983) 129
Botero (2000) 193
2.2.5 Copper
Copper is used as pure metal and as alloying element with other metal and steels. Its utility isbased on its physical and chemical properties, like electrical and thermal conductivity, ductility,workability and corrosion resistance. Then, the main use of copper is in wiring, plumbing andtelecommunications. The by-products of copper are zinc, lead, molybdenum, cobalt, arsenic,selenium, tellurium and silver. Copper ores are low in grade and most copper in mined from
27

large open pit mines requiring large amounts of materials processing. Ayres & Ayres (1996) as-sert that copper mining involves more materials displacement than any mining activity exceptcoal mining and uranium mining. The main producing countries are United States, Australia,Canada, Chile and China (USGS 2011a).
There are many different process possibilities to obtain the metal, it will depend on theore composition as well as the local costs of energy supply, nonetheless basically two differenttypes can be distinguished: hydrometallurgical and the pyrometallurgical process with a shareof 90.6 % and 9.4 % of the world-wide copper produced in 2004. Pyrometallurgical processincludes mainly three stages: (1) ore mining and beneficiation, (2) smelting and reduction and(3) final refining, while the hydrometallurgical process skips the beneficiation step, instead aleaching step is done which is followed by electro-winning. Classen et al. (2007) report that theore is mined mainly in open cut operations rising to 70 % in open pit, then 30 % is mined inunderground. Figure 2.4 depicts the primary copper production route.
0='L#$&)K
?+")@$&&+-9)A$#',9)!"(-9#&.$9 DRb
)8:QB:5<L5BESA9]BE+:5B<:LA(<BQ=QABEn(,AL0EC(7A9B;9E5EC(B5Q^,BQ8:;L<=()9(HL5B<4LA
!(!(!(
!(
((%<4HL<=
()8:QB:5<L5B(58(*L55B,HBA54:0
((
(!( SALE6(EHBA54:0(79<:LQB!( #8LE5(m(!ABQ5<4Q(79<:LQB!( @L56(EHBA54:0(79<:LQB
( ( ( ( (( ( (
(*L55B(
(,AL0 (,AL0(QABL:4:0n!( ,A83(Q88A4:0(g(7A85L548:!( !ABQ5<4Q(79<:LQBC(VB:4B:5B(EAL0
QABL:4:0( ( ( ( (( ( ( (,$J !( %<8;9Q548:(87(A4d94;(,$JC
E9AI69<4Q(LQ4;C(8AB9H( ( ( ( ((&:8;B(EQ<LI()8IIB<(EQ<LI(+:5B<:LA(<BQ=QABEn(,AL0EC(;9E5CB5Q^
!(!(
!(
()8:NB<54:0 ( !( %^,^(Q8:NB<5B<!( $56B<(Q8:NB<5B<E
( ( ((
(@A4E5B<(Q8IIB<((
( (
(()8IIB<(EQ<LI !(
(
((S4<Bc<B74:4:0(g(&:8;B(QLE54:0
(((
(!( #85L<=(L:8;B(79<:LQB!( KBL<56(E6L75(79<:LQB(.()8:54HBA5
( ( (()8IIB<(L:8;BE
((
( (
( ( ((!ABQ5<8A=54Q(<B74:4:0
(
( (!( )8:NB:548:LA!( %B<HL:B:5(QL568;B(5BQ6:8A80=C
B^0^(+,&(I<8QBEE
)8IIB<(QL568;BE
)8IIB<(QL568;BE%9<B(Q8IIB<(EQ<LI
!( *BA54:0C)LE54:0(87
,6LIBEC(Y4<Bc<8;
!( ,6L75(79<:LQBE!( !ABQ5<4Q(4:;9Q548:(79<:LQBE!( #85L<=(79<:LQBE
@.%-&$)KID\)*&.7'&H)0+LL$&)*&+(-5#.+")3+-#$
MEAEAEAEM!%.8)!8)7.4.4@
!"#$% #$% 1% (-&/"'&%E-&#(#*1/#,)% $/'E% 1EE3#'+% /,% /"'% *&-+'%.'/13% <03#$/'&%*,EE'&>%E&,+-*'+%06% /"'*,)2'&$#,)% $/18'D% % !"'% &'(#)#)8% $/'E% #)2,32'$% /"'% 1++#/#,)% ,(% 1#&% 1)+% /"')% 1% &'+-*/1)/% <'D8D"6+&,*1&0,)$%'/*>%/,%&'+-*'%1)6%,7#+'%E&'$')/%{/.%==H%C?%:AA:_%/.%=;H%R9T?ZS%:AA;_%/.%A=?,EE'&%C7E'&/%Q&,-E%:AAe|D
U#&'%&'(#)#)8%#$%1*"#'2'+%06%(#&$/%03,G#)8%1#&%/"&,-8"%/"'%.,3/')%.'/13%/,%,7#+#$'%#.E-&#/#'$%1)+&'.,2'%(#)13%/&1*'$%,(%$-3E"-&%E&,+-*#)8%1%$.133%1.,-)/%,(%$318D%%9%$,-&*'%,(%&'+-*#)8%18')/H$-*"%1$%)1/-&13%81$%,&%E&,E1)'H%#$%/"')%1++'+%/,%&'+-*'%1)6%*,EE'&%,7#+'%(,&.'+D%9..,)#1%.16
Figure 2.4: Primary copper production route. IPPC (2009a).
28

Copper is mining from currently mined ores averages around 0.8 percent in grade globally,thence the energy consumption in OECD countries for copper production from typical ore is60 GJ/t. In an open pit and low-grade copper mine (0.5 %) in the form or chalcopyrite, Kihlstedt(1975) reports the energy needed for concentrating as 42.84 GJ/t. The low grade of copper ore(0.5 to 2 %) makes mining and ore preparation quite energy intensive compared to the othermetals industries, thence Yoshiki & Toguri (1993) report the energy consumption during theseprocesses is 62.7 GJ/t, while the refining process requires 95.47 GJ/t.
According to Boustead & Hancock (1979), the gross energy requirement to produce copperfrom ore by the hydrometallurgical route is 73.75 GJ/t whilst the primary smelting and refiningprocesses need 54.25 GJ/t. Classen et al. (2007) argue that in pyrometallurgical processes theaverage consumption in the concentration stage is 7.59 GJ/t, while the smelting and refiningprocess have a energy consumption of 12.5 GJ/t. The hydrometallurgical process based on thesolvent extraction-electro-wining has energy requirement of 46.8 GJ/t and it is used mainly foroxide ores, also the sulphide ores can be recovered by this technique but they have to be roastedprior to leaching. During copper production the energy used in the electrolytic process is themost significant, 17 GJ/t on average are required for concentrating while 1.26 GJ/t is the energyconsumed by the electrorefining stage using copper concentrate, as reported on IPPC (2009a).
Chapman & Roberts (1983) assert that considering the best practice in the copper mining,the total energy required to mine and concentrate copper is 66.7 GJ/t taking into account thatthe ore grade ranges about 0.6 %, but if is consider that it is 1 % the energy requirement decreaseto 40 GJ/t, for the smelting and refining processes the energy requirement is 47 GJ/t. Ayres et al.(2002) outline that the energy required for copper production where energy-saving technolo-gies has been introduced give the weighted average for mining and concentration as 32 GJ/tand only 15 GJ/t for smelting in the case of the lowest grade ores currently mined.
Applying a Life Cycle Assessment (LCA) methodology in order to calculate the gross energyrequirement in the production process, and considering a generation efficiency of 50 % due tothe utilization of thermoelectric and hydroelectric power plants, Norgate et al. (2007) calculatethe energy requirement for the hydrometallurgical route as 128 GJ/t, whilst the pyrometallur-gical route accounted an energy consumption of 66 GJ/t, including both process concentratingand refining.
Finally, considering that the recent energy efficiency improvements are in the smelter andnot in the mining and concentration step, is considered that the actual energy consumptionby pyrometallurgical process for the concentration stage is 32 GJ/t and for refining is 28 GJ/t.Alvarado et al. (1999) state that there is a consensus that further energy savings are both techni-cally and economically feasible and can be achieved. Table 2.5 summarize the energy consump-tion in mining and refining of copper, according to the aforementioned process used to obtainit. The reasons for the large discrepancies between energy requirements are the improvementsof current technologies and introduction of new processes.
2.2.6 Gold
Gold is used mainly for jewelry, electronics, bar hoarding and official coins. One of the pecu-liarities of gold is that it can be recycled easily from jewellery, then gold is a renewable resourcewith no degradation in quality. Gold is commonly found native in Nature.
According to USGS (2011a), the world gold production during 2010 was produced in thefollowing countries: China (13.8%), Australia (10.2%), USA (9.2%), South Africa (7.6%), Rus-
29

Table 2.5: Energy consumption in the copper production. Values expressed in GJ/ton of Cu.Emining Erefining Etotal
Kihlstedt (1975) 42.84
Boustead & Hancock (1979) 73.75 54.25 128
Chapman & Roberts (1983) 66.7 47 113.7
Yoshiki & Toguri (1993) 62.7 95.47 158.17
Ayres et al. (2002) 32 15 47
Classen et al. (2007) 7.59 12.5 20.09
IPPC (2009a) 17 1.26 18.26
sia (7.6%), Peru (6.8%), Indonesia (4.8%), Ghana (4%), Canada (3.6%), Uzbekistan (3.6%), Brazil(2.6%), Papua New Guinea (2.4%), Mexico (2.4%), Chile (1.6%) and other countries (19.7%). Themajor reserves are located in Australia (14.4%), South Africa (11.84%), Russia (9.86%) and Chile(6.71%). Reserves data are dynamic because they may be reduced as ores are mined and/orthe extraction feasibility decreases, or more commonly, they may continue to increase as fur-ther deposits (known or recently discovered) are developed, or currently exploited deposits aremore completely explored and/or new technology or economic variables enhance their eco-nomic feasibility. Hence, reserves data are a major issue because they betray where the largestresources are, allowing us to be aware of the countries that must improve its mining methodsin order to extract in the best possible way.
The world official bullion reserves in 2009 were estimated by the USGS (2011b) at 30,700 t,while the estimated production in 2009 was 2,450 t. Kelly & Matos (2011) claim that the risingtrends in world production and consumer price are driven by the continuous growing demandof commodities needed to satisfy the consumption levels of the actual society. In this regard,Yellishetty et al. (2011) state that world production of gold has been increasing almost con-tinuously since 1950 because of economic conditions that have lead unit values fluctuations,mining growth/decline cycles and market volatility.
A survey performed by Valero & Valero (2010b) depicts that gold is one of the most depletedcommodities with a depletion degree of 75% with respect to 1900 reserve base values. Accord-ing to Shafiee & Topal (2010), the depletion time or proportion of mine production to reservesshows that, on average, world gold reserves will diminish in less than 40 years.
The production process of gold from auriferous ores begins with exploration and discover-ing a deposit. There are two kinds of mine configuration, open pit (the ore can be mined in fourgeneric steps: drilling, blasting, loading and hauling) and underground (in which in addition tothe operations mentioned before, a tunnel needs to be dug into the Earth). The kind of process-ing that follows the ore production process depends on the grade and type of ore, e.g. higherore grades are taken to a mill where the ore is converted to a fine slurry of powder. However,lower ore grades are taken to leach pads, in which an oxidization process is applied before be-ing sent to the leaching tank. Subsequently, three steps are followed: stripping, electro-winningand smelting. At this point the gold is in form of dorè bars with a 60% and 95% content of gold.The final step of gold mining is the refining process where the ore is converted into pure gold.Figure 2.5 shows the general route to produce gold and other precious metals, like silver andPGM’s.
30
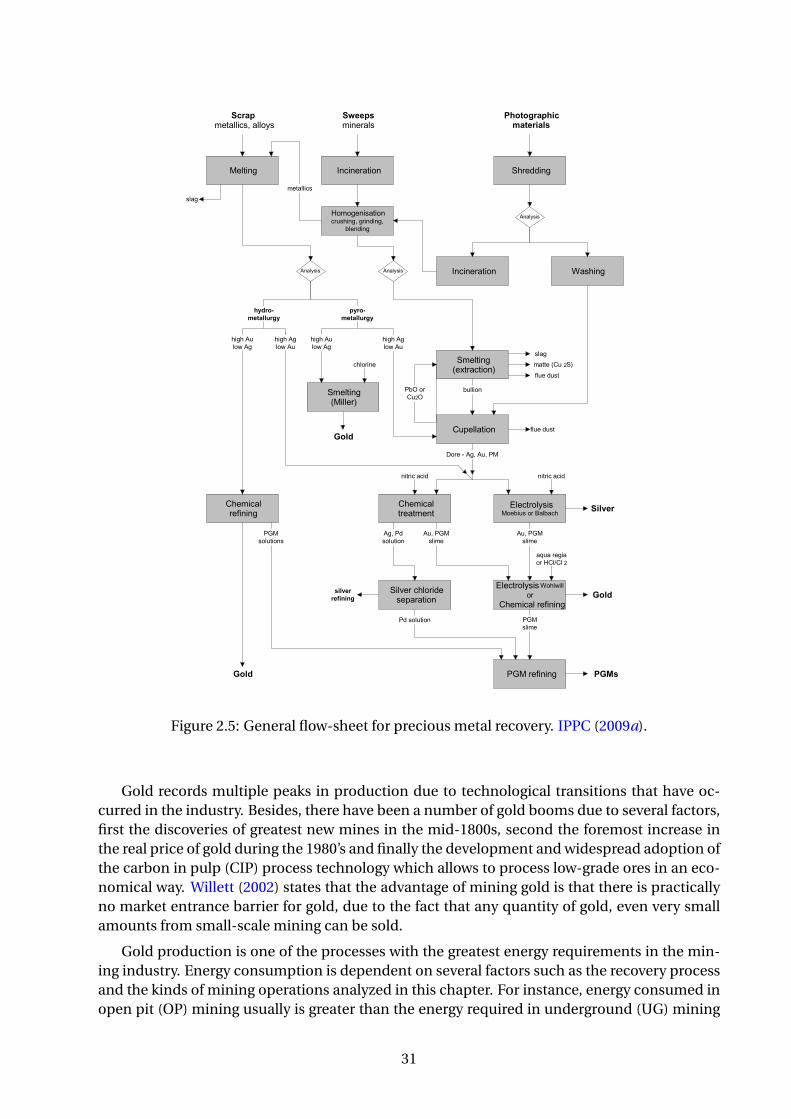
0='L#$&)S
OCS ?+")@$&&+-9)A$#',9)!"(-9#&.$9
*BA54:0 +:Q4:B<L548:
+:Q4:B<L548: YLE64:0
L28-FHB5LAA4QEC(LAA8=E
LG))F*H4:B<LAE
"3:+:@8-F3.2;-+)8.-/*
,6<B;;4:0
&:LA=E4EK8H80B:4EL548:Q<9E64:0C(0<4:;4:0C
RAB:;4:0
HB5LAA4QEEAL0
&:LA=E4E &:LA=E4E
,HBA54:02B]5<LQ548:>
)9IBAAL548:
R9AA48:
Z8<B(c(&0C(&9C(%*
!ABQ5<8A=E4E*8BR49E(8<(@LARLQ6
)6BH4QLA5<BL5HB:5
%R$(8<)9J$
EAL0HL55B(2)9 J,>7A9B(;9E5
7A9B(;9E5
,HBA54:02*4AAB<>
Q6A8<4:B
:45<4Q(LQ4;
L./,)8
!ABQ5<8A=E4EY86A34AA8<
)6BH4QLA(<B74:4:0B:/>
Ld9L(<B04L8<(K)A.)A J
%U*(<B74:4:0
%U*EA4HB
"B=*
:45<4Q(LQ4;
&9C(%U*EA4HB
&9C(%U*EA4HB
&0C(%;E8A9548:
,4ANB<(Q6A8<4;BEBIL<L548:
%;(E8A9548:
*./,)88)7.4.4@
B:/>
B)4)8-/!%/:G*3))+!7:8!L)2:4>-8J!"8)2.:6*!=)+-/*
)6BH4QLA<B74:4:0
3J>8:K;)+-//68@J
FJ8:K;)+-//68@J
6406(&9A83(&0
6406(&0A83(&9
%U*E8A9548:E
B:/>
6406(&9A83(&0
6406(&0A83(&9
@.%-&$)SID\)W$"$&',)4,+VJ9=$$#)4+&)L&$5.+-9)7$#',)&$5+/$&H
!"'&'%#$%13$,%1%)''+%/,%E&,*'$$%/"'$'%.1/'
$%&1E#+36%1)+%/"#$%#$%&'(3'*/'+%#)%/"'%#)/')/#,)13%,2'&*1E1*#/6% ,(% E&,+-*/#,)% #)% /"#$% $'*/,&D% % !"'% '7/')$#2'% $1.E3#)8% 1)+% 1)136$#$% 13$,% 133,G$% /"',E/#.-.%*",#*'%,(%E&,*'$$%*,.0#)1/#,)$%/,%0'%.1+'D9),+'%$3#.'$%(&,.%'3'*/&,36/#*%*,EE'&%&'(#)#)8%1&'%1%$#8)#(#*1)/%$,-&*'%,(%E&'*#,-$%.'/13$%1)+/"'6%1&'%/&'1/'+%/,%&'.,2'%1)+%&'*,2'&%/"'%E&'*#,-$%.'/13$%/,8'/"'&%G#/"%,/"'&%.'/13$%$-*"%1$$'3')#-.%1)+%/'33-&#-.D%%!"'%E&,*'$$%+'/1#3$%+'E')+%,)%/"'%E&,E,&/#,)%,(%.'/13$%/"1/%1&'%E&'$')/D
Figure 2.5: General flow-sheet for precious metal recovery. IPPC (2009a).
Gold records multiple peaks in production due to technological transitions that have oc-curred in the industry. Besides, there have been a number of gold booms due to several factors,first the discoveries of greatest new mines in the mid-1800s, second the foremost increase inthe real price of gold during the 1980’s and finally the development and widespread adoption ofthe carbon in pulp (CIP) process technology which allows to process low-grade ores in an eco-nomical way. Willett (2002) states that the advantage of mining gold is that there is practicallyno market entrance barrier for gold, due to the fact that any quantity of gold, even very smallamounts from small-scale mining can be sold.
Gold production is one of the processes with the greatest energy requirements in the min-ing industry. Energy consumption is dependent on several factors such as the recovery processand the kinds of mining operations analyzed in this chapter. For instance, energy consumed inopen pit (OP) mining usually is greater than the energy required in underground (UG) mining
31
because ore grades in open pit mines are smaller than those presented in underground mines.For open pit mines the average energy requirement is 170,000 GJ/t whilst for underground min-ing is 127,000 GJ/t of gold produced. The energy required to separate the gold from the mineincreases abruptly when the concentration of the ore in a deposit approaches zero.
The process extraction in open mining consist of three general steps: mining, processingand refining. First, the ore is mined through four processes drilling, blasting, loading and haul-ing, second the ore processing can be done through milling, oxidization and leaching, strip-ping, electro-winning and smelting, it will depend of the specific characteristics of the types ofore and the third step is the conversion into pure gold through a further processing.
Classen et al. (2007) perform a survey of global gold mining, then main results are described.The energy requirements will depend of the process used, e.g. data from 2000 to 2006 in PapuaNew Guinea indicates that the concentration energy requirement is 17,389.83 GJ/t for open pitmines using cyanide leach and carbon in pulp (CIP) or pressure oxidation processes, while forrefining is required 8.05 GJ/t by electrolysis. In Chile, information from 2002 shows that theconcentration process for an open pit mine consists of primary crushing, a pre-crushing cir-cuit, grinding, leaching, filtering and washing, also it has a dry tailings disposal system becauseof site-specific environmental conditions, the refining is realized by electrolysis, finally the re-quirements are 192,642.14 GJ/t and 86.8 GJ/t for both concentration and refining processes,respectively. Reports from 2002 to 2005, indicates that Yanacocha a gold mine in Peru, consid-ered one of the most important in the world has a energy consumption of 11,778.64 GJ/t forconcentration and 6.6 GJ/t for refining processes. During 2002 Canadian data of three mines ofwhich two are underground and produce only gold, report that the ore from the mine is recov-ered by gravity concentration, milling (primary and secondary crushing, rod/ball mill grinding),cyanidation techniques and carbon in pulp process followed by electrowinning and refining,the total amount of energy required is 81,264.71 GJ/t for the concentration process and 5.88GJ/t for refining. Gold production in USA includes open pit and underground mines, throughdifferent processes in average the energy consumptions for concentration and refining pro-cesses are 35,213.11 GJ/t and 5.88 GJ/t, respectively. An underground mine in South Africareported during 2006 the total requirements for both concentration and refining 42,293.71 GJ/tand 5.89 GJ/t, respectively, the methods used for mining are 50 % conventional (drilled, blastedand scraped or washed) and 50 % mechanized drift and fill trackless (drilled, blasted and loadedwith scoop trams to internal ore passes), the unrefined gold bullion bars containing between 60% and 95 % gold. Australia has open pit and underground mines, in 2005 they report an aver-age consumption of 22,013.94 GJ/t for the concentration process and 5.87 GJ/t for refining. Theopen pit mines from Tanzania reported a energy consumption of 5.87 GJ/t for refining processduring 2005. Mudd (2007b) assert that global trends in gold mining shows a total energy con-sumption of 143,000 GJ/t as average data between 1991 and 2006. In 1976 the U.S. Bureau ofMines reported that the amount of energy required to produce gold from all primary sourceswas about 62,247.95 GJ/t, as report on ITP (2002).
2.2.7 Iron
The most important use of iron ore is as the primary input to steel making. The end-usingsectors of steel are automobile and construction. The latter is of great importance in developingcountries, especially when they are industrialising. Iron is the 4th most common element in theouter earth crust. The economically most important iron minerals are hematite and magnetite.Most of the iron ore today is gained from open mines. The thickness of the recoverable ore
32

deposit usually is in the range of 100 meters. Iron ore is mined mainly in China, Brazil andin Australia. Nearly all iron ore is reduced to iron in blast furnaces, it is usually known as pigiron or “hot metal” if is liquid. In general, blast furnace burden contains lump ore, sinter andpellets, therefore the gross energy consumption include the energy used in the sinter, pelletand coke oven plant plus the energy required in blast furnace, oxygen furnace or electric arcfurnaces. Figure 2.6 displays a rough overview of the cradle to gate process of the cast iron andsteel production.
5. System Characterisation
Ecoinvent v2.0 report No. 10 - 7 -
5 System Characterisation 5.1 General overview A rough overview of the cradle to gate processes of the cast iron and steel production are given in Fig. 5.1.
Casting
Transport to steel work
Mining of iron ore
Transport to iron work
Sorting
Lump ore
Benefication
Pellets
Sinter
Pellet feed Sinter feed
Transport to iron work
Direct reduction
Blast furnace reduction
Other melt- reduction
Sponge iron Hot metal/Pig iron
Pig iron
Electric steel furnace
Basic oxygenfurnace
Transport to steel work
SteelCast iron
Iron scrap
Fig. 5.1 Overview of cast iron and steel production (The grey materials and processes are of minor relevance and not considered in the ecoinvent data)
5.2 Iron ore mining and beneficiation This part is mainly based on (Roth et al. (1999)) and (Meiler (1997)).
5.2.1 Production process and infrastructure Most of the iron ore today is gained from open mines. The thickness of the recoverable ore deposit usually is in the range of 100 meters. The cap of the deposit is removed as overburden and deposited nearby to be used for the recultivation when the mine has been depleted. The ore is won in stripes us-
Figure 2.6: Overview of cast iron and steel production Classen et al. (2007).
The process of concentrating iron ore from ore in the ground requires 1.11 GJ/t and therefining process has an average consumption of 24.67 GJ/t based on the fuel energy to operatea blast furnace, according to Boustead & Hancock (1979). Whilst, Botero (2000) reports the totalenergy requirements for the concentrating process as 1 GJ/t and a high energy use around 28GJ/t is required for the refining in the blast furnace, considering a concentration upper than 92%.Classen et al. (2007) state that the energy utilized in the overall mining process is 28.8 GJ/tincluding electricity and fuels utilized in the sinter, coke and pellet plants as well as in the blast
33
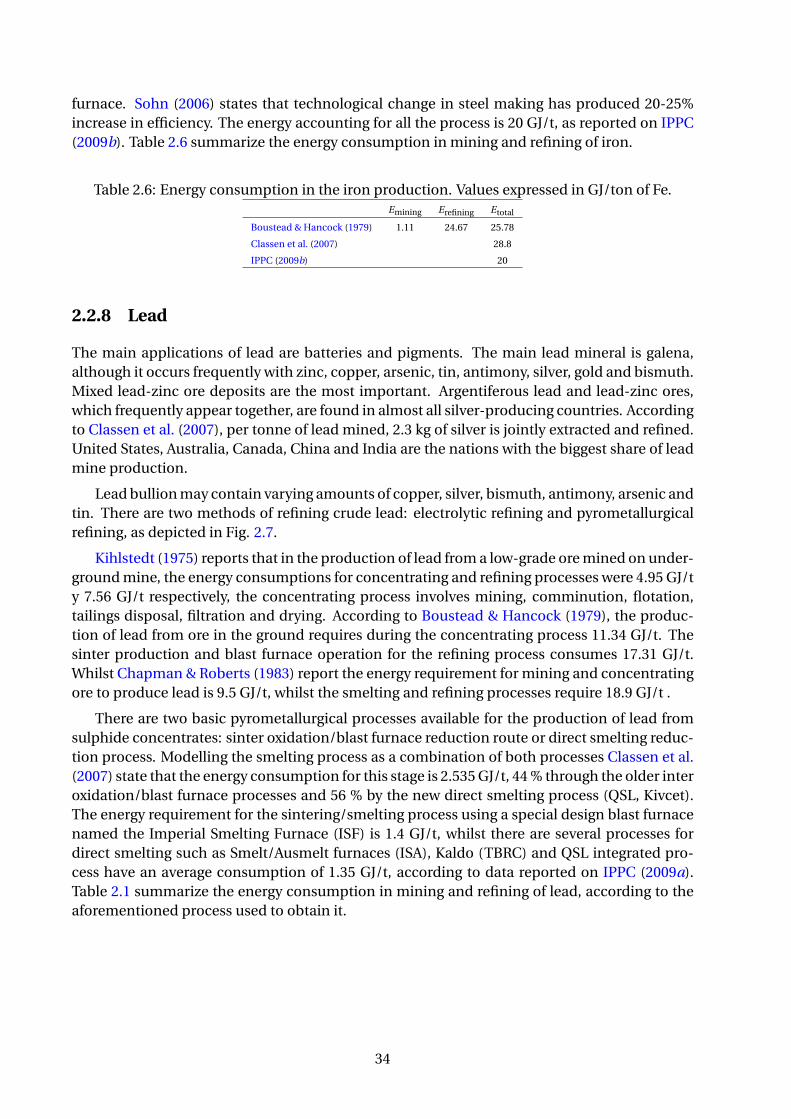
furnace. Sohn (2006) states that technological change in steel making has produced 20-25%increase in efficiency. The energy accounting for all the process is 20 GJ/t, as reported on IPPC(2009b). Table 2.6 summarize the energy consumption in mining and refining of iron.
Table 2.6: Energy consumption in the iron production. Values expressed in GJ/ton of Fe.Emining Erefining Etotal
Boustead & Hancock (1979) 1.11 24.67 25.78
Classen et al. (2007) 28.8
IPPC (2009b) 20
2.2.8 Lead
The main applications of lead are batteries and pigments. The main lead mineral is galena,although it occurs frequently with zinc, copper, arsenic, tin, antimony, silver, gold and bismuth.Mixed lead-zinc ore deposits are the most important. Argentiferous lead and lead-zinc ores,which frequently appear together, are found in almost all silver-producing countries. Accordingto Classen et al. (2007), per tonne of lead mined, 2.3 kg of silver is jointly extracted and refined.United States, Australia, Canada, China and India are the nations with the biggest share of leadmine production.
Lead bullion may contain varying amounts of copper, silver, bismuth, antimony, arsenic andtin. There are two methods of refining crude lead: electrolytic refining and pyrometallurgicalrefining, as depicted in Fig. 2.7.
Kihlstedt (1975) reports that in the production of lead from a low-grade ore mined on under-ground mine, the energy consumptions for concentrating and refining processes were 4.95 GJ/ty 7.56 GJ/t respectively, the concentrating process involves mining, comminution, flotation,tailings disposal, filtration and drying. According to Boustead & Hancock (1979), the produc-tion of lead from ore in the ground requires during the concentrating process 11.34 GJ/t. Thesinter production and blast furnace operation for the refining process consumes 17.31 GJ/t.Whilst Chapman & Roberts (1983) report the energy requirement for mining and concentratingore to produce lead is 9.5 GJ/t, whilst the smelting and refining processes require 18.9 GJ/t .
There are two basic pyrometallurgical processes available for the production of lead fromsulphide concentrates: sinter oxidation/blast furnace reduction route or direct smelting reduc-tion process. Modelling the smelting process as a combination of both processes Classen et al.(2007) state that the energy consumption for this stage is 2.535 GJ/t, 44 % through the older interoxidation/blast furnace processes and 56 % by the new direct smelting process (QSL, Kivcet).The energy requirement for the sintering/smelting process using a special design blast furnacenamed the Imperial Smelting Furnace (ISF) is 1.4 GJ/t, whilst there are several processes fordirect smelting such as Smelt/Ausmelt furnaces (ISA), Kaldo (TBRC) and QSL integrated pro-cess have an average consumption of 1.35 GJ/t, according to data reported on IPPC (2009a).Table 2.1 summarize the energy consumption in mining and refining of lead, according to theaforementioned process used to obtain it.
34

0='L#$&)T
?+")@$&&+-9)A$#',9)!"(-9#&.$9 KOK
$V#..#)8D% 9% 0#$.-/"53'1+% 133,6% #$% &'*,2'&'+% 1)+% -)+'&8,'$% (-&/"'&% &'(#)#)8% /,% E&,+-*'0#$.-/"D
aBL;(R9AA48:
A*+!-4>!I4>>8:**!H)++/)
L:7+)4.4@
,875B:B;ABL;
9)*./,)8.4@A
9)*./,)8.4@I
e-266;>)^.42.4@
9)0.*;6+3K.*.4@!H)++/)
#)7.4.4@H)++/)
#B74:B;(ABL;
Z<8EE278<(<BQ=QA4:0>
,9AI69<
&4<
h4:Q
)LAQ49HCHL0:BE49H
'L$K
#),)80)8-+:8J7684-2)
2@=cI<8;9Q55<BL5HB:5>
aBL;
)8IIB<(;<8EE
S9HBE(58RL0689EB
d-8>!/)->7684-2)&<EB:4QLA(.
L:54H8:4LA(E/4HE
,AL0(2<B59<:(58(Q6L<0B(I<BIL<L548:>
d:G-8>F8)**
aBL;
,4ANB<E/4HE
#)+:8+
h4:Q258(;BE4ANB<4:0>d:G-8>
F8)**
aBL;
,/4HE
)L9E54Q(;<8EE(3456(h:C(,RC(&E(Q8HI89:;E2<B59<:(58 Q6L<0B(I<BIL<L548:>
'6F)/
&4<
Z8<e
aBL;(8]4;B
#)7.4.4@H)++/)
'L$K
&:54H8:4LA26L<;>(ABL;
)8IIB<(<4Q6(HL55B(L:;EIB4EE(258 Q8IIB<(EHBA5B<>
#BE4;9LAi4:Q
(-@3:6*)
@4EH956(;<8EE78<(@4EH956(<BQ8NB<=
?.56-+.:4
Z<8EE
@.%-&$)TIK\)6.'%&'7)+4),$'()&$4."."%)L&+5$99$9Y#7)DCBN)6@!M)[")DRRRZ
!"'% E-&'% 3'1+% #$% *1$/% #)/,% 03,*V$% ,&% #)8,/$D% % U-.'H% +&,$$'$H% 3#/"1&8'$% 1)+% ,/"'&% &'$#+-'$% 1&'-$-1336% $.'3/'+% #)% 1% $.133% 031$/% (-&)1*'% ,&% 1% &,/1&6% (-&)1*'% /,%E&,+-*'% 3'1+% 0-33#,)%G"#*"% #$&'*6*3'+%/,%/"'%&'(#)#)8%*#&*-#/D
OEAEN!=)/+.4@!-4>!-//:J.4@!F8:2)**)*!7:8!/)->
S'3/#)8% 1)+% 133,6#)8% 1&'% -$-1336% *1&&#'+% ,-/% #)% #)+#&'*/36% "'1/'+% *&-*#03'% (-&)1*'$% ,&% V'//3'$-$#)8% '3'*/&#*#/6% ,&% ,#3% ,&% 81$D% % T'(#)'+% 3'1+% #$% .'3/'+% #)% 1% V'//3'% 1)+% 133,6#)8% '3'.')/$% 1&'1++'+D%%!'.E'&1/-&'%*,)/&,3%,(%/"'%.'3/%*1)%0'%#.E,&/1)/D%%N'1+%1)+%3'1+%133,6$%1&'%-$-1336%*1$/#)/,%E'&.1)')/%*1$/%#&,)%.,-3+$%{/.%[H%aSPR%R0%:AAX|D
K/1/#*% .,-3+$% 1)+% *,)2'6,&% *1$/#)8% .1*"#)'$% 1&'% -$'+% /,% E&,+-*'% 03,*V$H% $310$% 1)+% #)8,/$D?,)/#)-,-$%*1$/#)8%.1*"#)'$%1&'%-$'+%/,%E&,+-*'%&,+%(,&%&'+-*/#,)%/,%G#&'D%%U-.'%'7/&1*/#,)%#$-$'+%1/%/"'%31-)+'&$%1)+%/1EE#)8%E,#)/$D
Figure 2.7: Diagram of lead refining processes IPPC (2009a).
Table 2.7: Energy consumption in the lead production. Values expressed in GJ/ton of Pb.Emining Erefining Etotal
Kihlstedt (1975) 4.95 7.56 12.51
Boustead & Hancock (1979) 11.34 17.31 28.65
Chapman & Roberts (1983) 9.5 18.9 28.4
Classen et al. (2007) 2.535
IPPC (2009a) 1.4
2.2.9 Manganese
Manganese metal is hard and very brittle, and its primary uses in a metallic form are as alloy-ing, desulphurising, and deoxidising agent for steel, cast iron, and non-ferrous metals, steel isthe main form in which manganese is recycled. Whilst, manganese compounds are used inchemical industry and battery manufacture. Nowadays, about 17% of the magnesium supply is
35

produced by recycling of magnesium wastes. The main producing countries of manganese are:Australia, Brazil, China, Gabon and India.
Manganese ore are generally mined in open pits. After mining, the beneficiation step followswith operations such as crushing, gravity concentration, converting, calcining or reducing andsintering. Then, the production of pure manganese metal can be performed through two mainoptions, electrolysis of aqueous manganese salts (this process involves milling, reduction, cal-cination, leaching, filtration, precipitation and electrolysis) or electrothermal decomposition ofmanganese ores (this multistage process includes several smelted stages). Figure 2.8 depicts asummary of manganese products and their process routes.& [>&f1(&c&E))%"6$+"*#&*,&H$+('"$%& &
!
D.$0'J0E'23**"-4')8'*"#$"#%&%'R-)P3Q+&'"#P'+W%.-'R-)Q%&&'-)3+%&'ST%776%7),%P'%+'"70'SEUUMVV0'
!
!
D.$0'J0/'2.*R7.8.%P'P."$-"*'8)-'+W%'R-)P3Q+.)#')8'`%4'*"#$"#%&%'QW%*.Q"7&'Sa)#%&'SEUUJVV0'
!
!
ecoinvent v2.0 report No. 10& L&^&L&
Figure 2.8: Manganese products and their process routes Classen et al. (2007).
Chapman & Roberts (1983) report that the energy requirement for mining and concentrat-ing ore to produce manganese is 1.83 GJ/t, whilst the smelting and refining processes requiresaround 116.93 GJ/t using either electric arc or blast furnace. Whilst, Boustead & Hancock (1979)report the energy for electrowining of manganese from leach liquor as 148.67 GJ/t. Accordingto Botero (2000), the energy consumptions for concentrating and refining processes are 15.5GJ/t and 41.4 GJ/t, respectively . Whilst, Classen et al. (2007) report the energy requirement forthe production of manganese during the concentration process as 16.5 GJ/t, whilst the refin-ing process consumes 23.22 GJ/t. Table 2.8 summarize the energy consumption in mining andrefining of manganese.
Table 2.8: Energy consumption in the manganese production. Values expressed in GJ/ton ofMn.
Emining Erefining Etotal
Boustead & Hancock (1979) 148.67
Chapman & Roberts (1983) 1.83 116.93 118.76
Classen et al. (2007) 16.5 23.22 39.72
36
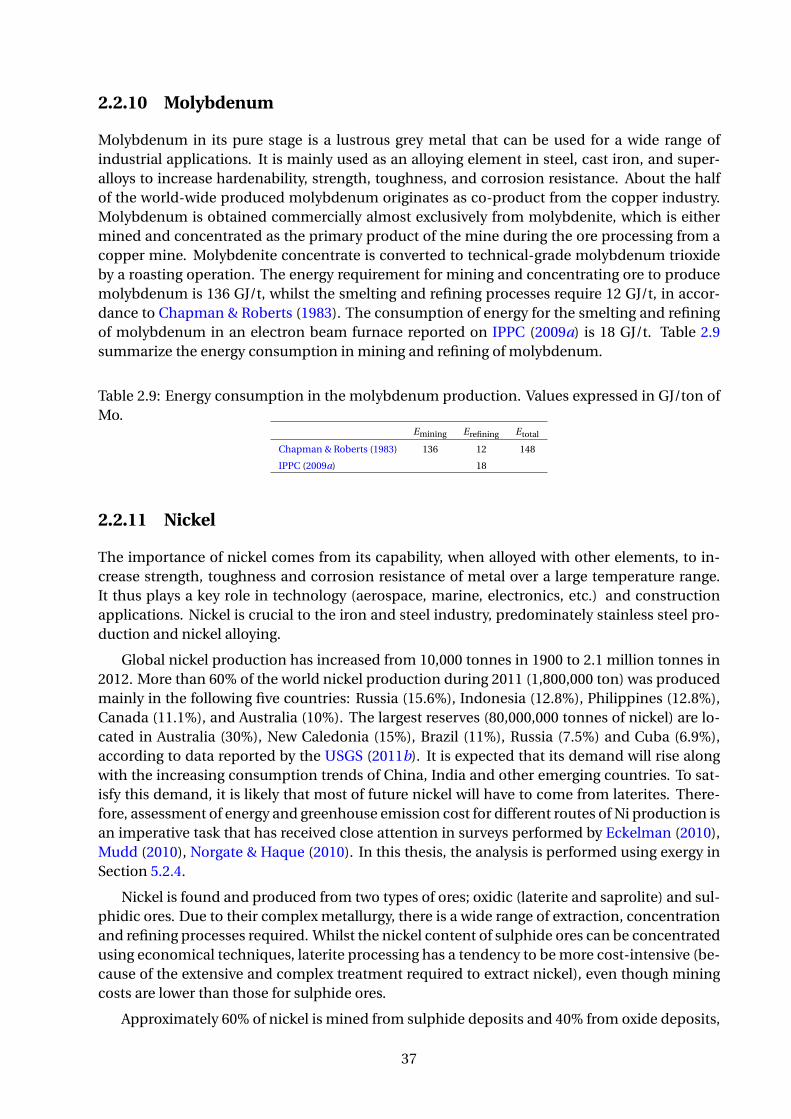
2.2.10 Molybdenum
Molybdenum in its pure stage is a lustrous grey metal that can be used for a wide range ofindustrial applications. It is mainly used as an alloying element in steel, cast iron, and super-alloys to increase hardenability, strength, toughness, and corrosion resistance. About the halfof the world-wide produced molybdenum originates as co-product from the copper industry.Molybdenum is obtained commercially almost exclusively from molybdenite, which is eithermined and concentrated as the primary product of the mine during the ore processing from acopper mine. Molybdenite concentrate is converted to technical-grade molybdenum trioxideby a roasting operation. The energy requirement for mining and concentrating ore to producemolybdenum is 136 GJ/t, whilst the smelting and refining processes require 12 GJ/t, in accor-dance to Chapman & Roberts (1983). The consumption of energy for the smelting and refiningof molybdenum in an electron beam furnace reported on IPPC (2009a) is 18 GJ/t. Table 2.9summarize the energy consumption in mining and refining of molybdenum.
Table 2.9: Energy consumption in the molybdenum production. Values expressed in GJ/ton ofMo.
Emining Erefining Etotal
Chapman & Roberts (1983) 136 12 148
IPPC (2009a) 18
2.2.11 Nickel
The importance of nickel comes from its capability, when alloyed with other elements, to in-crease strength, toughness and corrosion resistance of metal over a large temperature range.It thus plays a key role in technology (aerospace, marine, electronics, etc.) and constructionapplications. Nickel is crucial to the iron and steel industry, predominately stainless steel pro-duction and nickel alloying.
Global nickel production has increased from 10,000 tonnes in 1900 to 2.1 million tonnes in2012. More than 60% of the world nickel production during 2011 (1,800,000 ton) was producedmainly in the following five countries: Russia (15.6%), Indonesia (12.8%), Philippines (12.8%),Canada (11.1%), and Australia (10%). The largest reserves (80,000,000 tonnes of nickel) are lo-cated in Australia (30%), New Caledonia (15%), Brazil (11%), Russia (7.5%) and Cuba (6.9%),according to data reported by the USGS (2011b). It is expected that its demand will rise alongwith the increasing consumption trends of China, India and other emerging countries. To sat-isfy this demand, it is likely that most of future nickel will have to come from laterites. There-fore, assessment of energy and greenhouse emission cost for different routes of Ni production isan imperative task that has received close attention in surveys performed by Eckelman (2010),Mudd (2010), Norgate & Haque (2010). In this thesis, the analysis is performed using exergy inSection 5.2.4.
Nickel is found and produced from two types of ores; oxidic (laterite and saprolite) and sul-phidic ores. Due to their complex metallurgy, there is a wide range of extraction, concentrationand refining processes required. Whilst the nickel content of sulphide ores can be concentratedusing economical techniques, laterite processing has a tendency to be more cost-intensive (be-cause of the extensive and complex treatment required to extract nickel), even though miningcosts are lower than those for sulphide ores.
Approximately 60% of nickel is mined from sulphide deposits and 40% from oxide deposits,
37

although paradoxically approximately 60% of nickel resources are found in laterites and the re-maining 40% is contained in sulphides, according to USGS (2011b). The reason behind thisrelates to the complexity of processing nickel laterites compared to sulphides with the refin-ing of the former implying a substantial amount of energy. Besides, the continuous decline insulphide ore grades along with the increasing cost of underground mining, will mean that fu-ture supply of nickel will come from oxide ores, which are relatively uniform in grade and canbe surface mined. Then, nickel derived from laterites will need to increase significantly in thefuture in order to satisfy the growing demand. During nickel production from sulphides, thereare important by-products obtained such as: copper, cobalt, gold, iron and PGM (PlatinumGroup Metals). Cobalt, chromium and iron are the main by-products meanwhile, associatedwith nickel production from laterites.
In recent years, the idea of using new leaching technologies instead of pyrometallurgicalroutes has been raised. Nevertheless, Mäkinen & Taskinen (2008) state that almost 90% of theworld’s nickel production capacity is still based on pyrometallurgical processes.
According to Eckelman (2010), the smelting and refining steps consume most of the pri-mary energy, whilst mining and concentrating account for only 7-35%, depending exactly onthe nickel product as well as the source. Notwithstanding, the energy required for nickel oremining, milling and beneficiation will continue to increase as average ore grades decrease andmore materials need to be processed in order to acquire the same amount of metal.
Table 2.10 shows the energy consumption associated with the mining and refining processesof nickel production from laterites and sulphides according to different studies.
Table 2.10: Energy consumption in the nickel production. Values expressed in GJ/ton of Ni.Sulphides Laterites
Emining Erefining Etotal Emining Erefining Etotal
Boustead & Hancock (1979) 232.23 696.71
Chapman & Roberts (1983) 67 150 217 6.3 570 576.3
Classen et al. (2007) 20.19 84.88 105.07
Norgate et al. (2007) 114 228 388
IPPC (2009a) 18.5 45
Mudd (2010) 39.46 100.2 139.66 572
The lower energy values presented by the European Commission, in its document Inte-grated Pollution Prevention and Control – IPPC (2009a), derive from the fact that nickel pro-duction comes from sulphide ores containing 4 to 15% nickel, which is a relatively high oregrade compared with those of the other references published in Table 2.10. Furthermore, en-ergy values from an international database such as those presented in Classen et al. (2007) arebased on diverse sources and are not only from one particular mine or country, hence the range.
2.2.12 Nickel laterites
Laterite ores are generally found with iron oxide or silica compounds and are difficult to up-grade it to a concentrate. Laterite ore concentrations are rarely high, typically having a maxi-mum nickel content of 3% was reported on IPPC (2009a). The general route of producing nickelfrom laterite ores consists of five linked operations: ore mining, drying, roasting, melting andrefining, as shown in Fig. 2.9.
38
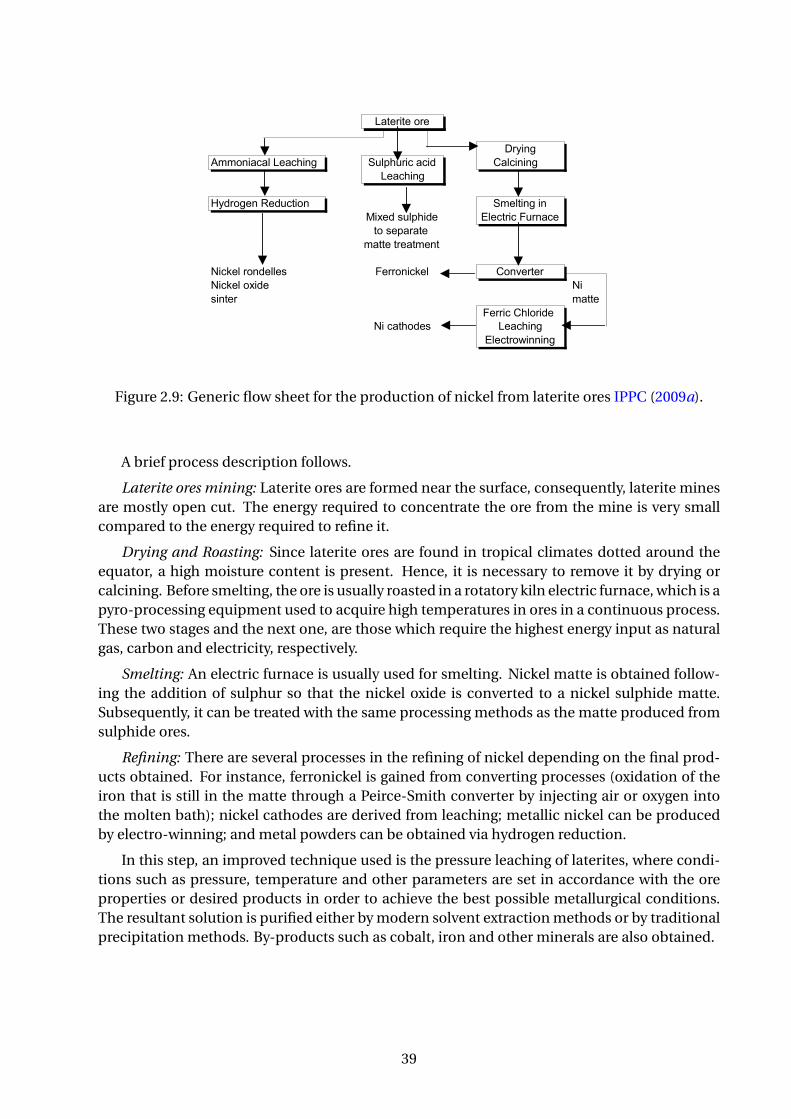
0='L#$&)DD
SBC ?+")@$&&+-9)A$#',9)!"(-9#&.$9
aL5B<45B(8<B
Z<=4:0&HH8:4LQLA(aBLQ64:0 ,9AI69<4Q(LQ4; )LAQ4:4:0
aBLQ64:0
K=;<80B:(#B;9Q548: ,HBA54:0(4:*4]B;(E9AI64;B !ABQ5<4Q(S9<:LQB58(EBIL<L5B
HL55B(5<BL5HB:5
'4Q/BA(<8:;BAABE SB<<8:4Q/BA )8:NB<5B<'4Q/BA(8]4;B (('4E4:5B< ((HL55B
SB<<4Q()6A8<4;B'4(QL568;BE aBLQ64:0
!ABQ5<834::4:0
@.%-&$)DDID\)W$"$&.5)4,+V)9=$$#)4+&)".5P$,)L&+(-5#.+")4&+7)a'#$&.#$)+&$9
K1E&,3#/'% ,&'$% *1)% 0'% $.'3/'+% G#/"% $-3E"-&% $,% /"1/% /"'% )#*V'3% ,7#+'% #$% *,)2'&/'+% /,% 1% )#*V'3$-3E"#+'%.1//'%1)+%#&,)%#$%&'.,2'+%1$%1%$318%{/.%:IAH%YWCR%:AAX|D%%!"'%.1//'%#$%/&'1/'+%#)%/"'$1.'%.1))'&%1$%.1//'%E&,+-*'+%(&,.%$-3E"#+'%,&'$D
K.'3/#)8%/,%('&&,)#*V'3%1**,-)/$%(,&%1%31&8'%E&,E,&/#,)%,(%)#*V'3%E&,+-*/#,)%(&,.%31/'&#/'%,&'$H/"'$'%E&,*'$$'$%1&'%+#$*-$$'+%-)+'&%('&&,5133,6$D%%N'1*"#)8%,(%31/'&#/'%G#/"%1..,)#1%#$%13$,%-$'+/,%'7/&1*/%)#*V'3%{/.%=IH%aSPR%W#%:AAX_%/.%]hH%Z-/,V-.E-%:AAh_%/.%A;H%Z-/,V-.E-%:AAe|%1)+/"#$%E&,*'$$%#$%0'*,.#)8%.,&'%#.E,&/1)/D%%93/",-8"%*,)2'&$#,)%,(%)#*V'3%,7#+'%/,%#.E-&'%)#*V'31)+%/"')%/,%)#*V'3%*1&0,)63H%G"#*"%#$%2,31/#3'H%#$%-$'+%/,%E&,+-*'%&'(#)'+%)#*V'3H%/"'%)#*V'3%,7#+'#$%E&,+-*'+%(&,.%/"'%$.'3/#)8%,(%1%$-3E"#+#*%,&'D%%!"'%31/'&#/'%,&'$%8')'&1336%"12'%1%.17#.-.)#*V'3%*,)/')/%,(%Xg%1)+%1&'%/"'&'(,&'%),/%-$'+%+#&'*/36%#)%/"#$%E&,*'$$D
!"'%E&'$$-&'%3'1*"#)8%,(%31/'&#/'$%G#/"%$-3E"-&#*%1*#+%#$%E&#)*#E1336%1%$#.E3'%1)+%$/&1#8"/(,&G1&+E&,*'$$D%%!"'%/'.E'&1/-&'H%E&'$$-&'%1)+%,/"'&%E1&1.'/'&$%.16%21&6%(&,.%*1$'%/,%*1$'%/,%1*"#'2'/"'%0'$/%E,$$#03'%.'/133-&8#*13% *,)+#/#,)$% +'E')+#)8% ,)% /"'%,&'% 1)+% E&,+-*/$% #)% 4-'$/#,)% 1)+,/"'&%,0F'*/#2'$D%!"'%/'.E'&1/-&'%,(%/"'%3'1*"#)8%1-/,*312'$%#$%-$-1336%0'/G'')%=XI%1)+%=;Ik%?1)+%E&'$$-&'$%-E%/,%[X%01&%1&'%-$'+D%%Z768')%*1)%13$,%0'%-$'+%#)%/"'%E&,*'$$D
!"'%&'$-3/1)/%$,3-/#,)%#$%E-&#(#'+%'#/"'&%06%.,+'&)%$,32')/%'7/&1*/#,)%.'/",+$%,&%06%/&1+#/#,)13E&'*#E#/1/#,)%.'/",+$D%%U,&%'71.E3'%"6+&,8')%$-3E"#+'%#$%-$'+%/,%$'3'*/#2'36%E&'*#E#/1/'%)#*V'31)+%*,013/%$-3E"#+'$%G"#*"%1&'%$')/%(,&%(-&/"'&%.'/13%&'*,2'&6D%%!"'%$,3-/#,)%*1)%0'%)'-/&13#$'+$,%/"1/%#&,)%E&'*#E#/1/'$D%%W#*V'3%1)+%*,013/%G#33%0'%E&'*#E#/1/'+%1)+%&'5%3'1*"'+%G#/"%1..,)#1D
K,32')/%'7/&1*/#,)%#$%-$'+%/,%$'E1&1/'%)#*V'3%1)+%*,013/%*"3,&#+'$%,&%$-3E"1/'$D%%S'/133#*%)#*V'3*1)% 0'% E&,+-*'+% 06% '3'*/&,5G#))#)8% 1)+% *,013/% *1)% 0'% E&'*#E#/1/'+% 1$% *,013/% $-3E"#+'D93/'&)1/#2'36%)#*V'3%1)+%*,013/%*1)%0'%&'*,2'&'+%1$%.'/13%E,G+'&$%-$#)8%"6+&,8')%&'+-*/#,)D
AAEAEI!L6/F3.>.2!:8)*
W#*V'350'1&#)8%$-3E"#+'%,&'$%*1)%0'%*,)*')/&1/'+%'D8D%06%(3,/1/#,)%/,%-E8&1+'%/"'%)#*V'3%*,)/')/DW#*V'3% *,)*')/&1/'$H% 8')'&1336% *,)/1#)#)8% h% 5% =]g% W#H% 1&'% E&,+-*'+% G"#*"% .1V'$% (-&/"'&E&,*'$$#)8% '1$#'&D% %!"'% )#*V'3% *,)*')/&1/'$% 1&'% -$-1336% $.'3/'+% -)+'&% ,7#+#$#)8% *,)+#/#,)$% /,,7#+#$'%/"'%#&,)%$-3E"#+'$H%G"#*"%G#/"%,/"'&%81)8-'%.1/'
$%(,&.$%1)%#&,)%$#3#*1/'%$318D% %!"'
Figure 2.9: Generic flow sheet for the production of nickel from laterite ores IPPC (2009a).
A brief process description follows.
Laterite ores mining: Laterite ores are formed near the surface, consequently, laterite minesare mostly open cut. The energy required to concentrate the ore from the mine is very smallcompared to the energy required to refine it.
Drying and Roasting: Since laterite ores are found in tropical climates dotted around theequator, a high moisture content is present. Hence, it is necessary to remove it by drying orcalcining. Before smelting, the ore is usually roasted in a rotatory kiln electric furnace, which is apyro-processing equipment used to acquire high temperatures in ores in a continuous process.These two stages and the next one, are those which require the highest energy input as naturalgas, carbon and electricity, respectively.
Smelting: An electric furnace is usually used for smelting. Nickel matte is obtained follow-ing the addition of sulphur so that the nickel oxide is converted to a nickel sulphide matte.Subsequently, it can be treated with the same processing methods as the matte produced fromsulphide ores.
Refining: There are several processes in the refining of nickel depending on the final prod-ucts obtained. For instance, ferronickel is gained from converting processes (oxidation of theiron that is still in the matte through a Peirce-Smith converter by injecting air or oxygen intothe molten bath); nickel cathodes are derived from leaching; metallic nickel can be producedby electro-winning; and metal powders can be obtained via hydrogen reduction.
In this step, an improved technique used is the pressure leaching of laterites, where condi-tions such as pressure, temperature and other parameters are set in accordance with the oreproperties or desired products in order to achieve the best possible metallurgical conditions.The resultant solution is purified either by modern solvent extraction methods or by traditionalprecipitation methods. By-products such as cobalt, iron and other minerals are also obtained.
39

2.2.13 Nickel sulphides
Sulphide ores are typically derived from volcanic or hydrothermal processes with a typical nickelcontent ranging from 0.4 to 2%, according to Classen et al. (2007). Nickel production fromsulphide ores involves either underground (95%) or open cut mining (5%). The processes toproduce nickel from sulphide ores include several steps: ore mining, beneficiation, drying,roasting, smelting, converting, sulphuric acid, leaching, reduction, electrolysis, purification ofleachate and carbonyl. Figure 2.10 gives an overview of the process options.
0='L#$&)DD
?+")@$&&+-9)A$#',9)!"(-9#&.$9 SBD
Z-/-V-.E-% (31$"% (-&)1*'% #$% -$'+% #)% C-&,E'_% /"'% Z-/-V-.E-% 1)+% PW?Z% U31$"% U-&)1*'$% 1)+'3'*/&#*%,&%$"1(/%(-&)1*'$%1&'%-$'+%'3$'G"'&'%#)%/"'%^,&3+D
!"'%)#*V'3%#$%&'*,2'&'+%#)/,%1%$-3E"#+'%.1//'%*,)/1#)#)8%X]%5%hIg%W#H%?,%1)+%?-D% %!"'%.1//'*1)%0'%/&'1/'+%#)%1%R#'&*'%K.#/"%?,)2'&/'&%,&%13/'&)1/#2'36%#/%*1)%0'%8&1)-31/'+%,&%*,,3'+%$3,G360'(,&'%1%"6+&,.'/133-&8#*13%&'*,2'&6%$/18'%{/.%:[=H%U#)31)+%W:%:AAA|D%%!"'%*,)2'&/'&%$/18'%#$),/%-$'+%#)%C-&,E'%1/%/"'%/#.'%,(%G&#/#)8D
P.E,&/1)/% *,.E,)')/$%,(% /"'%)#*V'3%.1//'$%1&'% *,013/H% *,EE'&% 1)+% E&'*#,-$%.'/13$D% %!"'% $318E&,+-*'+%+-&#)8%$.'3/#)8%13$,%*,)/1#)$%&'*,2'&103'%.'/13%1)+%#$%/&'1/'+%#)%1)%'3'*/&#*%(-&)1*'%/,E&,+-*'%.,&'%)#*V'3%.1//'D% %!"#$%*1)%0'%8&1)-31/'+% 1)+% /&'1/'+%$'E1&1/'36% {/.%A[H%W#%C7E'&/Q&,-E%:AAe_% /.%A;H%Z-/,V-.E-%:AAe|D% %K'*,)+1&6%.1/'
$% 1&'% $,.'/#.'$% &'*,2'&'+% #)% /"''3'*/&#*%(-&)1*'D
!"'%(,33,G#)8%(#8-&'%8#2'$%1)%,2'&2#'G%,(%/"'%E&,*'$$%,E/#,)$D
,9AI64;B(Q8:QB:5<L5B
#8LE54:0
!ABQ5<4Q(,HBA54:0 SALE6(,HBA54:0 SALE6(,HBA54:0 &HH8:4LQLA(aBLQ64:0
)8:NB<54:0 )8:NB<54:0 K=;<80B:(#B;9Q548:
'4Q/BA(I83;B<.R<4d9B55BE
!ABQ5<8A=54Q(#B74:4:0 )L<R8:=A(<B74:4:0 )6A8<4;B(aBLQ64:0 ,9AI6L5B(aBLQ64:0I<8QBEE !ABQ5<834::4:0 !ABQ5<834::4:0.
K=;<80B:(#B;9Q548:
'4(QL568;B '4(IBAAB5E.I83;B< '4Q/BA(QL568;B'4(QL568;BE.(I83;B<.(R<4d9B55BE
@.%-&$)DDIB\)W$"$&.5)4,+V)9=$$#)4+&)#=$)L&+(-5#.+")+4)".5P$,)4&+7)9-,L=.($)5+"5$"#&'#$9
AAEAEIEA!':4,)4+.:4-/!7/-*3!*;)/+.4@!F8:2)**
?,)2')/#,)13% $.'3/#)8% E&,*'$$'$% 1&'% -$'+% /,% &'.,2'% #&,)% 1)+% ,/"'&% 81)8-'% .1/'
$% (&,.$-3E"#+'%*,)*')/&1/'$%/,%E&,+-*'%)#*V'3%.1//'D%%P)%C-&,E'%,)36%/"'%Z-/,V-.E-%U31$"%K.'3/#)8(-&)1*'%#$%-$'+D
^,&3+G#+'% /"'&'% 1&'% (#2'% ,/"'&% $.'3/'&$H% G"#*"% -$'% /"#$% E&,*'$$D% % !G,% ,(% /"'$'% -$'% 1% (31$"$.'3/#)8% (-&)1*'% +'$#8)'+% 06% ^'$/'&)% S#)#)8% ?,&E,&1/#,)H% G"'&'% /"'% $.'3/#)8% 1)+% $318*3'1)#)8%(-&)1*'$%"12'%0'')%0-#3/%/,8'/"'&%/,%(,&.%,)'%31&8'&%-)#/D
!"'&'% 1&'% +#(('&')*'$% #)% ,E'&1/#,)$% 0'/G'')% /"'% $.'3/'&$D% %!"'%.,$/% 2#$#03'% +#(('&')*'% #$% /"'.1//'%8&1+'%0-/%21/#,)$% #)% /"'%&1G%.1/'
%*,.E,$#/#,)%13$,%*1-$'%$,.'%+#(('&')*'$D% %!"'8')'&#*%(3,G%$"''/%#$%$",G)%0'3,GD
Figure 2.10: Generic flow sheet for the production of nickel from sulphide concentrates IPPC(2009a).
There are assorted processes used to produce nickel and the differences depend on factorssuch as the grade or the concentrate and the presence of other metals in the material mined.The options for nickel production from sulphide concentrates are classified in Table 2.11. Ashort description of each process involved in sulphide mining and refining is presented next.
Table 2.11: Processes for nickel production from sulphide ores.Option Processes
A Mining and beneficiation, drying and roasting, smelting, converting and electrolysis.
B Mining and beneficiation, drying and roasting, smelting, converting and carbonyl.
C Mining and beneficiation, drying and roasting, smelting, converting and leaching.
D Mining and beneficiation, smelting, converting and carbonyl.
E Mining and beneficiation, smelting, converting and electrolysis.
F Mining and beneficiation, smelting, converting and leaching.
G Mining and beneficiation, smelting, converting, leaching and hydrogen reduction.
H Mining and beneficiation, smelting and leaching.
I Mining and beneficiation, smelting and electrolysis.
J Mining and beneficiation, leaching and hydrogen reduction.
Sulphide ores mining and beneficiation: Sulphide ores are normally found hundreds of me-tres below the surface, therefore, they require an underground mining infrastructure. However,the major advantage of sulphide ores is that they can be concentrated easily by flotation, a
40

method which upgrades the Ni content to some 7-25 %. In this process, the ore is mixed withspecial reagents and agitated by mechanical and pneumatic means.
Drying and Roasting: This step is needed to carry out the smelting process which requiresdry sulphide ore containing less than 1% moisture. Smelting processes require a roasting step toreduce sulphur content and volatiles. According to Norgate & Haque (2010), an opportunity toimprove this step is the use of the emerging bath smelting technology for ferronickel productioninstead of the rotatory kiln/electric furnace process.
Smelting: The smelting process is often achieved in a conventional flash smelting furnaceor in an Outokumpu flash furnace (DON process), which is characterized by its low energy con-sumption. In the DON process, high grade nickel matte of low iron content is produced in theflash smelting furnace directly without subsequent converting.
Converting: Nickel is recovered into a sulphide matte containing 35-70% Ni, Co, Cu andprecious metals. The matte still contains iron and sulphur that are oxidized in a Pierce-Smithconverter to sulphur dioxide and iron oxide by injecting air or oxygen into the molten bath.
Refining: The mattes produced by the smelting process must go through a multi-stage pro-cess in order to: recover and refine the metal content, reject iron and ultimately recover copper,cobalt and precious metals. Matte can be treated by pyrometallurgical methods but hydromet-allurgical processes are more widely used.
Leaching: Matte can be leached under different processes as a function of the substanceused. For instance, nickel leach with chloride solution using chlorine gas, as an oxidant, allowsthe acquisition of copper, cobalt, lead and manganese as co-products. Another option is atmo-spheric leaching in a sulphate base whereby copper and cobalt are obtained as by-products.
A further process is ammonia pressure leaching which uses air as an oxidant; this processis followed by hydrogen reduction to produce metallic nickel powder and eventually copperand cobalt. Ferric chloride leaching is an additional method where nickel is electro-won. Thisprocess has by-products like iron, cobalt, chrome, aluminum and lead.
Lately, a new technology for Ni production is being used, namely that of heap leaching in-cluding biological activation. Although it is mainly applied in laterites, recent projects havebeen developed for sulphide ores. Mudd (2010) claims that heap leaching has an appreciablylow capital cost but still there is dubiety regarding ore chemistry and leaching dynamics.
Reduction: Hydrogen pressure reduction produces metallic nickel powder and briquettes.
Electrolysis: Nickel is placed onto pure nickel cathodes from sulphate or chloride solutionsin electrolytic cells.
Carbonyl: Nickel carbonyl is formed by the reaction of metal with carbon monoxide at lowtemperature and pressure.
2.2.14 Rare Earth Elements
Rare earth elements are integrated by a group of seventeen chemically similar elements; lan-thanide, yttrium and scandium series. There is a classification for light, medium and heavyelements, as shown in Table 2.12. This classification is important in order to determine thesuitable separation process.
41

Table 2.12: Rare Earth Elements Classification. Koltun & Tharumarajah (2008)Type Element Symbol
Light Lanthanum La
Cerium Ce
Praseodymium Pr
Neodymium Nd
Promethium Pm
Medium Samarium Sm
Europium Eu
Gadolinium Gd
Heavy Terbium Tb
Dysprosium Dy
Holmium Ho
Erbium Er
Thulium Tm
Ytterbium Y
Lutetium Lu
Yttrium Y
Scandium Sc
Rare earth resources are inequable distributed in the world. Minerals such as bastnasiteand monazite, have been recovered for commercial production. Bastnasite deposits are foundin China and United States, whilst monazite deposits are in Australia, Brazil, China, India, etc.,hence China produce more than 90 % of REE. China is applying export restrictions. Massari &Ruberti (2013) declare that this fact has greatly increased the REEs prices, causing tension anduncertainty among the world hi-tech markets. Then, new mine projects are underway in othercountries.
Rare earths can be used like a mixture or with various levels of purity, depending on thetechnical application (phosphors, high refractive glass, lasers, permanent magnets, capacitors,memory systems, magneto-optical recording, oxygen sensors, temperature resistant mater, hightemperature superconductivity, decolourising, polishing, deoxidising, pyrophoric properties,alloys, oil refining and catalytic converters). As new products and new applications are devised,the demand will increase and it is possible the exhaustion of the resources in near future.
On the other hand, recovery processes have been developed but none of them is currentlycommercially viable. In regards to substitution, the ad-hoc Working Group (2010) asserts that alot of applications for rare earth are available but the problem lies on loss of performance.
The mineral monazite is a source of mostly light RE elements and contains considerableamount of radioactive elements (thorium and uranium ) and phosphorus. Koltun & Tharu-marajah (2008) state that overall production processes of REE can be separated into three stages,as depicted in Fig. 2.11 and described briefly below.
42

USP2007/35 8
representative system of production in Bayan Obo, China, up to the point of REO extraction. The final stage of reduction of each REO to their corresponding REE is assumed to occur at elsewhere (such as at the purchasers’ site), though no assumption is made as to their location and hence transport is not considered.
Figure 2: The “cradle-to-gate” LCA boundary for the production of separated mix of REO in China
The overall production of REEs can be divided into three separate stages, as described briefly below:
1. Mining and beneficiation: The first stage of the overall process is mining. In general, rare earth minerals are mined as by-products from mining of other ore types, such as iron ore. After the ore is removed from the mine it undergoes beneficiation to remove the unwanted materials and concentrate the rare earth bearing minerals. Beneficiation separates bastnasite and monazite mainly using gravity separation, magnetic separation and flotation.
2. Separation of REOs: A cracking process is used for separating RE oxides contained in the ore concentrates of bastnasite and monazite. This is done by digestion in acids and bases,
Figure 2.11: The “cradle to gate” LCA boundary for the production of separated mix of REOKoltun & Tharumarajah (2008).
Mining and beneficiation: rare earth minerals are mined as by-products from mining ofother ore types, such as iron ore. Bastnasite and monazite are two of the major sources of rareearth elements. The ore is mined in open-pit mines where ore is processed to extract ore upto the point of delivery of ore concentrates. Beneficiation separates bastnasite and monazitegenerally using gravity separation, magnetic separation and flotation.
Separation of REOs: rare earth oxides contained in the ore concentrates of bastnasite andmonazite are separated through a cracking process. This stage involves a progressive separationof light, medium and heavy REOs. The main processes for extraction and separation of REOfrom bastnasite are precipitation, solvent extraction (S/X) and ion exchange.
The hydrometallurgical route to separates REO from bastnasite includes: 1) pre-leaching; 2)calcination; 3) caustic conversion and drying/oxidation; 4) hydrochloric acid leaching and re-moval impurities; 5) separation of light REO form medium and heavy REO (Nd/Sm separation);and 6) separation of medium REO from heavy REO by solvent extraction and precipitation andfurther S/X for individual REO. The hydrometallurgical process used in extracting RE oxidesfrom monazite involves: 1) autoclave leaching; 2) radioactive elements removal; 3) cerium ex-traction; 4) light RE extraction from medium and heavy REO; 5) stripping for further separationof medium REO from heavy REO; 6) precipitation and re-extraction for precise separation oflight, medium and heavy REO.
43

Reduction of REEs: rare earth elements are separated from their respective grouped REOs.A solvent extraction process is used for recovery of individual RE oxides from light (La, Pr, Nd),medium (Sm, Eu, Gd) and heavy REE mixture.
The reduction of the rare earth elements has been carried out by fused salt electrolysis forlight REE (La-Nd), whilst medium and heavy REE are produced by metallothermic reduction.Table 2.13 depicts the consumption of electricity (considering an efficiency of 40%) and heatfor six rare earth elements, accounted by Koltun & Tharumarajah (2008).
Table 2.13: Energy consumption for production of 1 kg of rare earth metals. Data modified fromKoltun & Tharumarajah (2008).
REE Energy consumption (MJ/kg REE)
Oxide production Metal production
Lanthanum 296.75 53.45
Cerium 523.05 56.1
Praseodymium 296.275 55
Neodymium 591.7 53
Gadolinium 3607.25 43.05
Yttrium 1198.25 47.6
2.2.15 Silver
Silver is used, today, primarily for its chemical and electronic properties. Silver is a relativelyrare metal. According to Ayres & Ayres (1996), it constitutes about 0.2 parts per million, byweight, of the earth’s crust. Plenty of gold mines produce silver because the extraction of silverore is carried out mainly as by-product from lead/zinc, copper and gold deposits. The majorproducing countries of silver are Mexico, China, Peru, Australia and Russia.
The survey performed by Classen et al. (2007) shows that the amount of silver extracted dur-ing 2000-2006 from mines in Papua New Guinea are almost equal than gold as well as the en-ergy consumption for concentrating and refining process which are 17,100 GJ/t and 7.92 GJ/t,respectively. Throughout 2002 an open pit mine in Chile produces mainly silver consuming5,142.86 GJ/t in the concentration process and 2.32 GJ/t in the refinement.The open pit Yana-cocha mine in Peru produces silver in less quantity than gold, hence the consumptions with re-gards to concentration and refining process are 33,057.22 GJ/t and 18.54 GJ/t, which are higherthan those for gold production. The ITP (2002) reports that in 1976 the Bureau of Mines esti-mates that 2,743 GJ/t were required to produce silver. The energy consumption for both con-centrating and refining processes was reported as 1,582 GJ/t by Kellogg (1977).
2.2.16 Tellurium
A recent application of tellurium is for the thin film solar cells, although it has common applica-tions such as thermoelectric devices and as an steel alloy. Tellurium is a relatively rare element.It is commonly extracted as a by-product of processing copper, lead, gold, and bismuth ores.The tellurium content in the copper varies considerably, according to Classen et al. (2007) anaverage 7 g refined tellurium is produced per tonne copper that is extracted. Tellurium is pro-duced mainly in the United States, Canada, Peru and Japan.
The metallic impurities form anode slime of copper, is the main source for the production
44

of tellurium. The slime contains tellurium, beside various metals like Bi, Sb, Se, Pb, Au, Ag, As orNi. Therefore, the separation process is usually done for all metals at one place. The tellurium isseparated from the slime as copper-telluride-cementate, through the following process: (i) dis-solving of copper-cementate with sulphuric acid, (ii) electrolysis of tellurium from the solutionand (iii) purification of cathode-tellurium with melting, as shown in Fig. 2.12.& =>&I(%%-'"-J& &
!
Fig. 2.2 Production process of tellurium
Dissolving cementate and electrolysis:! Q90! ,060&'3'0! )4! ,)<<0(J'055+(-*0! -1! '(03'0*!O-'9! 1+5<9+(-,!3,-*#!Q90!&0E'!1'0<!-1!'90!050,'()5A1-1!)4!'90!1)5+'-)&!')!0E'(3,'!'90!'055+(-+6!3'!'90!,3'9)*0#!U+('90(!*0J'3-51!3&*!,906-,35!(03,'-)&1!,3&!T0!4)+&*!-&!Z&),X30('!P"]]"R#!
Purification: [,,)(*-&C!')!U'90&3X-1!P"]]:RH!9-C9!<+(-'A!'055+(-+6!-1!<()*+,0*!TA!050,'()5A'-,!<+(-4-J,3'-)&! 3&*! 1+T10F+0&'! 605'-&C! 3&*! 3')6-h3'-)&! )(! TA! 23,++6J*-1'-553'-)&#! [,,)(*-&C! ')! -&*+1'(-35!1)+(,01!-&!'90!60&'-)&0*!(0<)('H!050,'()5A'-,!<+(-4-,3'-)&!*)01!&)'!<()*+,0!3&A!06-11-)&1!3&*!355!O31'0!-1!(0,A,50*#!N&!'90!)'90(!93&*H!-'!-1!60&'-)&0*!'93'!4)(!'90!<()*+,'-)&!)4!]#=!XC!'055+(-+6!PBB#BBB`!)(!.\R!]#?.!XC!'055+(-+6!PBB#BB`!)(!:\R!-1!(0F+-(0*#"!Q9-1!(0<(010&'1!3!'055+(-+6!5)11!)4!"]`!*+(-&C!'9-1!<9310!)4!<+(-4-,3'-)&#!!
!
2.6 Life cycle inventory 7\)!@8[J1'+*A!)&! '055+(-+6!<()*+,'-)&! -1!323-53T50 #!Q9-1!6)*+50! -1!T310*!)&! (0<)('0*!235+01! 4()6!
Z&),X30('!P"]]"R!3&*!PU'90&3X-1!i!Z-6!P"]].Rd!U'90&3X-1!P"]]:RR#!Q90!4+&,'-)&35!+&-'!)4!'9-1!<(),011!-1!$!X-5)C(36!)4!'055+(-+6!O-'9!3!<+(-'A!)4!BB#BBB`!P.\R#!Q9-1!<+(-'A!355)O1!3!*-(0,'!+10!4)(!'90!<()J*+,'-)&!)4!1)53(!,0551!3&*!050,'()&-,!*02-,01#!Q9-1!*3'310'!*01,(-T01!'90!<()*+,'-)&!3&*!<+(-4-,3'-)&!)4!'055+(-+6!-&!D+()<0H!1'3('-&C!4()6!'90!3&)*0!15+*C0!4()6!,)<<0(!<+(-4-,3'-)&#!
Transports:!Z&),X30('!P"]]"R!(0<)('0*!3!O-*0!'(3*0!O-'9!,)&,0&'(3'0H!T5-1'0(!3&*!3&)*0!,)<<0(H!1)!3&!320(3C0!'(3&1<)('!*-1'3&,0!)4!:]]]!X6!TA!19-<!O31!311+60*!4)(!'90!3&)*0!15-60!O-'9!3!7`!,)&,0&'(3J'-)&!)4!'055+(-+6#!Q90!355),3'-)&!4)(!'9-1!'(3&1<)('!O31!*)&0!TA!O0-C9'!P100!Q3T#!"#:R#!Q90!'(3&1<)('!')!'90!<53&'!O31!311+60*!O-'9!1'3&*3(*!'(3&1<)('!*-1'3&,01#!
Demand in materials and energy:!Q90!-&<+'!400*!-1!,)<<0(J'055+(-*0!,060&'3'0H!'93'!-1!*0(-20*!4()6!'90!<(-63(A!,)<<0(!<()*+,'-)&!,A,50!PS00!>3('!a8)<<0(f!-&!'90!,)((01<)&*-&C!,93<'0(R#!Q90!'055+(-*0!
!!!!!!!!!!!!!!!!!!!!!!!!!!!!!!!!!!!!!!!!!!!!!!!!!!!!!!!
"!!>0(1)&35!,)66+&-,3'-)&V!D63-5!4()6!Y#!U'90&3X-1!')!\#!_+&CT5+'9H!\)2#!"]]=!7!!S'0-&T0(C0(!P$BB?R!3&35A10*!'90!5-40!,A,50!)4!8*Q0J1)53(!,0551H!'9)+C9!'90!311+6<'-)&1!4)(!'90!<()*+,'-)&!3&*!<+(-4-,3'-)&!)4!'055+(-+6!O0(0!')!()+C9#!Q90(04)(0!&)!*3'3!4()6!'90!60&'-)&0*!'901-1!931!T00&!+10*#!
ecoinvent v2.0 report No. 10& K&V&K&
Figure 2.12: Production process of tellurium IPPC (2009a).
Dissolving cementate and electrolysis: the cementate of copper-telluride is treated with sul-phuric acid. The next step is the electrolysis of the solution to extract the tellurium at the cath-ode.
Purification: high purity tellurium is produced by electrolytic purification and subsequentmelting and atomization or by vacuum-distillation.
2.2.17 Zinc
Zinc is an important industrial metal which is extensively used both in metallic and chemicalforms. It has useful electrochemical properties, forms useful alloys (e.g. with copper and tin)and makes a good protective coating for iron or steel. Zinc is one of the main nonferrous metals,which are largely produced and largely consumed in the world. It is produced in many coun-tries such as Australia, Canada, China, Kazakhstan, Mexico and Peru. The most important zincmineral is sphalerite. There are two routes to produce zinc, hydrometallurgical process thataccounts almost 80 % of total zinc production and pyrometallurgical process that produces theremaining 20 %, according to Xiao et al. (2003) (Fig. 2.13). About 70 % of zinc is won from asulphidic ore and is mined mostly underground.
45

& 6>&System Characterisation& &
ecoinvent v2.0 report No. 10& P&U?&P&
!
6.5 Primary Zinc Production Process X,-*!*0-!6$!%&'()*$(!.&'3!%&,30&9!&0;!30+$&,0/4!69!%9&'3$+0//)&F,*0/!'&!#9(&'3$+0//)&F,*0/!3$+#'(4!
?<,F7!P7SA7!Y9&'3$+0//)&F,*0/!3$+#'(4!0&$!)4$(!,-!'+#$&!%0&+4!'.!+#$!;'&/(!6)+!#05$!F&0()0//9!/'4+!+#$,&!
,3%'&+0-*$!0-(!0&$!-'+!)4$(!,-!>g!.'&!4,3%/$!2,-*!*'-*$-+&0+$47!8$+$&3,-,-F!.0*+'&4!.'&!+#,4!+$-($-*9!
0&$!+#$!-$$(!.'&!0-!$H+&0!(,4+,//0+,'-!4+0F$!+'!'6+0,-!#,F#KF&0($!2,-*!0-(!+#$!&$/0+,5$/9!/';!2,-*!$H+&0*K
+,'-!$..,*,$-*97!"#$!%9&'3$+0//)&F,*0/!I3%$&,0/!:3$/+,-F!<)&-0*$!%&'*$44!?I:<A!,4!#';$5$&!4+,//!'.!,3K
%'&+0-*$!,-!>g!6$*0)4$!,+!$-06/$4!*'3%/$H!/$0(K2,-*!*'-*$-+&0+$4!0-(!4$*'-(0&9!30+$&,0/!+'!6$!+&$0+$(!
4,3)/+0-$')4/91! 9,$/(,-F! 40/$06/$! /$0(! 0-(! 2,-*7! I+! *0-! 0/4'! *'-4)3$! &$4,()$4! .&'3! '+#$&! %&'*$44$4!
?IYYT1!BCCOA7!
!
Fig. 6.9 General scheme of zinc production (Dove & Boustead, 1998). The pyrometallurgical and hydrometallurgical production processes account for 20% and 80% of the world production, respectively (IPPC, 2001).
!
6.5.1 Production process and infrastructure
"#$!%9&'3$+0//)&F,*0/!&')+$! ,4!)4$(!.'&!.$$(!'.!3,H$(!2,-*`/$0(!*'-*$-+&0+$4!0-(!4$*'-(0&9!30+$&,0/!
0-(!)4$4! +#$! I3%$&,0/!:3$/+,-F!<)&-0*$! ?I:<A1! 0! 4%$*,0/! .'&3!'.!0!6/04+! .)&-0*$7!"#$!$/$*+&'+#$&3,*!
.)&-0*$!,4!)4$(!,-!'+#$&!%0&+4!'.!+#$!;'&/(7!X,-*!%&'()*$(!,-!+#$!I3%$&,0/!:3$/+,-F!<)&-0*$!309!*'-K
+0,-!50&9,-F!03')-+4!'.!*0(3,)31!/$0(1!*'%%$&1!0&4$-,*1!0-+,3'-9!0-(!,&'-7!"#$!%&'*$44!)4$4!0!&$.,-K
,-F!4+0F$7!X,-*!.&'3!+#$!I:<!,4!&$.,-$(!69!&$./)H!(,4+,//0+,'-!,-!*'/)3-4!*'-+0,-,-F!0!/0&F$!-)36$&!'.!
&$.&0*+'&9! +&094! ?@$;! s$&4$9!8,4+,//0+,'-A7! "#$! /';$&! $-(4! '.! +#$! *'/)3-4! 0&$! #$0+$(! $H+$&-0//9! 69!
-0+)&0/!F047!"#$!)%%$&!$-(4!0&$!-'+!#$0+$(!0-(!&)-!*''/!$-')F#!+'!&$./)H!+#$!#,F#$&!6',/,-F!%',-+!3$+K
0/4!6$.'&$!50%')&4!%044!+'!0!*'-($-4$&7!"#$!@$;!s$&4$9!(,4+,//0+,'-!*'/)3-!,4!0/4'!)4$(!.'&!4$*'-(0&9!
2,-*!30+$&,0/47!8,4+,//0+,'-!%&'*$$(4!,-!+;'!4+0F$4m!.,&4+!+#$!4$%0&0+,'-!'.!2,-*!0-(!*0(3,)3!.&'3!/$0(!
0-(!+#$-!4$%0&0+,'-!'.!*0(3,)3!.&'3!2,-*7!I-!+#$!.,&4+!4+0F$1!3'/+$-!2,-*!,4!.$(!,-+'!0!*'/)3-!;#$&$!0//!
+#$!*0(3,)3!0-(!0!#,F#!%&'%'&+,'-!'.!+#$!2,-*!0&$!(,4+,//$(7!"#$!3,H+)&$!,4!*'-($-4$(!0-(!.$(!(,&$*+/9!
+'!0!4$*'-(!*'/)3-7!"#,4!*'/)3-!,4!'%$&0+$(!0+!0!4/,F#+/9!/';$&!+$3%$&0+)&$!+'!(,4+,/!30,-/9!*0(3,)31!
;#,*#! ,4! *'-($-4$(! 04! 0! 2,-*K*0(3,)3! 0//'97! "#$! 0//'9! ,4! +&0-4.$&&$(! +'! 0! *0(3,)3! &$.,-$&97! "#$!
Figure 2.13: General scheme of zinc production Classen et al. (2007).
Zinc and lead are extracted together from sulphidic ores and are mined largely underground.The ore is transferred to the beneficiation step where processes such as gravity concentration,flotation and neutralisation, are performed. Zinc can be produced by pyrometallurgical or hy-drometallurgical methods. The pyrometallurgical route uses the Imperial Smelting Furnace(ISF) for zinc/lead concentrates followed by a refining stage to separate zinc from cadmium,lead, copper, arsenic, antimony and iron. The hydrometallurgical route is used for zinc sul-phide. The first step is the roasting process to produce zinc oxide, followed by several leachingstages to obtain zinc, which does not requires a further refining. The electrolysis process isthe hydrometallurgical route used to produce zinc from primary raw material, the energy con-sumption during this refining stage reported by the IPPC (2009a) is 14.76 GJ/t.
According to Classen et al. (2007), smelting of zinc is a multi-output process that deliversthree co-products: zinc, cadmium sludge from zinc electrolysis and indium from leaching. Un-doubtedly, zinc extraction is the major source for raw material. However an allocation factor forthree products zinc, indium and cadmium has to be determined. Since cadmium is consideredas a contaminant that has to be isolated from the main product anyway, the cadmium contain-ing sludge is regarded as burden free. For every tonne of zinc extracted 1.5 kg of cadmium isrefined. For Indium, there is a ratio of 45 g refined Indium per tonne extracted zinc.
According to Boustead & Hancock (1979), the energy requirement by the electrothermicmethod to obtain zinc from ore is 69.8 GJ/t, including overall process. Whilst, Chapman &Roberts (1983) assert that the energy requirement for mining and concentrating ore to producezinc is 11.7 GJ/t, the smelting and refining processes requires 63.3 GJ/t by electrothermic or 49.6GJ/t by electrolytic means.
The energy consumed in the open pit mining of zinc (for an ore grade of about 5 %) andore preparation is 4.464 GJ/t, which is relatively low compared with the high energy consump-tion of 63.21 GJ/t for the refining process through electrothermic operations. Yoshiki & Toguri(1993) argue that less energy-intensive methods of zinc production include electrolytic route,reductive flash smelting and the Plasmazinc process. The gross energy needed to produce spe-cial high-grade zinc reported by Dove & Boustead (1998) is 51.05 GJ/t, this energy includes the
46

consumption of all ancillary operations, tracking all operations back to the extraction of rawmaterials from the ground. According to Ayres et al. (2002), the International Zinc Associationhas concluded that the total energy in fuels and electricity required to produce a tonne of con-centrate is 7.6 GJ/t, while 50 GJ/t is required to produce refined zinc.
According to Classen et al. (2007), the mining process has an energy requirement of 0.62GJ/t and once obtained the primary raw material zinc can be produced by pyrometallurgicalor hydrometallurgical method. Pyrometallurgical methods are used in other parts of the worldbut have gradually lost the importance, considering the mix world-wide in the pattern of theproduction processes producing zinc, the energy needed in the smelting step is 21.09 GJ/t as-suming that 80 % is done by hydrometallurgical and 20 % by pyrometallurgical route. Norgateet al. (2007) report that zinc production from sulphide ore is done through electrolytic processwith a energy requirement of 48 GJ/t of primary energy in overall process. Considering an aver-age efficiency of 50 % due to the utilization of both thermoelectric and hydroelectric generationthe energy requirement is 96 GJ/t. The imperial smelting process has an energy consumptionof 72 GJ/t. Table 2.14 summarize the energy consumption in mining and refining of zinc, ac-cording to the aforementioned process used to obtain it.
Table 2.14: Energy consumption in the zinc production. Values expressed in GJ/ton of Zn.Emining Erefining Etotal
Boustead & Hancock (1979) 69.8
Chapman & Roberts (1983) 11.7 63.3 75
Yoshiki & Toguri (1993) 4.464 63.21 67.85
Ayres et al. (2002) 7.6 50 57.6
Classen et al. (2007) 0.62 21.09 21.71
IPPC (2009a) 14.76
2.3 Summary
This chapter attempts to provide a basic understanding of the technology and energy usage ofthe mining industry. A description of main uses, physical, chemical and geological character-istics, producing countries and metallurgical production processes of several metals which willbe used in the following chapters of this thesis, have been carried out. For each metal, a sum-mary table of the energy consumptions during the mining and refining steps was presented.It is important to highlight that there is a wide range of energy values for each commodity asshown in each of the energy tables presented in this chapter due to different factors such asore grade and technological constraints. Furthermore, it is difficult to know the energy require-ments reported for those metals obtained as by-products. Due to the fact that there is very littledata available on the mining industry for energy use by specific mining process utilized to pro-duce by-products. Accordingly, Table 2.15 presents a summary of the energy requirements foreach of the described metals as well as for the metals presented in Appendix A.
In the next chapter, the energy consumption of the mining industry (gold) is analyzed throughthe learning curve theory in order to know the influence that factors such as ore grade and tech-nological improvements have in mining.
47

Table 2.15: Energy requirements for the production ofmineral commodities. [GJ/t]
Metal Mining and Beneficiation Smelting and Refining
Aluminium (Gibbsite) 10.5 23.9
Antimony (Stibnite) 1.4 12.0
Arsenic (Arsenopyrite) 9.0 19.0
Beryllium (Beryl) 7.2 450.0
Bismuth (Bismuthinite) 3.6 52.8
Cadmium (Greenockite) 263.9 278.5
Chromium (Chromite) 0.1 36.3
Cobalt (Linnaeite) 9.2 129.0
Copper (Chalcopyrite) 28.8 21.4
Fluorite 1.5 -
Gold 107751.8 -
Iron ore (Hematite) 0.7 13.4
Lead (Galena) 0.9 3.3
Lithium (Spodumene) 12.5 420.0
Manganese (Pyrolusite) 0.2 57.4
Mercury (Cinnabar) 157.0 252.0
Molybdenum (Molybdenite) 136.0 12.0
Nickel sulph. (Pentlandite) 15.5 100.0
Nickel later. (Garnierite) 1.7 412.0
Potassium (Sylvite) 3.1 N.A.
REE (Bastnaesite) 10.2 374.0
Silicon (Quartz) 0.7 76.0
Silver (Argentite) 1281.4 284.8
Sodium (Halite) 3.3 39.6
Tantalum (Tantalite) 3082.8 8.1
Tin (Cassiterite) 15.2 11.4
Ti-Ilmenite 7.2 128.1
Ti-Rutile 13.8 243.8
Uranium (Uraninite) 188.8 N.A.
Vanadium 136.0 381.0
Wolfram (Scheelite) 213.0 381.0
Zinc (Sphalerite) 1.5 40.4
Zirconium (Zircon) 738.5 633.0
48

Chapter 3
Technical development in the miningindustry
In the previous chapter, it was seen that factors such as ore grade and technological constraintsplay an important role when energy requirements in mining and metallurgical industry areevaluated. This chapter analyzes these variables through the learning curves theory, in orderto know if energy required to mining ores decreases as technologies improve, if the amount ofimprovement decreases as time goes on and if technology improvements have more or less in-fluence than ore grade declining in energy consumption. Furthermore, learning curves can beused as a tool to estimate future energy reductions in the mining industry.
3.1 Introduction
As described in chapter 1, the mining industry is experiencing groundbreaking changes such ascommodity price fluctuating, rising energy demand, water and cyanide consumption, increas-ing costs, declining ore grades, green-house gas emissions, increasing waste volumes and thechallenge to achieve sustainable industry. Thence, sustainability1 practices have become im-portant for most major mining companies in order to reach a balance between socio-political,economic and environmental issues.
In order to overcome the sustainability challenges in the mining industry, it is importantto increase efficiency on resource extraction. One of the most powerful forces influencing theeconomic importance of natural resources in the future is technological change. Through tech-nological innovations, it is possible to increase material efficiency in manufacturing processesand seek new substitute raw materials. Technology has always played an important role totransform mineral resources into mineral wealth and useful end-products. Nevertheless, tech-nology breakthroughs of mineral extraction had been relatively slow until the Industrial Revo-lution when it showed a growth demand in commodities like coal, iron or copper. This fact leadto ever greater technological advances that even now are still used such as flotation, the blastfurnace, railways, geophysics, drilling, trucks and transport, etc., allowing the mining of lowerore-grade mines.
1For Placer Dome Inc. which is one of the world’s largest gold producers “sustainability means the exploration,design, construction, operation and closure of mines in a manner that respects and responds to the social, environ-mental and economic needs of present generations and anticipates those of future generations in the communitiesand countries where it works” Milton (1998).
49

According to the ad-hoc Working Group (2010), the technological progress in exploring,mining and processing mineral raw materials has actually been the key driver that has allowedsupply to keep up with demand in the past. Sohn (2006) states that over the last 25 years, pow-erful advances in exploration techniques in the mining sector, such as remote sensing imagery,have located new and major deposits. Breakthroughs in mining machinery, the extensive useof computers, more effective chemicals and reagents, and better use of explosives in the mines,are some of the examples that allows for cost reductions and energy efficiency. Therefore, moreefficient processing methods can have a great impact on future availability of mineral resources.
That said, there is a debate about the availability of commodities in the future, becausethere are two counteracting trends. First, general trends suggest a long-term decline in oregrade, which rises energy consumption per ton of metal extracted, and second technologicaltransitions, which may hamper this trend. Jolliet et al. (2003) argue that if the quality of a minedabiotic resource is reduced over time, the effort to extract the remaining resource will increase.
Technological learning has been widely used and it has acquired support in many appli-cations as the energy analysis proposed in this thesis. The aim of this chapter is to becomeacquainted if technological breakthroughs that have occurred can preclude the rising energydemand for the gold mining industry as a case study. As experience is acquired, material andenergy efficiency increase and technical changes can be expressed through the so called learn-ing curves. In this chapter these opposite issues are analyzed through the survey of data sets of17 major gold producing countries, with the aim to establish relationships among resource ex-traction and energy use; therefore it allows being aware if actual mining processes are leadingthe gold mining sector towards sustainability. Nevertheless, technical efficiency cannot im-prove indefinitely and it can never overcome thermodynamic bounds.
3.2 Ore grade evolution
In the mining industry, energy consumption trend is strongly influenced by the decline in oregrades. Declining ore grades are indicative of a shift from “easier and cheaper” to more “com-plex and expensive” processing, which implies declining in productivity and the consequentialrise in the energy intensity of mineral processing. Giurco et al. (2010) state that almost all min-erals are being produced today at greater rates than at any time in history.
Historical data compiled by different authors such as Mudd (2007a,b,c, 2010), Page & Creasey(1975), Skinner (1986), Norgate & Jahanshahi (2010, 2011) reveal that ore grades have declineddramatically throughout the last century. The best mines with the highest grades have beenalready extracted and today mining companies need to go further and deeper to find profitableores. Consequently, much more energy is required per ton of mineral extracted, as depicted inFig. 3.1. But not only that, the use of water, chemicals and waste-rock produced is also increas-ing strongly, leading to serious environmental problems. Hence, production and cost trendsshow an increment as explained promptly.
That said, although there is evidence supporting the long-term decline in gold ore grades,there also exists the possibility that technological learning will overwhelm this fact. Hence, inthe next sections the relationship between two issues: the decline in ore grades and the risingin energy consumption per ton of metal extracted, is analyzed.
50

0
200,000
400,000
600,000
800,000
1,000,000
1,200,000
0 5 10 15 20 25 30 35 40 45 50
Energy Con
sump.
on (G
J/t)
Ore grade (g/t)
United States
Tanzania
South Africa
Russia
NewZ
PNG
Peru
Namibia
Mexico
Mali
Laos
Indonesia
Guinea
Ghana
Chile
Canada
Brazil
Bolivia
ArgenNna
Australia
Figure 3.1: Energy consumption as a function of ore grade in global gold mining. Data fromMudd (2007b).
3.3 Evolution in technology in the minerals industry
Natural resources are the main inputs into mining production. The problem is their non-renewable character. As mineral and energy deposits are depleted, the quality and accessibilityof remaining reserves usually decline, requiring more complex extraction techniques as well asgreater costs. Hence, the importance of a deeper understanding of the role of technology in themining industry.
Technology has always been, and remains, a key issue of the mining industry and its abil-ity to transform mineral resources into mineral wealth and useful end-products. According toGiurco et al. (2010), improved technological performance has allowed the industry to:
• improve exploration capabilities
• decrease costs and increase efficiency when processing complex ores
• restrict the cost associated with environmental regulations
• reduce cost of labour by increasing mechanisation
• diminish input cost due to energy or chemicals
• recover resources from wastes
The development and widespread use of new technologies has made possible the growingin mineral supply to meet increasing demand. The latter is the main reasoning against mineraldepletion. Nonetheless, this historical situation may change due to declining in ore grades.
The role of technology in mineral exploration, mining, processing, manufacturing and re-cycling has been critical in the minerals industry. A major breakthrough in mineral exploration
51

was the emergence of geophysics, besides drilling, remote sensing, bio-prospecting, complexgeological modelling tools, field analysis instruments, and so on. The main techniques of min-ing remain the same, however increasing mechanisation in underground mining allows to reachgreater depths. In open cut mining, increasing truck sizes, safer and cheaper explosives andcheap diesel fuel, are the factors that have made possible the long-term growth. Whilst, flota-tion, gravity and dense media separation, carbon-in-pulp and heap leaching solvent extractionelectrowinning (SX-EW), are the technologies developed to reduce energy intensity and im-prove metals recovery during minerals processing. Technology in manufacturing plays an im-portant role because it allows to reduce the metal used in products as well as to design productsin such way that recycling at their end of life be more easy.
Technical change is a gradual process that entails technical knowledge and investment, butalso an increase in material and energy efficiency. Ruth (1993) claims that both material andenergy efficiency increase independently and changes can be led to the learning by doing con-cept. In accordance to Söderholm & Sundqvist (2007), technical change is introduced by im-plementing technology learning rates, which specify the quantitative relationship between thecumulative experiences of the technology and cost reductions.
3.4 The learning curve theory applied to the mining industry
Learning curves come out as an empirical method to assess the effect of learning on technicalchange. Learning curves are used to analyze a well known observed fact. Because of the experi-ence, humans become increasingly efficient. As experience is acquired, cost decline, efficiencyand quality upgrade and waste is reduced.
There is a widespread use of learning curves because of their usefulness to quantify the im-pact of increased experience and learning of a given technology, allowing to obtain a represen-tation of technical change with a variety of different indicators of technological performance.
A good number of studies based on the learning curves theory have been carried out. For in-stance, Söderholm & Sundqvist (2007) used learning curves for assessing the economic outlookof renewable energy technologies to link future cost developments to current investment in newtechnology. Other studies about the impact of quality on learning that suggest that learning isthe link between quality improvement and productivity increase have been accomplished byvarious authors like Li & Rajagopalan (1997) and Jaber & Guiffrida (2008).
The rate of improvement is not subjective, it is a function of the process itself. Limitationsto improve the process often requires a capital investment and remove the limitations inherentin the process. Learning curves describe long-term improvement through the knowledge of
• How fast can you improve to a energy saving of x?
• What are the limitations to improve the process?
• Are forceful goal achievable?
Yelle (1979) states that the simplest and most frequently representation of learning curve inenergy technology studies is the Wright’s log-linear model:
Yx = Y0xb (3.1)
52

where Yx represents the energy required to produce the x t h unit, Y0 is the theoretical energyof the first production unit, x is the sequential number of the unit for which the energy is to becomputed and b is a constant reflecting the rate energy decrease from year to year (learningindex) and is calculated as:
b = lnS
ln2(3.2)
where S is the energy slope expressed as a decimal value (learning rate), while (1-S) is de-fined as the progress ratio which express the fraction to which energy requirements are reducedwith cumulated production.
However, Ruth (1995b) asserts that there is a limit on the energy use to ore production thatcannot be exceed with increasing experience and in this case it is the minimum theoreticalenergy required to concentrate a substance from an ideal mixture of components. This limitcan be calculated through the concentration exergy presented in Chapter 4 and expressed in Eq.4.28. Accordingly, considering the energy limiting value, the learning curve can be expressed asEq. 3.3 which integrates thermodynamic concepts to the learning curve analysis.
Y −bc = Y0xb (3.3)
In the mining industry, the technology learning rates state the correspondence between thecumulative experience of the technology and the energy requirement reductions. These reduc-tions are the result of learning by doing. For instance, performance improves as new technolo-gies and mining methods are implemented. Accordingly, learning curves will be used to empir-ically quantify the impact of accomplishing new mining practices on the energy consumptionsof ore mining.
Kahouli-Brahmi (2008) has performed an enhancement for the simplest learning curve byapplying a factor related with research and development. These extended formulation is knownas the two factor learning curve (TFLC) expressed as follows:
Y (x,K S) = Y0xb ∗K Sc (3.4)
where K S is the knowledge stock and c is the elasticity of learning by researching.
According to Weiss et al. (2010), both types of learning curves are the most commonly usedto assess technology learning rates in the energy sector. However, Jamasb & Kohler (2007) de-clare that a multiple-factor learning curves that account for other independent variables be-sides cumulative production represent an approach to get a better understand of technologicallearning by enhancing the knowledge base.
Learning rates depend on the data points that are chosen. Previous surveys, as the oneperformed by Kahouli-Brahmi (2008) reveals significant variability in estimated rates betweendifferent energy technologies, which ranges from 1% to 41.5%. On the other hand, the studydeveloped by McDonald & Schrattenholzer (2001) show that the average value of learning ratesfor energy technologies is 16-17% and learning rates for manufacturing is 19-20%. Negativelearning rates can be interpreted as a consequence of experience depreciation, if no impor-tant external factors (such as declining ore grades in mining technologies) are influencing theproduction process.
53

The estimating of learning curves using econometric techniques has some highlights. Forinstance, the need to survey the effect of detach single observations especially outliers that mayeffect the learning rate estimate or the impact of using different variable definitions. Anotherissue is related with the way in which technology learning is operationalized in order to knowif the indicator of learning by doing selected is assuredly capturing the impact of learning bydoing activities or if it is following a general trend of technical progress. Also is important toinvestigate differences in learning rates across different technologies. Söderholm & Sundqvist(2007) assert that a further point is the assumption in the model when the independent variableis defined as well as the influence of other variables on this.
The use of learning curves implies that a technology had been already invented and imple-mented. Ruth (1993) argues that as more awareness is obtained in using materials and energyto produce outputs with a determined technology, changes in its performance occur slowly.This can suggest that a high level of expertise in ore mining with a specific technology will re-sult in a discontinuity in learning. Further interruptions or discontinuities in the learning curveoccur when intermittent production is presented, e.g. mine rehabilitation. Afterwards, learn-ing curves may start again with a new technological breakthrough, a radical innovation or aparadigm change, according to Wellmer & Becker-Platen (2002). Also, Schoots et al. (2008) averthat breakthroughs may influence the progress ratio.
Wellmer & Becker-Platen (2002) avow that learning curves for mining sector are driven byfinancial rewards, directly (i.e. by the discovery of a very economic deposit or a price increaseof a commodity) or indirectly (by a penalty).
3.5 Learning Curves applied to Global Gold Mining
In this section, the analysis of data set on historic gold mining in the main gold producing coun-tries was carried out by means of linking resource extraction with energy use through the learn-ing curves approach. Learning curves were originally developed to evaluate the effect of learn-ing by doing in manufacturing. However, there are new applications such as analysis innovationand technical change in energy technology.
This section looks over energy data on gold mining for Australia, North America, Africa andthe Asia-Pacific compiled by Mudd (2007b,c), who pointed out the critical aspects of mineralresource sustainability such as resource intensity linked to technology.
Learning rates and progress ratios were calculated for each mine using Eq. 3.2 and Eq. 3.3.The information was grouped according to the different mining technologies used, becauselearning by doing will differ between mines, countries and technologies.
Progress ratios are different for each country and even for each mine although they use thesame recovery process technology. This is due to inherent factors to each mine such as projectage, depth, ore types, etc. Results of the analysis performed for different mining operations andrecovery processes are shown in Table 3.1. The assorted configurations of gold mines like openpit (OP), underground (UG) or mixed (MIX), as well as the energy source (diesel, coal, hydro,gas or any mix among them) are factors that influenced the progress ratio.
Recovery process technologies show average progress ratios around ±25% as shown in Fig.3.2. Open pit operations with heap leach technology (HL) as recovery process as well as un-
54

derground operations using carbon in pulp (CIP)2 technology are the mining options with thegreatest progress ratios.
Figure 3.2: Distribution of average progress ratios for gold mining industry.
Negative progress ratios convey that technological learning has been unable to overcomethe increase in energy consumption during mining operations due to the declining in ore grade.On the other side, positive progress ratios imply that mining recovery processes have achievedto maintain or decrease the energy consumption during mining operations throughout time.Accordingly, the progress ratio becomes an indicator to identify those mines where miningpractices are successful when saving energy.
Table 3.1: Progress ratio for global gold mining.
Country Mines Operation Recovery Energy consumption Average ore Progress ratio
process (GJ/t Au) grade (g/t Au) by mine (%)
Argentina Veladero OP HL 476.295 1,2 20%
Cerro Vanguardia OP CIL 57.568 7,4 -15%
Australia Granny Smith OP CIP 48.010 12 -1%
Kidston OP CIP 95.494 10,5 -7%
Henty UG CIL 91.984 5,6 -31%
Kalgoorlie West MIX CIL 88.191 39,3 -8%
Agnew MIX CIP 171.934 21,6 -22%
Hill 50 MIX CIL 76.790 12,2 -6%
2The difference between carbon-in-pulp and carbon-in-leach processes is that for the first one the adsorptionoccurs after the leaching cascade section of the plant, whilst for the second one leaching and adsorption occursimultaneously De Andrade (2007).
55

Country Mines Operation Recovery Energy consumption Average ore Progress ratio
process (GJ/t Au) grade (g/t Au) by mine (%)
St Ives MIX CIP, HL 47.554 12,9 4%
Central Norseman MIX CIL 148.309 8,4 1%
Plutonic UG CIP, HL 155.778 3,5 2%
Darlot UG CIL 181.927 1,5 14%
Lawlers UG CIL 168.441 2 4%
SuperPit OP CIL 141.350 2,1 -4%
Mt Leyshon OP CIP 117.687 2,9 5%
Tanami-Granites MIX CIP/CIL 174.270 1,6 -30%
Boddington OP CIL 498.021 1,1 -14%
Pajingo UG CIP 112.653 4,3 24%
Bronzewing MIX CIL 63.504 7,5 4%
Jundee MIX CIL 144.078 3,9 -19%
Sunrise Dam OP CIL 180.196 0,4 1%
Challenger MIX CIP 210.419 0,5 -26%
Ravenswood OP CIP 236.498 1,5 18%
Stawell UG CIL 87.669 1,1 -4%
Fosterville OP BIOX, CIL 167.234 1,2 -5%
Peak (NSW) MIX CIL 162.455 3,3 6%
Brazil Mineracao OP HL 73.567 6,9 -4%
Serra Grande OP CIL 64.707 6,3 -23%
Amapari OP HL 208.293 2,4 29%
Morro do Ouro OP CIL 176.444 0,5 1%
Paracatu OP CIL 191.369 0,3 -2%
Maricunga OP HL 163.089 0,4 24%
Canada Dome-Porcupine MIX CIP 113.562 2,9 0%
Hemlo MIX HL 102.457 4,6 -6%
Musselwhite UG CIP 91.984 5,6 -16%
Campbell UG CIL/CIP 67.688 16,8 -2%
Eskay Creek UG 88.191 39,3 -16%
Red Lake UG CIP 22.401 79,7 0%
Chile La Coipa OP CIL 385.254 1,1 -3%
Ghana Tarkwa OP CIL 110.248 1 -4%
Damang OP CIL 166.186 1,4 -11%
Iduapriem OP CIP 130.283 1,8 -22%
Obuasi MIX HL 192.560 2,1 -4%
Guinea Siguiri OP CIP 189.244 1,1 4%
Indonesia Kelian OP CIL 190.161 2,4 0%
56
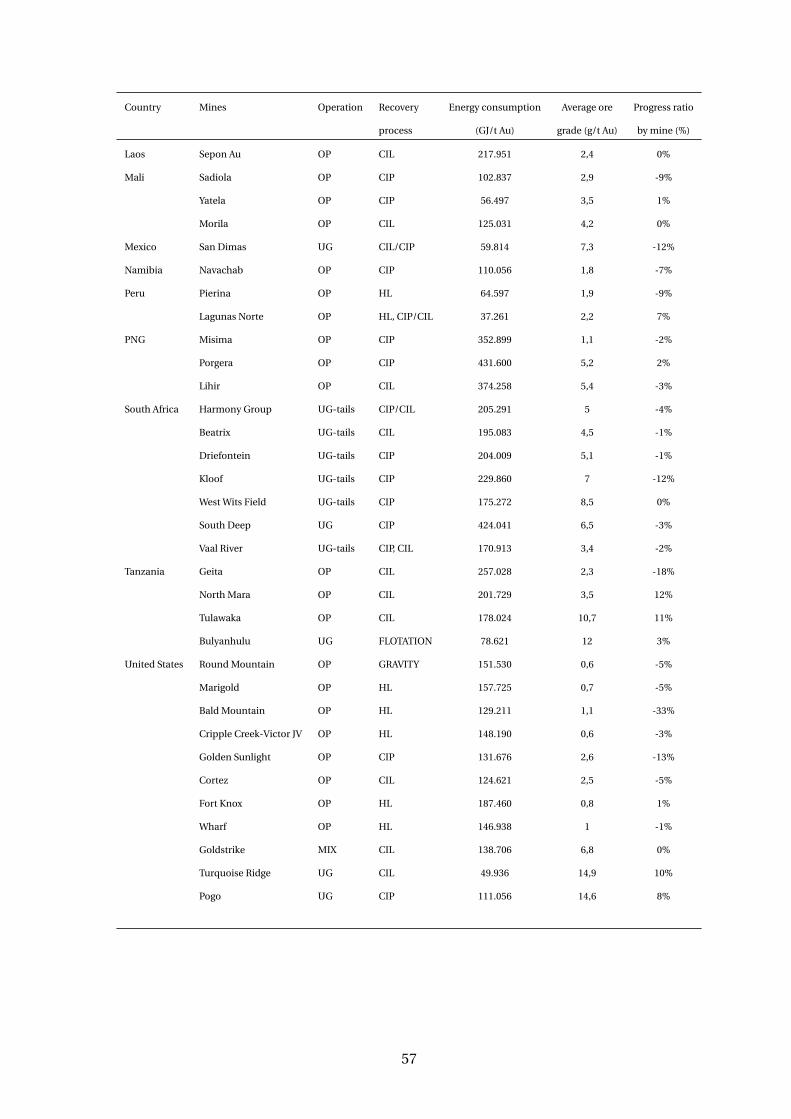
Country Mines Operation Recovery Energy consumption Average ore Progress ratio
process (GJ/t Au) grade (g/t Au) by mine (%)
Laos Sepon Au OP CIL 217.951 2,4 0%
Mali Sadiola OP CIP 102.837 2,9 -9%
Yatela OP CIP 56.497 3,5 1%
Morila OP CIL 125.031 4,2 0%
Mexico San Dimas UG CIL/CIP 59.814 7,3 -12%
Namibia Navachab OP CIP 110.056 1,8 -7%
Peru Pierina OP HL 64.597 1,9 -9%
Lagunas Norte OP HL, CIP/CIL 37.261 2,2 7%
PNG Misima OP CIP 352.899 1,1 -2%
Porgera OP CIP 431.600 5,2 2%
Lihir OP CIL 374.258 5,4 -3%
South Africa Harmony Group UG-tails CIP/CIL 205.291 5 -4%
Beatrix UG-tails CIL 195.083 4,5 -1%
Driefontein UG-tails CIP 204.009 5,1 -1%
Kloof UG-tails CIP 229.860 7 -12%
West Wits Field UG-tails CIP 175.272 8,5 0%
South Deep UG CIP 424.041 6,5 -3%
Vaal River UG-tails CIP, CIL 170.913 3,4 -2%
Tanzania Geita OP CIL 257.028 2,3 -18%
North Mara OP CIL 201.729 3,5 12%
Tulawaka OP CIL 178.024 10,7 11%
Bulyanhulu UG FLOTATION 78.621 12 3%
United States Round Mountain OP GRAVITY 151.530 0,6 -5%
Marigold OP HL 157.725 0,7 -5%
Bald Mountain OP HL 129.211 1,1 -33%
Cripple Creek-Victor JV OP HL 148.190 0,6 -3%
Golden Sunlight OP CIP 131.676 2,6 -13%
Cortez OP CIL 124.621 2,5 -5%
Fort Knox OP HL 187.460 0,8 1%
Wharf OP HL 146.938 1 -1%
Goldstrike MIX CIL 138.706 6,8 0%
Turquoise Ridge UG CIL 49.936 14,9 10%
Pogo UG CIP 111.056 14,6 8%
57

3.5.1 Australia
Global demand for Australian minerals and metals continues to rise. However, energy inputs tomining are rising, direct employment from mining is relatively low and productivity is declin-ing. Giurco et al. (2010) avow that being Australia very dependent on mining exports, strategiesto assure long-term national benefits from minerals including social, economic and environ-mental issues should be developed.
Australian data was compiled by Mudd (2007b) who asserts that industry will be challengedby declining ore grades and the increase of environmental and social costs or resource intensity.Other authors such as Prior et al. (2012) reveal that mineral production in Australia is currentlyunsustainable, not because of resources being finite, but because of the impacts associatedwith its processing and use. Notwithstanding it, commodities mining in Australia has been andcontinues to be a very important issue of Australian industry, representing approximately 7.7%of Australia’s GDP in 2008-2009, as stated by Giurco et al. (2010).
Gold is produced in almost 30 mines, including open pit, underground and mixed. In thischapter an analysis of the influence of technical development and declining ore grades on theavailability of Australian gold resources was accomplished. Obtained results suggests that al-though progress in technology has been made, in most cases energy requirements are increas-ing, because the main variable is the ore grade. Progress ratios represent the amount of im-provement in mining technologies for several mines in Australia, such as Kidston, Henty, Kal-goorlie, Agnew, St Ives, Plutonic, Darlot, Lawers, Superpit, Mt. Leyshon, Tanami, Boddington,Pajingo, Sunrise Dam, Challenger, Ravenswood and Peak. Available data from 1990 through2008, is shown in Fig. 3.3.
-‐100%
-‐80%
-‐60%
-‐40%
-‐20%
0%
20%
40%
60%
80%
1991 1992 1993 1994 1995 1996 1997 1998 1999 2000 2001 2002 2003 2004 2005 2006 2007 2008
Progress Ra*
o (%
)
Granny Smith
Kidston
Henty
Kalgoorlie West
Agnew
Hill 50
St Ives
Central Norseman
Plutonic
Darlot
Lawlers
SuperPit
Mt Leyshon
Tanami-‐Granites
Boddington
Pajingo
Figure 3.3: Progress ratios for gold mines in Australia.
Australia has a rising trend in energy consumption as well as in learning rates from 1857 to2009, as shown in Figure 3.4. During this period its cumulative production was 11,565 t of gold.The general trend is a rising energy requirement throughout time, but there are some minessuch as Agnew, Challenger, Plutonic, Super Pit, Fosterville, Tanami-Granites and Jundee, whichshow a reduction in its energy consumptions through the time. Another important issue whenanalyzing the energy consumption is the ore grade. As the concentration of the ore in a deposittends to zero, the energy required to separate the substance from the mine tends to infinity.This is a consequence of the Second Law of Thermodynamics and is an empirical fact.
58

0%
1%
2%
3%
4%
5%
6%
7%
8%
0
20,000
40,000
60,000
80,000
100,000
120,000
140,000
160,000
0 2,000 4,000 6,000 8,000 10,000 12,000 14,000
Learning Rate (%
)
Energy Con
sump6
on (G
J/t)
Cumula6ve prorduc6on (t)
Energy consump9on (GJ/t)
Learning Rate (%)
Figure 3.4: Learning curve for gold mining.
The scatter in gold data is due to factors such as the assorted configuration of gold mines(open pit, underground or mixed), the different kind of process used in the processing (heapleach versus CIP), the energy source (diesel, coal, hydro, gas or any mix between them) as wellas inherent factors to each mine (project age, depth, ore types, etc.).
Hence, to analyze the real behavior of these data some differentiations between the type ofmine and ore grades was carried out, in order to compare similar data, as shown in Fig. 3.5which depicts the progress ratios classified according to ore grades and mining types.
-‐60%
-‐50%
-‐40%
-‐30%
-‐20%
-‐10%
0%
10%
20%
Xc<0.5
1<Xc<2
2<Xc<3
3<Xc<4
4<Xc<5
5<Xc<7
7<Xc<8
10<Xc<11
11<Xc<13
13<Xc<14
14<Xc<15
15<Xc<40
40<Xc<83
Progress ra
)o (%
)
Open Pit Undergorund Mix
Figure 3.5: Progress ratios classified by ore grade for gold mining industry in Australia.
Furthermore, analysis taking into account variables such as: ore grade, years, mining type,primary fuel, energy consumption and cumulative production were performed. Figure 3.6 dis-plays the aforementioned variables for an open pit mine in Australia. It can be observed thatenergy consumption decrease as cumulative production increase. Then, positive progress ra-tios were obtained from 1996 to 2007. A negative progress ratio or a reduction in progress ratiosfrom one year to another is due to declines in ore grades.
The incoming general guidelines were obtained for the case of Australian gold mining:
59

4.2%
6.4%
0.4%
-‐1.1%
1.0% 1.3%
3.5% 3.7%
5.1%
0.8%
0
2
4
6
8
10
12
14
16
-‐2%
-‐1%
0%
1%
2%
3%
4%
5%
6%
7%
1996 1997 1999 2000 2001 2002 2003 2004 2005 2006
Ore Grade
(g/t Au)
Progress ra
2o (%
)
Progress Ra7o Ore Grade
Figure 3.6: Progress ratios of an open pit mine in Australia.
1. Energy required to mining the ores is strongly related to ore grades variation and, to alesser extent, to technological improvement.
2. The amount of improvement in mining technologies, represented in this work by theprogress ratios calculated for each scope of ore grade, is not related to time, owing to the oregrade influence in progress ratios evolution. That is to say, if there are positive progress ratiosover time these not necessarily increase as time goes on, because the key variable is the oregrade change.
3. Ore grades fluctuate across mines and mineral deposit regions. However average oregrades are declining, meaning that gold mining industry must shift from “simple and cheaper”to more “complex and expensive” mining methods.
3.5.2 Argentina
Gold is produced in two open pit mines; Veladero and Cerro Vanguardia. There is another im-portant mine in Argentina named Bajo la Alumbrera in which gold and copper are produced.The Veladero mine belonging to Barrick Company (2013a) with typical ore grades under 2.5 g/tAu started its production on 2005 so it is a new mine that has been increasing its productionwith lower energy requirements. Hence positive learning rates are obtained when applying thelearning curve approach. Otherwise, Cerro Vanguardia mine with ore grades between 7 and8 g/t Au has been displaying a decline in its ore grade. Although cumulative production hasgrown, the energy per unit of gold produced has also increased and thereby negative progressratios are presented. Available data from 2005 through 2007, is shown in Fig. 3.7.
-‐30%
-‐20%
-‐10%
0%
10%
20%
30%
40%
2006 2007
Progress Ra*
o (%
)
Veladero
Cerro Vanguardia
Figure 3.7: Progress ratios for gold mines in Argentina.
60

3.5.3 Brazil
There are two mines in which gold is extracted with an ore grade range less than 0.35 g/t Au,Maricunga and Paracatu owned by Kinross (2013). Maricunga mills only 35% of the total oremilled in Paracatu. In that case, the energy consumption in mining is related with quantity(cumulative production) and quality (ore grade) resulting a positive PR of 24% for Maricungabut not for Paracatu, which has a negative PR. Amapari mine owned by Newgold (2013) showsan improvement from 2005 to 2006 when it reduces its energy requirement almost 60% eventhough ore grade decreases. Hence, it presents the highest progress ratio of all mines analyzed.Available data from 2001 through 2007, is shown in Fig. 3.8.
-‐40%
-‐30%
-‐20%
-‐10%
0%
10%
20%
30%
40%
2002 2004 2006 2007
Progress Ra*
o (%
) Mineracao
Serra Grande
Amapari
Morro do Ouro
Paracatu
Maricunga
Figure 3.8: Progress ratios for gold mines in Brazil.
3.5.4 Canada
Dome-Porcupine mine belongs to Goldcorp (2013), these mine does not show variation in progressratios although three situations were identified: 1) with the same ore grade in 1997 and 2005,an increment in energy consumption was presented, this can imply that there was no improve-ment in the process and that this increase can be caused by the deterioration in the miningequipment, 2) energy consumption can diminish although ore grade declines; for instance from1997 to 1998, where energy reduction was influenced by the increase in the tons of ore milled,leading to a positive learning rate, and 3) the expected behavior of when ore grades decreaseenergy consumption increase and vice verse. Hemlo owned by Barrick Company (2013a), Mus-selwhite and Campbell mines belonging to Goldcorp (2013), show negative progress ratios asa result of ore grade declining, as well as the increment in energy consumption although oregrade remains constant.
Eskay Creek Mine belongs to Barrick’s Company. This mine is a clear example of ore gradedeclining trend insomuch as ore grade in 2001 was 53.14 g/t Au and then in 2007 it was of 20.91g/t Au. This situation have an effect on the energy consumption because in 2001 the energyrequired was 35.09 MJ/kg Au while in 2007 it reached 203.378 MJ/kg Au. Accordingly, negativeprogress ratios are presented. For values of ore grade between 40 and 90 g/t Au, besides EskayCreek, there is another mine Red Lake from Goldcorp (2013). Available data from 1997 through2007, is shown in Fig. 3.9.
61

-‐40%
-‐35%
-‐30%
-‐25%
-‐20%
-‐15%
-‐10%
-‐5%
0%
5%
10%
1998 2000 2002 2003 2004 2005 2006 2007 Progress Ra*
o (%
)
Dome-‐Porcupine
Hemlo
Musselwhite
Campbell
Eskay Creek
Red Lake
Figure 3.9: Progress ratios for gold mines in Canada.
3.5.5 Chile
Coipa mine uses conventional open pit mining methods and crushing, grinding and leachingoperations to process gold (Global Infomine 2013). Energy consumption has been increasingover time, leading to negative progress ratios. Available data from 2003 through 2004.
3.5.6 Ghana
The main gold producing country in West Africa is Ghana. For ore grades below 1.5 g/t Au, thereare two mines from Gold Fields Co.: Tarkwa Gold Mine and Damang Gold Mine owned by GoldFields (2013). The first one consists of six open pits, two heap leach facilities, and a CIL plant.The operation is currently mining multiple-reef horizons from open pits and there is potentialfor underground mining in the future. Tarkwa has mineral resources equal to 433.75 gold tonsand a mineral reserve of 280.6 tons. The second one is composed of multiple open pits, sur-face stockpile sources and a CIL plant, with a mineral resource of 133.2 gold tons and a mineralreserve of 59.5 tons. In accordance with the above information, it is reasonable that Damangmine has energy consumptions greater than Tarkwa mine for the same ore grade, leading tolower PR values. Furthermore, both mines show an increasing energy consumption trend un-der two conditions, when ore grades decrease and when cumulative production increase. Con-sequently, both mines have negative progress ratios, because under any circumstances there isan increase in energy consumption.
AngloGold Ashanti (2013) has two mines in Ghana: Iduapriem and Obuasi. The decreasein ore grade together with the rising energy consumption, result in negative progress ratios forboth. Available data from 2004 through 2008, is shown in Fig. 3.10.
62

-‐35%
-‐30%
-‐25%
-‐20%
-‐15%
-‐10%
-‐5%
0% 2004 2005 2006 2007 2008
Progress Ra*
o (%
)
Tarkwa
Damang
Iduapriem
Obuasi
Figure 3.10: Progress ratios for gold mines in Ghana.
3.5.7 Guinea
Siguiri gold mine belongs to AngloGold Ashanti (2013). The annual production is 7.9 gold tons.It has a mineral resource of 138.9 gold tons and a mineral reserve of 73.7 tons. This mine ful-fills the learning curve theory, since energy consumption decreases as cumulative productionincreases despite the ore grade is declining. Then, positive progress ratios are presented. Avail-able data from 2005 through 2007.
3.5.8 Indonesia
Kelian Equatorial Mining is 90% owned by Rio Tinto (McGuire 2003). This open pit mine startedits production in 1992 and finished it in 2004. The gold recovery process uses SAG and Ball Millsfollowed by gravity separation and carbon in leach (CIL) cyanidation. This mine shows a neutralPR. Available data from 2002 through 2004.
3.5.9 Laos
MMG Limited owns Seapon mine which has gold and copper operations. According to Min-metals Resources Limited (2013)Gold has been produced since 2002. In early 2005, an expansionof the original gold processing facility was completed doubling the capacity of the gold process-ing plant to 2.5 Mt/year, with a new crusher and mill allowing more flexibility and efficiency inthe treatment of Seapon ore. The mine has a mineral resource of 93.5 gold tons and a mineralreserve of 5.1 tons. The Seapon gold mine is expected to be operational until 2012. There is notenough data to establish a trend in its energy consumption, then its PR is zero. Available data2003 and 2005.
3.5.10 Mali
Sadiola Gold Mine owned by IamGold Corporation (2013) is operated by AngloGold Ashanti.Yatela Gold Mine performs the elution and smelting processes at the nearby Sadiola Gold mine.Morila Gold Mine is a joint venture company between Randgold (40%), AngloGold Ashanti Ltd(40%) and the State of Mali (20%) (RandGold Resources 2013) . During the first quarter of 2009,a successful transition was made from open pit mining to stockpile treatment. The operation
63

is expected to come to an end in 2013 although the mine is currently investigating the oppor-tunity to retreat the Tailings Storage Facility (TSF) material, which would extend the mine lifeby approximately five years. For ore grades under 3 g/t Au, energy consumption increases ascumulative production rises, leading to negative progress ratios. The positive progress ratio isdue to the increment in ore grade. For the ore grades ranging between 3 and 6 g/t Au energyconsumptions vary for each mine, but the general trend is a decreasing in energy consumptionwhen cumulative production grows. Consequently, a null progress ratio is presented. Availabledata from 2005 through 2007, is shown in Fig. 3.11.
-‐20%
-‐15%
-‐10%
-‐5%
0%
5%
2006 2007
Progress Ra*
o (%
)
Sadiola
Yatela
Morila
Figure 3.11: Progress ratios for gold mines in Mali.
3.5.11 Mexico
San Dimas Mine belonging to Primero Mining (2013) consists of five ore zones or blocks whereunderground gold and silver mining operations are carried out using mechanized cut-and-fillmining methods, with LHD equipment feed-ing either truck or rail haul to the mills. Aftermilling, cyanidation, zinc precipitation and smelting, doré bars are poured and then trans-ported to refineries in the United States. Over the last ten years investments have been made tosignificantly upgraded tailings management, increasing production and achieving a lower coststructure in the future. Besides, in 2005, crushing capacity was increased, as well as improve-ments to the chemical treatment and leaching area. Energy consumption increases althoughcumulative production grows and ore grade increases, but there is a change in 2005 where areduction in energy requirements is presented despite the fact that ore grade decreases due tothe improvement in the processes indicated above. Nevertheless, a negative progress ratio ispresented. Available data from 2004 through 2006.
3.5.12 Namibia
Navachab gold mine recovers 85% of gold, according to AditNow (2013). After CIP extraction,elution and smelting, the unrefined bullion is sent to Switzerland, where it is refined. Energyconsumption increase through the time due to the decline in ore grades, leading to a negativeprogress ratio. Available data from 2005 through 2007.
64
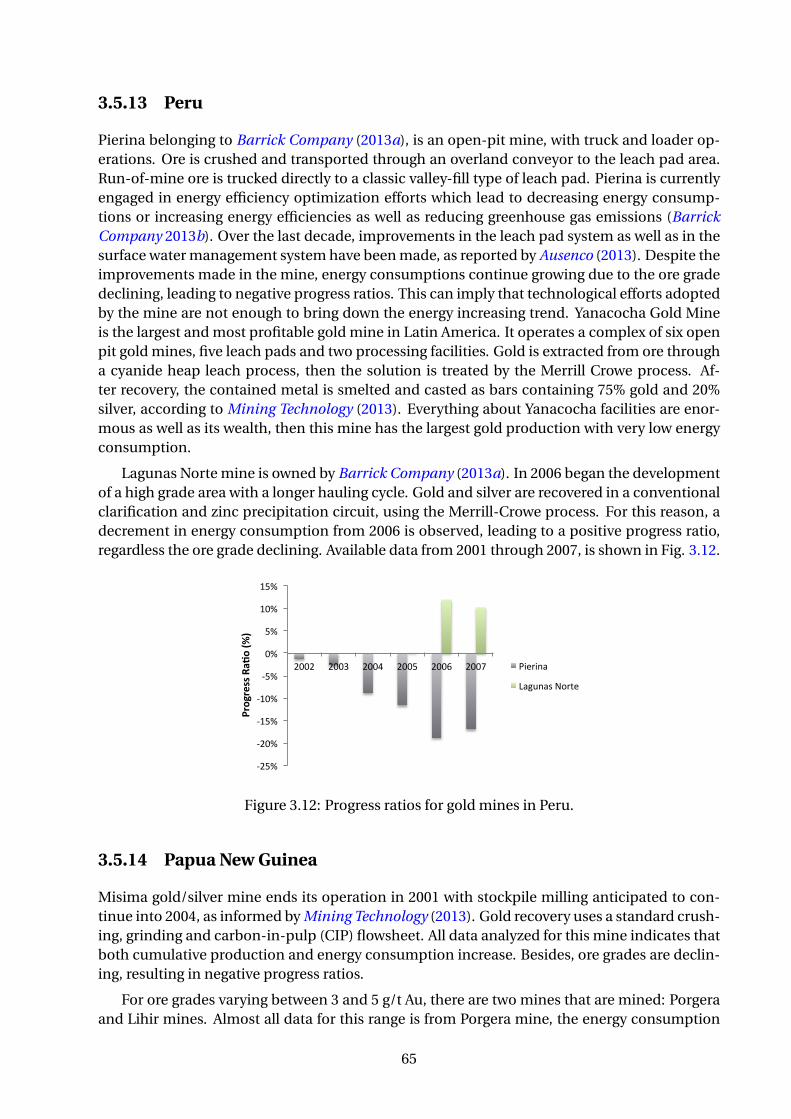
3.5.13 Peru
Pierina belonging to Barrick Company (2013a), is an open-pit mine, with truck and loader op-erations. Ore is crushed and transported through an overland conveyor to the leach pad area.Run-of-mine ore is trucked directly to a classic valley-fill type of leach pad. Pierina is currentlyengaged in energy efficiency optimization efforts which lead to decreasing energy consump-tions or increasing energy efficiencies as well as reducing greenhouse gas emissions (BarrickCompany 2013b). Over the last decade, improvements in the leach pad system as well as in thesurface water management system have been made, as reported by Ausenco (2013). Despite theimprovements made in the mine, energy consumptions continue growing due to the ore gradedeclining, leading to negative progress ratios. This can imply that technological efforts adoptedby the mine are not enough to bring down the energy increasing trend. Yanacocha Gold Mineis the largest and most profitable gold mine in Latin America. It operates a complex of six openpit gold mines, five leach pads and two processing facilities. Gold is extracted from ore througha cyanide heap leach process, then the solution is treated by the Merrill Crowe process. Af-ter recovery, the contained metal is smelted and casted as bars containing 75% gold and 20%silver, according to Mining Technology (2013). Everything about Yanacocha facilities are enor-mous as well as its wealth, then this mine has the largest gold production with very low energyconsumption.
Lagunas Norte mine is owned by Barrick Company (2013a). In 2006 began the developmentof a high grade area with a longer hauling cycle. Gold and silver are recovered in a conventionalclarification and zinc precipitation circuit, using the Merrill-Crowe process. For this reason, adecrement in energy consumption from 2006 is observed, leading to a positive progress ratio,regardless the ore grade declining. Available data from 2001 through 2007, is shown in Fig. 3.12.
-‐25%
-‐20%
-‐15%
-‐10%
-‐5%
0%
5%
10%
15%
2002 2003 2004 2005 2006 2007
Progress Ra*
o (%
)
Pierina
Lagunas Norte
Figure 3.12: Progress ratios for gold mines in Peru.
3.5.14 Papua New Guinea
Misima gold/silver mine ends its operation in 2001 with stockpile milling anticipated to con-tinue into 2004, as informed by Mining Technology (2013). Gold recovery uses a standard crush-ing, grinding and carbon-in-pulp (CIP) flowsheet. All data analyzed for this mine indicates thatboth cumulative production and energy consumption increase. Besides, ore grades are declin-ing, resulting in negative progress ratios.
For ore grades varying between 3 and 5 g/t Au, there are two mines that are mined: Porgeraand Lihir mines. Almost all data for this range is from Porgera mine, the energy consumption
65

grows as cumulative production does, whilst progress ratios vary according to the ore gradechanges. For the interval within 5 and 6 g/t Au of ore grade, Porgera mine reveals a slightlytrend of ore grade decrease, whilst cumulative production increase. The result is a decreasingtendency of energy consumption prompting a positive progress ratio.
The Porgera gold mine is operated by a Barrick subsidiary. According to Mining Technology(2013), both open-pit and underground mining methods are employed because it was initiallyan underground operation until 1997, but was resumed in 2002. Additionally an open-pit min-ing became increasingly important from 1993. A lot of changes have been made into the miningprocesses. For instance, the open pit has been mined in five stages, with final-stage overburdenremoval taking place during 2001. The open-pit truck and shovel fleet was expanded in 1995and 1997. Besides, in 1999 a flotation expansion was installed as well as and additional oxygencapacity to increase autoclave throughput. Run-of-mine ore is crushed and ground, then goldis recovered in a gravity circuit and flotation is used to recover a sulphide concentrate beforethe applying of CIP cyanide leaching process. The final step is the electrowinning process thatproduces bars of 88% gold average.
The Lihir gold mine is an open-pit mine consisting of two adjacent overlapping pits. Its op-erations include; crusher, SAG and ball mill circuit, flotation circuit, pressure oxidation and CILprocessing facilities, and electrowinning and smelting facilities to produce gold dorè (GlobalInfomine 2013). Available data from 1997 through 2007, is shown in Fig. 3.13.
-‐10%
-‐8%
-‐6%
-‐4%
-‐2%
0%
2%
4%
6%
8%
1998 1999 2000 2001 2002 2003 2004 2005 2006 2007
Progress Ra*
o (%
)
Misima
Porgera
Lihir
Figure 3.13: Progress ratios for gold mines in Papua New Guinea.
3.5.15 South Africa
In South Africa the data are from the following mines: Harmony Group, Vaal River, Beatrix,Driefontein, South Deep, Kloof and West Field. Gold Fields company owns Beatrix, Driefontein,South Deep and Kloof.
Beatrix Gold Mine owned by Gold Fields (2013) consists of four surface operating shafts thatmine various gold bearing reefs from open ground and pillars. Ore is processed at two met-allurgical plants, where milling, CIL process, elution and gravity circuits, electrowinning andsmelting operations are carried out.
Driefontein Gold Mine owned by Gold Fields (2013) includes eight shaft systems that minevarious gold bearing reefs from open ground and pillars. Ore extracted from the bearing reefs isprocessed at three metallurgical plants. It has a centralized elution and carbon treatment facil-ity since 2001. The mineral processing technology was based on SAG milling circuit followingby a cyanide leaching until the year 2003, when the-se processes were replaced by the CIP plant.
66

Kloof Gold Mine owned by Gold Fields (2013) is composed of five shaft systems and twogold plants, the gold is produced from a combination of underground mining and processingof surface waste rock dump material. For the mineral processing, two operational metallurgicalfacilities are used, including a central elution and smelting facility. In 2001 and ACC Pump CellCIP circuit was installed to replace the less efficient drum filtration and zinc precipitation. Also,the upgrade included the installation of continuous electrowinning sludge reactors.
South Deep Gold Mine owned by Gold Fields (2013) incorporates two shaft systems thatmine various auriferous conglomerates from open ground and pillars. The ore is processed at acentral metallurgical plant. The mineral processing includes a milling circuit SAG, a CIP circuit,an elution system to finally recover gold by electrowinning and smelting processes.
Great Noligwa underground gold mine is situated close to the Vaal River, it comprises fourgold plants, one uranium plant and a sulphuric acid plant. Great Noligwa has its own millingand treatment plant which applies conventional crushing, screening, grinding and CIL pro-cesses to threat the ore and extract the gold, as informed by Mining Technology (2013).
Harmony (2013) Group in South Africa include the next mines: Bambanani, Doornkop,Kusasalethu, Evander, Joel, Kalgold, Masimong, Phakisa, Phoenix, Target, Tshepong and Vir-ginia . Sometimes the value of ore milled is too large compared with the values of other minesin the same ore grade scope. Therefore, it is probably that these data are referred to severalmines. West Wits Operations include Driefontein, Kloof and South Deep.
Harmony Group reports the highest energy consumption value, leading to a negative progressratio. For ore grades from 6 to 7 g/t Au, the only existing mine is Kloof, which shows an increasein the energy consumption for the same ore grade value from 2004 to 2008, therefore a nega-tive progress ratio is shown. Data in the span between 8 and 9 g/t Au is from West Wits Field,even though ore grade decrease, energy consumption decrease too, leading to a null positiveprogress ratio. Available data from 2003 through 2008, is shown in Fig. 3.14.
-‐35%
-‐30%
-‐25%
-‐20%
-‐15%
-‐10%
-‐5%
0%
5%
10%
2003 2004 2005 2006 2007 2008
Progress Ra*
o (%
) Harmony Group
Beatrix
Driefontein
Kloof
West Wits Field
South Deep
Vaal River
Figure 3.14: Progress ratios for gold mines in SA.
3.5.16 Tanzania
North Mara gold mine consists of three open pit deposits and belongs to Placer Dome Com-pany. AngloGold Ashanti (2013) owns Geita gold mine, which began production in 2000. Geitais a multiple open-pit operation with underground potential. For ore grades between 3 and 5g/t Au, most of the data is from North Mara, during 2003 and 2004 the ore grade is the same but
67

the energy consumption differ greatly, almost by a 50%, the same situation is repeated for years2005 and 2007, despite of the-se observations, there is a declining trend in energy consumption,resulting in a positive progress ratio of 12%.
Tulawaka Gold mine consists of a completed open pit mine with an underground accessramp, an ore stockpile area and crushing plant, a processing plant. The ore processing methodincludes SAG, gravity recovery and CIL (Global Infomine 2013). It is the only mine which reportdata in the span of 9 and 14 g/t Au, within this large ore grades the energy consumption falls ascumulative production increase, hence a positive progress ratio of 11% is shown.
Bulyanhulu Mine is owned by Barrick Gold Corp. Bulyanhulu is an underground tracklessoperation using long hole and drift and fill as its principal toping methods (Gold mining inTanzania 2013). It shows a clear downtrend in ore grade that results in an energy consump-tion increase as cumulative production rises. However, due to the fact that ore grade vary fromone year to another without a clear trend of increase or de-crease and this variation is not sig-nificant, the progress ratio is positive. Available data from 2001 through 2007, is shown in Fig.3.15.
-‐40%
-‐30%
-‐20%
-‐10%
0%
10%
20%
30%
2002 2003 2004 2005 2006 2007
Progress Ra*
o (%
)
Geita
North Mara
Tulawaka
Bulyanhulu
Figure 3.15: Progress ratios for gold mines in Tanzania.
3.5.17 United States
Barrick Company (2013a) in USA owns several mines. Bald Mountain mine is an open pit, run-of mine with conventional heap leaching technology and carbon absorption for ore treatment.Cortez mine is mined by conventional open-pit methods. It employs three different metallurgi-cal processes to recover gold. Lower-grade oxide ore is heap leached, while higher grade ore istreated in a conventional mill using cyanidation and a CIL process. Heap leached ore is hauleddirectly to leach pads for gold recovery.
Golden Sunlight mine is mined by conventional open-pit methods. The ore treatment plantuses conventional CIP technology as well as San Tailing Retreatment (SRT). Goldstrike complexincludes an open pit mine and two underground mines. The open pit is a truck and shovel oper-ation using large electric shovels. While one of the underground mines is a high grade ore bodywhich is mined by transverse longhole stoping, underhand drift and fill mining methods, whilethe other is a trackless operation, using two different underground mining methods: longholeopen stoping and drift and fill. Also, it consists of two processing facilities that are used for boththe surface and underground operations: (1) an autoclave circuit and (2) the roaster.
Marigold mine is an open-pit operation that uses heap-leaching to process its ore. RoundMountain mine is a conventional open-pit operation that uses multiple processing methods
68

including crushed ore leaching, run of mine ore leaching, milling of higher grade ore and thegravity concentration circuit.
Turquoise Ridge mine uses underhand cut and fill mining methods. Ore is transported to anexternal mill for processing. The refractory gold ore is treated by pressure oxidation technologyand gold is recovered using conventional CIL technology.
Cripple Creek Victor JV gold mine is a low-grade, open pit operation. The ore is treated usinga valley-type, heap leach process with activated carbon used to recover the gold. The resultingdoré buttons are shipped to a refinery for final processing, according to Mining Technology(2013).
Fort Knox mine belonging to Kinross (2013) is an open pit mine, that uses as processingmethods CIP mill, heap leach and gravity. According to Mining Technology (2013), productionfrom heap leach began in late 2009. Ridgeway underground mine produces gold and copper.It is in the process of transitioning from the sub-level cave to a block cave beneath the existingmine. Crushed ore from the underground is delivered by conveyor to a surface stockpile; then,gold and copper are recovered in a conventional floatation circuit to produce a copper concen-trate containing elevated gold levels. The next step is to pump to the filtration plant where it isdewatered prior to being transported to export to smelters throughout East Asia.
Wharf owned by Goldcorp (2013) is an open pit and heap leach mine that has been in op-eration since 1983. Global Infomine (2013) state that Barneys Canyon gold mine is an open pitmine that started production in 1989. Mining and milling ended in 2001. Gold production fromstockpiles continued until 2005. The Kettle River-Buckhorn gold mine belonging to Kinross(2013), was originally conceived as an open pit mine, but then it was redesigned and developedas an underground mine. The primary mining method employed is cut and fill. Its ore is pro-cessed through milling, flotation and CIP processes. Pogo gold mine is an underground minethat utilizes a cut and fill drift method. The milling operation includes grinding, sulfide flota-tion, paste thickening, leach/CIP, cyanide detoxification, tailings filtration and gravity recovery(Global Infomine 2013).
Open pit mining in USA is characterized by negative progress ratios, but underground min-ing using CIL and CIP shows positive progress ratios. Available data from 2002 through 2007, isshown in Fig. 3.16.
-‐80%
-‐70%
-‐60%
-‐50%
-‐40%
-‐30%
-‐20%
-‐10%
0%
10%
20%
30%
2002 2003 2004 2005 2006 2007
Progress Ra*
o (%
)
Round Mountain
Marigold
Bald Mountain
Cripple Creek-‐Victor JV
Golden Sunlight
Cortez
Fort Knox
Wharf
Goldstrike
Turquoise Ridge
Pogo
Figure 3.16: Progress ratios for gold mines in United States of America.
69

3.6 Progress ratios in the gold mining industry
Assuming that all mines of the same kind of operation as well as recovery process for a specificcountry are comparable, progress ratios can be presented as Fig. 3.17 displays. Average progressratios obtained between different operation and recovery processes ranged from + 20% to –22%.
Australia has an excellent progress ratio when CIP technology is used either in open pit orunderground mines. This can imply that gold mining industry in Australia has overcome thedeclining in ore grades through technological learning. A compilation of the best practices andall mining process in general would be very useful for mines using the same recovery processaround the world. The sharing of operational and technical experiences, with countries suchas Papua New Guinea would be an excellent way to improve the efficiency in the gold miningsector.
For the United States, positive progress ratios can be observed when underground miningis performed (either when CIP or CIL process are applied). Hence, the relevant fact here is thekind of mining operation used: underground. Performance benchmarking of gold mines inCanada can be a worthwhile action to improve practices in the gold mining industry.
In South America, countries like Argentina and Brazil show great positive progress ratiowhen operations in open pit mines with heap in leach technology as recovery process is em-ployed. Again, it would be very useful an extended compilation of their best practices in orderto share this information with countries that have mines with the same geological and techno-logical characteristics, such as mines in Peru.
3.7 Summary
In this chapter the influence of technical development and declining ore grades on the avail-ability of world gold resources has been studied, applying the learning curves approach andestimating progress ratios for each country. The latter allowed to identify mines in which min-ing operations have proved to be successful when the goal is to save energy. Therefore theseestimates can be used to point out best mining practices and serve as a reference for othermines with similar conditions. Results for Australia gold mining industry were published inValero, Valero & Domínguez (2011), afterwards results for global gold mining were published inDomínguez & Valero (2013).
It should be pointed out, that the improvement in mining technologies, represented in thissurvey by the progress ratios calculated for different countries, mines operations and recov-ery processes are not related to time or cumulative production as it happens to conventionalapplications (such as manufacturing) when the theory of learning curves is applied. In the min-ing sector, an additional factor needs to be taken into account, and that is the key variable oregrade change. The learning effect is measured in terms of reduction in the energy requirementsof mining operations. This way, an improvement in the energy efficiency of the processes doesnot necessarily imply an overall energy reduction, since the decrease in the ore grade may dom-inate.
General results suggest that although progress in technology has been made, in most casesenergy requirements are increasing, because the main variable is the ore grade. Therefore, it canbe asserted that technology cannot in general avert the rising energy demand for gold mining
70

Figure 3.17: Progress ratio for different recovery process and countries in gold mining industry.
71

in the future if no major changes are performed in gold mines around the world. Hence, en-ergy consumptions will continue to increase threatening the capability to fulfill the prospectivedemand.
It is crucial to analyze carefully those countries that are and will be the major gold pro-ducers such as Australia, South Africa, Russia, Chile, United States and Indonesia. The dataanalyzed reveals that South Africa and Australia show the greatest energy consumptions andhence should increase their efforts in improving their mining practices. Additionally, due tothe strategic position of China in the gold mining industry, analyzing its data sets in energyconsumptions and ore grades would be also very interesting and profitable.
This analysis allow us to have a more suitable understanding of the mining sector and theoutcomes of technology evolution together with ore grade declining. Furthermore, this analysislets us understand the general trends in resource consumption in the mining industry by meansof identifying best mining practices around the world. Learning models can be used to surveythe effect of policies and research and development resources applied in the mining sector inorder to accelerate technical progress. Nevertheless, the accuracy of the estimated learningrates and progress ratios remains a major issue.
This chapter closes the analysis of energy consumption in the mining industry performed inthis thesis. Hence, the next chapter presents an overview of thermodynamics and the method-ologies that can be used to analyze mining industry from a thermodynamic point of view.
72

Chapter 4
Thermoeconomic Analysis
The aim of this chapter is to provide the thermodynamic background to assess mineral re-sources and their corresponding mining and metallurgical processes. Particularly, it introducesThermoeconomics, the Thermoecological cost and the Exergoecological approach, which willbe later combined so as to adequately cover the requirements of the mining industry.
4.1 Thermodynamics and the evaluation of natural resources
The use of thermodynamics to evaluate natural resources began with Georgescu-Roegen (1971)who draw on the idea of entropic degradation as a fundamental restriction for economic ac-tivity. He pointed out that the increasing rates of extraction of natural resources, leads to theentropic degradation of the earth. Afterwards, authors such as Naredo (1987) and Cleveland& Ruth (1997) studied the implications for material and energy use in economic developmentand the ecological systems, taking into account thermodynamic constraints. Within this re-search line, in Naredo & Valero (1998), Valero proposed a new approach to calculate the exergyreplacement cost of natural resources. This method based on exergy has led several researchworks which in turn have given birth to two new disciplines: Physical Hydronomics and Physi-cal Geonomics.
The former is concerned with water analyzes. The first study on this topic was performed byZaleta et al. (1998), who applied the methodology to the water of a river. Martinez (2009) refinedthe methodology for undertaking exergy cost assessments of water bodies. Physical Geonomicsmeanwhile, is concerned with mineral analysis. In this respect, an exergy cost analysis of theEarth’s mineral wealth was firstly accomplished by Ranz (1999). Later on, Botero (2000) car-ried out an exergy assessment of natural resources (including minerals, water and fossil fuels)and Valero Delgado (2008) performed a research work focused on the exergy evolution of themineral capital on Earth which has led to many publications in this field (see section 4.6). Thisthesis continues with this research line with the aim of addressing unresolved issues that re-mained open in Valero Delgado (2008) such as the assessment of the exergy cost and ore gradein global mining.
A brief review of thermoeconomic concepts taken from Valero & Lozano (1994) are pre-sented in the next section, so as to give an overview of the different tools used in this thesis.
73

4.2 Fundamentals of Exergy Analysis and Thermoeconomics
The exergy analysis is based on both the first and second laws of thermodynamics. Its aimis to calculate the useful energy associated with a thermodynamic system or with each flowstream in a given process, thereby identifying and evaluating the inefficiencies of the system.Exergy analysis provides two important messages: one is that it allows quantifying and locatingthermodynamic losses. The second is, it allows to concentrate on the relevant part of the energy,namely “useful” energy. These analyzes can solve problems related to complex energy systemsthat could not be solved by using conventional energy analyzes.
Nevertheless, exergy analysis (Thermodynamics) is necessary but not sufficient to deter-mine the origin of losses and the potential for energy saving as will be see in the next sections.Accordingly, it is necessary to include the concept of purpose (Economics) by means of the def-inition of efficiency. Exergy efficiency compares the performance of a real process to an idealone of the same type. The conceptual link between these two disciplines is Thermoeconomics,which is a general theory for energy saving, that integrates thermodynamics (exergy analysis)and economics (exergy cost) by means of the Second Law, for the analysis, optimization anddiagnosis of complex energy systems Lozano & Valero (1993). In this kind of systems, energyflows are easily converted into exergy ones and their value is an indication of quality. Amongother applications, thermoeconomics is used for:
• Rational prices assessment of plant products based on physical criteria.
• Optimization of specific process unit variables to minimize the final product cost, i.e.global and local optimisation.
• Detection of inefficiencies and calculation of their economic effects in operating plants,i.e. plant operation thermoeconomic diagnosis.
• Evaluation of various design alternatives or operation decisions and profitability maxi-mization.
• Energy audits.
4.2.1 Exergy
As already explained, exergy is an adequate thermodynamic property to account for energyquality. The exergy of a thermodynamic flow is the minimum amount of technical work neededfor its production, from a given reference environment. Exergy provides a thermodynamicvalue of any energy stream with respect to reference conditions, and can be rigorously obtainedfrom the laws of thermodynamics, which allows precise measurements. Valero & Torres (2004)argue that exergy may be regarded as a measure of the capacity of a given form of energy toproduce work and is reasonable to assess the price of energy products on the basis of its exergycontent.
Exergy is also a worthwhile concept in Economics. Exergy puts forward an approach to as-sess resource depletion and environmental destruction. Szargut (1993) pointed out that “theconcept of exergy is crucial not only to efficiency studies but also to cost accounting and eco-nomic analysis”. Hence, exergy is a pragmatic tool for evaluating: fuels and resources, process,devices and system efficiencies and their costs, as well as the value and cost of systems outputs.
74

In the absence of nuclear, magnetic, electrical, and surface tension effects, the exergy B canbe divided into four components: physical exergy B PH , kinetic exergy BK , potential exergy BP
and chemical exergy BC H , that is:
B = B PH +B K +B P +BC H (4.1)
The sum of the kinetic, potential, and physical exergies is also referred to as thermo-mechanicalexergy.
4.2.2 Exergy balance
Conventional thermodynamics states that the exergy balance accounts for the degradation ofthe exergy. The incoming exergy will be always greater than the outgoing one:
Exergy Input - Exergy Output = Irreversibilities > 0
As stated in Valero, Uson, Torres & Valero (2010), this expression only points out the exis-tence of irreversibilities within the process. However, Thermoeconomics includes in the equa-tion the concept of purpose by means of an efficiency definition. There is an implicit classifica-tion of the flows crossing the boundary of the system: the production objective, P, the resourcesrequired to carry out the production, F, and those that are residuals or wastes, R. Nonetheless,resources cannot just be associated with input flows, nor the products with output flows. It isnecessary to have a clear idea of what is to be produced before the definition of the efficiency.This way, the exergy balance now becomes:
Ex. Resources(F) - Ex. Products(P) = Ex. Wastes(R) + Irreversibilities(I) > 0
F −P −R = I > 0 (4.2)
And the process efficiency is defined as:
Efficiency = Ex. Product / Ex. Resources
ε= P/F (4.3)
Efficiency measures the quality of a process. This is to say, there is an implicit classificationof the flows crossing the boundary of the system, the flows that are the production objective,and those that are the resources required to carry out the production. Since the exergy of re-sources is greater than that of the products, this efficiency is always positive and less than one.
4.2.3 Exergy Cost
The exergy cost concept proposed by Valero et al. (1986) can be defined as the sum of all re-sources required to build a product from its component parts, expressed in exergy units. The
75

exergy cost of a mass or energy stream is the amount of exergy required to produce it. Almost si-multaneously Szargut & Morris (1987) proposed the cumulative exergy consumption theory (seeSection 4.4). Both concepts represent embodied exergy. In fact, the exergy cost is isomorphouswith the Input-Output analysis (see Appendix B).
The unit exergy cost of a mass or energy stream represents the amount of exergy requiredto obtain a unit of exergy of the product stream. If Bi represents the exergy of the i-th productstream and B∗
i its exergy cost, the unit average exergy cost is written as:
k∗i = B∗
i
Bi(4.4)
The physical cost measured in exergy units of all manufactured products as well as the ex-ergy needed for their use, maintenance, repair and disposal is named Exergy Life Cycle As-sessment and provides average exergy costs because it is focused in obtaining round numberswhich could be used as ecological indexes of sustainability.
4.3 Thermoeconomic Input-Output Analysis
Thermoeconomic Input-Output Analysis is a methodology for the analysis of the productivestructure, and the natural resources consumption process in energy systems. According to Tor-res (1991) it appears as a technique, based on the Exergy Cost Theory, to obtain general equa-tions, which relate the overall efficiency of an energy system and other thermoeconomic vari-ables as fuel, product, exergy cost, with the efficiency of each component which forms it. Bymeans of the equations obtained, it is possible to analyze the influence of the individual con-sumption of each component on the total amount of external resources required to obtain aproduct.
This approach is based on the Input-Output analysis explained in Appendix B. In thermoe-conomics, the input-output table is transformed into a Fuel-Product model, in which the Sec-ond Law of Thermodynamics is used in the analysis of the processes. The Fuel-Product ta-ble (see Table 4.1) represents the productive structure which shows the resources distributionthroughout the plant. The rows represent the destination of the production of each component:as fuel of other components, as disposable waste, or as a primary product of the system. Thefirst row represents the external resources entering the system. Meanwhile, the columns rep-resent the source of the fuel of each component: either coming from the production of othercomponents or as resources coming from outside the boundaries of the system.
Table 4.1: Fuel-Product TableProcess Resources
Final Product 1 · · · j · · · n Total
External Resources B01 · · · B0 j · · · B0n P0
1 B10 B11 · · · B1 j · · · B1n P1...
......
......
......
...
Process Products i Bi 0 Bi 1 · · · Bi j · · · Bi n Pi...
......
......
......
...
n Bn0 Bn1 · · · Bn j · · · Bnn Pn
Total F0 F1 · · · F j · · · Fn
76

According to this representation, the production of a productive component is used as fuelof other components or as a primary product of the system. Mathematically, this could beexpressed as the sum of the element of each fuel-product table row:
Pi = Bi 0 +n∑
j=1Bi j , i = 1, · · · ,n (4.5)
where Pi is the exergy of the process i production, which is used in part to meet the inter-mediate requirement as input resources of other process and in part to meet the final demandof the system, Bi j is the exergy of process i uses as a resource for process j , E0i is the exergyof process i uses as a resource for the final product coming from the exergy of environment 0.Otherwise, the resources entering each component, could be expressed as:
Fi = B0i +n∑
j=1B j i , i = 0,1, · · · ,n (4.6)
where Fi is in part coming from external resources, say B0i , entering to the system, which gointo the i th component. Therefore, the total product and fuel of the system could be expressedas:
PT ≡ F0 =n∑
j=1B j 0 (4.7)
FT ≡ P0 =n∑
j=1B0 j (4.8)
The fuel and product Eqs. (4.5 - 4.6) could be rewritten in terms of exergy cost as:
P∗i = B∗
i 0 +n∑
j=1B∗
i j , i = 1, · · · ,n (4.9)
F∗i = B∗
0i +n∑
j=1E∗
j i , i = 0,1, · · · ,n (4.10)
where B∗i j denotes de exergy costs of the flow Bi j , and P∗
i and F∗i are the cost of product and
fuel of process i , respectively.
The Fuel-Product model provides two possible representations, the Demand driven model,from product to fuel (PF) and the Supply driven model, from fuel to product (FP), introduced innext sections.
4.3.1 The Demand Driven Model
The analysis of any system requires studying the behavior of the productive structure as a func-tion of the total production or demand objectives. The demand driven model relates the ther-moeconomic variables of the system with the total plant product, the efficiency of its compo-nents, and a new type of parameter called junction ratio.
77

The junction coefficients ri j , are the portion of the resources of the j th component comingfrom the i th product, expressed as:
ri j =Bi j
F j(4.11)
that verifies the sum of all junction ratios of a component is equal to one:
n∑i=0
r j i = 1 (4.12)
Applying Eq. 4.11 to Eq. 4.5 could be written as:
Pi = Bi 0 +n∑
j=1ri j P j i = 1, · · · ,n (4.13)
As stated by Valero, Uson, Torres & Valero (2010), the exergy balance expressed by Eq. 4.2,is the point in understanding the difference between the Input-Output quantity model and theThermoeconomic approach. The only numeraire (kg, m3, kJ, ...) defining F , P and R that satis-fies the Second Law Analysis is exergy. Since all elements in the fuel-product table are measuredin the same quantity exergy, it is possible to add not only the rows (products) but also columns(fuels) for each component and compare them.
In matrix notation, Eq. 4.13 may be compacted and expressed as:
P = Ps +⟨K P⟩P (4.14)
The vector Ps (nx1) contains the exergy values of the final product obtained in each compo-nent, and ⟨K P⟩ is a (nxn) matrix which elements are the junction coefficients ri j . The matrix⟨K P⟩ is, in the input-output methodology, the matrix of direct requirement (A) because it showsthe quantity of product i required directly in the production of one unit of process j , and thetechnical coefficients could also be considered as unit exergy consumptions.
Therefore, the production of each process could be expressed as:
P = |P⟩Ps wher e |P⟩ = (UD −⟨K P⟩) (4.15)
The matrix |P⟩ is called, in the input-output methodology, the Leontief inverse matrix (L),and its elements, say pi j represents the total production requirement of process i in the pro-duction of a unit of process j , both direct and indirect.
The cost of the resources used in each component is given by:
k∗P = ⟨K P⟩k∗
P +κe (4.16)
where κe is a (nx1) vector that represents the known cost of the external resources enteringthe components. Likewise, the unit exergy cost of each process as a function of the local unitexergy consumptions of all the processes of the system is:
k∗P = t |K P⟩κe (4.17)
78

In the input-output methodology presented in Appendix B, κe corresponds to b, whilst k∗P
is the unit cost c.
4.3.2 The Supply Driven Model
The supply driven model allows to obtain all flows of the productive structure of the systemstarting from the external resources, those consumed by the system from the environment.
It is based on the distribution coefficients yi j , which are the portion of the production of thej th used as resources in the i th component, expressed as:
yi j =B j i
P j(4.18)
and verifies that the sum of all distribution ratios of a component is equal to one:
n∑i=0
y j i = 1 (4.19)
Applying Eq. 4.18 to Eq. 4.6 could be written as:
Fi = B0i +n∑
j=1yi j P j i = 1, · · · ,n (4.20)
The previous Eq. 4.20 could be written in matrix notation as:
F = Fe +⟨F P⟩P (4.21)
The vector Fe (nx1) contains the exergy values of the external resources for each compo-nent, and ⟨F P⟩ is a (nxn) matrix which elements are the distribution coefficients yi j .
Therefore, the production exergy cost of all the process of the system, as a function of theexternal resources and the distribution ratios, could be expressed as:
P∗ =t ⟨P∗|Fe wher e ⟨P∗| = (UD −⟨F P⟩)−1 (4.22)
4.4 Thermoecological Cost (TEC)
In this section the Thermo-ecological cost method is introduced, which will be used in Chapter6 to analyze the mineral processing of several metals. The Thermo-ecological cost derives fromSzargut et al. (1988a) where the cumulative exergy consumption concept is defined as the cu-mulative consumption of non-renewable exergy connected with the fabrication of a particularproduct with additional inclusion of the consumption resulting from the necessity of compen-sation of environmental losses caused by rejection of harmful substances to the environment.The thermo-ecological cost is in essence the same concept of the exergy cost proposed by Valeroet al. (1986) which can be defined as the sum of all resources required to build a product fromits component parts, expressed in exergy units.
79

The TEC index is calculated by solving a system of linear input-output equations (Eq.4.23),in order to determine the exergy cost for the j th process within the bounds defined by the pro-cess under study as Fig. 4.1 depicts. It should be noted that in the case of TEC the boundaryreaches up to natural resources deposits.
Figure 4.1: TEC balance equation. Piekarczyk et al. (2012).
Recently, the TEC methodology has been further developed in Szargut et al. (2002). This newapproach states that differentiation between the TEC resulting from fuel or non-fuel mineralresources is worthy. This is because fuel resources could be substituted by renewable naturalresources, yet non-fuel minerals cannot be easily replaced by any other resource. Moreover, itis important to keep in mind that current technology allows only for partial substitutions of fueland material resources, whilst recycling processes allows to recover only some of the mineralresources at their end of life.
The first set of equations used to perform the balance of Thermo-Ecological Cost for a sys-tem, like the one presented in Fig. 4.1, is expressed as:
ρ j +∑
i( fi j −ai j )ρi =
∑f
b f j +∑m
bm j +∑k
pk jζk (4.23)
where ρ j is the specific TEC of a main product j th of the considered process, ρi is the spe-
80

cific TEC of a raw material or semi-finished product i th of the considered process, fi j is thecoefficient of production of the i th by-product per unit of the j th main product, ai j is the co-efficient of consumption of the i th raw material and semi-finished product per unit of the j th
main product, b f j is the exergy of the fuel ( f ) and bm j is the exergy of the mineral (m) immedi-ately extracted from nature per unit of the j th main product, pk j is coefficient of the productionof the k th rejected harmful waste product per unit of the j th main product, and ζk is the TEC ofcompensation of the deleterious impact of the k th rejected waste product.
Distinctness of the TEC into a fuel part T EC f and mineral part T ECm allows to identify thekind and amount of exergy consumed in the course of the production process. Accordingly, it isnecessary to include a second set of equations used to determine the fuel part of TEC throughthe expression:
z jρ j +∑
i( fi j −ai j )ziρi =
∑f
b f j +∑k
pk j zkζk (4.24)
where z j is the fraction of TEC of a main product j th due to fuel consumption and zi isthe fraction of TEC of a raw material or semi-finished product i th due to fuel consumption.The fraction of TEC of a raw material or semi-finished product i th due to mineral consumptiondoes not appear in Eq. 4.24 because this equation is evaluating only the fuel part. Hence, thefraction of TEC of a main product j th due to mineral consumption will be the difference (1-z j ),whilst (1-zi ) will be the fraction of TEC of a raw material or semi-finished product i th due tomineral consumption.
Szargut (1986) proposed that the TEC part due to rejections of harmful substances to thenatural environmental can be assessed by means of:
ζk = B wk
GDP +∑k
Pk wk(4.25)
where ζk is the Thermo-Ecological Cost due to the emission of a unit of the k th waste prod-uct, B is the exergy extracted per year from the domestic non-renewable natural resources, wk
is a monetary index of harmfulness of k th substances, GDP is the Gross Domestic Product andPk is the nominal flow rate of the k th deleterious waste product rejected to the environment.
Finally, the TEC can be the basis for determining the index of sustainability which expressesthe ratio between Thermo-Ecological Cost of the useful i th product and its specific chemicalexergy:
ri = ρi
bi(4.26)
A lower index of sustainability means fewer cumulative exergy consumption of natural re-sources per unit of exergy of a given useful product. Accordingly, the lower the index of sustain-ability, the better the product from an ecological point of view.
81

4.5 Similarities and differences between Thermoecological Costand Thermoeconmic Input-Output Analysis
As aforementioned, the exergy cost proposed by Valero et al. (1986) in their “General Theory ofExergy Saving” can be defined as the amount of exergy required to produce a mass or energystream. Whilst, the thermoecological cost proposed by Szargut & Morris (1987) almost simul-taneously in their “Cumulative Exergy Consumption Theory” can be defined as the cumulativeconsumption of non-renewable exergy connected with the fabrication of a particular product.Basically, both concepts represent embodied exergy.
The Thermoeconomic Input-Output Analysis is in essence the same concept of the Ther-moecological Cost, which can be defined as the sum of all resources required to build a productfrom its component parts, expressed in exergy units. In fact both are isomorphous with theInput-Output analysis (see Appendix B) as described in section 4.3.
The Eq. 4.13 from thermoeconomic input-output analysis, expresses the same that Eq. 4.23from the thermoecological cost. Here, the exergy of the process Pi is equivalent to the specificthermoecological cost ρ j . Whilst the specific TEC of a raw material or semi-finished producti th of the considered process ρi is analogous to P j . The exergy of the fuel b f j and the exergyof the mineral bm j in the TEC methodology correspond to the exergy of process i coming fromthe exergy of environment E0i . Finally, the junction coefficients ri j , are the coefficient of con-sumption ai j of TEC.
Both, the exergy of the process Pi calculated through the Thermoeconomic Input-Outputanalysis and the Thermoecological cost ρ j , account for the by-products or wastes obtained ina system. The Thermoecological cost perform this analysis through the coefficients of produc-tion of the i th by-product per unit of the j th main product, fi j . The Thermoeconomic Input-Output analysis meanwhile has been applied to develop a method for the allocation of the costof wastes, presented in Agudelo, Valero & Torres (2011). Besides, both methodologies analyzethe emissions related to the use of fossil fuels. The Thermoecological cost has an additionalinclusion of the consumption resulting from the necessity of compensation of environmentallosses caused by rejection of harmful substances to the environment. The ThermoeconomicInput-Output analyze carbon emissions through the abatement costs (Agudelo, Valero & Uson2011). The latter methodology allows to perform an exergy decompostion in order to knowthe contributions of every external resource to each stream of a system, revealing how energyresources are used along productive processes. In the same way, the Thermoecological costmethod performs a differentiation between the TEC resulting from fuel or non-fuel mineral re-sources. However, the TEC can be applied on a regional scale, involving the thermo-ecologicalcost associated with the imported raw materials and semi-finished products.
When the analysis of any system is performed, the matrix system obtained from the Ther-moeconomic Input-Output Analysis can be solved using an Excel spreadsheet. Whilst, the sys-tem of linear input-output equations derived from Thermoecological Cost Analysis requiresa software package used for solution of systems of equations, like EES (Engineering EquationSolver), Matlab, etcetera.
82

4.6 The exergoecology approach and the degraded Earth Tha-natia
The methodologies presented in the previous sections allow to analyze the path “cradle tograve” in a LCA of mining industry, because processes such as raw material extraction, refin-ing, product manufacturing, recycling and disposal can be evaluated. Nevertheless, the “graveto cradle” path still needs to be assessed for an absolute LCA (see Fig. 4.2).
CRADLE�TO�GRAVE
Solar�energy
Thermoecological cost
Services of�productsExergy Exergy
NATURE/CRADLEResources Life cycle of�
a�productAbatementprocesses
EmissionsResidues
THANATIA/GRAVE
WastesEffluentsEmissions
Replacementprocesses
Exergy
GRAVE�TO�CRADLEExergy�replacement cost
Figure 4.2: Conceptual diagram of cradle-to-grave and grave-to-cradle methodologies. Valero& Valero D. (2014).
The exergoecological approach proposed by Valero (1998), Valero et al. (2003) is used forassessing the exergy of any natural resource from a defined dispersed state of the Earth. Con-ceptually, the Exergoecological method allows an evaluation of mineral resources through theExergy Replacement Cost, which is the exergy required to return to the initial state of concentra-tion and composition found in mines, the minerals that have been totally dispersed throughoutthe crust once their useful lives have come to an end. That is to say, the Exergy ReplacementCost quantifies the amount of exergy that man saves when resources are extracted from a mine,instead of from a pool of materials contained in a hypothetical Earth that has reached the max-imum level of deterioration.
The dispersed state is assimilated to an Earth where all fossil fuels have been burnt and allmines have been commercially exhausted and dispersed. The model for this “commercial end”of the planet developed by Valero Delgado (2008), is the Crepuscular Earth model of the theo-retical Earth state Thanatia. It represents a degraded planet with an exhausted atmosphere, hy-drosphere and continental crust. Nevertheless, as opposed to that of the current Earth, the cre-
83

puscular crust contains no mineral deposits with all non-fuel minerals having been extractedand dispersed and all fossil fuels having been burnt. Valero, Agudelo & Valero (2010) assert thatas a consequence, the CO2 concentration of the crepuscular atmosphere is much higher than itis at present. Similarly, all water available in the hydrosphere, except for a tiny 2.5% due to thehydrological cycle as it is now, is saline due to all freshwater and saltwater having mixed. Thecrust model proposed by Valero, Valero & Gomez (2011) is a first approximation of the averagemineralogical composition of the upper crust and provides the composition and concentrationof the most common 294 minerals currently found on Earth. These concentrations representthe lower limit of ore grades, and once it is achieved, the natural exergy of a mine becomes zero(Fig. 4.3). Although closely related the concept of Thanatia should not be mixed up with that ofthe well known Reference Environment (R.E.) commonly used for the calculation of chemicalexergies. For the calculation of ERC, the concentration of all minerals in a dispersed crust arerequired, something which is missing in conventional R.E. That said, the Reference Environ-ment is still required for the assessment of the chemical exergy of minerals and in fact Thanatiahas chemical exergy with respect to the R.E. (see Fig. 4.3).
Figure 4.3: Conceptual diagram of RE and Crepuscular Earth for the evaluation of mineral cap-ital. Valero, Valero & Gomez (2011).
In the exergoecology approach, a resource is not only valued according to its mass or chem-ical composition. Mineral resources are assessed according to its differentiation with the envi-ronment. The greater the ore grade of the mineral with respect to the dispersed state, the greaterits thermodynamic value. This is because the value of a mineral is related with the amount of ex-ergy needed to return it from the depleted state of Thanatia to the conditions of the mine whereit was originally found. Valero & Valero D. (2014) assert that the exergy difference between Tha-natia and the mine increases with the mine’s quality (e.g. with its ore grade) and decrease whenthe mineral deposits become exhausted. At the threshold when all natural resources have beenextracted and dispersed, the planet has lost all its natural bonus. Valero, Valero & Gomez (2011)
84

claim that the mining of highly concentrated mines is “penalised” since they have greater asso-ciated exergy replacement costs. For instance, mines with high-grade ores do not need so muchenergy during the mining and concentration processes, however if ores of high exergy contentare being depleted, inexorably its exergy replacement costs will be high. On the contrary, mineswith low-grade ores require high amounts of energy during the mining and beneficiation pro-cesses, but their exergy replacement costs will remain low. And each time a mine is exploited,that exergy bonus gets lost and is therefore unavailable for future generations.
According to Valero & Valero (2010a), the exergoecology approach is based on two concepts:exergy and exergy cost. The first is defined as the minimum energy required to produce a nat-ural resource with a specific structure and concentration from common materials in the refer-ence environment, and the second accounts for the actual exergy required for accomplishingthe same process with available technology, as shown in Fig. 4.3.
By means of these two concepts, the Exergy Replacement Costs (ERC) were preliminary cal-culated in Valero, Valero & Martínez (2010). The objective of the ERC is thus to determine theexergy bonus that Nature provides by having minerals concentrated in mines instead of havingthem dispersed throughout the Earth’s crust. It can also be used alongside extraction data, toassess how Nature’s stock is being degraded and dispersed by mankind and at which rate.
4.6.1 Reference Environment
As mentioned above, to calculate the chemical exergy of a mineral resource, it is necessary todefine a reference environment (RE). Authors such as Ahrendts (1980), Kameyama et al. (1982),Szargut et al. (1988a) have proposed different references environments. The RE must be deter-mined by the natural environment and is fixed by its chemical composition. The differencesbetween standard chemical exergies of the elements obtained from different RE can be verysignificant. Each RE definition generate different exergies, therefore an appropriate RE is nec-essary.
There are criterion differences between the different RE proposals. For instance, the REproposed by Ahrendts (1980) is based on the chemical equilibrium, however the natural envi-ronment is ar removed from such equilibrium. Kameyama et al. (1982) proposed a referenceenvironment with the criterion of chemical stability, nonetheless the most stable compoundsselected by this author are not the more common in the real environment. The RE proposed bySzargut et al. (1988a) is based on partial abundance, this author select the most stable substanceamong a group of reasonable abundant substances in order to satisfy the “earth similarity crite-rion”. Further information of these RE and other partial RE has been carried out by Ranz (1999)and Valero Delgado (2008).
An appropriate RE to assess natural resources, has been proposed by Valero Delgado (2008).This reference environment is based on that developed by Szargut et al. (1988a) and is an up-dated of the RE proposed by Ranz (1999). The update takes into account new data of the stan-dard chemical exergy of chemical compounds as well as the gaseous, solid and liquid referencesubstances.
85

4.6.2 Assessment of mineral resource depletion
Exergy of mineral resources
The exergy of a mineral resource has at least three components: one associated with its chemi-cal composition (bch), one associated with its concentration (bc ) and one associated with com-minution processes (bcom).
The chemical exergy1 bch of the resource can be calculated by means of an exergy balanceof the reversible formation reaction, as proposed by Szargut et al. (1988a).
bch =∑k
vk b0ch,k +∆Gmi ner al (4.27)
Where b0ch,k is the standard chemical exergy of the elements that compose the mineral, vk
is the number of moles of element k in the mineral and ∆Gmi ner al is the standard normal freeenergy of formation of the mineral (Gibbs free energy). In a recent survey, Valero & Valero (2012)have obtained a database of enthalpy and Gibbs free energy of formation of minerals in orderto calculate thermodynamic properties such as the chemical exergy of about 300 natural sub-stances.
The concentration exergy (bc ), meanwhile, is the minimum amount of energy associatedwith the concentration of a substance from an ideal mixture of two components, was definedby Faber (1984) as:
bc i =−R̄T 0[
l nxi + (1−xi )
xiln(1−xi )
](4.28)
where R̄ is the universal gas constant (8.314 kJ/kmolK), T0 is the temperature of the refer-ence environment (298.15 K) and xi is the concentration of the substance i . The exergy ac-counting of mineral resources implies to know the ore grade which is the average mineral con-centration in a mine xm as well as the average concentration in the Earth’s crust (in Thanatia)xc . The value of x[g /g ] in Eq. 4.28 is replaced by xc or xm to obtain their respective exergies,bc (x = xc ) and bc (x = xm) whilst the difference between them∆bc (xc → xm) represents the min-imum energy (exergy) required to form the mineral from the concentration in the Earth’s crustto the concentration in the mineral deposits as:
∆bc (xc → xm) = bc (x = xc )−bc (x = xm) (4.29)
In the case of concentrating two solids, another term must be added: the variation in cohe-sion exergy between the final and the initial state. Minerals in the crust are commonly embed-ded in a sillicate matrix and its cohesion exergy is its comminution exergy (bcom), or minimumexergy needed to comminute the mineral between two given sizes Valero & Valero D. (2012).Considering that the size of the bare rock of the Crepuscular Earth model dθ is so large com-pared to the geometrical mean size dM of the natural fragments found in the mine, the com-minution exergy cost (b∗
com) of a mineral in a mine of size dM is defined as:
b∗com = 10Wi (1/
p(dM )−1/
p(dθ)) (4.30)
1Chemical exergy is the work that can be obtained by a substance having the parameters T0 and P0 to a state ofthermodynamic equilibrium with the datum level components of the environment (Szargut et al. (1988b)).
86
Where Wi is the Bond work index [kWh/t][µm]0.5. If the differences in size are not substan-tial and the mineral is present in the same sillicate matrix, this comminution exergy variationmay be neglected in a first approach.
Exergy Replacement Cost
From the 2nd Law of Thermodynamics, Eq. 4.28 indicates that as the concentration of the sub-stance tends to zero, the exergy required to separate it tends to infinity. So Thermodynamicsprovides the tendency of the behavior. The real energy required is several orders of magni-tude greater than what the Thermodynamics of reversible processes dictates. In fact, mixingand separating are the most irreversible processes. When salt and sugar are mixed, the energythat is liberated in the mixture is almost imperceptible. If the process were reversible, the sameamount of energy would be required to separate the mixture. But that is obviously not the casein the real world and when this happens in everyday life, it is easier to throw out the mixturethan trying to separate it. Hence, it should be noted that if minerals are assessed solely in exergyterms, the results obtained would be very far removed from “socially accepted” values given tominerals. This is because exergy measures minimum thermodynamic values. Man’s technol-ogy is however very far removed from reversibility conditions and this is why we need to resortto the exergy replacement costs, including the so called unit exergy costs (k). The latter factoris defined as the ratio between the exergy consumed in the real mining process (Er eal pr ocess)used to obtain the mineral from the ore grade xc to the commercial grade xr and the minimumexergy (∆bmi ner al ) required to accomplish the same process, expressed as:
km = Er eal pr ocess
∆bmi ner al(4.31)
Accordingly k is a measure of the irreversibility of man-made processes and amplify mini-mum exergies by a factor of ten to several thousand times, depending on the commodity an-alyzed. Consequently, the Exergy Replacement Cost of a mineral would require k times theminimum exergy, and can be calculated with the following expression:
b∗t = kch ·bch +kc ·bc +b∗
com (4.32)
The exergy replacement cost is defined as the total exergy required to concentrate the min-eral resources from Thanatia, with the best available technologies. Therefore, these are notabsolute and universal values, as opposed to property exergy. Domínguez & Valero (2013) ar-gue that the exergy costs are a function of the extraction and separation technologies, which inturn vary with time, with the type of mineral analyzed, and with man’s ability to extract it, i.e.with its learning curve. See Section 3.4.
For most case studies, the chemical component of Eq. 4.32 is zero because there is no needto chemically produce the mineral from Thanatia again, since the Crepuscular Earth modelalready contains the substance, but at a significant lower concentration. Whilst, the comminu-tion exergy cost of a mineral can be neglected if the differences in size are not substantial, asconsidered in the analyzes carried out in this paper. Therefore, one only needs to account forthe exergy required to concentrate the mineral from the dispersed conditions found in Thana-tia, until the original concentration found in the mines.
As aforementioned, in Eq.4.33 the unit exergy cost k is the ratio between the real cumulativeenergy required to accomplish the real process to concentrate the mineral from the ore grade
87

xm to the commercial grade xr and the minimum thermodynamic exergy required to accom-plish the same process as, it can be expressed also as:
k = E(xm→xr )
∆b(xm → xr )(4.33)
The general procedure to calculate the exergy replacement cost of mineral resources is pre-sented in Fig. 4.4.
Calculation of the theoreticalexergy of the mining and
concentration process from theore grade xm to the refining
conditions xrb(xm->xr)
Assessment of the real mining and concentration
energyxm->xr)
Calculation of unit exergy costs
k(xm)= E(xm->xr)/b(xm->xr)
Extrapolation of unit exergy costs to xc
k(xc)
Calculation of the theoreticalexergy of the concentration
process from the crespuscularconcentration xc to the mine
conditions xmb(xc->xm)
Calculation of the exergy replacement costs (mineral
exergy bonus)b*= k(xc) b(xc->xm)
Figure 4.4: Calculation procedure for obtaining a mineral’s exergy replacement costs. Valero &Valero D. (2014).
The energy required for mining is a function of the ore grade of the mine and of the tech-nology used, thence it can be defined as the unit exergy cost. Moreover, both variables have anopposite effect on the energy used, as Ruth (1993, 1995a,b,c) states. The lower the ore grade,the more energy is required for mining. On the contrary, technological development usuallyimproves the efficiency of mining processes and hence, decrease the energy consumption. Inother words, the unit exergy cost depends on the ore grade (xm) and the time (t) that is con-sidered through the improvements in mining techniques, which in turn are reflected in the realenergy consumptions.
k = k(x, t ) (4.34)
88

Hence, the temporal function k is only definable for the past and for each particular min-eral. It is therefore difficult to extrapolate it towards the future for the practical impossibility topredict changes in the scientific and technological knowledge that will eventually appear.
The second problem with k is that it is not a continuous function. The technology appliedcan also vary with the concentration ranges of a particular deposit. And in turn, each miningtechnique (i.e. underground or open-pit mining), has a particular effect on the energy con-sumption due to different factors such as ore grade, grind size, nature, depth and processingroute. These factors have been analyzed in Norgate & Haque (2010), Norgate & Jahanshahi(2010, 2011), for different commodities such as for copper, nickel aluminium and iron throughthe life cycle assessment methodology.
Bearing in mind these limitations and the kind of data available for mining (which is usuallyvery scarce) in this survey it is assumed that the same technology is applied for the range of con-centration between the ore grade xm in the mine and the refining grade xr , than between thedispersed state of the crepuscular crust xc and xm . This way, an analysis of the average energyvs. ore grade trends for different minerals is carried out, in order to calculate the correspond-ing unit exergy cost values and extrapolate them to ore grades equal to those of the dispersedconditions of Thanatia.
4.7 Summary
In this chapter a brief review of the main thermoeconomic concepts was presented, in orderto introduce the concepts that allow to assess natural resources. In this regard, two method-ologies: Thermoeconomic Input-Output and Thermoecological Cost were explained and com-pared. Both methods will be applied in several case studies of mining and metallurgical in-dustry in Chapters 5 and 6 of this PhD. These methods are used to analyze the path “cradle tograve” in a LCA of mining industry, because processes such as raw material extraction, refining,product manufacturing, recycling and disposal can be evaluated.
Afterwards, the Exergoecology approach and the exergy replacement costs were presentedas tools to evaluate the “grave to cradle” path. In this way, the cycle of natural resource as-sessment is closed and an absolute LCA “cradle-to-cradle” can be performed. The importanceof the exergy replacement costs lies in their ability to establish a scarcity factor of mineral re-sources which should be accounted for, when assessing the sustainability of mining and met-allurgical processes. Accordingly, in next chapter an exergy analysis of mineral resources andmetallurgical systems will be carried out, and the exergy replacement cost of several metals willbe calculated. Additionally, the problem of cost allocation when two or more commodities areproduced in the same mining operation will be settled.
89


Chapter 5
Exergy analysis of mineral resources andmining by-products
This chapter is aimed at providing a thermodynamic outlook of mineral resources and the met-allurgical processes required to produce them. Accordingly, the first objective of this chapteris to analyze the energy requirements as a function of the ore grade, in order to calculate theexergy replacement costs. However, in the mining industry, with each ore, two or more prod-ucts, by-products and residues are produced simultaneously. Hence, the LCA is confrontedwith the difficult and often rather complicated problem of assigning costs to their by-productsand joint products. In this regard, the second objective of this chapter is to develop a new costallocation methodology based on the exergy replacement costs. The final aim is to estimate theexergy cost and eventually economic, technology and environmental bearings of each com-modity produced.
5.1 Introduction to exergy analysis of mineral resources
Future availability of mineral resources is increasingly gaining importance in strategic plans ofgovernments, as it is a high-priority issue for economic development. The availability is notrelated to the quantity of minerals included in the crust. The whole continental crust is com-posed of minerals that could be eventually extracted. Mineral availability is rather related toaccessibility, which in turn is tightly connected with energy consumption. Mining, transport,crushing and grinding, smelting, refining, etc. are all processes that require significant amountsof energy. Notwithstanding, it is important to highlight that energy requirements become animportant issue, because nowadays it comes mainly from non-renewable resources.
An assessment of the energy consumption required to produce commodities can providean overview of the implications needed to achieve sustainability. Authors such as Chapman &Roberts (1983) pointed out that the energy required to produce a metal provided a useful guideto its resource implications. Otherwise, trough different works like those performed by Valero& Valero (2011), Valero et al. (2008), Valero, Valero & Martínez (2010) it has been demonstratedthat exergy analysis is a useful tool to assess natural resources because it takes into accountvariables such as composition, concentration (ore grade), cohesion and the state of technology.
As stated in Chapter 4, section 4.6, the exergy of any natural resource is defined as the min-imum energy required to produce it with a specific structure and concentration from common
91

materials in the reference environment. The exergy of a system gives an idea of its differen-tiation with the environment. The case of a mineral deposit is clear; it has exergy because theminerals contained in it have a specific concentration and composition different from the com-mon bedrock. Hence, the higher the grade of a mineral deposit, the more exergy it has. Hence,minerals can be considered as a carrier of exergy.
When the mineral is mined, the exergy content of the mineral is kept constant, and if it isenriched the exergy content increases. A meager deposit of mineral contains less exergy andwill require a substantial input of external exergy to be utilized. Finally, when a concentratedmineral is dispersed, the exergy content decreases. A mine loses its natural exergy when the oregrade declines through extraction, and becomes zero when this ore grade equals to that of thesurrounding environment.
But exergy only represents the thermodynamic minimum. And this minimum is very farremoved from reality. If mineral resources had to be created and concentrated with currentavailable technology from the bedrock (from Thanatia), much more energy would be required.Accordingly, the first objective of this chapter will be accomplished through the analysis of theenergy requirements as a function of the ore grade in order to calculate the exergy replacementcosts. This will allow to physically assess mineral resources and will give an idea of how far isthe mining industry from sustainability.
5.2 Exergy Replacement Costs of minerals resources
This section appraises the energy requirements for mineral production through an exergy ap-proach taking into account the long-term decline in ore grades. In this context, the exergyreplacement costs are defined as the exergy required for restoring mineral resources from acomplete dispersed state where no deposits exist into the same conditions in which they weredelivered by the ecosystems with the available technology. The exergy replacement cost is thepoint of reference in order to evaluate in a single variable, characteristics such as composition,concentration (ore grade) and the state of technology of mineral resources. With empirical dataof energy requirements in mining as a function of the ore grade, the exergy replacement costsof cobalt, copper, gold, nickel and uranium are obtained. Additionally, a general expression ofmining energy vs. ore grade is derived for those mineral commodities where no empirical datais presented.
The first step in obtaining the unit exergy cost for the commodities analyzed is to obtaintheir real energy consumptions in the mining and concentrating processes (going from xm toxr ) as a function of the ore grade (xm). This information can be obtained from data publishedin the literature. In a parallel way, the theoretical exergy of the same process is calculated asthe difference in concentration exergy (Eq. 4.28) when x = xm and x = xr . A calculation of therefining grade xr requires a careful analysis of the different processes involved in the concen-trating steps. Finally, the unit exergy costs are calculated with Eq. 4.33 as a function of the oregrade. The latter can be extrapolated to obtain the unit costs at the crepuscular grade xc , whichwill eventually serve for calculating the exergy replacement costs of the mineral wealth on Earthwith Eq. 4.32. The values used for the crepuscular grade are those xc published in Valero, Valero& Gomez (2011). Average values for xm have been obtained from several studies such as Cox &Singer (1992), Kellogg (1977), Mudd (2007c, 2010), Norgate & Jahanshahi (2010).
92

5.2.1 Cobalt
Cobalt is mainly produced as a by-product and recovery of other abundant metals such as cop-per, platinum or nickel. In this survey it is considered that cobalt comes mainly from nickelsulphide ore. The energy consumption as function of the ore grade shown in Fig. 5.1 is ob-tained from the data set of Ni-Cu-Co provided by Mudd (2010). The allocation of the energyamong different metals was carried out in Mudd’s study according to their tonnage. Further-more, it was assumed that 60% of the overall energy is consumed for mining and concentratingcobalt from sulphide ore, while 40% for refining1. In addition, it was assumed the same Ex-ergy replacement cost for nickel sulphide ores and for cobalt, since the latter is “free” mineralobtained in nickel production. Accordingly, it is considered that the proportion of Co in Ni-sulphides is 0.07gCo/gNi from the Minara Murrin mine. Consequently the Exergy replacementcosts for cobalt in GJ/tonCo are calculated as the exergy costs for nickel sulphides divided by0.07.
y = 2.2416x-‐0.635
0
5
10
15
20
25
30
0.0 0.5 1.0 1.5 2.0 2.5 3.0 3.5
Concen
tra)
on Ene
rgy [GJ/t]
Ore Grade[%]
Real data set
Concentra:on Energy [GJ/t]
Figure 5.1: Energy requirements for cobalt production form sulphide ores as a function of theore grade. Adapted from Mudd (2010).
5.2.2 Copper
Copper is always associated with other metals, commonly nickel, molybdenum and platiniumgroup metals. Copper in mineral deposits is usually found in nature in association with sul-phur, as chalcopyrite (CuFeS2). This ore has a crustal concentration of xc = 6.64E−05g/g, asreported in Valero, Valero & Gomez (2011). According to Cox & Singer (1992), the average oregrade assumed is xm = 1.67E−02 g/g. Data sets for energy requirements as a function of thecopper ore grade are obtained from the study of Mudd (2010) of sulphidic ores, which contain
1This assumption comes from an extrapolation of published data: according to Botero (2000), the energy re-quirement for mining and concentration is 193 GJ/t, while the energy consumption in the refining process toobtain pure cobalt is reported by Chapman & Roberts (1983) as 129 GJ/t.
93
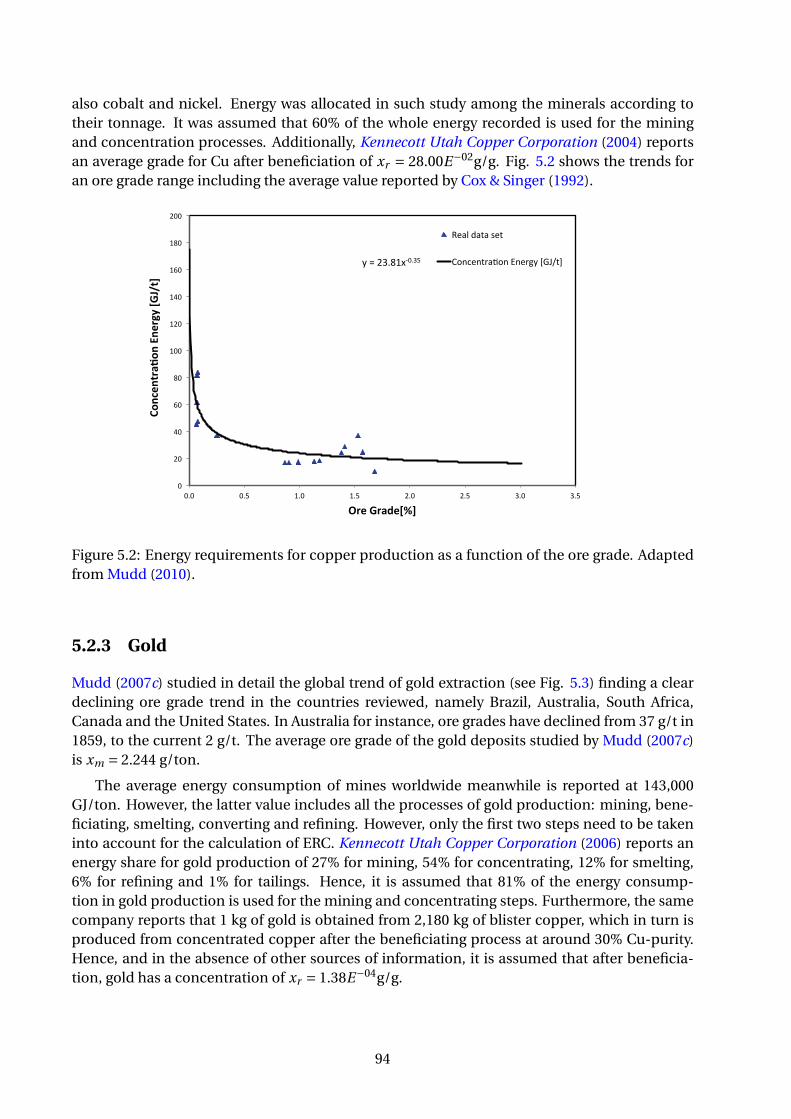
also cobalt and nickel. Energy was allocated in such study among the minerals according totheir tonnage. It was assumed that 60% of the whole energy recorded is used for the miningand concentration processes. Additionally, Kennecott Utah Copper Corporation (2004) reportsan average grade for Cu after beneficiation of xr = 28.00E−02g/g. Fig. 5.2 shows the trends foran ore grade range including the average value reported by Cox & Singer (1992).
y = 23.81x-‐0.35
0
20
40
60
80
100
120
140
160
180
200
0.0 0.5 1.0 1.5 2.0 2.5 3.0 3.5
Concen
tra)
on Ene
rgy [GJ/t]
Ore Grade[%]
Real data set
Concentra;on Energy [GJ/t]
Figure 5.2: Energy requirements for copper production as a function of the ore grade. Adaptedfrom Mudd (2010).
5.2.3 Gold
Mudd (2007c) studied in detail the global trend of gold extraction (see Fig. 5.3) finding a cleardeclining ore grade trend in the countries reviewed, namely Brazil, Australia, South Africa,Canada and the United States. In Australia for instance, ore grades have declined from 37 g/t in1859, to the current 2 g/t. The average ore grade of the gold deposits studied by Mudd (2007c)is xm = 2.244 g/ton.
The average energy consumption of mines worldwide meanwhile is reported at 143,000GJ/ton. However, the latter value includes all the processes of gold production: mining, bene-ficiating, smelting, converting and refining. However, only the first two steps need to be takeninto account for the calculation of ERC. Kennecott Utah Copper Corporation (2006) reports anenergy share for gold production of 27% for mining, 54% for concentrating, 12% for smelting,6% for refining and 1% for tailings. Hence, it is assumed that 81% of the energy consump-tion in gold production is used for the mining and concentrating steps. Furthermore, the samecompany reports that 1 kg of gold is obtained from 2,180 kg of blister copper, which in turn isproduced from concentrated copper after the beneficiating process at around 30% Cu-purity.Hence, and in the absence of other sources of information, it is assumed that after beneficia-tion, gold has a concentration of xr = 1.38E−04g/g.
94

y = 135,664x-‐0,285
0
200000
400000
600000
800000
1000000
1200000
0 10 20 30 40 50 60 70 80 90
Concen
tra)
on Ene
rgy [G
J/t]
Ore Grade [g/t]
Real data set
Concentra=on Energy [GJ/t]
Figure 5.3: Energy requirements for gold production as a function of the ore grade. Adaptedfrom Mudd (2007c).
5.2.4 Nickel
Nickel is always associated with other metals, predominantly copper, cobalt and platinum groupmetals. It is produced from oxidic (laterite and saprolite) or sulphidic ores. Although the ma-jority of economic resources are contained in laterite ores (around 60% vs. 40% for sulphideores), the bulk of historic Ni production has been derived from sulphide ores since lateritesrequire more complex processing (60% of extraction from sulphide vs. 40% from laterite ores).Sulphide ores are predominantly produced by underground mining whilst lateritic ores are gen-erally produced by open pit mining.
It is assumed that the lateritic ore from which nickel is produced is garnierite, which hascrustal concentration of xc = 4.10E−06g/g, reported by Valero, Valero & Gomez (2011). It hasan average ore grade of xm = 4.42E−02 g/g, according to Norgate & Jahanshahi (2010). In IPPC(2009b) the refining grade of laterite ores with a maximum nickel content of 3% is reported asxr = 8E−02 g/g. The energy consumption as a function of the ore grade is obtained from thestudy for sulphidic Cu-Ni-Co ores performed by Mudd (2010) where values from 252 to 572GJ/ton of metal are reported in the re-fining process. A mean value of 412 GJ/ton of nickel isconsidered in this survey.
Otherwise, pentlandite is the sulphidic ore from which most nickel is produced, and has acrustal concentration of xc = 5.75E−05g/g, according to Valero, Valero & Gomez (2011). It hasan average ore grade of xm = 3.36E−02 g/g, reported by Mudd (2010). IPPC (2009b) reports thatnickel concentrates, generally contain 7 - 25% Ni. Assuming a mean value of 16 % results in therefining grade of xr = 4.68E−01 g/g. The energy requirements as a function of the ore grade areobtained from the study of Mudd (2010) for sulphidic Cu-Ni-Co ores.
Figure 5.4 shows the trends of energy consumption as a function of the ore grade for pent-landite. Undoubtedly, the processing of nickel from lateritic ores is more resource intensive
95

than from sulphides, this is a spotlight issue because of the on going increase of nickel miningfrom laterites.
y = 17.01x-‐0.67
0
10
20
30
40
50
60
0.0 0.5 1.0 1.5 2.0 2.5 3.0 3.5 4.0 4.5
Concen
tra)
on Ene
rgy [GJ/t]
Ore Grade[%]
Real data set
Concentra;on Energy [GJ/t]
Figure 5.4: Energy requirements for nickel production as a function of the ore grade. Adaptedfrom Mudd (2010).
5.2.5 Uranium
Uranium is widely distributed, with the most important ores uraninite UO2 and carnotite. How-ever, these are usually dispersed so that typical ores contain only about 0,1% of U contentand many of the more readily exploited deposits are nearing exhaustion. It is assumed thaturaninite is the only U -ore. Valero, Valero & Gomez (2011) calculates a crustal concentration ofxc = 1.51E−06g/g, whilst the average ore grade is xm = 3.18E−03g/g, according to Cox & Singer(1992). The energy data used to obtain the exergy cost for this commodity was provided byMudd & Diesendorf (2008) who did a detailed compilation and analysis of Australian uraniummining (as U3O8) (5.5). The refining grade is assumed at xr = 7.50E−01 g/g, in accordance withGupta & Mukherjee (1990).
96

y = 138.8x-‐0.28
0
100
200
300
400
500
600
700
800
900
0.00 0.05 0.10 0.15 0.20 0.25 0.30 0.35
Concen
tra)
on Ene
rgy [GJ/t]
Ore Grade[%]
Real data set
Concentra=on Energy [GJ/t]
Figure 5.5: Trends of unit exergy costs and concentration energy in uranium mining (data re-ferred to uranium oxide U3O8). Adapted from Mudd & Diesendorf (2008).
5.2.6 Summary of ERC obtained
A summary of all commodities analyzed previously is presented in Table 5.1. It contains themain values for each substance, such as xc , xm and xr along with the equations to calculate theenergy required to mining and concentrating a specific ore, the unit exergy cost and the exergyreplacement cost.
Table 5.1: Exergy Replacement Costs. Values of xc , xm and xr are referred to the assumed min-eral that represents the ores from which the metal is extracted.
E(x)[G J/t ] xc [g /g ] xm [g /g ] xr [g /g ] k(x = xc ) k(x = xm ) Exergy
Replacement
Cost
Cobalt (Linnaeite) E = 2.24x−0.64 5.15E−09 1.90E−03 4.56E−02 10,872
Copper (Chalcopyrite) E = 23.81x−0.35 6.64E−05 1.67E−02 8.09E−01 525 170 110
Gold E = 135,664x−0.285 1.28E−09 2.24E−06 1.38E−04 6,380,357 2,135,879 583,668
Nickel (Sulphide - Pentlandite) E = 17.01x−0.67 5.75E−05 3.36E−02 4.68E−01 13,039 585 761
Nickel (Laterite - Garnierite) E = 2.11x−0.5 4.10E−06 4.42E−02 8.04E−02 876 136 167
Uranium (Uraninite) E = 138.8x−0.28 1.51E−06 3.18E−03 7.50E−01 13,843 3,697 901
As stated before, the unit exergy cost is the ratio between the real energy required for miningand concentrating a substance and the minimum thermodynamic energy (exergy) required toachieve the same process. Hence, it provides a measure for the irreversibility (or technologicalignorance) of the process. Generally, the energy value (nominator) increases more rapidly thanthe exergy one (denominator). An exception of this fact is found for elevated ore grades, wherethe opposite happens. Consequently, the lower the ore grade, the more energy is required formining and concentrating the mineral and the more irreversible is the process.
97

For instance, gold has the highest unit exergy cost value associated to the deposits (whenx = xm) of the metals analyzed in this work, attributable to its low concentration in mines andthe consequent amount of energy needed to concentrate it. Besides, the actual ore grade inmines is close to that in crepuscular Earth’s crust. The opposite example is copper which has alower k value ascribed to its actual high ore grade in mines.
But the state of technology plays also an important role. This fact is highlighted with nickelfrom sulphide ore. Even if its ore grade is similar to that of copper, the elevated value of k is anindicator of the significant irreversibility of the production process.
A particular case is that of nickel and its ores. Historically, the metal was likely obtainedfrom sulphide ores due to the major energy requirement of laterites in the refining process.Nevertheless, more Ni resources are in the form of laterites than of sulphides. But focusingonly in the concentration energy, sulphide ores have larger concentration requirements thanlateritic ores, as revealed by the larger unit exergy costs. However, continuous sulphide oregrade decline, the increasing cost of underground mining coupled to the estimations that in thefuture nickel production will be obtained from lateritic ores in order to fulfil the nickel demand,augur an increase of the energy associated with nickel production.
Of special interest is the value of k(x = xc ). This value multiplied by the minimum exergyrequired to concentrate the mineral from xc to xm represents the amount of energy required tomine and concentrate a substance from the bedrock (from Thanatia) to the current conditionsin the mineral deposits and provides a measure of the exergy that Nature provides “for free”thanks of having minerals concentrated in mines instead of dispersed throughout the crust.The value of the crepuscular unit exergy cost of the different minerals is always greater than thatof the current mineral deposits. The difference increases generally with the separation betweenthe crepuscular grade and the average grade in the deposits. For instance, the crepuscular k-value of gold is in the same order of magnitude than the mine k-value, because the grade ofgold is close to that found in Thanatia. The opposite happens with uranium, which has a smallcrepuscular grade compared to current average ore grades. Therefore its crepuscular k-valueis considerably much larger compared to its unit exergy cost when the average ore grade inU-mines is taking into account.
Finally it is worth to note in Table 5.1 that the energy consumption as a function of the oregrade shows expression varying from x−0.2 to x−0.9. From this observation and recognising thatempirical data for most of the minerals produced in the world is very limited, it is proposedthe following general expression for the exponential curve applied to estimate the energy con-sumption as a function of the ore grade:
E(xm) = A · x−0.5m [xm , metal concentration %] (5.1)
Coefficient A is determined for each mineral since generally, the average ore grade xm andthe energy required for concentrating and extracting the mineral at that grade E(xm) is known.It should be noted that xm values are expressed in Eq. 5.1 as mass percentage of the elementunder consideration. This is a very rough approximation, but it is more in agreement withactual mining behaviour than the equation proposed by Chapman & Roberts (1983), where theenergy is inversely proportional to the ore grade.
The same analysis was carried out for several commodities, which will be used in furtherchapters. Hence, Table 5.2 summarize the exergy replacement cost for different commodities.It can be observed that a mineral has a high exergy replacement cost when 1) the concentration
98

of the mineral in the crepuscular crust (in Thanatia) is low and the difference between the oregrade of the current mines (xm) is high and/or 2) when the energy required to extract the min-eral and beneficiate it is significant. The exergy replacement cost is greater for critical elements(e.g. gold) than it is for those found in abundance (e.g. chromium).
Table 5.2: Exergy Replacement Costs for different commodities. Energy and exergy values areexpressed in GJ/ton of mineral.
Mineral xc [g /g ] xm [g /g ] xr [g /g ] Concentration Smelting Exergy
and beneficiation and refining replacement
energy energy cost
Aluminium (Gibbsite) 1.38E−03 7.03E−01 9.50E−01 10.55 23.87 627
Antimony (Stibnite) 2.75E−07 5.27E−02 9.00E−01 1.4 12 474
Cadmium (Greenockite) 1.16E−07 1.28E−04 3.86E−03 1.4 263.9 278.5
Chromium (Chromite) 1.98E−04 6.37E−01 8.10E−01 0.01 36.3 5
Iron (Hematite) 9.66E−04 7.3E−01 9.5E−01 0.7 13.4 18
Lead (Galena) 6.67E−06 2.37E−02 6.35E−01 0.9 3.3 37
Manganese (Pyrolusite) 4.90E−05 5.00E−01 6.71E−01 0.2 57.4 16
Molybdenum (Molybdenite) 1.83E−06 5.01E−04 9.18E−01 136 12 908
Phosphate rock (Apatite) 4.03E−04 5.97E−03 9.00E−01 0.3 4.6 0.4
Silver (Argentite) 1.24E−08 4.27E−06 9.00E−01 1281.4 284.8 7371.4
Zinc (Sphalerite) 9.96E−05 6.05E−02 7.90E−01 1.5 40.4 25
Rare Earth Metals
Cerium (Monazite) 1.03E−04 3.00E−04 8.0E−01 523.05 56.1 43.47
Gadolinium (Monazite) 1.03E−04 3.00E−04 9.5E−01 3607.25 43.05 115.23
Lanthanum (Monazite) 1.03E−04 3.00E−04 8.0E−01 296.75 53.45 16.77
Neodymium (Monazite) 1.03E−04 3.00E−04 8.0E−01 591.7 53 31.88
Praseodymium (Monazite) 7.10E−06 3.00E−04 8.0E−01 296.28 55 124.37
Yttrium (Monazite) 1.03E−04 3.00E−04 9.5E−01 1198.25 47.6 32.01
5.3 Introduction to Exergy Cost Allocation of by-products in themining industry
The long-term availability of mineral resources is a key factor to satisfy human activities, tech-nology and economic activity, including those metals that do not generally are the primaryproduction of mines, such as copper or nickel, but instead are mined as by-products duringthe mining of primary ores. In this regard, mining industry is confronted with the difficult andoften rather complicated problem of assigning costs to their by-products and joint products,which have highly complex demand/supply and technology and investments requirements.
The availability of by-product metals depend on the availability of technology to recoverthose metals during or after the processing of host metal ores, as well as on the economic profitof by-product metal recovery. Mudd et al. (2013) proposed a set of parameters in order to eval-uate by-product metal availability such as: (1) size and type of the by-product metal ore bodies;(2) the characteristics abundances of by-product metals in the host or hosts; (3) the typical re-covery efficiencies for these by-product metals (mainly the different technologies used) and (4)models of the relative costs and benefits of by-product metal recovery.
However, in Mudd’s proposed parameters there is a missing one related with energy con-sumption of by-product metals. In this respect, conventional LCA software usually performsallocations among products when one or more by-products come about in a mining or metal-
99

lurgical process, based either on tonnage or on revenue (commercial prices). Both ways of al-locating environmental costs entail many disadvantages, such as introducing subjectivity withprice or underestimating burden for certain by-products when the tonnage is low. Specificallyin the Ecoinvent database, the by-product allocation problem (the joint production of silver andlead, for instance) is undertaken by a subdivision of the sub-processes. The starting point forthe estimation depends on the general profit expectations of the company, considering an ar-bitrary performance value of 10%. Hence, the allocation factors are based on revenue but thesevalues are corrected by mass in order to keep up with the resource balance in the final com-modity. Consequently, allocation methods are confronted with the difficult and often rathercomplicated problem of assigning costs to their by-products and joint products.
Furthermore, LCA uses computer software and database like Ecoinvent (Classen et al. 2007),which contains a very broad data on energy supply, resource extraction, raw material supply likechemicals, metals, explosives or water. However, most of such databases consider regional av-erages of environmental impacts associated with mineral processing, with arbitrary allocationsamong those operations using raw materials, hydro, gas, coal or nuclear generated electricity,or those occurring in different countries, or even any variations from process to process. Inthis way, authors like Yellishetty et al. (2009) have conducted a critical review of existing LCAmethods in the minerals and metals sector in relation to allocation issues related to indicatorsof abiotic resource depletion, concluding that LCA issues of minerals and metals need to be in-vestigated further to get more understanding, to facilitate the future use of LCA as a policy toolin the mining sector and increase objectivity with more scientific validity. There is clearly a needfor better data related to mining industry such as, energy consumption, production efficiency atvarious levels of aggregation, waste disposal, fugitive emissions, among others. Authors such asBrown et al. (2012), McLellan et al. (2012) think that a global perspective on the current energyuse and GHG emissions proceeding from minerals production is required. Espí (2009), Sagar& Frosch (1997) assert that this kind of information is crucial to perform analysis which allowsa deeper understanding of mining sector. Since mineral extraction and processing constitutesthe first stage of any given process, using conventional LCA software may lead to incorrect re-sults. Aware of this problem, in this section, the second objective will be achieved through thedevelopment of a new cost allocation methodology based on the exergy replacement costs. Thefinal aim is to estimate the energy consumption and eventually economic, technology and en-vironmental bearings of each commodity produced. The novelty introduced with respect towhat is already being done in conventional Thermoeconomic analysis is that when non-fuelminerals come into play, allocation is carried out through the exergy replacement costs insteadof through chemical exergy, what was traditionally done in conventional thermoeconomic an-alyzes. In this way, the scarcity factor of minerals is taken into account.
In order to allocate costs among non-fuel minerals through the exergy replacement costs, 33different mineral deposit models where 12 coupled products are obtained have been analyzed.Additionally, as study cases, exergy cost allocation was applied to nickel, copper, lead and REEproduction with its respective by-products.
The mineral deposits models used to develop the allocation methodology in this section,are taken from the comprehensive study of average ore grades accomplished by Cox & Singer(1992). In their study, a compendium of geologic models was presented, including 85 descrip-tive models identifying attributes of the deposit type and 60 grade-tonnage models giving es-timated pre-mining tonnage’s grades from over 3,900 well-characterized deposits all over theworld. The average grade xm of the different mineral deposits analyzed is calculated with Eq.5.2, taking into account the tonnage (M) and ore grade (xm) of each model and the number of
100

deposits containing the mineral under consideration. Tables 5.3 through 5.9 are calculated withthe mean average grade and tonnage of each deposit type.
xm =∫ M
0 xmd M∫ M0 d M
(5.2)
Such models will serve to demonstrate why the allocation model presented in this thesis ismore suitable than conventional approaches using tonnage or market prices.
5.4 Joint products and by-products in the mining industry
Products produced at the same time are classified as joint products or by-products; generallydriven by the importance of the different products to the viability of the mine. The same metalmay be treated differently based on differing grades and quantities of products. The decisionas to whether these are joint products or one is only a by-product is important as it may affectthe allocation costs.
Joint products are metals or minerals within an ore body which each have significant rela-tive sales values. Hansen et al. (2009) state that they are produced simultaneously by the sameprocess up to a “split-off” point and from a common raw material source. Joint products arerelated to each other such that one joint product cannot be produced without the other. Fur-thermore, an increase in the output of one increases the output of the others, although notnecessarily in the same ratio. Up to the often called split-off point, it cannot be obtained moreof one product without getting more of the other(s). The split-off point is the point at which thejoint products become separate and identifiable.
By-products are metals or minerals within an ore body which have minor sales values whencompared with the principal product or products. Is a secondary product recovered in thecourse of production or processing of a primary product. For instance, by-products resultingfrom scrap, trimmings, and so forth, of the main products. According to Mudd et al. (2013),these metals are known also as companion metals (e.g., cobalt, molybdenum, rhenium, sele-nium, germanium, gallium, tellurium and indium). Although these metals often have economicand technological importance, the economic driver for mining here is undoubtedly the majormetal. Besides, there are some groups of metals such as PGMs or REE that may occur as “cou-pled elements” without a real carrier metal.
Otherwise, some metals generally produced as by-products may also be mined as targetmetals on their own if they occur in elevated concentrations (e.g. cobalt, bismuth, molyb-denum, gold, silver, PGMs and tantalum) or if demand exceed the supply available from by-product and joint product output.
As previously explained, more than one metal is commonly produced by the same min-ing and refining processes. Metals such as lead and zinc are commonly found together; silveris often found with gold. These are only two examples of the many joint products that Natureprovides. Figure 5.6 depicts that each carrier commodity metal is associated in Nature (geology)by a distinctive mix of valuable minor elements. The latter has led to metallurgical processingbeing sharpened to effectively recover most elements economically. This complex link of ma-terials can be observed in the “Metal Wheel”, in which each element has a unique position.Therefore, eliminating or disrupting the production of one element will have an effect over all
101

other connected elements Verhoef et al. (2004).
Figure 5.6: The metal wheel. Verhoef et al. (2004)
5.5 Approaches to allocating joint cost
As aforementioned, the Exergy Life Cycle Assessment provides average exergy costs of all man-ufactured products as well as the exergy needed for their use, maintenance, repair and disposal,it is focused in obtaining round numbers which could be used as ecological indexes of sustain-ability. However, the problem comes up when two or more products, by-products and residuesare produced simultaneously. How to allocate costs? As stated by Valero & Lozano (1994), it isnecessary to look inside the system in order to understand the process of cost formation, byidentifying the internal relationships of all the structure components. Indeed, the main prob-lem of allocating costs has been to find a function that adequately characterizes every one ofthe internal flows in a system and distributes cost proportionally. This function needs to beuniversal, sensitive and additive. That is, it needs to have an objective value for every possiblematerial manifestations, it needs to be able to vary when these manifestations do so and eachinternal flow property needs to be represented additively. There is a wide international consen-sus that the best function, at least for energy systems, is exergy, which can contain in its ownanalytical structure the flow history.
Therefore three conditions are needed to allocate costs. First, the definition of the bound-aries of the system. Second, a structure of the system in which all the components or processesare described in terms of black boxes interacting to each other through energy flows (or moregeneralized: energy, economic or information flows). Third, the definition of the purpose of
102

production for each and every component.
The purposes of cost accounting could be stated in broad terms as: determination of theactual cost of products, settlement of a rational basis for pricing products and/or evaluation oftheir profitability as well as means for controlling costs.
Accordingly, cost allocation of mineral resources is not a simple task, due to the fact thatan allocation method must allocates the cost on as reasonable basis as possible. As reportedon PWC (2012), a systematic and rational basis of cost allocation should be applied when theconversion costs of a product are not separately identifiable.
Joint costs are the total of the raw material, labor, and overhead costs incurred up to theinitial split-off point. Joint cost allocation is based on the proportional values of the products atthe split-off point. Whilst, separable costs are those costs incurred after the split-off point; theycan be easily traced to individual products.
For instance, if ore contains both iron and zinc, the direct material itself, is a joint prod-uct. Since neither zinc nor iron can be produced alone prior to the split-off point, the relatedprocessing costs of mining, crushing, and splitting the ore are also joint costs. The variety ofproducts and the mutually beneficial costs, appear either because the material itself is a jointproduct or because processing results in the simultaneous output of more than one product.
By-products are not usually allocated any of the joint costs. Some mining entities assign toby-products only the costs of processing after the split-off point to by-products, because by-products are processed beyond the split-off point to bring them to a marketable form or to in-crease their value above their selling prince at the split-off point. Furthermore, the accountingtreatment of by-products necessitates a reasonably complete knowledge of the technologicalfactors underlying their manufacture, since the origins of by-products may differ.
As mentioned above, cost are either separable or not. Separable cost are easily traced toindividual products and offer no particular problem. If not separable, they must be allocatedto various products. All joint products benefit from the entire joint cost. The objective in jointcost allocation is to determine the most appropriate way to allocate a cost that is not reallyseparable.
Although, there are variety methods for allocating costs to joint and by-products, they canbe associated to two approaches, using market-based data or using physical measures. How-ever, the physical measure of the individual products may have no relationship to their respec-tive revenue-generating capacity. For example, in a gold mine that extracts ore containing gold,silver, and lead, the use of a common physical measure (tons) would result in almost all costsbeing allocated to lead, the product that weighs the most but has the lowest revenue-generatingpower. The physical method of cost allocation is inconsistent for this case, with the main reasonthat the mining company earns revenues from gold and silver, not lead. Thereby, Hansen et al.(2009) assert that there is no well-accepted theoretical way to determine which product incurswhat part of the joint cost.
In this thesis, three different allocation methods are reviewed:
• Through Tonnage: For this allocation, the tonnage of each of the product and by-productis considered. External resources such as energy and raw materials are divided into theproducts according to its mass value.
• Through Market Price: The assignment based on price, considers the market price of eachproduct obtained in the process.
103
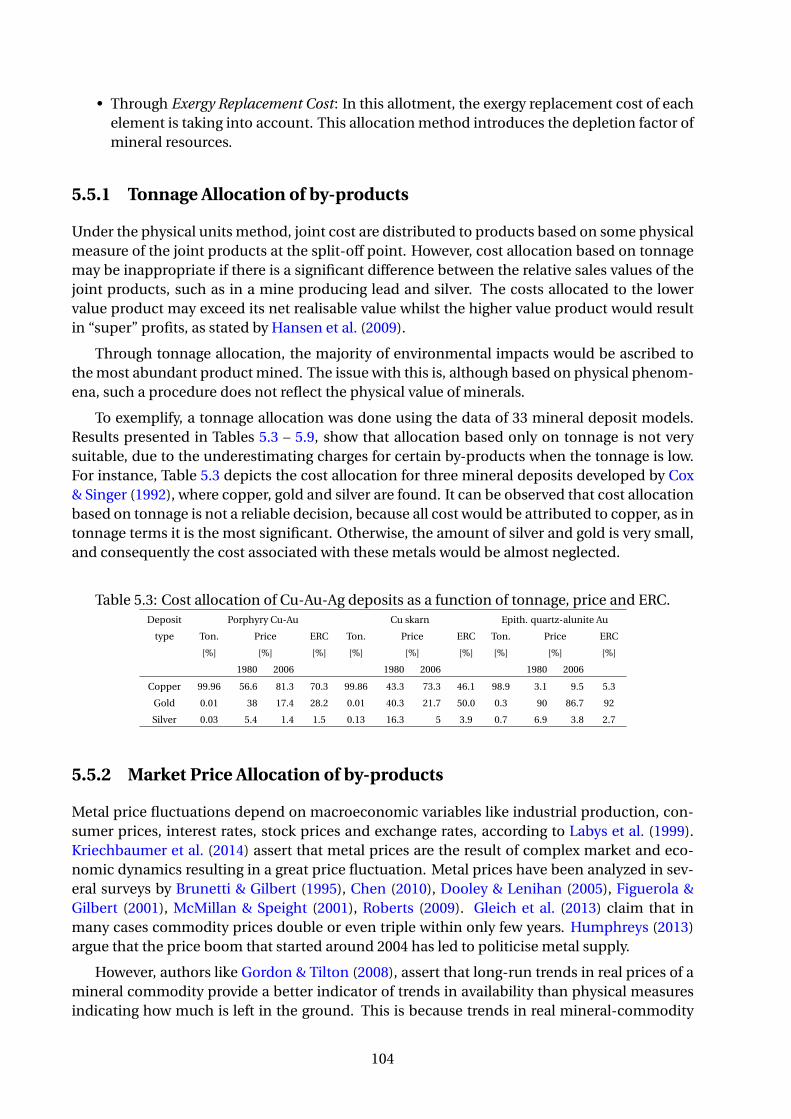
• Through Exergy Replacement Cost: In this allotment, the exergy replacement cost of eachelement is taking into account. This allocation method introduces the depletion factor ofmineral resources.
5.5.1 Tonnage Allocation of by-products
Under the physical units method, joint cost are distributed to products based on some physicalmeasure of the joint products at the split-off point. However, cost allocation based on tonnagemay be inappropriate if there is a significant difference between the relative sales values of thejoint products, such as in a mine producing lead and silver. The costs allocated to the lowervalue product may exceed its net realisable value whilst the higher value product would resultin “super” profits, as stated by Hansen et al. (2009).
Through tonnage allocation, the majority of environmental impacts would be ascribed tothe most abundant product mined. The issue with this is, although based on physical phenom-ena, such a procedure does not reflect the physical value of minerals.
To exemplify, a tonnage allocation was done using the data of 33 mineral deposit models.Results presented in Tables 5.3 – 5.9, show that allocation based only on tonnage is not verysuitable, due to the underestimating charges for certain by-products when the tonnage is low.For instance, Table 5.3 depicts the cost allocation for three mineral deposits developed by Cox& Singer (1992), where copper, gold and silver are found. It can be observed that cost allocationbased on tonnage is not a reliable decision, because all cost would be attributed to copper, as intonnage terms it is the most significant. Otherwise, the amount of silver and gold is very small,and consequently the cost associated with these metals would be almost neglected.
Table 5.3: Cost allocation of Cu-Au-Ag deposits as a function of tonnage, price and ERC.Deposit Porphyry Cu-Au Cu skarn Epith. quartz-alunite Au
type Ton. Price ERC Ton. Price ERC Ton. Price ERC
[%] [%] [%] [%] [%] [%] [%] [%] [%]
1980 2006 1980 2006 1980 2006
Copper 99.96 56.6 81.3 70.3 99.86 43.3 73.3 46.1 98.9 3.1 9.5 5.3
Gold 0.01 38 17.4 28.2 0.01 40.3 21.7 50.0 0.3 90 86.7 92
Silver 0.03 5.4 1.4 1.5 0.13 16.3 5 3.9 0.7 6.9 3.8 2.7
5.5.2 Market Price Allocation of by-products
Metal price fluctuations depend on macroeconomic variables like industrial production, con-sumer prices, interest rates, stock prices and exchange rates, according to Labys et al. (1999).Kriechbaumer et al. (2014) assert that metal prices are the result of complex market and eco-nomic dynamics resulting in a great price fluctuation. Metal prices have been analyzed in sev-eral surveys by Brunetti & Gilbert (1995), Chen (2010), Dooley & Lenihan (2005), Figuerola &Gilbert (2001), McMillan & Speight (2001), Roberts (2009). Gleich et al. (2013) claim that inmany cases commodity prices double or even triple within only few years. Humphreys (2013)argue that the price boom that started around 2004 has led to politicise metal supply.
However, authors like Gordon & Tilton (2008), assert that long-run trends in real prices of amineral commodity provide a better indicator of trends in availability than physical measuresindicating how much is left in the ground. This is because trends in real mineral-commodity
104

prices can be upward or downward depending largely on whether new technology with theassistance of mineral substitution offsets the cost-increasing effects of depletion. Furthermore,Gordon & Tilton (2008) argue that if environmental impacts of mining industry are graduallyincluded into cost structure of metal production (for instance, through carbon taxes) the priceof metals will increase.
The most common allocation methods used to share out joint production costs to jointproducts at the split-off point, based on market data include: the sales value at split-off method,the net realizable value method, the constant gross-margin percentage method. These meth-ods are preferred over the physical measures, because revenues are, in general, a better indi-cator of benefits received (PWC 2012). For instance, mining companies receive more benefitsfrom 1 ton of gold than they do from 10 tons of copper. Besides, the physical measure of theindividual products may have no relationship to their respective revenue-generating capacity.For example, in a gold mine that extracts ore containing gold, silver, and lead, the use of a com-mon physical measure (tons) would result in almost all costs being allocated to lead, the prod-uct that weighs the most but has the lowest revenue-generating power. The physical methodof cost allocation is inconsistent for this case, with the main reason that the mining companyearns revenues from gold and silver, not lead.
In this section a market price allocation was done taking into account the unit value ($/ton)of the different commodities published in U. S. Geological Survey (USGS) from year 1900 to2011. Chen (2010) asserts that metal prices rise to a peak in the 1980s, and in recent times, theprice boom started around 2004, as stated by Humphreys (2013). Therefore, Tables 5.3 – 5.9show the allocation factor for the year 1980 and 2006. Results depict great variations amongyears, commodities, by-products and models. The latter supports the idea that despite whatprice allocation supporters claim, market price is not a suitable indicator to assess mineralresources, because of the huge price volatility. Clearly therefore, resource consumption andgreenhouse gas emissions need to be related to physical expenditures, not prices.
105

Table 5.4: Cost allocation of Cu-Au-Pb-Ag-Zn deposits as a function of tonnage, price and ERC.Deposit Zn-Pb skarn Polymet. Replacement Polymetallic vein
type Ton. Price ERC Ton. Price ERC Ton. Price ERC
[%] [%] [%] [%] [%] [%] [%] [%] [%]
1980 2006 1980 2006 1980 2006
Copper 4.79 5.9 9.2 11.9 2.49 2.3 4.9 5.2 1.58 0.6 2.2 1.9
Gold 0.0005 5.1 2.5 6.2 0.001 6.2 4.3 4.0 0.001 1.7 2 3.3
Lead 33.54 17.3 15.9 27.7 54.82 20.9 26.6 37.7 74.58 12 25.6 30
Silver 0.12 43.7 12.4 19.8 0.21 56.4 22.1 29.0 0.72 82.3 54 58.4
Zinc 61.55 28 59.9 34.4 42.47 14.2 42.1 19.8 23.12 3.3 16.2 6.3
Deposit Cyprus massive sulfide Creede epith. vein Comstock epith. vein
type Ton. Price ERC Ton. Price ERC Ton. Price ERC
[%] [%] [%] [%] [%] [%] [%] [%] [%]
1980 2006 1980 2006 1980 2006
Copper 65.54 51.6 68.5 67.8 6.33 3.9 9.5 8.5 27.7 0.2 0.7 0.42
Gold 0.004 25.9 10.9 20.4 0.004 24.4 18.9 31.8 1 65.6 76.2 83.2
Lead 2.05 0.7 0.5 0.7 53.77 14.0 20 24 13.8 0.04 0.1 0.07
Silver 0.05 12.3 3.0 3.6 0.26 48.7 21.4 23.8 15.9 34 22.4 16.2
Zinc 32.36 9.4 17.1 7.5 39.64 9.1 30.1 12 41.5 0.1 0.6 0.14
Deposit Kuroko mass. sulfide
type Ton. Price ERC
[%] [%] [%]
1980 2006
Copper 26.13 30.3 38.9 45.9
Gold 0.002 16.6 6.8 15
Lead 15.55 7.6 5.7 9.1
Silver 0.06 20.6 4.8 7
Zinc 58.26 25 43.8 23
Table 5.4 shows the cost allocation for seven mineral deposits developed by Cox & Singer(1992), where copper, gold, lead, silver and zinc are found. In general, the high prices of goldand silver may drive the exploitation of the other commodities. However, it can be observedthat cost allocation based on market price, not always attributes the cost to the most expensivecommodity (e.g. gold). This is because the quantity of the produced metal is also considered.
106

0%
10%
20%
30%
40%
50%
60%
70%
80%
1900
1902
1904
1906
1908
1910
1912
1914
1916
1918
1920
1922
1924
1926
1928
1930
1932
1934
1936
1938
1940
1942
1944
1946
1948
1950
1952
1954
1956
1958
1960
1962
1964
1966
1968
1970
1972
1974
1976
1978
1980
1982
1984
1986
1988
1990
1992
1994
1996
1998
2000
2002
2004
2006
2008
2010
Copper Silver Gold Zinc Lead B*Cu B*Ag B*Au B*Zn B*Pb
Cu, $
Cu, B*
Au, B* Au, $
Ag, $
Ag, B*
Zn, B*
Pb, B*
Zn, $
Pb, $
Figure 5.7: Cost allocation of Cu-Au-Pb-Ag-Zn deposits as a function of price and ERC.
The “Polymetallic vein” model of Table 5.4 shows a percentage allocation cost for silver of82.3% in the year 1980 which decreases up to 54% in 2006. This is because of price volatility, de-picted in Fig. 5.7. The problem with this allocation type is that burdens or energy consumptiondo not change at the same rate as price fluctuates (which in fact occurs frequently).
5.5.3 Exergy Cost Allocation of by-products
An alternative way to allocate costs as proposed in this thesis is through the Exergy ReplacementCost (ERC). ERC is greater for critical elements (e.g. gold, silver, cobalt) than it is for thosefound in abundance (e.g. limestone). A mineral has a high exergy replacement cost when 1)the concentration of the mineral in Thanatia is low and the difference between the ore grade ofthe current mines (xm) is high and/or 2) when the energy required to extract the mineral andbeneficiate it is significant. Consequently, when minerals are assessed through ERC, the exergybonus that Nature provides by having minerals concentrated in mines instead of having themdispersed throughout the Earth’s crust is taken into account.
107

Table 5.5: Cost allocation of Au – Ag deposits as a function of tonnage, price and ERC.Deposit Placer Au-PGE Carbonate-hosted Au-Ag Low-sulfide Au-quartz veins
type Ton. Price ERC Ton. Price ERC Ton. Price ERC
[%] [%] [%] [%] [%] [%] [%] [%] [%]
1980 2006 1980 2006 1980 2006
Gold 13 81.7 88.7 92.2 10.5 77.7 86 90.3 76.3 99 99.4 99.6
Silver 87 18.3 11.3 7.8 89.5 22.3 14 9.7 23.7 1 0.6 0.4
Deposit Homestake Au
type Ton. Price ERC
[%] [%] [%]
1980 2006
Gold 85.1 99.4 99.7 99.8
Silver 14.9 0.6 0.3 0.2
Table 5.5 depicts the cost allocation for four mineral deposits developed by Cox & Singer(1992), where gold and silver are found. The fact that gold has a higher ERC than silver, leadto a great cost allocation for it, as Fig. 5.8 shows. The specific exergy replacement costs (GJ/t),shown in Table 5.5, need to be multiplied by the tonnage of the given commodity. The greatera commodity’s replacement cost, the more energy (or environmental burden) is allocated to itand subsequently the strengths of price and tonnage as indicators are combined, with the high-est importance placed on those minerals that are more“socially valued”. It is thus a physicalmeasure independent of monetary arbitrariness supported by the rigorous theory of Thermoe-conomics.
0%
10%
20%
30%
40%
50%
60%
70%
80%
90%
100%
1900
1903
1906
1909
1912
1915
1918
1921
1924
1927
1930
1933
1936
1939
1942
1945
1948
1951
1954
1957
1960
1963
1966
1969
1972
1975
1978
1981
1984
1987
1990
1993
1996
1999
2002
2005
2008
2011
GOLD SILVER B* Au B* Ag
Au, B*
Au, $
Ag, $
Ag, B*
Figure 5.8: Cost allocation of Au-Ag deposits as a function of price and ERC.
108

5.6 Cost allocation of by-products applied to mineral deposits
Once the three allocation options have been explained, allocation among commodities are pre-sented in Tables 5.3 – 5.9, which show how costs are allocated as a function of tonnage, price(for 1980 and 2006) and Exergy Replacement Cost of 33 mineral deposit models containing 12commodities: phosphorous, manganese, iron, cobalt, nickel, copper, molybdenum, silver, gold,zinc, lead and antimony. Allocation was done from 1900 to 2011, however a summary of eachdeposit type is presented in the Tables 5.3 – 5.9 which are calculated with the mean averagegrade and tonnage of each deposit type.
Table 5.6: Cost allocation of Co-Au-Mo-Ag deposits as a function of tonnage, price and ERC.Deposit
Porphyry CuPorphyry Cu
Porphyry Cu-Motype skarn-related
Ton. Price ERC Ton. Price ER Ton. Price ERC
[%] [%] [%] [%] [%] [%] [%] [%] [%]
1980 2006 1980 2006 1980 2006
Cobalt 98.2 68.5 81.7 42.6 97.9 61.3 78 41.7 95.4 64.5 71.6 70.2
Gold 0.002 13.5 5.1 50 0.003 18.2 7.4 50 0.0002 1.4 0.5 0.9
Molybdenum 1.8 11.8 11.9 6.5 2 11.6 12.5 7 4.5 28.5 26.8 27.5
Silver 0.03 6.2 1.3 0.9 0.05 8.9 2 1.4 0.03 5.6 1.1 1.4
According to the different allocation methods used, it can be observed that tonnage alloca-tion is not a reliable indicator, as explained in section 5.5.3. For instance, in the case of copperand its more valuable by-products: gold and silver, if the tonnage indicator is selected, none ofthe burden is ascribed to gold or silver due to their much lower grade compared to copper. Ifexergy replacement cost is applied, the results are similar to those obtained via the price indica-tor. This supports the idea that the exergy replacement cost indicator is very close to the valuesociety places on minerals. Nevertheless, contrarily to prices, exergy replacement cost does notfluctuate with external factors linked to market mechanisms but remains constant as can beseen in Figures 5.7 – 5.12. That said, exergy replacement costs are a function of the technologyused and can be obtained from energy data published in different sources such as that providedby the Ecoinvent database. Hence, the values are as reliable as the sources used and are subjectto improvements.
To have a general outlook of the cost allocation based on market price, Figures 5.7 - 5.12show the historical trend of commodities prices from 1900 to 2011, for several mineral depositmodels, where different commodities are obtained. From the figures, it can be clearly appreci-ated the great price fluctuation throughout time, being evident that the mining and metallur-gical industry requires a more objective allocation method, like the one proposed in this thesisthrough the exergy replacement costs and represented in the figures by the straight line.
109

0%
10%
20%
30%
40%
50%
60%
70%
80%
90%
100%
1912
1914
1916
1918
1920
1922
1924
1926
1928
1930
1932
1934
1936
1938
1940
1942
1944
1946
1948
1950
1952
1954
1956
1958
1960
1962
1964
1966
1968
1970
1972
1974
1976
1978
1980
1982
1984
1986
1988
1990
1992
1994
1996
1998
2000
2002
2004
2006
2008
2010
Copper Gold Molybdenum Silver B*Cu B*Au B*Mo B*Ag
Au, B*
Cu, B*
Mo, B*
Ag, B*
Au, $
Cu, $
Mo, $
Ag, $
Figure 5.9: Cost allocation of Co-Au-Mo-Ag deposits as a function of price and ERC.
Table 5.7 shows two deposit models of copper and its by products: gold, silver and zinc. Thistable is important because it is based on real deposits founded in the Earth’s crust and analyzedby Cox & Singer (1992). The allocation procedure through the three options explained previ-ously were applied. It can be observed, that values of exergy allocation factor for copper andsilver are very similar to those obtained in the case study presented in Table 5.10. For instance,the “Besshi massive sulfide” deposit show an exergy allocation factor of 80 % for copper and2.2% for silver, whilst the case study show an exergy allocation factors of 89% and 2%, respec-tively.
Table 5.7: Cost allocation of Cu-Au-Ag-Zn deposits as a function of tonnage, price and ERC.Deposit Besshi massive sulfide Sado epith. vein
type Ton. [%] Price [%] ERC [%] Ton. [%] Price [%] ERC [%]
1980 2006 1980 2006
Copper 72.2 66.3 77.7 80.3 42.7 2.5 7.8 4.6
Gold 0.002 13.6 5.1 9.9 0.2 81.1 78.8 87.9
Silver 0.04 10.6 2.2 2.9 0.9 15.1 8.3 6.1
Zinc 27.71 9.4 15 6.9 56.2 1.2 5.2 1.4
Figure 5.10 shows the historical trend of commodity prices (market price allocation) from1900 to 2011 for the “Besshi massive sulfide” deposit, where a great price fluctuation through-out time, can be noted. The exergy replacement costs (exergy allocation) is represented by thestraight line.
110

0%
10%
20%
30%
40%
50%
60%
70%
80%
90%
100%
1900
1902
1904
1906
1908
1910
1912
1914
1916
1918
1920
1922
1924
1926
1928
1930
1932
1934
1936
1938
1940
1942
1944
1946
1948
1950
1952
1954
1956
1958
1960
1962
1964
1966
1968
1970
1972
1974
1976
1978
1980
1982
1984
1986
1988
1990
1992
1994
1996
1998
2000
2002
2004
2006
2008
2010
Copper Silver Gold Zinc B*Cu B*Ag B*Au B*Zn
Au, $
Zn, $
Cu, $
Ag, $ Ag, B*
Au, B*
Cu, B*
Zn, B*
Figure 5.10: Cost allocation of Cu-Au-Ag-Zn deposits as a function of price and ERC.
Table 5.8 depicts three deposit models of cobalt and its by products: copper, gold and nickel.This deposit contains two of the commodities analyzed in this section, copper and cobalt. Theallocation procedure through the three options explained previously were applied. It can beobserved that values of exergy cost allocation for copper and cobalt are very different to thoseobtained in the case study presented in Table 5.10, due to the different tonnage. Hence, it is im-portant to highlight that there is a general exergy allocation factor for each specific commodity,depending on the amount of mineral produced.
Table 5.8: Cost allocation of Co-Cu-Au-Ni deposits as a function of tonnage, price and ERC.Deposit Komatiite Ni-Cu Dunitic Ni-Cu Synorg.-synvolc. Ni-Cu
type Ton. Price ERC Ton. Price ERC Ton. Price ERC
[%] [%] [%] [%] [%] [%] [%] [%] [%]
1980 2006 1980 2006 1980 2006
Cobalt 3.5 24 4.7 35.9 2.8 19.7 3.7 30.1 3.9 30 6.5 46
Copper 8.2 2.4 2.5 0.8 3.8 1.1 1.1 0.4 37.2 12.4 14.2 4.5
Gold 0.0002 0.6 0.2 0.1 0.0002 0.5 0.2 0.1 0.001 2.5 0.9 0.5
Nickel 88.3 73 92.7 63.2 93.4 78.6 95.1 69.4 58.9 55 78.4 49
Figure 5.11 shows the historical trend of the market price allocation from 1900 to 2011 forthe “Komatite” deposit, as well as the exergy replacement costs allocation represented by thestraight line (B∗). It can be noted that price allocation could be above the exergy allocation (e.g.nickel) or below (e.g. cobalt).
111

0%
10%
20%
30%
40%
50%
60%
70%
80%
90%
100%
1900
1902
1904
1906
1908
1910
1912
1914
1916
1918
1920
1922
1924
1926
1928
1930
1932
1934
1936
1938
1940
1942
1944
1946
1948
1950
1952
1954
1956
1958
1960
1962
1964
1966
1968
1970
1972
1974
1976
1978
1980
1982
1984
1986
1988
1990
1992
1994
1996
1998
2000
2002
2004
2006
2008
2010
Copper Gold Cobalt Nickel B*Cu B*Au B*Co B*Ni
Au, B*
Ni, B*
Co, B*
Cu, B* Au, $ Cu, $
Ni, $
Co, $
Figure 5.11: Cost allocation of Co-Cu-Au-Ni deposits as a function of price and ERC.
Table 5.9 depicts two deposit models of lead, silver and zinc. This deposit contains two ofthe commodities analyzed in this section, lead and silver.
Table 5.9: Cost allocation of Pb-Ag-Zn deposits as a function of tonnage, price and ERC.Deposit Sandstone-hosted Pb-Zn Missouri / Appalach. Pb-Zn
type Ton. [%] Price [%] ERC [%] Ton. [%] Price [%] ERC [%]
1980 2006 1980 2006
Lead 78.4 62.1 59.7 77.5 23.3 24 12.8 30.3
Silver 0.04 22.9 6.8 8.1 0.01 6.4 1.1 2.3
Zinc 21.5 15 33.5 14.4 76.7 69.6 86.2 67.4
Figure 5.12 shows the historical trend of the market price allocation from 1900 to 2011 forthe “Sandstone” deposit, as well as the exergy replacement costs allocation represented by thestraight line is close to the price allocation factor. This means that commodities have beenvaluated in a similar way in which it would be allocated taking into account the ERC.
Additional Tables and Figures of deposit models are presented in the Appendix C.
112

0%
10%
20%
30%
40%
50%
60%
70%
80%
90%
1900
1902
1904
1906
1908
1910
1912
1914
1916
1918
1920
1922
1924
1926
1928
1930
1932
1934
1936
1938
1940
1942
1944
1946
1948
1950
1952
1954
1956
1958
1960
1962
1964
1966
1968
1970
1972
1974
1976
1978
1980
1982
1984
1986
1988
1990
1992
1994
1996
1998
2000
2002
2004
2006
2008
2010
Silver Zinc Lead B*Ag B*Zn B*Pb
Pb, B*
Zn, B*
Ag, B*
Pb, $
Zn, $
Ag, $
Figure 5.12: Cost allocation of Pb-Ag-Zn deposits as a function of price and ERC.
5.7 Exergy cost allocation applied to mining and metallurgicalprocesses
Once the cost allocation has been done for specific deposits, the methodology can be appliedto mining processes in order to allocate inputs of raw materials, utilities, emissions and so on.For this kind of allocation methods, it is necessary a detailed knowledge of the process involvedin the commodities production. Data such as energy (fuel and electricity), ore and raw materialmass, in each production stage is needed to perform the analysis.
In this section, the analysis of four case studies of mineral production is carried out. Dueto lack of information about real processes, the case studies used in this section were pro-posed from information of different sections of Ecoinvent database (Classen et al. 2007) anddo not represent a specific mining operation. A detailed analysis of a metallurgical processwill be carried out in the following chapter. Hence, in this chapter only theoretical and sim-plified case studies are presented as a way to show how the allocation procedure works in themining industry. The first case involves copper production and its by-products: molybdenum,silver and tellurium. The second case assesses nickel production and its by-products: copperand cobalt. The third case analyzes lead production and its by-products: zinc, silver and cad-mium. The fourth case evaluates the rare earth elements: lanthanum, cerium, praseodymium,neodymium, gadolinium and yttrium.
5.7.1 Exergy Cost Allocation of Copper and its by-products
Copper is always associated with other metals, mainly nickel, molybdenum and platinum groupmetals. In this case, copper is extracted jointly with molybdenum, silver and tellurium. In order
113

to assess the production process of copper, a Thermoeconomic Input-Output analysis (consid-ering ERC as explained in Chapter 4 ) was performed.
Data of raw material and utilities (e.g. electricity, natural gas and fuel inputs) used duringthe production process were taken from Ecoinvent database Classen et al. (2007). Accordingto the copper production process shown in Fig. 5.13, molybdenum is obtained right after themining and beneficiation operations. Pretreatment, reduction and refining processes followand by-products tellurium and silver are obtained from this second stage. Once the materialflows have been identified, exergy cost allocation of inputs of electricity or natural gas amongthe products of the considered process is performed as depicted in Fig.5.14. In the same way,all inputs such as chemicals, raw materials and utilities are allocated.
Figure 5.13: Exergy Cost allocation of Cu and its by-products Mo, Ag and Te.
114

Finally, a thermoeconomic analysis of the process allows to obtain the exergy cost of each ofthe commodities obtained, which in turn can be converted into monetary units considering theelectricity price. Accordingly, one can compare the market price of the commodities with thatconsidering the exergy costs required to produce them. Obviously market prices do not onlytake into account production costs, but also include other factors alien to the physical realityof commodities. In addition, prices do not take into account the fact that with extraction andthe further dispersion of materials, the mineral heritage of the Earth is being destroyed andbecoming thus unavailable for future generations.
Table 5.10 depicts the results obtained for the copper example. Amount of product ob-tained, unit price (market price of the commodity for the year 2011 according to U. S. GeologicalSurvey (USGS)), exergy cost and their respective allocation factors (a.f.), as well as an additionalallocation factor based on the chemical exergy, are shown.
Table 5.10: Allocation factors of copper and its by-products Mo, Ag and TeCommodity Output Exergy cost Exergy Cost Unit price Ton. Price bch
product [kg] a.f. [%] [MJ/kg] [$/kg] a.f. [%] a.f. [%] a.f. [%]
Copper_1 97 44 99.6 98.5 99.7
Copper_2 1 89 186 9 99.956 94 99.99457
Molybdenum 0.00411 3 545 34 0.4 1.5 0.3
Tellurium 7.17E-06 8 73,324 349 0.040 5 0.00004
Silver 3.26E-04 2 6,419 1,130 0.005 1 0.00539
Figure 5.14 shows the commodity prices vs. the units of exergy required to produce 1 kilo-gram of metal. It can be seen that costs based on ERC show higher values respect the unit pricevalue. Accordingly, a critical commodity such as tellurium, should have a higher unit price, inorder to reflect properly its physical condition in Nature.
0
200
400
600
800
1,000
1,200
1
10
100
1,000
10,000
100,000
Cu Mo Te Ag
Unit p
rice [$/kg]
Exergy Cost [MJ/kg]
Exergy Cost Unit price
Figure 5.14: Cost allocation of Cu by-products, based on price and exergy.
115

5.7.2 Exergy Cost Allocation of Nickel and its by-products
Since nickel is always associated with other elements, its production generates other metals likecopper and cobalt. A detailed study of the nickel production process is performed in Chapter6. Thence, the exergy analysis required to obtain the exergy cost used in this section is takenfrom section 6.1.1. The production system for nickel production is shown in Fig. 5.15. Theprocessing operations have been grouped into four general stages: 1) Mining and Beneficiationand 2) Drying, Roasting and Smelting, 3) Converting and 4)Electrolysis. Figure 5.15 depicts theinput-output of utilities (e.g. electricity, natural gas, fuel oil and coal) and raw materials (e.g.ores from which nickel is produced).
Figure 5.15: Exergy Cost allocation of Ni and its by-products Cu and Co.
116

Nickel by-products are obtained together with nickel at the last step, in the amounts indi-cated in Table 5.11. Two issues are shown in Fig. 5.15. First, at mining and beneficiation step( j = 1), an input of 1.505 MJ/kg of fuel oil is required. Accordingly, the ERC of minerals involvedin this operation are depicted, and the exergy cost allocation factor is calculated (taken into ac-count the mass output of each mineral). This way, the input can be distributed to each mineralin an objective way. Second, the following steps ( j = 2, j = 3, j = 4) show all inputs of naturalgas, electricity and fuel oil for each stage. Considering the exergy cost allocation, calculatedpreviously in stage 1, these input are alloted to each mineral. This will be the general procedureto analyze any metallurgical system, where main product and by-products are obtained.
Table 5.11 shows the variables considered to obtain the exergy cost allocation of each com-modity, such as: the output product, the exergy cost allocation factor obtained from exergyreplacement cost and the amount of mineral mined, the exergy cost calculated from a thermoe-conomic input-output analysis and the unit price provided by U. S. Geological Survey (USGS)in the year 2011.
Table 5.11: Allocation factors of nickel and its by-products Cu and Co.Commodity Output Exergy cost Exergy Cost Unit price Ton. Price bch
product [kg] a.f. [%] [MJ/kg] [$/kg] a.f. [%] a.f. [%] a.f. [%]
Nickel 1 82 1,534 23 65.57 82.2 67.3
Copper 0.515 6 53 9 33.77 16.5 32.2
Cobalt 0.01 12 1,906 36 0.66 1.3 0.4
Figure 5.16 depicts the exergy cost calculated through the thermoeconomic input-outputanalysis vs. unit price of metal. It can be observed that exergy cost based on ERC and unit price,gives the same appreciation for the three commodities. In first place cobalt is highlighted byprice and by exergy content, in second place is nickel and in third place copper.
0
5
10
15
20
25
30
35
40
0
250
500
750
1,000
1,250
1,500
1,750
2,000
Ni Cu Co
Unit p
rice [$/kg]
Exergy Cost [MJ/kg]
Exergy Cost Unit price
Figure 5.16: Cost allocation of Ni by-products, based on price and exergy
5.7.3 Exergy Cost Allocation of Lead and its by-products
The allocation of the subprocesses lead-silver production is not clear, because the only avail-able data are the final commodity prices. Besides the share of the products in total costs is noteasy to estimate. In Ecoinvent, Classen et al. (2007) the by-product allocation problem (the joinproduction of silver and lead) is undertake by a subdivision of the sub-processes. The starting
117

point for the estimation depends on the general profit expectations of the company, consider-ing an arbitrary performance value of 10%. Hence, the allocation factors are based on revenuebut these values are corrected by mass in order to keep up with the resource balance in the finalcommodity. Metal prices are used as the allocation parameter for polymetallic mines in Classenet al. (2007).
Figure 5.17: Exergy Cost allocation of Pb and its by-products Zn, Ag and Cd.
The exergy cost allocation to lead production and its by-products zinc, cadmium and silver,starts with the definition of the processing operations, which are grouped in two general stages:1) Mining and Beneficiation and 2) Smelting. Figure 5.17 depicts the input-output of utilities(e.g. electricity, natural gas, fuel oil and coal) and raw materials (e.g. ores from which copper
118

is produced), as well as the point in the process where the by-product are obtained. The sameprocedure (previously explained for copper and nickel, in Figs. 5.14 – 5.16, respectively) is fol-lowed to estimate the exergy cost allocation factor. In this manner, the inputs are shared outamong the commodities obtained in each process.
Table 5.12 depicts the exergy cost allocation factor for each commodity, it can be observedthat in the case of lead in the first stage the allocation factor is 70% whilst in the second stageis 1.8%. This situation is presented because in the first case, lead shares the energy inputs withzinc, which has a lower ERC. The opposite occurs in the last stage, where cadmium and sil-ver have a very high ERC. This situation demonstrates that a general exergy cost allocation fora mineral processing operation cannot be established, but rather a detailed analysis of eachprocess is required in order to allocate cost suitably.
Table 5.12: Allocation factors of lead and its by-product Zn, Ag and CdCommodity Output Exergy cost Exergy Cost Unit price Ton. Price bch
product [kg] a.f. [%] [MJ/kg] [$/kg] a.f. [%] a.f. [%] a.f. [%]
Lead_1 70 120 61.5 65 33.5
Lead_2 1 1.8 252 3 74.6 50 61.3
Zinc 0.626 30 59 2 38.5 35 66.5
Cadmium 0.339 97.7 4,595 3 25.29 17 38.4
Silver 0.00153 0.6 6,659 1,130 0.11 32 0.3
Figure 5.18 depicts the exergy cost calculated from a thermoeconomic input-output analysisand the unit price of commodities provided by U. S. Geological Survey (USGS) in the year 2011.It can be observed that silver is the only metal with high market price and high exergy cost. Onthe contrary, cadmium for instance, has a very low price considering its high exergy content.
0
200
400
600
800
1,000
1,200
1
10
100
1,000
10,000
Pb Zn Ag Cd
Unit p
rice [$/kg]
Exergy Cost [MJ/kg]
Exergy Cost Unit price
Figure 5.18: Cost allocation of Pb by-products, based on price and exergy.
5.7.4 Exergy Cost Allocation of REE
The rare earth elements (REE) are a group of seventeen chemically similar elements. Nonethe-less in this analysis only six will be taken into account: lanthanum, cerium, praseodymium,neodymium, gadolinium and yttrium. REE are generally obtained from monazite or bastnae-site. This study is focused on the former ore. The production structure of REE processing de-
119

picted in Fig. 5.19 is divided into three general steps: 1) Mining and Beneficiation, 2) REO (RareEarth Oxides) separation and 3) Reduction. Stages 2 and 3 are separated for light, mediumor heavy REE. (See Chapter 2, section 2.12). In order to perform the exergy analysis, the pro-duction process was separated in two stages: oxide production (mining and beneficiation andREO separation) and metal production (separation and reduction of LRE, MRE and HRE). Theenergy required during these processes are presented in Table 2.13. The oxide production isconsidered as the concentration step. In fact, with such energy values, the ERC [MJ/kg] werecalculated and presented previously in Table 5.2. All data used in this analysis was taken fromthe study developed by Koltun & Tharumarajah (2008).
Figure 5.19: Exergy Cost allocation of REE.
120
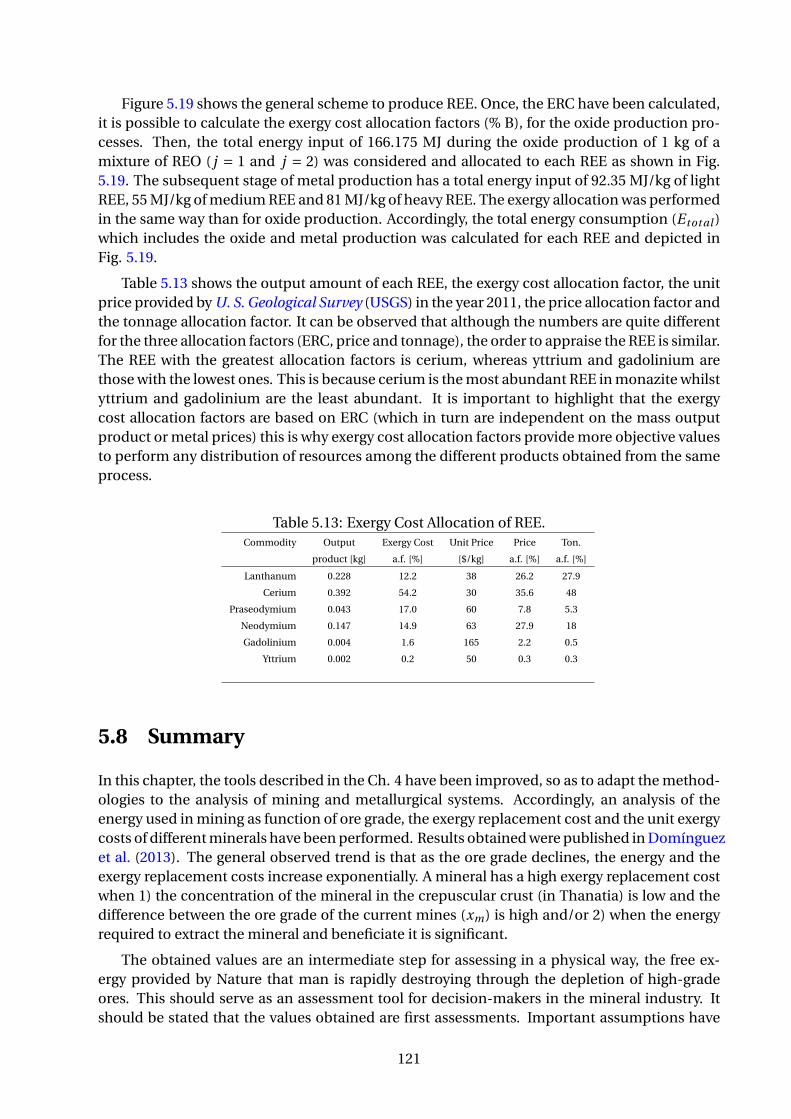
Figure 5.19 shows the general scheme to produce REE. Once, the ERC have been calculated,it is possible to calculate the exergy cost allocation factors (% B), for the oxide production pro-cesses. Then, the total energy input of 166.175 MJ during the oxide production of 1 kg of amixture of REO ( j = 1 and j = 2) was considered and allocated to each REE as shown in Fig.5.19. The subsequent stage of metal production has a total energy input of 92.35 MJ/kg of lightREE, 55 MJ/kg of medium REE and 81 MJ/kg of heavy REE. The exergy allocation was performedin the same way than for oxide production. Accordingly, the total energy consumption (Etot al )which includes the oxide and metal production was calculated for each REE and depicted inFig. 5.19.
Table 5.13 shows the output amount of each REE, the exergy cost allocation factor, the unitprice provided by U. S. Geological Survey (USGS) in the year 2011, the price allocation factor andthe tonnage allocation factor. It can be observed that although the numbers are quite differentfor the three allocation factors (ERC, price and tonnage), the order to appraise the REE is similar.The REE with the greatest allocation factors is cerium, whereas yttrium and gadolinium arethose with the lowest ones. This is because cerium is the most abundant REE in monazite whilstyttrium and gadolinium are the least abundant. It is important to highlight that the exergycost allocation factors are based on ERC (which in turn are independent on the mass outputproduct or metal prices) this is why exergy cost allocation factors provide more objective valuesto perform any distribution of resources among the different products obtained from the sameprocess.
Table 5.13: Exergy Cost Allocation of REE.Commodity Output Exergy Cost Unit Price Price Ton.
product [kg] a.f. [%] [$/kg] a.f. [%] a.f. [%]
Lanthanum 0.228 12.2 38 26.2 27.9
Cerium 0.392 54.2 30 35.6 48
Praseodymium 0.043 17.0 60 7.8 5.3
Neodymium 0.147 14.9 63 27.9 18
Gadolinium 0.004 1.6 165 2.2 0.5
Yttrium 0.002 0.2 50 0.3 0.3
5.8 Summary
In this chapter, the tools described in the Ch. 4 have been improved, so as to adapt the method-ologies to the analysis of mining and metallurgical systems. Accordingly, an analysis of theenergy used in mining as function of ore grade, the exergy replacement cost and the unit exergycosts of different minerals have been performed. Results obtained were published in Domínguezet al. (2013). The general observed trend is that as the ore grade declines, the energy and theexergy replacement costs increase exponentially. A mineral has a high exergy replacement costwhen 1) the concentration of the mineral in the crepuscular crust (in Thanatia) is low and thedifference between the ore grade of the current mines (xm) is high and/or 2) when the energyrequired to extract the mineral and beneficiate it is significant.
The obtained values are an intermediate step for assessing in a physical way, the free ex-ergy provided by Nature that man is rapidly destroying through the depletion of high-gradeores. This should serve as an assessment tool for decision-makers in the mineral industry. Itshould be stated that the values obtained are first assessments. Important assumptions have
121

been made, such as assuming that the same technology is applied for the whole range of gradesanalyzed, including the crepuscular ore grade. One of the major limitations found is the lack ofreal data over time. So estimation of future trends of this issue without real and reliable infor-mation becomes subjective. Therefore, the results and data provided are an attempt to affordindicators for identifying challenges and opportunities in the mining sector and should not betaken as final and closed.
An additional activity undertaken in this chapter was to propose a new allocation method.Since the mining and metallurgical industry commonly produces two or more commoditiessimultaneously and bearing in mind that the use of LCA in these processes will continue to in-crease, the necessity to look for suitable by-product cost allocation procedures, was presented.In this chapter, three cost allocation approaches through tonnage, price and exergy replace-ment cost were analyzed and applied to 33 different mineral deposits. The exergy replacementcost allocation procedure was further applied to four metallurgical processes (copper, nickel,lead and REE), using an extended thermoeconomic approach. It was demonstrated that costallocation through tonnage is not always a suitable option because minor by-products appear-ing at very low concentrations can be even more valuable than the major product. With mar-ket prices used to perform cost allocations, the problem is associated with their high volatility,which in turn depends on macroeconomic variables that commonly do not reflect the physicalconditions of non-fuel mineral resources in Nature and the fact Man is destroying the mineralwealth on Earth, which will be unavailable for future generations. The exergy cost allocationusing exergy replacement cost provides in turn, objective values to dispersion and offers a “nat-ural” cost of minerals extracted. Furthermore, it measures mineral endowment depletion on agrave to cradle basis.
Once the general basis to perform a complete exergy analysis of mineral resources and themetallurgical processes have been presented, in the next chapter a more detailed exergy analy-sis of the processing of seven metals is carried out.
122

Chapter 6
Exergy analysis of metal processing
In this chapter, the exergy analysis is applied to seven metals through three different method-ologies. Firstly, the exergy accounting for the case of nickel processing is performed by applyingthe methodology used first by Ayres et al. (2006). However, the scope of this methodology is ex-tended in the “cradle to market” path through the use of the Thermo-ecological Cost (TEC). Ac-cordingly, in second place, an exergy analysis through the TEC methodology is accomplishedin order to extend the scope of the mineral processing from a specific mining operation to ageneral mineral production system. Finally, the same analysis is carried out through a com-bination of the TEC and the ERC. The result is an improved TEC methodology (denoted hereas TERC) with which an absolute exergy life cycle analysis can be accomplished (including alsothe grave-cradle approach), thereby allowing for a complete and deeper assessment of non-fuelmineral processing. The resulting “TERC” analysis has been further applied to seven mineralprocessing chains: aluminium, copper, chromium, gold, iron, nickel and manganese.
6.1 Exergy accounting applied to mineral processing
As was explained throughout this thesis, exergy analysis can be used to assess energy and ma-terial inputs and outputs in metallurgical systems whilst also helping to identify opportunitiesfor improving the efficiency of processes and help to achieve a more sustainable mining sector.Some commodities related to nickel production, like iron and steel, have already been the sub-ject of exergy analyzes. For instance, Michaelis et al. (1998) applied the exergy analysis to thesteel life cycle concluding that electricity use is one of the largest exergy consumers in its pro-duction. Costa et al. (2001) likewise undertook exergy accounting of energy and material flowsfor various steel production processes, coming to the conclusion that overall exergy losses arehighly dependent on the efficiency of electricity generation. Ostrovski & Zhang (2005) focusedon identifying exergy losses of specific processes such as direct iron smelting. They found thatthe overall fuel efficiency depends on the utilisation of gases emitted as by-products.
Other investigations, such as the exergy assessment of natural resources accomplished byFinnveden & Ostland (1997) demonstrated that chemical exergies along with specific systemboundaries may be used as a characterisation method in life cycle assessments as well as otherapplications of exergy analysis.
This section undertakes an exergy analysis of the two main routes for nickel production,namely from laterites and sulphides. Exergy inputs and outputs as well as exergy efficiencies
123

for both, including their disaggregated steps, are presented and discussed.
6.1.1 The case of nickel processing
The exergy accounting for the case of nickel processing is performed by applying the method-ology used first by Ayres et al. (2006) who accomplished exergy analyzes of five metal industries:steel, aluminium, cooper, lead and zinc. Ayres et al. consider that although exergy can be di-vided into four components: kinetic, potential, physical and chemical, only the last one shouldbe taken into account. Considering that the systems under analysis are chemical and metal-lurgical processes, the first three components are disregarded, and only the chemical exergycomponent is used to assess and analyze mining operations. Hence, the methodology is basedon the assumption that chemical exergy is the main and only component taken into account.
It is however important to point out that physical exergy bph1 is relevant for analysing ther-
mal and mechanical processes such as power plants, yet not so important when chemical andmetallurgical processes are surveyed. Consequently, the exergy associated with pressure ortemperature should be considered in those processes where these properties show a signifi-cant differentiation relative to the environment (e.g., steam production). In this regard, an ex-ergy analysis applied to the life cycle of steel performed by Michaelis et al. (1998) suggest thatboth, the physical and chemical exergies, must be considered in order to take into account thepressure or temperature differences relative to environmental conditions. However, one of theconclusions of this study was that steel production is primarily a chemical process and there-fore, physical exergy can be disregarded.
As already explained in Chapter 4, the chemical exergy bch is the work that can be obtainedby a substance having the parameters T0 and P0 to a state of thermodynamic equilibrium withthe datum level components of the environment2 and thus is closely related to the energy re-quired in the metallurgy of the mineral.
In this particular case study, the chemical exergies for each mass flow in the process of nickelproduction are obtained through Eq. 4.27. The chemical exergy content of fuels meanwhile, hasbeen determined by multiplying an exergy coefficient by its net heating value, as performed inSzargut et al. (1988b).
A list of several substances involved in nickel production from laterites and sulphide ores,their chemical exergy and exergy coefficients of fossil fuels is presented in Table 6.1.
1Physical exergy is the work obtainable by taking a substance through reversible physical processes from itsinitial state (temperature T, pressure p) to the state determined by the temperature T0 and the pressure P0 of theenvironment, (Szargut et al. 1988b).
2The reference environment used in this work is that proposed by Szargut et al. (1988b) and is commonly usedto calculate standard chemical exergies for a number of chemical compounds and pure elements.
124
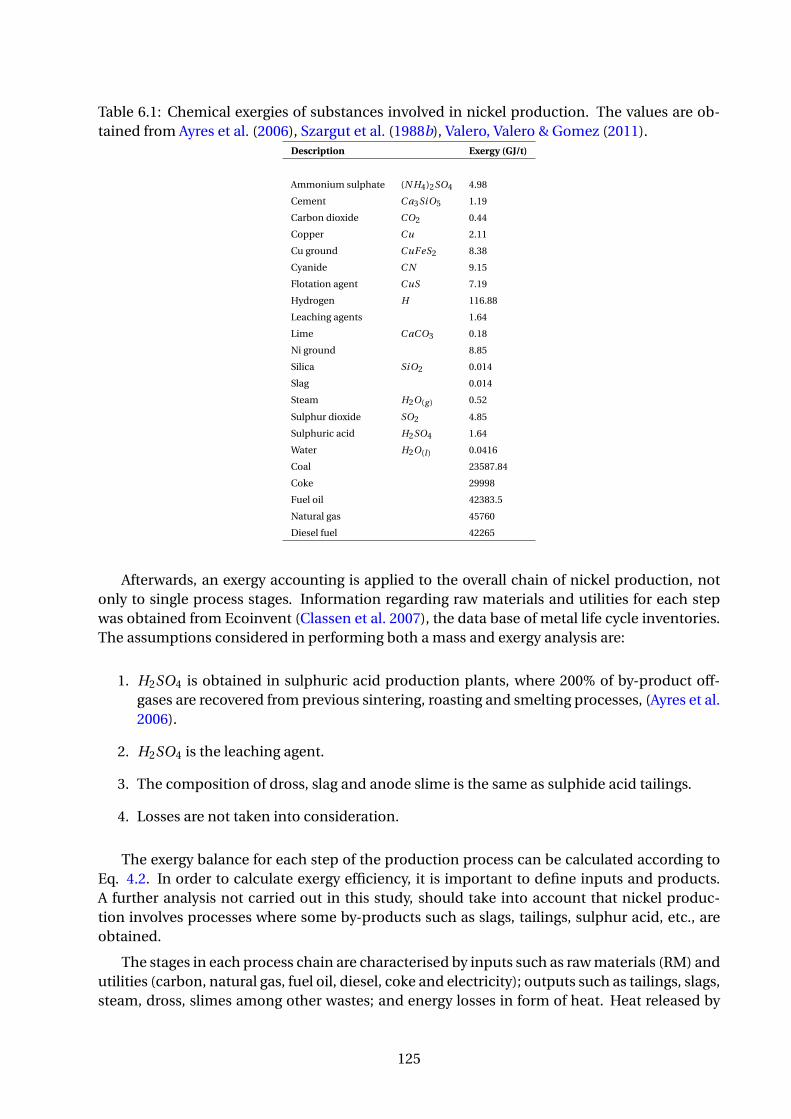
Table 6.1: Chemical exergies of substances involved in nickel production. The values are ob-tained from Ayres et al. (2006), Szargut et al. (1988b), Valero, Valero & Gomez (2011).
Description Exergy (GJ/t)
Ammonium sulphate (N H4)2SO4 4.98
Cement C a3SiO5 1.19
Carbon dioxide CO2 0.44
Copper Cu 2.11
Cu ground CuFeS2 8.38
Cyanide C N 9.15
Flotation agent CuS 7.19
Hydrogen H 116.88
Leaching agents 1.64
Lime C aCO3 0.18
Ni ground 8.85
Silica SiO2 0.014
Slag 0.014
Steam H2O(g ) 0.52
Sulphur dioxide SO2 4.85
Sulphuric acid H2SO4 1.64
Water H2O(l ) 0.0416
Coal 23587.84
Coke 29998
Fuel oil 42383.5
Natural gas 45760
Diesel fuel 42265
Afterwards, an exergy accounting is applied to the overall chain of nickel production, notonly to single process stages. Information regarding raw materials and utilities for each stepwas obtained from Ecoinvent (Classen et al. 2007), the data base of metal life cycle inventories.The assumptions considered in performing both a mass and exergy analysis are:
1. H2SO4 is obtained in sulphuric acid production plants, where 200% of by-product off-gases are recovered from previous sintering, roasting and smelting processes, (Ayres et al.2006).
2. H2SO4 is the leaching agent.
3. The composition of dross, slag and anode slime is the same as sulphide acid tailings.
4. Losses are not taken into consideration.
The exergy balance for each step of the production process can be calculated according toEq. 4.2. In order to calculate exergy efficiency, it is important to define inputs and products.A further analysis not carried out in this study, should take into account that nickel produc-tion involves processes where some by-products such as slags, tailings, sulphur acid, etc., areobtained.
The stages in each process chain are characterised by inputs such as raw materials (RM) andutilities (carbon, natural gas, fuel oil, diesel, coke and electricity); outputs such as tailings, slags,steam, dross, slimes among other wastes; and energy losses in form of heat. Heat released by
125

the system into the surroundings is by convention, a negative quantity, whilst the energy trans-ferred to the system as heat from its surroundings is a positive quantity. In the flow diagramsshown in Figures [6.1-6.3] as well as in the Tables [ 6.2 - 6.4], values are expressed in mass unitsfor raw materials and in energy units for fuels and heat.
Table 6.2: Main mass and energy flows for the production of 1 kg of nickel from laterites.Process Mining Drying Roasting Refining Other Melting
Inputs [kg]
Ni ground 1.74
Explosive 0.001
Lime 0.47
Utilities [MJ]
Diesel 1.91
Electricity 0.11 2.34 2.88 24.48 1.08 1.8
Natural gas 28.8 1
Fuel oil 3.75
Coal 40
Outputs [kg]
Overburden 18
Slag 12.4
Dust 0.3
Carbon dioxide 0.21
Wastes [kg]
Dust 0.01
Waste heat [MJ] 32.29 46.4 24.34 33.4 2.62
Table 6.2 displays the main mass and energy consumption of each production step whenthe starting material is nickel laterites. The simplified mass flow diagram of the production of1 kg of nickel from these sources is presented in Fig. 6.1, including the associated exergy flowsentering or leaving the system.
126
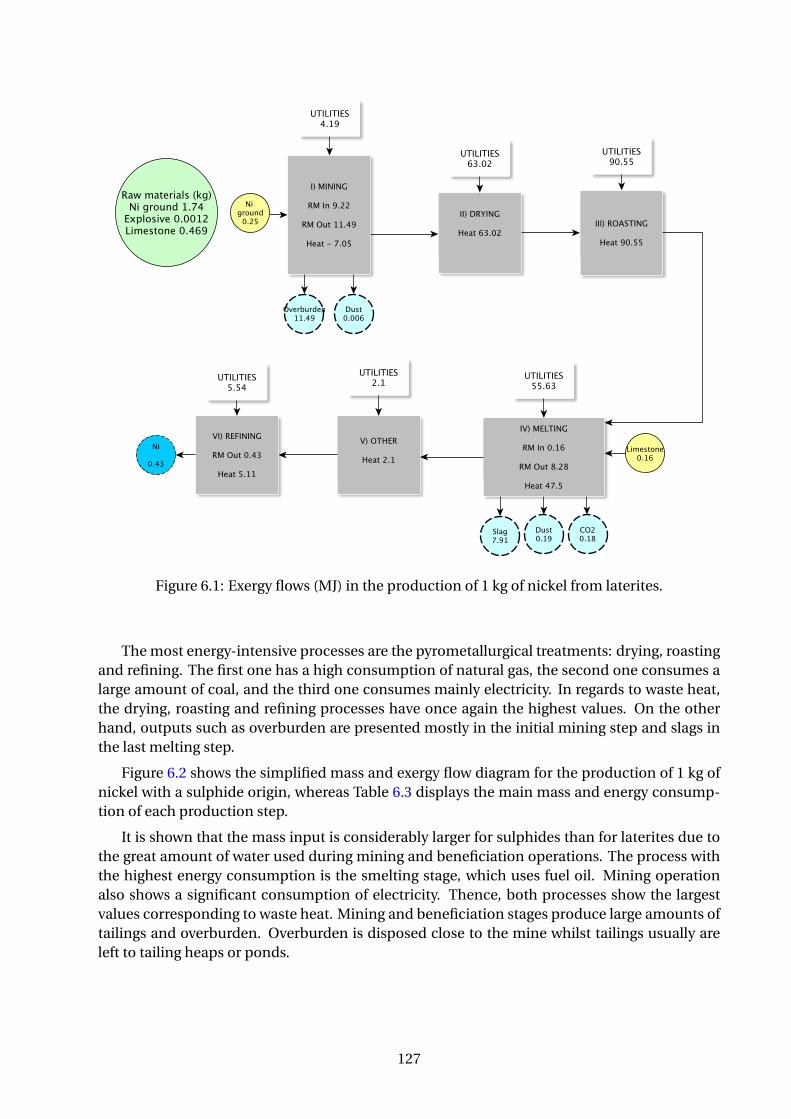
Figure 6.1: Exergy flows (MJ) in the production of 1 kg of nickel from laterites.
The most energy-intensive processes are the pyrometallurgical treatments: drying, roastingand refining. The first one has a high consumption of natural gas, the second one consumes alarge amount of coal, and the third one consumes mainly electricity. In regards to waste heat,the drying, roasting and refining processes have once again the highest values. On the otherhand, outputs such as overburden are presented mostly in the initial mining step and slags inthe last melting step.
Figure 6.2 shows the simplified mass and exergy flow diagram for the production of 1 kg ofnickel with a sulphide origin, whereas Table 6.3 displays the main mass and energy consump-tion of each production step.
It is shown that the mass input is considerably larger for sulphides than for laterites due tothe great amount of water used during mining and beneficiation operations. The process withthe highest energy consumption is the smelting stage, which uses fuel oil. Mining operationalso shows a significant consumption of electricity. Thence, both processes show the largestvalues corresponding to waste heat. Mining and beneficiation stages produce large amounts oftailings and overburden. Overburden is disposed close to the mine whilst tailings usually areleft to tailing heaps or ponds.
127

Figure 6.2: Exergy flows (MJ) in the production of 1 kg of nickel from sulphides - option A.
As aforementioned, there are sundry routes to produce nickel from sulphide ores. Figure6.3 shows the mass and exergy flows associated with an alternative production route. Table 6.4displays the main mass and energy consumption of each production step shown in Figure 6.3from which exergies are obtained.
Table 6.4 depicts that leaching technologies are those that have the higher utilities con-sumptions in the form of electricity. Leaching processes performed with sulphidic acid involvethe use of off-gas and shows a high value of waste heat. Till heap leaching operation presentsdifferent kinds of wastes or even copper as a by-product.
Broadly, it can be observed, that exergy wastes in form of heat are considerably higher dur-ing production of nickel from laterite ores than those of the sulphide ores due to their complexmetallurgy. Therefore, as expected exergy efficiency values are lower than for sulphides.
Table 6.5 shows results of exergy and exergy efficiency obtained for eleven different routesof nickel production. It is noticeable that exergy consumption during mining and beneficia-tion steps for laterites is smaller than for sulphides, due to the fact that laterite ores are mostlymined open cut and beneficiation is carried out by easy and economic techniques. Otherwise,exergy required during the refining process of laterites is larger than for any sulphide optionbecause laterites cannot be significantly upgraded or concentrated before the smelting and re-fining steps, hence almost all laterite ore mined must be treated in the entire process.
128

Table 6.3: Main mass and energy flows for the production of 1 kg of nickel from sulphides -option A.
Process Mining Beneficiation Drying Roasting Smelting Converting Electrolysis
Inputs [kg]
Ni ground 1.26
Cu ground 0.65
Explosive 0.17
Water 106.1 152
Sand 45.6 0.54 1.66
Cement 3.62
Lime 0.16 0.54 1.66
Cyanide 0.004
Sulphuric Acid 0.25
Utilities [MJ]
Diesel 11.2
Electricity 15.7 0.25 0.78 10.44 5.09 5.1
Natural gas 2.44 2.8 3.05 3.97
Fuel oil 1.8 24.8
Coke 2.2
Outputs [kg]
Sulphidic tailings 50.7 65
Tailings 33.3
Slag 10.5 0.39
Sulphur dioxide 1.5
Wastes [kg]
Steam 0.78 13.1 2.86
Anode slime 0.07
Spoiled anodes 0.18
Waste heat [MJ] 37.01 2.89 2.628 24.79 6.65 9.14
Table 6.4: Main mass and energy flows for several processes in the production of 1 kg of nickelfrom sulphides .
Process Sulphuric Leaching Reduction Carbonyl Purification Hydrogen
acid of leaching reduction
Inputs [kg]
Off gas 22.6
Leaching agents 0.08
Hydrogen 0.005
Utilities [MJ]
Electricity 4.49 2.62 0.06 0.82 0.06 0.06
Natural gas 1.76
Fuel oil 1.21
Wastes [kg]
Ammonium sulphat 0.3
Precipitates 0.17
Dross 0.03 0.001
Copper 0.51
Steam 0.24
Waste heat [MJ] 22.98 1.95 0.06 2.35
129

The exergy values presented in Table 6.5, show the same tendency as energy consumptionfor nickel production presented in Table 2.10 in Chapter 2, since in both cases, energy and ex-ergy analysis, it can be observed that greater values are presented for nickel production comingfrom laterites than from sulphides, although the chemical exergy of laterites (0.0788 GJ/t) issmaller than for sulphides (8.85 GJ/t).
Figure 6.3: Exergy flows (MJ) for several processes in the production of 1 kg of nickel from sul-phides.
Exergy required to obtain 1 kg of nickel from laterites or sulphide ores is 221 GJ/t and 127GJ/t, respectively, as depicted in Table 6.5. However, different values can be obtained depend-ing on: the system boundary selected (for instance, if direct electricity or the primary energysources extracted from the environment used to produce electricity, are considered as inputs),the accurate composition of ores (based on information from specific mines), the multi-outputallocation problem (which usually takes place in mining and metal production where severalmetals are produced from the same raw material) and the way in which it is solved. Sulphideore processing has efficiencies fluctuating from 0.67 to 0.79, depending on the specific tech-nologies utilised. The higher efficiencies are reached when leaching technologies are used. Onthe contrary if nickel is produced from laterites, the efficiencies achieved are lower on average(0.38) due to the cost-intensive processing.
130

Table 6.5: Exergy and exergy efficiency in nickel production. Values expressed in GJ/ton of Ni.Process Mining and Smelting and Total Exergy
beneficiation refining Efficiency ε
Laterites 4.45 217.02 221.46 0.39
Sulphides
A 61.17 65.71 126.88 0.67
B 61.17 58.60 119.77 0.71
C 61.17 61.07 122.25 0.69
D 61.17 52.68 113.85 0.75
E 61.17 59.79 120.96 0.71
F 61.17 55.01 116.18 0.73
G 61.17 56.83 118 0.72
H 61.17 46.88 108.06 0.79
I 61.17 51.52 112.7 0.76
The obtained results allow to have a unified picture of the overall processes involved innickel production. The use of the same units for all inputs and outputs facilitates a directcomparison among production routes, the establishment of efficiency ratios including not onlyenergy (in form of electricity, diesel, natural gas or coal), but also water and raw material con-sumptions and the identification of improvement possibilities. This way for instance, it hasbeen stated that when leaching technology is used to produce nickel, higher efficiencies areobtained than when electrolysis processes are utilised.
Nevertheless, there are some aspects in this methodology that are not taken into account.One of the most limiting shortcomings of the exergy analysis is its complexity of calculationand in the understanding of it for non-exergy practitioners, including plant engineers or deci-sion makers. This means that the advantages of using exergy as an accounting tool need to beperfectly justified and in this regard, exergy analysis should provide information and solutionsthat other more conventional analyzes are unable to do.
The total exergy associated with the production of nickel is lower for sulphides than forlaterites. But the same conclusion can be drawn if the analysis is carried out regarding onlyenergy values (as revealed by Table 2.10), since the use of other substances is not very relevant.Hence, the use of exergy as it was implemented here is not justified. The same thing happenswith many other metals where the dominant factor in the production chain is the consumptionof energy and not of water, chemicals, etc.
Furthermore, awkward results can be obtained when using only the chemical exergy of sub-stances as an accounting tool. For instance, a common chemical used in the metallurgy sector,sulphuric acid, has a chemical exergy value of 161 kJ/mol, whereas scarce and precious gold hasonly 60 kJ/mol. Here it can be seen clearly that the chemical exergy component is not alwaysa good accounting tool and should not be used in isolation. In the case study, laterites havean almost negligible chemical exergy, although the energy requirements and exergy account-ing results are greater than those obtained for sulphides, which in turn have a greater chemicalexergy.
There is an important factor missing from the methodology, namely the concentration ex-ergy. As explained previously, laterites are more abundant than sulphides. If only chemical ex-ergy is taken into account, then it is clear that the best way to produce nickel is from sulphides.In the same way, from a chemical exergy point of view, gold is of little value. Therefore, the wayin which the minerals are found on the crust is completely ignored with the methodology sug-gested by Ayres et al. (2006). This shortcoming is solved by integrating the Exergy replacement
131

cost into the calculations, as performed in the next sections. The latter approach implies thatthe scarcity factor of mineral resources should be accounted for when assessing the sustainabil-ity of mining and metallurgical processes. If this is indeed carried out, the advantage of usingsulphides over laterites is not so evident.
Additional and detailed information in regards to mining processing can be obtained if theboundaries of the analyzed system are expanded. For instance, the analysis of a specific min-ing operation can be enlarged if the system of energy production (power and refinery plants)required to produce minerals is included. The latter can be performed through the Thermo-Ecological Cost methodology, which also will be complemented with the Exergy replacementcost, as depicted in next sections.
6.2 Thermo-Ecological Cost applied to metallurgical systems
The Thermo-Ecological Cost (TEC) expresses the cumulative consumption of non-renewableexergy per unit of the considered useful product (Szargut 1986, 1989, 2005) and provides a cra-dle to market approach. In this section, the analysis of nickel processing is extended with theTEC methodology, broadening the scope from a mineral processing operation to a more com-plex metallurgical system where the power and refinery plants (required to satisfy the energyconsumption of minerals production) are included into the exergy analysis.
6.2.1 TEC analysis: the case of nickel production
The first step to calculate the TEC of a process is to identify the inlet and outlet flows of raw ma-terials, semi-finished products and products for each stage. In order to exemplify the method-ology, the case of nickel production is analyzed first.
In Chapter 2 – section 2.2.13, the general route to produce nickel from sulphide ores hasbeen explained. It includes several steps, namely: ore mining, beneficiation, drying, roasting,smelting, converting, sulphuric acid, leaching, reduction, electrolysis, purification of leachateand carbonyl. There are assorted processes used to produce nickel. These variations dependon factors such as the grade or the concentrate and the presence of other metals in the materialmined. The options for nickel production from sulphide concentrates are classified in Table2.11. Nevertheless, Fig. 6.4 depicts the nickel processing route A: mining, beneficiation, drying,roasting, smelting, converting and electrolysis.
132

Figure 6.4: Nickel production system for sulphide ores.
Whilst, the way to produce nickel from laterite ores, described in Chapter 2 – section 2.2.12,consists mainly of five linked operations: ore mining, drying, roasting, melting and refining,as depicts Fig.6.5. Accordingly, Tables 6.6 and 6.7 contain data of sulphide and laterite ores,respectively.
133
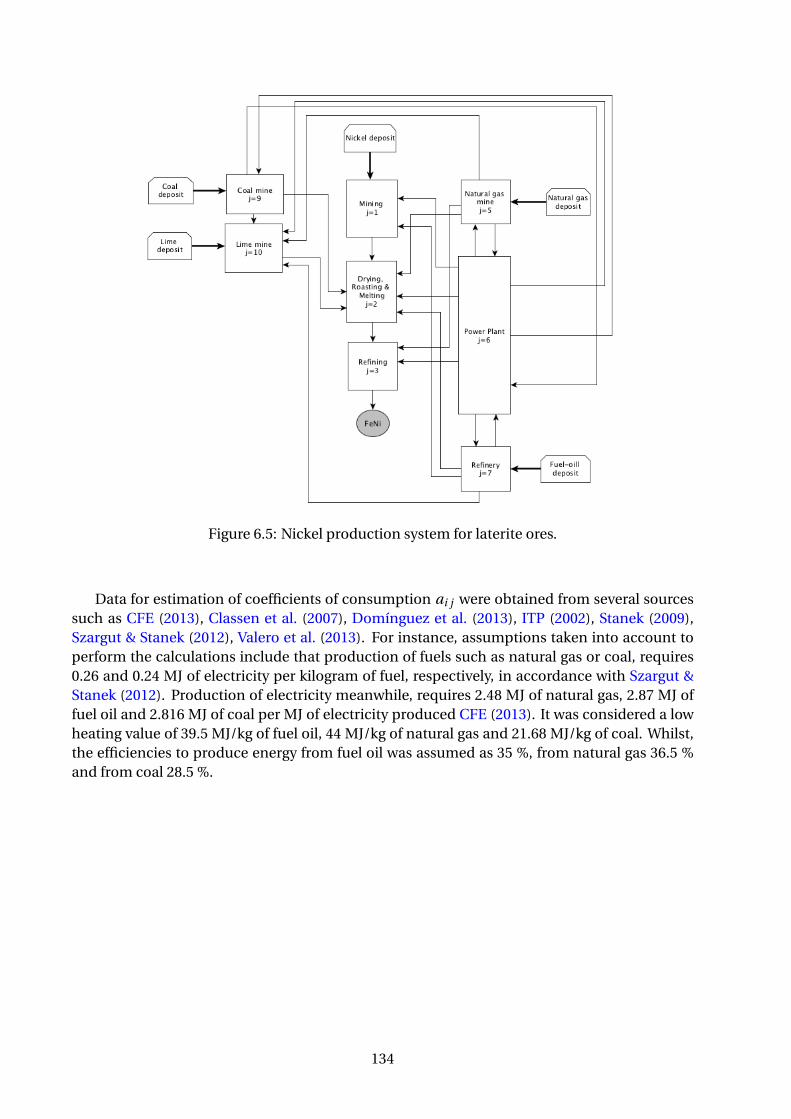
Figure 6.5: Nickel production system for laterite ores.
Data for estimation of coefficients of consumption ai j were obtained from several sourcessuch as CFE (2013), Classen et al. (2007), Domínguez et al. (2013), ITP (2002), Stanek (2009),Szargut & Stanek (2012), Valero et al. (2013). For instance, assumptions taken into account toperform the calculations include that production of fuels such as natural gas or coal, requires0.26 and 0.24 MJ of electricity per kilogram of fuel, respectively, in accordance with Szargut &Stanek (2012). Production of electricity meanwhile, requires 2.48 MJ of natural gas, 2.87 MJ offuel oil and 2.816 MJ of coal per MJ of electricity produced CFE (2013). It was considered a lowheating value of 39.5 MJ/kg of fuel oil, 44 MJ/kg of natural gas and 21.68 MJ/kg of coal. Whilst,the efficiencies to produce energy from fuel oil was assumed as 35 %, from natural gas 36.5 %and from coal 28.5 %.
134

Tab
le6.
6:C
on
sum
edp
rod
uct
sd
uri
ng
Nip
rod
uct
ion
fro
msu
lph
ide
ore
-o
pti
on
A.
Co
nsi
der
edj t
hp
roce
ss
12
34
56
78
910
11
kg_N
ikg
_Ni
kg_N
ikg
_Ni
kg_N
GM
J_p
pkg
_Rkg
_Cu
kg_c
oal
kg_l
ime
kg_c
em
1kg
_Ni
2.80
2kg
_Ni
1.14
3
3kg
_Ni
1.24
6
4kg
_Ni
5M
J_N
G1.
871
2.66
93.
178
2.48
00.
005
0.00
5
6M
J_P
P2.
110
4.09
64.
454
4.09
10.
260
0.08
00.
240
0.01
40.
450
Co
nsu
med
7M
J_R
1.50
510
.290
2.87
00.
022
i th
pro
du
ct8
kg_C
u0.
087
aij
[i]/
[j]
9M
J_co
al2.
816
0.00
10.
151
10kg
_lim
e0.
021
0.78
6
11kg
_cem
0.48
7
12kg
_sil
6.12
90.
786
13kg
_NaC
N0.
001
14kg
_su
lph
0.03
4
15kg
_Cu
S0.
0147
2
Ch
emic
alb
jM
J/[j
]8.
8545
.76
42.2
658.
3423
.58
0.2
0.24
Exe
rgy
Co
nce
nt.
bj
MJ/
[j]
260.
2738
.22
1.47
Exe
rgy
135

It is important to note that Tables 6.6 and 6.7 are related to a physical structure which depictsthe overall connections between each branch as shown in Fig. 6.4 for sulphides ores or in Fig.6.5for laterites ores.
Table 6.7: Consumed products during Ni production from laterite ore.Considered jth process
1 2 3 4 5 6 7 8
kg_Ni kg_Ni kg_Ni kg_NG MJ_pp kg_R kg_coal kg_lime
1 kg_Ni 3.5
2 kg_Ni 1.286
Consumed 3 kg_Ni
ith product 4 MJ_NG 8.229 0.777 2.48 0.005
ai j [i]/[j] 5 MJ_PP 0.028 8.486 2.24 0.260 0.08 0.24 0.014
6 MJ_R 0.503 1.071 2.87 0.022
7 MJ_coal 11.43 2.816 0.001
8 kg_lime 0.134
Chemical b j MJ/[ j ] 0.07 45.76 42.265 23.58 0.2
Exergy
Concent. b j MJ/[ j ] 56.84 1.47
Exergy
Subsequently, the TEC balance through Eqs.4.23–4.24 is applied individually for each pro-cess j th of nickel production from sulphide ores, in order to obtain two equations for eachbranch. Hence, it is necessary to define the value for each coefficient a and f , which are relatedwith the real production process shown in Fig. 6.4. The utilities used during the nickel produc-tion process through the different stages are gathered in the Ecoinvent database (Classen et al.2007). Nickel production from sulphide ore using leaching (option B - Table 6.9) leads to obtaincopper as a by-product. Thence, the coefficient f is the amount of copper as by-product in themining step and represents the avoided cost of mine copper because it is mined together withnickel ore.
There are three types of equations that can be formulated depending if the process underanalysis corresponds to the production of:
1. Mineral. When an ore is mined frequently different minerals are obtained. For this rea-son, a mineral can be acquired as a main product or as by-product. Hence, both caseshave different TEC equations.
- Production of a mineral as a main product includes electricity from power plant,fuels, raw minerals, other minerals presented in the same ore where the desiredmineral is mined and the exergy of the mineral. For instance, the following Eqs.6.1–6.2 relate all links between the different processes needed during the first stepof nickel production: mining and beneficiation ( j = 1), shown in Fig. 6.4. It shouldbe noticed that exergy of the mineral appears only in Eq. 6.1, because Eq. 6.2 repre-sents the TEC part due to fuel consumption.
ρ1 = a6,1 ·ρ6 +a7,1 ·ρ7 +·· ·+bNi (6.1)
z1 ·ρ1 = a6,1 ·ρ6 · z6 +a7,1 ·ρ7 · z7 + . . . (6.2)
136

- Production of a mineral as by-product includes the same inputs as production of a min-eral as a main product, but additionally the by-product term must be included. For ex-ample, in this study copper is produced as a by-product during the electrolysis process ofnickel production from sulphide ore depicted in Fig. 6.4. Then, Eqs. 6.3–6.4 are obtained:
ρ4 = a3,4 ·ρ3 +a5,4 ·ρ5 +·· ·− f4,8 ·ρ8 (6.3)
z4 ·ρ4 = a3,4 ·ρ3 · z3 +a5,4 ·ρ5 · z5 +·· ·− f4,8 ·ρ8 · z8 (6.4)
Fuel. In general when a fuel is produced, for instance natural gas, coal or fuel oil, the maincontribution to its TEC is electricity and its chemical exergy. For production of natural gas ( j =5) shown in Fig. 6.4, Eqs. 6.5–6.6 are obtained. It is important to mention that the fuel exergyis included in both equations and not only in the first one as in the case of mineral production(Eqs. 6.1–6.2).
ρ5 = a6,5 ·ρ6 +bNG (6.5)
z5 ·ρ5 = a6,5 ·ρ6 · z6 +bNG (6.6)
Products which are not obtained directly from nature e.g. electricity. The main inputs for theelectricity production in a power plant ( j = 6) are fuels such as natural gas, oil and coal, as Fig.6.4 depicts and Eqs. 6.7–6.8 express:
ρ6 = a5,6 ·ρ5 +a7,6 ·ρ7 +a9,6 ·ρ9 (6.7)
z6 ·ρ6 = a5,6 ·ρ5 · z5 +a7,6 ·ρ7 · z7 +a9,6 ·ρ9 · z9 (6.8)
Once the TEC methodology has been applied, the ERC are introduced in the set of equationslisted previously. This way, the exergy of the mineral denoted by bNi in Eq. 6.1 is substituted bythe ERC. The same procedure is performed to those equations which involve mineral resources.The Exergy Replacement Cost of the commodities analyzed in this chapter are presented inTable 5.2, in Chapter 5. The aforementioned fusion of TEC and ERC is explained in the nextsection.
6.3 Integration of the Thermo-Ecological Cost and Exergy Re-placement Cost to assess mineral processing
The motivation to join both indicators, Thermo-Ecological Cost and Exergy Replacement Cost,starts when I was in a 3-month research stay at the Institute of Thermal Technology of the Sile-sian University of Technology in Poland. Professor Stanek explained me their Thermo-EcologicalCost methodology. He had applied the TEC method to a simplified steel work (Szargut & Stanek(2012)) and results showed that the mineral part of TEC was always smaller when comparedto the fuel part, due to the fact that in TEC analysis, the mineral part was obtained taken into
137

account only the chemical exergy of mineral resources. However, this assumption is not al-ways sufficient when mineral resources are assessed, as explained in Chapter 5. The value of amineral is very much associated with its scarcity degree. This is why the concentration exergycomponent, accounted for through the Exergy Replacement Cost, is very relevant when non-fuelminerals come into play.
The original TEC approach leads to results implying that mainly exergy coming from fuelconsumption influences the Thermo-Ecological Cost of a particular good. Therefore, it sug-gests that non-fuel mineral consumption is of minor relevance from the Thermo-EcologicalCost Theory point of view. As this is not necessarily true, the TEC methodology is comple-mented with ERC, so as to account for the impacts associated with mineral consumption anddispersion. Details of both methodologies can be consulted in chapter 5.
As aforementioned, the TEC provides a cradle to market approach. The ERC, meanwhile,enhances the TEC because it assesses the concentration exergy that would be expended in re-covering a mineral deposit from the material dispersed in the Earth’s crust with the availabletechnology through a grave to cradle approach developed by Valero & Valero (2010a). Resultsshow that when Exergy Replacement Costs are embedded into the TEC infrastructure, the im-pacts associated with mineral consumption are significantly greater. Accordingly, the inclusionof ERC into TEC allows for a more comprehensive and fairer weight to the consumption of non-fuel mineral resources, thereby providing better indications as to the achievement of a moresustainable production.
TERC methodology proposed in this chapter, means that the Thermo-ecological cost iscomplemented with the Exergy Replacement Cost, with the main objective to integrate con-centration exergy of mineral resources into the cumulative exergy account associated with theproduction of a particular commodity performed through the TEC method.
The Thermo-Ecological and Exergy Replacement Costs of mineral processing are very vari-able, depending on raw material sources, production process and final products obtained. Bothmethodologies have been applied to seven different cases of metal production. In order to ex-plain the procedure that integrates the ERC into TEC analysis, the results from the case of nickelprocessing will be analyzed first.
6.3.1 TERC analysis of nickel production
Both methodologies have been applied to three different cases of nickel production: nickel fromsulphide ore using electrolysis (option A - Table 6.8), nickel from sulphide ore using leachingobtaining copper as a by-product (option B - Table 6.9), and ferronickel from laterite ore (Tables6.10 and 6.11). Ni1, Ni2, Ni3, Ni4 represent Ni obtained at each of the processes involved in thenickel production chain, which are shown in Figs. 6.4 and Fig.6.5. Results of the exergy analysisof nickel production are presented in four sections, as follows: 1) TEC methodology, 2) TECcomplemented with ERC, and 3) sensitivity analysis.
TEC methodology
In order to explain the results of TEC analysis, results of nickel production from sulphide ores(option A) and shown in Table 6.8 will be explained. TEC increase through the first step of min-ing and beneficiation (27.29 MJ/kg_Ni) until the last electrolysis step (179.2 MJ/kg_Ni), becausein this final step the highest amount of energy consumption (as electricity and natural gas)
138

takes place as Table 6.6 depicts. The opposite occurs with zm values which decrease from min-ing and beneficiation operations (63.87 %) to electrolysis process (39.64 %) because the mainimpact in regards to mineral part is presented during the initial step which is directly connectedwith nickel deposit, as can be observed in Fig. 6.4. Besides, Table 6.8 shows that smelting andrefining processes consume most of the energy required to produce nickel, whilst mining andbeneficiation steps consume around 7-35%, as reported by Eckelman (2010). Processes wherethe Thermo-Ecological Cost mineral part is zero are those in which all of the burden is due tothe consumption of fossil fuels like in the natural gas plant, the power plant, the refinery andthe coal mine.
Table 6.8: Thermo-Ecological and Exergy Replacement Costs for Ni production from sulphideore - option A.
TEC TEC+ERC
Process ρ j zm r j ρ j zm r j
MJ/[ j ] [%] MJ/[ j ] [%]
1 Ni Mining–Beneficiation 27.29 63.87 3.005 278.6 96.37 31.4
2 Ni Drying–Roasting–Smelting 104.8 48.39 809.75 93.37
3 Ni Converting 131.5 42.52 937.13 91.78
4 Ni Electrolysis 179.2 39.64 1183.22 90.7
5 Natural gas 1.07 0 1.017 1.07 0 1.017
6 Power Plant 3.98 0 3.98 0
7 Refinery 1.08 0 1.006 1.08 0 1.006
8 Copper ore 8.34 100 1 38.22 100 4.583
9 Coal 1.121 0 1.03 1.133 0 1.03
10 Lime 0.279 73.93 1.353 1.549 95.42 7.703
11 Cement 1.76 13.82 1.736 13.82
12 Silica 1.5 95 1.84 95
13 NaCN 9.15 1 29.42 1
14 Sulphuric acid 14.53 1 14.53 1
15 CuS 7.19 1 32.59 1
Analyzing option B, when leaching technology takes place during nickel production fromsulphide ores, by-products such as copper can be obtained. In this case copper is gained whenthe electrolysis operation of Fig. 6.4 is replaced by a leaching operation. Hence, a new productis obtained in the process and values for TEC are shown in Table 6.9. It can be observed that themineral part of TEC has a greater influence in nickel and copper ore than in nickel and copperas a final product.
One of the challenges of the mining industry is the multi-output allocation problem, ana-lyzed in Chapter 5.3. The nickel production has this hitch, due to the nickel and copper contentof sulphide ores. Depending on the process utilized, copper can be obtained as a by-product.It is important to highlight that in this study, copper is mined together with nickel sulphide ore.Accordingly, it is necessary to perform an assignment of resources required during its mining.Nevertheless, until today there is not an agreement if this must be done based on tonnage, mar-ket price or energy (exergy) values. In TEC methodology, all fuel inputs required during nickeland copper mining and beneficiation processes are assigned directly to nickel. Whilst copper isincluded in the analysis through Eqs. 6.3 and 6.4. Then the mineral part of copper always willbe 100 %. Obviously, this is not a reasonable allocation method because all burden is allotted tonickel. Therefore, in Chapter 5.3 an objective allocation method based on ERC of commoditieswas applied.
139

Table 6.9: Thermo-Ecological and Exergy Replacement Costs of mineral inputs in Nickel pro-duction with Copper as by-product - option B.
Ni ore Ni Lime Cu ore Cu
ρ j MJ/[ j ] 27.29 138.31 0.279 8.344 82.634
TEC zm [%] 63.87 42.15 73.93 100 33.28
ρ j MJ/[ j ] 278.6 991.52 1.549 38.224 447.6
TEC+ERC zm [%] 96.37 91.77 95.42 100 87.53
Results of the approach used to solve the multi-output allocation problem are shown in Ta-ble 6.9, for nickel as a main product and copper as a by-product. These results are the proposalof TEC methodology to solve this problem, because the overall process has been evaluatedthrough the balance equations involving copper production and finally a Thermo-EcologicalCost for copper as by-product is obtained. Therefore, the total TEC value for this case is notonly 138.31 GJ/t of nickel, because it must be added the amount of 82.634 GJ/t of copper. Themineral part of TEC has the greater values in the process connected directly with nickel, limeand copper ore deposits.
Results shown in Tables 6.10 and 6.11 display a TEC increment through the overall processuntil nickel is acquired. It can be observed that TEC values for sulphide ores in the first stepof the mining and beneficiation are lower for laterite ores, because sulphide ores are generallymined underground whilst laterite ones are mostly mined open cut and less energy is required.TEC at the last step of nickel production from laterite ores (75.6 MJ/kg_Ni) is smaller than TECof nickel produced from sulphide ores (179.12 MJ/kg_Ni), because from laterite ore, ferronickelis obtained as final product, whilst from sulphide ore nickel class I is obtained. Results aresimilar to those presented by Eckelman (2010). However, the energy required to produce nickelfrom laterite ores is significantly higher than from sulphide ores, as reported by Domínguezet al. (2013), Eckelman (2010), Mudd (2010), Norgate & Haque (2010).
Table 6.10: TEC and ERC of Ni production processes. Units: GJ/t_NiProcess Ni1 Ni2 Ni3 Ni4
TEC TEC+ERC TEC TEC+ERC TEC TEC+ERC TEC TEC+ERC
Laterites 1.39 57.46 53.90 248.9 75.60 327.4
Sulphides
A 27.28 277.9 104.75 805.9 131.43 936.9 179.12 1183
B 27.28 277.9 104.75 805.9 131.43 936.9 138.32 991.3
The results presented in Table 6.10 show that in the case of the electrolysis, TEC values arehigher than in the case of leaching technology. A high mineral part of TEC values for leachingtechnology results from the additional TEC value of copper which is obtained as by-product, asTable 6.11 depicts.
TEC complemented with ERC
In general, if Exergy Replacement Costs (ERC) are added to the TEC methodology, TEC valuesincrease in branches connected to mineral deposits, due to the additional exergy required toproduce minerals from a completely dispersed state to the original conditions in which theywere originally found in Nature. This is the case of the mining and beneficiation operationswhich are directly connected with nickel and copper deposits, as shown in Fig. 6.4. Hence,percentages of TEC mineral part (zm) increases as depicted in Table 6.8, as well as the index of
140

Table 6.11: Mineral part of TEC and ERC of Ni production processes.Process Ni1 Ni2 Ni3 Ni4
z[%] z[%] z[%] z[%]
Laterites TEC 10.08 0.543 0.487
(Ferronickel) TEC+ERC 98.91 80 78.19
Sulphides
A TEC 63.87 48.39 42.52 39.64
TEC+ERC 96.37 93.37 91.78 90.7
B TEC 63.87 48.39 42.52 42.15
TEC+ERC 96.37 93.37 91.78 91.77
sustainability. For instance, nickel ore has a value of r1 = 3.005 and if the ERC are considered,the value is increased to r1 = 31.4, as Table 6.8 shows. It means that if ERC are taken into ac-count, the mining industry would be far from sustainable development, because concentrationexergy granted by Nature in mining deposits, which has been ignored with TEC approach, willplay a major role in energy consumption in the mining sector.
Sensitivity analysis
As previously mentioned, the mining industry has very large energy requirements. In this sec-tion, assumptions in regards to the kind and amount of fuels consumed through the differentsteps in nickel production were done using information from the Ecoinvent database (Classenet al. 2007). Since the reliability of the data is not always ideal and the amount of energy is pre-sumably going to increase as ore grades decline, it is important to perform a sensitivity analysisin regards to the electricity and fossil fuels consumed during the different processes in nickelproduction, so as to identify the impact on the Thermo-Ecological Cost analysis when theseinputs are changed. Accordingly, the effect of TEC and ERC of nickel production has been an-alyzed when electricity, fuel oil and natural gas consumptions are increased or decreased by±10%. The obtained results are shown in Table 6.12, where it can be observed that electricity isthe variable with the highest influence. For laterites, the electricity requirement during the pro-cesses of drying, roasting and melting will increase or decrease the Thermo-Ecological Cost ina most significant manner than natural gas or fuel oil consumption. Sulphides are meanwhilemore susceptible to Thermo-Ecological Cost fluctuations caused by changes in electricity thanin fuel oil consumption, during the first step of mining and beneficiation.
In general, Table 6.12 allows to identify the process and the kind of resource that can havea great effect on the TEC of nickel production. If the objective is to diminish the TEC of nickelproduction in a particular process, electricity input plays a major role. For instance, a decre-ment of 10% in electricity will lead to a 0.22% decrease of the TEC in mining and beneficiationof nickel sulphides, whilst a decrement of 10% in fuel oil will lead to a 0.07% decrease of theTEC in the same process. Accordingly, it can be inferred that in order to reduce the TEC of min-ing and beneficiation of nickel sulphides, it would be preferable to reduce the electricity or tomake an effort to produce it from renewable sources than to reduce the use of fuels or to in-clude bio-fuels in the processes, because of the greatest impact on the TEC will be associatedwith electricity consumption.
141

Table 6.12: Effect of energy consumption in TEC and ERC of Ni production [%].Processes Electricity Fuel oil Natural gas
±10[%] ±10[%] ±10[%]
Laterites
Ni Mining ±0.02 ±0.1 -
Ni Drying-Roasting-Melting ±1 ±0.04 ±0.08
Ni Refining ±0.2 - -
Sulphides
Ni Mining-Beneficiation ±0.22 ±0.07 -
Ni Drying-Roasting-Smelting ±0.15 ±0.14 ±0.02
Ni Converting ±0.14 - ±0.03
Ni Electrolysis ±0.08 - -
Moreover, Exergy Replacement Costs are very dependent on ore grade and therefore changesin TEC including ERC for laterite and sulphide ores are presented in Fig. 6.6. Sensitivity analy-sis disclosed that ore grade variation had a greater effect on laterites than on sulphides. This ismostly due to the high-energy intensity of nickel production from lateritic ores.
0
100
200
300
400
500
600
Ni1 Ni2 Ni3
TEC+
ERC [M
J/kg
Ni]
0.5% Ni
1% Ni
2% Ni
2.5% Ni
(a) Laterite ore
0
50
100
150
200
250
300
350
400
450
Ni1 Ni2 Ni3 Ni4
TEC+
ERC [M
J/kg
Ni]
0.5% Ni
1% Ni
1.5% Ni
2% Ni
(b) Sulphide ore
Figure 6.6: Effect of ore grade in TEC including ERC.
Ore grade variation was done according to values reported by the mining industry. Nowa-days, laterite ore has a maximum nickel content of 3 % whilst nickel content in the sulphide orerange from 0.4% to 2%. For sulphides, the results show that TEC including ERC at this com-mercial nickel content are closer to the values presented in Table 6.10 than for laterites. Thismeans that lateritic ores are more susceptible to ore grade variation, therefore declining in oregrade will result in a significant energy consumption increase. In summary, nickel producedfrom lateritic ore will need much more exergy than nickel produced from sulphidic ore.
6.3.2 TERC analysis of aluminium production
An overview of the processes for the aluminium production system is presented in Fig. 6.7.It was grouped into six processes to perform the exergy analysis: mining, production of alu-minium hydroxide, aluminium oxide, electrolysis anode, electrolysis cathode and aluminiumliquide, to finally obtain aluminium. These processes were explained in Chapter 2, section 2.2.1.
142

Figure 6.7 is the a physical structure which displays the overall connections between each stage,in order to obtain the balance equations of TEC analysis.
Bauxite, is the mineral from which aluminium is gained, the mining and beneficiation steprequires electricity and diesel to produce 1.4 kg of bauxite, which will be the input to the pro-duction of aluminium hydroxide, then 1.53 kg of aluminium hydroxide will be feed to producealuminium oxide. Finally, 1.92 kg of aluminium oxide will be needed to produce 1 kg of alu-minium liquide. The step which the highest energy consumption is the electrolysis to producealuminium cathode ( j = 5).
Figure 6.7: Aluminium production system.
A brief description of the production processes follows.
1. Mining: Includes mechanical grinding and separation of the ore from the gangue materialand drying process. Electricity and diesel are inputs in this step.
2. Aluminium hydroxide production: This stage is done through the Bayer-Process. Thisprocess includes operations such as: grinding, digestion, precipitation and calcination.Sodium hydroxide (NaOH), also known as caustic soda as well as calcium oxide is used inthis process. Besides electricity, heat from coal, natural gas and oil is required.
3. Aluminium oxide production: This operation is based on the Bayer-Process. After filtra-tion, the aluminium is calcined to aluminium oxide. In this step, electricity and heat fromcoal, natural gas and oil is needed. According to Dutta & Mukherjee (2010), this method
143
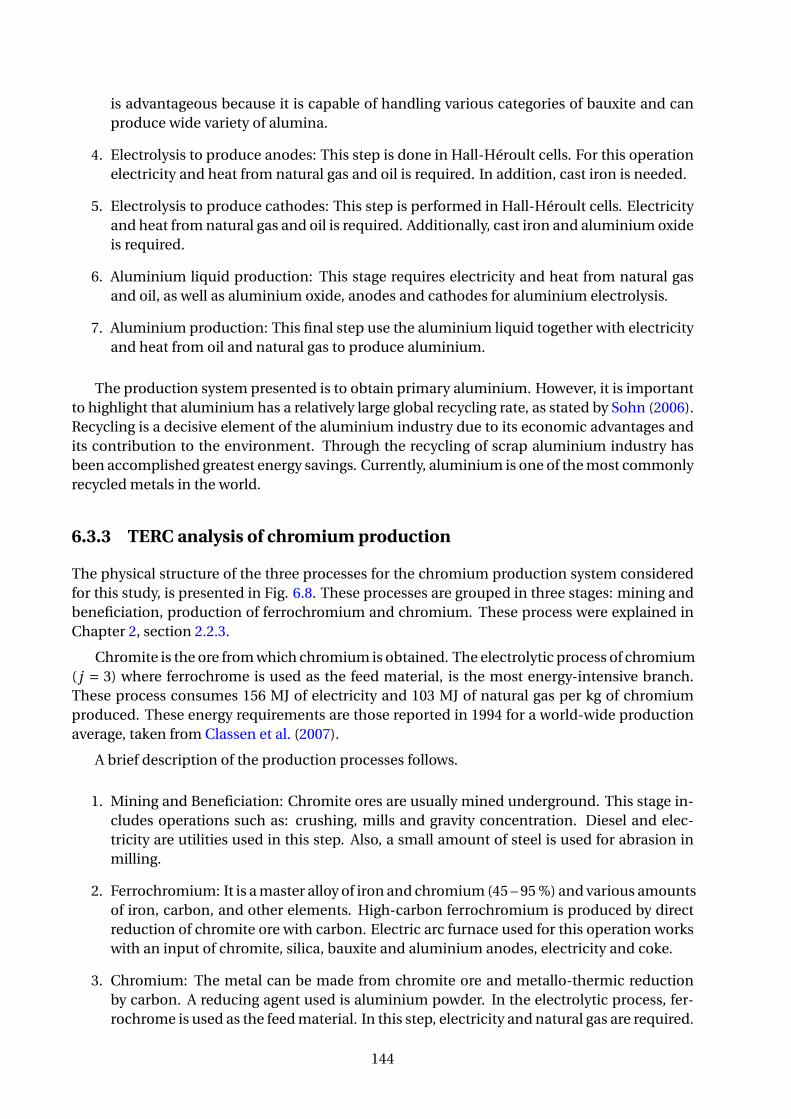
is advantageous because it is capable of handling various categories of bauxite and canproduce wide variety of alumina.
4. Electrolysis to produce anodes: This step is done in Hall-Héroult cells. For this operationelectricity and heat from natural gas and oil is required. In addition, cast iron is needed.
5. Electrolysis to produce cathodes: This step is performed in Hall-Héroult cells. Electricityand heat from natural gas and oil is required. Additionally, cast iron and aluminium oxideis required.
6. Aluminium liquid production: This stage requires electricity and heat from natural gasand oil, as well as aluminium oxide, anodes and cathodes for aluminium electrolysis.
7. Aluminium production: This final step use the aluminium liquid together with electricityand heat from oil and natural gas to produce aluminium.
The production system presented is to obtain primary aluminium. However, it is importantto highlight that aluminium has a relatively large global recycling rate, as stated by Sohn (2006).Recycling is a decisive element of the aluminium industry due to its economic advantages andits contribution to the environment. Through the recycling of scrap aluminium industry hasbeen accomplished greatest energy savings. Currently, aluminium is one of the most commonlyrecycled metals in the world.
6.3.3 TERC analysis of chromium production
The physical structure of the three processes for the chromium production system consideredfor this study, is presented in Fig. 6.8. These processes are grouped in three stages: mining andbeneficiation, production of ferrochromium and chromium. These process were explained inChapter 2, section 2.2.3.
Chromite is the ore from which chromium is obtained. The electrolytic process of chromium( j = 3) where ferrochrome is used as the feed material, is the most energy-intensive branch.These process consumes 156 MJ of electricity and 103 MJ of natural gas per kg of chromiumproduced. These energy requirements are those reported in 1994 for a world-wide productionaverage, taken from Classen et al. (2007).
A brief description of the production processes follows.
1. Mining and Beneficiation: Chromite ores are usually mined underground. This stage in-cludes operations such as: crushing, mills and gravity concentration. Diesel and elec-tricity are utilities used in this step. Also, a small amount of steel is used for abrasion inmilling.
2. Ferrochromium: It is a master alloy of iron and chromium (45 – 95 %) and various amountsof iron, carbon, and other elements. High-carbon ferrochromium is produced by directreduction of chromite ore with carbon. Electric arc furnace used for this operation workswith an input of chromite, silica, bauxite and aluminium anodes, electricity and coke.
3. Chromium: The metal can be made from chromite ore and metallo-thermic reductionby carbon. A reducing agent used is aluminium powder. In the electrolytic process, fer-rochrome is used as the feed material. In this step, electricity and natural gas are required.
144

Figure 6.8: Chromium production system.
6.3.4 TERC analysis of copper production
Copper is always associated with other metals, mainly nickel, molybdenum and platinium groupmetals. In this case, molybdenum is mined together with copper in stage. Molybdenum andcopper are coexisting in prophry deposits of the copper-molybdenum type, as molybdenite(MoS2) and chalcopyrite (CuFeS2).
The production diagram of the three group of processes for the copper production systemis presented in Fig. 6.9. These processes were explained in Chapter 2, section 2.2.5. The min-ing and beneficiation step ( j = 1) is a multi-output process, yielding copper concentrate andmolybdenite concentrate. 4.11 g of molybdenite concentrate is obtained per each kilogram ofcopper concentrate. The stage of solvent extraction and electrowinning (SX/EW) copper ( j = 3)is the most energy-intensive. It requires 28 MJ per kilogram of copper produced.
A brief description of the production processes follows.
1. Mining and beneficiation: this step includes operations such as: mining, ground, gravityconcentration, and flotation. Raw materials such as lime (for neutralisation), steel (forabrasion), sodium cyanide (as depressant), sulphuric acid (for pH adjustment and leach-ing) and floating agents are used. Also, electricity and diesel are required. Molybdenumis produced as co-product in this step.
2. Pre-treatment, reduction and refining: are the three types of unit operation in pyrometal-lurgical treatment of copper concentrates. Pre-treatment consists of drying and roasting,
145
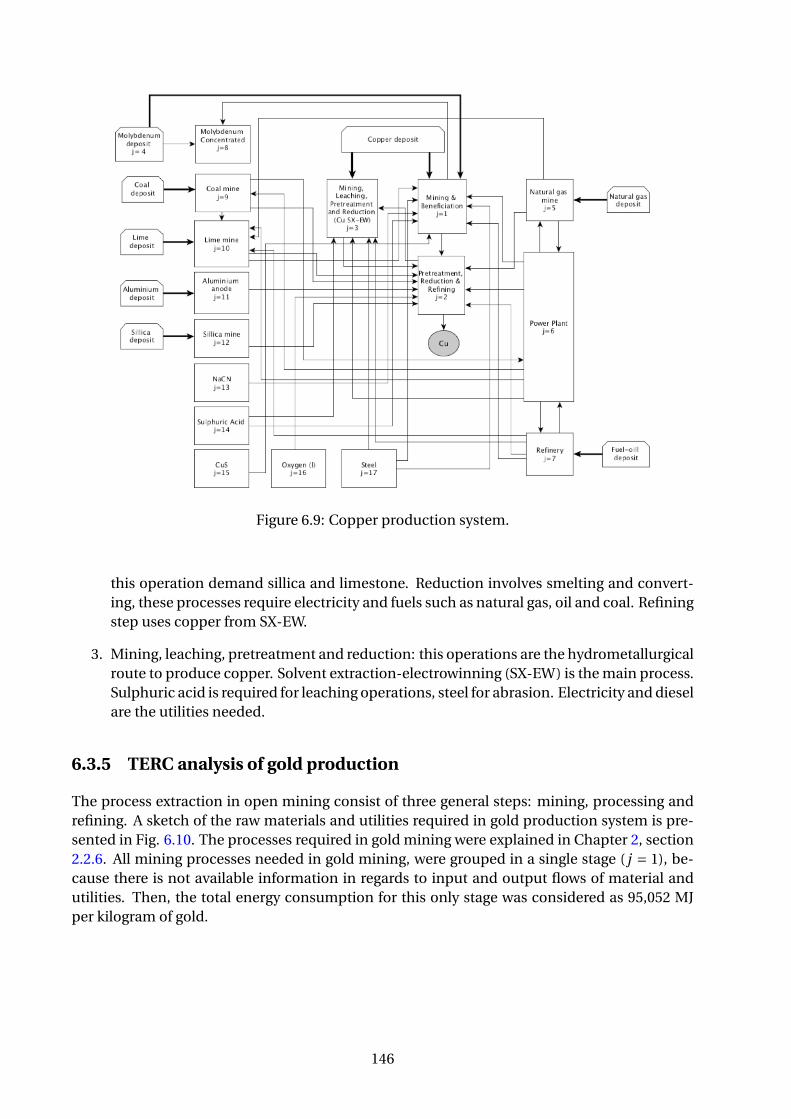
Figure 6.9: Copper production system.
this operation demand sillica and limestone. Reduction involves smelting and convert-ing, these processes require electricity and fuels such as natural gas, oil and coal. Refiningstep uses copper from SX-EW.
3. Mining, leaching, pretreatment and reduction: this operations are the hydrometallurgicalroute to produce copper. Solvent extraction-electrowinning (SX-EW) is the main process.Sulphuric acid is required for leaching operations, steel for abrasion. Electricity and dieselare the utilities needed.
6.3.5 TERC analysis of gold production
The process extraction in open mining consist of three general steps: mining, processing andrefining. A sketch of the raw materials and utilities required in gold production system is pre-sented in Fig. 6.10. The processes required in gold mining were explained in Chapter 2, section2.2.6. All mining processes needed in gold mining, were grouped in a single stage ( j = 1), be-cause there is not available information in regards to input and output flows of material andutilities. Then, the total energy consumption for this only stage was considered as 95,052 MJper kilogram of gold.
146

Figure 6.10: Gold production system.
6.3.6 TERC analysis of iron production
Iron ores are mixtures of up to 400 different minerals. The ore considered for this analysis ishematite. The production system includes six processes for the iron production: mining andrecultivation, beneficiation, production of sinter, pellets, pig iron and cast iron, as Fig. 6.11depicts. These processes were explained in Chapter 2, section 2.2.7. The pig iron production( j = 5), is the process with the highest energy requirement, 10.35 MJ per kilogram produced inthe blast furnace.
A brief description of the production processes follows.
1. Mining and recultivation: the ore is won in stripes using hydraulic excavators and/or beltloaders. Electricity and diesel are required in this stage.
2. Beneficiation: this step includes milling and sorting of crude ore. Electricity is needed.
3. Sinter: this process agglomerates the unrefined iron particles. Coke is the main sinterplant energy input, with electricity and natural gas.
4. Pellets: this process agglomerates the refined iron ore particles under different tempera-ture range in regards to sinter.
147

Figure 6.11: Iron production system.
5. Pig iron: the blast furnace is the most important process for the production of pig iron.This system requires additives (limestone) and reducing agents (coke). Uses sinter, pelletsand iron ore as inputs.
6. Cast iron: is made by remelting pig iron in small furnaces.
6.3.7 TERC analysis of manganese production
Manganese is produced from pyrolusite ore. An overview of the three processes for the man-ganese production system is presented in Fig. 6.12. These processes are: mining and bene-ficiation, production of ferromanganese and manganese. These processes were explained inChapter 2, section 2.2.9. The production of manganese as pure metal ( j = 3), is the processwhich consumes the greatest electricity consumer, 9.5 MJ per kilogram of manganese.
A brief description of the production processes follows.
1. Mining and beneficiation: mining, crushing, milling and gravity concentration are theoperations in this stage. Steel for abrasion in mill is required, as well as electricity anddiesel.
2. Metallurgy-Ferromanganese: this stage includes the reduction to high-carbon ferroman-ganese. The ore is processed in blast furnaces (20%), electric arc furnaces without flux
148

Figure 6.12: Manganese production system.
(27%) and electric arc furnaces with calcareous flux (53%). The raw materials requiredare manganese ores, limestone, dolomite or silica and reductants such as coke. Utilitieslike electricity, and heat from coke and coal are added.
3. Manganese: in this step manganese as a pure metal, is produced by electrolysis from ore(25%) and by electrothermic process from ferromanganese (75%). For both processeselectricity is required and silica for the electrothermal process.
6.3.8 TERC analysis results of metals production
The TEC values for all commodities increase through the first stage where the ore is minedand processed until the last step where the smelted and refined metal is obtained, becausein this finals steps is where the greater amount of energy is consumed, as Table 6.13 depicts.Otherwise, the mineral part of TEC zm decreases from mining and beneficiation to smeltingand refining operations, as Table 6.14 shows, because the mineral consumption is presentedduring the initial step which is directly connected with mineral deposits.
Table 6.13 shows TEC and TEC+ERC results for each commodity from the initial process(mining) through the final process (refining). TEC means without considering the concentra-tion exergy whilst TEC+ERC shows values when it is considered. It is important to highlightthat trend is the same for both approaches, an increment from the initial to the ending process.There are some exceptions as the case of iron where the output of a process is not the input tothe follow process, then a decrease in TEC is presented in intermediate processes.
149

Tab
le6.
13:T
her
mo
-Eco
logi
cala
nd
Exe
rgy
Rep
lace
men
tCo
sts
for
dif
fere
ntm
iner
alp
rod
uct
ion
pro
cess
es.
Co
mm
od
itie
sP
roce
ss_[
1]P
roce
ss_[
2]P
roce
ss_[
3]P
roce
ss_[
4]P
roce
ss_[
5]P
roce
ss_[
6]P
roce
ss_[
7]
Alu
min
ium
TE
C0.
096.
012
.05.
820
.519
1.0
192.
4
TE
C+E
RC
217.
1030
9.8
476.
716
.130
.810
88.0
1090
.0
Ch
rom
ium
TE
C1.
3749
.720
6.7
TE
C+E
RC
4.87
114.
823
1.9
Co
pp
erT
EC
19.0
311
8.7
13.3
TE
C+E
RC
53.0
122
6.0
13.3
Go
ldT
EC
1548
73.0
0
TE
C+E
RC
1113
000.
00
Iro
nT
EC
0.16
0.5
3.2
1.2
16.2
17.2
TE
C+E
RC
17.8
029
.834
.132
.065
.352
.5
Man
gan
ese
TE
C0.
4529
.064
.8
TE
C+E
RC
10.0
651
.710
1.7
150

If Exergy Replacement Cost (ERC) are added to the TEC methodology, TEC values increasedue to the additional energy needed during the concentration process. As well as the index ofsustainability, it means that if energy to obtain minerals from the crust Earth is considered, themining industry would be far from sustainable development. For instance, aluminium has avalue r = 13.68 and if the mineral bonus is considered the value is increased to r = 21708, asTable 6.14 shows.
Table 6.14 depicts values of the mineral part of TEC (zm[%]), it can be observed that valuesdecrease from the initial to final processes, as expected, because mineral part has the greatercontribution to TEC in the initial step. When concentration values are included, the trend is thesame, the difference is that values are bigger because of that consideration.
The results show that cumulative mineral exergy has a greater significance than cumulativefuel exergy, as a result of include concentration exergy in the mineral part analysis. In this man-ner, the way in which the minerals are found on the crust is considered. If Exergy ReplacementCost (ERC) are added to the TEC methodology, TEC values increase due to the additional energyneeded during the concentration process.
Table 6.14 depicts values of the mineral part of TEC (zm[%]), it can be observed that valuesdecrease from the initial to final processes, as expected, because mineral part has the greatercontribution to TEC in the initial step. When concentration values are included, the trend is thesame, the difference is that values are bigger because of that consideration. The main advan-tage of consider the Exergy Replacement Cost (exergy concentration) can be observed whenthe sustainability index is calculated, because TEC methodology only consider the chemicalexergy then r values are higher than if both exergies (named chemical and concentration) areincluded. For instance, gold which has a very low chemical exergy has a very high index of sus-tainability if TEC is applying but if Exergy Replacement Cost is included the value decrease toexpected values.
The results show that cumulative mineral exergy has a greater significance than cumulativefuel exergy, as a result of include concentration exergy in the mineral part analysis. In this man-ner, the way in which the minerals are found on the crust is considered, and better index ofsustainability are reached.
As opposed to fossil fuels, minerals are not lost when they are used. On the contrary theyusually end up in landfills and become eventually dispersed. In the limit, when all mineral de-posits are completely exhausted, Man will need to extract minerals from those dispersed land-fills, i.e. from the grave. Having an order of magnitude of how much would it cost to replacesuch valuable minerals from the grave, would allow to manage scarce materials more appropri-ately.
151

Tab
le6.
14:M
iner
alp
arto
fTh
erm
o-e
colo
gica
lan
dE
xerg
yR
epla
cem
entC
ost
sfo
rd
iffe
ren
tmin
eral
pro
du
ctio
np
roce
sses
.C
om
mo
dit
ies
z_m
Pro
cess
_[1]
Pro
cess
_[2]
Pro
cess
_[3]
Pro
cess
_[4]
Pro
cess
_[5]
Pro
cess
_[6]
Pro
cess
_[7]
Sust
ain
abil
ity
[%]
ind
ex(r
)
Alu
min
ium
TE
C7.
310.
730.
570.
020.
010.
060.
0613
.68
TE
C+E
RC
99.9
698
.08
97.5
254
.28
33.5
382
.44
82.3
421
708
Ch
rom
ium
TE
C63
.69
4.39
1.39
1.57
TE
C+E
RC
89.8
158
.59
12.0
855
93
Co
pp
erT
EC
44.2
523
.41
8.62
2.28
TE
C+E
RC
79.9
959
.78
8.62
6356
Go
ldT
EC
0.35
5956
66.0
0
TE
C+E
RC
86.1
342
8000
0
Iro
nT
EC
66.9
238
.80
6.09
15.3
61.
931.
341.
49
TE
C+E
RC
99.6
999
.03
91.0
796
.70
75.6
467
.65
161.
9
Man
gan
ese
TE
C60
.04
2.26
3.76
1.67
TE
C+E
RC
98.2
145
.21
38.7
137
.26
152
6.4 Summary
In this chapter an exergy analysis of metal processing was performed. In first place, an exergyaccounting of energy and material flows for the two main routes of nickel production (fromlaterites and sulphides ores) was performed under the assumption that chemical exergy is themain and only component taken into account. Accordingly, the chemical exergy of the dif-ferent raw materials and utilities involved in the production of nickel was calculated. Exergyinputs and outputs as well as exergy efficiencies for both, including their disaggregated steps,were presented and discussed. The results showed that nickel processing has higher efficien-cies when it is produced from sulphides than from laterites. The strengths and weakness of themethodology applied were discussed. Moreover, the scope of this methodology was extendedin the “cradle to market” path through the use of the Thermo-ecological Cost (TEC) and in the“grave to cradle” tack with the Exergoecology approach through the Exergy Replacement Costs(ERC).
Accordingly, an extended assessment of resources consumption in metal processing, hasbeen performed integrating two methodologies based on exergy, leading to the improved TERCmethodology. In this way a global exergy life cycle assessment of metal processing was ac-complished. It was demonstrated that the Thermo-Ecological Cost associated with mineralconsumption increases significantly when Exergy Replacement Costs are included in the TECmethodology. This is because TEC values increase in those processes connected to mineral de-posits, due to the additional exergy needed during the concentration process of commodities inthe grave-cradle approach. If concentration exergy (through the ERC) is taken into account, theThermo-Ecological Cost associated with the mineral part becomes even more significant thanthe fuel one. Consequently, the combined methodology enhances the importance of mineralconsumption, which is increasingly becoming an issue due to the criticality of raw materials.
Additionally, this methodology integration has shown that when ERC are included in TECmethodology, higher index of sustainability are obtained. This would then mean that if ERCare taken into account, the considered energy required in mining and metallurgical processeswould be even more far removed from sustainable development, because concentration exergygranted by Nature in mining deposits, which was traditionally ignored with the TEC approach,will play a major role.
Finally, a sensitivity analysis allows to identify the metal production route (e.g. among nickelores) more susceptible to ore grade changes or energy consumption variations. For the nickelprocessing, it has been shown that laterite ores are more sensitive to changes in ore grade andthat both nickel ores are very dependant especially on electricity consumption.
153

Chapter 7
Conclusions
This chapter of conclusions provides a synthesis of this PhD. The main contributions and thescientific publications derived from this research work are then listed. Finally, the perspectivesthat have arisen as a result of the development of this thesis are commented and proposed forfurther research.
7.1 Synthesis
The accessibility of mineral resources has become a crucial matter for technological progress.Many resources that are considered critical, are determinant for the development of renewableenergies, ICTs or agriculture. Consequently, to ensure their availability has become an imper-ative task. An initial and mandatory step towards this endeavour is to account properly for theresources used and to analyze and optimize with objective and rigorous tools the mining andmetallurgical industry.
Accordingly, the main objective of this PhD thesis was to apply thermoeconomic method-ologies so as to undertake “absolute Life Cycle Assessment” of mineral resources. This way,not only the conventional approach is accounted for, namely, the cradle to grave path, but alsothe complementary one, the grave to cradle one. This has been performed by complementingthe thermoeconomic analysis with the exergoecological approach through the exergy replace-ment cost (ERC). The ERC account for the exergy that would be required for recovering back totheir initial composition, concentration and cohesion conditions with current technology, theminerals that have been extracted. Consequently, the combined methodology not only takesinto account the effort required to produce a given metal, but also the loss of mineral wealthassociated with the depletion of the natural deposits.
The aim of the starting Chapter 1 was to provide an overview of mineral resources and themining industry. Since this PhD is focused on the assessment of global mining, issues like sus-tainable development and life cycle assessment for abiotic resource depletion have been re-viewed. Additionally, a general overview of world mineral supply, market price evolution andcurrent situation of mineral resources was outlined.
Chapter 2 provided a general outlook of the production chains of several metals. Accord-ingly, a description of the main physical processes applied in the mining and metallurgicalindustry was presented. Subsequently, a detailed analysis of the particular metallurgical pro-cesses of selected commodities analyzed and applied in different case studies in this thesis was
155

performed. It was stated that energy requirements data for metal processing varies greatly, andthe associated energy increases substantially due to different factors such as: lower ore grades,deeper mines, complex ores and more waste rock produced. The chapter ended with a compi-lation of energy requirements for 33 mineral commodities, dividing the information into 1) themining and beneficiation and 2) smelting and refining stages.
Technical changes have historically played a crucial role in the progress of the mining andmetallurgical industry. Accordingly, Chapter 3 displayed the historic evolution of technologicalinnovation in the mining industry, which were supposed to offset the increase of costs associ-ated with several operational handicaps throughout history.
Yet the mining activity in addition to the problems that are common for other industries,needs to face an additional issue: decline in ore grades. Hence, future availability of min-eral resources is influenced by two opposed facts. On the one hand, general trends suggesta long-term decline in ore grade, which increases energy consumption in the mining industry,but on the other hand there have been technological transitions that might avert rises in en-ergy consumption. The aim of Chapter 3 was therefore to become acquainted if technologicalbreakthroughs that have occurred can preclude the rising energy demand for the gold miningindustry as an example.
As experience is acquired, material and energy efficiency increase and technical changescan be expressed through the so called learning curves. Accordingly, the learning curves theorywas applied to several mines in different countries. Average progress ratios obtained betweendifferent operation and recovery processes ranged from + 20% to – 22%. This survey allowedus to have a more suitable understanding of the mining sector and the outcomes of technol-ogy evolution together with ore grade declining. In this way, mines in which mining opera-tions have proved to be successful when the goal was to save energy were identified. Therefore,these estimates can be used to point out best mining practices and can serve as a reference forother worldwide mines with similar conditions. That said, general results suggest that althoughprogress in technology has been made, in most cases energy requirements are increasing, be-cause the main variable is the ore grade. Therefore, it can be asserted that technology, in generalcannot avert the rising energy demand at least for the case of gold mining in the future if no ma-jor changes are performed around the world.
After having reviewed the main aspects related to the minerals industry, the thesis enteredwith Chapter 4 into the thermodynamic dimension for the assessment of mining and metal-lurgical processes. It thus presented the fundamentals of the exergy, thermoeconomic, ther-moecological and exergoecological analysis. Particularly, it was shown that thermoeconomicsis a general theory for energy saving, which integrates thermodynamics (exergy analysis) andeconomics (exergy cost) by means of the Second Law. The thermoecological cost theory mean-while, is defined as the cumulative consumption of non-renewable exergy connected with thefabrication of a particular product with additional inclusion of the consumption resulting fromthe necessity of compensation of environmental losses caused by rejection of harmful sub-stances to the environment. Both methodologies are closely linked and the similarities anddifferences between both approaches have been explained. Furthermore, both theories can beimproved for the analysis of metallurgical systems in the same way, namely, through the exer-goecology approach using the exergy replacement costs of minerals. The exergy replacementcosts are the point of reference in order to evaluate in a single variable, characteristics such ascomposition, concentration (ore grade), cohesion and the state of technology of mineral re-sources. Contrary to fossil fuels, non-fuel minerals are not lost when they have been used butthey usually end up scattered in landfills. Having an order of magnitude of how much it will
156
cost to replace these dispersed minerals, will allow to manage resources more appropriately.The importance of the exergy replacement costs lies thus in their ability to establish a scarcityfactor of mineral resources which should be accounted for, when assessing the sustainability ofmining and metallurgical processes.
The fundamentals of the exergoecological approach were developed in a previous PhD the-sis, but a set of unresolved issues still remained such as the influence of the long-term decline inore grades on the exergy replacement costs. This thesis has thus tried to improve the method-ology and calculate more accurate ERC of substances. The basic ingredient to obtain them isassessing the so called unit exergy costs, which are the ratio between the real energy requiredfor mining and concentrating a substance and the minimum thermodynamic energy (exergy)required to achieve the same process. Hence, it provides a measure for the irreversibility (ortechnological ignorance) of the process. Since the energy required in mining depends on theore grade as well as on the technology utilized, both factors influence the unit exergy replace-ment costs. Taking into account empirical data of energy requirements in mining as a functionof ore grade, the exergy replacement costs for several minerals were obtained in Chapter 5. Ad-ditionally, a general expression of mining energy vs. ore grade was derived for those mineralcommodities where no empirical data was available. The general observed trend was that asthe ore grade declines, the energy and the exergy replacement costs increased exponentially.The obtained values are an intermediate step for assessing in a physical way the free exergyprovided by Nature that man is rapidly destroying through the depletion of high-grade ores.This should serve as an assessment tool for decision-makers in the mineral industry.
Another issue that has addressed this thesis is the allocation problem of mining and met-allurgical processes. As is well known, in the mining industry, with each metal extracted, mainproducts, by-products and wastes are obtained. A strategy of sustainable development in min-ing industry is to implement a zero waste policy, changing to polymetallic mining, in which allmineral resources are deployed and many by-products are recovered. Accordingly, the miningindustry must be considered as a system which produces by-products. These by-products needobjective cost allocation methods, like the one proposed in Chapter 5 of this thesis.
Metals produced as by-products generally have highly complex demand/supply, technol-ogy and investments requirements. By-products production depends on the availability andtechnical feasibility to recover those metals during or next processing of main metals, as well ason the economic profit of by-product metal recovery. The final energy used in obtaining suchby-products is difficult to ascertain as current cost allocation procedures are at least debatable.
Nowadays, allocations among products when one or more by-products come about in amining or metallurgical process are based either on tonnage or on commercial prices. Bothways of allocating environmental costs entail many disadvantages, such as subjectivity withprice or underestimating charges for certain by-products when the tonnage is low. Since min-eral extraction and processing constitutes the first stage of any given process, using conven-tional LCA software, which allocates cost in regards to tonnage or revenue, can lead to incor-rect results. In Chapter 5, a rigorous way to allocate costs among non-fuel minerals throughthe exergy replacement costs was proposed. This approach allows to allocate costs accord-ing to the physical quality of minerals. Cost allocation approaches based on tonnage, marketprice and exergy replacement cost, were applied to different mineral deposits. In this way, itwas demonstrated that cost allocation through tonnage is not always a suitable option becauseminor by-products appearing at very low concentrations can be even more valuable than themajor product. With market prices used to perform cost allocations, the problem is associatedwith their high volatility, which in turn depends on macroeconomic variables that commonly
157

do not reflect the physical conditions of non-fuel mineral resources in Nature. If by way of con-trast, exergy replacement cost is applied, the results are similar to those obtained via the priceindicator. This supports the idea that the exergy replacement cost indicator is very close to thevalue society places on minerals. Nevertheless, contrarily to prices, exergy replacement costdoes not fluctuate with external factors linked to market mechanisms but remains constant.
Having demonstrated the power and reliability of the new allocation procedure in the ex-traction stage, the methodology was subsequently applied to four metallurgical processes usedto produce nickel, copper, lead and rare earth elements, as well as their corresponding by-products. The aim was to allocate to each by-product, their respective inputs of raw materialsand fossil fuels using an extended thermoeconomic approach. Accordingly, the physical costof the production of different commodities was calculated. The results showed that in general,prices do not adequately refer natural costs because they do not take into account the deple-tion factor of minerals and the fact Man is destroying the mineral wealth on Earth, which willbe unavailable for future generations.
In Chapter 6 of this thesis, exergy analyzes of different processes for obtaining various min-erals were performed. The case of nickel processing, was studied in detail. Particularly, anexergy analysis of energy and material flows to produce nickel from two types of ore (lateriteand sulphide) was performed to identify the main losses occurring in the disaggregated pro-cess. Firstly, an exergy analysis based only on the chemical component was performed. Re-sults showed that nickel processing has greater efficiencies when nickel is produced from sul-phides than from laterites. Sulphide ore processing has efficiencies fluctuating from 67% to79%, depending on the specific technologies utilised. The higher efficiencies are reached whenleaching technologies are used and on the contrary if nickel is produced from laterites, the ef-ficiencies achieved are lower on average 38% due to the cost-intensive processing. This firstanalysis allowed us to conclude that exergy analysis based on chemical exergies is not enoughto assess properly mineral resources. For instance, laterites have an almost negligible chem-ical exergy, although the energy requirements and exergy accounting results are greater thanthose obtained for sulphides, which in turn have a greater chemical exergy. Hence, it can bestated that using chemical exergy alone leads to unreliable results, because there is an impor-tant factor missing, namely the concentration exergy because the “value” of minerals is ratherassociated with its depletion degree and not with its particular chemical exergy. This is the mainreason why concentration exergy, calculated through the exergy replacement cost, is more con-venient when mineral resources come into play.
A more complex analysis of the nickel production was subsequently performed throughthe thermo-ecological cost methodology, thereby extending the scope of the analysis through a“cradle to market” approach. TEC assesses the cumulative consumption of non-renewable ex-ergy required to produce a unit of useful product from raw materials contained in mineral de-posits. TEC results can be separated into those associated with consumption of fossil fuels andwith consumption of mineral resources in each process stage, thereby identifying the types ofresources that are being consumed in each step of the overall production process. This differen-tiation is important due to the fact that fossil fuels could be substituted by renewable sources,whereas minerals cannot be easily replaced by other kinds of resources. A problem detectedwith the TEC was that the exergy associated with the mineral component was small comparedto the fuel component. This is because the TEC traditionally uses the chemical exergy of sub-stances in their assessment and fossil fuels eclipse any other raw material. In order to overcomesuch issue, exergy replacement costs were embedded into the TEC infrastructure,including alsothe grave-cradle approach. Results showed that the impacts associated with mineral consump-
158

tion are significantly greater. Accordingly, the inclusion of ERC into TEC allows for a more com-prehensive and fairer weight to the consumption of non-fuel mineral resources, thereby pro-viding better indications to assess mineral resources consumption, which could be even morecritical than fossil fuel depletion.
Finally, it can be concluded that exergy analysis carried out through methodologies such asTEC and ERC allows to: (1) analyse inputs-outputs of materials and energy resources, (2) anal-yse the transformation efficiency of resources, (3) perform an objective cost allocation amongproducts and by-products, (4) assess environmental impacts and (5) identify the opportunityareas to reach a sustainable development in the mining sector.
7.2 Contributions
The general contribution of this PhD was to improve and adapt current methodologies based onthe exergy analysis and used to optimize industrial processes to the specific case of the miningand metallurgical industry. Particularly, Thermoeconomics and the Thermo-Ecological Costmethodology have been complemented with the Exergoecological approach, allowing for a bet-ter assessment of non-fuel mineral resources. The specific contributions of this PhD thesis areoutlined next.
1. The main contribution made in Chapter 3 is the use of learning curves from an exergoe-cology approach. This analysis allows to become acquainted if research and technologi-cal breakthroughs that have occurred in the production processes of mining industry canpreclude the rising energy demand.
2. The first contribution made in Chapter 5 is a more accurate calculation of the exergy re-placement costs of minerals, taking into account time through variable unit exergy costs,which in turn depend on the energy requirements. Additionally, a general expression ofmining energy vs. ore grade has been derived for those mineral commodities where noempirical data was available. This should serve as an assessment tool for decision-makersin the mineral industry.
3. The second contribution of Chapter 5 is the development of a new methodology for costallocation among by-products based on exergy replacement costs. This method allows toallocate costs according to the quality of the products obtained, which is directly relatedto their ore grade and depletion state. The final aim is to estimate in a reliable way energyconsumptions related to each mineral produced.
4. The main contribution made in Chapter 6 is the proof that the use of chemical exergy toassess mineral resources leads to unreliable results, because there is an important factormissing, namely the concentration exergy. The value of minerals is more associated to itsscarcity degree than to its inherent chemical exergy. This is the reason why concentra-tion exergy, calculated through the exergy replacement cost, is a more convenient unit ofmeasure when mineral resources are analyzed.
5. An additional contribution of Chapter 6 is the integration of the exergy replacement costinto thermo-ecological cost methodology. This allows to perform an integral assessmentof mineral resources: a grave-cradle-market analysis.
159

7.3 Scientific publications
The development of this PhD dissertation has led to some scientific publications, which havebeen presented in different scientific conferences and published in journals.
Al. Valero, A. Valero, A. Domínguez. Influence of technical development and declining oregrades on the availability of gold resources. In SDEWES 2011: Proceedings of the 6th DubrovnikConference on Sustainable Development of Energy, Water and Environment Systems, Septem-ber 25 - 29, 2011, Dubrovnik, Croatia.
Al. Valero, A. Valero, A. Domínguez. Trends of exergy costs and ore grade in global mining.In SDIMI 2011: Proceedings of Sustainable Development in the Minerals Industry, June 14 - 17,2011, Aachen, Germany.
A. Domínguez, Al. Valero. Global gold mining: is technological learning overcoming thedeclining in ore grades?. In ECOS, 2012: Proceedings of 25st International Conference on Effi-ciency, Cost, Optimization, Simulation and Environmental Impact of Energy Systems, June 26 -29, 2012. Perugia, Italy.
A. Domínguez, Al. Valero, A. Valero. Exergy accounting applied to metallurgical systems:The case of nickel processing. In CPOTE, 2012: Proceedings of 3rd International ConferenceContemporary Problems of Thermal Engineering, September 18 - 20, 2012, Gliwice, Poland.
A. Domínguez, Al. Valero. Global Gold Mining: Is Technological Learning Overcoming theDeclining in Ore grades? Journal of Environmental Accounting and Management, 2013 (1) 85 -101.
Al. Valero, A. Valero, A. Domínguez. Exergy Replacement Cost of Mineral Resources. Journalof Environmental Accounting and Management, 2013 (2) 147 - 158.
A. Domínguez, Al. Valero, A. Valero. Exergy accounting applied to metallurgical systems:The case of nickel processing. Energy 2013 (62) 37 - 45.http://dx.doi.org/10.1016/j.energy.2013.03.089
A. Domínguez, L. Czarnowska, Al. Valero, S. Wojciech, A. Valero. Thermo-Ecological andExergy Replacement Costs of Nickel Processing. (Under review in Energy Journal, submitted inApril 2, 2014)
Al. Valero, A. Valero, A. Domínguez. Exergy Cost Allocation of by-products in the mining andmetallurgical industry. (Accepted in ECOS 2014, 25st International Conference on Efficiency,Cost, Optimization, Simulation and Environmental Impact of Energy Systems. Finland, June15-19, 2014.)
7.4 Perspectives
Throughout the length and breadth of this thesis, further research opportunities have beenidentified. The main problem encountered in the writing of the results of this PhD was thelack of reliable information sources. When transparency in the mining and metallurgical sectorbecomes the norm, the methodology and the numbers obtained could be refined and extendedto more case studies. Some of the identified open questions are listed as follows.
1. Due to lack of data, the learning curve methodology was only applied to the case studyof gold. Consequently, even if gold is an important commodity, it cannot be representative
160

for all minerals produced in the world. Therefore, the analysis should be extended to othercommodities and to countries from all over the world such as China, which holds currently astrategic position in the mining industry. With the help of a neural network model, the questionof whether technological improvement can offset the declining in ore grades could be bettersolved.
2. In addition, the learning curves methodology used in this thesis is subject of improve-ments by adding a factor related with research and technological development in the miningindustry. The extended methodology is known as learning curve of two factors, although thereis also the multi-factors learning curve which can include additional independent variables toanalyze the mining sector.
3. In this thesis, the ERC of 23 substances was obtained, from which only 6 commoditieswere derived from empirical information regarding energy consumption vs. ore grade. The re-maining were obtained assuming a general behaviour based on observations where data wasavailable. Hence, it becomes important to improve the obtained values when more informa-tion appears. But not only that, the calculation of ERC should be extended to all producedcommodities. Major efforts should be especially devoted to those minerals considered as criti-cal, including substances such as In, Ge, Ga, REE from the lanthanide group or P.
It is important to highlight that exergy replacement cost values as well as the exergy analysisof systems and process, are dependant on the data used, therefore their objectivity rely on thequality of such data. Hence, it is imperative the use of reliable information sources in regardsto energy and raw materials correspondent to each mineral deposit and used technology.
161


Appendix A
Background of commodities
A.1 Metal processing and energy requirements of minerals
Antimony
This material is one of the critical raw materials for EU due to several factors such as: no ef-fective substitute for its major application (flame retardant), low recycling due to dissipativenature of major usage and metal supply risk because China has the largest reserves of anti-mony ore worldwide according to the ad-hoc Working Group (2010) and Butterman & Carlin(2004).
The most important ore mineral of antimony is the sulfide stibnite and the method usedto extract antimony from it is the sulphide ore flotation which has an energy consumption of90 MJ per ton of treated material (Kihlstedt 1975), considering that sulfide ore contain an av-erage of 13.25 % antimony, the energy during the concentrating process is 0.95 GJ/t. Once theconcentrate ore is obtained the next step is roasting to produce oxide followed by smelting inblast furnace to produce crude metal, this metallurgic process is similar for sulphide ores suchas molybdenum, thence the energy consumption is 12 GJ/t.
The energy requirement for the concentrating process of antimony was 1.4 GJ/t and forrefining the energetic consumption was 12 GJ/t (Botero 2000).
Table A.1: Energy consumption in the antimony production. Values expressed in GJ/ton of Sb.Emining Erefining Etotal
Kihlstedt (1975) 0.95 12 12.95
Botero (2000) 1.4 12 13.4
Arsenic
Arsenic is a byproduct of mining nonferrous metals, being the copper processing industry themajor source. Most arsenic was produced as the trioxide (As2O3) from the smelting processof cooper, lead, gold and silver ores. The most common commercial source of arsenic is thearsenopyrite (Fe AsS) containing 46 % of arsenic.
The energy requirement for the concentrating process starting from sulphide ore is 9 GJ/t(without considering mining process) and the refining process consumes 19 GJ/t (Chapman &
163

Roberts 1983) considering that this process is similar to lead refining (Botero 2000).
Beryllium
There are several beryllium containing minerals on the Earth’s crust, but only two berylliumminerals, bertrandite and beryl, are important commercially. The mining and beneficiationprocesses to obtain beryllium sulfate solution from beryl includes crushing, leaching with sul-furic acid and heating operations, then the solution undergoes solvent extraction and hydrol-ysis, which results in the formation of beryllium hydroxide from which can be obtained beryl-lium as metal by dissolving it in an ammonium bifluoride solution, followed by a concentratingoperation in an evaporator, finally the beryllium fluoride is reacted with magnesium in induc-tion furnaces to produce metallic beryllium (Cunningham 2000).
According to Kihlstedt, the energy consumptions of the operations mentioned above forconcentrating beryllium from beryl which contains about 4 % Be, is 10.8 GJ/t (Kihlstedt 1975).The energy consumption for refining process is 450 GJ/t (Botero 2000).
The fact that 99% of world production originates in US and China, along with low recyclingrate and difficult to substitute, makes this material critical for EU, as reported by the ad-hocWorking Group (2010).
Bismuth
Bismuth is mainly produced as a byproduct of lead ore refining, although it may occur in natureas a sulfide (bismuthinite, Bi2S3) or as a oxide (bismite, Bi2O3).
The energy consumptions of the sulphide or oxide ores flotation for concentrating bismuthand a content about 5 % Bi, is 3.54 GJ/t (Kihlstedt 1975). The energy consumption for refiningprocess is 52.8 GJ/t (Botero 2000).
Fluor
Fluorine occurs mainly in the minerals fluorspar (C aF2) and cryolite (N a3 AlF6). There is nota unique route to obtain fluorine, but industrial production of fluorine entails the electrolysisof hydrogen fluoride in the presence of potassium fluoride. The energy consumption in theconcentrating process is 1.45 GJ/t and no energy is required for refining process (Botero 2000).
Fluorspar is listed as critical material for EU because just 25% of the fluorspar consump-tion of the EU is overcast by domestic production, the remaining was imported mainly fromChina which applies export quota and export taxes. Besides, recycling rate is estimated under-neath 1% in the EU and substitution possibilities appear to be scanty, as stated by the ad-hocWorking Group (2010).
Gallium
Gallium has many characteristics similar to aluminium, e.g. conductivity of heat and electricity.Hence, it is used in optoelectronics, telecommunication, aerospace and commercial items likealloys, computers and DVDs (Classen et al. 2007). It can be extracted from bauxite ore. The
164

three process used to extract gallium is extraction with chelating agents, electrolytic processesand fractional precipitation.
China is the major producer of gallium with 75% of worldwide production, then trade re-strictions have been imposed in this country as well as in South Africa and Russia. Nowadays,gallium is not being recycled from old scrap and just some applications have substitutes. Thelatter places gallium into the list of critical materials for EU (ad-hoc Working Group 2010).
Germanium
Germanium ores are imported in order to be refined in EU for further export. Hence there is ahigh dependency on imports from China, which accounts for more than 70% of world produc-tion. The recycling rate is about 30% in accordance to the ad-hoc Working Group (2010).
Indium
Indium is obtained as by-product during zinc, lead, tin and copper mining. The general processto obtain indium from hydrometallurgical zinc extraction are: leaching and solvent extraction(SX), cementation and anode casting, electrorefining and vacuum refining in order to reducethe level of volatile impurities (Classen et al. 2007). Indium is produced mainly by recoveringfrom by-products of zinc smelting, which contain small amounts of indium together with otherelements such as arsenic, zinc and cadmium. The main challenge is to remove contaminantsthat have negative effect on the properties of the semiconductor made from indium. Hence,a complex hydrometallurgical process is required to separate indium from impurities. Theseprocesses are highly dependent on the composition given by the specific deposit.
The fact that more than 81% of the EU’s imports of indium comes from China, joint withlimited recycling possibilities from manufacturing residues as well as shorty substitution forspecific applications, arouse indium to be considered as critical material for EU, according toad-hoc Working Group (2010).
Lithium
Lithium occur in nature combined with all igneous rocks such as spodumene (Li AsSi2O6), lep-idolite, petalite and amblydonite also it is found in the waters of many mineral springs thenceit is recovered from brines. Lithium metal is produced by electrolysis of a molten mixture oflithium chloride and potassium chloride.
The energy requirements for the hydroxide production of lithium is 12.5 GJ/t for the con-centrating process and 420 GJ/t for the refining process (Botero 2000).
Magnesium
Magnesium can be extracted from seawater, from minerals (dolomite, magnesite and brucite)or can be earned through recycling. The metal magnesium is gaining more importance as aconstruction material.
The main production process are electrolysis of magnesium chloride melts (made from re-sources such as seawater and dolomite) and the metallothermic reduction of magnesium oxide.
165

Energy is used for the preparation of dolomite lime, making M gC l _2 cell feed from seawaterand acid generation. Different methodologies show energy requirements and large differencesexist. Considering the higher energy efficiency, the cumulative energy use of 144 MJ/kg is con-sidered (Classen et al. 2007).
China is by far the largest producer of magnesium over the world (93%), whilst EU importsalmost 47% of world’s production of magnesium. Taking into account that China, Russia andSouth Africa impose trade restrictions and that recycling rates are small, magnesium is consid-ered a critical material for the EU, in accordande to the ad-hoc Working Group (2010).
Mercury
The energy requirement for mining and concentrating ore to produce mercury is 157 GJ/t,whilst the smelting and refining processes require 252 GJ/t (Chapman & Roberts 1983).
Niobium
Production of niobium takes places mainly in Brazil (92%) and in Canada (7%). Its recycling rateis around 20%. In spite of niobium substitution possibilities, it may entail higher costs and/orloss in performance, as stated by the ad-hoc Working Group (2010).
The consumption of energy for the smelting and refining of niobium in an electron beamfurnace is 37.8 GJ/t (IPPC 2009a).
Platinum Group Metals (PGM)
The six platinium group metals are Ruthenium (Ru), Rhodium (Rh), Palladium (Pd), Osmium(Os), Iridium (Ir) and Platinum (Pt). These metals are associated with other metals, then theirproduction always delivers other metals than PGM, mainly nickel and copper. Therefore, theprocess of primary production is a multioutput-process.
PGM are highly valuable because thier occurrence is scarce. PGM-containing ores are minedonly in few sites such as Russia and South Africa. In the main, production of PGMs depends ontheir market price and the accompanying metals like Ni or Cu (Classen et al. 2007). Due to thelow concentration and often difficult mining conditions PGM production is very energy inten-sive (Glaister & Mudd 2010).
Recycling is a further source of PGM metals. Automotive catalysts use large amounts ofPGMs, which are recovered depending on the market price of the metals.
Mining ore is mined underground and transferred to beneficiation where operations suchas gravity concentration, flotation, neutralisation are applied. Afterward, the ore is processed inthe pyrometallurgical step which is divided in three substeps (roasting, smelting and convert-ing).
The main metals that occur with PGM winning are nickel and copper, which are separatedthrough hydrometallurgical process such as leaching. The remaining leach residue is composedof all PGM, which are extracted in the refining step (selective precipitation or solvent extrac-tion).
The most important sources for PGM are Russia and South Africa. The recovery of PGMsfrom consumer products is still limited. For instance, in Europe the recovery rate of PGMs
166
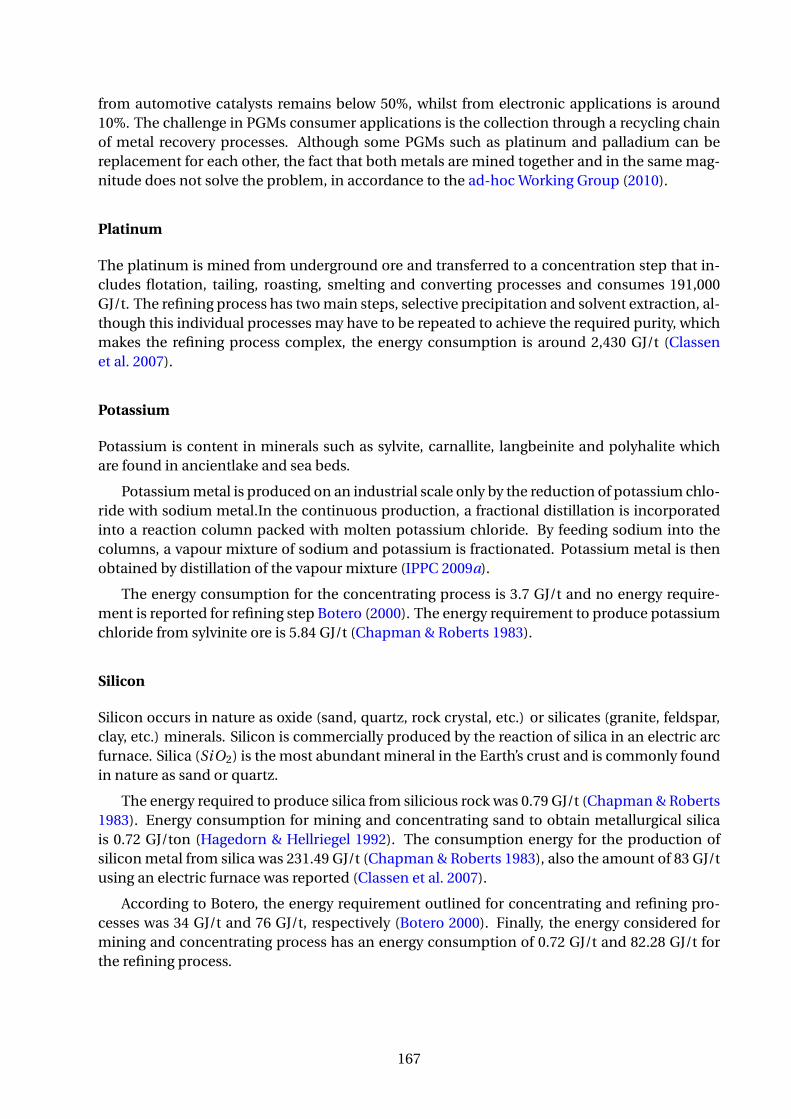
from automotive catalysts remains below 50%, whilst from electronic applications is around10%. The challenge in PGMs consumer applications is the collection through a recycling chainof metal recovery processes. Although some PGMs such as platinum and palladium can bereplacement for each other, the fact that both metals are mined together and in the same mag-nitude does not solve the problem, in accordance to the ad-hoc Working Group (2010).
Platinum
The platinum is mined from underground ore and transferred to a concentration step that in-cludes flotation, tailing, roasting, smelting and converting processes and consumes 191,000GJ/t. The refining process has two main steps, selective precipitation and solvent extraction, al-though this individual processes may have to be repeated to achieve the required purity, whichmakes the refining process complex, the energy consumption is around 2,430 GJ/t (Classenet al. 2007).
Potassium
Potassium is content in minerals such as sylvite, carnallite, langbeinite and polyhalite whichare found in ancientlake and sea beds.
Potassium metal is produced on an industrial scale only by the reduction of potassium chlo-ride with sodium metal.In the continuous production, a fractional distillation is incorporatedinto a reaction column packed with molten potassium chloride. By feeding sodium into thecolumns, a vapour mixture of sodium and potassium is fractionated. Potassium metal is thenobtained by distillation of the vapour mixture (IPPC 2009a).
The energy consumption for the concentrating process is 3.7 GJ/t and no energy require-ment is reported for refining step Botero (2000). The energy requirement to produce potassiumchloride from sylvinite ore is 5.84 GJ/t (Chapman & Roberts 1983).
Silicon
Silicon occurs in nature as oxide (sand, quartz, rock crystal, etc.) or silicates (granite, feldspar,clay, etc.) minerals. Silicon is commercially produced by the reaction of silica in an electric arcfurnace. Silica (SiO2) is the most abundant mineral in the Earth’s crust and is commonly foundin nature as sand or quartz.
The energy required to produce silica from silicious rock was 0.79 GJ/t (Chapman & Roberts1983). Energy consumption for mining and concentrating sand to obtain metallurgical silicais 0.72 GJ/ton (Hagedorn & Hellriegel 1992). The consumption energy for the production ofsilicon metal from silica was 231.49 GJ/t (Chapman & Roberts 1983), also the amount of 83 GJ/tusing an electric furnace was reported (Classen et al. 2007).
According to Botero, the energy requirement outlined for concentrating and refining pro-cesses was 34 GJ/t and 76 GJ/t, respectively (Botero 2000). Finally, the energy considered formining and concentrating process has an energy consumption of 0.72 GJ/t and 82.28 GJ/t forthe refining process.
167

Sodium
The most common compound of sodium is sodium chloride (salt) which occurs in extensiveamounts dissolved in seawater, as well as in solid deposits (halite).
Sodium metal is commonly produced by the electrolysis of fused sodium chloride throughthe Downs Cell, this process reported an energy requirement of 165.21 GJ/t and the energyconsumption for concentrating sodium chloride in rock salt from mineral in the ground was1.65 GJ/t, considering the content of sodium, the energy is 4.2 GJ/t of sodium (Chapman &Roberts 1983).
The energy requirement for mining and concentrating sodium from rock salt was reportedas 3.28 GJ/t whilst the energy required for refining sodium through electrolysis of sodium chlo-ride was 39.63 GJ/t (Botero 2000).
Tantalum
Tantalum is mainly gained from Tantalite and it is currently mined in open pits. A lot of tindeposits occurs with niobium.
The energy needed for mining and concentrating tantalum is 1,375 GJ/t and it was calcu-lated assuming that the process takes place in an open pit mine by means of sulphide acidleaching process. The energy consumption for refining is 380 GJ/t considering that the processis equal as the vanadium refining process by means of direct reduction (Botero 2000).
The energy required during the mining and beneficiation processes is 1,693.16 GJ/t accord-ing to Ecoinvent database. The reduction stage is effectuated by means of magnesium vapor ina rotatory kiln or multiple hearth furnace, the resulting tantalum has an average concentrationof 99.8 percent, this process consumes 2.59 GJ/t (Classen et al. 2007). The consumption of en-ergy for the smelting and refining of tantalum in an electron beam furnace is 37.8 GJ/t (IPPC2009a).
Recycling for tantalum is limited and substitution when possible involves loss of perfor-mance, as the ad-hoc Working Group (2010) states.
Tin
The most important tin ore is cassiterite (SnO_2). 20% of tin is extracted from undergroundmines and 40 % each from open pit mines and from offshore deposits. Underground miningincludes processes like drilling, blasting, sorting (flotation) and thermal ore beneficiation.
The tin production has four main processes: mining, beneficiating, smelting and refining.The refining process of tin from ore concentrate by means of electric furnace and assuming a70 % tin in concentrate, the energy requirement was 19.17 GJ/t (Boustead & Hancock 1979).
The energy requirement for mining and concentrating ore to produce Tin from alluvial oresis 187.5 GJ/t, which have an average percentage of recovery in the mining and concentratingprocess of 80 %, whilst the smelting and refining processes requires around 19.6 GJ/t usingeither electric arc or blast furnace. Otherwise if the tin is mining from hard-rock ores whichhave a typical recovery of 55 %, the energy consumption for concentrating is 157.3 GJ/t, whilethe energy for refining reaches 127 GJ/t (Chapman & Roberts 1983).
The energy consumption for mining and beneficiating processes in underground mining is
168

252.32 GJ/t due to the additional operations of drilling, blasting and thermal ore beneficiationin regard to open pit mining. Considering the beneficiated ores with the average tin content of68 % the smelting and refining steps have an energy demand of 2.48 GJ/t (Classen et al. 2007).
Table A.2: Energy consumption in the tin production. Values expressed in GJ/ton of Sn.Emining Erefining Etotal
Boustead & Hancock (1979) 19.17
Chapman & Roberts (1983) 187.5 19.6 207.1
Classen et al. (2007) 252.32 2.48 254.8
Titanium
Assuming that titanium is mined from rutile ore, the energy requirement for mining and con-centrating is 2.8 GJ/t, whilst the smelting and refining processes require 575 GJ/t. If the minedore is ilmenite the energy consumptions are 23 GJ/t and 687 GJ/t for concentrating and refiningprocesses, respectively (Chapman & Roberts 1983).
The energy requirement for refining titanium is 406.8 GJ/t, this stage is the most energyintensive for several metals (Yoshiki & Toguri 1993). The consumption of energy for the smeltingand refining of titanium in an electron beam furnace is 3.6 GJ/t (IPPC 2009a).
Using a Life Cycle Assessment (LCA) methodology was calculated the gross energy require-ment in the titanium production process as 361 GJ/t of primary energy consumed in overallproduction life cycle from ilmenite, considering a generation efficiency of 50 % due to the uti-lization of thermoelectric and hydroelectric power plants, the energy requirement is 722 GJ/t(Norgate et al. 2007).
Table A.3: Energy consumption in the titanium production. Values expressed in GJ/ton of Ti.Emining Erefining Etotal
Rutile – Chapman & Roberts (1983) 2.8 575 577.8
Ilmenite – Chapman & Roberts (1983) 23 687 710
Yoshiki & Toguri (1993) 406.8
Norgate et al. (2007) 722
Vanadium
Vanadium is found in nature in several minerals such as patronite, carnotite, roscoelite andvanadinite, although it is also present in phosphate rock, some iron ores, bauxite and fossilfuels.
The majority of vanadium metal is produced from vanadium slag, which is obtained from apre-reducing process of titanomagnetite ore in an electric arc furnace. The electric arc furnaceproduces pig iron that is oxidised further in an oxygen blown converter in order to transfer thevanadium into the slag. The slag that contains vanadium is then used as the world’s major rawmaterial source to produce vanadium oxide, which can further be transformed by reduction tovanadium metal, especially alloys that contain vanadium (Classen et al. 2007).
The energy requirement for mining and concentrating ore to produce vanadium is 136 GJ/t,whilst the smelting and refining processes require 381 GJ/t (Botero 2000).
169

Wolfram (Tungsten)
China has the largest reserves of tungsten ore worldwide and is the principal supplier of raw ma-terial. Issues such as cost of alternative materials/technologies, performance decrement, andslight environmental alternatives are the substitution limiting, according to the ad-hoc Work-ing Group (2010).
The energy requirement for mining and concentrating ore to produce tungsten is 213 GJ/t,whilst the smelting and refining processes require 144 GJ/t (Chapman & Roberts 1983).
Zirconium
The main economic source of zirconium is the zircon sillicate mineral, zircon (Z r SiO4) whichis a coproduct or byproduct of the mining and processing of heavy-minerals sands of titaniumor tin minerals. The concentrating of zirconium is done through a magnesium-reduction pro-cess (Kroll process) with a energy requirement of 633 GJ/t and 738.5 GJ/t is consumed duringrefining stage (Botero 2000).
Table A.4: Uses of commodities
Commodity Producing countries Uses
Al Australia, China, Brazil Aircraft, automotive parts, railroads cars,seagoing vessels, packaging, building con-struction, electrical applications, pharmaceu-tical, water treatment
Ag Peru, China, Mexico, UnitedStates, Canada
Industrial application, photography, jew-ellery, electrical applications, batteries
As China, Chile, Morocco
Au China, Australia, UnitedStates, South Africa, Russia
Jewellery, electronics, official coin, dentistry,decoration
Be United States, China,Mozambique
Bi Coolant for nuclear reactors, bi-metal poly-mer bullets, high-T superconductors, com-puter chips
Cd China, Korea, Kazakhstan Batteries, pigments, stabilisers, coatings, al-loys
Ce Catalyst, metal alloys, radiation shielding,phosphors for flat screen TVs
Co Congo, Australia, China Superalloy manufacture (gas turbines and jetengines), hybrid and electric car batteries,storage of solar energy, catalysts, cell phones,tire adhesives, magnetic recording media,hard materials, chemical uses
170
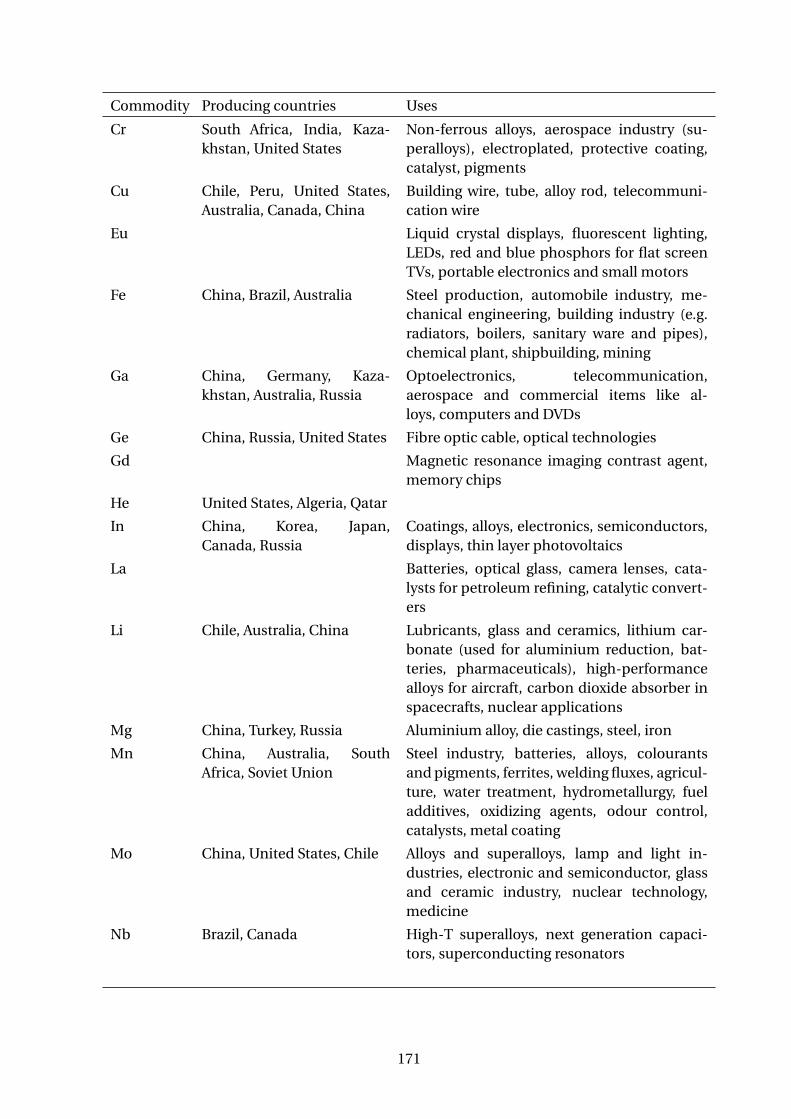
Commodity Producing countries Uses
Cr South Africa, India, Kaza-khstan, United States
Non-ferrous alloys, aerospace industry (su-peralloys), electroplated, protective coating,catalyst, pigments
Cu Chile, Peru, United States,Australia, Canada, China
Building wire, tube, alloy rod, telecommuni-cation wire
Eu Liquid crystal displays, fluorescent lighting,LEDs, red and blue phosphors for flat screenTVs, portable electronics and small motors
Fe China, Brazil, Australia Steel production, automobile industry, me-chanical engineering, building industry (e.g.radiators, boilers, sanitary ware and pipes),chemical plant, shipbuilding, mining
Ga China, Germany, Kaza-khstan, Australia, Russia
Optoelectronics, telecommunication,aerospace and commercial items like al-loys, computers and DVDs
Ge China, Russia, United States Fibre optic cable, optical technologies
Gd Magnetic resonance imaging contrast agent,memory chips
He United States, Algeria, Qatar
In China, Korea, Japan,Canada, Russia
Coatings, alloys, electronics, semiconductors,displays, thin layer photovoltaics
La Batteries, optical glass, camera lenses, cata-lysts for petroleum refining, catalytic convert-ers
Li Chile, Australia, China Lubricants, glass and ceramics, lithium car-bonate (used for aluminium reduction, bat-teries, pharmaceuticals), high-performancealloys for aircraft, carbon dioxide absorber inspacecrafts, nuclear applications
Mg China, Turkey, Russia Aluminium alloy, die castings, steel, iron
Mn China, Australia, SouthAfrica, Soviet Union
Steel industry, batteries, alloys, colourantsand pigments, ferrites, welding fluxes, agricul-ture, water treatment, hydrometallurgy, fueladditives, oxidizing agents, odour control,catalysts, metal coating
Mo China, United States, Chile Alloys and superalloys, lamp and light in-dustries, electronic and semiconductor, glassand ceramic industry, nuclear technology,medicine
Nb Brazil, Canada High-T superalloys, next generation capaci-tors, superconducting resonators
171

Commodity Producing countries Uses
Nd Hard disk drives, medical applications,portable electronics and small motors,high-strength permanent magnets, lasertechnology
Ni – lat-erites
Australia, Brazil, Cuba Stainless steel, battery manufacture, coin pro-duction, welding products, fuel filters, paints,electronics
Ni – sul-phide
Russia, Indonesia, Canada,South Africa, Australia
Pb China, Australia, UnitedStates, Canada
Batteries, pigments, alloys, cable sheathing,lead crystal, solder and radiation protection
Pd Russia, South Africa, UnitedStates
Catalysts, seawater desalination
PGM Russia, South Africa Automotive catalysts, electronics, hydrogenfuel cells, industrial applications, jewellery,coins, glass, dentistry, petroleum, laboratoryequipment, medical implants
Pr Flat screen TVs, portable electronics and smallmotors, hard disk drives, magnets, lasers, pig-ments, cryogenic refrigerant
Pt South Africa, Russia, Zim-babwe
Hydrogen fuel cells, chemical sensors, can-cer drugs, flat-panel displays, electronics, cat-alysts, jewellery
REE China, India, Brazil, UnitedStates, Australia
Optics, magnetics, electronics, ceramics,glass, metallurgy, catalyst
Re Chile, United States, Kaza-khstan
Se Japan, Belgium, Canada
Sc Super alloys, light aerospace components, X-ray tubes, catalysts
Sn China, Indonesia, Peru
Sb China, Bolivia, Russia, SouthAfrica
Micro capacitors
Ta China,Thailand, Malaysia,Indonesia
Electronic components (capacitors), superal-loys, medical technology, lining for chemicaland nuclear reactors, wires, cameras
Tb Green phosphor for flat screen TVs, lasers, flu-orescent lamps, optical computer memories,medical applications
Te Chile, United States, Peru,Canada, Japan
Photovoltaic solar cells, thermoelectric de-vices, steel alloy
172

Commodity Producing countries Uses
Ti Malaysia, Indonesia andThailand
Food packaging, electronics, chemicals,aircraft and automotive components,lightweight alloys, joint replacement, paints,watches, chemical processing equipment,marine equipment, pulp and paper process-ing equipment, pipes, jewellery
U Canada, Kazakhstan, Aus-tralia
nuclear fuel, nuclear weapons, X-ray targets,photographic toner
V China, South Africa, Russia Alloys (especially steel), catalysts, pigmentsfor ceramics and glass, batteries, medical,pharmaceutical, electronics
W China, Russia, Canada Negative thermal expansion devices, high-Tsuperalloys, X-ray photo imaging, alloys (elec-tric lamp filaments, electron and televisiontube, metal evaporation work), ammunition,chemical and tanning industry, paints
Y Compact fluorescent lamps, LEDs, flat-screenTVs, medical applications, ceramics
Zn China, Peru, Australia,Canada
Construction, automotive equipment, agri-culture, electrical components, galvanizing,alloys, brass, batteries, roofing, water purifi-cation, coins, zinc oxide (widely used in man-ufactured goods), zinc sulfide (luminous di-als, X–ray and TV screens, paints, fluorescentlights)
Zr Ceramics, refractories, foundry sands, glass,chemical piping in corrosive environments,nuclear power reactors, hardening agent inalloys, heat exchangers, photographic flash-bulbs, surgical instruments
173


Appendix B
Input-Output Analysis
The input-output was developed by Wassily Leontief from 1930s to the 1950s. It consists of aqualitative and quantitative analysis of the relations that link the flows of goods and servicesbetween the components of an economic unit, in order to study its structural characteristics.It describes how industries are interrelated through producing and consuming intermediateindustry outputs.
Assuming that the economy is divided into n industries. The total output of industry i isdenoted as xi , the final demand for industry products as yi , and the intermediate input salesfrom industry i to industry j as xi j . Then, the I–O system of equations can be expressed as:
x1 = x11 +x12+ ·· · +x1 j+ ·· · +x1n + y1
x2 = x21 +x22+ ·· · +x2 j+ ·· · +x2n + y2...
......
xi = xi 1 +xi 2+ ·· · +xi j+ ·· · +xi n + yi...
......
xn = xn1 +xn2+ ·· · +xn j+ ·· · +xnn + yn
(B.1)
To aid further analysis, it is defined the technical coefficient which express the value of in-termediate inputs that are required by industry j from industry i to produce a unit of productin industry j :
ai j =xi j
x j(B.2)
Using these technical coefficients, the I–O system of equations can be re-write in matrixform:
X = AX + Y (B.3)
where X =
∣∣∣∣∣∣∣∣∣∣∣
x1
x2...
xn
∣∣∣∣∣∣∣∣∣∣∣175
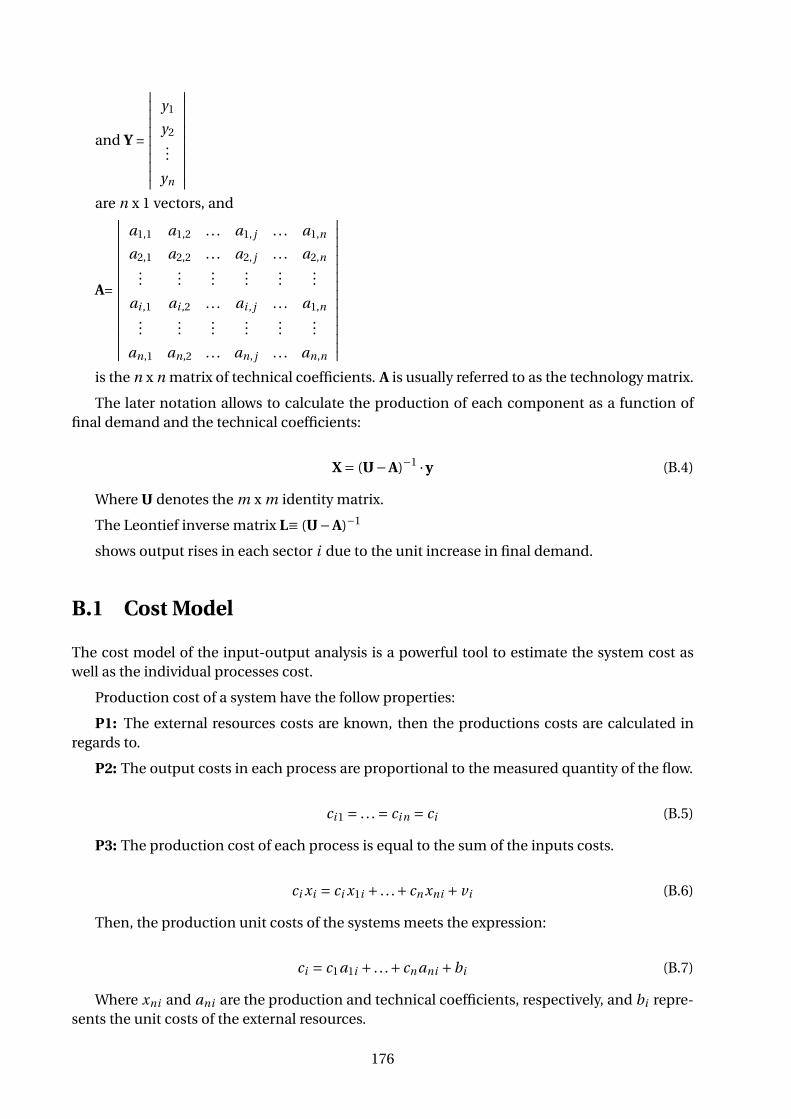
and Y =
∣∣∣∣∣∣∣∣∣∣∣
y1
y2...
yn
∣∣∣∣∣∣∣∣∣∣∣are n x 1 vectors, and
A=
∣∣∣∣∣∣∣∣∣∣∣∣∣∣∣∣
a1,1 a1,2 . . . a1, j . . . a1,n
a2,1 a2,2 . . . a2, j . . . a2,n...
......
......
...
ai ,1 ai ,2 . . . ai , j . . . a1,n...
......
......
...
an,1 an,2 . . . an, j . . . an,n
∣∣∣∣∣∣∣∣∣∣∣∣∣∣∣∣is the n x n matrix of technical coefficients. A is usually referred to as the technology matrix.
The later notation allows to calculate the production of each component as a function offinal demand and the technical coefficients:
X = (U−A)−1 ·y (B.4)
Where U denotes the m x m identity matrix.
The Leontief inverse matrix L≡ (U−A)−1
shows output rises in each sector i due to the unit increase in final demand.
B.1 Cost Model
The cost model of the input-output analysis is a powerful tool to estimate the system cost aswell as the individual processes cost.
Production cost of a system have the follow properties:
P1: The external resources costs are known, then the productions costs are calculated inregards to.
P2: The output costs in each process are proportional to the measured quantity of the flow.
ci 1 = . . . = ci n = ci (B.5)
P3: The production cost of each process is equal to the sum of the inputs costs.
ci xi = ci x1i + . . .+ cn xni + vi (B.6)
Then, the production unit costs of the systems meets the expression:
ci = c1a1i + . . .+ cn ani +bi (B.7)
Where xni and ani are the production and technical coefficients, respectively, and bi repre-sents the unit costs of the external resources.
176

The cost model equations can be re-writed in matrix form:∣∣∣∣∣∣∣∣c1...
cn
∣∣∣∣∣∣∣∣=∣∣∣∣∣∣∣∣
ai ,1 . . . a1,n...
. . ....
an,1 . . . an,n
∣∣∣∣∣∣∣∣ ·∣∣∣∣∣∣∣∣
c1...
cn
∣∣∣∣∣∣∣∣+∣∣∣∣∣∣∣∣
b1...
bn
∣∣∣∣∣∣∣∣Or,
c = AT · c +b (B.8)
Where AT is the transposed matrix of A. Then, it is possible to calculate the unit costs of eachprocess as function of the unit costs of the external resources and the technical coefficients orlocal consumptions, as follows:
c = (U − AT )−1 ·b (B.9)
177


Appendix C
Exergy Cost Allocation for deposit models
Allocation factors of several mineral deposits depicted in following Tables and its correspondingFigures, are based on tonnage, price and exergy replacement cost. See Chapter 5.
Table C.1: Cost allocation of Cu-Mn-P deposits as a function of tonnage, price and ERC.Deposit Replacement Mn
type Ton. [%] Price [%] ERC [%]
1980 2006
Copper 2.4 14.5 18.9 15.7
Manganese 89.3 85.1 80.8 84.1
Phosphorus 8.2 0.4 0.3 0.2
Table C.2: Cost allocation of Mn-P deposits as a function of tonnage, price and ERC.Deposit Volcanogenic Mn
type Ton. [%] Price [%] ERC [%]
1980 2006
Manganese 99.8 99.99 99.99 99.99
Phosphorus 0.2 0.01 0.01 0.01
Table C.3: Cost allocation of Fe-P deposits as a function of tonnage, price and ERC.Deposit Algoma and Sup. Fe Volcan.-hosted magnetite
type Ton. [%] Price [%] ERC [%] Ton. [%] Price [%] ERC [%]
1980 2006 1980 2006
Iron 99.9 99.9 99.9 99.997 99.3 99.6 99.6 99.98
Phosphorus 0.1 0.1 0.1 0.003 0.7 0.4 0.4 0.02
179

Table C.4: Cost allocation of Sb-Au-Ag deposits as a function of tonnage, price and ERC.Deposit Sb venis Disseminated Sb
type Ton. [%] Price [%] ERC [%] Ton. [%] Price [%] ERC [%]
1980 2006 1980 2006
Antimony 99.99 90.2 94.1 98.1 99.996 94.6 96.7 98.9
Gold 0.001 7.9 5.2 1.8 0.001 4.7 3 1.0
Silver 0.01 1.9 0.7 0.2 0.003 0.6 0.2 0.1
Table C.5: Cost allocation of Co-Cu deposits as a function of tonnage, price and ERC.Deposit Sedim.-hosted Cu
type Ton. [%] Price [%] ERC [%]
1980 2006
Cobalt 10 72.1 33.1 91.7
Copper 90 27.9 66.9 8.3
Table C.6: Cost allocation of Cu-Pb-Ag-Zn deposits as a function of tonnage, price and ERC.Deposit Sedim. Exhal Zn-Pb
type Ton. [%] Price [%] ERC [%]
1980 2006
Copper 2.2 4 4.8 7.1
Lead 32.2 24.7 17.3 34.5
Silver 0.1 27.2 5.9 10.8
Zinc 65.51 44.1 72 47.5
Table C.7: Cost allocation of Co-Ni deposits as a function of tonnage, price and ERC.Deposit Laterite Ni
type Ton. [%] Price [%] ERC [%]
1980 2006
Cobalt 4.9 29.9 6.1 42.4
Nickel 95.1 70.1 93.9 57.6
180

0%
10%
20%
30%
40%
50%
60%
70%
80%
90%
100%
1900
1903
1906
1909
1912
1915
1918
1921
1924
1927
1930
1933
1936
1939
1942
1945
1948
1951
1954
1957
1960
1963
1966
1969
1972
1975
1978
1981
1984
1987
1990
1993
1996
1999
2002
2005
2008
2011
GOLD COPPER SILVER B* Au B*Cu B* Ag
Au, B*
Au, $
Cu, $
Cu, B*
Ag, $ Ag, B*
Figure C.1: Cost allocation of Cu-Au-Ag deposits as a function of price and ERC.
0%
10%
20%
30%
40%
50%
60%
70%
80%
90%
100%
1900
1902
1904
1906
1908
1910
1912
1914
1916
1918
1920
1922
1924
1926
1928
1930
1932
1934
1936
1938
1940
1942
1944
1946
1948
1950
1952
1954
1956
1958
1960
1962
1964
1966
1968
1970
1972
1974
1976
1978
1980
1982
1984
1986
1988
1990
1992
1994
1996
1998
2000
2002
2004
2006
2008
2010
Copper Manganese Phosporous B*Cu B*Mn B*P
Mn, $
Mn, B*
Cu, $
Cu, B*
P, $
P, B*
Figure C.2: Cost allocation of Cu-Mn-P deposits as a function of price and ERC.
181

0%
10%
20%
30%
40%
50%
60%
70%
80%
90%
100% 1900
1902
1904
1906
1908
1910
1912
1914
1916
1918
1920
1922
1924
1926
1928
1930
1932
1934
1936
1938
1940
1942
1944
1946
1948
1950
1952
1954
1956
1958
1960
1962
1964
1966
1968
1970
1972
1974
1976
1978
1980
1982
1984
1986
1988
1990
1992
1994
1996
1998
2000
2002
2004
2006
2008
2010
Cobalt Copper B*Co B*Cu
Co, B*
Cu, B*
Co, $
Cu, $
Figure C.3: Cost allocation of Co-Cu deposits as a function of price and ERC.
0%
10%
20%
30%
40%
50%
60%
70%
80%
90%
1900
1902
1904
1906
1908
1910
1912
1914
1916
1918
1920
1922
1924
1926
1928
1930
1932
1934
1936
1938
1940
1942
1944
1946
1948
1950
1952
1954
1956
1958
1960
1962
1964
1966
1968
1970
1972
1974
1976
1978
1980
1982
1984
1986
1988
1990
1992
1994
1996
1998
2000
2002
2004
2006
2008
2010
Copper Silver Zinc Lead B*Cu B*Ag B*Zn B*Pb
Zn, B*
Pb, B*
Ag, B*
Cu, B*
Zn, $
Pb, $
Cu, $
Ag, $
Figure C.4: Cost allocation of Cu-Pb-Ag-Zn deposits as a function of price and ERC.
182
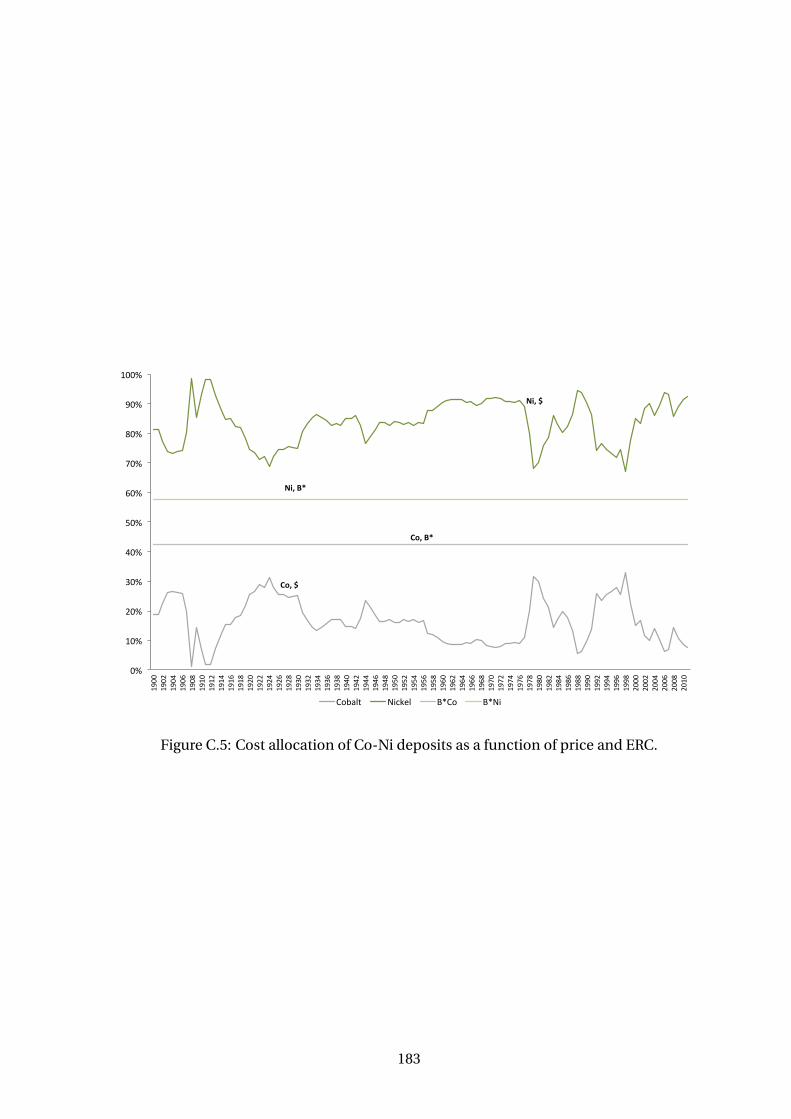
0%
10%
20%
30%
40%
50%
60%
70%
80%
90%
100%
1900
1902
1904
1906
1908
1910
1912
1914
1916
1918
1920
1922
1924
1926
1928
1930
1932
1934
1936
1938
1940
1942
1944
1946
1948
1950
1952
1954
1956
1958
1960
1962
1964
1966
1968
1970
1972
1974
1976
1978
1980
1982
1984
1986
1988
1990
1992
1994
1996
1998
2000
2002
2004
2006
2008
2010
Cobalt Nickel B*Co B*Ni
Ni, B*
Co, B*
Ni, $
Co, $
Figure C.5: Cost allocation of Co-Ni deposits as a function of price and ERC.
183
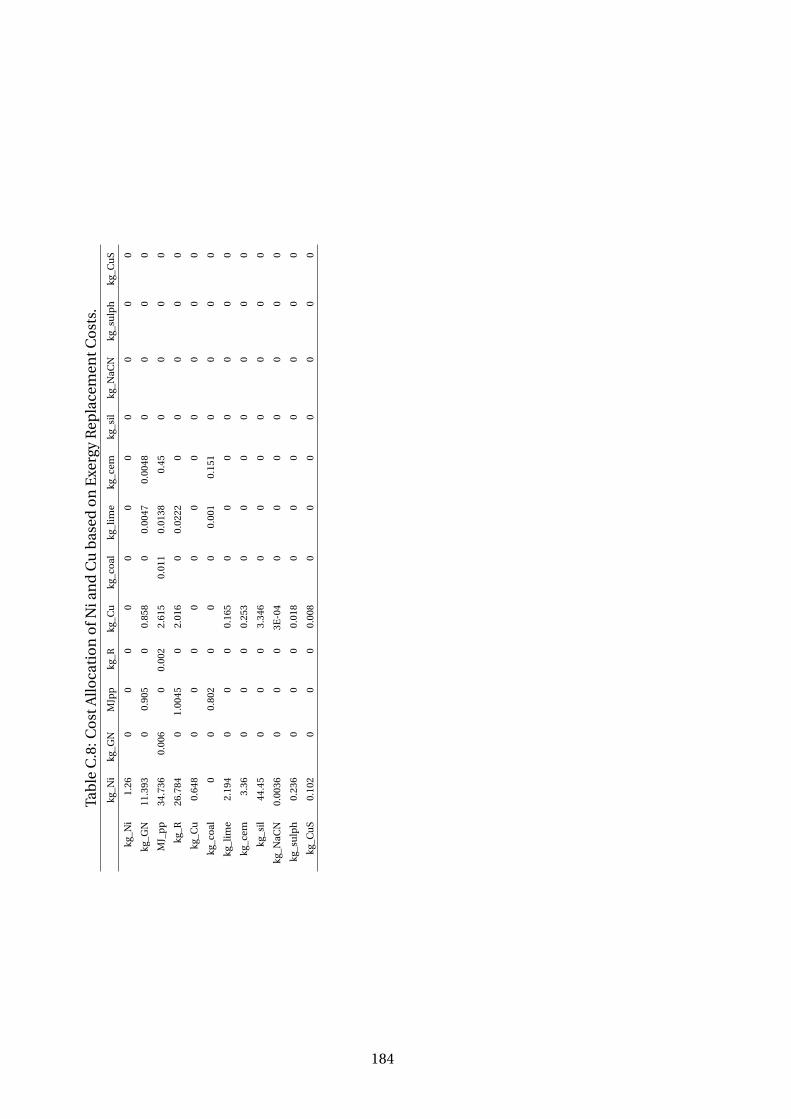
Tab
leC
.8:C
ost
Allo
cati
on
ofN
ian
dC
ub
ased
on
Exe
rgy
Rep
lace
men
tCo
sts.
kg_N
ikg
_GN
MJp
pkg
_Rkg
_Cu
kg_c
oal
kg_l
ime
kg_c
emkg
_sil
kg_N
aCN
kg_s
ulp
hkg
_Cu
S
kg_N
i1.
260
00
00
00
00
00
kg_G
N11
.393
00.
905
00.
858
00.
0047
0.00
480
00
0
MJ_
pp
34.7
360.
006
00.
002
2.61
50.
011
0.01
380.
450
00
0
kg_R
26.7
840
1.00
450
2.01
60
0.02
220
00
00
kg_C
u0.
648
00
00
00
00
00
0
kg_c
oal
00
0.80
20
00
0.00
10.
151
00
00
kg_l
ime
2.19
40
00
0.16
50
00
00
00
kg_c
em3.
360
00
0.25
30
00
00
00
kg_s
il44
.45
00
03.
346
00
00
00
0
kg_N
aCN
0.00
360
00
3E-0
40
00
00
00
kg_s
ulp
h0.
236
00
00.
018
00
00
00
0
kg_C
uS
0.10
20
00
0.00
80
00
00
00
184

Tab
leC
.9:C
ost
Allo
cati
on
ofN
i-C
u-C
ob
ased
on
Exe
rgy
Rep
lace
men
tCo
sts.
kg_N
ikg
_GN
MJ_
pp
kg_R
kg_C
ukg
_co
alkg
_lim
ekg
_cem
kg_s
ilkg
_NaC
Nkg
_su
lph
kg_C
uS
kg_C
o
kg_N
i1.
260
00
00
00
00
00
00
kg_G
N10
.045
00.
905
00.
735
00.
005
0.00
50
00
01.
470
MJ_
pp
30.6
270.
0059
00.
002
2.24
10.
011
0.01
40.
450
00
00
4.48
2
kg_R
23.6
160
1.00
50
1.72
80
0.02
20
00
00
3.45
6
kg_C
u0.
648
00
00
00
00
00
00
kg_c
oal
00
0.80
30
00
0.00
10.
151
00
00
0
kg_l
ime
1.93
40
00
0.14
20
00
00
00
0.28
3
kg_c
em2.
968
00
00.
217
00
00
00
00.
434
kg_s
il39
.196
00
02.
868
00
00
00
05.
736
kg_N
aCN0
.003
00
00.
000
00
00
00
00.
000
kg_s
ulp
h0.2
080
00
0.01
50
00
00
00
0.03
0
kg_C
uS
0.09
00
00
0.00
70
00
00
00
0.01
3
kg_C
o0.
013
00
00
00
00
00
00
185

Tab
leC
.10:
Co
stA
lloca
tio
no
fCu
-Mo
-Ag-
Teb
ased
on
Exe
rgy
Rep
lace
men
tCo
sts.
kg_C
u1
kg_C
u_2
kg_M
okg
_Te
kg_A
gkg
_Cu
_3kg
_GN
MJ_
pp
kg_R
kg_c
oal
kg_l
ime
kg_A
lkg
_sil
kg_N
aCN
kg_s
ulp
hkg
_Cu
Skg
_Okg
_ste
el
kg_C
u_1
03.
150
00
00
00
00
00
00
00
00
kg_C
u_2
00
00
00
00
00
00
00
00
00
kg_M
o0.
008
00
00
00
00
00
00
00
00
0
kg_T
e0
0.00
005
00
00
00
00
00
00
00
00
kg_A
g0
0.00
030
00
00
00
00
00
00
00
0
kg_C
u_3
00.
094
00
00
00
00
00
00
00
00
kg_G
N0
2.81
60
0.27
20.
076
00
0.90
50
00.
005
00
00
00
0
MJ_
pp
2.55
31.
577
0.08
70.
152
0.04
22.
910
0.00
60
0.00
20.
011
0.01
45.
526
00
00
00
kg_R
0.00
35.
319
0.00
009
0.51
30.
143
0.78
30
1.00
50
00.
022
0.18
90
00
00
0
kg_c
oal
00.
023
00.
002
0.00
10
00.
803
00
0.00
10
00
00
00
kg_l
ime
0.04
10.
201
0.00
10.
019
0.00
50
00
00
00
00
00
00
kg_A
l0
0.00
10
0.00
00.
0000
20
00
00
00
00
00
00
kg_s
il0
0.67
10
0.06
50.
018
00
00
00
00
00
00
0
kg_N
aCN
0.00
10
0.00
004
00
00
00
00
00
00
00
0
kg_s
ulp
h0.
130
00.
004
00
00
00
00
00
00
00
0
kg_C
uS
0.03
50
0.00
10
00
00
00
00
00
00
00
kg_O
00.
234
00.
023
0.00
60
00
00
00
00
00
00
kg_s
teel
0.02
60
0.00
090
00
00
00
00
00
00
00
186

Conclusiones
En este apartado de conclusiones se presenta una síntesis de esta tesis. Además, se mencionanlas principales contribuciones así como las publicaciones científicas derivadas de este trabajo.Finalmente, se exponen las perspectivas que han surgido durante el desarrollo de esta tesis y seproponen para estudios posteriores.
Síntesis
La accesibilidad y disponibilidad de los recursos minerales se ha convertido en un tema cru-cial para el progreso tecnológico. Muchos de estos recursos son considerados estratégicos ocríticos, puesto que son determinantes para el desarrollo de nuevas tecnologías, las energíasrenovables y las TICs. Por lo que asegurar su disponibilidad se ha convertido en una tarea im-perativa. En este sentido, es necesario como primer paso contabilizar apropiadamente el usode los recursos así como optimizar y analizar a través de métodos objetivos y rigurosos la in-dustria minera y metalúrgica.
Por consiguiente, el objetivo principal de esta tesis doctoral consistió en la aplicación demetodologías termoeconómicas que permitieron realizar un “Análisis de Ciclo de Vida abso-luto” de los recursos minerales. De esta manera, no sólo el enfoque convencional de “la cunaa la tumba” es considerado, sino también el complementario, de “la tumba a la cuna”. Por lotanto, se complementó el análisis termoeconómico con el enfoque exergoecológico a través delos costes exergéticos de reposición (ERC). Los ERC contabilizan la exergía necesaria para regre-sar un mineral que ha sido extraído a sus condiciones iniciales de composición, concentracióny cohesión con la tecnología actual. De esta forma, la combinación de metodologías permitetener en cuenta no sólo el esfuerzo requerido para producir un metal sino también la pérdidade la riqueza mineral asociada al agotamiento de los depósitos naturales.
El objetivo del Capítulo 1 consistió en mostrar un perspectiva general de los recursos min-erales y de la industria minera. Dado que esta tesis doctoral esta centrada en la evaluación dela minería global, temas como el desarrollo sostenible y el análisis de ciclo de vida aplicado alagotamiento de los recursos naturales han sido abordados. Adicionalmente, se ha presentadouna perspectiva global de la producción, la evolución de los precios de mercado y la situaciónactual de los minerales.
En el Capítulo 2 se proporcionó una síntesis de la cadena productiva de varios mineralesmetálicos. Por lo que se describieron los principales procesos de extracción y metalúrgicos enla industria minera. Posteriormente, se realizó un análisis más detallado de los procesos met-alúrgicos específicos para cada uno de los metales analizados, y aplicados en diferentes casosde estudio a lo largo del desarrollo de esta tesis. Se observó que los datos de los requerimientosenergéticos para el procesado de metales varía notablemente, así como el hecho de que la en-
187

ergía asociada se incrementa sustancialmente debido a diferentes factores, tales como: bajasleyes minerales, profundidad de las minas, complejidad de la mena y el aumento de residuos.El Capítulo 2 finaliza con una recopilación de los requerimientos energéticos necesarios parala producción de 33 minerales, dividiendo la información en dos etapas: 1) minería y concen-tración y 2) fundición y refinado.
Los cambios tecnológicos han jugado un factor crucial en la evolución de los procesos deproducción dentro del sector minero. De ahí que en el Capítulo 3 se mostró la evolución históricade la innovación tecnológica en la industria minera, la cual debería compensar el incrementode los costos asociados a las dificultades operativas que se han presentado este sector a travésdel tiempo.
La industria minera, además de hacer frente a los problemas comunes a cualquier otraindustria, debe enfrentar un problema adicional: la disminución de las leyes minerales. En-tonces, se puede decir que la disponibilidad futura de los recursos minerales esta influenciadapor dos factores opuestos. Por un lado, la tendencia general sugiere una disminución de la leymineral, lo que ha incrementado el consumo energético en la industria minera. Y por otro lado,ha habido transiciones tecnológicas que podrían evitar el aumento del consumo energético. Elobjetivo del Capítulo 3 consistió en analizar si los avances tecnológicos que han tenido lugaren este sector, pueden evitar el aumento en la demanda de energía, tomando como ejemplo laminería del oro.
Conforme se adquiere experiencia, la eficiencia en el uso de materias y energía aumenta,estos cambios tecnológicos pueden expresarse a través de las curvas de aprendizaje. Por con-siguiente, la teoría de las curvas de aprendizaje se aplicó a varias minas de oro en distintospaíses. Los porcentajes de progreso promedios obtenidos para diferentes países varían entre+20% y -22%. Este estudio permitió tener un mejor conocimiento del sector minero así comode las consecuencias de la evolución tecnológica aunada al decremento de la ley mineral. Detal forma que se pueden identificar las minas en las cuales las operaciones mineras y los pro-cesos metalúrgicos han probado ser exitosos en lo que al ahorro de energía se refiere. De estamanera, es posible identificar las mejores prácticas en el sector minero, para que las innova-ciones tecnológicas sirvan de referencia a otras minas con condiciones similares alrededor delmundo. Los resultados muestran que aunque ha habido avances tecnológicos, por lo generalel consumo energético en el sector ha ido en aumento en la mayoría de los casos, debido a queestos dependen principalmente de la ley mineral. Por lo anterior, se puede decir que en generallos avances tecnológicos no han sido ni serán capaces de mitigar el aumento de energía en laindustria minera si no se presentan avances tecnológicos contundentes.
Una vez revisados los principales aspectos relacionados con la industria minera, en el Capí-tulo 4 se presentaron los fundamentos termodinámicos para evaluar los procesos mineros ymetalúrgicos. Por lo que se presentaron las bases de los análisis exergético, termoeconómico,termoecológico y exergoecológico. Particularmente, se presentó la Termoeconomía, definidacomo una teoría general para el ahorro de energía, la cual integra la Termodinámica (análisisexergético) y la Economía (costo exergético) a través de la Segunda Ley de la Termodinámica.Mientras que la teoría del Costo Termo-Ecol?gico (TEC), define este último como el consumoacumulado de exergía no renovable requerida para producir una unidad de producto útil a par-tir de materias primas contenidas en los depósitos naturales, con la inclusión adicional delconsumo resultante de la necesidad de compensar los daños ambientales debidos a la emisiónde sustancias contaminantes al ambiente. Ambas metodologías están muy relacionadas, por loque sus similitudes y diferencias fueron explicadas. Además, ambos métodos pueden ser mejo-rados en cuanto al análisis de la extracción de minerales y procesos metalúrgicos se refiere, a
188

través de la Exergoecología, usando los costos exergéticos de reposición de los minerales.
Los costos exergéticos de reposición son el punto de referencia para evaluar la concen-tración, composición y el estado de la tecnología integrados en un sólo parámetro. Al con-trario de los combustibles fósiles, los minerales no se pierden cuando son utilizados, puestoque generalmente terminan dispersos en vertederos. Contar con un orden de magnitud decuanto costaría reponer estos minerales dispersos, permitirá una gestión más adecuada de losmismos. La importancia de los costos exergéticos de reposición radica en su habilidad paraestablecer un factor de escasez de los recursos minerales, los cuales deben ser contabilizadoscuando se analiza la sostenibilidad de la industria minera.
Los fundamentos del enfoque exergoecológico fueron desarrollados en una tesis doctoralprevia, sin embargo algunos aspectos quedaron sin resolver, como la influencia de la tenden-cia del decremento de la ley mineral en los costos exergéticos de reposición. Por lo tanto, estatesis ha tratado de mejorar la metodología y se han calculado valores de ERC más precisos paracada sustancia. La variable principal para obtener dichos costos es el costo exergético unitario,el cual representa la proporción entre la energía acumulada real requerida para la extracción yconcentración de una sustancia y la energía (exergía) mínima requerida para realizar el mismoproceso. Por lo tanto, proporcionan una medida de la irreversibilidad (ignorancia tecnológica)de un proceso. Dado que la energía requerida en la minería es función de la ley mineral y dela tecnología utilizada, ambos factores tienen influencia sobre los costos exergéticos de reposi-ción unitarios. Teniendo en cuenta datos empíricos de los requerimientos energéticos en laminería en función de la ley mineral, los nuevos valores obtenidos de los costos exergéticos dereposición para diferentes minerales se presentaron en el Capítulo 5. Adicionalmente, se ob-tuvo una expresión general del consumo de energía vs. la ley mineral, para aquellos mineralesde los que no se tenían datos empíricos disponibles. Se observó que la tendencia general es queconforme la ley mineral decrece, la energía y los costos exergéticos de reposición incrementanexponencialmente. Los valores obtenidos constituyen un paso intermedio para evaluar de unamanera física, la exergía gratuita de la naturaleza que el hombre esta destruyendo rápidamentea través del agotamiento de las mayores leyes minerales. Estos valores deberían proporcionaruna herramienta de valoración para los tomadores de decisiones en la industria minera.
Otro aspecto que se ha analizado en esta tesis, es el problema de asignación de costos enlos procesos de la industria minera y metalúrgica. Se sabe que en la minería con cada mineralextraído, se obtienen subproductos y residuos. Una estrategia de desarrollo sostenible en la in-dustria minera consiste en implementar una política de cero desechos, emigrando a la mineríapolimetálica, en la que se aprovechen todos los recursos minerales y se recuperen la mayor can-tidad de subproductos. Por lo que la industria minera debe ser vista como un sistema que pro-duce subproductos, mismos que necesitan métodos de asignación de costos objetivos, como elpropuesto en el Capítulo 5 de esta tesis.
Los metales que se producen como subproductos generalmente tienen complicaciones encuanto a la demanda y suministro, los requerimientos tecnológicos así como en temas de in-versión. La producción de estos subproductos dependen de la disponibilidad y factibilidadtecnológica para recuperar estos metales durante o después del procesado de los metales prin-cipales, así como del beneficio económico de los subproductos recuperados. La energía finalutilizada para obtener dichos subproductos es difícil de estimar puesto que hasta ahora no ex-iste uniformidad en cuanto a los procedimientos para la asignación de costos.
Actualmente, la asignación de costos entre los productos y subproductos obtenidos en laindustria minera y metalúrgica están basados en el tonelaje o en precios comerciales. Am-
189

bos métodos de asignación conllevan varias desventajas, tales como subjetividad con el precioo la subestimación de aquellos subproductos que presentan un bajo tonelaje. Si se tiene encuenta que la extracción de minerales y el subsiguiente procesado de los mismos constituye laprimer etapa de cualquier proceso, utilizar programas convencionales para el análisis de ciclode vida, que asignan costos en función del tonelaje o los precios de mercado, puede conducira resultados incorrectos. En el Capítulo 5 se propuso un método riguroso basado en exergíapara asignar costos entre los subproductos mineros a través de los costos exergéticos de reposi-ción. Este enfoque permitió asignar costos en función de la calidad física de los minerales. Losmétodos de asignación de costos basados en tonelaje, precio y costos exergéticos de reposi-ción, fueron aplicados a varios modelos de depósitos minerales. De esta manera se demostróque la asignación de costos teniendo en cuenta el tonelaje no siempre es una opción apropiadadebido a las pequeñas cantidades de subproductos que pueden presentarse, pero que puedenser tanto o más valiosas que el producto principal. Por otra parte, si se utiliza el precio de mer-cado para la asignación de costos, se presenta el problema asociado a su alta volatilidad, quea su vez depende de variables macroeconómicas que comúnmente no reflejan las condicionesfísicas de los recursos minerales en la Naturaleza. Los resultados obtenidos sugieren que si loscostos exergéticos de reposición son aplicados a la asignación de costos, se obtienen valoresde asignación similares a los que se obtienen cuando se considera el precio como indicador.Lo anterior respalda la idea que los costos exergéticos de reposición son similares al valor quela sociedad asigna a los minerales. Con la ventaja de que los costos exergéticos de reposiciónno fluctúan con factores externos relacionados con los mecanismos de mercado, sino que per-manecen constantes, caso contrario a lo que ocurre con los precios.
Una vez que se demostraron las ventajas del nuevo procedimiento de asignación de costos,se aplicó la metodología a cuatro casos de estudios donde se produce níquel, cobre, plomo ytierras raras, como metales principales y sus respectivos subproductos, con el objetivo de asig-nar a cada subproducto las entradas de materia prima y combustibles fósiles correspondientes.De esta manera, se calculó el costo físico de la producción de los diferentes metales obtenidosen una operación minera. Los resultados demuestran que en general los precios no están rela-cionados adecuadamente con los costos naturales, porque no se está tomando en cuenta elfactor de agotamiento mineral y el hecho de que el hombre esta destruyendo la riqueza min-eral de la tierra, que estará indisponible para las generaciones futuras.
En el Capítulo 6 de esta tesis, se realizó el análisis exergético del proceso de obtención dediversos minerales. El caso del procesamiento de níquel, se estudió exhaustivamente en estatesis, se realizó un análisis exergético del flujo de energía y materiales para la producción deníquel a partir de dos tipos de mineral (lateritas y sulfuros). Los resultados muestran que elprocesamiento de níquel presenta mayores eficiencias cuando se produce níquel a partir desulfuros que de lateritas. El procesamiento de sulfuros presenta eficiencias que fluctúan entre67% y 79%, dependiendo de la tecnología utilizada, las mayores eficiencias se alcanzan cuandose emplean procesos de lixiviación. Para el caso de lateritas, las eficiencias alcanzadas estánalrededor de 38% debido al costo intensivo de procesamiento. Este análisis se realizó teniendoen cuenta la exergía química de los materiales, lo que permitió hacer comparaciones directasentre diversas rutas de producción. Los resultados fueron comparados con el método exer-goecológico, que incluye no sólo la exergía química de los minerales, sino que involucra tam-bién la exergía de concentración. Se concluyó que el análisis a partir de la exergía química noes suficiente para valorar adecuadamente los minerales. Por ejemplo, las lateritas tienen unaexergía química insignificante, sin embargo, sus requerimientos energéticos y contabilizaciónexergética son mayores que los obtenidos para los sulfuros, los cuales tienen una mayor exergía
190
química. Así pues, se puede concluir que la exergía química utilizada en los análisis exergéti-cos puede conducir a resultados poco fiables, porque esta faltando la exergía de concentración.Es importante destacar que el valor de los minerales está mucho más asociado con su gradode escasez. Ésta es la razón por la cual la exergía de concentración, calculada por los costosexergéticos de reposición, es mucho más relevante cuando se analizan recursos minerales.
Posteriormente, en este mismo Capítulo 6 se realizó un análisis exergético más complejo delprocesamiento de varios minerales a través del costo termoecológico, ampliando así el análisishasta un enfoque de “la cuna al mercado”. El TEC evalúa el consumo acumulado de exergíano renovable requerida para producir una unidad de producto útil a partir de materias primascontenidas en los depósitos naturales. Con este método, es posible dividir los resultados encomponentes asociadas al consumo de combustibles fósiles o consumo de minerales en cadaetapa del proceso y de esta manera saber cuanto y que tipo de recurso se consume en cada op-eración. Esta diferenciación es importante porque los combustibles fósiles podrían ser sustitu-idos por combustibles de origen renovable, no así los minerales, que difícilmente pueden serreemplazados por otro tipo de recursos. Un inconveniente de esta metodología es el uso de laexergía química para evaluar los recursos minerales, lo que conduce a obtener valores de ex-ergía asociada a la parte mineral mucho menores que los obtenidos a partir de combustiblefósiles. Por lo anterior el TEC se complementó con la introducción de los ERC, los cuales pro-porcionan un enfoque de “la tumba a la cuna”. Los resultados muestran que cuando los ERCson incluidos en los TEC, los impactos asociados al consumo de minerales son significativa-mente mayores. De esta manera, se obtienen mejores indicadores para evaluar el consumo derecursos minerales. De tal forma que el consumo de minerales se vuelve una cuestión aún máscrítica que el consumo de combustibles en la industria minera.
Finalmente, se puede concluir que los análisis exergéticos realizados a través de metodologíascomo el TEC y los ERC permiten: (1) analizar entradas y salidas de materiales y recursos en-ergéticos, (2) analizar la eficiencia de la transformación de recursos, (3) realizar una asignaciónde costos objetiva entre productos y subproductos, (4) evaluar las consecuencias ambientalese (5) identificar áreas de oportunidad para alcanzar un desarrollo sostenible en el sector de laminería.
Contribuciones
La contribución general de esta tesis doctoral consistió en mejorar y adaptar las metodologíasde análisis y optimización exergética al caso concreto de la industria minera y metalúrgica.Particularmente, la Termoeconomía y el Costo Termoecológico fueron complementados conel enfoque exergoecológico, lo que permitirá realizar un “Análisis de Ciclo de Vida absoluto” delos recursos minerales. A continuación se presentan las principales contribuciones de esta tesisdoctoral.
1. La principal contribución del Capítulo 3 es el uso de las curvas de aprendizaje desde unenfoque exergético. Este análisis permite saber si la investigación e innovación tecnológ-ica de los procesos de producción dentro del sector minero han podido o pueden evitarel aumento en la demanda de energía.
2. La primera contribución realizada en el Capítulo 5 consiste en una determinación másexacta de los costos exergéticos de reposición de los minerales, al integrar la variable deltiempo a través de los costos exergéticos unitarios variables que a su vez dependen de los
191

requerimientos energéticos. Adicionalmente, se obtuvo una expresión general del con-sumo de energía vs. la ley mineral, para aquellos minerales de los que no se tenían datosdisponibles. Estos valores deberían proporcionar una herramienta de valoración para lostomadores de decisiones en la industria minera.
3. La segunda contribución del Capítulo 5 es el desarrollo de un nuevo método de asig-nación de costos basado en exergía para resolver el problema de asignación de costos en-tre los subproductos mineros a través de los costos exergéticos de reposición, los cualestienen en cuenta el factor físico de agotamiento mineral. Contar con este tipo de indi-cadores objetivos de asignación de costos, permitirá estimar los consumos energéticosasociados a cada uno de los minerales producidos, de una forma objetiva.
4. La principal contribución del Capítulo 6 es la demostración de que el uso de la exergíaquímica para evaluar los recursos minerales conduce a resultados poco fiables, puestoque es necesario introducir la exergía de concentración. El valor de los minerales estáasociado a su grado de escasez. Y ésta es la razón principal por la que la exergía de con-centración, calculada a través de los costos exergéticos de reposición, es mucho más so-bresaliente cuando los recursos minerales son analizados.
5. Otra contribución del Capítulo 6 es la integración de los costos exergéticos de reposiciónen el análisis exergético realizado con la metodología del Costo Termoecológico, lo quepermite evaluar los recursos minerales de una forma más completa, al incluir un enfoquede “la tumba – a la cuna – al mercado ”.
Publicaciones
El desarrollo de esta tesis doctoral ha permitido la elaboración de varias publicaciones científi-cas que han sido presentadas en diferentes congresos internacionales y publicados en revistasinternacionales.
Al. Valero, A. Valero, A. Domínguez. Influence of technical development and declining oregrades on the availability of gold resources. In SDEWES 2011: Proceedings of the 6th DubrovnikConference on Sustainable Development of Energy, Water and Environment Systems, Septem-ber 25 - 29, 2011, Dubrovnik, Croatia.
Al. Valero, A. Valero, A. Domínguez. Trends of exergy costs and ore grade in global mining.In SDIMI 2011: Proceedings of Sustainable Development in the Minerals Industry, June 14-17,2011, Aachen, Germany.
A. Domínguez, Al. Valero. Global gold mining: is technological learning overcoming thedeclining in ore grades?. In ECOS, 2012: Proceedings of 25st International Conference on Effi-ciency, Cost, Optimization, Simulation and Environmental Impact of Energy Systems, June 26 -29, 2012. Perugia, Italy.
A. Domínguez, Al. Valero, A. Valero. Exergy accounting applied to metallurgical systems:The case of nickel processing. In CPOTE, 2012: Proceedings of 3rd. International ConferenceContemporary Problems of Thermal Engineering, September 18-20, 2012, Gliwice, Poland.
A. Domínguez, Al. Valero. Global Gold Mining: Is Technological Learning Overcoming theDeclining in Ore grades? Journal of Environmental Accounting and Management, 2013, 1, 85-101.
192

Al. Valero, A. Valero, A. Domínguez. Exergy Replacement Cost of Mineral Resources. Journalof Environmental Accounting and Management, 2013, 2, 147-158.
A. Domínguez, Al. Valero, A. Valero. Exergy accounting applied to metallurgical systems:The case of nickel processing. Energy 2013 (62) 37 - 45.http://dx.doi.org/10.1016/j.energy.2013.03.089
A. Domínguez, L. Czarnowska, Al. Valero, S. Wojciech, A. Valero. Thermo-Ecological andExergy Replacement Costs of Nickel Processing. (En revisión en la revista Energy, enviado el 2de Abril del 2014.)
Al. Valero, A. Valero, A. Domínguez. Exergy Cost Allocation of by-products in the mining andmetallurgical industry. (Aceptado en ECOS 2014, 25st International Conference on Efficiency,Cost, Optimization, Simulation and Environmental Impact of Energy Systems. Finland, June15-19, 2014.)
Perspectivas
Durante el desarrollo de esta tesis, se han identificado varias areás de oportunidad para in-vestigaciones futuras. El principal problema encontrado para obtener resultados de esta tesisha sido la falta de fuentes de información fiables. Una vez que se establezca un sistema deinformación transparente en el sector minero y metalúrgico, tanto las metodologías como losresultados obtenidos podrán ser refinados y extendidos a más casos de estudio. Algunas de lasinterrogantes identificadas en esta tesis son enlistadas a continuación.
1. Debido a la falta de datos, la metodología de curvas de aprendizaje fue aplicada única-mente al oro. Aunque el oro es un mineral muy importante, los resultdos obtenidos apartir de su análisis no pueden ser representativos para todos los minerales producidosa escala global. Por lo tanto, el análsis debería ser extendido a otros minerales y a otrospaíses alrededor del mundo, como por ejemplo China. Puesto que actualmente, Chinaesta poscionado estratégicamente en la industria minera. Con la ayuda de un modelo deredes neuronales, la cuestión acerca de si la tecnología puede contrarrestar el decrementode la ley mineral podría ser mejor abordada.
2. Adicionalmente, la metodología de curvas de aprendizaje utilizada en esta tesis, puedeser mejorada al incorporar un factor relacionado con la investigación y desarrollo tec-nológico en la industria minera. Esta fórmula extendida es conocida como curva deaprendizaje de dos factores, aunque también existen las curvas de aprendizaje de múlti-ples factores que podría incluir variables independientes adicionales que permitan analizarel sector minero.
3. En esta tesis, los ERC de 23 minerales fueron obtenidos, de los cuales sólo 6 fueron obtenidosa partir de información empírica que relaciona el consumo de energía con la ley min-eral. Los restantes fueron obtenidos asumiendo un comportamiento general basado enobservaciones de datos disponibles. Por lo tanto, resulta importante mejorar los valoresobtenidos conforme vaya apareciendo más información. Sin embargo, también es impor-tante extender el cálculo de los ERC a todos los minerales, prestando especial atencióna aquellos minerales considerados como críticos o claves, ya que por sus propiedadesfiísico-químicas están siendo ampliamente utilizados en aplicaciones relacionadas con
193

las nuevas tecnologías y el desarrollo del sector de las energías renovables. Por ejemplo:In, Ge, Ga, P y las REE del grupo de los lantánidos.
Es importante destacar que tanto los cálculos de los costos exergéticos de reposición comolos análisis exergéticos de sistemas y procesos, están supedidatos a las bases de datos utilizadasy que la objetividad de los mismos depende de dichos datos. Por lo tanto, es imperativo el usode fuentes de información fiables en cuanto a consumo de energía y materias primas, diferen-ciados por el tipo de depósito mineral y las tecnologías utilizadas.
194

List of Tables
2.1 Energy consumption in the aluminium production. Values expressed in GJ/ton ofAl. . . . . . . . . . . . . . . . . . . . . . . . . . . . . . . . . . . . . . . . . . . . . . . . . 24
2.2 Energy consumption in the cadmium production. Values expressed in GJ/ton ofCd. . . . . . . . . . . . . . . . . . . . . . . . . . . . . . . . . . . . . . . . . . . . . . . . . 25
2.3 Energy consumption in the chromium production. Values expressed in GJ/ton ofCr. . . . . . . . . . . . . . . . . . . . . . . . . . . . . . . . . . . . . . . . . . . . . . . . . 26
2.4 Energy consumption in the cobalt production. Values expressed in GJ/ton of Co. . 27
2.5 Energy consumption in the copper production. Values expressed in GJ/ton of Cu. 30
2.6 Energy consumption in the iron production. Values expressed in GJ/ton of Fe. . . . 34
2.7 Energy consumption in the lead production. Values expressed in GJ/ton of Pb. . . 35
2.8 Energy consumption in the manganese production. Values expressed in GJ/tonof Mn. . . . . . . . . . . . . . . . . . . . . . . . . . . . . . . . . . . . . . . . . . . . . . . 36
2.9 Energy consumption in the molybdenum production. Values expressed in GJ/tonof Mo. . . . . . . . . . . . . . . . . . . . . . . . . . . . . . . . . . . . . . . . . . . . . . . 37
2.10 Energy consumption in the nickel production. Values expressed in GJ/ton of Ni. . 38
2.11 Processes for nickel production from sulphide ores. . . . . . . . . . . . . . . . . . . . 40
2.12 Rare Earth Elements Classification. Koltun & Tharumarajah (2008) . . . . . . . . . 42
2.13 Energy consumption for production of 1 kg of rare earth metals. Data modifiedfrom Koltun & Tharumarajah (2008). . . . . . . . . . . . . . . . . . . . . . . . . . . . 44
2.14 Energy consumption in the zinc production. Values expressed in GJ/ton of Zn. . . 47
2.15 Energy requirements for the production of mineral commodities. [GJ/t] . . . . . . 48
3.1 Progress ratio for global gold mining. . . . . . . . . . . . . . . . . . . . . . . . . . . . 55
4.1 Fuel-Product Table . . . . . . . . . . . . . . . . . . . . . . . . . . . . . . . . . . . . . . 76
5.1 Exergy Replacement Costs. Values of xc , xm and xr are referred to the assumedmineral that represents the ores from which the metal is extracted. . . . . . . . . . 97
5.2 Exergy Replacement Costs for different commodities. Energy and exergy valuesare expressed in GJ/ton of mineral. . . . . . . . . . . . . . . . . . . . . . . . . . . . . . 99
5.3 Cost allocation of Cu-Au-Ag deposits as a function of tonnage, price and ERC. . . . 104
195

5.4 Cost allocation of Cu-Au-Pb-Ag-Zn deposits as a function of tonnage, price andERC. . . . . . . . . . . . . . . . . . . . . . . . . . . . . . . . . . . . . . . . . . . . . . . . 106
5.5 Cost allocation of Au – Ag deposits as a function of tonnage, price and ERC. . . . . 108
5.6 Cost allocation of Co-Au-Mo-Ag deposits as a function of tonnage, price and ERC. 109
5.7 Cost allocation of Cu-Au-Ag-Zn deposits as a function of tonnage, price and ERC. . 110
5.8 Cost allocation of Co-Cu-Au-Ni deposits as a function of tonnage, price and ERC. . 111
5.9 Cost allocation of Pb-Ag-Zn deposits as a function of tonnage, price and ERC. . . . 112
5.10 Allocation factors of copper and its by-products Mo, Ag and Te . . . . . . . . . . . . 115
5.11 Allocation factors of nickel and its by-products Cu and Co. . . . . . . . . . . . . . . 117
5.12 Allocation factors of lead and its by-product Zn, Ag and Cd . . . . . . . . . . . . . . 119
5.13 Exergy Cost Allocation of REE. . . . . . . . . . . . . . . . . . . . . . . . . . . . . . . . 121
6.1 Chemical exergies of substances involved in nickel production. The values areobtained from Ayres et al. (2006), Szargut et al. (1988b), Valero, Valero & Gomez(2011). . . . . . . . . . . . . . . . . . . . . . . . . . . . . . . . . . . . . . . . . . . . . . 125
6.2 Main mass and energy flows for the production of 1 kg of nickel from laterites. . . . 126
6.3 Main mass and energy flows for the production of 1 kg of nickel from sulphides -option A. . . . . . . . . . . . . . . . . . . . . . . . . . . . . . . . . . . . . . . . . . . . . 129
6.4 Main mass and energy flows for several processes in the production of 1 kg ofnickel from sulphides . . . . . . . . . . . . . . . . . . . . . . . . . . . . . . . . . . . . . 129
6.5 Exergy and exergy efficiency in nickel production. Values expressed in GJ/ton of Ni.131
6.6 Consumed products during Ni production from sulphide ore - option A. . . . . . . 135
6.7 Consumed products during Ni production from laterite ore. . . . . . . . . . . . . . 136
6.8 Thermo-Ecological and Exergy Replacement Costs for Ni production from sul-phide ore - option A. . . . . . . . . . . . . . . . . . . . . . . . . . . . . . . . . . . . . . 139
6.9 Thermo-Ecological and Exergy Replacement Costs of mineral inputs in Nickelproduction with Copper as by-product - option B. . . . . . . . . . . . . . . . . . . . . 140
6.10 TEC and ERC of Ni production processes. Units: GJ/t_Ni . . . . . . . . . . . . . . . 140
6.11 Mineral part of TEC and ERC of Ni production processes. . . . . . . . . . . . . . . . 141
6.12 Effect of energy consumption in TEC and ERC of Ni production [%]. . . . . . . . . . 142
6.13 Thermo-Ecological and Exergy Replacement Costs for different mineral produc-tion processes. . . . . . . . . . . . . . . . . . . . . . . . . . . . . . . . . . . . . . . . . . 150
6.14 Mineral part of Thermo-ecological and Exergy Replacement Costs for differentmineral production processes. . . . . . . . . . . . . . . . . . . . . . . . . . . . . . . . 152
A.1 Energy consumption in the antimony production. Values expressed in GJ/ton of Sb.163
A.2 Energy consumption in the tin production. Values expressed in GJ/ton of Sn. . . . 169
A.3 Energy consumption in the titanium production. Values expressed in GJ/ton of Ti. 169
A.4 Uses of commodities . . . . . . . . . . . . . . . . . . . . . . . . . . . . . . . . . . . . . 170
196

C.1 Cost allocation of Cu-Mn-P deposits as a function of tonnage, price and ERC. . . . 179
C.2 Cost allocation of Mn-P deposits as a function of tonnage, price and ERC. . . . . . 179
C.3 Cost allocation of Fe-P deposits as a function of tonnage, price and ERC. . . . . . . 179
C.4 Cost allocation of Sb-Au-Ag deposits as a function of tonnage, price and ERC. . . . 180
C.5 Cost allocation of Co-Cu deposits as a function of tonnage, price and ERC. . . . . . 180
C.6 Cost allocation of Cu-Pb-Ag-Zn deposits as a function of tonnage, price and ERC. . 180
C.7 Cost allocation of Co-Ni deposits as a function of tonnage, price and ERC. . . . . . 180
C.8 Cost Allocation of Ni and Cu based on Exergy Replacement Costs. . . . . . . . . . . 184
C.9 Cost Allocation of Ni-Cu-Co based on Exergy Replacement Costs. . . . . . . . . . . 185
C.10 Cost Allocation of Cu-Mo-Ag-Te based on Exergy Replacement Costs. . . . . . . . . 186
197

198

List of Figures
1.1 Everyday’s uses of minerals and metals. NGU (2008). . . . . . . . . . . . . . . . . . . 2
1.2 Mineral Resource Classification (USGS, 1980). . . . . . . . . . . . . . . . . . . . . . . 3
1.3 World production of metals. Data from U. S. Geological Survey (USGS). . . . . . . . 4
1.4 Unit price of metals [$/t]. Data from U. S. Geological Survey (USGS). . . . . . . . . . 5
1.5 Critical raw materials for the European Union. The ad-hoc Working Group (2010). 7
1.6 Production concentration of critical raw materials for the European Union. Thead-hoc Working Group (2010). . . . . . . . . . . . . . . . . . . . . . . . . . . . . . . . 8
1.7 Life cycle assessment from grave to grave. Valero & Valero (2012). . . . . . . . . . . 17
2.1 Simplified overview of the processes for the aluminium production. Classen et al.(2007). . . . . . . . . . . . . . . . . . . . . . . . . . . . . . . . . . . . . . . . . . . . . . 23
2.2 Scheme of the main processes in the chromium production. Classen et al. (2007). . 26
2.3 Generic flow sheet showing possible process steps for cobalt production. IPPC(2009a). . . . . . . . . . . . . . . . . . . . . . . . . . . . . . . . . . . . . . . . . . . . . . 27
2.4 Primary copper production route. IPPC (2009a). . . . . . . . . . . . . . . . . . . . . 28
2.5 General flow-sheet for precious metal recovery. IPPC (2009a). . . . . . . . . . . . . 31
2.6 Overview of cast iron and steel production Classen et al. (2007). . . . . . . . . . . . 33
2.7 Diagram of lead refining processes IPPC (2009a). . . . . . . . . . . . . . . . . . . . . 35
2.8 Manganese products and their process routes Classen et al. (2007). . . . . . . . . . 36
2.9 Generic flow sheet for the production of nickel from laterite ores IPPC (2009a). . . 39
2.10 Generic flow sheet for the production of nickel from sulphide concentrates IPPC(2009a). . . . . . . . . . . . . . . . . . . . . . . . . . . . . . . . . . . . . . . . . . . . . . 40
2.11 The “cradle to gate” LCA boundary for the production of separated mix of REOKoltun & Tharumarajah (2008). . . . . . . . . . . . . . . . . . . . . . . . . . . . . . . . 43
2.12 Production process of tellurium IPPC (2009a). . . . . . . . . . . . . . . . . . . . . . . 45
2.13 General scheme of zinc production Classen et al. (2007). . . . . . . . . . . . . . . . . 46
3.1 Energy consumption as a function of ore grade in global gold mining. Data fromMudd (2007b). . . . . . . . . . . . . . . . . . . . . . . . . . . . . . . . . . . . . . . . . . 51
3.2 Distribution of average progress ratios for gold mining industry. . . . . . . . . . . . 55
3.3 Progress ratios for gold mines in Australia. . . . . . . . . . . . . . . . . . . . . . . . . 58
199

3.4 Learning curve for gold mining. . . . . . . . . . . . . . . . . . . . . . . . . . . . . . . 59
3.5 Progress ratios classified by ore grade for gold mining industry in Australia. . . . . 59
3.6 Progress ratios of an open pit mine in Australia. . . . . . . . . . . . . . . . . . . . . . 60
3.7 Progress ratios for gold mines in Argentina. . . . . . . . . . . . . . . . . . . . . . . . . 60
3.8 Progress ratios for gold mines in Brazil. . . . . . . . . . . . . . . . . . . . . . . . . . . 61
3.9 Progress ratios for gold mines in Canada. . . . . . . . . . . . . . . . . . . . . . . . . . 62
3.10 Progress ratios for gold mines in Ghana. . . . . . . . . . . . . . . . . . . . . . . . . . 63
3.11 Progress ratios for gold mines in Mali. . . . . . . . . . . . . . . . . . . . . . . . . . . . 64
3.12 Progress ratios for gold mines in Peru. . . . . . . . . . . . . . . . . . . . . . . . . . . . 65
3.13 Progress ratios for gold mines in Papua New Guinea. . . . . . . . . . . . . . . . . . . 66
3.14 Progress ratios for gold mines in SA. . . . . . . . . . . . . . . . . . . . . . . . . . . . . 67
3.15 Progress ratios for gold mines in Tanzania. . . . . . . . . . . . . . . . . . . . . . . . . 68
3.16 Progress ratios for gold mines in United States of America. . . . . . . . . . . . . . . . 69
3.17 Progress ratio for different recovery process and countries in gold mining industry. 71
4.1 TEC balance equation. Piekarczyk et al. (2012). . . . . . . . . . . . . . . . . . . . . . 80
4.2 Conceptual diagram of cradle-to-grave and grave-to-cradle methodologies. Valero& Valero D. (2014). . . . . . . . . . . . . . . . . . . . . . . . . . . . . . . . . . . . . . . 83
4.3 Conceptual diagram of RE and Crepuscular Earth for the evaluation of mineralcapital. Valero, Valero & Gomez (2011). . . . . . . . . . . . . . . . . . . . . . . . . . . 84
4.4 Calculation procedure for obtaining a mineral’s exergy replacement costs. Valero& Valero D. (2014). . . . . . . . . . . . . . . . . . . . . . . . . . . . . . . . . . . . . . . 88
5.1 Energy requirements for cobalt production form sulphide ores as a function of theore grade. Adapted from Mudd (2010). . . . . . . . . . . . . . . . . . . . . . . . . . . 93
5.2 Energy requirements for copper production as a function of the ore grade. Adaptedfrom Mudd (2010). . . . . . . . . . . . . . . . . . . . . . . . . . . . . . . . . . . . . . . 94
5.3 Energy requirements for gold production as a function of the ore grade. Adaptedfrom Mudd (2007c). . . . . . . . . . . . . . . . . . . . . . . . . . . . . . . . . . . . . . . 95
5.4 Energy requirements for nickel production as a function of the ore grade. Adaptedfrom Mudd (2010). . . . . . . . . . . . . . . . . . . . . . . . . . . . . . . . . . . . . . . 96
5.5 Trends of unit exergy costs and concentration energy in uranium mining (datareferred to uranium oxide U3O8). Adapted from Mudd & Diesendorf (2008). . . . . 97
5.6 The metal wheel. Verhoef et al. (2004) . . . . . . . . . . . . . . . . . . . . . . . . . . . 102
5.7 Cost allocation of Cu-Au-Pb-Ag-Zn deposits as a function of price and ERC. . . . . 107
5.8 Cost allocation of Au-Ag deposits as a function of price and ERC. . . . . . . . . . . . 108
5.9 Cost allocation of Co-Au-Mo-Ag deposits as a function of price and ERC. . . . . . . 110
5.10 Cost allocation of Cu-Au-Ag-Zn deposits as a function of price and ERC. . . . . . . 111
5.11 Cost allocation of Co-Cu-Au-Ni deposits as a function of price and ERC. . . . . . . 112
200

5.12 Cost allocation of Pb-Ag-Zn deposits as a function of price and ERC. . . . . . . . . . 113
5.13 Exergy Cost allocation of Cu and its by-products Mo, Ag and Te. . . . . . . . . . . . 114
5.14 Cost allocation of Cu by-products, based on price and exergy. . . . . . . . . . . . . . 115
5.15 Exergy Cost allocation of Ni and its by-products Cu and Co. . . . . . . . . . . . . . . 116
5.16 Cost allocation of Ni by-products, based on price and exergy . . . . . . . . . . . . . 117
5.17 Exergy Cost allocation of Pb and its by-products Zn, Ag and Cd. . . . . . . . . . . . 118
5.18 Cost allocation of Pb by-products, based on price and exergy. . . . . . . . . . . . . . 119
5.19 Exergy Cost allocation of REE. . . . . . . . . . . . . . . . . . . . . . . . . . . . . . . . . 120
6.1 Exergy flows (MJ) in the production of 1 kg of nickel from laterites. . . . . . . . . . . 127
6.2 Exergy flows (MJ) in the production of 1 kg of nickel from sulphides - option A. . . 128
6.3 Exergy flows (MJ) for several processes in the production of 1 kg of nickel fromsulphides. . . . . . . . . . . . . . . . . . . . . . . . . . . . . . . . . . . . . . . . . . . . 130
6.4 Nickel production system for sulphide ores. . . . . . . . . . . . . . . . . . . . . . . . 133
6.5 Nickel production system for laterite ores. . . . . . . . . . . . . . . . . . . . . . . . . 134
6.6 Effect of ore grade in TEC including ERC. . . . . . . . . . . . . . . . . . . . . . . . . . 142
6.7 Aluminium production system. . . . . . . . . . . . . . . . . . . . . . . . . . . . . . . . 143
6.8 Chromium production system. . . . . . . . . . . . . . . . . . . . . . . . . . . . . . . . 145
6.9 Copper production system. . . . . . . . . . . . . . . . . . . . . . . . . . . . . . . . . . 146
6.10 Gold production system. . . . . . . . . . . . . . . . . . . . . . . . . . . . . . . . . . . . 147
6.11 Iron production system. . . . . . . . . . . . . . . . . . . . . . . . . . . . . . . . . . . . 148
6.12 Manganese production system. . . . . . . . . . . . . . . . . . . . . . . . . . . . . . . . 149
C.1 Cost allocation of Cu-Au-Ag deposits as a function of price and ERC. . . . . . . . . 181
C.2 Cost allocation of Cu-Mn-P deposits as a function of price and ERC. . . . . . . . . . 181
C.3 Cost allocation of Co-Cu deposits as a function of price and ERC. . . . . . . . . . . 182
C.4 Cost allocation of Cu-Pb-Ag-Zn deposits as a function of price and ERC. . . . . . . 182
C.5 Cost allocation of Co-Ni deposits as a function of price and ERC. . . . . . . . . . . . 183
201

202

Nomenclature
A Matrix of direct requirement
ai j Coefficient of consumption of raw material and semi-finished product
b Constant reflecting the rate energy decrease from year to year (learning index)
bc Concentration exergy
bch Chemical exergy
bcom Comminution exergy
b∗com Comminution exergy cost of a mineral in a mine
b f Fuel exergy
bm Mineral exergy
B Exergy
B∗ Exergy cost
BC H Chemical exergy
Bi Exergy of the ith product stream
B∗i Exergy cost of the ith product stream
B K Kinetic exergy
B P Potential exergy
B PH Physical exergy
c Elasticity of learning by researching
∆Gmi ner al Standard normal free energy of formation of the mineral (Gibbs free energy)
dM Geometrical mean size of the natural fragments found in the mine
dθ Size of the bare rock of the Crepuscular Earth model
E Energy
ε Efficiency
F Fuel
fi j Coefficient of production of by-product
I Irreversibilities
k Unit exergy cost
k∗i Unit average exergy cost of the ith product stream
K S Knowledge stock
⟨K P⟩ Matrix of marginal unit exergy consumptions (nxn)
L Leontief inverse matrix
M Tonnage
203

P Product
R Wastes
R̄ Gas constant (8.3145J/molK )
ri Index of sustainability
ri j Junction coefficients
ρ Specific Thermo-Ecological Cost of a main product
S Energy slope expressed as a decimal value (learning rate)
T0 Reference Temperature (298.15K )
vk Number of moles of element k in the mineral
Wi Bond work index [kWh/t][µm]0.5
x Sequential number of the unit for which the energy is to be computed
xc Ore grade (average concentration in the Earth’s crust)
xi Concentration of the substance i
xi Molar concentration of substance i
xm Average mineral concentration in a mine
xm Average grade of the mineral deposit
xr Refining grade
Y0 Theoretical energy of the first production unit
yi j Distribution coefficients
Yx Energy required to produce the xth unit
ζk TEC of compensation of the deleterious impact of the rejected waste product
z f Fraction of the Thermo-Ecological Cost of a main product due to fuel consumption
zm Fraction of the Thermo-Ecological Cost of a main product due to mineral consumption
Abbreviations
CIP Circuit in Pulp
CIL Circuit in Leach
ERC Exergy Replacement Cost
GDP Gross Domestic Product
HL Heap Leach
ISF Imperial Smelting Furnace
LCA Life Cycle Assessment
LHV Lower heating value [kJ/kg]
MIX Mixed (open pit and underground)
OP Open Pit
PR Progress ratio
R.E. Reference Environment
REE Rare Earth Elements
REM Rare Earth Metals
204
REO Rare Earth Oxides
S/X Solvent extraction
TEC Thermo-Ecological Cost
TFLC Two factor learning curve
UG Underground
UG_t Underground tailings
Acronyms
CIM Canadian Institute of Mining, Metallurgy and Petroleum
EU Europe Union
OECD Organisation for Economic Co-operation and Development
SAMREC South African Code for Reporting of Exploration Results, Mineral Resources
and Mineral Reserves
SEM Society for Mining, Metallurgy, and Exploration
205


References
Achzet, B. & Helbig, C. (2013), ‘How to evaluate raw material supply risks – an overview’, Re-source Policy 38, 435 – 447.
ad-hoc Working Group (2010), Critical raw materials for the eu. report of the ad-hoc workinggroup on defining critical raw materials, Technical report, European Commission.URL: http://ec.europa.eu/enterprise/policies/raw-materials/files/docs/report–b_en.pdf
AditNow (2013).URL: http://www.aditnow.co.uk/
Agudelo, A., Valero, A. & Torres, C. (2011), Allocation of wastes in thermoeconomic analyses,in ‘24st International Conference on Efficiency, Cost, Optimization, Simulation and Environ-mental Impact of Energy Systems (ECOS 2011)’.
Agudelo, A., Valero, A. & Uson, S. (2011), The fossil trace of co2 emissions in energy systems.,in ‘24st International Conference on Efficiency, Cost, Optimization, Simulation and Environ-mental Impact of Energy Systems (ECOS 2011)’.
Ahrendts, J. (1980), ‘Reference states’, Energy 5, 667–677.
Alvarado, S., Maldonado, P. & Jaques, I. (1999), ‘Energy and environmental implications of cop-per production’, Energy 24, 307–316.
AngloGold Ashanti (2013).URL: http://www.anglogold.co.za/Home
Ausenco (2013).URL: http://www.ausenco.com/page/Our_Projects/Pierina_Gold_Mine/
Ayres, R. (2008), ‘Sustainability economics: Where do we stand?’, Ecological Economics 67, 281– 310.
Ayres, R. & Ayres, L. (1996), Industrial Ecology. Towards closing the material cycle, Edward ElgarPublishing, Cheltenham U.K. and Northampton.
Ayres, R. & Ayres, L. (2002), A Handbook of Industrial Ecology, Edward Elgar.
Ayres, R., Ayres, L. & Masini, A. (2006), Sustainable Metals Management, Springer, chapter Anapplication of exergy accounting to five basic metal industries, pp. 141–194.
Ayres, R., Ayres, L. & Rade, I. (2002), The life cycle of copper, its co-products and by-products,Technical report, International Institute for Environment and Development (IIED).URL: http://www.iied.org/pubs/pdfs/G00740.pdf
207

Barrick Company (2013a).URL: http://www.barrick.com/GlobalOperations
Barrick Company (2013b).URL: http://www.barrick.com/Theme/Barrick/files/docs_presentations/pr11_12_2003_weauau.pdf
Botero, E. A. (2000), Valoración exergética de recursos naturales, minerales, agua y com-bustibles, PhD thesis, Universidad de Zaragoza.
Boustead, I. & Hancock, G. (1979), Handbook of Industrial Energy Analysis, Ellis Horwood Lim-ited.
Bradley, R. L. (2007), ‘Resourceship: An austrian theory of mineral resources’, The Review ofAustrian Economics 20, 63–90.
Bravard, J., Flora, H. & Portal, C. (1972), Energy expeditures associated with the production andrecycle of metals, Technical report, Oak Ridge National Laboratory.
Brentrup, F., Kiisters, J., Lammel, J. & Kuhlmann, H. (2002), ‘Impact assessment of abiotic re-source consumption conceptual considerations’, Int J LCA 7 (5), 301–307.
Brobech, J. (1996), ‘Sustainable metal resource management-the need for industrial develop-ment: efficiency improvement demands on metal resource management to enable a (sus-tainable) supply’, Journal of Cleaner Production 4, 97–104.
Brown, T., Idoine, N., Mills, A., Shaw, R., Hobbs, S. & Bide, T. (2012), European mineral statistics2006-10. a product of the world mineral statistics database., Technical report, Britsh Geolog-ical Survey.
Brunetti, C. & Gilbert, C. (1995), ‘Metals price volatility, 1972-95’, Resource Policy 21, 237 – 254.
Brunner, P. & Rechberger, H. (2004), Practical Handbook of Material Flow Analysis, Lewis Pub-lishers, Boca Raton.
Butterman, W. & Carlin, J. (2004), Antimony. mineral commodity profiles, Technical report, U.S.Geological Survey.URL: http://pubs.usgs.gov/of/2003/of03-019/of03-019.pdf
CFE (2013), ‘Comisión federal de electricidad’.URL: www.cfe.gob.mx
Chapman, P. & Roberts, F. (1983), Metal Resources and Energy, Butterworths.
Chen, M. (2010), ‘Understanding world metals prices – returns, volatility and diversification’,Resource Policy 35, 127 – 140.
Classen, M., Althaus, H.-J., Blaser, S., Scharnhorts, W., Tuchschmid, M., Jungbluthm, N. & Faist,E. (2007), Life cycle invventories of metals. final report ecoinvent data v2.0., Technical report,Swiss Centre for Life Cycle Inventories.
Cleveland, C. & Ruth, M. (1997), ‘When, where, and by how much do biophysical limits con-strain the economic process? a survey of nicholas georgescu-roegen’s contribution to eco-logical economics’, Ecological Economics 22, 203–223.
208
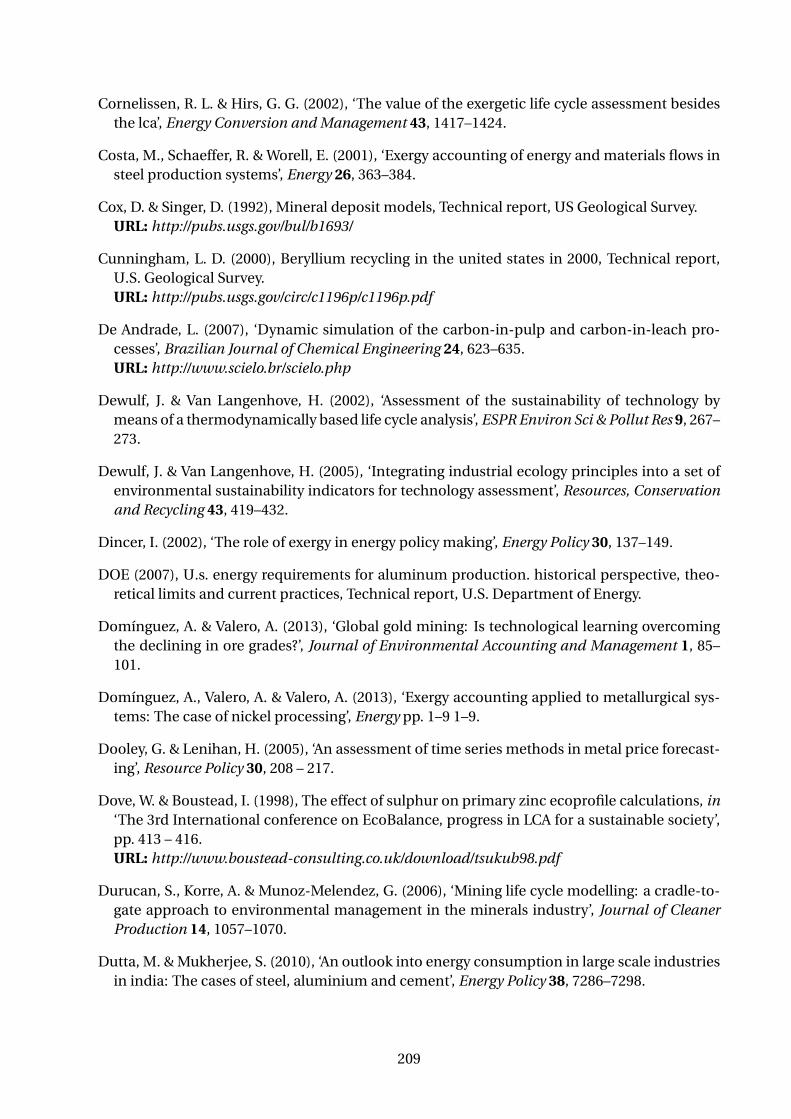
Cornelissen, R. L. & Hirs, G. G. (2002), ‘The value of the exergetic life cycle assessment besidesthe lca’, Energy Conversion and Management 43, 1417–1424.
Costa, M., Schaeffer, R. & Worell, E. (2001), ‘Exergy accounting of energy and materials flows insteel production systems’, Energy 26, 363–384.
Cox, D. & Singer, D. (1992), Mineral deposit models, Technical report, US Geological Survey.URL: http://pubs.usgs.gov/bul/b1693/
Cunningham, L. D. (2000), Beryllium recycling in the united states in 2000, Technical report,U.S. Geological Survey.URL: http://pubs.usgs.gov/circ/c1196p/c1196p.pdf
De Andrade, L. (2007), ‘Dynamic simulation of the carbon-in-pulp and carbon-in-leach pro-cesses’, Brazilian Journal of Chemical Engineering 24, 623–635.URL: http://www.scielo.br/scielo.php
Dewulf, J. & Van Langenhove, H. (2002), ‘Assessment of the sustainability of technology bymeans of a thermodynamically based life cycle analysis’, ESPR Environ Sci & Pollut Res 9, 267–273.
Dewulf, J. & Van Langenhove, H. (2005), ‘Integrating industrial ecology principles into a set ofenvironmental sustainability indicators for technology assessment’, Resources, Conservationand Recycling 43, 419–432.
Dincer, I. (2002), ‘The role of exergy in energy policy making’, Energy Policy 30, 137–149.
DOE (2007), U.s. energy requirements for aluminum production. historical perspective, theo-retical limits and current practices, Technical report, U.S. Department of Energy.
Domínguez, A. & Valero, A. (2013), ‘Global gold mining: Is technological learning overcomingthe declining in ore grades?’, Journal of Environmental Accounting and Management 1, 85–101.
Domínguez, A., Valero, A. & Valero, A. (2013), ‘Exergy accounting applied to metallurgical sys-tems: The case of nickel processing’, Energy pp. 1–9 1–9.
Dooley, G. & Lenihan, H. (2005), ‘An assessment of time series methods in metal price forecast-ing’, Resource Policy 30, 208 – 217.
Dove, W. & Boustead, I. (1998), The effect of sulphur on primary zinc ecoprofile calculations, in‘The 3rd International conference on EcoBalance, progress in LCA for a sustainable society’,pp. 413 – 416.URL: http://www.boustead-consulting.co.uk/download/tsukub98.pdf
Durucan, S., Korre, A. & Munoz-Melendez, G. (2006), ‘Mining life cycle modelling: a cradle-to-gate approach to environmental management in the minerals industry’, Journal of CleanerProduction 14, 1057–1070.
Dutta, M. & Mukherjee, S. (2010), ‘An outlook into energy consumption in large scale industriesin india: The cases of steel, aluminium and cement’, Energy Policy 38, 7286–7298.
209
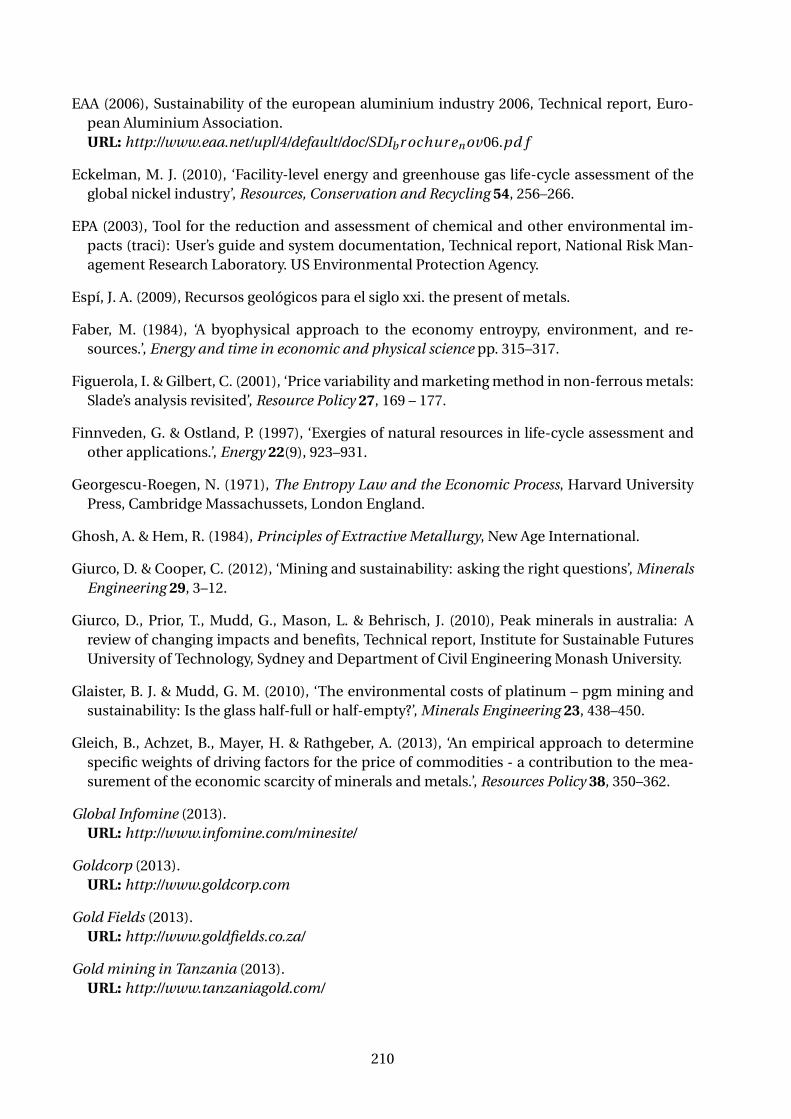
EAA (2006), Sustainability of the european aluminium industry 2006, Technical report, Euro-pean Aluminium Association.URL: http://www.eaa.net/upl/4/default/doc/SDIbr ochur enov06.pd f
Eckelman, M. J. (2010), ‘Facility-level energy and greenhouse gas life-cycle assessment of theglobal nickel industry’, Resources, Conservation and Recycling 54, 256–266.
EPA (2003), Tool for the reduction and assessment of chemical and other environmental im-pacts (traci): User’s guide and system documentation, Technical report, National Risk Man-agement Research Laboratory. US Environmental Protection Agency.
Espí, J. A. (2009), Recursos geológicos para el siglo xxi. the present of metals.
Faber, M. (1984), ‘A byophysical approach to the economy entroypy, environment, and re-sources.’, Energy and time in economic and physical science pp. 315–317.
Figuerola, I. & Gilbert, C. (2001), ‘Price variability and marketing method in non-ferrous metals:Slade’s analysis revisited’, Resource Policy 27, 169 – 177.
Finnveden, G. & Ostland, P. (1997), ‘Exergies of natural resources in life-cycle assessment andother applications.’, Energy 22(9), 923–931.
Georgescu-Roegen, N. (1971), The Entropy Law and the Economic Process, Harvard UniversityPress, Cambridge Massachussets, London England.
Ghosh, A. & Hem, R. (1984), Principles of Extractive Metallurgy, New Age International.
Giurco, D. & Cooper, C. (2012), ‘Mining and sustainability: asking the right questions’, MineralsEngineering 29, 3–12.
Giurco, D., Prior, T., Mudd, G., Mason, L. & Behrisch, J. (2010), Peak minerals in australia: Areview of changing impacts and benefits, Technical report, Institute for Sustainable FuturesUniversity of Technology, Sydney and Department of Civil Engineering Monash University.
Glaister, B. J. & Mudd, G. M. (2010), ‘The environmental costs of platinum – pgm mining andsustainability: Is the glass half-full or half-empty?’, Minerals Engineering 23, 438–450.
Gleich, B., Achzet, B., Mayer, H. & Rathgeber, A. (2013), ‘An empirical approach to determinespecific weights of driving factors for the price of commodities - a contribution to the mea-surement of the economic scarcity of minerals and metals.’, Resources Policy 38, 350–362.
Global Infomine (2013).URL: http://www.infomine.com/minesite/
Goldcorp (2013).URL: http://www.goldcorp.com
Gold Fields (2013).URL: http://www.goldfields.co.za/
Gold mining in Tanzania (2013).URL: http://www.tanzaniagold.com/
210

Gordon, R., Bertram, M. & Graedel, T. (2007), ‘On the sustainability of metal supplies: A re-sponse to tilton and lagos’, Resources Policy 32, 24–28.
Gordon, R. L. & Tilton, J. E. (2008), ‘Mineral economics: Overview of a discipline’, ResourcesPolicy 33, 4–11.
Graedel, T., Dubreuil, A., Gerst, M., Hashimoto, S., Moriguchi, Y., Muller, D., Pena, C., Rauch, J.,Sinkala, T. & Sonnemann, G. (2010), Metal Stocks in Society-Scientific Synthesis, A Report ofthe Working Group on the Global Metal Flows, UNEP. Accessed Jan. 2013.URL: http://www.unep.org/publications/
Gupta, C. K. & Mukherjee, T. K. (1990), ‘Hydrometallurgy in extraction processes’, CRC Press1, 74–75.
Hagedorn, G. & Hellriegel, E. (1992), Umweltrelevante masseneintrgen bei der herstellung ver-schiedener solarzellentypen, Endbericht-teil i: Konventionelle verfahren, Forschungsstelle frEnergiewirtschaft, Munchen.
Hansen, D. R., Mowen, M. M. & Guan, L. (2009), Cost Management: Accounting and Control,South Western, CENGAGE Learning.
Harmony (2013).URL: http://www.harmony.co.za/
Harmsen, J., Roes, A. & Patel, M. (2013), ‘The impact of copper scarcity on the efficiency of 2050global renewable energy scenarios’, Energy pp. 1–12.
Harper, E., Kavlak, G. & Graedel, T. (2012), ‘Tracking the metal of the goblins: Cobalt’s cycle ofuse’, Environmental Science and Technology 46, 1079–1086.
Hein, J., Mizell, K., Koschinsky, A. & Conrad, T. (2013), ‘Deep-ocean mineral deposits as a sourceof critical metals for high- and green-technology applications: Comparison with land-basedresources’, Ore Geology Reviews 51, 1–14.
Humphreys, D. (2013), ‘New mercantilism: A perspective on how politics is shaping world metalsupply’, Resource Policy 38, 341 – 349.
IamGold Corporation (2013).URL: http://www.iamgold.com/English/Operations/default.aspx
IPPC (2009a), Draft reference document on best available techniques for the non-ferrous met-als industries, Technical report, European Comission, Integrated Pollution Prevention andControl.URL: http://ftp.jrc.es/pub/eippcb/doc/nfm_2d_07–2009_public.pdf
IPPC (2009b), Draft reference document on best available techniques on the production of ironand steel, Technical report, European Comission, Integrated Pollution Prevention and Con-trol.URL: http://ftp.jrc.es/pub/eippcb/doc/isp_d2_0709.pdf
ITP (2002), Energy and environmental profile of the u.s. mining industry chapter 9 - limestoneand crushed rock, Technical report, U.S. Department of Energy. Energy, Efficiency and Re-newable Energy.URL: http://www1.eere.energy.gov/industry/mining/pdfs/stone.pdf
211

Jaber, M. Y. & Guiffrida, A. L. (2008), ‘Learning curves for imperfect production processes withreworks and process restoration interruptions’, European Journal of Operational Research189, 93–104.
Jamasb, T. & Kohler, J. (2007), Learning curves for energy technology and policy analysis: Acritical assessment, in ‘Cambridge Working Papers in Economics’.
Jolliet, O., Brent, A., Goedkoop, M., Itsubo, N., Mueller-Wenk, R., Peña, C., Schenk, R., Stewart,M. & Weidema, B. (2003), Final report of the life cycle impact assessment definition study,Technical report, Life Cycle Impact Assessment Programme of the Life Cycle Initiative.
Kahouli-Brahmi, S. (2008), ‘Technological learning in energy – environment – economy mod-elling: A survey’, Energy Policy 36, 138–162.
Kameyama, H., Yoshida, K., Yamauchi, S. & Fueki, K. (1982), ‘Evaluation of reference exergy forthe elements’, Applied Energy 11, 69–83.
Kellogg, H. H. (1977), ‘Sizing up the energy requeriments for producing primary metals’, Engin-nering and Mining Journal 178, 61–65.
Kelly, T. & Matos, G. (2011), Historical statistics for mineral and material commodities in theunited states., Technical report, USGS, U.S. Geological Survey.URL: http://minerals.usgs.gov/ds/2005/140/
Kennecott Utah Copper Corporation (2004).
Kennecott Utah Copper Corporation (2006).
Kihlstedt, P. G. (1975), ‘Energy and mineral exploitation techniques’, Scandinavian Journal ofMetallurgy 4, 145–149.
Kinross (2013).URL: http://www.kinross.com/
Koltun, P. & Tharumarajah, A. (2008), Life cycle assessment study of rare earth metals for mag-nesium alloy applications, Technical report, CSIRO.
Kriechbaumer, T., Angus, A., Parsons, D. & Rivas, M. (2014), ‘An improved wavelet – arima ap-proach for forecasting metal prices.’, Resources Policy 39, 32–41.
Kumah, A. (2006), ‘Sustainability and gold mining in the developing world’, Journal of CleanerProduction 14, 315–323.
Labys, W., Achouch, A. & Terraza, M. (1999), ‘Metal prices and the business cycle.’, ResourcesPolicy 25, 229–238.
Lee, C. (1998), ‘Formulation of resource depletion index’, Resources, Conservation and Recycling24, 285–298.
Li, G. & Rajagopalan, S. (1997), ‘The impact of quality on learning’, Journal of Operations Man-agement 15, 181–191.
Lozano, M. & Valero, A. (1993), ‘Theory of exergetic cost’, Energy 18, 939–960.
212

Mäkinen, T. & Taskinen, P. (2008), ‘State of the art in nickel smelting: direct outokumpu nickeltechnology.’, Mineral Processing and Extractive Metallurgy 117, 86–94.
Margolis, N. (1997), Energy and environmental profile of the u.s. aluminum industry, Technicalreport, U. S. Department of Energy Office of Industrial Technologies.URL: http://www1.eere.energy.gov/manufacturing/resources/aluminum/pdfs/aluminum.pdf
Martin, W. & Skinner, K. (1998), ‘Resource taxation and sustainability: A cge model of the czechrepublic’, Nonrenewable Resources 7.
Martinez, A. (2009), Exergy costs assessment of water bodies: Physical Hydronomics, PhD the-sis, Universidad de Zaragoza.
Massari, S. & Ruberti, M. (2013), ‘Rare earth elements as critical raw materials: Focus on inter-national markets and future strategies’, Resources Policy 38, 36–43.
McDonald, A. & Schrattenholzer, L. (2001), ‘Learning rates for energy technologies’, Energy Pol-icy 29, 255–261.
McDonough, W. & Braungart, M. (2002), Cradle to cradle. Remaking the way we make things.,North Point Press.
McGuire, G. (2003), Managing mine closure risks in developing communities - a case study,kelian equatorial mining, indonesia, in ‘Mining Risk Management Conference’. Sydney, NSW.
McLellan, B., Corder, G., Giurco, D. & Ishihara, K. (2012), ‘Renewable energy in the mineralsindustry: a review of global potential’, Journal of Cleaner Production 32, 32–44.
McMillan, D. & Speight, A. (2001), ‘Non-ferrous metals price volatility: a component analysis’,Resource Policy 27, 199 – 207.
Meadows, D. H., Meadows, D. L., Randers, J. & Behrens, W. W. (1972), The Limits to Growth,Universe Books.
Meadows, D. H., Randers, J. & Meadows, D. L. (2004), Limits to Growth: The 30-Year Update,Chelsea Green Publishing Company.
Michaelis, P., Jackson, T. & Clift, R. (1998), ‘Exergy analysis of the life cycle of steel’, Energy23, 213–220.
Milton (1998), Porgera mine sustainable report, Technical report, PDAP, Placer Dome Asia Pa-cific.
Mining Technology (2013).URL: http://www.mining-technology.com/projects/
Minmetals Resources Limited (2013).URL: http://www.mmg.com/pages/828.aspx
Mudd, G. & Diesendorf, M. (2008), ‘Sustainability of uranium mining and milling: Toward quan-tifying resources and eco-efficiency’, Environ. Sci. Technol. 42, 2624–2630.
Mudd, G. M. (2007a), ‘An analysis of historic production trends in australian base metal mining’,Ore Geology Reviews 32, 227 – 261.
213

Mudd, G. M. (2007b), ‘Global trends in gold mining: Towards quantifying environmental andresource sustainability?’, Resources Policy 32, 42–56.
Mudd, G. M. (2007c), ‘Gold mining in australia: linking historical trends and environmental andresource sustainability’, Environmental science and policy 10, 629–644.
Mudd, G. M. (2010), ‘Global trends and environmental issues in nickel mining: Sulfides versuslaterites’, Ore Geology Reviews 38, 9–26.
Mudd, G., Weng, Z., Jowitt, S., Turnbull, I. & Graedel, T. (2013), ‘Quantifying the recoverableresources of by-product metals: The case of cobalt’, Ore Geology Reviews 55, 87–98.
Murthy, R., Tripathy, S. K. & Kumar, R. (2011), ‘Chrome ore beneficiation challenges & opportu-nities – a review’, Minerals Engineering 24, 375–380.
Nappi, C. & Poulin, R. (1998), ‘Sustainable development and mine management’, NonrenewableResources 7, 4.
Naredo, J. (1987), La economía en evolución. Historia y perspectivas de características básicas delpensamiento económico., Ediciones Siglo XXI, Madrid.
Naredo, J. M. & Valero, A. (1998), Desarrollo económico y deterioro ecológico (Economic develop-ment and ecological deterioration), Fundación Argentaria.
Newgold (2013).URL: http://newgold.com/
NGU (2008), Mineral resources in norway 2008. production data and annual report, Technicalreport, Geological Survey of Norway.
Norgate, T. & Haque, N. (2010), ‘Energy and greenhouse gas impacts of mining and mineralprocessing operations’, Cleaner Production 18, 266 – 274.
Norgate, T. & Jahanshahi, S. (2010), ‘Low grade ores - smelt, leach or concentrate?’, MineralsEnginnering 23, 65 – 73.
Norgate, T. & Jahanshahi, S. (2011), ‘Assessing the energy and greenhouse gas footprints ofnickel laterite processing’, Minerals Engineering 24, 698 – 707.
Norgate, T., Jahanshahi, S. & Rankin, W. (2007), ‘Assessing the environmental impact of metalproduction processes’, Journal of Cleaner Production 15, 838 – 848.
Ostrovski, O. & Zhang, G. (2005), ‘Energy and exergy analyses of direct ironsmelting processes’,Energy 30, 2772–2783.
Page, N. J. & Creasey, S. (1975), ‘Ore grade, metal production, and energy’, Research of the U.S.Geological Survey 3, 9–13.
Piekarczyk, W., Czarnowska, L. & Ptasiski, K.and Stanek, W. (2012), Thermodynamic evalua-tion of biomass – to – biofuels production systems., in ‘3rd International Conference CPOTE(Contemporary Problems of Thermal Engineering)’.
Primero Mining (2013).URL: http://www.primeromining.com/Operations/San-Dimas-Mine/default.aspx
214

Prior, T., Giurco, D., Mudd, G., Mason, L. & Behrisch, J. (2012), ‘Resource depletion, peakminerals and the implications for sustainable resource management’, Global EnvironmentalChange 22, 577 – 587.
PWC (2012), Financial reporting in the mining industry. international financial reporting stan-dards, Technical report, PricewaterhouseCoopers LLP.URL: www.pwc.com
RandGold Resources (2013).URL: http://www.randgoldresources.com/randgold/content/en/2009/randgold-home
Ranz, L. (1999), Análisis de los costes exergéticos de la riqueza mineral terrestre. Su aplicaciónpara la gestión de la sostenibilidad, PhD thesis, Universidad de Zaragoza.
Roberts, M. (2009), ‘Duration and characteristics of metal price cycles’, Resource Policy 34, 87 –102.
Rosen, M. (2002), ‘Can exergy help us understand and address environmental concerns?’, Ex-ergy 2, 214–217.
Rosen, M. A. & Dincer, I. (2001), ‘Exergy as the confluence of energy, environment and sustain-able development’, Exergy Int. J. 1, 3–13.
Rosen, M. A., Dincer, I. & Kanoglu, M. (2008), ‘Role of exergy in increasing efficiency and sus-tainability and reducing environmental impact’, Energy Policy 36, 128 – 137.
Rosenqvist, T. (1983), Principles of Extractive Metallurgy, McGraw-Hill.
Ruth, M. (1993), Integrating Economics, Ecology and Thermodynamics, The Netherlands,Kluwer Academic Publishers.
Ruth, M. (1995a), ‘Information, order and knowledge in economic and ecological systems: im-plications for material and energy use’, Ecological Economics 13, 99–114.
Ruth, M. (1995b), ‘Thermodynamic constraints on optimal depletion of copper and aluminumin the united states: a dynamic model of substitution and technical change’, Ecological Eco-nomics 15, 197–213.
Ruth, M. (1995c), ‘Thermodynamic constraints on optimal depletion of copper and aluminumin the united states: a dynamic model of substitution and technical change’, Ecological Eco-nomics 15, 197–213.
Sagar, A. & Frosch, R. (1997), ‘A perspective on industrial ecology and its appkation to a metals-industry ecosystem’, Journal of Cleaner Production 5, 39–45.
Santos, T. M. & Zaratan, M. L. (1997), ‘Mineral resources accounting: a technique for monitor-ing the philippine mining industry sustainable development’, Journal of Anon Earth Sciences15, 155–160.
Schoots, K., Ferioli, F., Kramer, G. & Van der Zwaan, B. (2008), ‘Learning curves for hydrogenproduction technology: An assessment of observed cost reductions’, International Journal ofHydrogen Energy 33, 2630–2645.
215

SEPA (2012), Inspel till svensk mineralstrategi, N2012/1081/FIN NV-02433-12, The Swedish En-vironmental Protection Agency, Stockholm.
Shafiee, S. & Topal, E. (2010), ‘An overview of global gold market and gold price forecastingshahriar shafiee a,n, erkan topal b’, Resources Policy 35, 178–189.
Shields, D. J. (1998), ‘Sustainability for nonrenewable resources: Alternative perspectives’, Non-renewable Resources 7, 4.
Skinner, B. J. (1986), Earth resources, Prentice-Hall, London.
Söderholm, P. & Sundqvist, T. (2007), ‘Empirical challenges in the use of learning curves forassessing the economic prospects of renewable energy technologies’, Renewable Energy32, 2559 – 2578.
Sohn, I. (2006), ‘Long-term projections of non-fuel minerals: We were wrong, but why?’, Re-sources Policy 30, 259 – 284.
Stanek, W. (2009), Evaluation Method of the Ecological Effects in Thermal Processes Using theExergy Analysis (in Polish), Edition of the Silesian University of Technology, Gliwice.
Steen, B. A. (2006), ‘Abiotic resource depletion. different perceptions of the problem with min-eral deposits’, Int J LCA 1, 49–54.
Stewart, M. & Weidema, B. (2005), ‘A consistent framework for assessing the impacts from re-source use. a focus on resource functionality’, Int J LCA 10(4), 240–247.
Strauss, K., Brent, A. C. & Hietkamp, S. (2006), ‘Characterisation and normalisation factors forlife cycle impact assessment mined abiotic resources categories in south africa’, Int J LCA3, 162–171.
Suppen, N., Carranza, M., Huerta, M. & Hernandez, M. (2006), ‘Environmental managementand life cycle approaches in the mexican mining industry’, Journal of Cleaner Production14, 1101–1115.
Svedberg, P. & Tilton, J. E. (2006), ‘The real, real price of nonrenewable resources: Copper 1870– 2000’, World Development 34, 501–519.
Szargut, J. (1986), ‘Application of exergy for the calculation of ecological cost?’, Bull. Polish Acad.Techn. Sciences 7-8.
Szargut, J. (1989), ‘Chemical exergies of the elements’, Applied Energy 32, 269–286.
Szargut, J. (2005), Exergy method: technical and ecological applications., Southampton, Boston:WIT Press.
Szargut, J. (2008), ‘Influence of the pro-ecological tax on the market prices of fuels and electric-ity’, Energy 33, 137 – 143.
Szargut, J., ed. (1993), Exergy, Ecology and Democracy - Concepts of a Vital Society or A Pro-posal for An Exergy Tax, International Conference on Energy Systems and Ecology - ENSEC.Krakow, Poland.
216

Szargut, J. & Morris, D. (1987), ‘Cumulative exergy consumption and cumulative degree of per-fection of chemical processes’, Int. J. Energy Res. 11, 245–261.
Szargut, J., Morris, D. & Steward, F. (1988a), Exergy analysis of thermal, chemical, and metallur-gical processes, Hemisphere Publishing Corporation.
Szargut, J., Morris, D. & Steward, F. (1988b), Exergy analysis of thermal, chemical, and metallur-gical processes, Hemisphere Publishing Corporation.
Szargut, J. & Stanek, W. (2012), ‘Fuel part and mineral part of the thermoecological cost.’, Inter-national Journal of Thermodynamics 15, 187–19.
Szargut, J., Ziebik, A. & Stanek, W. (2002), ‘Depletion of the non-renewable natural exergy re-sources as a measure of the ecological cost’, Energy Conversion and Management 43, 9–12.
Tilton, J. (1996), ‘Exhaustible resources and sustainable development’, Resource Policy 22, 91–97.
Tilton, J. E. (2001), Depletion and the long-run availability of mineral commodities, TechnicalReport 14, International Institute for Environment and Development.
Tilton, J. E. (2003), On borrowed time? Assessing the threat of mineral depletion, Resources forthe Future Press.
Tilton, J. E. (2010), ‘Is mineral depletion a threat to sustainable mining?’, The Society of EconomicGeologists Newsletter 82.
Tilton, J. E. & Lagos, G. (2007), ‘Assessing the long-run availability of copper’, Resources Policy32, 19–23.
Torres, C. (1991), Symbolic exergoeconomis : methodology for thermoeconomic analysis of en-ergy sys, PhD thesis, University of Zaragoza.
U. S. Geological Survey (USGS).URL: http://www.usgs.gov
USGS (2011a), Mineral commodities summaries, Technical report, U.S. Geological Survey.URL: http://minerals.usgs.gov/minerals/pubs/mcs/2011/mcs2011.pdf
USGS (2011b), Minerals yearbook gold, Technical report, U.S. Geological Survey.URL: http://minerals.usgs.gov/minerals/pubs/commodity/gold/myb1-2011-gold.pdf
Valero, A. (1998), Thermoeconomics as a conceptual basis for energy-ecological analysis, inS. Ulgiati, ed., ‘Advances in Energy Studies. Energy Flows in Ecology and Economy’, Musis,Roma, pp. 415–444.
Valero, A., Agudelo, A. & Valero, A. (2010), ‘The crepuscular planet. a model for the exhaustedatmosphere and hydrosphere’, Energy pp. 1–9.
Valero, A. & Lozano, M. (1994), Curso de Termoeconomía, Universidad de Zaragoza.
Valero, A., Lozano, M. & Munoz, M. (1986), A general theory of exergy saving. i. on the exer-getic cost, in R. Gaggioli, ed., ‘Computer-Aided Engineering and Energy Systems. Second LawAnalysis and Modelling’, Vol. 3, pp. 1–8.
217

Valero, A., Martínez, A. & Botero, E. (2003), ‘La sostenibilidad ambiental a escala planetaria. elcoste físico de reposición del “capital mineral” de la tierra’, Economía Industrial 352, 77–93.
Valero, A. & Torres, C. (2004), ‘Thermoeconomic analysis’, Exergy, energy system analysis andoptimization. UNESCO - EOLSS .
Valero, A., Uson, S., Torres, C. & Valero, A. (2010), ‘Application of thermoeconomics to industrialecology’, Entropy 12, 591–612.
Valero, A. & Valero, A. (2010a), ‘Exergoecology: A thermodynamic approach for accounting theearth’s mineral capital. the case of bauxite – aluminium and limestone – lime chains’, Energy35, 229–238.
Valero, A. & Valero, A. (2010b), ‘Physical geonomics: Combining the exergy and hubbert peakanalysis for predicting mineral resources depletion’, Resources, Conservation and Recycling .
Valero, A. & Valero, A. (2011), ‘A prediction of the exergy loss of the world’s mineral reserves inthe 21st century’, Energy 36, 1848 – 1854.
Valero, A. & Valero, A. (2012), ‘From grave to cradle. a thermodynamic approach for accountingfor abiotic resource depletion’, Journal of Industrial Ecology 17.
Valero, A., Valero, A. & Arauzo, I. (2008), ‘Evolution of the decrease in mineral exergy throughoutthe 20th century. the case of copper in the us’, Energy 33(2), 107–115.
Valero, A., Valero, A. & Domínguez, A. (2011), Influence of technical development and decliningore grades on the availability of gold resources, in ‘SDEWES Proceedings of the 6th DubrovnikConference on Sustainable Development of Energy, Water and Environment Systems’.
Valero, A., Valero, A. & Domínguez, A. (2013), ‘Exergy replacement cost of mineral resources’,Journal of Environmental Accounting and Management 1, 147–158.
Valero, A., Valero, A. & Gomez, J. (2011), ‘The crepuscular planet. a model for the exhaustedcontinental crust’, Energy 36, 694–707.
Valero, A., Valero, A. & Martínez, A. (2010), ‘Inventory of the exergy resources on earth includingits mineral capital’, Energy 35, 989–995.
Valero, A. & Valero D., A. (2012), ‘Exergy of comminution and the thanatia earth’s model’, Energy44, 1085–1093.
Valero, A. & Valero D., A. (2014), Thanatia. The destinity of the Earth’s mineral resources. A ther-modynamic Cradle-to-Cradle Assessment, World Scientific.
Valero Delgado, A. (2008), Exergy evolution of the mineral capital on earth, PhD thesis.
Verhoef, E., Reuter, M. & Dijkema, G. (2004), ‘Process knowledge, system dynamics and metalecology’, Journal of Industrial Ecology 8, 23 – 43.
WCED (1987), Our common future, Technical report, World Commission on Environment andDevelopment.URL: http://www.un-documents.net/our-common-future.pdf
218

Weatherstone, N. (2008), International standards for reporting of mineral resources and re-serves - status, outlook and important issues, in ‘World Mining Congress & Expo’.
Weidema, B. P. (2000), Can resource depletion be omitted from environmental impact assess-ments?, in ‘Poster presented to the 3rd SETAC World Congress, , Brighton.’.
Weiss, M., Junginger, M., Patel, M. K. & Blok, K. (2010), ‘A review of experience curve analysesfor energy demand technologies’, Technological Forecasting & Social Change 77, 411–428.
Wellmer, F. & Becker-Platen, J. D. (2002), ‘Sustainable development and the exploitation of min-eral and energy resources: a review’, Int J Earth Sci 91, 723–745.
West, J. (2011), ‘Decreasing metal ore grades. are they really being drivn by the depletion of highgrade deposits?’, Journal of Industraial Ecology 15, 165–168.
Willett, K. (2002), Managing australian mineral wealth for sustainble economic development,Technical report, International Institute for Environment and Development.
Wils, B. A. (2006), Mineral Processing Technology, Elsevier Ltd.
Worrall, R., Neil, D., Brereton, D. & Mulligan, D. (2009), ‘Towards a sustainability criteria andindicators framework for legacy mine land’, Journal of Cleaner Production 17, 1426 – 1434.
Xiao, X., Songwen, X., Xueyi, G., Kelong, H. & Ryoichi, Y. (2003), ‘Lca case study of zinc hydro andpyro-metallurgical process in china’, International Journal of Life Cycle Assessment pp. 1–5.
Yaksic, A. andTilton, J. (2009), ‘Using the cumulative availability curve to assess the threat ofdepletion: The case of lithium’, Resources Policy 34.
Yelle, L. E. (1979), ‘The learning curve: historical review and comprehensive survey’, Universityof Lowell 10, 302–328.
Yellishetty, M., Mudd, G. M. & Ranjith, P. (2011), ‘The steel industry, abiotic resource depletionand life cycle assessment: a real or perceived issue?’, Journal of Cleaner Production 19, 78 –90.
Yellishetty, M., Ranjith, P. G., Tharumarajah, A. & Bhosale, S. (2009), ‘Life cycle assessment inthe minerals and metals sector: a critical review of selected issues and challenges’, Int J LCA14, 257–267.
Yoshiki, K. & Toguri, J. (1993), ‘Metals production, energy, and the environment, part i: Energyconsumption’, JOM : Journal of the Minerals, Metals and Materials Society 5, 15–20.
Zaleta, A., Ranz, L. & Valero, A. (1998), ‘Towards a unified measure of renewable resources avail-ability: the exergy method applied to the water of a river’, Energy Conversion and Manage-ment 39(16-18), 1911–1917.
219