experimental investigations of air entrainment in
TRANSCRIPT

1
Experimental Investigations of Air Entrainment in Transition and
Skimming Flows down a Stepped Chute
Application to Embankment Overflow Stepped Spillways
H. CHANSON (Reader) and L. TOOMBES (Associate Lecturer)
Dept of Civil Engineering, The University of Queensland, Brisbane QLD 4072, Australia
Fax : (61 7) 33 65 45 99
URL: http://www.uq.edu.au/~e2hchans
Email: [email protected]
RESEARCH REPORT No. CE 158
Department of Civil Engineering
The University of Queensland
July, 2001
ISBN 1 864995297
ABSTRACT: Stepped spillways have been used for about 3,500 years. The last few decades have seen the development of new construction materials, design techniques and applications : e.g., embankment overtopping protection systems. Although it is commonly acknowledged that free-surface aeration is significant in stepped chutes, experimental data are scarce, often limited to very steep slopes (α ~ 50º). The paper presents an experimental study conducted in a large-size stepped chute (α = 22º, h = 0.1 m, W = 1 m). Observations demonstrate the existence of a transition flow pattern for intermediate flow rates between nappe and skimming flows. Detailed air-water flow measurements were conducted in both transition and skimming flows, immediately downstream of the inception point of free-surface aeration where uniform equilibrium flow conditions were not achieved. In skimming flows, a complete characterisation is developed for the distributions of void fraction, bubble count rate and velocity, and flow resistance is estimated including drag reduction effects. Transition flows exhibit significantly different air-water flow properties. They are highly aerated, requiring the design of comparatively high chute sidewalls. The design of embankment overflow stepped spillway is discussed in the light of the new results and design recommendations are provided. Major design issues include the step stability at the plunge point for high tailwater levels, the interactions between free-surface and seepage flows which could lead to further drag reduction, and secondary currents at the connection between steps and abutments. Keywords : stepped spillway, air entrainment, two-phase flow properties, drag reduction, embankment overflow protection.

2
Table of contents
Page
Table of contents 2
Notation 3
About the writers 6
Part I - Experimental investigations in a 1V:2.5H stepped spillway model
1. Introduction 8
2. Experimental apparatus and instrumentation
3. Basic flow patterns
4. Air-water flow properties in skimming flows
5. Air-water flow properties in transition flows
6. Discussion : air-water flow properties and flow resistance
Part II - Hydraulic design of embankment overflow stepped spillways
7. Embankment overflow stepped spillways 41
8. Hydraulic design of Embankment overflow stepped spillway
9. Conclusion 51
Acknowledgments
Appendix I - Summary of experimental results
Appendix II - Modelling cavity ejection processes (by H. CHANSON)
Appendix III - Air bubble diffusion in self-aerated flows (by H. CHANSON)
Appendix IV - Velocity measurements and cross-correlation techniques for dual-tip probe
measurements in gas-liquid flows
References

3
Notation
a air-water specific area (1/m);
amean depth-averaged air-water specific area (1/m);
C air concentration defined as the volume of air per unit volume, also called void fraction;
Cmean depth averaged air concentration defined as : (1 - Y90) * Cmean = d ;
Cp inflow pressure coefficient defined as :
Cp = 1
12 * ρ * g * d2
* ⌡⌠0
dP(y) * dy
DH hydraulic diameter (m); DH = 4*d*W/(W + 2*d) for a rectangular channel;
Dt turbulent diffusivity (m2/s) of air bubble in air-water flows;
Do dimensionless coefficient;
D' dimensionless air bubble diffusivity (defined by CHANSON 1995b);
d 1- flow depth measured normal to the channel slope at the edge of a step;
2- characteristic depth (m) defined as : d = ⌡⌠0
Y90
(1 - C) *dy ;
3- channel height (m);
dc critical flow depth (m); for a rectangular channel : dc = 3
qw2/g;
do inflow depth (m);
Fab bubble count rate (Hz) : i.e., number of bubbles detected by the probe sensor per second;
(Fab)max maximum bubble count rate (Hz);
Fej average cavity ejection frequency (Hz);
f Darcy friction factor for water flows;
fd equivalent Darcy friction factor estimate of the form drag;
fe Darcy friction factor of air-water flows
fi Darcy friction factor, neglecting air entrainment;
g gravity constant (m/s2) or acceleration of gravity; g = 9.80 m/s2 in Brisbane;
H total head (m);
h height of steps (m) (measured vertically);
κ Von Karman constant;
4
Κ inverse of the spreading rate of a turbulent shear layer;
K' integration constant;
K* K* = tanh-1( 0.1) = 0.32745015...;
ks cavity depth (m) (or roughness height);
Lcav cavity length (m), or step cavity length (m) measured between step edges;
l horizontal length of steps (m) (measured perpendicular to the vertical direction);
N exponent of the velocity power law;
n exponent;
P pressure (Pa);
Q discharge (m3/s);
q discharge per unit width (m2/s);
R normalised cross-correlation coefficient;
Sf friction slope;
s curvi-linear coordinate (m) measured in the flow direction
T bubble travel time (s) for which the cross-correlation function is maximum;
Tu turbulence intensity defined as : Tu = u'/V;
Tu' characteristic turbulence intensity in air-water flows (App. IV);
t, t' time (s);
Uw clear-water flow velocity (m/s) : Uw = qw/d;
u' root mean square of longitudinal component of turbulent velocity (m/s);
ur bubble rise velocity (m/s);
(ur)Hyd bubble rise velocity (m/s) in a hydrostatic pressure gradient;
V velocity (m/s);
Vc critical velocity (m/s); for a rectangular channel : Vc = 3
g * qw ;
V90 characteristic velocity (m/s) where the air concentration is 90%;
Vo free-stream velocity (m/s);
W channel width (m);
x longitudinal distance (m);
Y90 characteristic depth (m) where the air concentration is 90%;

5
y 1- distance (m) from the bottom measured perpendicular to the spillway invert;
2- distance (m) from the pseudo-bottom (formed by the step edges) measured
perpendicular to the flow direction;
Greek symbols
α channel slope;
∆x distance between probe sensors (m);
δx characteristic sensor size (m) in the flow direction;
δBL boundary layer thickness (m);
δ* displacement thickness (m);
δM momentum thickness (m);
λ dimensionless coefficient;
µ dynamic viscosity (N.s/m2);
ν kinematic viscosity (m2/s);
π π = 3.141592653589793238462643...;
ρ density (kg/m3);
σ surface tension between air and water (N/m);
τo boundary shear stress (Pa);
∅ diameter (m);
Subscript
air air flow;
c critical flow conditions;
w water flow;
Abbreviations
RCC roller compacted concrete.

6
About the writers
Hubert Chanson received a degree of 'Ingénieur Hydraulicien' from the Ecole Nationale Supérieure
d'Hydraulique et de Mécanique de Grenoble (France) in 1983 and a degree
Atomique' from the 'Institut National des Sciences et Techniques Nucléaires' in 1984. He worked for the
industry in France as a R&D engineer at the Atomic Energy Commission from 1984 to 1986, and as a
computer professional in fluid mechanics for Thomson-CSF between 1989 and 1990. From 1986 to
1988, he studied at the University of Canterbury (New Zealand) as part of a Ph.D. project. He was
awarded a Doctor of Engineering from the University of Queensland in 1999 for outstanding research
achievements in gas-liquid bubbly flows.
Hubert Chanson is a reader in environmental fluid mechanics and water engineering at the University of
Queensland since 1990. His research interests include design of hydraulic structures, experimental
investigations of two-phase flows, coastal hydrodynamics, water quality modelling, environmental
management and natural resources. He is the author of four books : "Hydraulic Design of Stepped
Cascades, Channels, Weirs and Spillways" (Pergamon, 1995), "Air Bubble Entrainment in Free-
Surface Turbulent Shear Flows" (Academic Press, 1997), "The Hydraulics of Open Channel Flows :
An Introduction" (Butterworth-Heinemann, 1999) and "The Hydraulics of Stepped Chutes and
Spillways" (Balkema, 2001). His publication record includes over 180 international refereed papers and
his work was cited over 600 times since 1990. Hubert Chanson has been active also as consultant for
both governmental agencies and private organisations. He has been awarded five fellowships from the
Australian Academy of Science. In 1995 he was a Visiting Associate Professor at National Cheng
Kung University (Taiwan R.O.C.) and he was Visiting Research Fellow at Toyohashi University of
Technology (Japan) in 1999 and 2001.
Hubert Chanson was the keynote lecturer at the 1998 ASME Fluids Engineering Symposium on Flow
Aeration (Washington DC), at the Workshop on Flow Characteristics around Hydraulic Structures
(Nihon University, Japan 1998) and at the first International Conference of the International Federation
for Environmental Management System IFEMS'01 (Tsurugi, Japan 2001). He gave an invited lecture at
the International Workshop on Hydraulics of Stepped Spillways (ETH-Zürich, 2000). He lectured
several short courses in Australia and overseas (e.g. Taiwan).

7
Luke Toombes graduated a Bachelor in Civil Engineering (BEng., 1st Hon.) at the University of
Queensland in 1994. He worked for the industry in Australia from 1995 to 1996 as a consulting
engineer for Cullen, Grummitt & Roe Pty Ltd, with expertise in the design and management of ports
and harbours, both in Australia and overseas. Between 1996 and 2001, he studied at the University of
Queensland as part of a Ph.D. project investigating the air-water flow properties of stepped cascades.
Luke Toombes is an Associate Lecturer in fluid mechanics at the Department of Civil Engineering, the
University of Queensland. His research interests include coastal processes, hydraulic engineering and
hydraulic structures. His publication record includes 10 international refereed papers and two refereed
research reports. His work was cited more than 10 times since 1997.

8
Part I - Experimental investigations in a 1V:2.5H stepped spillway model
1. Introduction
Stepped spillways have been used for about 3,500 years (CHANSON 2000,2001). During the 19th
century, the design technique was common in Europe, North-America and Australia (e.g. SCHUYLER
1909, WEGMANN 1911, KELEN 1933, CHANSON 1997a) (Fig. 1-1A). By the end of the 19th
century, it was understood that stepped chutes contributed significantly to the dissipation of the flow
energy : e.g., the design of the Gold Creek and New Croton dam spillways (WEGMANN 1907,
CHANSON and WHITMORE 1998). The interest in stepped cascades dropped however during the
first half of the 20th century with new progresses in the energy dissipation characteristics of hydraulic
jumps favouring the design of hydraulic jump stilling basins. Stilling basins allowed larger energy
dissipation and smaller structures, leading to cheaper construction costs.
Fig. 1-1 - Photographs of stepped spillways (A) Pas du Riot dam, Planfroy, France in June 1998 - Completed in 1873 (H = 36 m), design discharge : 65 m3/s, 7 steps (h ~ 2.5 à 3 m), trapezoidal cross-section (base width ~ 3 m)

9
Since the 1970s, the regain of interest for the stepped spillway design has been associated with the
development of new construction materials (e.g. roller compacted concrete RCC, polymer coated
gabions), the introduction of new design techniques (e.g. overflow embankment dam protection systems
with RCC and precast concrete blocks), and the development of new applications (e.g. re-oxygenation
cascades) (Fig. 1-1B). Research on stepped chute hydraulics has been very active : i.e., one book,
sixteen journal papers and twenty-six discussions listed in Global Books in Print™ and Science
Citation Index™ for the period 1985-2000. However most studies prior to 1992 neglected the effects of
free-surface aeration ('white waters'), until the first data by RUFF and FRIZELL (1994) and the
analysis of CHANSON (1993a). Today experimental data on air entrainment down stepped chute are
scarce, often limited to very steep slopes (α ~ 50º) as used for gravity dams (Table 1-1).
Table 1-1 - Detailed experimental investigations of air entrainment in stepped chutes
Reference α qw h Flow regime Remarks
deg. m2/s m (1) (2) (3) (4) (5) (6)
CHANSON and TOOMBES (1997, 2000)
3.4 0.038 to 0.163
0.143 Nappe flow W = 0.5 m. Supercritical inflow (0.03-m nozzle thickness).
TOZZI et al. (1998) 52.2 0.23 0.053 Skimming flow Inflow: uncontrolled smooth WES ogee crest followed by smaller first steps.
CHAMANI and RAJARATNAM (1999)
51.3 & 59
0.07 to 0.2
0.313 to 0.125
Skimming flow W = 0.30 m. Inflow: un-controlled smooth WES ogee crest.
MATOS (2000) 53.1 0.08 to 0.2
0.08 Skimming flow W = 1 m. Inflow: uncontrolled WES ogee crest, with small first steps built in the ogee development.
TOOMBES and CHANSON (2000)
3.4 0.08 to 0.136
0.143 Nappe flow W = 0.25 m. Supercritical inflow (nozzle thickness : 0.028 to 0.040 m). Ventilated steps.
BOES (2000) 30 & 50 -- 0.023 to 0.09
Skimming flow W = 0.5 m. Inflow: pressurised intake.
OHTSU et al. (2000) 55 0.016 to 0.03
0.025 Skimming flow W = 0.3 m. Inflow: uncontrolled broad-crest.
Present study 21.8 0.04 to 0.18
0.1 Transition & Skimming flows
W = 1 m. Inflow: uncontrolled broad-crest.

10
Fig. 1-1 - Photographs of stepped spillways (B) Riou dam, France in November 1994 - Completed in 1990 (H = 22 m), design discharge : 1.5 m2/s, width : 96 m, h = 0.43 m, RCC construction
It is the purpose of this study to provide a comprehensive database on air-water flows down stepped
chutes. Measurements were conducted on a large facility (h = 0.1 m, W = 1 m) with a precise
instrumentation. (Based upon a Froude similitude, the large size of the facility ensures that the
experimental results may be extrapolated to prototype with negligible scale effects for geometric scaling
ratios less than 10:1.) Two flow regimes were investigated, providing a broad spectrum of flow
conditions. A complete characterisation of the air-water flow properties is provided. The results are
discussed in the context of embankment overflow stepped spillways and design recommendations are
provided.
2. Experimental apparatus and instrumentation
Experiments were conducted at the University of Queensland in a 2.7-m long, 1-m wide, 21.8º slope
chute (Table 2-1). Waters were supplied from a large feeding basin (1.5-m deep, surface area 6.8 m ×
4.8 m) leading to a sidewall convergent with a 4.8:1 contraction ratio. The test section consisted of a
broad-crested weir (1-m wide, 0.6-m long, with upstream rounded corner (0.057-m radius)) followed by
nine identical steps (h = 0.1 m, l = 0.25 m) made of marine ply. The stepped chute was 1-m wide with

11
perspex sidewalls, followed by a horizontal concrete-invert canal ending in a dissipation pit.
Fig. 2-1 - Definition sketch of the test section
Table 2-1 - Summary of experimental flow conditions
Ref. Qw
m3/s
Location of inception of free-surface aeration
Flow regime Remarks
(1) (2) (3) (4) (5) Series 1 Single-tip probe 0.182 Step edge 6 Skimming flow Run Q5 0.164 Step edge 6 Skimming flow Run Q6 0.147 Step edge 5 Skimming flow Run Q7 0.130 Step edge 5 Skimming flow Run Q8 0.124 Step edge 5 Skimming flow Run Q1 0.114 Step edge 5 Skimming flow Run Q9 0.103 Step edge 4 Skimming flow Run Q2 0.099 Step edge 4 Transition flow Run Q10 0.085 Step edge 4 Transition flow Run Q11 0.080 Step edge 4 Transition flow Run Q3 0.071 Step edge 3 Transition flow Run Q12 0.066 Step edge 3 Transition flow Run Q4 0.064 Step edge 3 Transition flow Run Q13 0.058 Step edge 3 Transition flow Run Q14 0.052 Step edge 3 Transition flow Run Q15 0.046 Step edge 3 Transition flow Run Q16
Series 2 Double-tip probe 0.182 Step edge 6 Skimming flow Run Q23. 0.114 Step edge 5 Skimming flow Run Q21. 0.058 Step edge 3 Transition flow Run Q22.
The flow rate was delivered by a pump controlled with an adjustable frequency AC motor drive,
enabling an accurate discharge adjustment in a closed-circuit system. The discharge was measured
from the upstream head above crest with an accuracy of about 2% (ACKERS et al. 1978, BOS 1976).
Clear-water flow depths and velocities were measured with a point gauge and a Prandtl-Pitot tube (∅ =

12
3.3 mm) respectively. Air-water flow properties were measured using two types of conductivity probe:
a single-tip probe (∅ = 0.35 mm), and a double-tip probe (∅ = 0.025 mm). The probe sensors were
aligned in the flow direction and excited by an air bubble detector (AS25240). (The velocity
measurements were the longitudinal component of the air-water interfacial velocity.) The probe signal
was scanned at 5 kHz for 180 s and at 20 kHz for 20 s for the single-tip and double-tip probes
respectively. The translation of the probes in the direction normal to the channel invert was controlled
by a fine adjustment travelling mechanism connected to a MitutoyoTM digimatic scale unit (Ref. No.
572-503). The error on the vertical position of the probe was less than 0.025 mm. The accuracy on the
longitudinal position of the probe was estimated as ∆x < +/- 0.5 cm. The accuracy on the transverse
position of the probe was less than 1 mm. Flow visualisations were conducted with a digital video-
camera Sony™ DV-CCD DCR-TRV900 (speed: 25 fr/s, shutter: 1/4 to 1/10,000 s) and high-speed still
photographs.
Air-water flow properties were recorded for nineteen flow rates ranging from 0.046 to 0.182 m3/s
(Table 2-1). Measurements were conducted at the step edges, unless indicated (Fig. 2-1). Note that
uniform equilibrium flow conditions were not achieved at the downstream end of the chute because the
flume was relatively short. Full details of the experimental results are given in Appendix I.
3. Basic flow patterns
3.1 Flow regime
The facility was designed to operate with flow conditions ranging from nappe to skimming flow regimes
(Fig. 3-1). For dc/h < 0.53, where dc is the critical depth and h is the step height, the water flowed
down the chute as a succession of clear, distinct free-falling nappes (i.e. nappe flow regime). (Nappe
flows were not specifically investigated. Relevant references include HORNER (1969) and CHANSON
(1995a).) For dc/h > 0.97, the flow skimmed over the pseudo-bottom formed by the step edges : i.e.,
skimming flow regime. Intense cavity recirculation was observed at each and every step. For
intermediate discharges (0.53 < dc/h < 0.97), a transition flow pattern was observed. Dominant flow
features of transitions flows included strong splashing and droplet ejections at any position downstream
of the inception point of free-surface aeration. Small to medium air cavities were observed irregularly.
For example, a step with a small air pocket could be followed by a medium-size air cavity at the

13
downstream step, followed by a tiny air cavity at the next drop. For an observer standing on the bank,
the transition flow had a chaotic appearance with irregular droplet ejections that were seen to reach
heights of up to 3 to 5 times the step height. It did not have the quasi-smooth free-surface appearance of
skimming flows, nor the distinctive succession of free-falling nappes observed in nappe flows.
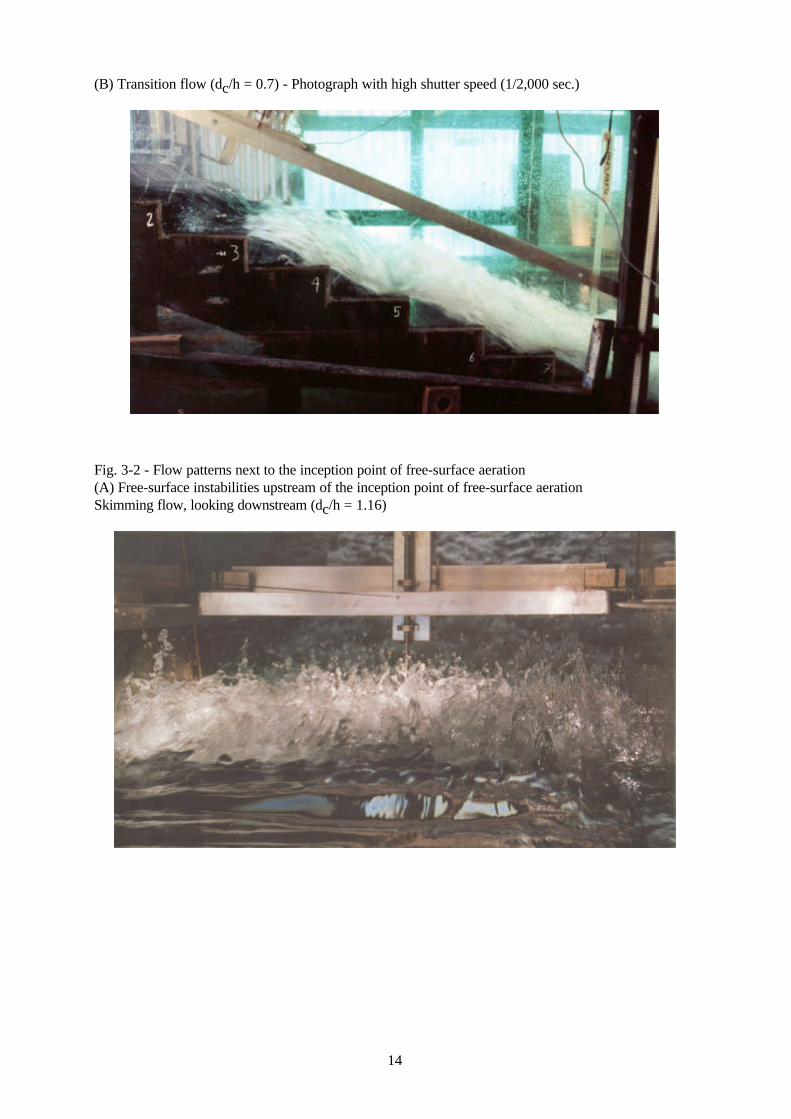
With both transition and skimming flows, the upstream flow was non-aerated and the free-surface
exhibited an undular profile of same wave length and in phase with the stepped invert profile. Free-
surface instabilities were however observed (Fig. 3-2). Similar wave instabilities were discussed by
ANWAR (1993) and CHANSON (1997b). ANWAR suggested that free-surface aeration may be
initiated by free-surface wave development, while CHANSON showed experimental evidence of free-
surface aeration in partially-developed flows.
The location of the inception of free-surface aeration was clearly defined for each and every test.
(Experimental observations are reported in Table 2-1 & Appendix I.) Cavity aeration was typically
observed one to two steps upstream of the inception point (Fig. 3-2). A similar observation was
reported by HORNER (1969), CHAMANI (2000) and MATOS (2000).
Fig. 3-1 - Views of the experimental test section (A) Skimming flow (dc/h = 1.5) - Flow from left to right
14
(B) Transition flow (dc/h = 0.7) - Photograph with high shutter speed (1/2,000 sec.)
Fig. 3-2 - Flow patterns next to the inception point of free-surface aeration (A) Free-surface instabilities upstream of the inception point of free-surface aeration Skimming flow, looking downstream (dc/h = 1.16)

15
(B) Cavity aeration at the inception point of free-surface aeration (Courtesy of M. EASTMAN) Transition flow, flow direction from the left to the right (dc/h = 0.6) - Note the small air cavity
OHTSU and YASUDA (1997) were the first to mention the existence of a distinct "transition flow"
regime (between nappe and skimming flows). The present observations of changes in flow regime are
close to their findings : i.e., 0.78 < dc/h < 1.05 for α = 18.4º (YASUDA and OHTSU 1999). These are
further consistent with previous reviews of nappe-to-skimming flow transition conditions (e.g.
RAJARATNAM 1990, CHANSON 1996).
3.2 Cavity recirculation in skimming flows
In skimming flows, intense three-dimensional cavity recirculation was observed at each step for all flow
rates (Table 2-1). The recirculation vortices were best observed next to and downstream of the
inception point, where entrained air bubbles within the step cavity enhanced visualisation. The
skimming flows were characterised by unsteady momentum exchanges between the main stream and
cavity flows. The recirculating fluid, at irregular time intervals, flowed outward into the main flow and
was replaced by fresh fluid (Fig. 3-3). The ejection mechanism appeared sequential. Once one cavity
outflow occured, it induced a sequence of outflows at the downstream cavities. Figure 3-3 illustrates the
sequential fluid ejection in three successive step cavities. (The time scale between the upper and lower
sketch is typically very short.) A similar pattern was documented with skimming flows past strip

16
roughness (1) while the sequential fluid ejection process was observed on the M'Bali stepped spillway
model by Professor LEJEUNE, and at Nihon University by Professor OHTSU and Dr YASUDA. This
is discussed in Appendix II.
Energy considerations show that the average fluid ejection frequency Fej is proportional to the
dimensionless boundary shear stress, and that the average outflow velocity is about half of the fluid
inflow velocity (Appendix II). For a wide chute with flat horizontal steps, the dimensionless cavity
ejection frequency is of the order of magnitude of :
Fej * (h*cosα)
Uw ~
f5 (3-1)
where Uw is the main flow velocity, f is the Darcy friction factor, h is the step height and α is the slope
of the pseudo-invert formed by the step edges. The duration of fluid ejection (or burst) must be smaller
than the average ejection period. This yields a limiting condition in terms of flow resistance : f ≤ 1.
Larger flow resistance implies that the flow energy is dissipated by further means other than viscous
dissipation in the cavity recirculation.
4. Air-water flow properties in skimming flows
Basic air-water flow properties
Downstream of the inception point of free-surface aeration, a rapid free-surface aeration was observed.
Air concentration distributions, measured at step edges, exhibited a smooth continuous profile.
Experimental results are presented in Figure 4-1 and compared with an analytical solution of the air
bubble advective diffusion equation :
C = 1 - tanh2
K" -
yY90
2 * Do +
y
Y90 -
13
3
3 * Do Skimming flows (4-1)
where y is distance measured normal to the pseudo-invert, Y90 is the characteristic distance where C =
90%, K" is an integration constant and Do is a function of the mean air concentration Cmean only
(App. III).
1Rectangular cavity : DJENEDI et al. (1994), ELAVARASAN et al. (1995). Triangular cavity :
TANTIRIDGE et al. (1994).

17
Fig. 3-3 Sketch of sequential fluid ejections From top to bottom : successive cavity ejections (burst and outflow) in three adjacent cavities
A small number of measurements were taken half-distance between two step edges (e.g. Fig. 4-1A). The
results suggest consistently a greater overall aeration than at adjacent step edges, with some aeration of
the fluid layers next to the recirculation cavity (i.e. y/Y90 < 0.3).
Velocity distributions measurements were performed at step edges (Fig. 4-1A). The results follow a

18
power law :
V
V90 =
y
Y90
1/N (4-2)
where V90 is the characteristic velocity for C = 90%. N was found to be about 5.1 and 6 for dc/h = 1.5
and 1.1 respectively. MATOS (2000) performed air-water velocity measurements in a longer chute and
he observed N ~ 4. CHANSON (1995a) found N = 3.5 and 4 for the earlier works of FRIZELL (1992)
and TOZZI (1992) respectively.
In the present study, the flume was relatively short and uniform equilibrium flow conditions were not
achieved. This might account for some difference with MATOS' results.
Figure 4-1C presents dimensionless distributions of bubble count rates Fab*dc/Vc, where Fab is the
bubble frequency, dc is the critical depth and Vc is the critical flow velocity. For a given flow velocity
and void fraction, the bubble count rate Fab is inversely proportional to the mean bubble size, and
directly proportional to the air-water specific interface area (e.g. CHANSON 1997c). The relationship
between the bubble frequency and air content exhibits a characteristic parabolic shape which is best
fitted by :
Fig. 4-1 - Air-water flow properties in skimming flows (A) Experimental data for Qw = 0.182 m3/s - Comparison with Equations (4-1) and (4-2) Inception of free-surface aeration upstream of step edge 6
0
0.2
0.4
0.6
0.8
1
1.2
0 0.2 0.4 0.6 0.8 1
C Step edge 6
C Step edge 7
C in between edges 7 & 8
C Step edge 8
Theory step 8
Theory step 8
V/V90 step edge 6
V/V90 step edge 7
V/V90 step edge 8
1/5.1 power law
y/Y90
C, V/V90
Run Q23, Qw = 0.182 m3/s

19
(B) Experimental data for Qw = 0.147 m3/s - Comparison with Equation (4-1) Inception of free-surface aeration upstream of step edge 5
0
0.2
0.4
0.6
0.8
1
1.2
0 0.2 0.4 0.6 0.8 1
Step edge 5
Step edge 6
Step edge 7
Step edge 8
Theory Step 5
Theory step 6
Theory step 7
y/Y90
C
Run Q7, Qw = 0.147 m3/s
(C) Dimensionless bubble count rate distributions (data measured with single-tip probe) for Qw = 0.147 m3/s
0
2
4
6
8
10
12
14
16
0 0.2 0.4 0.6 0.8 1
Step edge 5
Step edge 6
Step edge 7
Step edge 8
Parabolic law (step 6)
Parabolic law (step 8)
Fab dc/Vc
C
Run Q7, Qw = 0.147 m3/s

20
Fab
(Fab)max = 4 * C * (1 - C) (4-3)
where the maximum bubble frequency (Fab)max is seen for about C ~ 50%.
Bubble and droplet chord length data
Measured chord length size distributions are presented in Figure 4-2. Each figure shows the normalised
chord length probability distribution function where the histogram columns represent the probability of
a bubble chord length in 0.5 mm intervals : e.g., the probability of a chord length from 2.0 to 2.5 mm is
represented by the column labelled 2.0. The last column (i.e. > 20) indicates the probability of bubble
chord lengths larger than 20 mm. Air bubble chord length distributions are in white and water droplet
chord length distributions are in black. The data give some information on the characteristic sizes of air
bubbles and water droplets. They show the broad spectrum of bubble and droplet chord lengths
observed at each location : i.e., from less than 0.5 mm to larger than 20 mm (Fig. 4-2). Results from
both the bubbly flow region (C < 0.3 to 0.4) and the splashing region (0.6 to 0.8 < C) are shown.
The air bubble chord length distributions are skewed with a preponderance of small bubble sizes
relative to the mean. The probability of bubble chord lengths is the largest for bubble sizes between 0
and 1.5 mm for C ≈ 0.1 and between 0 and 2.5 mm for C ≈ 0.2. It is worth noting the large fraction of
bubbles larger than 20 mm for C ≈ 10 and 20%. These might be large air packets surrounding water
structures. For completeness, the fraction of bubbles larger than 20 mm was significantly higher
between step edges, possibly as the results of cavity aeration.
Although water droplet chord length distributions appeared skewed with a preponderance of small drop
sizes relative to the mean, the distributions differ from bubble chord length distributions for similar
liquid and void fractions respectively, indicating consistently larger droplet chord lengths (Fig. 4-2). A
similar result was noted in smooth-invert chute flow (CHANSON 1999a).
Dimensionless specific interface area distributions were calculated. Results are presented in Appendix I
in terms of the depth-averaged specific interface area amean. Experimental results show maximum
specific interface areas up to 650 m-1, with depth-average mean specific area ranging from 20 to 310
m-1 (App. I). For all skimming flow experiments, greater specific interface areas were measured in
between step edges than at the adjacent step edges. It is believed that the aeration of the recirculation

21
flow contributes even further to the interface area (2).
Fig. 4-2 Bubble and droplet chord length distributions (white = air bubbles - black = water droplets) (A) Void and liquid fractions : 10% (Qw = 0.182 m3/s)
Y90 (m) Cmean (Fab)max (Hz) Step edge 7 0.070 0.23 110 between step edges 7 and 8 0.090 0.40 123 Step edge 8 0.088 0.38 132
0
0.05
0.1
0.15
0 1 2 3 4 5 6 7 8 9 10 11 12 13 14 15 16 17 18 19
> 2
0
C=0.06, y/Y90=0.55, 796 bubbles
C=0.94, y/Y90=1.05, 782 droplets
Probability
chord length size (mm)
Run Q23, dc/h=1.5, Step edge 7
0
0.05
0.1
0.15
0 1 2 3 4 5 6 7 8 9 10 11 12 13 14 15 16 17 18 19
> 2
0
C=0.09, y/Y90=0.30, 1043 air bubbles
C=0.90, y/Y90=1.0, 1152 water droplets
Probability
chord length size (mm)
Run Q23, between step edges 7 & 8
0
0.05
0.1
0.15
0 1 2 3 4 5 6 7 8 9 10 11 12 13 14 15 16 17 18 19
> 2
0
C=0.10, y/Y90=0.36, 1661 air bubbles
C=0.9, y/Y90=1, 1185 water droplets
Probability
chord length size (mm)
Run Q23, Step edge 8
2No measurement was conducted in the recirculation cavity (y <0) to avoid probe tip damage.

22
(B) Void and liquid fractions : 20% (Qw = 0.114 m3/s)
Y90 (m) Cmean (Fab)max (Hz) Step edge 7 0.065 0.43 258 between step edges 7 and 8 0.070 0.53 205 Step edge 8 0.060 0.43 283
0
0.05
0.1
0.15
0.2
0 1 2 3 4 5 6 7 8 9 10 11 12 13 14 15 16 17 18 19
> 2
0
C=0.17, y/Y90=0.39, 3567 bubbles
C=0.79, y/Y90=0.77, 2896 droplets
Probability
chord length size (mm)
Run Q21, dc/h=1.1, Step edge 7
0
0.05
0.1
0.15
0.2
0 1 2 3 4 5 6 7 8 9 10 11 12 13 14 15 16 17 18 19
> 2
0
C=0.26, Y/Y90=0.07, 1730 bubbles
C=0.8, y/Y90=0.86, 1358 droplets
Probability
chord length size (mm)
Run Q21, between step edges 7 & 8
0
0.05
0.1
0 1 2 3 4 5 6 7 8 9 10 11 12 13 14 15 16 17 18 19
> 2
0
C=0.25, y/Y90=0.52, 2373 bubbles
C=0.78, y/Y90=0.76, 1993 droplets
Probability
chord length size (mm)
Run Q23, Step edge 8
Turbulent velocity field
Distributions of time-averaged air-water velocity V and modified turbulence intensity Tu' are presented

23
in Figure 4-3. The data were measured with a dual-tip resistivity probe and details of the processing
technique are given in Appendix IV. Although Tu' is not exactly equal to the turbulence intensity, it
provides some qualitative information on the turbulence level in the flow. Figure 4-3B includes data
measured at step edges (white symbols) and in between step edges (black symbols).
In Figure 4-3 the distributions of turbulence intensity Tu' exhibit relatively uniform profiles implying
high turbulence levels across the entire air-water flow mixture (i.e. 0 ≤ y ≤ Y90). The trend differs
significantly from well-known turbulence intensity profiles observed in turbulent boundary layers (e.g.
SCHLICHTING 1979). On stepped chutes, it is believed that the high rate of energy dissipation,
associated with form drag, contributes to strong turbulent mixing throughout the entire flow. Greater
turbulence levels are expected within the developing shear layers : i.e. in the wake of each step edge.
Despite some scatter, the trend is observed for the lower regions (y/Y90 < 0.2 to 0.3) (Fig. 4-3B).
Although the quantitative values of turbulence intensity Tu' are large (~ 100%), they are of the same
order of magnitude as turbulence levels measured in separated flows past rectangular cavity (HAUGEN
and DHANAK 1966, Fig. 9), in wakes between large stones (SUMER et al. 2001) and in the
developing shear region of plunging water jets (CHANSON and BRATTBERG 1998).
Fig. 4-3 - Dimensionless velocity and turbulent intensity distributions in skimming flow (A) qw = 0.182 m2/s, step edge 8
0
0.2
0.4
0.6
0.8
1
1.2
0 0.2 0.4 0.6 0.8 1
0 0.5 1 1.5 2 2.5
C Step edge 8
Theory step 8
V/V90 step edge 8
1/5.1 power law
Tu' data
y/Y90
C, V/V90
Run Q23, q = 0.182 m2/s, step edge 8
Tu'
Tu'
24
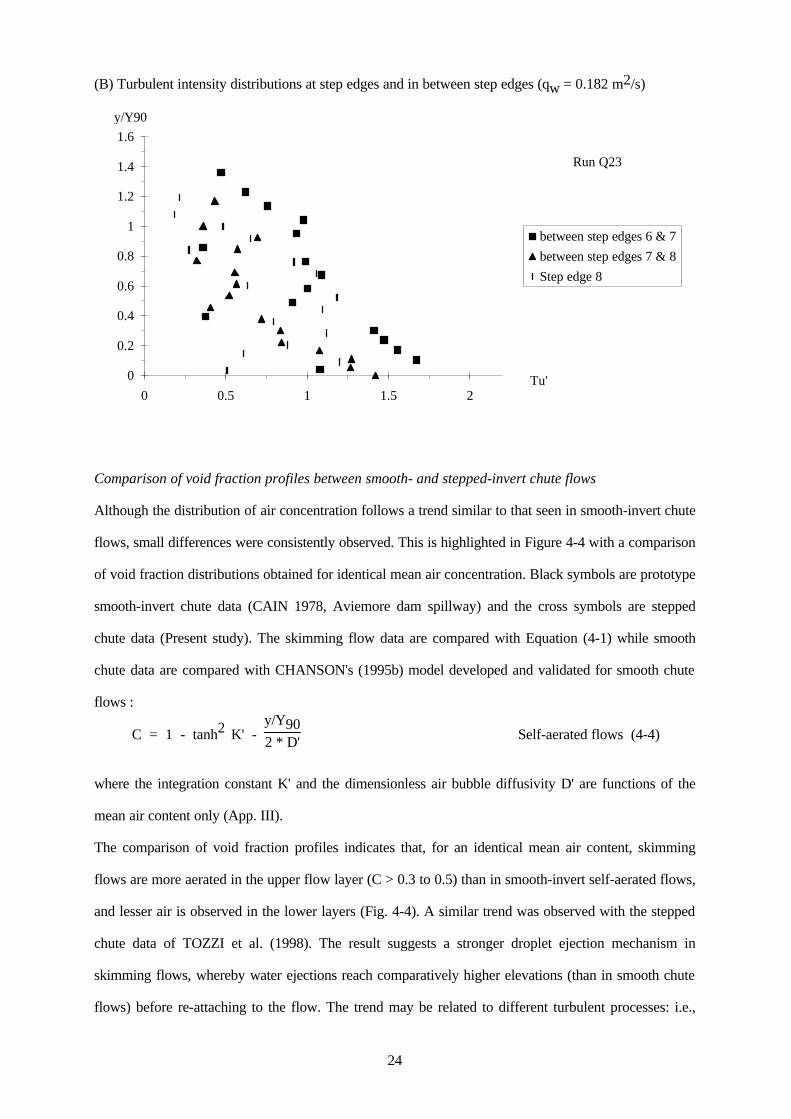
(B) Turbulent intensity distributions at step edges and in between step edges (qw = 0.182 m2/s)
0
0.2
0.4
0.6
0.8
1
1.2
1.4
1.6
0 0.5 1 1.5 2
between step edges 6 & 7
between step edges 7 & 8
Step edge 8
y/Y90
Tu'
Run Q23
Comparison of void fraction profiles between smooth- and stepped-invert chute flows
Although the distribution of air concentration follows a trend similar to that seen in smooth-invert chute
flows, small differences were consistently observed. This is highlighted in Figure 4-4 with a comparison
of void fraction distributions obtained for identical mean air concentration. Black symbols are prototype
smooth-invert chute data (CAIN 1978, Aviemore dam spillway) and the cross symbols are stepped
chute data (Present study). The skimming flow data are compared with Equation (4-1) while smooth
chute data are compared with CHANSON's (1995b) model developed and validated for smooth chute
flows :
C = 1 - tanh2
K' - y/Y902 * D' Self-aerated flows (4-4)
where the integration constant K' and the dimensionless air bubble diffusivity D' are functions of the
mean air content only (App. III).
The comparison of void fraction profiles indicates that, for an identical mean air content, skimming
flows are more aerated in the upper flow layer (C > 0.3 to 0.5) than in smooth-invert self-aerated flows,
and lesser air is observed in the lower layers (Fig. 4-4). A similar trend was observed with the stepped
chute data of TOZZI et al. (1998). The result suggests a stronger droplet ejection mechanism in
skimming flows, whereby water ejections reach comparatively higher elevations (than in smooth chute
flows) before re-attaching to the flow. The trend may be related to different turbulent processes: i.e.,

25
skin friction in smooth-invert chutes versus form drag in skimming flow down stepped chutes.
Fig. 4-4 - Comparison of air concentration distributions in smooth-invert and stepped chute flows Smooth-invert data : black symbols, solid line (Eq. (4-4)) Stepped chute date : cross symbols, dashed line (Eq. (4-1)) (A) Cmean = 0.27
0
0.2
0.4
0.6
0.8
1
1.2
0 0.2 0.4 0.6 0.8 1
CAIN 501-300
CAIN 502-450
UQ Q5-S8
UQ Q8-S6
UQ Q2-S5
Theory CHANSON (1995)
Theory Skimming
y/Y90
C
Cmean = 0.27
(B) Cmean = 0.35
0
0.2
0.4
0.6
0.8
1
1.2
0 0.2 0.4 0.6 0.8 1
CAIN 502-300
CAIN 503-450
UQ Q7-S7
UQ Q8-S8
UQ Q1-S6
Theory CHANSON (1995)
Theory Skimming
y/Y90
C
Cmean = 0.35

26
5. Air-water flow properties in transition flows
Free-surface aeration was found to be very intense for all transition flow rates (Table 2-1, App. I).
Downstream of the inception point of free-surface aeration, mean air concentrations ranged from 0.2 to
0.6 typically, with maximum mean air content of up to 78% measured at one step edge. Major
redistributions of air content and velocity were observed between adjacent, successive step edges.
Similar longitudinal fluctuations of flow properties were observed in transition flows down a 3.4º
stepped chute (h = 0.071 and 0.143 m) (CHANSON 2001), suggesting that the finding is not specific to
the facility. Figure 5-1 shows air-water flow properties for one typical flow rate.
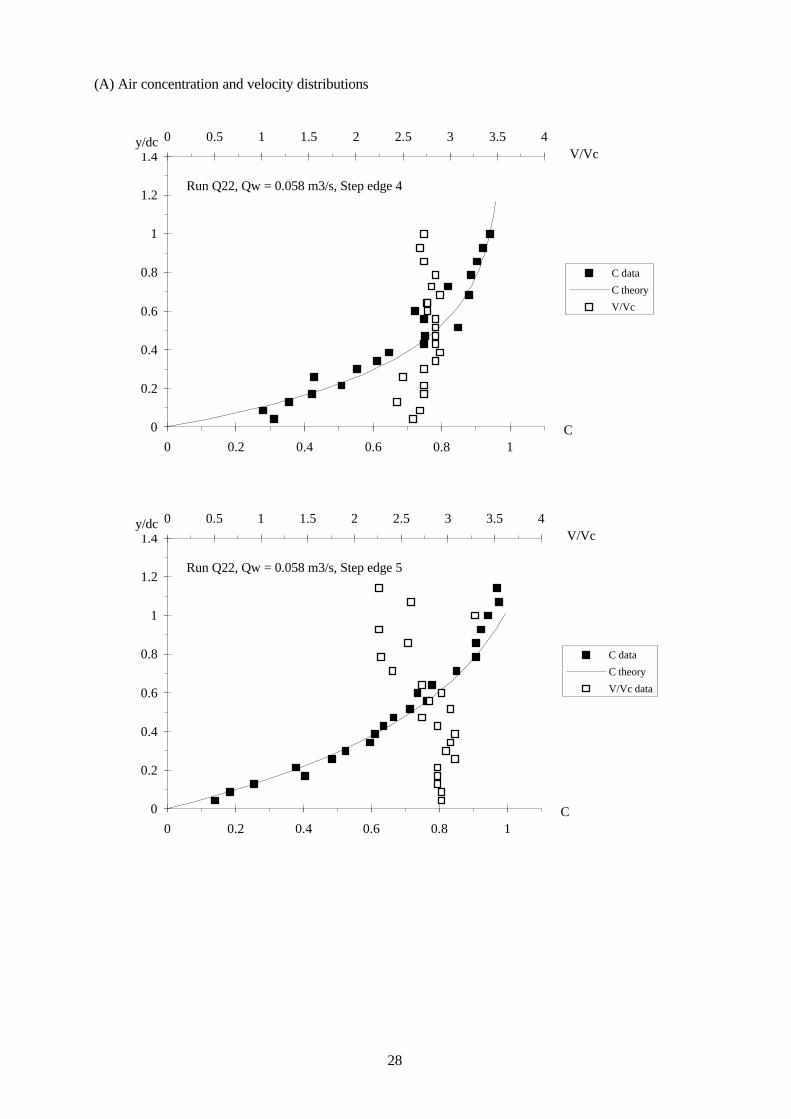
At most step edges, the distributions of air concentration may be fitted by :
C = K"' *
1 - exp
- λ *
yY90
Transition flows (5-1)
where K"' and λ are function of the mean air content only (App. III). Equation (5-1) compares
favourably with most data, except for the first step edge downstream of the inception point of free-
surface aeration and for the deflecting jet flow (e.g. Fig. 5-1).
For most flow rates, a deflecting flow was observed a few steps downstream of the inception point of
free-surface aeration. Visually, the flow appeared to bypass one step, barely touching the step edge. At
that step, liquid fractions (1-C) greater than 10% were measured at distances up to 1.5*dc and some
spray overtopped the 1.25-m high sidewalls. The nappe re-attached the main flow at the next
downstream step. In Figure 5-1A, such a deflected nappe is seen at the 6th step edge. (Further locations
of deflected nappe are reported in Appendix I.)
In transition flows, the distributions of bubble count rates follow about the parabolic law (Eq. (4-3))
that was observed in smooth-invert chute flows and in skimming flows (Fig. 5-1B).
Turbulent velocity field
Air-water velocity distributions are presented in Figure 5-2 in terms of the time-averaged air-water
velocity V and a modified turbulence intensity Tu' (Appendix IV). The distributions of turbulence
intensity Tu' exhibit relatively uniform profiles across the air-water flow mixture (i.e. y ≤ Y90). The
quantitative values of turbulence intensity Tu' are comparable with skimming flow data (Fig. 4-3).
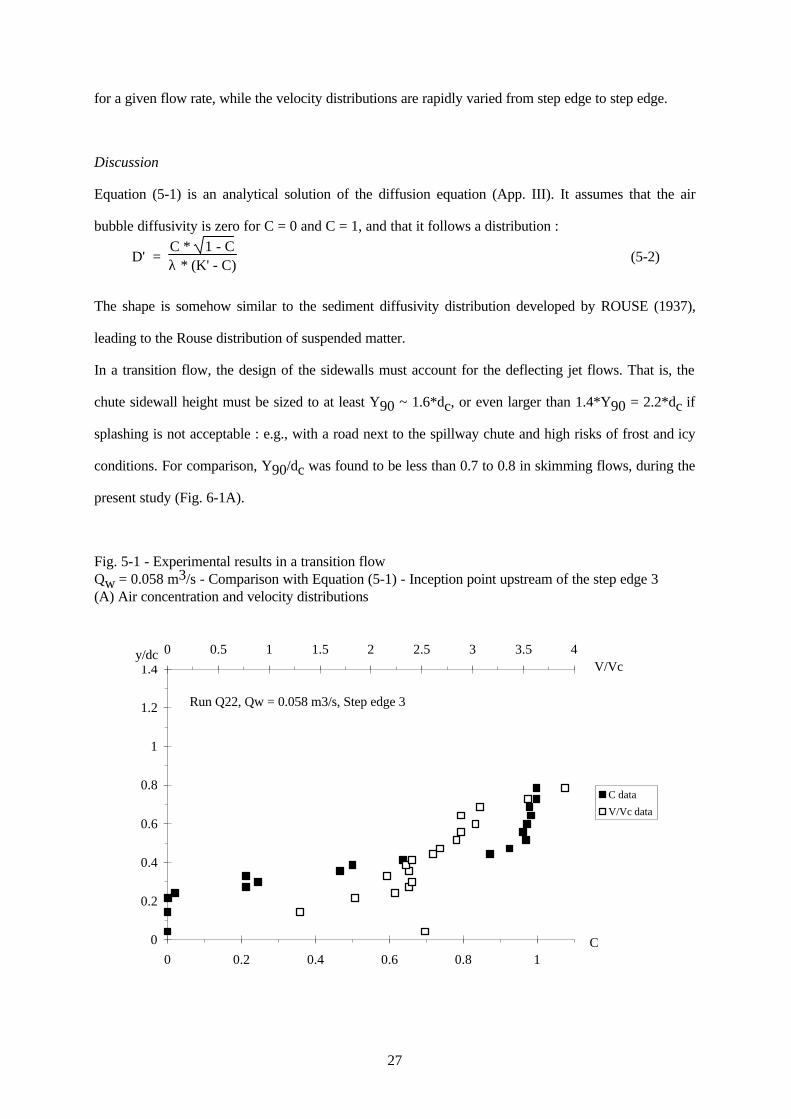
The writers note that, in a transition flow, the shape of the air concentration profiles is nearly identical
27
for a given flow rate, while the velocity distributions are rapidly varied from step edge to step edge.
Discussion
Equation (5-1) is an analytical solution of the diffusion equation (App. III). It assumes that the air
bubble diffusivity is zero for C = 0 and C = 1, and that it follows a distribution :
D' = C * 1 - Cλ * (K' - C)
(5-2)
The shape is somehow similar to the sediment diffusivity distribution developed by ROUSE (1937),
leading to the Rouse distribution of suspended matter.
In a transition flow, the design of the sidewalls must account for the deflecting jet flows. That is, the
chute sidewall height must be sized to at least Y90 ~ 1.6*dc, or even larger than 1.4*Y90 = 2.2*dc if
splashing is not acceptable : e.g., with a road next to the spillway chute and high risks of frost and icy
conditions. For comparison, Y90/dc was found to be less than 0.7 to 0.8 in skimming flows, during the
present study (Fig. 6-1A).
Fig. 5-1 - Experimental results in a transition flow Qw = 0.058 m3/s - Comparison with Equation (5-1) - Inception point upstream of the step edge 3 (A) Air concentration and velocity distributions
0
0.2
0.4
0.6
0.8
1
1.2
1.4
0 0.2 0.4 0.6 0.8 1
0 0.5 1 1.5 2 2.5 3 3.5 4
C data
V/Vc data
y/dc
C
Run Q22, Qw = 0.058 m3/s, Step edge 3
V/Vc
28
(A) Air concentration and velocity distributions
0
0.2
0.4
0.6
0.8
1
1.2
1.4
0 0.2 0.4 0.6 0.8 1
0 0.5 1 1.5 2 2.5 3 3.5 4
C data
C theory
V/Vc
y/dc
C
Run Q22, Qw = 0.058 m3/s, Step edge 4
V/Vc
0
0.2
0.4
0.6
0.8
1
1.2
1.4
0 0.2 0.4 0.6 0.8 1
0 0.5 1 1.5 2 2.5 3 3.5 4
C data
C theory
V/Vc data
y/dc
C
Run Q22, Qw = 0.058 m3/s, Step edge 5
V/Vc

29
(A) Air concentration and velocity distributions
0
0.2
0.4
0.6
0.8
1
1.2
1.4
1.6
1.8
2
2.2
0 0.2 0.4 0.6 0.8 1
0 0.5 1 1.5 2 2.5 3 3.5 4
C data
V/Vc data
y/dc
C
Run Q22, Qw = 0.058 m3/s, Step edge 6
Deflecting nappe
V/Vc
0
0.2
0.4
0.6
0.8
1
1.2
1.4
0 0.2 0.4 0.6 0.8 1
0 0.5 1 1.5 2 2.5 3 3.5 4
C data
C theory
V/Vc data
y/dc
C
Run Q22, Qw = 0.058 m3/s, Step edge 7
V/Vc

30
(A) Air concentration and velocity distributions
0
0.2
0.4
0.6
0.8
1
1.2
1.4
0 0.2 0.4 0.6 0.8 1
0 0.5 1 1.5 2 2.5 3 3.5 4
C data
C theory
V/Vc data
y/dc
C
Run Q22, Qw = 0.058 m3/s, Step edge 8
V/Vc
(B) Dimensionless bubble count rate distributions
0
2
4
6
8
10
12
14
16
18
20
22
24
0 0.2 0.4 0.6 0.8 1
Step edge 3
Step edge 4
Step edge 5
Step edge 6
Step edge 7
Step edge 8
Parabolic law (Step 5)
Parabolic law (Step 7)
Fab dc/Vc
C
Run Q22, qw = 0.058 m2/s
deflected nappe

31
Fig. 5-2 - Dimensionless velocity and turbulent intensity distributions in transition flow Run Q22, qw = 0.058 m2/s, step edge 8
0
0.2
0.4
0.6
0.8
1
1.2
1.4
1.6
1.8
0 0.2 0.4 0.6 0.8 1
0 0.5 1 1.5 2 2.5 3 3.5 4
C data
C theory
V/Vc data
Tu' data
y/Y90
C
Run Q22, q = 0.058 m2/s, Step edge 8
V/V90, Tu'
Tu'
6. Discussion : air-water flow properties and flow resistance
6.1 Air-water flow properties
Longitudinal distributions of mean air concentration Cmean and dimensionless air-water depth Y90/dc
are presented in Figure 6-1, where the horizontal axis s/dc is the ratio of the distance from the
downstream end of the broad crest to the critical depth. Note that the chute was relatively short and that
uniform equiibrium flow conditions were not achieved at the downstream end.
In skimming flows, rapid aeration was observed at the inception point, followed by a gradual increase
(Fig. 6-1A). In Figure 6-1A, the data are compared with the numerical model developed for smooth-
invert chutes by WOOD (1985) and extended by CHANSON (1993b). Calculations were conducted
assuming a friction factor f = 0.3.
Transition flow data are presented in Figure 6-1B. Note the different horizontal and vertical ranges
between Figures 6-1A and 6-1B. Very large aeration was observed in transition flows, in excess of
acknowledged limits observed in smooth chute flows (e.g. WOOD 1991, CHANSON 1997b,c). The
air-water flow depth data Y90 exhibited a saw-edged pattern, reaching up to 1.4 to 1.6 times dc at

32
deflected nappes. Overall both sets of curves do not show a monotonic trend. Rather chaotic, irregular
variations with increasing distances from the crest were observed.
Fig. 6-1 - Longitudinal distributions of mean air content Cmean and dimensionless depth Y90/dc (A) Skimming flow data - Comparison with numerical calculations (WOOD 1985, CHANSON 1993b)
0
0.1
0.2
0.3
0.4
0.5
0.6
0.7
8 10 12 14 16 18 20
Cmean dc/h=1.15 Q1
Cmean dc/h=1.3 Q7
Cmean dc/h=1.5 Q5
Y90/dc dc/h=1.51 Q1
Y90/dc dc/h=1.3 Q7
Y90/dc dc/h=1.5 Q5
Cmean calcul dc/h=1.3
Y90/dc calcul dc/h=1.3
Cmean, Y90/dc
s/dc
Y90/dc
Cmean
(B) Transition flow data
0.00
0.20
0.40
0.60
0.80
1.00
1.20
1.40
1.60
8 13 18 23 28
Q3 dc/h=0.87
Q11 dc/h=0.90
Q12 dc/h=0.8
Q4 dc/h=0.77
Q14 dc/h=0.70
Q15 dc/h=0.65
Y90/dc dc/h=0.87
Y90/dc dc/h=0.8
Y90/dc dc/h=0.77
Y90/dc dc/h=0.7
Y90/dc dc/h=0.65
s/dc
Cmean, Y90/dc

33
Similar instabilities were measured down a 3.4º stepped chute (h = 0.07 & 0.14 m) at the University of
Quensland (CHANSON 2001). OHTSU and YASUDA observed also the chaotic nature of transition
flows for slopes ranging from 5.7º to 55º, although it appeared more pronounced "cha os" for α < 35º
(Personal communication).
Experimental results show that the maximum bubble frequency (Fab)max increased with longitudinal
distance for each and every flow rate, and that it did not reach an upper limit within the length of the
experimental channel. The test section was indeed relatively short and uniform equilibrium was not
achieved at the downstream end. Figures 4-1C and 5-1B illustrate the longitudinal increase in maximum
bubble frequency for a skimming flow and a transition flow respectively.
6.2 Flow resistance in skimming flows
Skimming flows are characterised by significant form drag and form losses take place predominantly in
the cavity recirculation (see section 3.2, App. II). In gradually-varied flows downstream of the inception
point, the average shear stress between the skimming flow and the cavity recirculation may be
calculated from the friction slope Sf (3). For a wide channel the energy equation yields:
fe = 8 * τo
ρw * Uw2 =
8 * g *
⌡⌠y=0
y=Y90
(1 - C) * dy * Sf
Uw2 Gradually-varied flow (6-1)
where the friction slope equals Sf = - ∂H/∂s, H is the depth-averaged total head, s is the curvilinear
coordinate along the flow direction, fe is the Darcy friction factor for air-water flow, C is the local void
fraction, y is measured normal to the pseudo-invert formed by the step edges, and Uw is the mean flow
velocity (Uw = qw/d). For the present series of experiments, the flow resistance was estimated using
Equation (6-1) (Table 6-1). In Figure 6-2, the data are compared with experimental data obtained in
large-size laboratory flumes : i.e., h > 0.02 m and Re > 1 E+5. All 166 data were re-analysed using the
criteria of CHANSON et al. (2000).
0.30 (166 data) (Fig. 6-2B).
3The friction slope is the slope of the total head line (HENDERSON 1966, CHANSON 1999b).
34
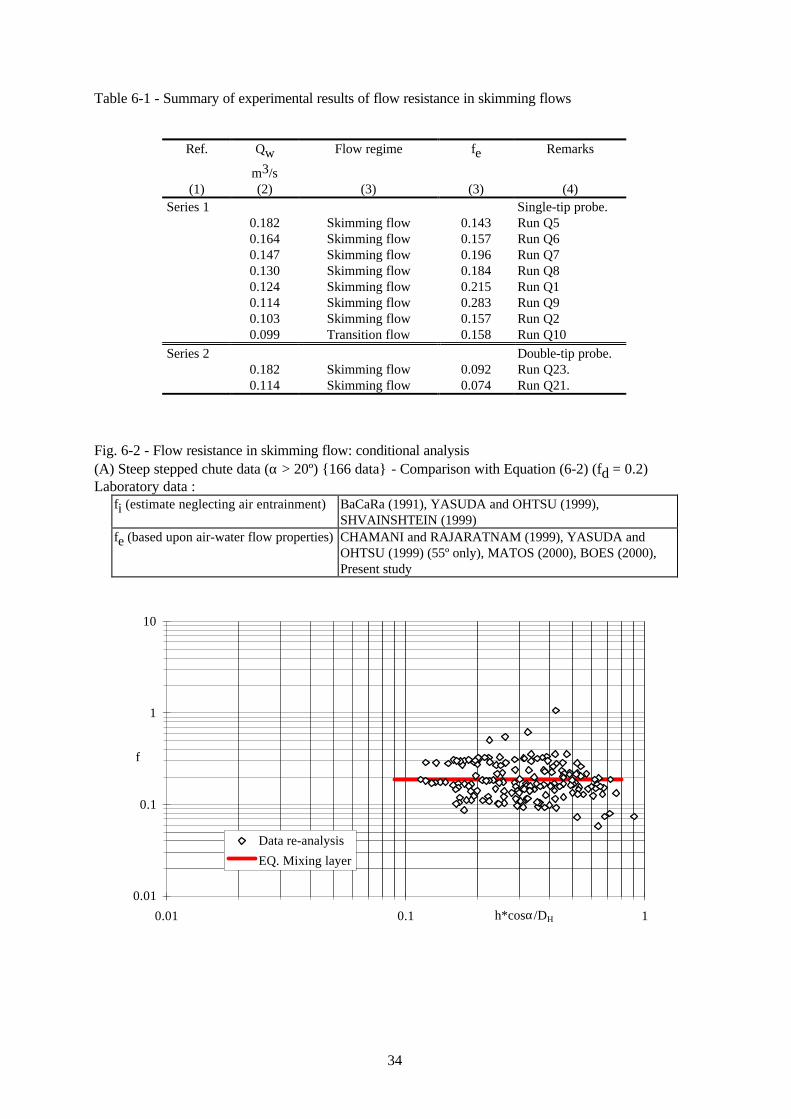
Table 6-1 - Summary of experimental results of flow resistance in skimming flows
Ref. Qw
m3/s
Flow regime fe Remarks
(1) (2) (3) (3) (4) Series 1 Single-tip probe. 0.182 Skimming flow 0.143 Run Q5 0.164 Skimming flow 0.157 Run Q6 0.147 Skimming flow 0.196 Run Q7 0.130 Skimming flow 0.184 Run Q8 0.124 Skimming flow 0.215 Run Q1 0.114 Skimming flow 0.283 Run Q9 0.103 Skimming flow 0.157 Run Q2 0.099 Transition flow 0.158 Run Q10
Series 2 Double-tip probe. 0.182 Skimming flow 0.092 Run Q23. 0.114 Skimming flow 0.074 Run Q21.
Fig. 6-2 - Flow resistance in skimming flow: conditional analysis (A) Steep stepped chute data (α > 20º) {166 data} - Comparison with Equation (6-2) (fd = 0.2) Laboratory data :
fi (estimate neglecting air entrainment) BaCaRa (1991), YASUDA and OHTSU (1999), SHVAINSHTEIN (1999)
fe (based upon air-water flow properties) CHAMANI and RAJARATNAM (1999), YASUDA and OHTSU (1999) (55º only), MATOS (2000), BOES (2000), Present study
0.01
0.1
1
10
0.01 0.1 1
Data re-analysis
EQ. Mixing layer
f
h*cosα/DH
35
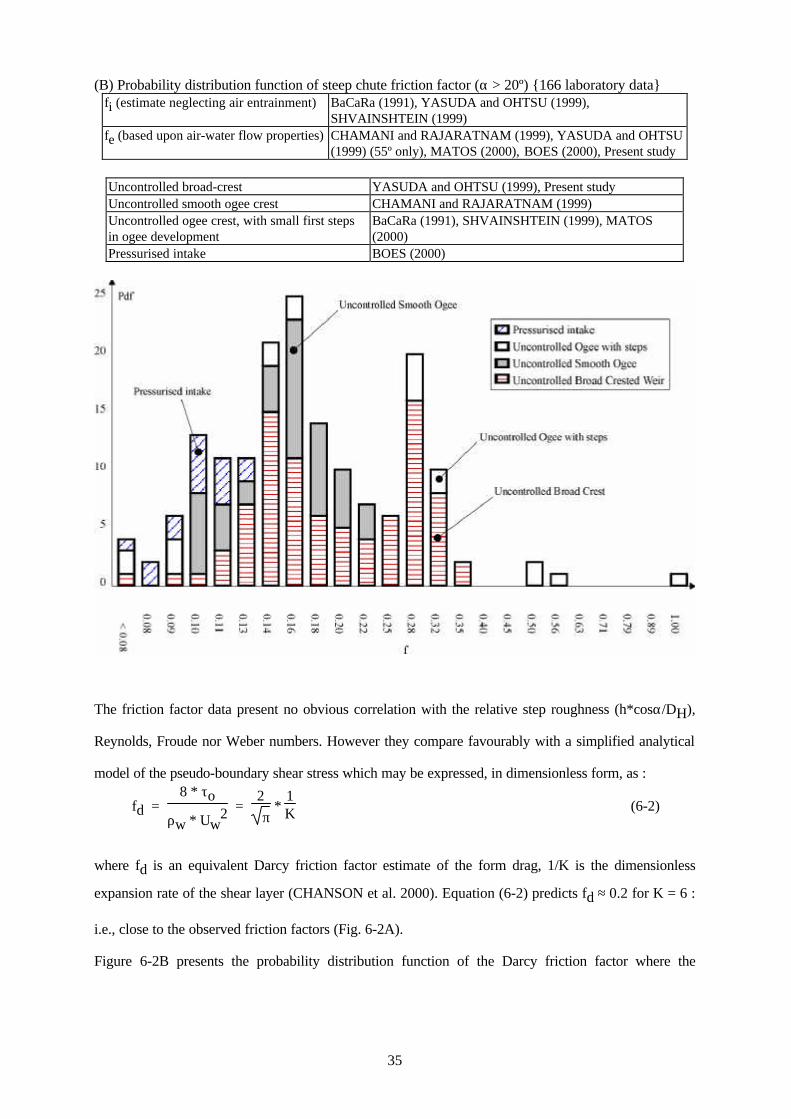
(B) Probability distribution function of steep chute friction factor (α > 20º) {166 laboratory data} fi (estimate neglecting air entrainment) BaCaRa (1991), YASUDA and OHTSU (1999),
SHVAINSHTEIN (1999) fe (based upon air-water flow properties) CHAMANI and RAJARATNAM (1999), YASUDA and OHTSU
(1999) (55º only), MATOS (2000), BOES (2000), Present study
Uncontrolled broad-crest YASUDA and OHTSU (1999), Present study Uncontrolled smooth ogee crest CHAMANI and RAJARATNAM (1999) Uncontrolled ogee crest, with small first steps in ogee development
BaCaRa (1991), SHVAINSHTEIN (1999), MATOS (2000)
Pressurised intake BOES (2000)
The friction factor data present no obvious correlation with the relative step roughness (h*cosα/DH),
Reynolds, Froude nor Weber numbers. However they compare favourably with a simplified analytical
model of the pseudo-boundary shear stress which may be expressed, in dimensionless form, as :
fd = 8 * τo
ρw * Uw2 =
2
π *
1K (6-2)
where fd is an equivalent Darcy friction factor estimate of the form drag, 1/K is the dimensionless
expansion rate of the shear layer (CHANSON et al. 2000). Equation (6-2) predicts fd ≈ 0.2 for K = 6 :
i.e., close to the observed friction factors (Fig. 6-2A).
Figure 6-2B presents the probability distribution function of the Darcy friction factor where the

36
histogram columns represent the number of data with friction factors within the interval (4) : e.g., the
probability of friction factors from 0.18 to 0.20 is represented by the column labelled 0.18. The first
and last column indicates the number of data with friction factors less than 0.08 and greater than 1.0
respectively. The experimental data are distributed around three dominant values: f ≈ 0.105, 0.17 and
0.30 (166 data) (Fig. 6-2B).
Fig. 6-3 - Cavity recirculation, developing shear layer and re-attachment in skimming flows
Discussion
The writers hypothesise that flow resistance in skimming flows (down steep slopes) is not an unique
function of the flow rate and stepped chute geometry, but that the form drag process presents several
modes of excitation. At each step edge, shear instabilities may develop in the shear layer (e.g.
NAUDASCHER 1967) (Fig. 6-3). In turn, the instabilities could generate different cavity wake
regimes, associated with different drag coefficients. In Figure 6-2B, the dominant values f ≈ 0.105, 0.17
and 0.30 are assumed to correspond to the three dominant modes (or regimes).
Different modes of excitation may be induced by different inflow conditions, affecting cavity
recirculation processes in a cascading effect (i.e. sequential cavity ejections, Fig. 3-3). At the upstream
4The intervals were selected with a constant logarithmic increment

37
end, the inflow turbulence does affect the cavity recirculation and the distance to re-attachment of the
shear layer (Fig. 6-3). In turn, this will affect all the stepped chute because of the sequential ejection
process (Fig. 3-3). Figure 6-4 summarises basic inflow configurations. With an uncontrolled ogee
profile, the pressure distribution is atmospheric in the entire flow at design flow conditions by definition
of the ogee development (HENDERSON 1966, CHANSON 1999b) (5). The inflow pressure coefficient
Cp is zero, where Cp is defined as :
Cp = 1
12 * ρ * g * d2
* ⌡⌠0
dP(y) * dy
With an uncontrolled broad-crest, the pressure is hydrostatic at the crest and Cp = 1. For a pressurised
intake, the inflow pressure distribution is greater than hydrostatic (i.e. Cp >> 1).
Figure 6-2B shows that experiments with pressurised intake yield lower flow resistance than for
uncontrolled inflow conditions. For example, the re-analysis of BOES' (2000) data gives f ~ 0.1 : i.e.,
about three times smaller than the third dominant value. Skimming flow experiments at the University
of Queensland down a flat slope (α = 3.4º, h = 0.07 m) yielded friction factors f ~ 0.03, that are three
times smaller than data of YASUDA and OHTSU (1999) (f ~ 0.08) on a 5.7º stepped slope (h = 0.025
& 0.05 m) with uncontrolled broad-crest.
The type of excitation mode (or regime) may further be affected by the cavity dimensions (ratio h/l),
cavity aeration (greater aeration are likely on steep slopes), and compliance of the stepped invert
(construction material) which could lead to different vibration regimes. There is some analogy with
form drag behind bluff bodies. For the flow behind a cylinder, the drag coefficient is known to be a
function of the upstream turbulence affecting the boundary layer separation for a given Reynolds
number (6). For ventilated cavities behind wedges and wings, several regimes were associated with
different drag coefficients for the same inflow conditions, depending upon the amount of ventilation
(SILBERMAN and SONG 1961, LAALI and MICHEL 1984, MICHEL 1984, VERRON and
5A further sub-division may be made between an entire smooth ogee profile and an ogee development
with small first steps in the profile (Fig. 6-3).
6For infinitely long smooth cylinders, the effect is best observed for Reynolds numbers about 1 E+5 to
1 E+6.

38
MICHEL 1984).
The above results may further be influenced by drag reduction associated with air bubble entrainment
(section 6.3).
Fig. 6-4 - Definition sketch of inflow conditions
6.3 Drag reduction in skimming flows
On smooth-invert chutes, the presence of air within turbulent boundary layers reduces the shear stress
between flow layers, and hence the shear force (WOOD 1983, CHANSON 1994). An estimate of the
drag reduction is :
fef = 0.5 *
1 + tanh
0.628 * 0.514 - Cmean
Cmean * (1 - Cmean) Smooth chute (6-3)
where tanh is the hyperbolic tangent function, Cmean is the mean air concentration, f is the clear-water
friction factor and fe is the Darcy friction factor of air-water flow (CHANSON 1994). Equation (6-3)

39
characterises the reduction in skin friction associated with air entrainment causing a thickening of the
momentum sublayer (CHANSON 1994,1997b).
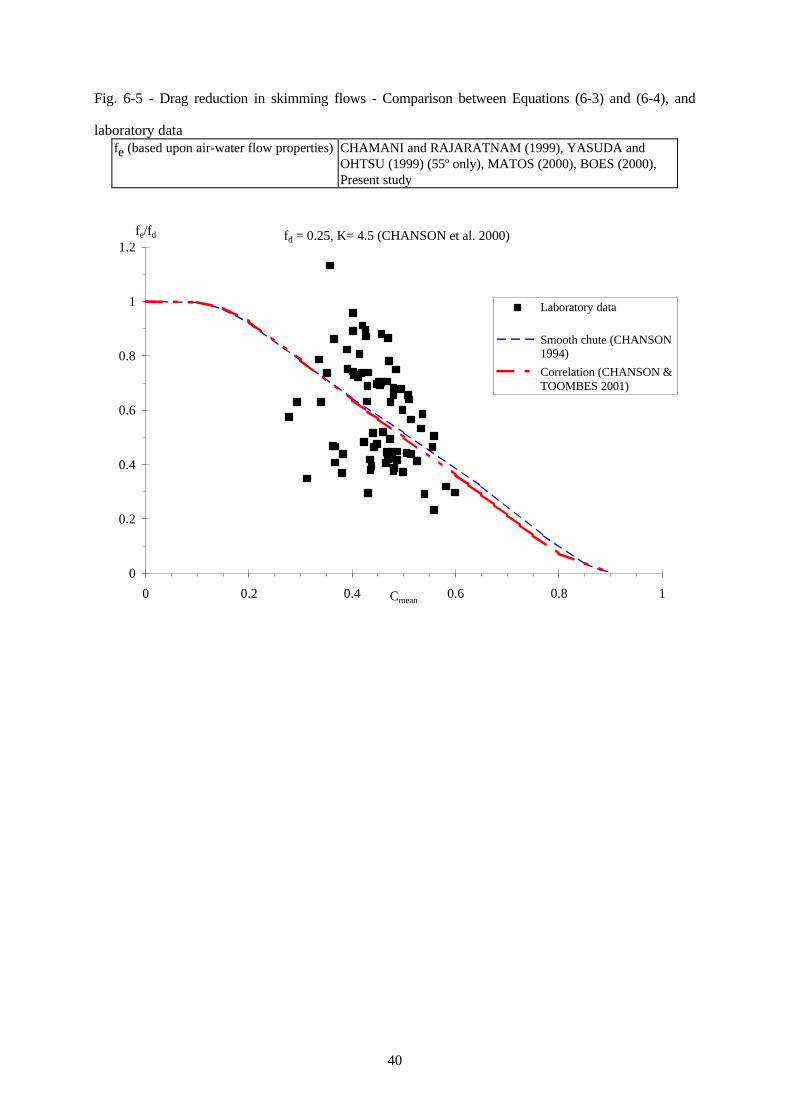
The re-analysis of detailed air concentration measurements in skimming flows shows a decrease in
friction factor fe with increasing mean air concentration (Fig. 6-5, Table 1-1). The re-analysed stepped
chute data are best correlated by :
fefd
= 0.5 *
1 + tanh
0.68 * 0.5 - Cmean
Cmean * (1 - Cmean) Skimming flow (6-4)
where fd is the dimensionless pseudo-boundary shear stress for clear-water flow (Eq. (6-2)). Equation
(6-4) is compared with experimental data in Figure 6-5 assuming a mixing layer expansion rate : 1/K =
0.22 (Eq. (6-2)). Equation (6-3) is also shown. Despite some scatter, the results confirm CHANSON's
assumption that a drag reduction process caused by air entrainment occurs on stepped spillways
(CHANSON 1993a,1995a). The trend (Eq. (6-4) is very close to drag reduction estimate on smooth-
chutes (Eq. (6-3)) although the drag reduction mechanism is entirely different (Fig. 6-5).
In skimming flows, separation occurs at each step edge and a shear layer develops with cavity
recirculation beneath (Fig. 3-3 & 6-3). It is believed that drag reduction results from interactions
between the entrained bubbles and the developing mixing layer. Small air bubbles tend to resist
stretching and this leads to some vortex inhibition. Hydrodynamic interactions between bubbles affect
their orientation in the flow and might play a key role in reducing the instability of the flow as with fibre
addition in water flows (e.g. AZAIEZ 2000). Interactions between particles and turbulent structures
were visualised in developing shear layers of dilute polymer solutions, showing the existence of large-
scale turbulent structures and a drastic reduction in number of small-scale eddies with polymer
additives (e.g. RIEDIGER 1989).
40
Fig. 6-5 - Drag reduction in skimming flows - Comparison between Equations (6-3) and (6-4), and
laboratory data fe (based upon air-water flow properties) CHAMANI and RAJARATNAM (1999), YASUDA and
OHTSU (1999) (55º only), MATOS (2000), BOES (2000), Present study
0
0.2
0.4
0.6
0.8
1
1.2
0 0.2 0.4 0.6 0.8 1
Laboratory data
Smooth chute (CHANSON1994)
Correlation (CHANSON &TOOMBES 2001)
fe/fd
Cmean
fd = 0.25, K= 4.5 (CHANSON et al. 2000)

41
Part II - Hydraulic design of embankment overflow stepped spillways
7. Embankment overflow stepped spillways
Flood protection of an embankment dam is usually achieved by combining a side spillway of relatively
large capacity with a reservoir storage "buffer" (i.e. empty volume) for flood attenuation. In recent
years, the design floods of a number of dams were re-evaluated and the revised flows were often larger
than those used for the original designs. In many cases, occurrence of the revised design floods would
result in dam overtopping because of the insufficient storage and spillway capacity of the existing
reservoir. Embankment overtopping is not acceptable because the rushing waters would scour the
embankment slope leading to the rapid and total failure of the embankment.
Some overflow systems were developed in Australia : e.g., flow through rockfill embankment (e.g.
OLIVIER 1967), the minimum energy loss weir design (e.g. Chinchilla weir, TURNBULL and
McKAY 1974), the concrete slab chute system at Crotty rockfill dam (Tasmania). Although technically
successful, these designs are not often economical. Recently new flood protection systems were
introduced, allowing controlled embankment overtopping over a reinforced downstream stepped slope.
Basic reinforcement techniques include concrete overtopping protection, precast concrete blocks, timber
cribs, sheet-piles, riprap and gabions, and reinforced earth.
Concrete overtopping protection
Concrete overtopping protection allows an increase of spillway capacity. In North-America, a number
of dam overtopping rehabilitations were conducted primarily on embankment structures with dam
heights ranging from 4.6 to 33.5 m. It is believed that the first ones were the Ocoee No. 2 timber crib
dam in 1980 and the Brownwood Country Club earth dam in 1984. Various construction techniques
were used. Current trends favour the use of roller compacted concrete (RCC) (7) (Fig. 7-1).
7RCC dam rehabilitation accounted for nearly two-thirds of the RCC dam construction in USA in the
1990s.

42
Fig. 7-1 - Concrete overflow protection system for embankments (A) Sketch of an overflow protection system with roller compacted concrete
(B) Construction of a RCC spillway for detention basin West of Las Vegas, designed by the US Corps of Engineers
Roller compacted concrete is placed in a succession of overlays of 0.2 to 0.4-m thickness and with a
width greater than 2.5 m for proper hauling, spreading and compacting. Exposed RCC is frequently
used for secondary spillways with infrequent spills of less than 5 m2/s. Alternatively, a conventional
concrete protection overlay may be applied after the RCC or at the completion of construction works to

43
protect the RCC. With both RCC and conventional concrete protection, a drainage system beneath the
concrete layers is essential to prevent uplift. Its purpose is to relieve pore pressure at the interface
between the embankment and RCC overlays. In some cases, the drainage installation may be replaced
or supplemented with drain holes formed through the RCC during placement. At the downstream end a
cutoff wall must be built to prevent undermining of the concrete layer during overtopping.
Precast concrete steps
Soviet engineers were among the first to propose a stepped concrete chute design on the downstream
face of embankment dams under the leadership of P.I. GORDIENKO (CHANSON 1995a, 2001) (Fig.
7-2). The choice of a stepped structure allows the use of individual blocks interlocked with the next
elements and the design assists in the energy dissipation. The design concept was more recently tested in
USA and UK, although it did not prove cost-effective there. An interesting feature of the concrete block
system is the flexibility of the stepped channel bed allowing differential settlements of the embankment.
Fig. 7-2 - Earth dam stepped spillway with precast concrete blocks : Sosnovsky farm dam (Russia,
1980) (Courtesy of Prof. Y. PRAVDIVETS) - H = 11 m, design flow : 3.3 m2/s, α = 10º, W = 12 m,
overlapping precast concrete blocks (1.5 m × 3 m × 0.16 m)

44
Fig. 7-3 - Earthfill embankment with a rockfill upstream protection and reinforced earth downstream
slope construction : Jordan II, Gatton QLD (Australia, 1992) on 22 Feb. 1998 - H = 5.3 m, h = 1.4 m,
α = 17.7º - View from downstream
For an earth dam with overflow precast block stepped spillway, the most important criterion is the
stability of the dam material. Seepage may occur in a saturated embankment and the resulting uplift
pressures can damage or destroy the stepped channel and the dam : adequate drainage is essential. In a
typical design, the blocks lay on a filter and erosion protection layer. The layer has the functions of
filtering the seepage flow out of the subsoil and protecting the subsoil layer from erosion by flow in the
drainage layer. The protection layer reduces or eliminates the uplift pressures acting on the concrete
blocks. Usually a geotextile membrane is laid on the embankment before the placing of the layer, and
another covers the protection layer before the installation of the blocks.
There is a basic design rule for precast concrete block systems : a skimming flow in a straight prismatic
chute. The step block system was developed for a skimming flow regime : i.e., maximum block stability
can only be achieved in skimming flows (e.g. BAKER 2000).
Alternatives for embankment stepped overflow
Alternative overtopping protection systems include timber cribs, sheet-piles, riprap and gabions, and
reinforced earth. Timber crib overflows were used as early as the 18th century in Russia and some
recent structures are still in use in Australia (CHANSON 2001). A number of weirs were designed with
45
steel sheet-piles and concrete slabs in Russia and Australia. An experimental structure was built with a
reinforced-earth stepped overflow (Fig. 7-3). Another alternative is an overflow system made with
gabions and Reno mattresses (e.g. CHANSON 1995a).
8. Hydraulic design of embankment overflow stepped spillways
8.1 Presentation
The design of embankment overflow stepped spillway is a critical issue. Any single failure of the
spillway system can lead to a total dam failure. The professional community lacks basic design
guidelines and current expertise is empirical.
For the design of an embankment overflow stepped spillway, a number of specific key issues must be
assessed accurately and this includes :
[1] Stepped spillway operation and chute erosion
The stepped chute is designed to dissipate safely some kinetic energy, without damage to the steps. The
spillway flow conditions cannot be calculated as for conventional flat (smooth invert) chutes.
[2] Embankment seepage
Seepage takes place in the embankment for high reservoir water levels. Strong interactions may occur
between the free-surface flow and seepage flow in the embankment, that could cause uplift pressures
leading to the destruction of the spillway, hence of the dam.
[3] Drainage beneath steps
A drainage system beneath the concrete steps is essential to prevent build-up of uplift pressures. Its
purpose is to relieve pore pressure at the interface between the embankment and concrete steps. (Two
stepped block spillways failed in Russia because of inadequate drainage layer (CHANSON 2000b).)
[4] Sidewalls (overtopping, scour)
The chute and crest sidewalls must be designed to prevent any overtopping for all flow rates up to
PMF. The design of chute sidewalls must take into account the flow bulking resulting from the free-
surface aeration. If splashing is acceptable, the training wall height may be sized to contain the
characteristic air-water depth Y90 for all flow rates up to design flows. If the surroundings (e.g.
embankment) are at risk of erosion, the sidewall height must be designed for 1.4*Y90. When the

46
developing spray can lead to fog or ice on surrounding roads or settlements, a greater safety margin
must be considered. Note that the calculations of sidewall heights depend upon the type of flow regime
(nappe, transition, skimming flow regimes).
Further strong secondary currents exist at the connection between the steps and the abutment walls.
These are associated with high risks of scour, and the connections steps/abutment must be reinforced
adequately.
[5] Sidewalls (chute convergence effects)
When the overflow spillway extends across the entire dam crest (e.g. Melton dam, Australia), the
topography of the valley induces a convergence of the overflow. While a slight chute convergence may
not affect the overall flow patterns, a reduction in channel width causes a modification of the discharge
per unit width qw and possibly a change in flow regime. Flow conditions at transition between flow
regime could exhibit some instabilities leading to deflecting nappes and fluctuating hydrodynamic loads
on the steps.
In nappe and skimming flows, sidewall convergence may further cause free-surface instabilities,
including shock waves, flow concentrations, secondary currents and sidewall splashing that may be
unacceptable.
[6] Downstream energy dissipation and scour
At the downstream end of the stepped chute, further energy dissipation takes place beneath the
hydraulic jump or in the plunge pool for high tailwater levels. Turbulent fluctuations (velocity and
pressure) in the hydraulic jump and at the plunge point may cause damage to the chute toe and
sidewalls.
8.2 Discussion
Secondary currents at the connection between steps and (smooth) abutment walls
At the connection between the steps and the abutment walls (8), the differences in flow resistance
between stepped invert and smooth concrete abutment generate transverse velocity gradient. Strong
secondary currents associated with high shear forces develop and the risks of scour are high.
8This is especially important when the abutment is not a vertical concrete wall.

47
Major scour at abutments was observed during a number of flood events above overflow stepped weirs
in Queensland : e.g., Whetstone weir (1953 overflow), Bonshaw weir (1956 failure) (CHANSON
2000b). In a keynote lecture on stepped block spillways, Dr BAKER emphasised that a known
construction weakness is the joint between the chute invert and the sidewalls (BAKER 2000). (At
Brushes Clough stepped spillway (UK), two longitudinal concrete guides were built to facilitate the
installation of the blocks and the connection with the stone-pitched sidewalls.)
Chute convergence
To date, nearly all bibliography on stepped chute hydraulics applies to prismatic rectangular channels.
Literature on converging stepped chutes is rare, but for TALBOT et al. (1997).
In nappe and skimming flows, sidewall convergence may cause shock waves propagating across the
chute and impacting onto the opposite chute walls. At Gold Creek dam stepped spillway (Australia),
significant flow disturbances and sidewall splashing caused by shock waves was observed during a
1996 overflow (CHANSON and WHITMORE 1998). Shock waves cause further flow concentrations
and induce three-dimensional instabilities that may not be acceptable (CHANSON 2001, chap. 9).
Interactions between seepage and free-surface flows
During overflows, seepage takes place in the embankment. It is influenced by the infiltration into the
downstream slope caused by the spillway flow, in addition to the flow through the embankment itself.
Appropriate provision for drainage and evacuation of seepage flow through the steps is required. Drains
are usually installed on the vertical face of the steps (Fig. 7-2, 8-1).
In skimming flows, the seepage that is drained into the step cavity may affect the cavity recirculation
and in turn the turbulent dissipation process. It may lead to a reduction in flow resistance and an
increase of the flow velocity at the downstream of the chute (i.e. at the plunge point, hydraulic jump or
ski jump).
Flow resistance in skimming flows is a form drag mechanism predominantly (RAJARATNAM 1990,
CHANSON et al. 2000). With form drag, fluid injection in the separated region (i.e. the cavity) does
reduce drastically the drag (e.g. WOOD 1964, NAUDASCHER and ROCKWELL 1994). Table 8-1
summarises well-known studies, illustrated in Figure 8-2. A related case is the flow above a porous sill.

48
The writers hypothesise that a similar mechanism may exist in skimming flows above embankment
stepped spillway. Note that this drag reduction mechanism differs and may add to drag reduction
induced by free-surface aeration (see Paragraph 6.3).
Fig. 8-1 - Interactions between seepage flow and cavity recirculation
Figure 8-2 - Drag reduction behind bluff body associated with fluid injection (A) Sketch of WOOD's (1964) experiments

49
(B) Drag coefficient Cd on ventilated wings as a function of the dimensionless cavity length lcav/h which is a function (VERRON and MICHEL 1984)
0.01
0.02
0.03
0.04
0.05
0.06
0.07
0 5 10 15 20
Rectangular wing(aspect ratio 4)
Trapezoidal wing(aspect ratio 3)
Cd
lcav/h
VERRON & MICHEL (1984)
No fluid injection
Downstream energy dissipation in a plunge pool
At the downstream end of the spillway, energy dissipation is usually achieved by (1) a high velocity
water jet taking off from a flip bucket and impinging into a downstream plunge pool acting as a water
cushion (e.g. Sosnovsky farm dam, Fig. 7-2), (2) a standard stilling basin downstream of the spillway
where a hydraulic jump is created to dissipate a large amount of flow energy (e.g. U.S. Bureau of
Reclamation designs), or (3) a plunge pool for high tailwater levels. In the latter case, the stability of
the steps immediately beneath the plunge point (i.e. below tailwater level) is at risk (Fig. 8-3). Potential
scour of the submerged steps is an issue that should be investigated in details with physical modelling.
BAKER (2000) observed major damage to stepped block spillway sections submerged by a hydraulic
jump and a plunge pool. He illustrated his keynote lecture with an audio-visual documentary. YASUDA
and OHTSU (2000) investigated the characteristics in the plunge pool downstream of a stepped chute
as a function of the tailwater level. Although their results did not include efforts on the submerged
steps, they observed some energy dissipation contribution from the submerged steps, suggesting some
loads on the steps. The writers believe that this mode of failure is the worst for embankment overflow
stepped spillways.

50
Table 8-1 - Drag reduction induced by fluid injection behind a bluff body
Reference Flow situations Description
(1) (2) (3) Fluid injection WOOD (1964) Air flow past aerofoil with base
bleed. Drag reduction by fluid injection. Up to 60% drag reduction.
ABDUL-KHADER and RAI (1980)
Open channel flow past bridge piers (0.2 < Fr < 0.65).
Drag reduction with slotted piers. Up to 50% drag reduction.
SURYANARAYANA et al. (1993), SURYANARAYANA and PRABHU (2000)
Wind flow past a sphere. Drag reduction by ventilation of the wake. Up to 60% drag reduction.
Cavity ventilation MICHEL and ROWE (1974) Water flow past hydrofoil wings.
Air ventilation. Drag reduction with air ventilation at downstream end. Up to 83% drag reduction.
VERRON and MICHEL (1984) Water flow past hydrofoil wings (rectangular and trapezoidal). Air ventilation
Drag reduction with air ventilation behind the wings. Up to 65% drag reduction.
Porous bluff body COOK (1990) Wind flow past porous fences. Drag reduction with increasing
porosity : Drag ∝ (1 - C2), C being the porosity.
Fig. 8-3 - Flow patterns at the plunge point

51
9. Conclusion
New experiments were conducted in a large-size stepped chute (1V:2.5H, h = 0.1 m, W = 1 m). Visual
observations demonstrated three types of flow regimes : nappe flow, transition flow and skimming flow.
The transition flow regime was observed for a relatively broad range of flow rates. It was characterised
by a chaotic flow motion, strong splashing and very significant aeration.
Detailed air-water flow measurements were conducted in both transition and skimming flows
immediately downstream of the inception point of free-surface aeration. In skimming flows, a complete
characterisation was developed for the distributions of void fraction, bubble count rate and velocity.
Although the air concentration distribution has the same shape as smooth chute flows, a slightly
different trend was consistently observed, associated with strong droplet ejections. Flow resistance data
are consistent with re-analysed data obtained in large-size laboratory chutes (Fig. 6-2). The re-analysis
of all data highlights three dominant values of Darcy friction factor that are hypothesised to be three
different modes of excitation. Drag reduction caused free-surface aeration was observed (Eq. (6-4), Fig.
6-5). It is believed to be caused by interactions between small entrained bubbles and developing mixing
layers at each step edge.
Transition flows exhibited significantly different air-water flow properties from those observed in
skimming flows. For each experiment, a deflected nappe was observed occasionally (i.e. at one step).
The deflected jet was highly aerated and the associated spray would overtop the 1.25 m high sidewall.
Although the study was limited to one slope and for a short canal, the results highlighted the complexity
of the free-surface aeration down stepped cascades.
For ancient embankments and new earthfill dams, an overflow stepped spillway may be considered as a
main flood release structure. A number of design alternatives exists : concrete protection layer, precast
concrete blocks, timber cribs, gabions. The hydraulic design of such stepped spillways includes a
number of specific aspects which must be taken into account, including seepage beneath the steps,
interactions between seepage and free-surface flows, and downstream energy dissipation in plunge pool
for high tailwater levels. Step stability below the plunge point is probably the worst loading scenario for
high tailwater levels and it must be investigated with a physical model in absence of experimental data.
It is believed that embankment overflow stepped spillways have a number of specific features that must
be considered carefully, and that further experimental works is required to understand the interactions

52
between seepage and free-surface flows.
Acknowledgements
The writers thank Dr John MACINTOSH, Water Solutions, for his detailed review and comments.
They acknowledge the assistance of M. EASTMAN, N. VAN SCHAGEN, and G. ILLIDGE (The
University of Queensland). The first author thanks Professor APELT, Dr MATOS, Professor OHTSU,
Dr ROYET, and Dr YASUDA for helpful discussions and for providing their experimental data.

53
Appendix I - Summary of experimental results
Tableau I-1 - Single-tip conductivity probe data (Series 1)
Qw m3/s Location Y90dc
Cmean (Fab)max*dc
Vc
UwVc
(1) (2) (3) (4) (5) (6) Series 1 0.1819 Step edge 6 0.44 0.15 4.30 2.64 0.1819 Step edge 7 0.52 0.24 7.59 2.55 0.1819 Step edge 8 0.51 0.28 13.38 2.71 0.164 Step edge 6 0.45 0.16 5.24 2.64 0.164 Step edge 7 0.55 0.31 9.79 2.62 0.164 Step edge 8 0.53 0.29 15.45 2.66 0.1467 Step edge 5 0.44 0.13 3.50 2.60 0.1467 Step edge 6 0.49 0.24 8.68 2.69 0.1467 Step edge 7 0.59 0.36 12.96 2.63 0.1467 Step edge 8 0.59 0.34 16.98 2.56 0.1301 Step edge 5 0.44 0.15 3.52 2.68 0.1301 Step edge 6 0.52 0.27 9.48 2.64 0.1301 Step edge 7 0.65 0.42 15.37 2.65 0.1301 Step edge 8 0.60 0.35 18.39 2.56 0.1237 Step edge 5 0.46 0.19 5.30 2.71 0.1237 Step edge 6 0.54 0.32 13.21 2.74 0.1237 Step edge 7 0.69 0.41 15.91 2.48 0.1237 Step edge 8 0.61 0.36 18.57 2.58 0.1142 Step edge 5 0.46 0.22 5.16 2.76 0.1142 Step edge 6 0.56 0.36 13.07 2.79 0.1142 Step edge 7 0.76 0.43 16.37 2.31 0.1142 Step edge 8 0.63 0.36 19.43 2.47 0.103 Step edge 4 0.44 0.14 2.85 2.67 0.103 Step edge 5 0.54 0.28 7.34 2.56 0.103 Step edge 6 0.68 0.46 14.33 2.70 0.103 Step edge 7 0.76 0.48 15.29 2.51 0.103 Step edge 8 0.57 0.34 18.63 2.65 0.099 Step edge 4 0.43 0.13 2.87 2.64 0.099 Step edge 5 0.56 0.33 8.52 2.66 0.099 Step edge 6 0.75 0.52 13.77 2.77 0.099 Step edge 7 0.63 0.35 16.97 2.46 0.099 Step edge 8 0.62 0.43 18.69 2.80 0.0845 Step edge 4 0.49 0.22 4.05 2.63 0.0845 Step edge 5 0.76 0.53 10.04 2.81 0.0845 Step edge 6 0.64 0.44 14.49 2.79 0.0845 Step edge 7 0.69 0.46 15.10 2.68 0.0845 Step edge 8 0.62 0.43 17.68 2.83 0.0799 Step edge 4 0.55 0.30 4.59 2.60 0.0799 Step edge 5 0.85 0.56 10.14 2.65 0.0799 Step edge 6 0.67 0.39 13.61 2.45 0.0799 Step edge 7 0.73 0.44 15.42 2.44 0.0799 Step edge 8 0.65 0.40 16.99 2.53 0.0708 Step edge 3 0.43 0.13 1.79 2.68 0.0708 Step edge 4 0.55 0.38 5.67 2.92 0.0708 Step edge 5 0.62 0.40 10.82 2.69 0.0708 Step edge 6 1.07 (*) 0.68 (*) 11.31 2.94 0.0708 Step edge 7 0.68 0.43 14.43 2.58 0.0708 Step edge 8 0.89 0.57 15.46 2.59

54
0.0665 Step edge 3 0.44 0.15 1.81 2.63 0.0665 Step edge 4 0.66 0.48 4.65 2.89 0.0665 Step edge 5 0.69 0.43 10.19 2.55 0.0665 Step edge 6 1.47 (*) 0.73 (*) 10.26 2.52 0.0665 Step edge 7 0.82 0.48 13.45 2.35 0.0665 Step edge 8 0.85 0.50 14.89 2.37 0.0643 Step edge 3 0.46 0.18 1.97 2.65 0.0643 Step edge 4 0.75 0.52 4.47 2.79 0.0643 Step edge 5 0.74 0.49 9.37 2.65 0.0643 Step edge 6 1.55 (*) 0.77 (*) 9.92 2.79 0.0643 Step edge 7 0.85 0.54 12.51 2.55 0.0643 Step edge 8 0.67 0.44 14.44 2.69 0.058 Step edge 3 0.51 0.24 2.22 2.58 0.058 Step edge 4 0.88 0.60 5.62 2.86 0.058 Step edge 5 0.82 0.52 9.00 2.55 0.058 Step edge 6 1.62 (*) 0.78 (*) 9.81 2.79 0.058 Step edge 7 0.81 0.51 12.06 2.48 0.058 Step edge 8 0.73 0.48 13.51 2.62 0.0519 Step edge 3 0.62 0.38 3.53 2.62 0.0519 Step edge 4 1.08 0.64 6.33 2.58 0.0519 Step edge 5 0.77 0.49 8.88 2.55 0.0519 Step edge 6 1.21 (*) 0.74 (*) 8.49 3.14 0.0519 Step edge 7 0.81 0.49 11.18 2.43 0.0519 Step edge 8 1.00 (*) 0.65 (*) 11.77 2.83 0.046 Step edge 3 0.56 0.36 3.24 2.78 0.046 Step edge 4 0.89 0.59 6.97 2.72 0.046 Step edge 5 0.72 0.48 9.22 2.65 0.046 Step edge 6 1.05 (*) 0.63 (*) 9.06 2.61 0.046 Step edge 7 0.72 0.48 10.14 2.65 0.046 Step edge 8 1.14 (*) 0.68 (*) 9.63 2.77
Notes : Column (2) : the first step edge is located at the downstream end of the broad-crest; Uw = qw/d; (*) deflected nappe.
Tableau I-2 - Double-tip conductivity data (Series 2)
Qw
m3/s
Location Y90dc
Cmean (Fab)max*dc
Vc
UwVc
V90Vc
amean*dc
(1) (2) (3) (4) (5) (6) (7) (8) Series 2 0.1819 Step edge 6 0.51 0.23 7.70 2.55 2.63 3.6 0.1819 between step edges 6 & 7 0.50 0.31 9.92 2.89 2.73 8.1 0.1819 Step edge 7 0.47 0.23 13.60 2.77 2.79 9.1 0.1819 between step edges 7 et 8 0.60 0.40 15.19 2.77 2.73 16.4 0.1819 Step edge 8 0.59 0.38 16.37 2.75 2.85 15.7 0.1142 Step edge 5 0.45 0.26 11.20 2.98 2.84 6.6 0.1142 Step edge 6 0.65 0.50 18.55 3.05 2.86 16.3 0.1142 Step edge 7 0.59 0.43 27.38 2.96 3.00 24.7 0.1142 between step edges 7 et 8 0.64 0.53 21.68 3.32 2.88 26.1 0.1142 Step edge 8 0.54 0.43 29.94 3.23 2.99 29.2 0.058 Step edge 3 0.46 0.20 4.06 2.73 2.65 1.5 0.058 Step edge 4 0.85 0.63 10.43 3.17 2.74 6.7 0.058 Step edge 5 0.78 0.56 13.74 2.91 2.30 13.9 0.058 Step edge 6 1.24 (*) 0.76 (*) 16.45 3.40 2.75 12.1 0.058 Step edge 7 0.79 0.55 19.64 2.86 3.48 17.3

55
0.058 Step edge 8 0.66 0.52 21.13 3.19 3.09 21.7
Notes : Column (2) : the first step edge is located at the downstream end of the broad-crest; Uw = qw/d; (*) deflected nappe; amean : depth-averaged specific interface area.
Appendix II - Modelling cavity ejection processes (by H. CHANSON)
In skimming flows, recirculating vortices develop in the step cavities and they are maintained through
the transmission of shear stress from the mainstream and by unsteady momentum exchanges between
the main stream and cavity flows. At irregular time intervals, some cavity volume flows outwards and
is replaced by fresh fluid (Fig. 3-3). The duration of the cavity ejection (or burst) is relatively short
compared to the average ejection period. The ejections and inflows occur predominantly in the
downstream region of the cavity (9). Several researchers suggested that the initiating mechanisms of the
ejections resides within the fully-developed flow and not in the cavity flow itself, the ejection process
being caused by interactions between low-speed streaks and vorticity structures next to the pseudo-
bottom formed by the step edges (DJENEDI et al. 1994, ELAVARASAN et al. 1995).
An early cavity ejection model
ETHEMBABAOGLU (1978) developed a model of hydrodynamic instability in the free-shear layer.
Vortices form in the shear layer. They are convected downstream, interacting with the downstream edge
of the cavity and inducing disturbances which are in turn transmitted to the origin of the shear layer.
The process generate self-induced disturbances.
The frequency of instability (10) may be estimated analytically. For a triangular cavity, it yields :
Fej * (h*cosα)
V = 0.5 *
i +
14 * sinα * cosα (II-1)
where V is the mainstream velocity, h*cosα is the cavity depth, and i is an integer. For ratios of cavity
length to cavity depth Lcav/ks less than 2, Equation (II-1) was close to ETHEMBABAOGLU's
observations using i = 1 and 2. For greater cavity length ratios, i = 2 and 3 gave better agreement.
9Stepped chute data : Present study. Strip roughness data : DJENEDI et al. (1994), ELAVARASAN et
al. (1995).
10which is basically the frequency of fluid ejections.

56
Energy considerations
Considering a skimming flow, it is hypothesised that all the energy losses occur by viscous dissipation
in the cavity, with some energy exchange between the main flow and the recirculation by irregular fluid
ejections. Considering the flow region located between two adjacent step edges (Fig. II-1), and during
an average ejection period ∆T (11), the continuity equation for the cavity implies : Qout * ∆t = Qin * ∆t = Vej (II-2a)
where Qin and Qout are the inflow and outflow rates respectively, Vej is the volume of ejected fluid, ∆t
is the ejection (12) duration. Dividing by the ejection period ∆T, Equation (II-2) may be rewritten :
Qout * ∆t∆T
= Vej * Fej (II-2b)
where Fej = 1/∆T is the fluid ejection frequency.
At uniform equilibrium, the rate of energy loss between two adjacent step edges equals ρ*Q*h, where ρ
is the fluid density, Q is the flow rate and h is the vertical step height. The energy is dissipated in the
recirculation cavity at a rate ρ*Vej*Fej*∆T/∆t*(V2/(2*g) - Vout2/(2*g)), where Vout is the outflow
velocity, and the inflow velocity is assumed to be equal to the flow velocity V. The energy principle
yields a relationship between the dimensionless fluid ejection frequency and rate of energy loss:
Fej * (h*cosα)
V = 2 * W * h2 * cosα *
∆t∆T
Vej * V2
g*d *
1 - Vout
2
V2
(II-3a)
where W is the chute width. For a wide channel with flat horizontal steps, it becomes :
Fej * (h*cosα)
V = f *
∆t∆T
2 * λ *
1 - Vout
2
V2
Flat horizontal steps (II-3b)
where f is the dimensionless pseudo-bed shear stress, or Darcy friction factor, and λ is the ratio of the
11The calculations are developed for an incompressible flow. Note that ∆T = 1/Fej where Fej is the fluid
ejection frequency.
12A fluid ejection is sometimes called a burst or bursting event.

57
average fluid ejection volume Vej to the total cavity volume.
Discussion
A lower limit of the average ejection frequency is set for Vout/V << 1 and by assuming that the ejection
volume equals the cavity volume. For flat horizontal steps, it yields :
Fej * (h*cosα)
Vmin
= f2 *
∆t∆T
Flat horizontal steps (II-4)
The duration of fluid ejection ∆t must be less than the average ejection period ∆T. Combining with the
continuity equation for the cavity, it yields an upper limit of the average ejection frequency :
Fej * (h*cosα)
Vmax
=
∆t∆T
λ *
1 +
VVout
Flat horizontal steps (II-5)
Equations (II-3), (II-4) and (II-5) are shown in Figure II-2. Calculations were performed for f = 0.2, λ
= 0.5, and ∆T/∆t = 7. (Flow visualisations in stepped chute models (e.g. Present study) suggest a
typical value of λ = 0.5 while visualisations of d-type cavity flows showed a ratio of average ejection
period to ejection duration of about 5.5 to 8 (Table II-1).) Assuming that all energy losses take place by
viscous dissipation in the recirculation cavity, the analytical solution must satisfy :
Fej * (h*cosα)
Vmin
≤ Fej * (h*cosα)
V ≤
Fej * (h*cosα)
Vmax
(II-6)
Using Equations (II-3), (II-4) and (II-5), it yields that the ratio of outflow velocity to inflow velocity is
centered around 0.5 :
12 * ( )1 - 1 - f <
VoutV <
12 * ( )1 + 1 - f (II-7)
A further conditions is f ≤ 1.

58
Fig. II-1 - Sketch of a cavity ejection
Fig. II-2 - Dimensionless average ejection frequency
0
0.02
0.04
0.06
0.08
0.1
0.12
0.14
0 0.2 0.4 0.6 0.8 1
Upper limit
St
Lower limit
Vout/Vin
St = F*ks/V
f = 0.2, Lambda = 0.5, Dt/DT = 0.14
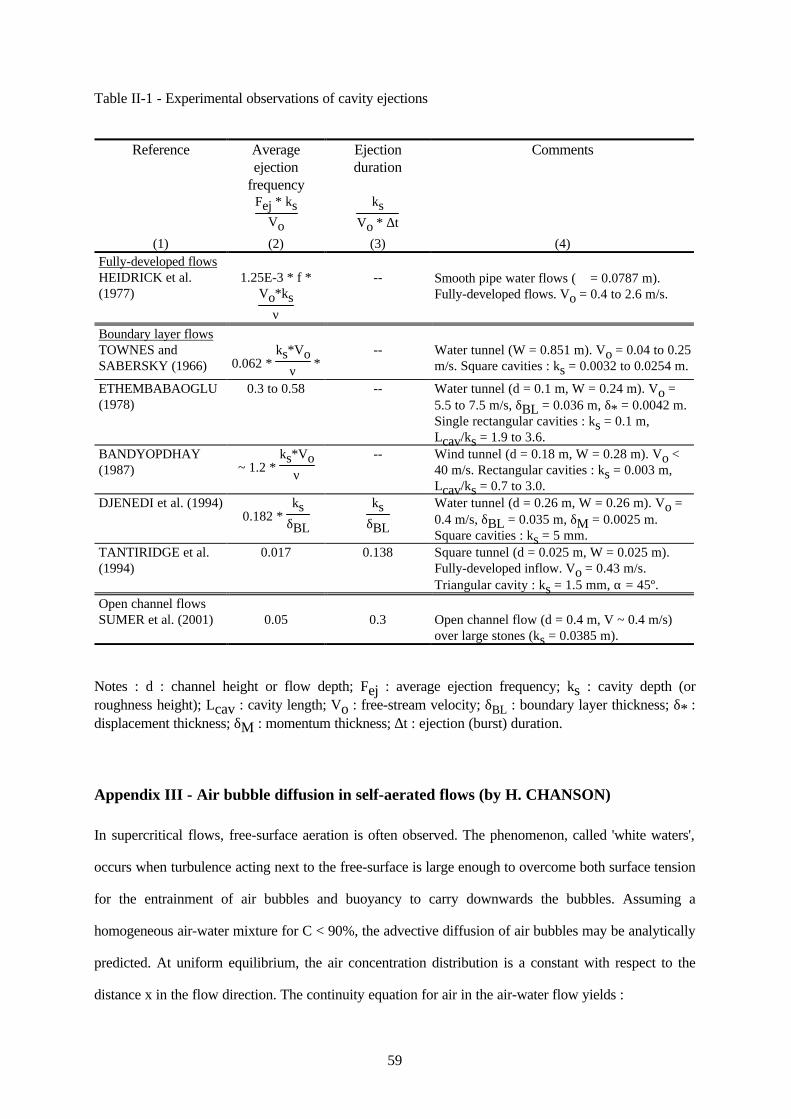
59
Table II-1 - Experimental observations of cavity ejections
Reference Average
ejection frequency
Ejection duration
Comments
Fej * ksVo
ks
Vo * ∆t
(1) (2) (3) (4) Fully-developed flows HEIDRICK et al. (1977)
1.25E-3 * f * Vo*ks
ν
-- Smooth pipe water flows (∅ = 0.0787 m). Fully-developed flows. Vo = 0.4 to 2.6 m/s.
Boundary layer flows TOWNES and SABERSKY (1966) 0.062 *
ks*Voν *
-- Water tunnel (W = 0.851 m). Vo = 0.04 to 0.25 m/s. Square cavities : ks = 0.0032 to 0.0254 m.
ETHEMBABAOGLU (1978)
0.3 to 0.58 -- Water tunnel (d = 0.1 m, W = 0.24 m). Vo = 5.5 to 7.5 m/s, δBL = 0.036 m, δ* = 0.0042 m. Single rectangular cavities : ks = 0.1 m, Lcav/ks = 1.9 to 3.6.
BANDYOPDHAY (1987) ~ 1.2 *
ks*Voν
-- Wind tunnel (d = 0.18 m, W = 0.28 m). Vo < 40 m/s. Rectangular cavities : ks = 0.003 m, Lcav/ks = 0.7 to 3.0.
DJENEDI et al. (1994) 0.182 *
ksδBL
ks
δBL
Water tunnel (d = 0.26 m, W = 0.26 m). Vo = 0.4 m/s, δBL = 0.035 m, δM = 0.0025 m. Square cavities : ks = 5 mm.
TANTIRIDGE et al. (1994)
0.017 0.138 Square tunnel (d = 0.025 m, W = 0.025 m). Fully-developed inflow. Vo = 0.43 m/s. Triangular cavity : ks = 1.5 mm, α = 45º.
Open channel flows SUMER et al. (2001) 0.05 0.3 Open channel flow (d = 0.4 m, V ~ 0.4 m/s)
over large stones (ks = 0.0385 m).
Notes : d : channel height or flow depth; Fej : average ejection frequency; ks : cavity depth (or roughness height); Lcav : cavity length; Vo : free-stream velocity; δBL : boundary layer thickness; δ* : displacement thickness; δM : momentum thickness; ∆t : ejection (burst) duration.
Appendix III - Air bubble diffusion in self-aerated flows (by H. CHANSON)
In supercritical flows, free-surface aeration is often observed. The phenomenon, called 'white waters',
occurs when turbulence acting next to the free-surface is large enough to overcome both surface tension
for the entrainment of air bubbles and buoyancy to carry downwards the bubbles. Assuming a
homogeneous air-water mixture for C < 90%, the advective diffusion of air bubbles may be analytically
predicted. At uniform equilibrium, the air concentration distribution is a constant with respect to the
distance x in the flow direction. The continuity equation for air in the air-water flow yields :

60
∂∂y
Dt *
∂ C∂y
= cosα * ∂∂y
(ur * C) (III-1)
where Dt is the turbulent diffusivity, ur is the bubble rise velocity, α is the channel slope and y is
measured perpendicular to the mean flow direction. Tche bubble rise velocity in a fluid of density
ρw*(1-C) equals :
ur2 = [(ur)Hyd]
2 * (1 - C) (III-2)
where (ur)Hyd is the rise velocity in hydrostatic pressure gradient (CHANSON 1995b,1997b). A first
integration of the continuity equation for air in the equilibrium flow region leads to :
∂ C∂y'
= 1D' * C * 1 - C (III-3)
where y' = y/Y90 and D' = Dt/(ur)Hyd*cosα*Y90) is a dimensionless turbulent diffusivity. D' is the ratio
of the air bubble diffusion coefficient to the rise velocity component normal to the flow direction times
the characteristic transverse dimension of the shear flow.
Assuming a homogeneous turbulence across the flow (i.e. D' constant), it yields :
C = 1 - tanh2
K' -
y'2 * D' (III-4)
where tanh is the hyperbolic tangent function and K' a dimensionless integration constant (CHANSON
1995b,1997b). A relationship between D' and K' is deduced for C = 0.9 for y' = 1 :
K' = K* + 1
2 * D' (III-5)
where K* = tanh-1( 0.1) = 0.32745015... The diffusivity and the mean air content Cmean defined in
terms of Y90 are related by :
Cmean = 2 * D' *
tanh
K* +
12 * D' - tanh(K*) (III-6)
Advanced void fraction distribution models may be developed assuming a non constant diffusivity.
Results are shown in Table III-1. Columns (1) and (2) show the analytical solutions of the air
concentration and air bubble diffusivity distributions respectively. Column (3) lists successful
applications of the solution, the reference data being listed below.

61
Table III-1 - Analytical solutions of Equation (III-3)
C D' Domain of applications
Remarks
(1) (2) (3) (4)
0.9 * y
Y90
2
0.92 * C2 * 1 - C Transition
flow (a) Cmean = 0.60.
K'" *
1 - exp
- λ *
yY90
C * 1 - Cλ * (K'" - C)
Transition
flow (a) K'" =
0.91 - exp(-λ)
Cmean = K'" - 0.9λ
Note : Cmean > 0.45
1 - tanh2
K' - y/Y902 * D'
Constant Self-aerated flow,
skimming flow (a)
CHANSON (1995b,1997b)
K' = K* + 1
2 * D'
K* = tanh-1( 0.1) = 0.32745015... Cmean = 2 * D' *
tanh
K* +
12 * D' - tanh(K*)
1 - tanh2
K' - (y/Y90)2
4 * λ
λy/Y90
Self-aerated
flow K' = K* + 1
4 * λ
K* = tanh-1( 0.1) = 0.32745015... Cmean =
1.7637E-3 + 0.8643*λ1.69
0.09547 + λ1.69
1 - tanh2
K' - (y/Y90)n+1
2 * (n + 1) * λ
λ
(y/Y90)n
Self-aerated flow K' = K* +
12 * (n+1) * λ
K* = tanh-1( 0.1) = 0.32745015... 1 -
tanh2
K' - y/Y902 * Do
+
y
Y90-13
3
3 * Do
Do
1 - 2*
y
Y90-13
2 Skimming flow (a)
K' = K* + 1
2 * Do -
881 * Do
K* = tanh-1( 0.1) = 0.32745015... Cmean =
0.7622*(1.0434 - exp(-3.614*Do))
Note : (a) measured at step edges. REFERENCE DATA : (1) Smooth-invert prototype: CAIN (1978). (2) Smooth invert laboratory: STRAUB and ANDERSON (1956), XI (1988). (3) Skimming flow (laboratory): RUFF and FRIZELL (1984), TOZZI et al. (1998), Present study. (4) Transition flow (laboratory): Present study.
Appendix IV - Velocity measurements and cross-correlation techniques for dual-tip
probe measurements in gas-liquid flows
In turbulent gas-liquid flows, a velocity measurement technique is based upon the successive detection

62
of bubbles/droplets by two sensors : i.e., double tip optical and resistivity probes (Fig. IV-1). The
technique assumes that {1} the probe sensors are aligned along a streamline, {2} the bubble/droplet
characteristics are little affected by the leading tip, and {3} the bubble/impact impact on the trailing tip
is similar to that on the leading tip. In highly turbulent gas-liquid flows, the successive detection of a
bubble by each probe sensor is highly improbable, and it is common to use a cross-correlation
technique (e.g. CROWE et al. 1998, pp. 309-318). The time-averaged air-water velocity is defined as:
V = ∆xT (IV-1)
where ∆x is the distance between probe sensors and T is the travel time for which the cross-correlation
function is maximum : i.e., R(T) = Rmax where R is the normalised cross-correlation function and
Rmax is the maximum cross-correlation value (Fig. IV-1).
The shape of the cross-correlation function provides a further information on the turbulent velocity
fluctuations (Fig. IV-2). Flat cross-correlation functions are associated with large velocity fluctuations
around the mean and large turbulence intensity Tu = u'/V, where u' is the standard deviation of the
turbulent velocity fluctuations. Thin high cross-correlation curves are characteristics of small turbulent
velocity fluctuations. The information must be corrected to account for the intrinsic noise of the leading
probe signal and the turbulence intensity is related to the broadening of the cross-correlation function
compared to the autocorrelation function (Fig. IV-1).
The definition of the standard deviation of the velocity leads to :
u'2 = V2
N ∑i=1
N
1
t2 * (t - T)2 (IV-2)
where V is the mean velocity, N is the number of samples and t is the bubble travel time data. With an
infinitely large number of data points N, an extension of the mean value theorem for definite integrals
may be used as the functions 1/t2 and (t-T)2 are positive and continuous over the interval [i = 1, N]
(SPIEGEL 1974). It implies that there exists at least one characteristic bubble travel time t' satisfying
t1 ≤ t' ≤ tN such that :
u'
V
2 =
1N *
1
t'2 * ∑
i=1
N
(t - T)2 (IV-3)
That is, the standard deviation of the velocity is proportional to the standard deviation of the bubble

63
travel time:
u'V =
σtt' (IV-4)
Assuming that the successive detections of bubbles by the probe sensors is a true random process (13),
the cross-correlation function would be a Gaussian distribution :
R(t) = Rmax * exp
-
t - T
σT
2 (IV-5)
where σT is the standard deviation of the cross-correlation function. Defining ∆T as a time scale
satisfying : R(T+∆T) = Rmax/2, the standard deviation equals : σT = ∆T/1.175 for a true Gaussian
distribution. The standard deviation of the bubble travel time σt is a function of both the standard
deviations of the cross-correlation and autocorrelation functions :
σt = ∆T2 - ∆t2
1.175 (IV-6)
where ∆t is the characteristic time for which the normalised autocorrelation function equals 0.5.
Assuming that t' ~ T and that the bubble/droplet travel distance is a constant ∆x, Equation (IV-4)
implies that the turbulence intensity u'/V equals :
Tu = u'V ≈ 0.851 *
∆T2 - ∆t2
T = Tu' (IV-7)
Tu' is a dimensionless velocity scale that is characteristic of the turbulent velocity fluctuations over the
distance ∆x separating the probe sensors. Although Tu' is not strictly equal to the dimensionless
turbulent velocity fluctuation Tu = u'/V, the distributions of modified turbulence intensity Tu' provide
some qualitative information on the turbulent velocity field in gas-liquid flows.
KIPPHAN (1977) developed a slightly different reasoning for two-phase mixtures such as pneumatic
conveying. He obtained a result of similar form :
u'
Uw =
σT2 - σ't
2
T2 (IV-8)
where Uw is the mean flow velocity, T is the mean particle travel time (e.g. on the conveyor, in the
pipe) and σ't is the standard deviation of the autocorrelation function. It is believed however that
13For example, affected only by random advective dispersion of the bubbles and random velocity
fluctuations over the distance separating the probe sensors.

64
KIPPHAN's result (Eq. (IV-8)) is an approximation (14).
Discussion
Equation (IV-7) has a wider range of application than Equation (IV-8) because it is applicable to
turbulent shear flows (e.g. boundary layer flow). The modified turbulence intensity Tu' (Eq. (IV-7))
may provide both qualitative and quantitative information on the turbulent velocity field in gas-liquid
flows.
The first writer's experience suggests that the standard deviation of the bubble travel time is also a
function of the distance ∆x between sensors. For a given bubbly flow configuration and probe sensors,
the cross-correlation function broaden and the maximum cross-correlation decreases with increasing
distance ∆x. KIPPHAN (1977) recommended an optimum distance ∆x between sensor equal to :
(∆x)opt
δx ≈
0.35Tu (IV-9)
where δx is the characteristic sensor size in the flow direction. Equation (IV-9) does not account
however for the characteristic size of the two-phase flow structure. Table IV-1 summarises successful
designs of dual-tip resistivity probes. For these designs, the "optimum" probe spacing satisfies :
(∆x)opt
δx = 33.5 * Vmax
0.27 (IV-10)
where Vmax is the maximum bubbly flow velocity in m/s.
The result is further affected by an offset between the leading and trailing tips of the probe. For
example, CHANSON (1995c,1997b) introduced successfully such an offset to reduce the effects of
separation and wake downstream of the leading tip, reported by SENE (1984) and CHANSON (1988).
14The assumptions of t' ~ T and Equation (IV-7) are not strictly correct.

65
Table IV-1 - Characteristic dimensions of successful dual-tip resistivity probe designs
Reference ∆x δx ∆x/δx V Remarques
m m m/s (1) (2) (3) (4) (5) (6)
Resistivity probes SERIZAWA et al. (1975) 0.005 2.0E-4 25 0.5 to Bubbly pipe flows. CAIN (1978) 0.1016 2.0E-3 50.8 15.6 to
18.5 Prototype spillway flows (Aviemore, NZ).
LEWIS and DAVIDSON (1983)
0.0015 5.0E-4 3 0.17 to 0.68
Bubble column flows.
CHANSON (1988) 0.01 3.0E-4 33.3 7 to 17 Laboratory spillway flows BEHNIA and GILLESPIE (1991)
0.00531 5E-4 10.6 up to 6 Bubbly pipe flows.
REVANKAR and ISHII (1992) 0.004 1.2E-4 33.3 0.1 to 1 Bubbly pipe flows. LIU and BANKOFF (1993) 0.005 1.0E-4 50 0.4 to 1.4 Bubbly pipe flows. CHANSON (1995c,1997b) 0.008 5.0E-5 160 1 to 9 Laboratory experiments : open
channel flows, stepped cascade flows, plunging jet flows, water jets discharging into air.
Fibre optic probes CHABOT et al. (1992) 0.004 to
0.009 1E-3 4 to 9 0.5 Bubble column flows.
Fig. IV-1 - Sketch of a cross-correlation function and dual-tip probe

66
Fig. IV-2 - Examples of autocorrelation and cross-correlation functions (Run Q23)
0
0.2
0.4
0.6
0.8
1
0 0.001 0.002 0.003 0.004 0.005 0.006
Rxx (leading tip)
Ryy (trailing tip)
Rxy
Run Q23, ST8_03, C = 0.038, V = 2.7 m/s
t (s)
R
Autocorrelation
Cross-correlation
67
References
ABDUL-KHADER, M.H., and RAI, S.P. (1980). "A Study of Channel obstructions with a
Longitudinal Slot." Proc. 7th Australasian Hydraulics and Fluid Mechanics Conf., IEAust.,
Brisbane, Australia, pp. 175-178.
ACKERS, P., WHITE, W.R., PERKINS, J.A., and HARRISON, A.J.M. (1978). "Weirs and Flumes
for Flow Measurement." John Wiley, Chichester, UK, 327 pages.
ANWAR, H.O. (1994). "Self-Aerated Flows on Chutes and Spillways - Discussion." Jl of Hyd. Engrg.,
ASCE, Vol. 120, No. 6, pp. 778-779.
AZAIEZ, J. (2000). "Reduction of Free Shear Flows Instabiity: Effects of Polymer versus Fibre
Additives." Jl of Non-Newtonian Fluid Mechanics, Vol. 91, pp. 233-254.
BAKER, R. (2000). "The CIRIA Guide for the Design of Stepped-Block Spillways." Intl Workshop on
Hydraulics of Stepped Spillways, Zürich, Switzerland, H.E. MINOR & W.H. HAGER Editors,
Balkema Publ., pp. 155-161.
BANDYOPADHYAT, P.R. (1987). "Rough-Wall Turbulent Boundary Layers in the Transition
Regime." Jl of Fluid Mech., Vol. 180, pp. 231-266.
BEHNIA, M., and GILLESPIE, S.J. (1991). "Void Fraction Measurement by a Computerized Double-
Point Resistivity Probe." Flow Meas. Instrum., Vol. 2, oct., pp. 243-247.
BOES, R.M. (1999). "Physical Model Study on Two-Phase Cascade Flow." Proc. 28th IAHR
Congress, Graz, Austria, Session S1, 6 pages (CD-ROM).
BOES, R.M. (2000). "Zweiphasenstroömung und Energieumsetzung auf Grosskaskaden." Ph.D. thesis,
VAW-ETH, Zürich, Switzerland.
BOS, M.G. (1976). "Discharge Measurement Structures." Publication No. 161, Delft Hydraulic
Laboratory, Delft, The Netherlands (also Publication No. 20, ILRI, Wageningen, The Netherlands).
CAIN, P. (1978). "Measurements within Self-Aerated Flow on a Large Spillway." Ph.D. Thesis, Ref.
78-18, Dept. of Civil Engrg., Univ. of Canterbury, Christchurch, New Zealand.
CHABOT, J., LEE, S.L.P., SORIA, A., and LASA, H.I. de (1992). "Interaction between Bubbles and
Fibre Optic Probes in a Bubble Column." Can. Jl of Chem. Eng., Vol. 70, Feb., pp. 61-68.
CHAMANI, M.R. (2000). "Air inception in Skimming Flow regime over Stepped Spillways." Intl
Workshop on Hydraulics of Stepped Spillways, Zürich, Switzerland, H.E. MINOR & W.H.

68
HAGER Editors, Balkema Publ., pp. 61-67.
CHAMANI, M.R., and RAJARATNAM, N. (1999). "Characteristics of Skimming Flow over Stepped
Spillways." Jl of Hyd. Engrg., ASCE, Vol. 125, No. 4, pp. 361-368.
CHANSON, H. (1988). "A Study of Air Entrainment and Aeration Devices on a Spillway Model."
Ph.D. thesis, Ref. 88-8, Dept. of Civil Engrg., University of Canterbury, New Zealand (ISSN 0110-
3326).
CHANSON, H. (1993a). "Stepped Spillway Flows and Air Entrainment." Can. Jl of Civil Eng., Vol.
20, No. 3, June, pp. 422-435.
CHANSON, H. (1993b). "Self-Aerated Flows on Chutes and Spillways." Jl of Hyd. Engrg., ASCE,
Vol. 119, No. 2, pp. 220-243. Discussion : Vol. 120, No. 6, pp. 778-782.
CHANSON, H. (1994) "Drag Reduction in Open Channel Flow by Aeration and Suspended Load." Jl
of Hyd. Res., IAHR, Vol. 32, No. 1, pp. 87-101.
CHANSON, H. (1995a). "Hydraulic Design of Stepped Cascades, Channels, Weirs and Spillways."
Pergamon, Oxford, UK, Jan., 292 pages.
CHANSON, H. (1995b). "Air Bubble Diffusion in Supercritical Open Channel Flow." Proc. 12th
Australasian Fluid Mechanics Conference AFMC, Sydney, Australia, R.W. BILGER Ed., Vol. 2,
pp. 707-710.
CHANSON, H. (1995c). "Air Bubble Entrainment in Free-surface Turbulent Flows. Experimental
Investigations." Report CH46/95, Dept. of Civil Engineering, University of Queensland, Australia,
June, 368 pages.
CHANSON, H. (1996). "Prediction of the Transition Nappe/Skimming Flow on a Stepped Channel." Jl
of Hyd. Res., IAHR, Vol. 34, No. 3, pp. 421-429.
CHANSON, H. (1997a). "A Short History of Stepped Cascades in Australia." ANCOLD Bulletin, No.
106, Aug., pp. 101-111.
CHANSON, H. (1997b). "Air Bubble Entrainment in Free-Surface Turbulent Shear Flows." Academic
Press, London, UK, 401 pages.
CHANSON, H. (1997c). "Measuring Air-Water Interface Area in Supercritical Open Channel Flow."
Water Res., IAWPRC, Vol. 31, No. 6, pp. 1414-1420.
CHANSON, H. (1999a). "Turbulent Open-Channel Flows : Drop-Generation and Self-Aeration.

69
Discussion." Jl of Hyd. Engrg., ASCE, Vol. 125, No. 6, pp. 668-670.
CHANSON, H. (1999b). "The Hydraulics of Open Channel Flows : An Introduction." Butterworth-
Heinemann, Oxford, UK, 512 pages. (Reprinted in 2001)
CHANSON, H. (2000). "Forum article. Hydraulics of Stepped Spillways: Current Status." Jl of Hyd.
Engrg., ASCE, Vol. 126, No. 9, pp. 636-637.
CHANSON, H. (2000b). "A Review of Accidents and Failures of Stepped Spillways and Weirs." Proc.
Instn Civ. Engrs Water and Maritime Engrg, UK, Vol. 142, Dec., pp. 177-188.
CHANSON, H. (2001). "The Hydraulics of Stepped Chutes and Spillways." Balkema Publ.,
Rotterdam, The Netherlands.
CHANSON, H., and BRATTBERG, T. (1998). "Air Entrainment by Two-Dimensional Plunging Jets :
the Impingement Region and the Very-Near Flow Field." Proc. 1998 ASME Fluids Eng. Conf.,
FEDSM'98, Washington DC, USA, June 21-25, Paper FEDSM98-4806, 8 pages (CD-ROM).
CHANSON, H., and TOOMBES, L. (1997). "Flow Aeration at Stepped Cascades." Research Report
No. CE155, Dept. of Civil Engineering, University of Queensland, Australia, June, 110 pages.
CHANSON, H., and TOOMBES, L. (2000). "Stream Reaeration in Nonuniform Flow:
Macroroughness Enhancement." Jl of Hyd. Engrg., ASCE, Vol. 126, No. 3, pp. 222-224.
CHANSON, H., YASUDA, Y., and OHTSU, I. (2000). "Flow Resistance in Skimming Flow : a
Critical Review." Intl Workshop on Hydraulics of Stepped Spillways, Zürich, Switzerland, H.E.
MINOR & W.H. HAGER Editors, Balkema Publ., pp. 95-102.
CHANSON, H., and WHITMORE, R.L. (1998). "Gold Creek Dam and its Unusual Waste Waterway
(1890-1997) : Design, Operation, Maintenance." Can. Jl of Civil Eng., Vol. 25, No. 4, Aug., pp.
755-768 & Front Cover.
COOK, N.J. (1990). "The Designer's Guide to Wind Loading of Building Structures. Part 2 : Static
Structures." Building Research Establishment & Butterworths, London, UK, 586 pages.
CROWE, C., SOMMERFIELD, M., and TSUJI, Y. (1998). "Multiphase Flows with Droplets and
Particles." CRC Press, Boca Raton, USA, 471 pages.
DJENEDI, L, ANSELMET, F., and ANTONIA, R.A. (1994). "LDA Measurements in a Turbulent
Boundary Layer over a D-Type Rough Wall." Experiments in Fluids, Vol. 16, pp. 323-329.
ELAVARASAN, R., PEARSON, B.R., and ANTONIA, R.E. (1995). "Visualization of Near Wall

70
Region in a Turbulent Boundary Layer over Transverse Square Cavities with Different Spacing."
Proc. 12th Australasian Fluid Mech. Conf. AFMC, Sydney, Australia, Vol. 1, pp. 485-488.
ETHEMBABAOGLU (1978). "Some Characteristics of Unstable Flow Past Slots." Jl of Hyd. Div.,
ASCE, Vol. 104, No. HY5, pp. 649-666.
FRIZELL, K.H. (1992). "Hydraulics of Stepped Spillways for RCC Dams and Dam Rehabilitations. "
Proc. 3rd Specialty Conf. on Roller Compacted Concrete, ASCE, San Diego CA, USA, pp. 423-
439.
HAUGEN, H.L., and DHANAK, A.M. (1966). "Momentum Transfer in Turbulent Separated Flow
past a Rectangular Cavity." Jl of Applied Mech., Trans. ASME, Sept., pp. 641-464.
HEIDRICK, T.R., BANERJEE, S., and AZAD, R.S. (1977). "Experiments on the Structure of
Turbulence in Fully Developed Pipe Flow. Part 2. A Statistical Procedure for Identifying 'Bursts' in
the Wall Layers and some Characteristics of Flow during Bursting Periods." Jl of Fluid Mech., Vol.
82, Pt 4, pp. 705-723.
HORNER, M.W. (1969). "An Analysis of Flow on Cascades of Steps." Ph.D. thesis, Univ. of
Birmingham, UK, May, 357 pages.
KELEN, N. (1933). "Gewichtsstaumauern und Massive Wehre." ('Gravity Dams and Large Weirs.')
Verlag von Julius Springer, Berlin, Germany (in German).
KIPPHAN, H. (1977). "Bestimmung von Tranportkenngrößen bei Mehrphasenströmungen mit Hilfe
Chemie Ingenieur Technik, Vol. 49, No. 9, pp. 695-707 (in German).
LAALI, A.R., and MICHEL, J.M. (1984). "Air Entrainment in Ventilated Cavities : Case of the Fully
Developed 'Half- Cavity'." Jl of Fluids Eng., Trans. ASME, Sept., Vol. 106, p.319.
LEWIS, D.A., and DAVIDSON, J.F. (1983). "Bubble Sizes Produced by Shear and Turbulence in a
Bubble Column." Chem. Eng. Sc., Vol. 38, No. 1, pp. 161-167.
LIU, T.J., and BANKOFF, S.G. (1993). "Structure of Air-water Bubbly Flow in a Vertical Pipe - II.
Void Fraction, Bubble Velocity and Bubble Size Distribution." Intl Jl of Heat and Mass Transfer,
Vol. 36, No. 4, pp. 1061-1072.
MATOS, J., SÁNCHEZ, M., QUINTELA, A., and DOLZ, J. (1999). "Characteristic Depth and
Pressure Profiles in Skimming Flow over Stepped Spillways." Proc. 28th IAHR Congress, Graz,
Austria, Session B14, 6 pages.

71
MATOS, J. (2000). "Hydraulic Design of Stepped Spillways over RCC Dams." Intl Workshop on
Hydraulics of Stepped Spillways, Zürich, Switzerland, H.E. MINOR & W.H. HAGER Editors,
Balkema Publ., pp. 187-194.
MICHEL, J.M. (1984). "Some Features of Water Flows with Ventilated Cavities." Jl of Fluids Eng.,
Trans. ASME, Sept., Vol. 106, p.319.
MICHEL, J.M., and ROWE, A. (1974). "Profils Minces Supercavitants à Arrière Tronqué." Jl La
Houille Blanche, Bo. 3, pp. 1-43.
NAUDASCHER, E. (1967). "From Flow Instability to Flow-Induced Excitation." Jl of Hyd. Div.,
Proc. ASCE, Vol. 93, No. HY4, pp. 15-40.
NAUDASCHER, E., and ROCKWELL, D. (1994). "Flow-Induced Vibrations. An Engineering
Guide." IAHR Hydraulic Structures Design Manual No. 7, Hydraulic Design Considerations,
Balkema Publ., Rotterdam, The Netherlands, 413 pages.
OHTSU, I., and YASUDA, Y. (1997). "Characteristics of Flow Conditions on Stepped Channels."
Proc. 27th IAHR Biennal Congress, San Francisco, USA, Theme D, pp. 583-588.
OHTSU, I, YASUDA, Y., and TAKAHASHI, M. (2000). "Characteristics of Skimming Flow over
Stepped Spillways. Discussion." Jl of Hyd. Engrg., ASCE, Vol. 126, No. 11, pp. 869-871.
OLIVIER, H. (1967). "Through and Overflow Rockfill Dams - New Design Techniques." Proc. Instn.
Civil Eng., March, 36, pp. 433-471. Discussion, 36, pp. 855-888.
RAJARATNAM, N. (1990). "Skimming Flow in Stepped Spillways." Jl of Hyd. Engrg., ASCE, Vol.
116, No. 4, pp. 587-591. Discussion : Vol. 118, No. 1, pp. 111-114.
REVANKAR, S.T., and ISHII, M. (1992). "Local Interfacial Area Measurement in Bubbly Flow." Intl
Jl of Multiphase Flow, Vol. 35, No. 4, pp. 913-925.
RIEDIGER, S. (1989). "Influence of Drag Reducing Additives on a Plane Mixing Layer." Proc. 4th
Intl Conf. on Drag Reduction, Davos, Switzerland, Ellis Horwood Publ., Chichester, UK, No. 10.4,
pp. 303-310.
ROUSE, H. (1937). "Modern Conceptions of the Mechanics of Turbulence." Transactions, ASCE,
Vol. 102, pp. 463-543.
RUFF, J.F., and FRIZELL, K.H. (1994). "Air Concentration Measurements in Highly-Turbulent Flow
on a Steeply-Sloping Chute." Proc. Hydraulic Engineering Conf., ASCE, Buffalo, USA, Vol. 2,

72
pp. 999-1003.
SCHLICHTING, H. (1979). "Boundary Layer Theory." McGraw-Hill, New York, USA, 7th edition.
SCHUYLER, J.D. (1909). "Reservoirs for Irrigation, Water-Power and Domestic Water Supply." John
Wiley & sons, 2nd edition, New York, USA.
SENE, K.J. (1984). "Aspects of Bubbly Two-Phase Flow." Ph.D. thesis, Trinity College, Cambridge,
UK, Dec..
SERIZAWA, A., KATAOKA, I., and MICHIYOSHI, I. (1975). "Turbulence Structure of Air-Water
Bubbly Flows - I. Measuring Techniques." Intl Jl Multiphase Flow, Vol. 2, No. 3, pp. 221-233
SHVAINSHTEIN, A.M. (1999). "Stepped Spillways and Energy Dissipation." Gidrotekhnicheskoe
Stroitel'stvo, No. 5, pp. 15-21 (in Russian). (Also Hydrotechnical Construction, Vol. 3, No. 5,
1999, pp. 275-282.)
SILBERMAN, E., and SONG, C.S. (1961). "Instability of Ventilated Cavities." Jl of Ship Res., Vol. 5,
No. 1, pp. 13-33.
SPIEGEL, M.R. (1974). "Mathematical Handbook of Formulas and Tables." McGraw-Hill Inc., New
York, USA.
STRAUB, L.G., and ANDERSON, A.G. (1958). "Experiments on Self-Aerated Flow in Open
Channels." Jl of Hyd. Div., Proc. ASCE, Vol. 84, No. HY7, paper 1890, pp. 1890-1 to 1890-35.
SUMER, B.M., COKGOR, S., and FREDS∅E, J. (2001). "Suction Removal of Sediment from
between Armor Blocks." Jl of Hyd. Engrg., ASCE, Vo. 127, No. 4, pp. 293-306.
SURYANARAYANA, G.K., PAUER, H., and MEIER, G.E.A. (1993). "Bluff-Body Drag Reduction
by Passive Ventilation." Exp. in Fluids, Vol. 16, pp. 73-81.
SURYANARAYANA, G.K., and PRABHU, A. (2000). "Effect of natural ventilation on the boundary
layer separation and near-wake vortex shedding characteristics of a sphere." Exp. in Fluids, Vol. 19,
No. 6, pp. 582-591.
TALBOT, J.R., ROBINSON, K.M., and KADAVY, P.E. (1997). "Hydrauic Model Study of a Roller
Compacted Concrete Stepped Spillway with Converging Chute Walls." Proc. Association of State
Dam Safety Officials Annual Conf., Pittsburg PA, USA, 10 pages.
TANTIRIGE, S.C., IRIBARNE, A.P., OJHAS, M., and TRASS, O. (1994). "The Turbulent Boundary
Layer over Single V-shaped Cavities." Intl Jl Heat Mass Transfer, Vol. 37, pp. 2261-2271.

73
TOOMBES, L., and CHANSON, H. (2000). "Air-Water Flow and Gas Transfer at Aeration Cascades:
a Comparative Study of Smooth and Stepped Chutes." Intl Workshop on Hydraulics of Stepped
Spillways, Zürich, Switzerland, H.E. MINOR & W.H. HAGER Editors, Balkema Publ., pp. 77-84.
TOWNES, H.W., and SABERSKY, R.H. (1966). "Experiments on the Flow over a Rough Surface."
Intl Jl of Heat and Mass Transfer, Vol. 9, pp. 729-738.
TOZZI, M.J. (1992). "Caracterização/Comportamento de Escoamentos em Vertedouros com
Paramento em Degraus." ('Hydraulics of Stepped Spillways.') Ph.D. thesis, University of Sao Paulo,
Brazil (in Portuguese).
TOZZI, M., TANIGUCHI, E., and OTA, J. (1998). "Air Concentration in Flows over Stepped
Spillways." Proc. 1998 ASME Fluids Eng. Conf., FEDSM'98, Washington DC, USA, June 21-25,
Paper FEDSM98-5053, 7 pages (CD-ROM).
TURNBULL, J.D., and McKAY, G.R. (1974). "The Design and Construction of Chinchilla Weir -
Condamine River Queensland." Proc. 5th Austalasian Conf. on Hydraulics and Fluid Mechanics,
Christchuch, New Zealand, Vol. II, pp. 1-8.
VERRON, J., and MICHEL, J.M. (1984). "Base-vented Hydrofoils of Finite Span under a Free
Surface : an Experimental Investigation." Jl of Ship Res., Vol. 28, No. 2, pp. 90-106.
WEGMANN, E. (1907). "The Design of the New Croton Dam." Transactions, ASCE, Vol. LXVIII,
No. 1047, pp. 398-457.
WEGMANN, E. (1911). "The Design and Construction of Dams." John Wiley & Sons, New York,
USA, 6th edition.
WOOD, C.J. (1964). "The Effect of Base Bleed on periodic Wake." Jl Roy. Aeronautical Soc., Vol.
68, pp. 477-482.
WOOD, I.R. (1983). "Uniform Region of Self-Aerated Flow." Jl Hyd. Eng., ASCE, Vol. 109, No. 3,
pp. 447-461.
WOOD, I.R. (1985). "Air Water Flows." Proc. 21st IAHR Congress, Melbourne, Australia, Keynote
address, pp. 18-29.
WOOD, I.R. (1991). "Air Entrainment in Free-Surface Flows." IAHR Hydraulic Structures Design
Manual No. 4, Hydraulic Design Considerations, Balkema Publ., Rotterdam, The Netherlands, 149
pages.

74
XI, Ruze (1988). "Characteristics of Self-Aerated Flow on Steep Chutes." Proc. Intl Symp. on
Hydraulics for High Dams, IAHR, Beijing, China, pp. 68-75.
YASUDA, Y., and OHTSU, I. (1999). "Flow Resistance of Skimming Flow in Stepped Channels."
Proc. 28th IAHR Congress, Graz, Austria, Session B14, 6 pages (CD-ROM).
YASUDA, Y., and OHTSU, I. (2000). "Characteristics of Plunging Flows in Stepped Channel Chutes."
Intl Workshop on Hydraulics of Stepped Spillways, Zürich, Switzerland, H.E. MINOR & W.H.
HAGER Editors, Balkema Publ., pp. 147-152.
Internet Resources Overflow embankment stepped spillways. Earth dam spillways with precast concrete blocks
http://www.uq.edu.au/~e2hchans/over_st.html
The Minimum Energy Loss (MEL) weir design. An overflow earthfill embankment dam
http://www.uq.edu.au/~e2hchans/mel_weir.html
Self-aeration on chute and stepped spillways - Air entrainment and flow aeration in open channel flows
http://www.uq.edu.au/~e2hchans/self_aer.html
Timber Crib Weirs in Queensland, Australia http://www.uq.edu.au/~e2hchans/tim_weir.html
Current expertise and experience on stepped channel flows
http://www.uq.edu.au/~e2hchans/dpri/topic_2.html
The bibliographic reference of the present report is :
CHANSON, H., and TOOMBES, L. (2001). "Experimental Investigations of Air Entrainment in
Transition and Skimming Flows down a Stepped Chute. Application to Embankment Overflow
Stepped Spillways." Research Report No. CE158, Dept. of Civil Engineering, The University of
Queensland, Brisbane, Australia, July (ISBN 1 864995297).
The Research Report CE158 is available, in the present form, as a .PDF file on the Internet at the
following address :
http://www.uq.edu.au/~e2hchans/reprints/ce158.pdf