experimental study of wellbore instability in clay s
TRANSCRIPT

Experimental Study of Wellbore Instability in Clays
The MIT Faculty has made this article openly available. Please share how this access benefits you. Your story matters.
Citation Abdulhadi, Naeem O., John T. Germaine, and Andrew J. Whittle.“Experimental Study of Wellbore Instability in Clays.” Journal ofGeotechnical and Geoenvironmental Engineering 137.8 (2011): 766.
As Published http://dx.doi.org/10.1061/(ASCE)GT.1943-5606.0000495
Publisher American Society of Civil Engineers
Version Author's final manuscript
Citable link http://hdl.handle.net/1721.1/69827
Terms of Use Creative Commons Attribution-Noncommercial-Share Alike 3.0
Detailed Terms http://creativecommons.org/licenses/by-nc-sa/3.0/

Experimental Study of Wellbore Instability in ClaysNaeem O. Abdulhadi, A.M.ASCE1; John T. Germaine, M.ASCE2; and Andrew J. Whittle, M.ASCE3
Abstract: This paper presents the results of an extensive program of laboratory model wellbore tests that have been performed to studywellbore instability in saturated clays. The tests were conducted on resedimented Boston blue clay (RBBC) anisotropically consolidated tovertical effective stresses up to 10 MPa by using two custom-built thick-walled cylinder (TWC) devices with outer diameters Do ¼ 7:6 and15.2 cm. The experimental program investigated the effects of specimen geometry, mode of loading, strain rate, consolidation stress level, andoverconsolidation ratio (OCR) on deformations of the model wellbore measured during undrained shearing. Results indicate that for normallyconsolidated clays most of the change in cavity pressure occurs at volumetric strains less than 5% after which the borehole becomes unstable.Increases in outer diameter and strain rate led to a reduction in the minimum borehole pressure. Stress-strain properties were interpretedby using an analysis procedure originally developed for undrained plane strain expansion of hollow cylinders. The backfigured undrainedstrength ratios from these analyses for normally consolidated specimens range from su=σ0
vc ¼ 0:19–0:22. Overconsolidation greatly improvesthe stability of the borehole, and interpreted undrained strength ratios from the TWC tests are consistent with well-known power lawfunctions previously developed for elemental shear tests. DOI: 10.1061/(ASCE)GT.1943-5606.0000495. © 2011 American Society ofCivil Engineers.
CE Database subject headings: Boreholes; Clays; Laboratory tests; Model tests; Saturated soils; Shear strength.
Author keywords: Boreholes; Clays; Laboratory tests; Model tests; Saturated Soil; Shear strength.
Introduction
Shallow oil reservoirs at depths less than 1,000 m are found withinweak rock formations. Most of these formations are poorlylithified, typically consisting of hard clays and lightly cementedgranular materials. The wells are drilled within reservoir and over-burden rocks that are much weaker and more deformable than thosetypically encountered in deep rock reservoirs (depths greater than3,000 m). Most existing deep wellbores pass vertically throughthese upper weak sediments and are usually successfully casedand cemented to mitigate effects of minor near-surface soil disturb-ance. In contrast, shallow field development concepts rely on asmall number of surface drilling locations, with high-angle wellsand complex directional trajectories. In these situations, controlof the drilling operations is closely related to an understandingof wellbore instability mechanisms.
Wellbore stability methods commonly employed in the designof deep wells are established on assumptions appropriate to thestrength and deformation characteristics of hard lithified rockformations (e.g., sandstones and mudstones). These materials fail
in a brittle manner creating classic borehole breakout failurepatterns in the rock (Santarelli and Brown 1989). The accuracyof these conventional models has been verified by numerous labo-ratory model experiments (e.g., Hoskins 1969; Santarelli 1987;Ewy and Cook 1990; Kutter and Rehse 1996; Haimson andSong 1998) and comparison with actual field drilling results (e.g.,Edwards et al. 2004).
However, no comparably validated methods exist for predictingthe stability of shallow boreholes drilled in hard clays and poorlylithified rocks (some work on soft shales has been reported by Wu1991; Marsden et al. 1996). These materials are expected toundergo large plastic deformations (borehole squeezing), creatinga more extensive zone of disturbance around the borehole. Theamount of data regarding the strength and deformation propertiesof clays in the relevant range of consolidation pressures (2–10MPa)is surprisingly limited. The research work undertaken by Bishopet al. (1965), Nakken et al. (1989), Taylor and Coop (1993), Petley(1994), Amorosi and Rampello (2007) among others, forms a majorpart of the available database. In addition, almost no model testsexist on borehole stability conducted on soils.
The present study addresses the problem of wellbore instabilityin soils through a comprehensive program of laboratory modelborehole tests conducted on resedimented Boston blue clay(RBBC) under simulated wellbore in situ conditions. The testingprogram evaluates the effects of different key parameters on theborehole response during undrained shearing including specimenouter diameter, mode of loading, cavity volumetric strain rate, con-solidation stress level, and stress history. The tests make use of twoautomated, high pressure thick-walled hollow cylinder (TWC)devices that have been developed to study the stability of verticalwellbore at reduced-scale. This paper describes the testing proce-dures and equipment used to carry out the experimental program,presents the data obtained from the model borehole testing, andanalyzes the results by using cylindrical cavity expansion theories.
1Senior Geotechnical Engineer, Arab Center for Engineering Studies(ACES), P.O. Box 5504, Amman 11183, Jordan; formerly, DoctoralStudent, Dept. of Civil and Environmental Engineering, MassachusettsInstitute of Technology, 77 Massachusetts Ave., Cambridge, MA 02139(corresponding author). E-mail: [email protected]
2Senior Research Associate, Dept. of Civil and EnvironmentalEngineering, Massachusetts Institute of Technology, 77 MassachusettsAve., Cambridge, MA 02139. E-mail: [email protected]
3Professor, Dept. of Civil and Environmental Engineering, Massachu-setts Institute of Technology, 77 Massachusetts Ave., Cambridge, MA02139. E-mail: [email protected]
Note. This manuscript was submitted on March 21, 2010; approved onDecember 8, 2010; published online on December 10, 2010. Discussionperiod open until January 1, 2012; separate discussions must be submittedfor individual papers. This paper is part of the Journal of Geotechnical andGeoenvironmental Engineering, Vol. 137, No. 8, August 1, 2011.©ASCE, ISSN 1090-0241/2011/8-0–0/$25.00.
1
JOURNAL OF GEOTECHNICAL AND GEOENVIRONMENTAL ENGINEERING © ASCE / AUGUST 2011 / 1
Experimental Program
Equipment
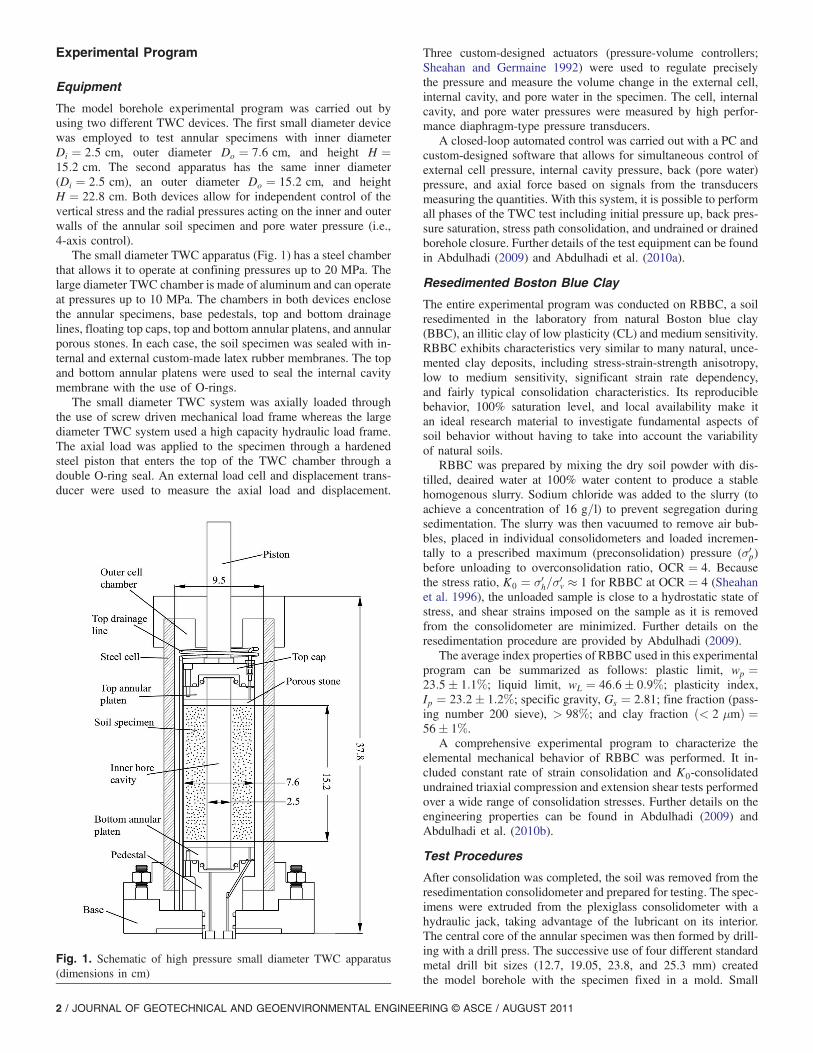
The model borehole experimental program was carried out byusing two different TWC devices. The first small diameter devicewas employed to test annular specimens with inner diameterDi ¼ 2:5 cm, outer diameter Do ¼ 7:6 cm, and height H ¼15:2 cm. The second apparatus has the same inner diameter(Di ¼ 2:5 cm), an outer diameter Do ¼ 15:2 cm, and heightH ¼ 22:8 cm. Both devices allow for independent control of thevertical stress and the radial pressures acting on the inner and outerwalls of the annular soil specimen and pore water pressure (i.e.,4-axis control).
The small diameter TWC apparatus (Fig. 1) has a steel chamberthat allows it to operate at confining pressures up to 20 MPa. Thelarge diameter TWC chamber is made of aluminum and can operateat pressures up to 10 MPa. The chambers in both devices enclosethe annular specimens, base pedestals, top and bottom drainagelines, floating top caps, top and bottom annular platens, and annularporous stones. In each case, the soil specimen was sealed with in-ternal and external custom-made latex rubber membranes. The topand bottom annular platens were used to seal the internal cavitymembrane with the use of O-rings.
The small diameter TWC system was axially loaded throughthe use of screw driven mechanical load frame whereas the largediameter TWC system used a high capacity hydraulic load frame.The axial load was applied to the specimen through a hardenedsteel piston that enters the top of the TWC chamber through adouble O-ring seal. An external load cell and displacement trans-ducer were used to measure the axial load and displacement.
Three custom-designed actuators (pressure-volume controllers;Sheahan and Germaine 1992) were used to regulate preciselythe pressure and measure the volume change in the external cell,internal cavity, and pore water in the specimen. The cell, internalcavity, and pore water pressures were measured by high perfor-mance diaphragm-type pressure transducers.
A closed-loop automated control was carried out with a PC andcustom-designed software that allows for simultaneous control ofexternal cell pressure, internal cavity pressure, back (pore water)pressure, and axial force based on signals from the transducersmeasuring the quantities. With this system, it is possible to performall phases of the TWC test including initial pressure up, back pres-sure saturation, stress path consolidation, and undrained or drainedborehole closure. Further details of the test equipment can be foundin Abdulhadi (2009) and Abdulhadi et al. (2010a).
Resedimented Boston Blue Clay
The entire experimental program was conducted on RBBC, a soilresedimented in the laboratory from natural Boston blue clay(BBC), an illitic clay of low plasticity (CL) and medium sensitivity.RBBC exhibits characteristics very similar to many natural, unce-mented clay deposits, including stress-strain-strength anisotropy,low to medium sensitivity, significant strain rate dependency,and fairly typical consolidation characteristics. Its reproduciblebehavior, 100% saturation level, and local availability make itan ideal research material to investigate fundamental aspects ofsoil behavior without having to take into account the variabilityof natural soils.
RBBC was prepared by mixing the dry soil powder with dis-tilled, deaired water at 100% water content to produce a stablehomogenous slurry. Sodium chloride was added to the slurry (toachieve a concentration of 16 g=l) to prevent segregation duringsedimentation. The slurry was then vacuumed to remove air bub-bles, placed in individual consolidometers and loaded incremen-tally to a prescribed maximum (preconsolidation) pressure (σ0
p)before unloading to overconsolidation ratio, OCR ¼ 4. Becausethe stress ratio, K0 ¼ σ0
h=σ0v ≈ 1 for RBBC at OCR ¼ 4 (Sheahan
et al. 1996), the unloaded sample is close to a hydrostatic state ofstress, and shear strains imposed on the sample as it is removedfrom the consolidometer are minimized. Further details on theresedimentation procedure are provided by Abdulhadi (2009).
The average index properties of RBBC used in this experimentalprogram can be summarized as follows: plastic limit, wp ¼23:5� 1:1%; liquid limit, wL ¼ 46:6� 0:9%; plasticity index,Ip ¼ 23:2� 1:2%; specific gravity, Gs ¼ 2:81; fine fraction (pass-ing number 200 sieve), > 98%; and clay fraction ð< 2 μmÞ ¼56� 1%.
A comprehensive experimental program to characterize theelemental mechanical behavior of RBBC was performed. It in-cluded constant rate of strain consolidation and K0-consolidatedundrained triaxial compression and extension shear tests performedover a wide range of consolidation stresses. Further details on theengineering properties can be found in Abdulhadi (2009) andAbdulhadi et al. (2010b).
Test Procedures
After consolidation was completed, the soil was removed from theresedimentation consolidometer and prepared for testing. The spec-imens were extruded from the plexiglass consolidometer with ahydraulic jack, taking advantage of the lubricant on its interior.The central core of the annular specimen was then formed by drill-ing with a drill press. The successive use of four different standardmetal drill bit sizes (12.7, 19.05, 23.8, and 25.3 mm) createdthe model borehole with the specimen fixed in a mold. Small
Fig. 1. Schematic of high pressure small diameter TWC apparatus(dimensions in cm)
2 / JOURNAL OF GEOTECHNICAL AND GEOENVIRONMENTAL ENGINEERING © ASCE / AUGUST 2011
differences in the diameter of the largest two, progressively-useddrill bits ensured minimal disturbance to the final inner surfaceof the annular test specimen. Note that the soil specimen hasthe same outside diameter as the resedimentation consolidometer,and therefore the outer surface does not require trimming. Only theends of the specimen were trimmed by using a hacksaw and blade.
A dry setup was adopted in the TWC apparatus to prevent thespecimen from swelling. Paper filter strips were applied to the outersurface of the TWC specimen to improve distribution and drainageof pore pressures during initial saturation, consolidation, and load-ing. After completing the specimen setup, the water lines werevacuumed to remove the air and flushed with water. With the drain-age valves closed, an initial isotropic stress increment was appliedto obtain positive pore pressures within the clay. The specimen wasthen back-pressure saturated to 400 kPa by increasing the externalcell, internal cavity, and back pressures while maintaining the mea-sured initial effective stress constant with no deviatoric load. Thisprocess was essential to make sure that the specimen and pore lineswere fully saturated. The Skempton pore pressure coefficient B,determined by incrementally increasing the internal and externalpressures and measuring the back pressure, was generally greaterthan 95%.
The soil specimen was anisotropically consolidated into the nor-mally consolidated (NC) stress range in two stages at an axial strainrate of 0:3%=h to a predefined stress ratio, K0 ¼ 0:55, on the basisof results from the triaxial test program (Abdulhadi et al. 2010b).The first stage of stress path consolidation in the TWC apparatusstarted from the hydrostatic condition and approached a targetvalue, K0 ¼ 0:55 at σ0 ¼ 0:8v σ0
p. The second stage involved stresspath consolidation at K0 ¼ 0:55 to the specified maximum verticaleffective stress (σ0
vm ¼ 1:5σ0p). The internal cavity and external cell
pressures were interconnected during this procedure. Once the tar-get maximum vertical effective stress was reached, the stresseswere kept constant for 48 h to ensure minimal rates of volume strainbefore simulation of borehole closure. Overconsolidated (OC)specimens were unloaded to prescribed vertical consolidationeffective stress values (σ0
vc) at an axial strain rate of 0:2%=h,and K0 conditions were approximated by adjusting the cell pressureby using the following expression (Schmidt 1966; Ladd et al.1977):
K0ðOCÞ ¼ K0ðNCÞðOCRÞ0:43 ð1Þ
where K0ðOCÞ and K0ðNCÞ = target overconsolidated and normallyconsolidated earth pressure coefficients, respectively. The exponent0.43 was obtained from previous data on RBBC.
After rebounding, final stresses were maintained for another48 h. Because the reconsolidation in the TWC apparatus was car-ried out at stresses significantly higher than those imposed duringinitial preparation in the resedimentation consolidometer, effects ofthe setup disturbance were minimized.
Mechanisms of instability were introduced by reducing theinternal cavity pressure within the model wellbore and keepingthe external cell pressure and axial stress constant. Cavity contrac-tion was performed by drawing out cavity fluid with the pressure-volume controller at a standard cavity volumetric strain rate of10%=h. The tests were terminated at 20% cavity volumetric strain.The drainage valves were closed to maintain undrained conditionsduring cavity contraction (globally within the specimen) while thepore pressures were measured at the top and base of the specimen.One test in the series was performed by increasing the internalcavity pressure (pressuremeter mode) and keeping the externalpressure and axial stress constant (see Table 1).
The original cavity pressure–cavity volume strain curves werecorrected for system compliance (e.g., compressibility of cavityfluid and tubing), internal membrane resistance, and axial strainduring borehole closure. The system compliance, which has a sig-nificant effect on the results especially for tests consolidated to highpressures, was measured by performing reference tests on dummyaluminum specimens in the small and large TWC devices. Severalcycles of unloading-loading were performed in these reference teststo verify the repeatability of the results. Axial strains were takeninto account in the calculation of the cavity volumetric strainassuming uniform (cylindrical) deformations of the specimen. Fur-ther piston friction and area corrections were made for the axialload measurement because the tests employed external load cells.
Variables Investigated
The model borehole experimental program investigated the effectsof the following variables on cavity deformations measured duringundrained shearing: specimen outer diameter (Do ¼ 7:6 cm and15:2 cm), mode of loading (cavity unloading/loading), cavity
Table 1. Summary of CAU Model Borehole Tests
Test number H (cm) Do (cm) σ0vc (MPa) OCRa
Shearing
NotesLoading mode Rate (%=h)
TWC6 15.26 7.62 5.86 1.00 Cavity unloading 10.0
TWC7 15.28 7.63 10.20 1.00 Cavity unloading 10.0
TWC9 15.27 7.61 2.95 1.00 Cavity unloading 10.0
TWC13 15.25 7.61 1.47 1.00 Cavity unloading 10.0
TWC14 15.27 7.62 1.47 3.98 Cavity unloading 10.0 Axial load not controlled
during BH closure
TWC15 15.26 7.62 2.94 2.02 Cavity unloading 10.0
TWC16 15.27 7.62 0.73 8.09 Cavity unloading 10.0 Axial load not controlled
during BH closure
TWC17 15.25 7.62 5.87 1.00 Cavity unloading 0.5 Test aborted at εcav ¼ 10:5%
TWC20 15.25 7.62 5.85 1.00 Cavity unloading 60.0
TWC22 22.85 15.34 1.48 1.00 Cavity unloading 10.0
TWC23 22.85 15.23 5.88 1.00 Cavity unloading 10.0
TWC24 15.14 7.61 2.96 1.00 Cavity loading 10.0aOCR ¼ σ0
vm=σ0vc
2
JOURNAL OF GEOTECHNICAL AND GEOENVIRONMENTAL ENGINEERING © ASCE / AUGUST 2011 / 3
volumetric strain rate ( _εcav ¼ 0:5–60%=h), consolidation stresslevel (σ0
vc ¼ 1:5–10 MPa), and stress history (OCR ¼ 1–8). Theeffects of boundary conditions and drainage (drained and undrainedtests) have also been evaluated and the results are discussed byAbdulhadi et al. (2010a).
Table 1 summarizes the anisotropically consolidated undrained(CAU) model borehole tests. For each test, the table provides thespecimen initial dimensions, preshear consolidation stress condi-tions, and undrained borehole closure conditions. The majorityof the tests were performed in the small diameter TWC apparatus.The “reference” test conditions most commonly used in the exper-imental program were OCR ¼ 1, 10%=h strain rate, and internalcavity depressurizing. The model borehole tests were essentiallyconsolidated in the TWC apparatus to one of four nominal maxi-mum vertical effective stress levels: 1.5, 3, 6, and 10 MPa. Thesestress levels reflect the range of in situ stresses pertinent to shallowoil field developments. Two tests were performed in the large TWCapparatus to examine the effect of the outer boundary on testresults. Additional tests were conducted on RBBC with OCR of2, 4, and 8. Strain rate effects during borehole closure were alsoinvestigated by varying the cavity volumetric strain rate overapproximately two orders of magnitude ( _εcav ¼ 0:5–60%=h).The overall model borehole experimental program consisted of24 TWC tests. Some of these tests were repeat tests in whichthe repeatability of the test results was demonstrated. The minimalvariability in the repeat tests indicated that any variations observedin test results are solely linked to the variables investigated.
Overview of Model Borehole Behavior for ReferenceTesting Conditions
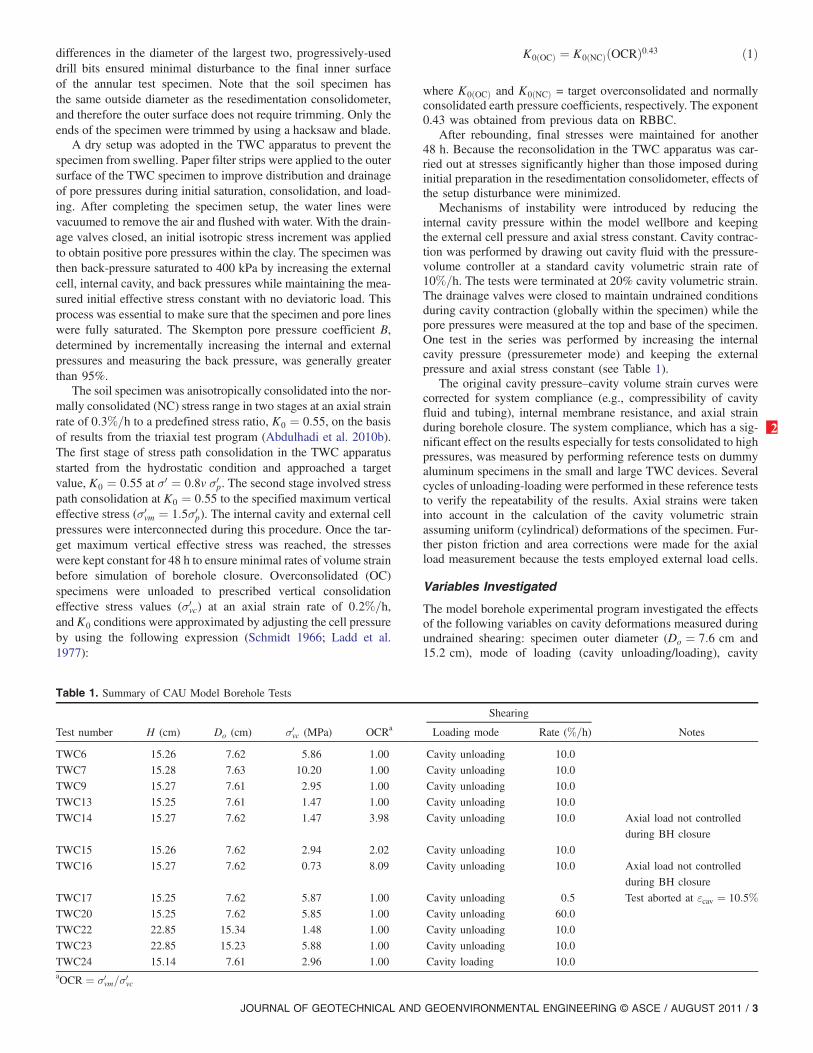
Fig. 2(a) shows the net internal cavity pressure inside the borehole,pi � u0 (where pi is the total internal cavity pressure and u0 is thepore pressure at the start of shearing), versus cavity volumetricstrain, εcavð¼ ΔV=V0Þ, for a reference baseline model boreholetest that was initially anisotropically normally consolidated(K0ðNCÞ ¼ 0:55) to σ0
vc ¼ 10 MPa in the small diameter TWCapparatus before undrained cavity contraction at average volumestrain rate, _εcav ¼ 10%=h (test TWC 7; Table 1). Fig. 2(a) showsthe nonlinear relationship between the cavity pressure and volumet-ric strain. The shearing starts from net internal pressure, ½pi � u0� ¼5:5 MPa (¼ K0ðNCÞσ0
vc). The bulk of the pressure drop occurswithin the first 5% volume strain before the borehole becomes un-stable (i.e., deforms without further reduction in cavity pressure)when the net pressure reaches ½pi � u0� ¼ 1:5 MPa at volumestrains in the range εcav ¼ 7� 8%. The axial strain during thisprocedure was minimal, particularly at small volume strains, asshown in Fig. 2(b).
Fig. 2(c) shows the measured excess pore pressure,ueð¼ u� u0Þ, versus cavity volumetric strain owing to the reduc-tion of the internal cavity pressure for the same reference test. Theresults show that the pore pressure increases continuously with thecavity volumetric strain. The pore pressures measured at the mini-mum net cavity pressure (corresponding to εcav ¼ 7� 8%) areue ¼ 0:8 MPa and rise to ue ¼ 1:1 MPa at the end of shearing.Those pressures are relatively small compared with the consolida-tion stresses. However, the pore pressure regime in the TWC is verycomplex because nonuniform stresses and strains across the speci-men wall (developed owing to the difference between the internalcavity and external cell pressures) generate large pore pressure gra-dients during undrained cavity contraction. By using the theoreticalrelationship presented in Bishop and Henkel (1962) between theequalization of nonuniform pore pressure (1� u=u0) and the time
factor (T ¼ cvt=h2, in whichcv is the coefficient of consolidation,t is elapsed time, and h is the drainage length), the time to reach95% pore pressure equalization is 60–80 min. Consequently, it isunlikely that the pore pressures are fully redistributed within theTWC specimen at the standard rate of shearing and were estimatedto be only 80–90% equilibrated (less redistribution at beginningof shearing). Therefore, the measurements at the specimen ends[Fig. 2(c)] are considered to represent “average” pore pressureconditions across the width of the specimen.
The rate of shearing in the undrained tests is of great importance.Although very fast tests tend to better simulate the true undrainedcase (i.e., minimal pore water migration within the specimen), theresultant pore pressures measured are not very reliable. On the other
Fig. 2. Typical undrained borehole closure results for test on NCRBBC in small diameter TWC apparatus: (a) net internal cavity pres-sure versus cavity volume strain; (b) axial strain versus cavity volumestrain; and (c) average excess pore pressure versus cavity volume strain
3
4
4 / JOURNAL OF GEOTECHNICAL AND GEOENVIRONMENTAL ENGINEERING © ASCE / AUGUST 2011

hand, tests performed at sufficiently slow rates allow for porepressure equilibration within the specimen (i.e., representative porepressure measurements) but violate the undrained assumptionlocally. Therefore, the standard rate (10%=h) was chosen to simulatethe “true” undrained behavior as much as possible and at the sametime obtain somewhat representative average readings of porepressures. Subsequent sections investigate the effect of pore pres-sure redistribution on the test results and analysis.
Posttest observations and measurements of the TWC test speci-men and radiography scans indicate that the cross-sectional radialdeformations are uniform (i.e., little distortion of the cross section).In addition, vertical cracks were observed at the inside wall of theborehole for specimens initially consolidated to maximum verticaleffective stresses, σ0
vm ≥ 6 MPa.The method used to interpret the model borehole tests is based
on pressuremeter cavity expansion theory. Silvestri (1998) pro-posed a method to obtain the stress-strain properties from measure-ments of cavity expansion in a thick-walled cylinder of clay forundrained plane strain conditions. The same interpretation methodis also applicable to cavity contraction as the problem geometry isfully strain-controlled (i.e., strain field is independent of the stress-strain curve). In the case of the model borehole experimental pro-gram conducted in this study, global undrained conditions weremaintained during the borehole closure procedure, although somesmall axial deformations occurred, as illustrated in Fig. 2(b) forthe reference test. The complete stress-strain curve of a saturatedclay from undrained plane strain expansion or contraction of ahollow cylinder can be obtained by means of the following relation-ship (Silvestri 1998):
qha ¼ χðχ� 1Þ dpidχ
þ χ1� β þ βχ
qhb ð2Þ
where qha = shear stress in the horizontal plane generated at theinner radius of the hollow cylinder (¼ ½σθi � σri�=2; where σθiand σri = circumferential and radial stresses at the inner wall,respectively); χ = distortion parameter (¼ ½1þ εcav� ¼ ½a0=a�2;where a0 = inner radius of the hollow cylinder in a deformed stateand a = initial inner radius); dpi=dχ = slope of the expansion orcontraction curve; β = size parameter (¼ ½a=b�2, where b = initialouter radius of the hollow cylinder); and qhb = shear stress in thehorizontal plane generated at the outer radius (¼ ½σθo � σro�=2;where σθo and σro = circumferential and radial stresses at the outerwall, respectively). The shear stress at the outer boundary (qhb) isnot known at the start of the test but follows the same stress-straincurve as qha. Therefore, an iteration process was performed to ob-tain what can be assumed to be the true and unique stress-straincurve of the soil (i.e., applies to every material element of theTWC specimen). The numerical differentiation procedure per-formed on the experimental contraction pressure-strain relationshipresults in some fluctuations in the stress-strain curves. This particu-lar behavior is caused by the fact that when differentiation is per-formed on discrete data points, the procedure is very sensitive toeven the smallest variation in the raw data. As a result, the stress-strain curves were smoothed by using a five-point moving average.
The interpreted shear stress-strain results for the reference test(small diameter TWC specimen: β ¼ 0:111) are presented in Fig. 3.The y-axis in the plot is the shear stress, qh ¼ ðσθ � σrÞ=2, and thex-axis is the natural shear strain, γð¼ ½r0=r�2; where r0 is the de-formed state of the initial radial coordinate r). The results showthat the stress-strain curve reaches a maximum shear stress, qh ¼2:2 MPa at γ≈ 3% and exhibits almost perfectly plastic behaviorbeyond peak shear resistance (i.e., the material does not strainsoften). The undrained shear strength (su) of the clay is equated
to the maximum value of shear stress in the horizontal plane;su ¼ qhMAX ¼ ð½σθ–σr�=2ÞMAX. This yields an undrained strengthratio, su=σ0
vc ¼ 0:22, which is similar to that obtained in a directsimple shear (DSS) mode. These results are consistent with pre-vious knowledge of anisotropic strength properties of RBBC(Whittle et al. 1994). The initial portion of the stress-strain curveis not well defined (lack of enough data points), so it is not possibleto estimate the initial shear modulus readily by this procedure.
Although the shear stress-strain curve obtained in Fig. 3 can beassumed to be unique and applicable to the entire soil mass, thestrain distribution across the TWC wall results in shear stress var-iations. For example, Fig. 4 shows the shear strain distributionacross the small TWC specimen wall at εcav ¼ 7:5%. At this vol-ume strain, the shear strain at the inner wall γa ¼ 7:2% and at theouter wall γb ¼ 0:8%. For the reference test (TWC7), the corre-sponding shear stress at the inner wall was qha ¼ 2:2 MPa (reachedfailure) and at the outer wall qhb ¼ 1:8 MPa. The natural shearstrains at the inner radius (γa), outer radius (γb), and distancerðγrÞ are linked to the distortion parameter, χ (and hence εcav),through the following expressions (Silvestri 1998):
γa ¼ lnχ ð3Þ
γb ¼ lnð1� β þ βχÞ ð4Þ
γr ¼ lnð1� βr þ βrχÞ ð5Þ
where βr ¼ a2=r2.
Fig. 3. Interpreted shear stress-strain behavior for a typical test on NCRBBC in small diameter TWC apparatus
Fig. 4. Interpreted shear strain distribution across small diameter TWCspecimen at εcav ¼ 7:5% (γa ¼ 7:2%)
JOURNAL OF GEOTECHNICAL AND GEOENVIRONMENTAL ENGINEERING © ASCE / AUGUST 2011 / 5
Effect of Specimen Geometry
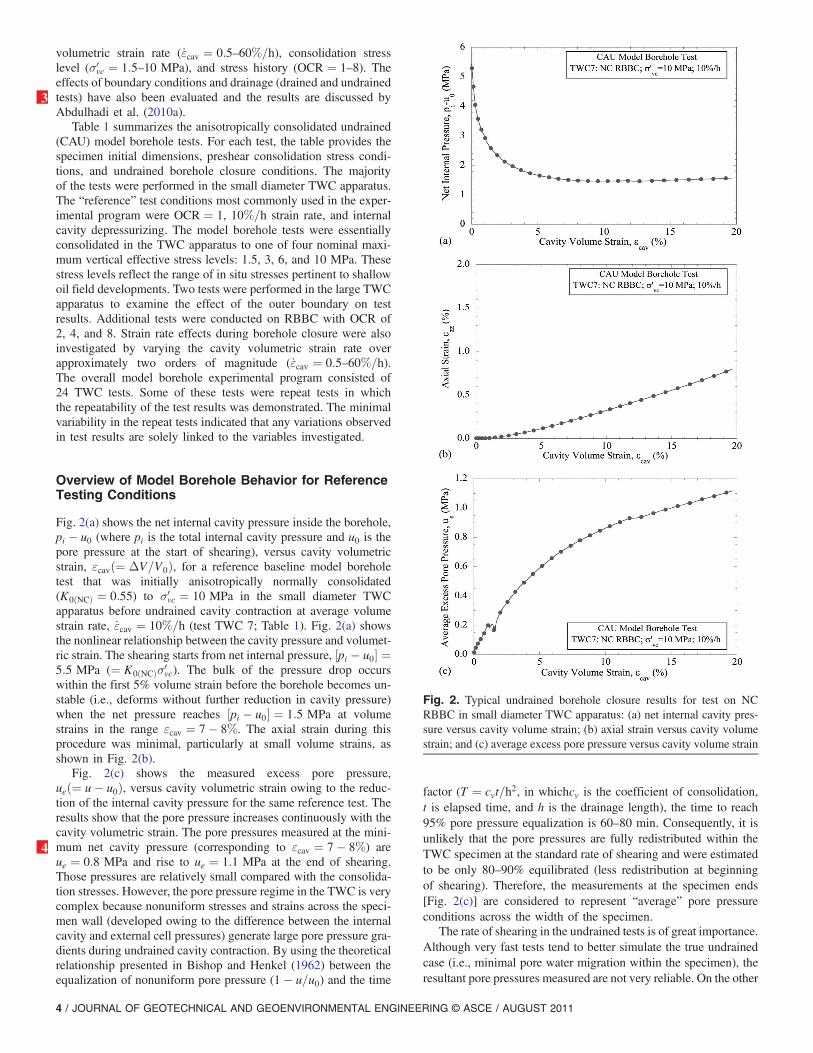
Abdulhadi et al. (2010a) demonstrated that the initial specimenheight has minimal impact on the measured borehole responseand pore pressures by testing small diameter TWC specimens(Do ¼ 7:6 cm) with H ¼ 15:2, 11.5, and 8.2 cm (i.e., H=Do ¼ 2,1.5, and 1.1). On the other hand, increases in the outer diameterhave a significant impact on the minimum borehole pressureand redistribution of pore pressures within the clay specimen, asillustrated in Fig. 5. These results were obtained from tests per-formed on small diameter (Do ¼ 7:6 cm; H ¼ 15:2 cm) and largediameter (Do ¼ 15:2 cm; H ¼ 22:8 cm) TWC specimens (bothwith Di ¼ 2:5 cm). The RBBC specimens were anisotropicallynormally consolidated to σ0
vc ¼ 6 MPa before carrying outundrained cavity contraction.
The effect of the outer diameter on the interpreted shear stress-strain behavior is shown in Fig. 6 (with β ¼ 0:111 and 0.0278 forthe small and large diameter specimens, respectively). The figureshows that both tests have comparable stress-strain curves and reachpeak undrained strength, su ¼ 1:25 MPa (i.e., su=σ0
vc ¼ 0:21).Test TWC23 (larger specimen) exhibits some strain softening afterreaching the peak stress. These results demonstrate that the interpre-tation method produces an almost unique stress-strain curve forthe soil that is independent of the specimen dimensions. Further-more, the results confirm that the analysis is not very sensitive to theinternal redistribution of pore pressures taking place within thespecimen becausemoremigration is expected to occur in the smallerspecimen owing to the reduced drainage path length.
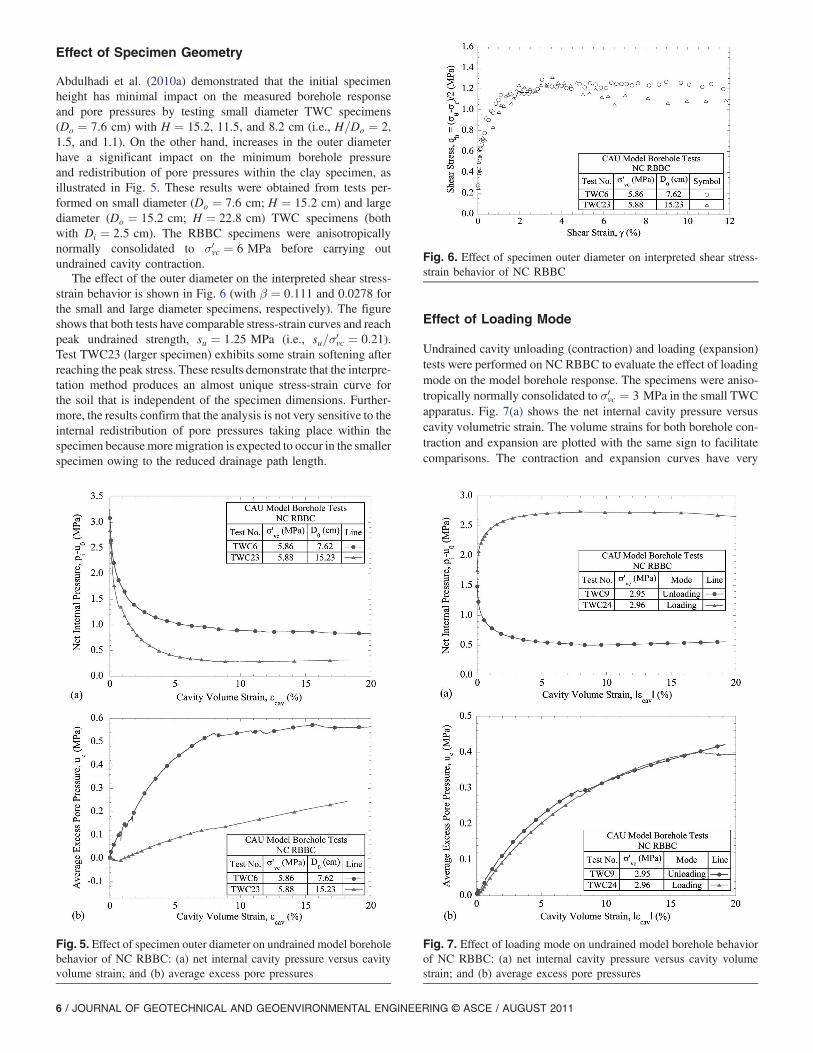
Effect of Loading Mode
Undrained cavity unloading (contraction) and loading (expansion)tests were performed on NC RBBC to evaluate the effect of loadingmode on the model borehole response. The specimens were aniso-tropically normally consolidated to σ0
vc ¼ 3 MPa in the small TWCapparatus. Fig. 7(a) shows the net internal cavity pressure versuscavity volumetric strain. The volume strains for both borehole con-traction and expansion are plotted with the same sign to facilitatecomparisons. The contraction and expansion curves have very
Fig. 5. Effect of specimen outer diameter on undrained model boreholebehavior of NC RBBC: (a) net internal cavity pressure versus cavityvolume strain; and (b) average excess pore pressures
Fig. 6. Effect of specimen outer diameter on interpreted shear stress-strain behavior of NC RBBC
Fig. 7. Effect of loading mode on undrained model borehole behaviorof NC RBBC: (a) net internal cavity pressure versus cavity volumestrain; and (b) average excess pore pressures
6 / JOURNAL OF GEOTECHNICAL AND GEOENVIRONMENTAL ENGINEERING © ASCE / AUGUST 2011

similar profiles (i.e., the evolution of net pressure with strain) evenat small strains. The cavity loading test (TWC24) reaches a maxi-mum ½pi � uo� ¼ 2:7 MPa whereas the unloading test (TWC9) hasa minimum ½pi � u0� ¼ 0:5 MPa. Fig. 7(b) shows that the mea-sured average excess pore pressures are virtually coincident forboth tests (ue ≈ 0:4 MPa at end of the test).
Fig. 8 shows that the contraction and expansion tests havevery similar interpreted shear stress-strain properties, reachingcomparable maximum shear stress, qh ≈�0:54 MPa (i.e.,su=σ0
vc ≈ 0:185). Because qh is defined as ðσθ � σrÞ=2, the expan-sion test yields a negative shear stress (σr > σθ). These resultsconfirm that the stress-strain-strength properties are isotropic inthe horizontal plane after stress path consolidation. Moreover,the behavior is in agreement with the predictions made by Aubenyet al. (2000) by using a generalized effective stress soil model,MIT-E3 (Whittle and Kavvadas 1994), for pressuremeter testson Boston blue clay (BBC). The numerical analyses demonstratedthat the undrained strength ratios obtained in a pressuremeter shearmode are approximately 0.2 (i.e., similar to those measured in aDSS mode), and the predicted stress-strain curves show almostperfectly plastic behavior beyond peak shear resistance. Ladd et al.(1979) also suggested that the pressuremeter undrained shearstrength is similar to that of simple shear.
Effect of Strain Rate
The strain rate sensitivity of the undrained borehole behavior wasevaluated by shearing NC RBBC specimens at cavity volumetricstrain rates varying within approximately two orders of magnitude:slow rate (0:5%=h), moderate or standard rate (10%=h), and fastrate (60%=h). All three specimens were anisotropically consoli-dated to σ0
vc ¼ 6 MPa in the small diameter TWC apparatus beforeundrained cavity unloading. The slow test (TWC17) was aborted atcavity volumetric strain, εcav ¼ 10:5%. Fig. 9(a) shows the net cav-ity pressure versus cavity volumetric strain. The standard and fastrate tests have comparable borehole response whereas the curve forthe slow rate test indicates higher net pressures at a given strainlevel. The borehole becomes unstable at ½pi � u0� ¼ 1:2 MPa forthe slow rate test and at ½pi � u0�≈ 0:8 MPa for the other two rates.In addition, the initial cavity stiffness increases slightly withincreasing strain rate.
The average excess pore pressures measured during undrainedborehole closure are shown in Fig. 9(b) for the three rates.The figure shows that the measured pore pressures increasewith decreasing strain rate: Atεcav ¼ 10%, the pore pressure,
ue ¼ 0:83 MPa in the slow rate test, ue ¼ 0:55 MPa in the standardrate test, and ue ¼ 0:35 MPa in the fast rate test. The differencebetween the standard and slow rate tests is thought to be partlyattributable to the pore water redistribution but mainly owing tothe inherent “viscosity” of the soil skeleton (i.e., true rate depend-ence in soil behavior). Pore pressure measured in the fast rate testshows that very little redistribution occurs at the beginning ofshearing and then increases toward the end of the test where itapproaches the standard rate curve. In fact, the pore pressure de-creases slightly to a negative value before increasing with volumestrain because the soil at the inner wall is unloading (resulting indecreasing pore pressures), and negligible redistribution of porepressures exists at the beginning of the test. The fast rate test thussimulates the closest condition to a “true” undrained shear case,whereas the pore pressures in the slow rate test are believed tobe fully equilibrated. The pore pressures in the standard rate testare estimated to be 80–90% equilibrated.
The interpreted stress-strain curves are presented in Fig. 10. Thecurves are comparable for the three tests indicating that the strainrate (and hence, the degree of internal pore water migration) hasminor effects on the interpreted stress-strain behavior. The differ-ence in excess pore pressures generated in the three tests [Fig. 9(b)]is relatively small (especially when compared to the consolidationstresses) and does not appear to affect the contraction curves sig-nificantly nor the subsequent stress-strain curves. The standard andfast rate tests reach a peak shear strength, su ¼ 1:25–1:30 MPa(i.e., su=σ0
vc ¼ 0:215–0:221), whereas the slow rate test attains apeak strength, su ¼ 1:15 MPa (i.e., su=σ0
vc ¼ 0:196). The trends
Fig. 8. Effect of loading mode on interpreted shear stress-strainbehavior of NC RBBC
Fig. 9. Effect of strain rate on undrained model borehole behavior ofNC RBBC: (a) net internal cavity pressure versus cavity volume strain;and (b) average excess pore pressures
5
JOURNAL OF GEOTECHNICAL AND GEOENVIRONMENTAL ENGINEERING © ASCE / AUGUST 2011 / 7

in pore pressures and strength with strain rate are consistent withthe observations made by Sheahan et al. (1996) in which it wasobserved that increasing strain rates are associated in the case ofNC RBBC in triaxial compression with an increase of approxi-mately 6% in strength and decrease of approximately 12–15%in pore pressures per log cycle of strain rate.
Effect of Consolidation Stress Level
A series of TWC tests have been performed on NC RBBC to in-vestigate the effects of consolidation stress level on the undrainedborehole closure behavior in the small TWC apparatus. The spec-imens were anisotropically consolidated to vertical consolidationeffective stresses, σ0
vc ¼ 1:5–10 MPa. Fig. 11(a) shows the netinternal cavity pressure normalized in relation to the initialradial stress, ½pi � u0�=σ0
r0 (where σ0r0 ¼ K0ðNCÞσ0
vc ¼ po � u0),versus cavity volumetric strain. The results demonstrate that theoverall normalized behavior is similar for the four tests; the bulkof the pressure drop occurs within the first 3–4% cavity volumetricstrain and the borehole becomes unstable when the net pressureratio, ½pi � u0�=σ0
r0 ¼ 0:25–0:35 at volumetric strains in the rangeεcav ¼ 5–8%. The initial cavity stiffness ratio decreases slightly asstress level increases. Fig. 11(b) shows the average excess porepressure normalized in relation to the vertical consolidation effec-tive stress, ue=σ0
vc. The pore pressures increase with volumetricstrain to a range ue=σ0
vc ¼ 0:10–0:14, with lower values for thehighly stresses specimens. These results show that the normalizedpore pressure behavior is similar for the four tests.
Fig. 12 shows the normalized interpreted shear stress-strainbehavior (qh=σ0
vc versus γ) for the same four tests. The curvesare characterized by a peak shear strength reached at γ ¼ 2� 3%followed by almost perfectly plastic behavior beyond peak shearresistance. The undrained strength ratios range only from su=σ0
vc ¼0:19–0:22, with lower values for tests at σ0
vc ¼ 1:5–3 MPa.
Effect of Stress History
The effect of stress history on the undrained model borehole behav-ior was investigated by performing tests with nominal values ofOCR: 1, 2, 4, and 8. The four RBBC specimens were initiallyanisotropically consolidated to a common maximum vertical effec-tive stress, σ0
vm ¼ 6 MPa. Three specimens were then unloaded tothe target OCR before undrained borehole closure. The axial loadwas not controlled during borehole closure at OCR ¼ 4 and
8 (Tests TWC14 and TWC16; Table 1). Keeping the axial stressconstant requires the axial load to be reduced to compensate forthe reduction in the internal cavity pressure acting on the undersideof the top cap. This could not be performed because the preshearlateral stress ratio, K ≈ 1 (i.e., σ0
h=σ0v ≈ 1) for these tests and the
current TWC design cannot impose axial extension. This limitationalso prevents 1-D swelling to OCR ¼ 8. Instead, the TWC16specimen was unloaded along a specified stress path to K ¼ 1
Fig. 10. Effect of strain rate on interpreted shear stress-strain behaviorfor NC RBBC
Fig. 11. Effect of consolidation stress level on undrained modelborehole behavior of NC RBBC: (a) normalized net internal cavitypressure versus cavity volume strain; and (b) normalized averageexcess pore pressures
Fig. 12. Effect of consolidation stress level on normalized interpretedstress-strain behavior for NC RBBC
6
8 / JOURNAL OF GEOTECHNICAL AND GEOENVIRONMENTAL ENGINEERING © ASCE / AUGUST 2011

(i.e., σ0h ¼ σ0
v ¼ 0:75 MPa) and hence, corresponds to a pseudoOCR ¼ 8 state.
Fig. 13(a) shows the net internal pressure ratio (½pi � u0�=σ0r0)
versus cavity volumetric strain. The results demonstrate that thestress history has a marked effect on borehole stability. The OCtests are all able to sustain net internal pressures, ½pi � u0� ≤ 0.The internal bore pressure at the end of the test decreases from½pi � u0�=σ0
r0 ¼ 0:25 at OCR ¼ 1 to ½pi � u0�=σ0r0 ¼ �0:55 at
OCR ¼ 8. Moreover, OCR ¼ 4 and 8 RBBC specimens do notreach limiting values of ½pi � u0� even at large volumetric strains.Fig. 13(a) also shows a significant increase in borehole stiffness athigher OCR. The normalized average excess pore pressures(ue=σ0
vc) are presented in Fig. 13(b). As OCR increases, the excesspore pressures decrease and become increasingly negative. Thepore pressures at the end of the test decline from ue=σ0
vc ¼ 0:10at OCR ¼ 1 to ue=σ0
vc ¼ �0:66 at OCR ¼ 8.Fig. 14(a) presents the normalized interpreted shear stress-strain
behavior (qh=σ0vc versus γ) from tests at OCR ¼ 1, 2, 4, and 8. In
general, the undrained shear strength is mobilized at shear strains,γ ¼ 2–4%, with no indication of postpeak strain softening. The testat OCR ¼ 8 (TWC16) exhibits strain hardening behavior, withincreased resistance throughout the test, reaching a maximumstrength ratio, qh=σ0
vc ¼ 0:95, at the end of shearing.The undrained strength ratio increases with increasing OCR and
can be described by using the SHANSEP power law equation(Ladd and Foott 1974)
su=σ0vc ¼ SðOCRÞm ð6Þ
where S = undrained strength ratio of NC clay; and m = scalingexponent.
Fig. 14(b) summarizes the measured undrained strength ratiosversus OCR for the CAU model borehole tests and K0-consolidatedundrained (CK0U) triaxial compression and extension testsperformed on RBBC at high consolidation stresses (triaxial dataobtained from Abdulhadi 2009). The value of S for the TWCis 0:21� 0:01, corresponding to an average between S valuesmeasured in triaxial compression and extension tests, whereasthe exponent m ¼ 0:72 is consistent with elemental shear tests.These parameters are very similar to those obtained by Ahmed(1990) for RBBC from the DSS test (S ¼ 0:20 and m ¼0:74� 0:82). In addition, the results are in excellent agreementwith the predictions made by Aubeny et al. (2000) by using theMIT-E3 constitutive model for the pressuremeter tests on NCand OC BBC.
Summary and Conclusions
A program of laboratory model borehole tests have been performedto study wellbore instability in clays by using two automated, highpressure thick-walled cylinder (TWC) devices with outer diameterDo ¼ 7:6 cm and 15:2 cm. Both devices allow for independent
Fig. 13. Effect of stress history on undrained model borehole behaviorof NC RBBC: (a) normalized net internal cavity pressure versus cavityvolume strain; and (b) normalized average excess pore pressures
Fig. 14. (a) Effect of stress history on normalized interpreted stress-strain behavior for NC and OC RBBC from CAU model borehole tests;and (b) undrained strength ratio as a function of OCR for RBBC fromCAU model borehole, CK0U triaxial compression (TC) and extension(TE) tests at high consolidation stresses
7
JOURNAL OF GEOTECHNICAL AND GEOENVIRONMENTAL ENGINEERING © ASCE / AUGUST 2011 / 9
control of external cell pressure, internal cavity pressure, back pres-sure, and axial force.
The present paper evaluated the effects of the following varia-bles on the borehole response of resedimented Boston blue clay(RBBC) during undrained shearing: specimen outer diameter,mode of loading, cavity volumetric strain rate, consolidation stresslevel, and stress history. The main findings can be summarized asfollows:1. Model borehole closure data on specimens of RBBC
normally consolidated to high pressures indicated that mostof the reduction in cavity pressure occurs at cavity volumestrains less than 5% before the borehole becomes unstable.The shear stress-strain behavior, interpreted by using the fra-mework proposed by Silvestri (1998) demonstrates that thesoil reaches a maximum shear stress in the horizontal plane(qhMAX ¼ su) at shear strain, γ ¼ 2–4%, and exhibits almostperfectly plastic behavior beyond peak shear resistance. Thebackfigured undrained strength ratios, su=σ0
vc ¼ 0:19–0:22 aresimilar to those obtained in a direct simple shear (DSS)mode.
2. Increases in the outer diameter of the TWC specimen have asignificant impact on the minimum borehole pressure andredistribution of pore pressures within the specimen. Onthe other hand, the interpreted shear stress-strain curves forthe small and large diameter TWC tests yielded comparableresults confirming that this stress-strain curve is unique forthe soil.
3. The contraction and expansion curves from cavity unloadingand loading tests had very similar evolution of pressure withvolume strain even at small strains. The pore pressures wereobserved to be independent of the mode of loading. In addi-tion, the interpreted shear stress-strain-strength properties werealmost identical. The undrained strength ratios, su=σ0
vc ≈ 0:19,are in agreement with previous studies on pressuremeter tests(e.g., Ladd et al. 1979; Aubeny et al. 2000).
4. The effect of increasing strain rate in the undrained boreholeclosure tests was to decrease the minimum net cavity pressure,increase initial cavity stiffness, and decrease pore pressure de-velopment. The shear stress-strain curves were comparable forthe three rates indicating that the strain rate has minimal effecton the interpreted stress-strain behavior.
5. The consolidation stress level has a small effect on normalizedcavity contraction curves for NC RBBC, whereas the initialcavity stiffness decreased slightly as stress level increased.The measured normalized average pore pressures were com-parable as were normalized shear stress-strain curves.
6. The measured undrained borehole response was shownto be considerably affected by the stress history of the material.As OCR increased, a significant improvement is shown inborehole stability such that OC test specimens were able tosustain net pressures less than zero. The excess averagepore pressures decreased and become increasingly negativeas OCR increased. The relationship between the undrainedstrength ratio and OCR is consistent with element tests, withSHANSEP equation parameters S ¼ 0:21, and m ¼ 0:72.
Acknowledgments
This research was sponsored by BPAmerica Inc., Houston, and bythe BP-MIT Major Projects Program. The writers are grateful toDr. Stephen Willson for his support and technical advice, and toMr. Stephen Rudolph for his expertise in designing and fabricatingthe new TWC devices.
Notation
The following symbols are used in this paper:CAU = anisotropically consolidated undrained shear test;
CK0U = K0-consolidated undrained shear test;a, a0 = inner radius, deformed inner radius;
B = Skempton’s pore pressure parameter;b, b0 = outer radius, deformed outer radius;
cv = coefficient of consolidation;Di = specimen inner diameter;Do = specimen outer diameter;Gs = specific gravity;H = specimen height;Ip = plasticity index;K = lateral stress ratio;K0 = coefficient of lateral earth pressure at rest;
K0ðNCÞ = coefficient of lateral earth pressure at rest forNC soil;
K0ðOCÞ = coefficient of lateral earth pressure at rest forOC soil;
m = OCR exponent in SHANSEP equation for undrainedstrength ratio;
OCR = overconsolidation ratio, σ0vm=σ0
vc;pi = internal cavity pressure;po = extermal cell pressure;qh = shear stress in the horizontal plane, (σθ � σrÞ=2;qha = shear stress in the horizontal plane at inner radius;qhb = shear stress in the horizontal plane at outer radius;r, r0 = radial coordinate, deformed radius;
S = undrained strength ratio for NC soil in SHANSEPequation;
su = undrained shear strength;ue = excess pore pressure;u0 = pore (back) pressure at start of shearing;
V , ΔV = current volume, change in volume;V0 = initial volume;wL = liquid limit;wp = plastic limit;β = size parameter;γ = shear strain;γa = shear strain at inner radius;γb = shear strain at outer radius;γr = shear strain at radius r;εzz = axial strain;εcav = cavity volumetric strain;_εcav = cavity volumetric strain rate;σr = radial stress;σ0r0 = initial radial effective stress (at end of consolidation);σθ = circumferential (hoop) stress;σ0p = batch preconsolidation pressure;
σ0v = vertical effective stress;
σ0vc = vertical consolidation effective stress (preshear);
σ0vm = maximum vertical consolidation effective stress; andχ = distortion parameter.
References
Abdulhadi, N. O. (2009). “An experimental investigation into the stress-dependent mechanical behavior of cohesive soil with application towellbore instability.” Ph.D. thesis, MIT, Cambridge, MA.
Abdulhadi, N. O., Germaine, J. T., and Whittle, A. J. (2010a). “Thick-walled cylinder testing of clays for the study of wellbore instability.”Geotech. Test. J., in press.
8
9
10 / JOURNAL OF GEOTECHNICAL AND GEOENVIRONMENTAL ENGINEERING © ASCE / AUGUST 2011

Abdulhadi, N. O., Germaine, J. T., and Whittle, A. J. (2010b). “Behaviourof resedimented clay at high consolidation stresses.” Géotechnique, inpress.
Ahmed, I. (1990). “Investigation of normalized behavior of resedimentedBoston blue clay using Geonor direct simple shear.” SM thesis, MIT,Cambridge, MA.
Amorosi, A., and Rampello, S. (2007). “An experimental investigation intothe mechanical behavior of a structured stiff clay.” Géotechnique, 57(2),153–166.
Aubeny, C. P., Whittle, A. J., and Ladd, C. C. (2000). “Effects of disturb-ance on undrained strengths interpreted from pressuremeter tests.”J. Geotech. Geoenviron. Eng., 126(12), 1133–1144.
Bishop, A. W., and Henkel, D. J. (1962). The measurement of soil proper-ties in the triaxial test, Edward Arnold, London.
Bishop, A. W., Webb, D. L., and Skinner, A. E. (1965). “Triaxial testson soil at elevated cell pressures.” Proc., Int. Conf. of Soil Mechanics,Vol. 1, Montreal, 170–174.
Edwards, S., Matasutruyu, B., and Willson, S. M. (2004). “Real-timeimaging of borehole failures.” SPE Drill. Completion, 19(4), 236–243.
Ewy, R. T., and Cook, N. G. (1990). “Deformation and fracture aroundcylindrical openings in rock: II initiation, growth and interaction offractures.” Int. J. Rock Mech. Min. Sci., 27(5), 409–427.
Haimson, B. C., and Song, I. (1998). “Borehole breakouts in Bereasandstone: Two porosity-dependent distinct shapes and mechanismsof formation.” SPE/ISRM Rock Mechanics and Petroleum Engineering,Trondheim, Norway, 229–238.
Hoskins, E. R. (1969). “The failure of thick walled hollow cylinders ofisotropic rock.” Int. J. Rock Mech. Min. Sci. Geomech. Abstr., 6(1),99–125.
Kutter, H. K., and Rehse, H. (1996). “Laboratory investigations of factorsaffecting borehole breakouts.” Proc., Eurock 96, Balkema, Rotterdam,751–758.
Ladd, C. C., and Foott, R. (1974). “New design procedure for stability ofsoft clays.” J. Geotech. Engrg. Div., 100(7), 763–786.
Ladd, C. C., Foott, R., Ishihara, K., Schlosser, F., and Poulos, H. G. (1977).“Stress-deformation and strength characteristics.” Proc., 9th Int.l Conf.of Soil Mechanics and Foundation Engineering, Vol. 2, Tokyo,421–494.
Ladd, C. C., Germaine, J. T., Baligh, M. M., and Lacasse, S. (1979).“Evaluation of self-boring pressuremeter tests in sensitive clays.”
Research Rep. R79-A, Dept. of Civil Engineering, MIT, Cambridge,MA.
Marsden, J. R., Dennis, J. W., and Wu, B. (1996). “Deformation and failureof thick-walled hollow cylinders of mudrock: A study of wellboreinstability in weak rock.” Proc., Eurock 96, Balkema, Rotterdam,759–766.
Nakken, S. J., Christensen, T. L., Marsden, J. R., and Holt, R. M. (1989).“Mechanical behavior of clays at high stress levels for wellbore stabilityapplications.” Proc., Int. Conf. Rock at Great Depth, Pau, France, 2,141–148.
Petley, D. N. (1994). “The deformation of mudrocks.” Ph.D. thesis, Univ. ofLondon, London.
Santarelli, F. J. (1987). “Theoretical and experimental investigation of thestability of the axisymmetric wellbore.” Ph.D. thesis, Imperial Collegeof Science, Technology and Medicine, Univ. of London, London.
Santarelli, F. J., and Brown, E. T. (1989). “Failure of three sedimentaryrocks in triaxial and hollow cylinder compression tests.” Int. J. RockMech. Min. Sci., 26(5), 401–413.
Schmidt, B. (1966). “Discussion of earth pressure at rest related to stresshistory.” Can. Geotech. J., 3(4), 239–242.
Sheahan, T. C., and Germaine, J. T. (1992). “Computer automation ofconventional triaxial equipment.” Geotech. Test. J., 15(4), 311–322.
Sheahan, T. C., Ladd, C. C., and Germaine, J. T. (1996). “Rate-dependentundrained shear behavior of saturated clay.” J. Geotech. Eng., 122(2),99–108.
Silvestri, V. (1998). “On the determination of the stress-strain curve of clayfrom undrained plane-strain expansion of hollow cylinders: A longforgotten method.” Can. Geotech. J., 35(2), 360–363.
Taylor, R. N., and Coop, M. R. (1993). “Stress path testing of Boom Clayfrom Mol, Belgium.” The Engineering Geology of Weak Rock,Balkema, Rotterdam, 77–82.
Whittle, A. J., DeGroot, D. J., Ladd, C. C., and Seah, T.-H. (1994). “Modelprediction of the anisotropic behavior of Boston blue clay.” J. Geotech.Eng., 120(1), 199–224.
Whittle, A. J., and Kavvadas, M. (1994). “Formulation of the MIT-E3constitutive model for overconsolidated clays.” J. Geotech. Eng.,120(1), 173–198.
Wu, B. (1991). “Investigations into the mechanical behavior of soft rocks.”Ph.D. thesis, Imperial College of Science, Technology and Medicine,Univ. of London, London.
10
11
12
13
14
15
16
JOURNAL OF GEOTECHNICAL AND GEOENVIRONMENTAL ENGINEERING © ASCE / AUGUST 2011 / 11