experimental study on cold lap formation in tandem gas...
TRANSCRIPT
chalmers university of technologyse - 412 96 Gothenburg, SwedenTelephone: + 46 - (0)31 772 10 00www.chalmers.se
Experimental Study on Cold Lap Formation in Tandem Gas Metal Arc Welding
peigang li
Department of Materials and Manufacturing Technologychalmers university of technologyGothenburg, Sweden 2011
peig
an
g l
i Experim
ental Study on Cold L
ap Formation in Tandem
Gas M
etal Arc W
elding 2011

Exp
THESI
perimen
Dep
IS FOR TH
ntalStud
De
partmentoCHAL
E DEGREE
dyonCoMetal
P
partmentUNI
TROLLHÄ
ofMateriaLMERSUNIGOTHENB
E OF LICEN
oldLapFlArcWe
PEIGANG
ofEngineeIVERSITYWÄTTAN,SWE
alsandManIVERSITYOBURG,SWE
NTIATE OF
Formatielding
LI
eringScienWESTEDEN2011
nufacturinOFTECHNOLDEN2011
F ENGINEE
ioninT
nce
ngTechnolLOGY
ERING
Tandem
logy
Gas
ExperimentalStudyonColdLapFormationinTandemGasMetalArcWelding
PeigangLi
©PeigangLi,2011.
TechnicalReportno69/2011.
ISSN:1652‐8891
DepartmentofMaterialsandManufacturingTechnology
ChalmersUniversityofTechnology
SE‐41296Gothenburg,SwedenTel:+46(0)31‐7721000.
PrintedbyChalmersReproservice
Gothenburg,Sweden2011
To Xiaolin and my coming baby

v
Abstract
Tandemgasmetalarcwelding(GMAW)isahighproductivityweldingprocesswhichisappliedinmanyindustries.However,atypeofimperfection,knownascoldlap,wasrevealedthatmostlyaccompaniesthetandemGMAWprocess.
Coldlapisasmalllackoffusioninsizeattheweldtoewhichcanhaveanegativeinfluenceonthefatiguelifeoftheweld[1,2].Itgenerallyrunsparalleltothesurfaceoftheparentplate.Duetoitssmallsize,ithasnotbeensuccessfultodetectcoldlapbyanynon‐destructivetest(NDT)method.Withalotofwork,ithasbeennoticedthatitishardtoproduceaweldwithoutcoldlaps.Evenforsomepost‐treatmentmethods,e.g.TIG‐dressing,coldlapcannotbeeliminatedcompletely[2].Therefore,abetterunderstandingoftheformationmechanismisrequiredtobeabletoavoidtheirformation.
Themainobjectivesofthisthesisaretoclassifycoldlaps,tocharacterisecoldlapinterfaces,andtoinvestigatethemaininfluencingfactorsoncoldlapformation.Forthispurpose,severalseriestandemGMAWexperimentswereperformed.Domex355MCwasusedasthebasemetalandOKAutrod12.51Φ1.2wasusedastheconsumablematerial.Differentshieldinggases(pureargonandpurecarbondioxide)andsurfaceconditions(blastedsurfaceandmilledsurface)ofthebasemetalwereapplied.Asealedchamberwasusedintheexperimenttoensureanon‐oxidisingoroxidisingweldingenvironment.Crosssectionsofthecoldlapswerepreparedbyaconventionalmetallographicmethod,e.g.cutting,mounting,polishing,andetching(ifnecessary).Themetallographicsampleswereevaluatedwiththehelpofbothalightopticalmicroscopeandascanningelectronmicroscope(SEM)withanattachedenergydispersivespectroscopy(EDS).Also,theinterfacebetweenspatterandbasemetalwasinvestigatedusingthesamemethodasanassistantstudyofcoldlaps.
Theresultsshowedthreetypesofcoldlaps,i.e.spattercoldlap,overlapcoldlap,andspatter‐overlapcoldlap.Thecoldlapismostlycomposedofvoidsandoxides.Forthematerials(weldingconsumablesandparentmaterials)usedintheexperiments,theoxideswereshowntobemanganese‐siliconoxides(Mn‐Sioxides).ItwasalsofoundthatMn‐Sioxideshaveasignificantinfluenceontheoccurrenceofoverlapcoldlap.Theblastedsurfaceconditioncanhaveaminoreffectonenhancingcoldlaps.Bystudyingthespatter/basemetalinterface,itisbelievedthattemperature/energyaretheotherimportantfactorsfortheformationofcoldlaps.
Keywords:tandemGMAW,coldlap,imperfection,lackoffusion,spatter,overlap,overflow,manganese,silicon,oxides,temperature/energy.

vi
vii
Acknowledgements
InmystudiesIhavehadalotofhelpfrommanypeople.Firstofall,IwouldliketoexpressmydeepgratitudetomymainsupervisorProfessorLars‐ErikSvenssonforhispatience,discussions,suggestions,andhelp.Ialsowouldliketogivemysincerethankstomyex‐mainsupervisorProfessorPerNylénforhisvaluableencouragement.MysincerethanksareduetomyassistantsupervisorNicolaieMarkocsanforhispositiveadviceandfrankdiscussion.SpecialthankstomyexaminerProfessorUtaKlementforhereffortstopushmyPhDstudyforward.
MyheartfeltthanksgotoProfessorBillLucas,ProfessorYoshinoriHirata,andDr.StephanEgerlandfortheirvaluablecomments,helpfuldiscussionsandfaithfuladviceduringtheIIWconferenceandevents.Manypeoplehavegivenmesupportanddeservemythanks:Dr.NiklasJärvstråt,AssociateProfessorHåkanWirdlius,Mr.ToreRonnhult,ProfessorNilsStenbacka,Dr.YimingYao,Mr.HasseOlsson,AssociateProfessorKennethHamberg,Mr.PeterNerman,Mr.JoakimHedegård,Mr.Kjell‐ArnePersson,Mr.LarsHammar,andMr.NicolasCurry.Ithankallmycolleagueswhohelpedtocreateaninspiringandmoreinterestingworkingenvironment.WithoutthefinancialsupportfromtheLOSTandWIQprojects,thisworkwouldnothavebeenpossible.Also,IwouldliketothankVolvoConstructionEquipment(VCE)forimportantsupport.
Finally,Iwouldliketodedicateallofmyloveandthisworktomywife,XiaolinSu,andmycomingbaby.Youmeantheworldtome!
Trollhättan,June2011
PeigangLi

viii
ix
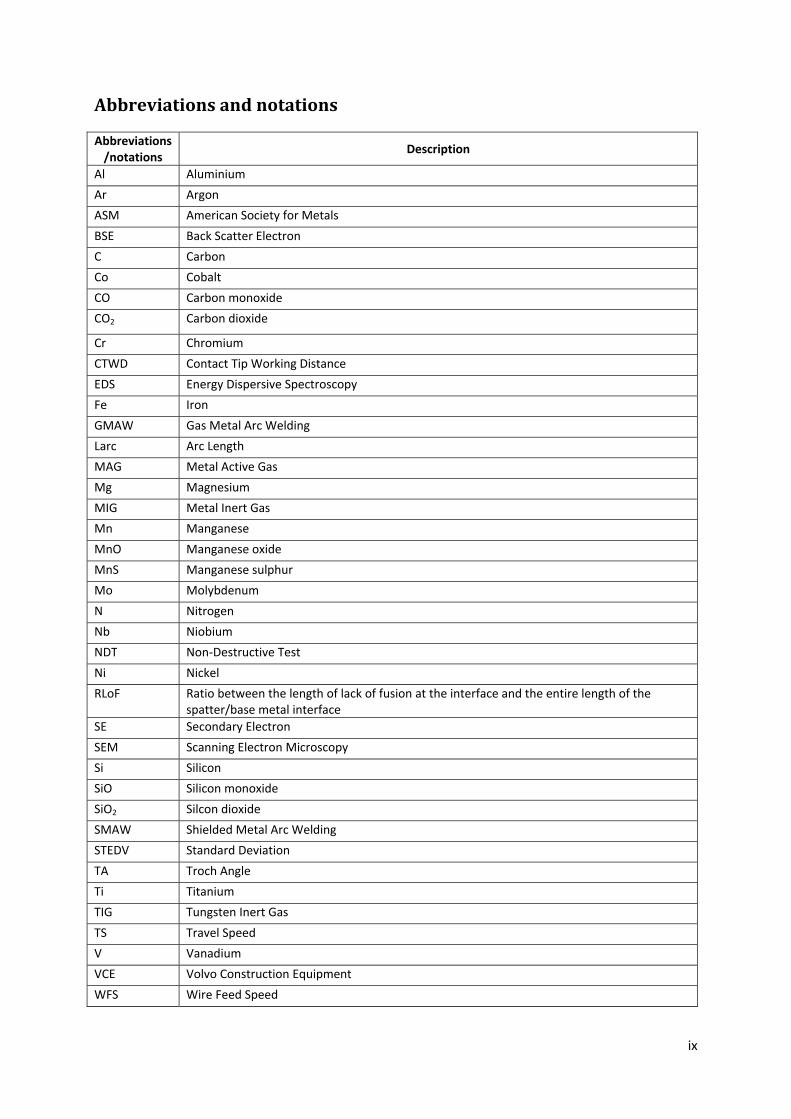
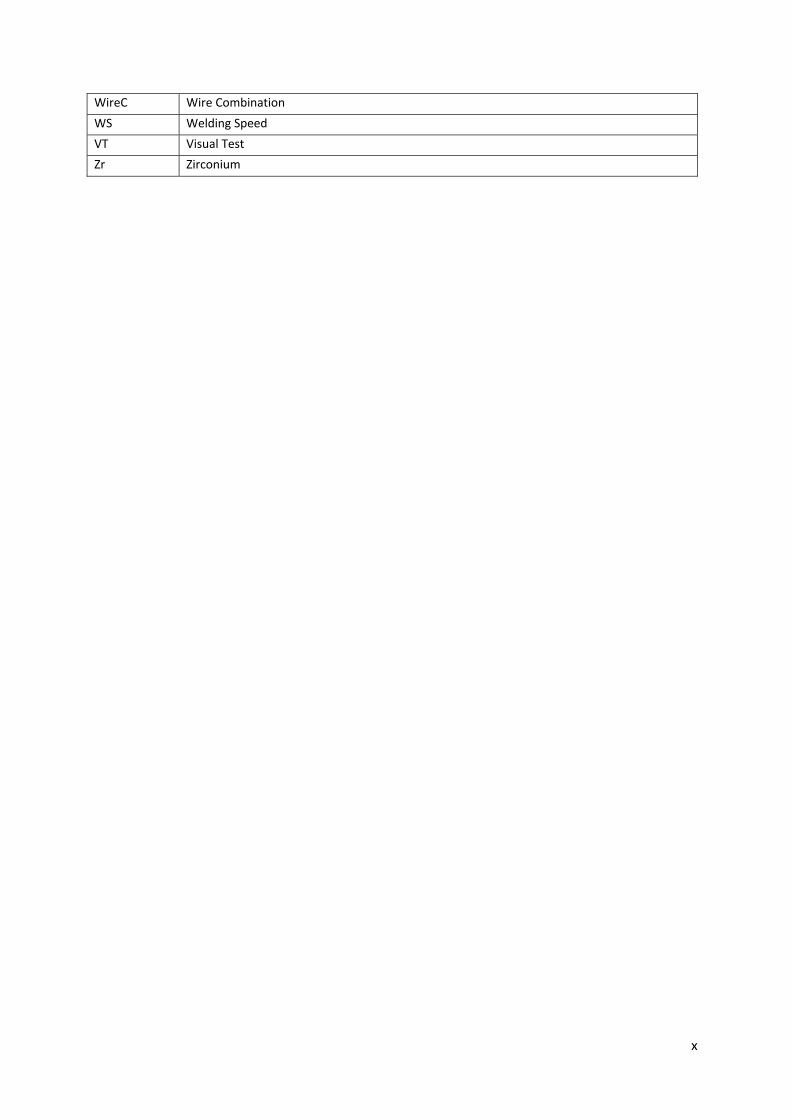
Abbreviationsandnotations
Abbreviations/notations
Description
Al Aluminium
Ar Argon
ASM American Society for Metals
BSE Back Scatter Electron
C Carbon
Co Cobalt
CO Carbon monoxide
CO2 Carbon dioxide
Cr Chromium
CTWD Contact Tip Working Distance
EDS Energy Dispersive Spectroscopy
Fe Iron
GMAW Gas Metal Arc Welding
Larc Arc Length
MAG Metal Active Gas
Mg Magnesium
MIG Metal Inert Gas
Mn Manganese
MnO Manganese oxide
MnS Manganese sulphur
Mo Molybdenum
N Nitrogen
Nb Niobium
NDT Non‐Destructive Test
Ni Nickel
RLoF Ratio between the length of lack of fusion at the interface and the entire length of the spatter/base metal interface
SE Secondary Electron
SEM Scanning Electron Microscopy
Si Silicon
SiO Silicon monoxide
SiO2 Silcon dioxide
SMAW Shielded Metal Arc Welding
STEDV Standard Deviation
TA Troch Angle
Ti Titanium
TIG Tungsten Inert Gas
TS Travel Speed
V Vanadium
VCE Volvo Construction Equipment
WFS Wire Feed Speed
x
WireC Wire Combination
WS Welding Speed
VT Visual Test
Zr Zirconium
xi
Contents
Abstract……………………………………………….….………………………….……………………………………………………………..v
Acknowledgements……………………………………………………………………….…………………………….……………………vii
Abbreviations…………………………………………………………….………………………………………………………………………ix
Contents……………………………………………………………………………………………………………….……………………………xi
1 Introduction ..................................................................................................................................... 1
1.1 Background .............................................................................................................................. 1
1.2 Objective.................................................................................................................................. 1
1.3 Limitations ............................................................................................................................. 1
2 GMAW process ................................................................................................................................ 3
3 Cold laps .......................................................................................................................................... 7
3.1 Definition of cold laps .............................................................................................................. 7
3.2 Detection of cold laps ............................................................................................................ 10
3.3 Previous classification of cold laps ........................................................................................ 11
3.4 Influence factors for cold laps ............................................................................................... 15
4 Oxides in GMAW process .............................................................................................................. 23
5 Experimental techniques ............................................................................................................... 27
5.1 Steel and consumable materials ........................................................................................... 27
5.2 Shielding gases ...................................................................................................................... 27
5.3 Sealed chamber ..................................................................................................................... 28
5.4 SEM and EDS .......................................................................................................................... 28
6 Summary of appended papers ...................................................................................................... 31
6.1 Paper I .................................................................................................................................... 31
6.2 Paper II ................................................................................................................................... 32
6.3 Paper III .................................................................................................................................. 32
7 Conclusions and future work ......................................................................................................... 35
8 References ..................................................................................................................................... 37
9 Appended papers .......................................................................................................................... 39

xii

1
1 Introduction
1.1 BackgroundThis thesis contributes towards the fundamental understanding of the formation of cold lap,
which is a type of welding defect, to be explained later.
Welding is very important in modern manufacturing industry. Gas Metal Arc Welding (GMAW) is
especially utilized in offshore industry and vehicle manufacture due to its high welding
productivity. It is well known that some imperfections generated in the GMAW process, such as
pores, inclusions, undercuts, etc, are inevitable in civil industrial manufacture. These
imperfections can influence the properties of the welded structures, especially the fatigue
properties. Fatigue is a local phenomenon in which the local stress level and/or local defects can
influence the service life of the materials severely. The fatigue properties of the welded
structures always need to be improved for the development of new products, which must
usually feature increased load capacity, higher travel speeds and longer life. Since the last
century, many fatigue tests have been performed and evaluated on welded samples using
different welding methods, filler materials, parent materials, welding parameters, shielding
gases, joint types, and fatigue loadings [1‐6]. Besides weld geometry, cold lap was revealed as
another important factor which can have a detrimental effect on the fatigue life of the welded
structures. Recently, a new corporate standard was developed within Volvo Construction
Equipment (VCE), in which cold lap was firstly given and related to different quality classes[7].
However, very limited knowledge about cold lap is available in literature. Even the detection of
cold lap is an obstacle for studying it. Previous investigations have shown that it is very difficult
to produce a weld without cold lap when using GMAW. Therefore, it is important to understand
cold lap fundamentally, e.g. classification, characterisation, mechanism of formation, etc.
1.2 ObjectiveThe objective of this ongoing work is to study cold laps in order to better understand the
phenomena behind their formation and the mechanisms involved. First, a classification of cold
laps is given. Physical characterisation of the cold lap interface is a second important part of this
thesis. Thirdly, the factors that are supposed to have a significant influence on cold lap
formation are presented. Regarding the welding process, different influence factors are
illustrated to explain the cold lap formation.
1.3 LimitationsIn this study, the detection of cold laps has continued to be an obstacle. Since cold laps are small
in size, all standard NDT (Non‐Destructive Test) methods have failed in detecting them, and only
visual tests (as a preliminary test) and destructive tests were found to be efficient and reliable
methods.
Blasted surfaces of the base materials have been broadly introduced in industry. Therefore, this
study only focuses on blasted or burr grinding surface conditions.
According to previous studies, the solid wire can give the highest frequency of cold lap in the
welding process. One type of both welding filler material (solid wire) and base metal were used
in this study.

2
Only two types of joint were used in this study, i.e. butt joint and bead‐on‐plate, to reduce the
uncertainties of the welding process. Tandem GMAW was selected as the welding process in this
study since it was mostly applied in the workshop of VCE.
It is also important to point out that the cold laps discussed in this thesis only refer to ‘local’ cold
laps, which are compared with a type of cold lap due to a lack of fusion along the entire weld toe
in the longitudinal direction. Usually, the cold laps along the entire weld toe are due to
‘incorrect’ welding setup or a very thick oxide layer on the base metal surface. Therefore, it is
believed that the cold lap along the entire weld can be easily avoided in the modern GMAW
process.
3
2 GMAWprocess
Gas Metal Arc Welding (GMAW) refers to an arc welding process using an arc between a
continuously filling electrode and the welding pool with a shielding gas. GMAW was introduced
in the 1920s, but it was not until 1948 that it was made commercially available. When using
different shielding gases, GMAW is also called MIG (Metal Inert Gas)/MAG (Metal Active Gas) if
the shielding gas is an inert or active gas. In Europe the process is also simply called MIG
welding. The use of GMAW can bring many advantages. It can be used for almost all commercial
metals and alloys; it can be done in all positions; continuous wire feeding is possible; deposition
rates are significantly high; it is easy to automate welding; and minimal post‐weld cleaning is
required. Therefore, GMAW is utilized broadly in industry.
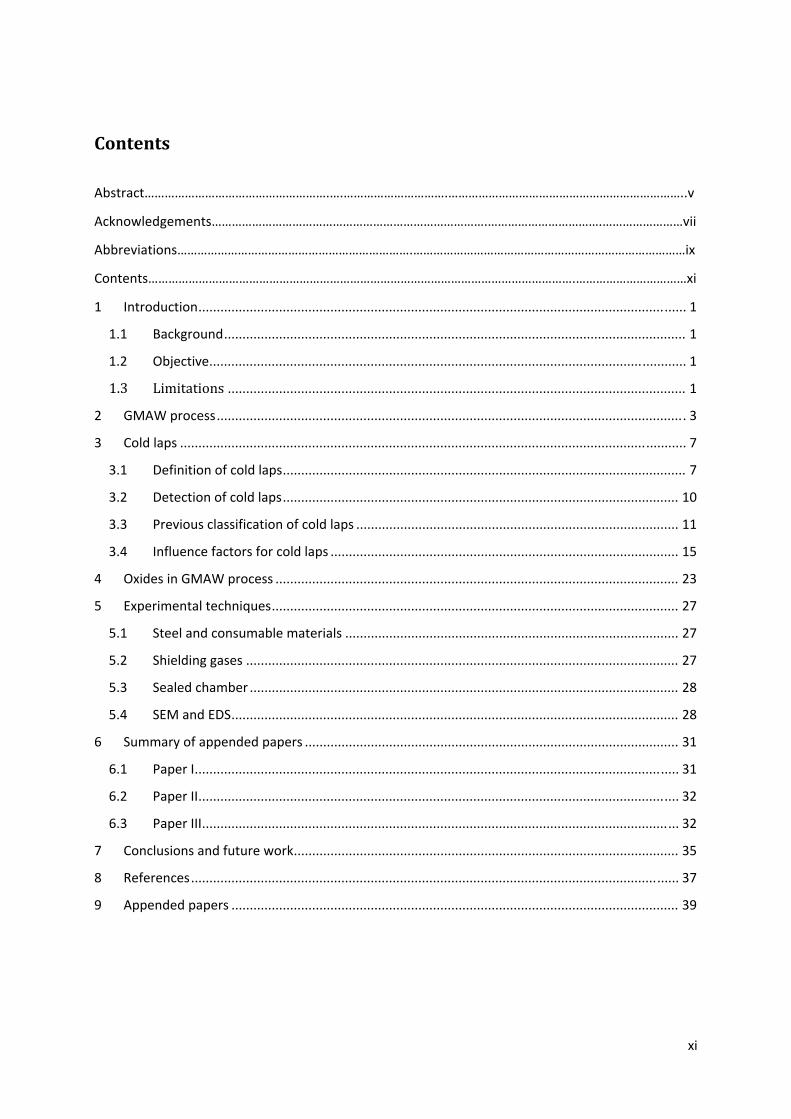
The typical equipments for GMAW include power source, wire supply reel, wire feeding drive
rollers, flexible conduit, hose package, welding gun, contact tube, gas nozzle, and shielding gas,
etc [8].
Figure 1 Typical GMAW equipment. (1: Arc; 2: Metal wire electrode; 3: Wire supply reel; 4: Wire feeding drive rollers; 5: Flexible conduit; 6: Hose package; 7: Welding gun; 8: Power source; 9: Contact tube; 10: Shielding gas; 11: Gas nozzle; 12: Weld pool.) (Adapted from [8])
The GMAW welding process is dependent on a number of welding parameters, the most
common variables being [8]:
Electrode diameter
Voltage
Wire feed speed and current
Welding speed
Electrode stick‐out
Choice of shielding gas and gas flow rate
Torch and joint position
To ensure good welding performance, most of these parameters must be optimized and
matched to each other. The working point must be within the working range or tolerance box
for the particular welding situation. Generally, the size of electrode is chosen according to the
welding current. When a higher welding current is used, an electrode with a higher diameter
should be chosen. Regarding voltage, increased voltage increases the arc length and gives a
4
wider weld bead. But too high a voltage will bring the risk of undercut. If short arc welding is
used, a higher voltage reduces the short circuit frequency, which will give larger drops and more
spatter. On the other hand, too low a voltage will increase the risk of stubbing and poor start
performance. Normally the voltage should be set for a stability arc. For GMAW, the current is set
indirectly by the wire feed speed and diameter. Current is the main parameter for welding to
achieve sufficient welding penetration. However, it is also important to strike a balance with
welding speed, voltage with respect to the arc stability, and weld quality. When setting welding
speed, this also has a considerable effect on the shape and penetration of the weld. Therefore, a
higher welding speed always accompanies higher current and voltage and may result in poor
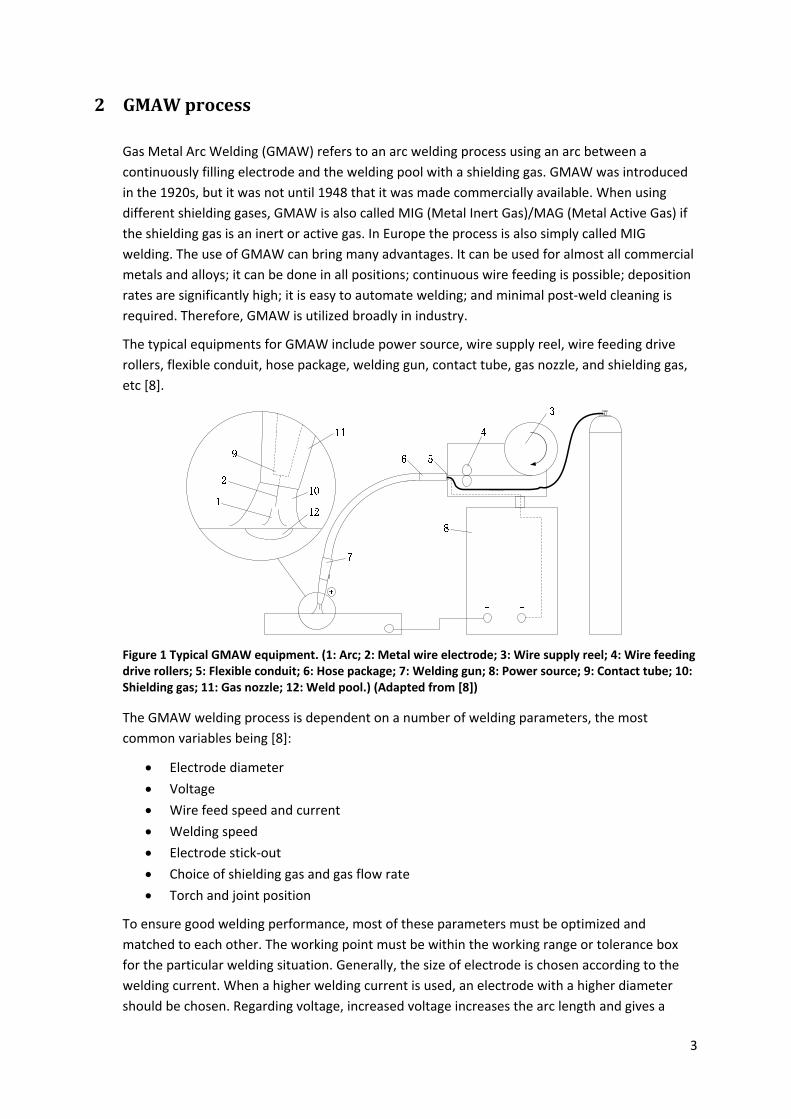
stability. Electrode extension, also called stick‐out, refers to the distance from the contact tip to
the melted electrode tip. Practically, it is easy to use the distance from the contact tip to the
workpiece (CTWD) to express electrode extension. The relationship between stick‐out, CTWD
and arc length is shown in Figure 2. Too small a stick‐out increases the risk of burn‐back, where
the arc will weld the electrode together with the contact tip. Too long a distance will increase
the risk of stubbing, especially at the start. The contact tip‐to‐work distance also has an
influence on the current and penetration profile. If the electrode extension is increased, the
current and heat input decrease while the amount of deposited metal remains the same. This
reduces the penetration, and even if it was unintentional a risk of a lack of fusion arises.
Therefore, the stick‐out is usually kept constant during the welding operation. Torch angles
relative to the joint are also an important welding parameter. If the torch/wire is directed away
from the finished part of the weld (forehand technique), this makes the penetration profile
more shallow and the width of the seam wider. On the other hand, if it is directed towards the
finished part of the weld (backhand technique), the penetration will be deeper and the seam
width will be narrower [8‐10].
Figure 2 Relationship between stick‐out, CTWD and arc length in GMAW
Solid wires and cored wires are the two types of wires used in GMAW. The latter type consists of
a metallic outer sheath, filled with flux or metal powder. The flux cored wires can have either a
rutile or basic filling. They can also be self‐shielded for use without shielding gas. The cost per
unit
sup
core
givi
GM
wel
For
the
mat
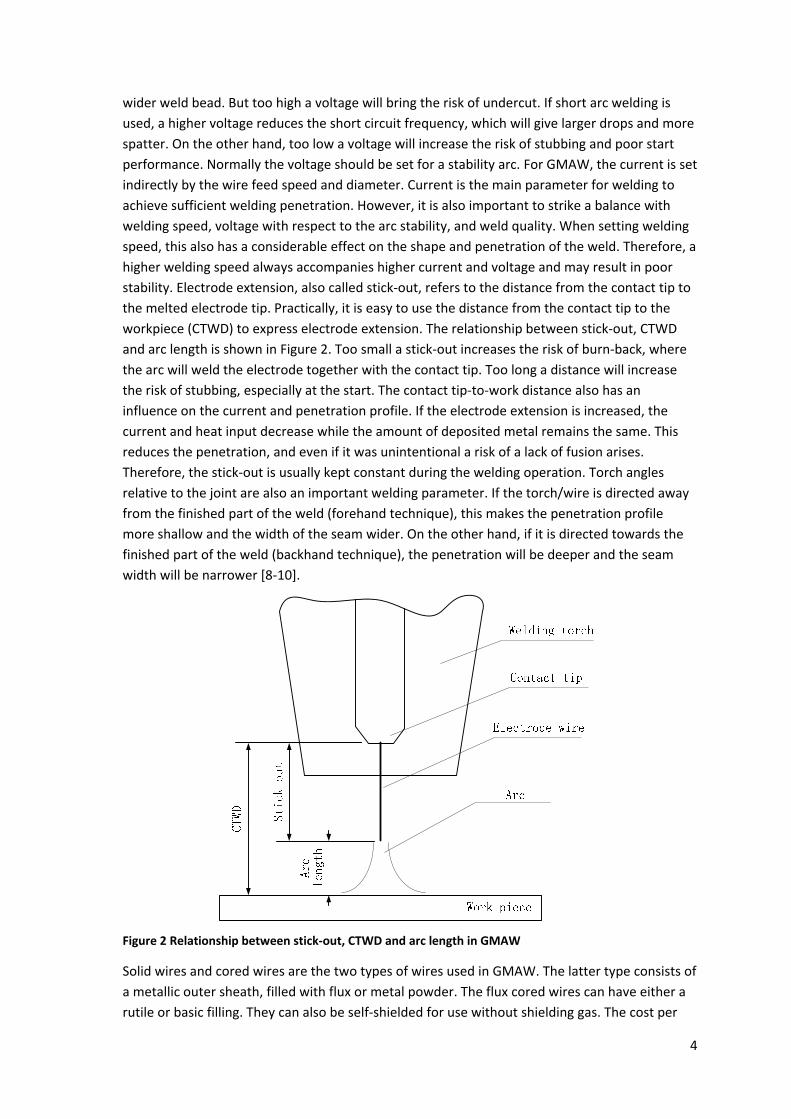
Tan
wel
are
are
indi
com
wel
mag
Figu
Mo
para
dist
t of cored wi
perior to solid
ed wires. Bas
ng a tough a
MAW is smalle
ding. The wi
GMAW, the
arc. One can
terial transpo
ndem GMAW
ding speed c
melted into
used for the
ividually. Ho
mplicated and
ding parame
gnetic arc blo
ure 3 Tandem
reover, due
ameters nee
tance betwee
ires is consid
d wires. A hig
sic flux cored
and crack res
er compared
ire is usually
e stability of t
n distinguish
ort: the spra
W is regarded
can be obtain
one commo
e wires. Ther
wever, beca
d difficult to
eter setting w
ow effect.
GMAW with
to an additio
ed to be set f
en the wires
derably highe
gh depositio
d wires have
sistant weld m
d with that us
0.9 mm to 1
the arc depe
essentially b
ay arc and th
as a type of
n by using th
on weld pool
refore, the w
use the two
set the weld
will increase
two individu
onal wire bei
for the tande
, and the rat
er than that
n rate and g
e similar perf
metal [8]. Ge
sed for subm
1.6 mm in dia
ends largely o
between two
e short arc (
f high efficien
he double wi
using two a
welding param
arcs are ver
ding current
the risk of in
ual wires and a
ing introduce
em GMAW, e
tio of current
of solid wire
ood side wa
formance to
enerally, the
merged arc a
ameter [9].
on how the m
o different ty
short‐circuit
ncy GMAW w
re. In tandem
rcs, as show
meters for ea
y close to ea
and voltage
nterference
arcs
ed into the w
e.g. the angle
t and voltage
s, but they a
ll penetratio
basic manua
size of the e
nd manual s
molten meta
ypes of arcs,
ing arc) [8, 9
welding proc
m GMAW, tw
n in Figure 3
ach wire can
ach other, it i
for each wir
between the
welding proc
e between th
e between th
are in some r
on are featur
al stick electr
electrode use
stick electrod
al is transferr
, depending o
9].
cess in which
wo individua
3. Two powe
n be set comp
is much mor
re. An incorr
e two arcs th
cess, more w
he two wires
he two wires
5
respects
es of
rodes,
ed for
de
red in
on the
h higher
l wires
r units
pletely
re
ect
hrough
welding
s, the
s.

6
7
3 Coldlaps
Cold lap is a relatively new word to describe an imperfection at the weld toe. The imperfection
was first discovered in the 1990s during experimental work to improve the fatigue properties of
welds. It was also observed at that time that cold laps can have an important influence on the
fatigue life of the welded structures. However, in terms of available literature, there are a
limited number of publications presenting studies on weld process influence on cold lap
formation or phenomena which promote cold laps. In this chapter, the few available articles are
summarized in order to give a brief overview of cold laps.
3.1 DefinitionofcoldlapsIn this thesis, cold lap refers to a crack‐like imperfection at the weld toe which has a negative
influence on the fatigue properties of the weld.
The cold lap was found in fatigue tests carried out by Lopez Martinez and Korsgren [1] in the
1990s . In their fatigue investigation, two welding methods were evaluated, i.e. Shielded Metal
Arc Welding (SMAW) and Gas Metal Arc Welding (GMAW). The welding runs were performed in
the best welding position (1G). Four different types of welding consumable materials were
involved: OK 48.00, a basic coated electrode; PZ6130, a basic flux cored wire; PZ6111, a rutile
flux cored wire; and OK 12.51, a solid wire. For GMAW, two types of shielding gases were
applied in the welding experiments. Different welding parameters, i.e. welding current, welding
voltage, and interpass temperature, were used due to the different methods and different
diameters of the electrodes. The details are shown in Table 1. Two parent materials were used,
i.e. Domex 350 XP and Weldox 900.
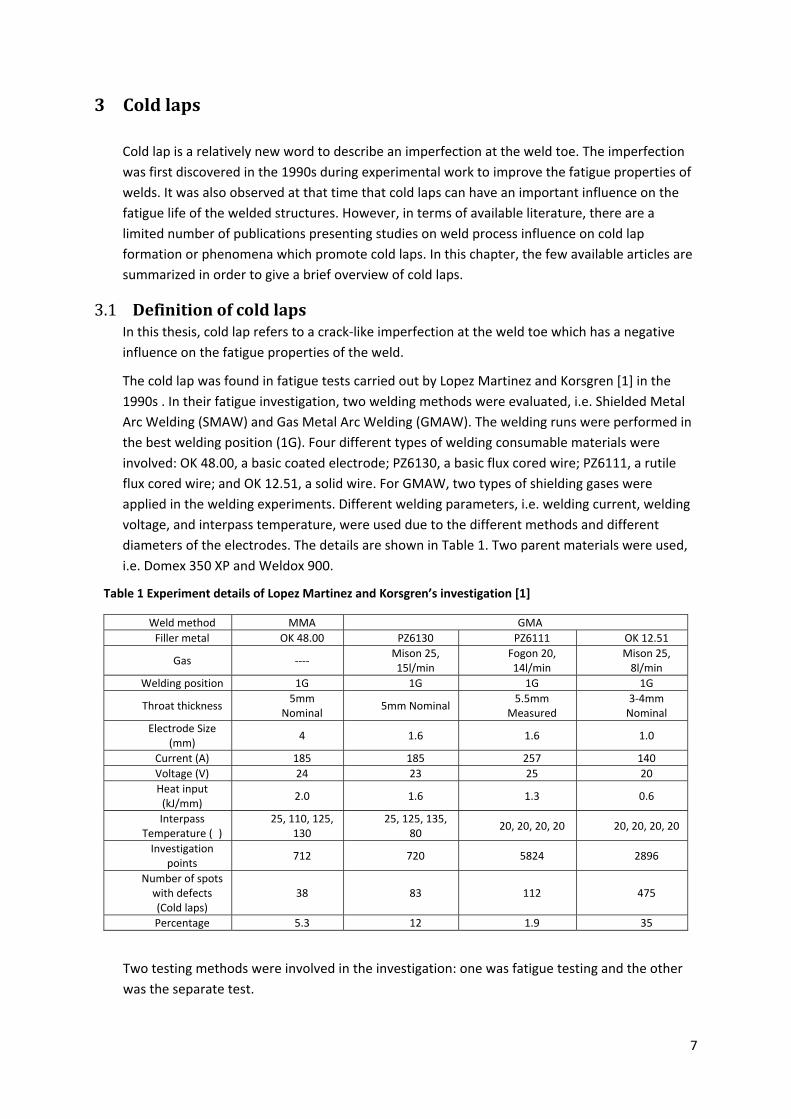
Table 1 Experiment details of Lopez Martinez and Korsgren’s investigation [1]
Weld method MMA GMA
Filler metal OK 48.00 PZ6130 PZ6111 OK 12.51
Gas ‐‐‐‐ Mison 25, 15l/min
Fogon 20, 14l/min
Mison 25, 8l/min
Welding position 1G 1G 1G 1G
Throat thickness 5mm
Nominal 5mm Nominal
5.5mm Measured
3‐4mm Nominal
Electrode Size (mm)
4 1.6 1.6 1.0
Current (A) 185 185 257 140
Voltage (V) 24 23 25 20
Heat input (kJ/mm)
2.0 1.6 1.3 0.6
Interpass Temperature (�)
25, 110, 125, 130
25, 125, 135, 80
20, 20, 20, 20 20, 20, 20, 20
Investigation points
712 720 5824 2896
Number of spots with defects (Cold laps)
38 83 112 475
Percentage 5.3 12 1.9 35
Two testing methods were involved in the investigation: one was fatigue testing and the other
was the separate test.
8
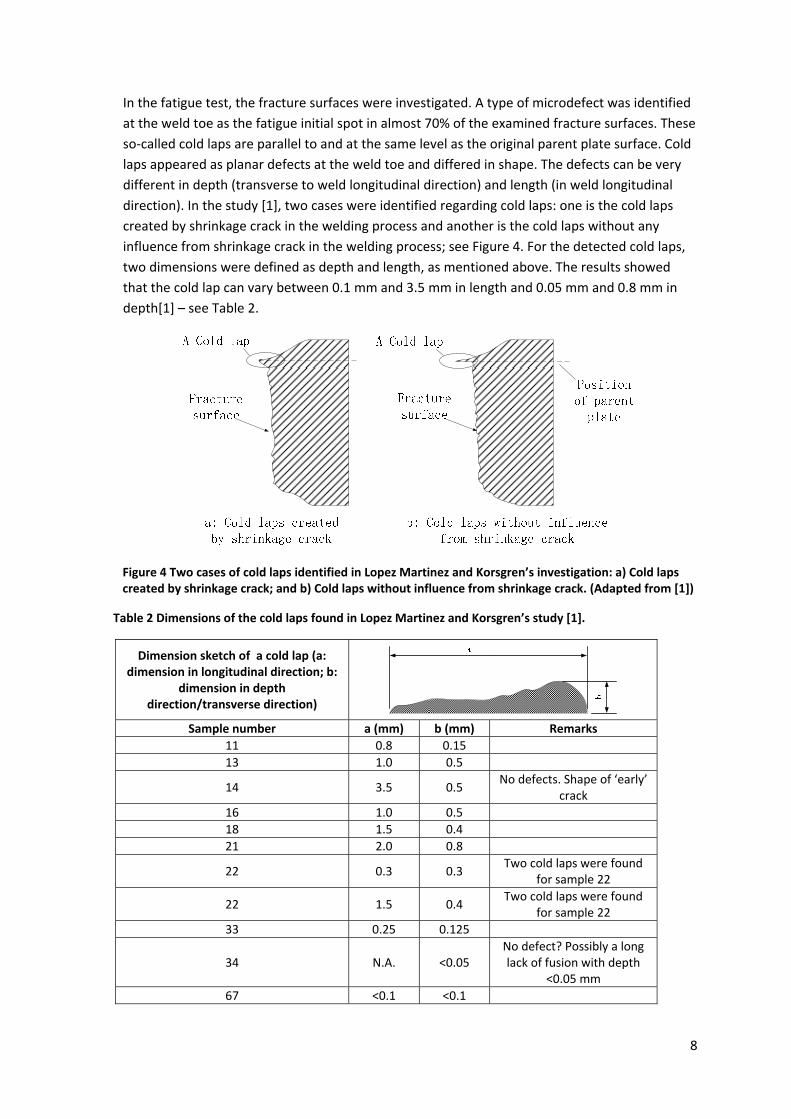
In the fatigue test, the fracture surfaces were investigated. A type of microdefect was identified
at the weld toe as the fatigue initial spot in almost 70% of the examined fracture surfaces. These
so‐called cold laps are parallel to and at the same level as the original parent plate surface. Cold
laps appeared as planar defects at the weld toe and differed in shape. The defects can be very
different in depth (transverse to weld longitudinal direction) and length (in weld longitudinal
direction). In the study [1], two cases were identified regarding cold laps: one is the cold laps
created by shrinkage crack in the welding process and another is the cold laps without any
influence from shrinkage crack in the welding process; see Figure 4. For the detected cold laps,
two dimensions were defined as depth and length, as mentioned above. The results showed
that the cold lap can vary between 0.1 mm and 3.5 mm in length and 0.05 mm and 0.8 mm in
depth[1] – see Table 2.
Figure 4 Two cases of cold laps identified in Lopez Martinez and Korsgren’s investigation: a) Cold laps created by shrinkage crack; and b) Cold laps without influence from shrinkage crack. (Adapted from [1])
Table 2 Dimensions of the cold laps found in Lopez Martinez and Korsgren’s study [1].
Dimension sketch of a cold lap (a: dimension in longitudinal direction; b:
dimension in depth direction/transverse direction)
Sample number a (mm) b (mm) Remarks
11 0.8 0.15
13 1.0 0.5
14 3.5 0.5 No defects. Shape of ‘early’
crack
16 1.0 0.5
18 1.5 0.4
21 2.0 0.8
22 0.3 0.3 Two cold laps were found
for sample 22
22 1.5 0.4 Two cold laps were found
for sample 22
33 0.25 0.125
34 N.A. <0.05 No defect? Possibly a long lack of fusion with depth
<0.05 mm
67 <0.1 <0.1
9
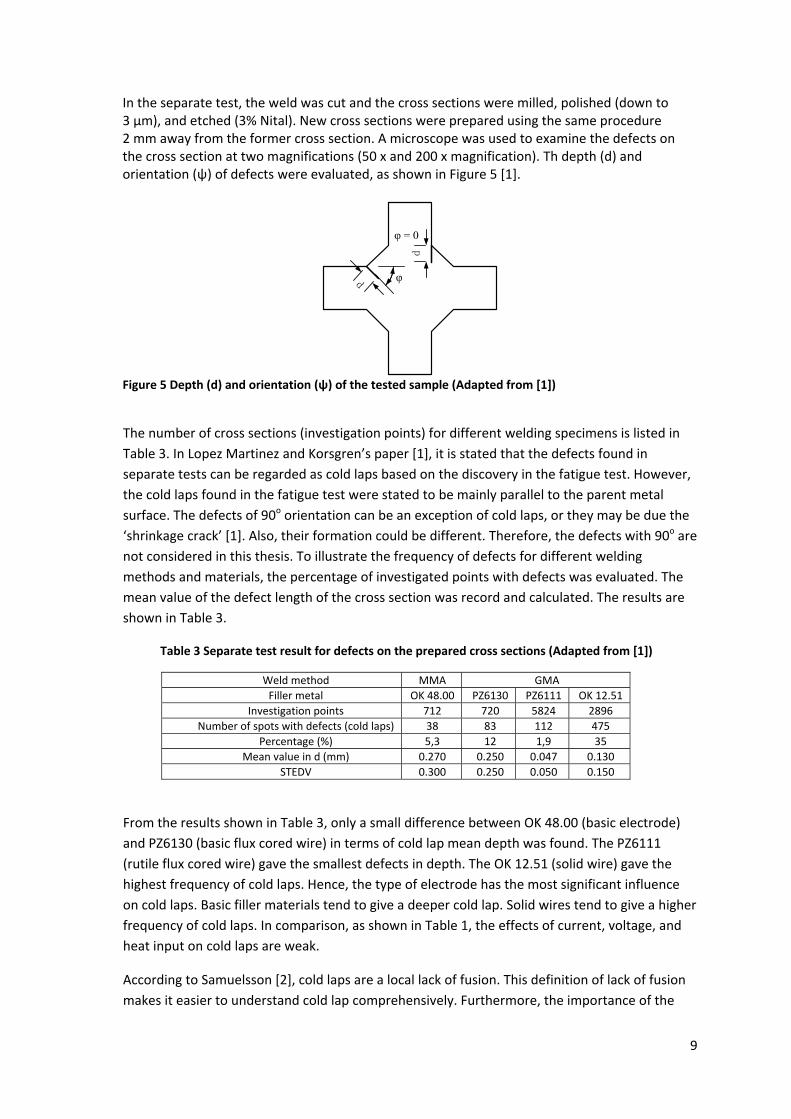
In the separate test, the weld was cut and the cross sections were milled, polished (down to 3 µm), and etched (3% Nital). New cross sections were prepared using the same procedure 2 mm away from the former cross section. A microscope was used to examine the defects on the cross section at two magnifications (50 x and 200 x magnification). Th depth (d) and orientation (ψ) of defects were evaluated, as shown in Figure 5 [1].
d
d φ
φ = 0
Figure 5 Depth (d) and orientation (ψ) of the tested sample (Adapted from [1])
The number of cross sections (investigation points) for different welding specimens is listed in
Table 3. In Lopez Martinez and Korsgren’s paper [1], it is stated that the defects found in
separate tests can be regarded as cold laps based on the discovery in the fatigue test. However,
the cold laps found in the fatigue test were stated to be mainly parallel to the parent metal
surface. The defects of 90o orientation can be an exception of cold laps, or they may be due the
‘shrinkage crack’ [1]. Also, their formation could be different. Therefore, the defects with 90o are
not considered in this thesis. To illustrate the frequency of defects for different welding
methods and materials, the percentage of investigated points with defects was evaluated. The
mean value of the defect length of the cross section was record and calculated. The results are
shown in Table 3.
Table 3 Separate test result for defects on the prepared cross sections (Adapted from [1])
Weld method MMA GMA
Filler metal OK 48.00 PZ6130 PZ6111 OK 12.51
Investigation points 712 720 5824 2896
Number of spots with defects (cold laps) 38 83 112 475
Percentage (%) 5,3 12 1,9 35
Mean value in d (mm) 0.270 0.250 0.047 0.130
STEDV 0.300 0.250 0.050 0.150
From the results shown in Table 3, only a small difference between OK 48.00 (basic electrode)
and PZ6130 (basic flux cored wire) in terms of cold lap mean depth was found. The PZ6111
(rutile flux cored wire) gave the smallest defects in depth. The OK 12.51 (solid wire) gave the
highest frequency of cold laps. Hence, the type of electrode has the most significant influence
on cold laps. Basic filler materials tend to give a deeper cold lap. Solid wires tend to give a higher
frequency of cold laps. In comparison, as shown in Table 1, the effects of current, voltage, and
heat input on cold laps are weak.
According to Samuelsson [2], cold laps are a local lack of fusion. This definition of lack of fusion
makes it easier to understand cold lap comprehensively. Furthermore, the importance of the
10
lack of fusion definition is to imply cold lap formation as the conventional lack of fusion, e.g. lack
of energy/heat, improper preweld cleaning, and incorrect welding techniques/operation, etc
[11].
3.2 DetectionofcoldlapsAs mentioned above, cold laps are very small in size (0.1 mm‐3.5 mm in length and 0.05 mm‐
0.8 mm in depth). It is very hard to detect cold laps by any NDT method. The conventional
method for detecting cold laps is cutting, polishing and investigating the cross section by
microscopy.
However, this method cannot give information about the length of the cold laps along the
weld bead. Also, it is hard to get an overview of the number of cold laps in the weld.
Therefore, a new destructive method was developed by Holst et al. [5] which can successfully
detect cold laps.
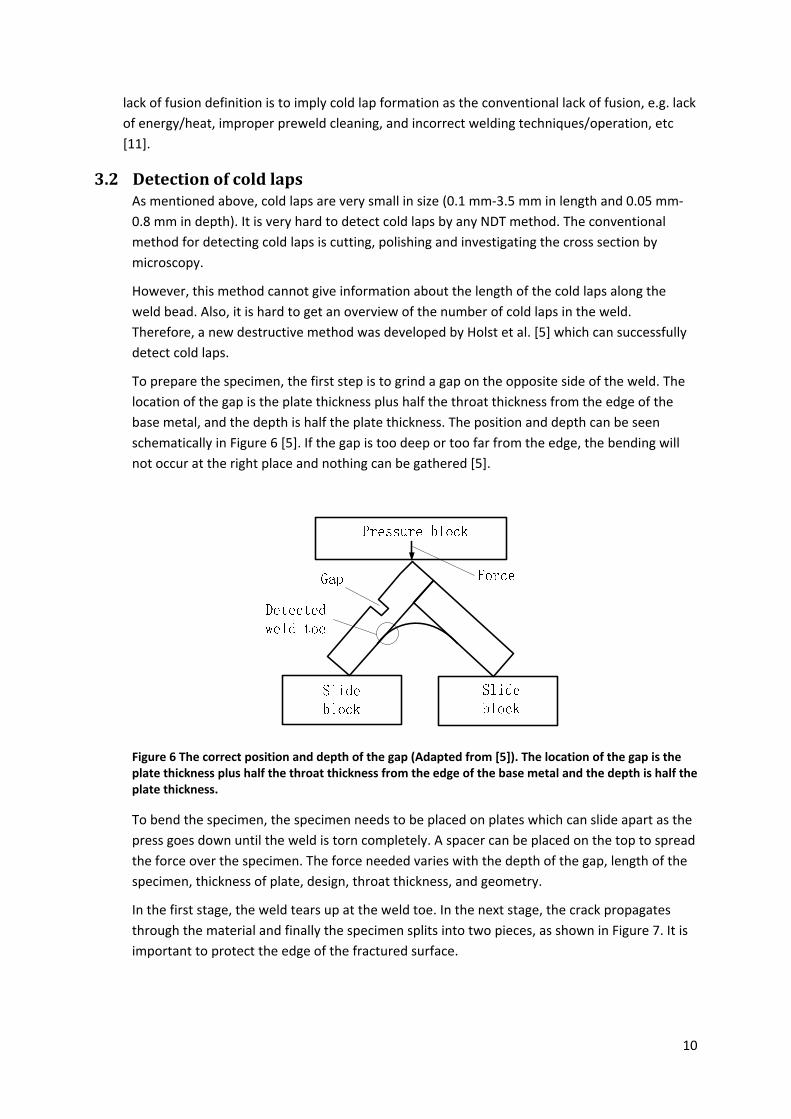
To prepare the specimen, the first step is to grind a gap on the opposite side of the weld. The
location of the gap is the plate thickness plus half the throat thickness from the edge of the
base metal, and the depth is half the plate thickness. The position and depth can be seen
schematically in Figure 6 [5]. If the gap is too deep or too far from the edge, the bending will
not occur at the right place and nothing can be gathered [5].
Figure 6 The correct position and depth of the gap (Adapted from [5]). The location of the gap is the plate thickness plus half the throat thickness from the edge of the base metal and the depth is half the plate thickness.
To bend the specimen, the specimen needs to be placed on plates which can slide apart as the
press goes down until the weld is torn completely. A spacer can be placed on the top to spread
the force over the specimen. The force needed varies with the depth of the gap, length of the
specimen, thickness of plate, design, throat thickness, and geometry.
In the first stage, the weld tears up at the weld toe. In the next stage, the crack propagates
through the material and finally the specimen splits into two pieces, as shown in Figure 7. It is
important to protect the edge of the fractured surface.
11
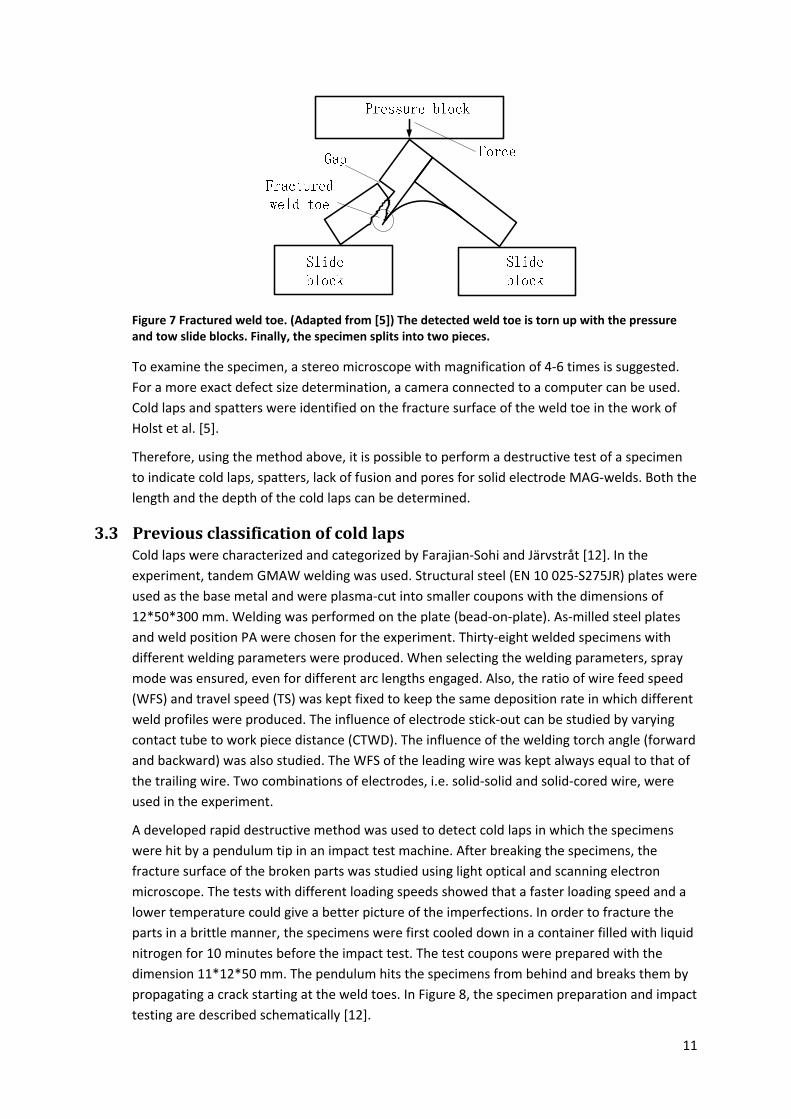
Figure 7 Fractured weld toe. (Adapted from [5]) The detected weld toe is torn up with the pressure and tow slide blocks. Finally, the specimen splits into two pieces.
To examine the specimen, a stereo microscope with magnification of 4‐6 times is suggested.
For a more exact defect size determination, a camera connected to a computer can be used.
Cold laps and spatters were identified on the fracture surface of the weld toe in the work of
Holst et al. [5].
Therefore, using the method above, it is possible to perform a destructive test of a specimen
to indicate cold laps, spatters, lack of fusion and pores for solid electrode MAG‐welds. Both the
length and the depth of the cold laps can be determined.
3.3 PreviousclassificationofcoldlapsCold laps were characterized and categorized by Farajian‐Sohi and Järvstråt [12]. In the
experiment, tandem GMAW welding was used. Structural steel (EN 10 025‐S275JR) plates were
used as the base metal and were plasma‐cut into smaller coupons with the dimensions of
12*50*300 mm. Welding was performed on the plate (bead‐on‐plate). As‐milled steel plates
and weld position PA were chosen for the experiment. Thirty‐eight welded specimens with
different welding parameters were produced. When selecting the welding parameters, spray
mode was ensured, even for different arc lengths engaged. Also, the ratio of wire feed speed
(WFS) and travel speed (TS) was kept fixed to keep the same deposition rate in which different
weld profiles were produced. The influence of electrode stick‐out can be studied by varying
contact tube to work piece distance (CTWD). The influence of the welding torch angle (forward
and backward) was also studied. The WFS of the leading wire was kept always equal to that of
the trailing wire. Two combinations of electrodes, i.e. solid‐solid and solid‐cored wire, were
used in the experiment.
A developed rapid destructive method was used to detect cold laps in which the specimens
were hit by a pendulum tip in an impact test machine. After breaking the specimens, the
fracture surface of the broken parts was studied using light optical and scanning electron
microscope. The tests with different loading speeds showed that a faster loading speed and a
lower temperature could give a better picture of the imperfections. In order to fracture the
parts in a brittle manner, the specimens were first cooled down in a container filled with liquid
nitrogen for 10 minutes before the impact test. The test coupons were prepared with the
dimension 11*12*50 mm. The pendulum hits the specimens from behind and breaks them by
propagating a crack starting at the weld toes. In Figure 8, the specimen preparation and impact
testing are described schematically [12].
Figint[1pe
By
an
pr
Us
kn
In
sh
fra
Fig
hi
lo
th
so
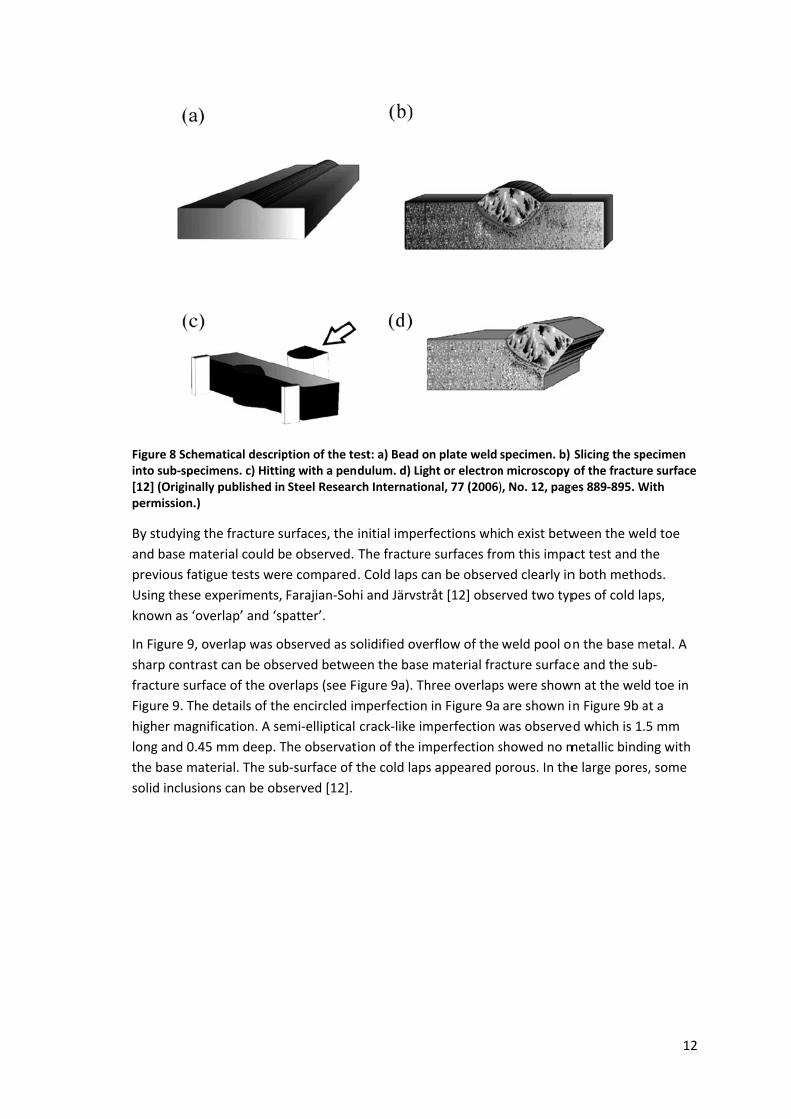
gure 8 Schemto sub‐specim2] (Originally ermission.)
y studying th
nd base mate
revious fatigu
sing these ex
nown as ‘ove
Figure 9, ov
harp contrast
acture surfac
gure 9. The d
gher magnif
ng and 0.45
he base mate
olid inclusion
matical descripmens. c) Hittinpublished in
he fracture su
erial could be
ue tests wer
xperiments,
erlap’ and ‘sp
verlap was ob
t can be obse
ce of the ove
details of the
fication. A se
mm deep. T
erial. The sub
ns can be obs
ption of the teng with a pendSteel Researc
urfaces, the
e observed.
e compared
Farajian‐Soh
patter’.
bserved as so
erved betwe
erlaps (see F
e encircled im
mi‐elliptical
The observat
b‐surface of t
served [12].
est: a) Bead odulum. d) Ligch Internation
initial imper
The fracture
. Cold laps ca
hi and Järvstr
olidified ove
een the base
igure 9a). Th
mperfection
crack‐like im
ion of the im
the cold laps
n plate weld ht or electronnal, 77 (2006)
fections whi
e surfaces fro
an be observ
råt [12] obse
rflow of the
material fra
hree overlaps
in Figure 9a
mperfection w
mperfection s
s appeared p
specimen. b) n microscopy ), No. 12, page
ch exist betw
om this impa
ved clearly in
erved two typ
weld pool o
cture surfac
s were show
are shown i
was observe
showed no m
porous. In the
Slicing the spof the fractures 889‐895. W
ween the we
act test and t
n both metho
pes of cold la
n the base m
ce and the su
wn at the wel
n Figure 9b a
ed which is 1.
metallic bind
e large pores
12
pecimen re surface With
eld toe
the
ods.
aps,
metal. A
ub‐
d toe in
at a
.5 mm
ing with
s, some
Figsp(Ope
To
sp
po
an
ox
in
bo
FigInt
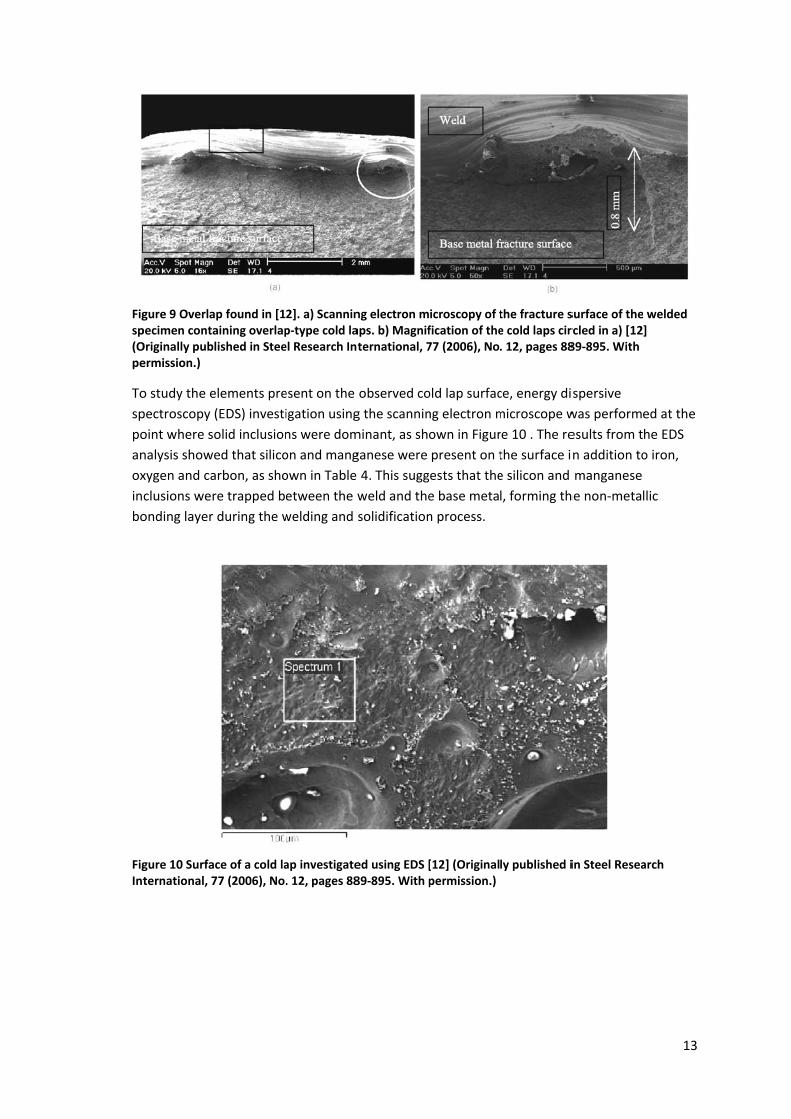
gure 9 Overlapecimen contaOriginally pubermission.)
o study the e
pectroscopy
oint where so
nalysis showe
xygen and ca
clusions wer
onding layer
gure 10 Surfaternational, 7
ap found in [1aining overlaplished in Stee
elements pre
(EDS) investi
olid inclusion
ed that silico
arbon, as sho
re trapped b
during the w
ce of a cold la77 (2006), No.
2]. a) Scanninp‐type cold lael Research Int
esent on the
igation using
ns were dom
on and mang
own in Table
etween the w
welding and
ap investigate. 12, pages 88
ng electron maps. b) Magnifternational, 7
observed co
g the scannin
minant, as sh
ganese were
4. This sugg
weld and the
solidification
ed using EDS [89‐895. With p
icroscopy of tfication of the77 (2006), No
old lap surfac
ng electron m
own in Figur
present on t
gests that the
e base meta
n process.
[12] (Originalpermission.)
the fracture se cold laps cir. 12, pages 88
ce, energy di
microscope w
re 10 . The re
the surface i
e silicon and
l, forming th
ly published i
surface of thercled in a) [1289‐895. With
spersive
was performe
esults from t
n addition to
manganese
he non‐metal
in Steel Resea
13
welded ]
ed at the
he EDS
o iron,
llic
arch

14
Table 4 Chemical composition obtained by EDS investigation of one cold lap surface, as shown in Figure 10. (Modified from [12])
Element Weight (%) Atomic (%)
C 2.07 7.31
O 9.11 24.15
Si 0.91 1.37
Mn 1.50 1.16
Fe 85.75 65.13
Another type of cold lap found by Farajian‐Sohi and Järvstråt [12] is named ‘spatter’. The
length of a single spatter is much shorter than that of the overlap‐type cold laps, and in
general the aspect ratio (a/c a: crack depth, 2c: crack length) of spatter‐like cold laps is larger
than that of overlap‐like cold laps. In Figure 11, a single spatter trapped within the weld metal
at the weld toe is shown. The observed spatter has a diameter of around 200 μm and was
believed to be covered by the weld weaves. Some oxides were also found surrounding the
spatter, which is the same material as the inclusions in the pores on the overlap surface. A
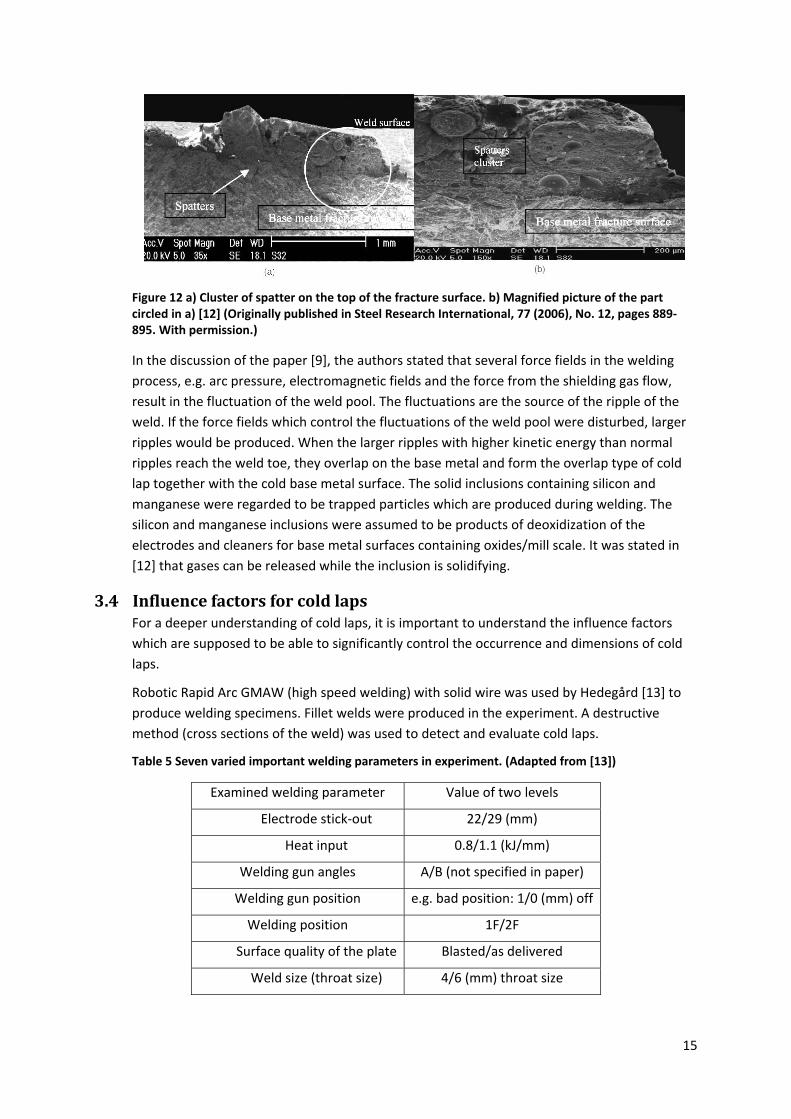
cluster of spatter was also observed at the edge of the fracture surface, as shown in Figure 12.
Between the sticking spatters, oxides and pores were stated to be found. The length of this
spatter cluster is 1.8 mm and its depth is 0.6 mm.
Figure 11 Spatter found in [12]. a) Single spatter on the top of the fracture surface. b) Magnified picture of the spatter in the left image. [12] (Originally published in Steel Research International, 77 (2006), No. 12, pages 889‐895. With permission.)
15
Figure 12 a) Cluster of spatter on the top of the fracture surface. b) Magnified picture of the part circled in a) [12] (Originally published in Steel Research International, 77 (2006), No. 12, pages 889‐895. With permission.)
In the discussion of the paper [9], the authors stated that several force fields in the welding
process, e.g. arc pressure, electromagnetic fields and the force from the shielding gas flow,
result in the fluctuation of the weld pool. The fluctuations are the source of the ripple of the
weld. If the force fields which control the fluctuations of the weld pool were disturbed, larger
ripples would be produced. When the larger ripples with higher kinetic energy than normal
ripples reach the weld toe, they overlap on the base metal and form the overlap type of cold
lap together with the cold base metal surface. The solid inclusions containing silicon and
manganese were regarded to be trapped particles which are produced during welding. The
silicon and manganese inclusions were assumed to be products of deoxidization of the
electrodes and cleaners for base metal surfaces containing oxides/mill scale. It was stated in
[12] that gases can be released while the inclusion is solidifying.
3.4 InfluencefactorsforcoldlapsFor a deeper understanding of cold laps, it is important to understand the influence factors
which are supposed to be able to significantly control the occurrence and dimensions of cold
laps.
Robotic Rapid Arc GMAW (high speed welding) with solid wire was used by Hedegård [13] to
produce welding specimens. Fillet welds were produced in the experiment. A destructive
method (cross sections of the weld) was used to detect and evaluate cold laps.
Table 5 Seven varied important welding parameters in experiment. (Adapted from [13])
Examined welding parameter Value of two levels
Electrode stick‐out 22/29 (mm)
Heat input 0.8/1.1 (kJ/mm)
Welding gun angles A/B (not specified in paper)
Welding gun position e.g. bad position: 1/0 (mm) off
Welding position 1F/2F
Surface quality of the plate Blasted/as delivered
Weld size (throat size) 4/6 (mm) throat size

16
In the experiment, multi‐factorial tests were performed and eight test series were welded,
consisting of three specimens each. Seven important welding parameters were varied in a
standardised and reduced two‐level multi‐factorial test. The welding parameters examined are
shown below.
In total, twenty‐five independent cuts were made for each series. By evaluating the cross
sections, three significant parameters were revealed for cold lap occurrence, i.e. welding
position, surface condition, and welding gun position [13].
The most important parameters for GMAW, as considered by Farajian‐Sohi and Järvstråt [14]
in their experiment, are listed in Table 6.
Table 6 Nominal weld parameters. (Controlled parameters are denoted by *, those held fixed are denoted by o, and those fully determined by controlled parameters are denoted by †.) (Adapted from [14])
Welding
parameter Base material
Filler materials and
Shielding gas
Total wire feed speed* (21 m/s)
Alloy o (Steel, EN 10 025‐S275JR)
Wire type* (solid: OK Autrod 12.51, metal cored: OK Tubrod 14.12)
Weld torch angle* (0, vertical)
Plate thickness o
(12 mm) Wire diameter o (1.2 mm, leading and
trailing)
Arc length* (4 mm) Surface quality o
(As rolled) Distance between the two contact
tubes o (20 mm)
Contact tube to work distance (16 mm)*
geometry o (50×300 mm, bead‐on‐plate)
Gas type*: 92% Ar and 8% Co2
Electrode stick‐out† Welding position o (Horizontal, PA) Gas flow rate o (28 l/min)
Current†
Voltage†
Welding speed†
A fractional factorial two level model with one replication was chosen to design the
experiment using the software MODDE. Six variables of the welding parameters for tandem
GMAW with two levels were involved in experimental design, as shown in Table 7 [14].
A total number of 38 weld specimens with different and controlled welding parameters were
produced according to the work sheet, as shown in Table 8 [14]. Strangely, the two level of
CTWD used are 13 mm and 15 mm instead of the levels shown in Table 7.
17
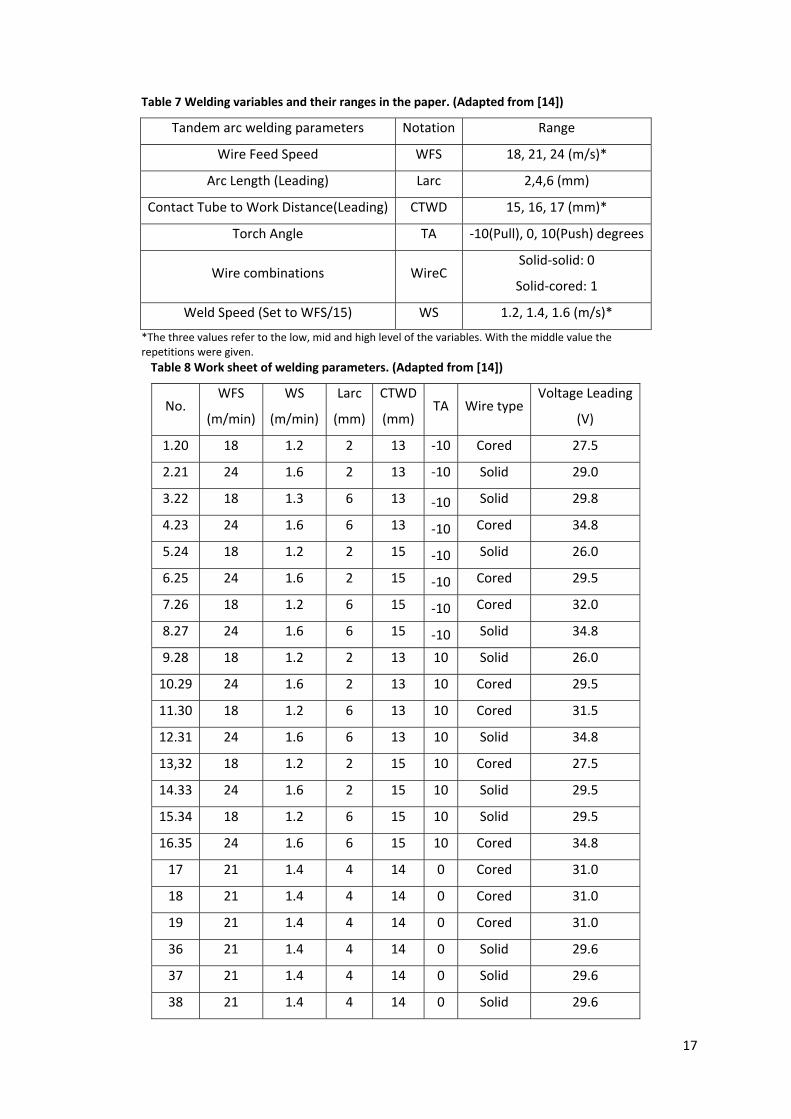
Table 7 Welding variables and their ranges in the paper. (Adapted from [14])
Tandem arc welding parameters Notation Range
Wire Feed Speed WFS 18, 21, 24 (m/s)*
Arc Length (Leading) Larc 2,4,6 (mm)
Contact Tube to Work Distance(Leading) CTWD 15, 16, 17 (mm)*
Torch Angle TA ‐10(Pull), 0, 10(Push) degrees
Wire combinations WireC Solid‐solid: 0
Solid‐cored: 1
Weld Speed (Set to WFS/15) WS 1.2, 1.4, 1.6 (m/s)*
*The three values refer to the low, mid and high level of the variables. With the middle value the repetitions were given.
Table 8 Work sheet of welding parameters. (Adapted from [14])
No. WFS
(m/min)
WS
(m/min)
Larc
(mm)
CTWD
(mm) TA Wire type
Voltage Leading
(V)
1.20 18 1.2 2 13 ‐10 Cored 27.5
2.21 24 1.6 2 13 ‐10 Solid 29.0
3.22 18 1.3 6 13 ‐10 Solid 29.8
4.23 24 1.6 6 13 ‐10 Cored 34.8
5.24 18 1.2 2 15 ‐10 Solid 26.0
6.25 24 1.6 2 15 ‐10 Cored 29.5
7.26 18 1.2 6 15 ‐10 Cored 32.0
8.27 24 1.6 6 15 ‐10 Solid 34.8
9.28 18 1.2 2 13 10 Solid 26.0
10.29 24 1.6 2 13 10 Cored 29.5
11.30 18 1.2 6 13 10 Cored 31.5
12.31 24 1.6 6 13 10 Solid 34.8
13,32 18 1.2 2 15 10 Cored 27.5
14.33 24 1.6 2 15 10 Solid 29.5
15.34 18 1.2 6 15 10 Solid 29.5
16.35 24 1.6 6 15 10 Cored 34.8
17 21 1.4 4 14 0 Cored 31.0
18 21 1.4 4 14 0 Cored 31.0
19 21 1.4 4 14 0 Cored 31.0
36 21 1.4 4 14 0 Solid 29.6
37 21 1.4 4 14 0 Solid 29.6
38 21 1.4 4 14 0 Solid 29.6
18
To evaluate the specimens, both the conventional cross‐section method and the developed
impacted destructive method (as mentioned in the above chapter) were engaged. Light optical
and scanning electron microscope was used for the investigations. Two types of cold lap were
observed in this study [14], i.e. overlap and spatters, and Mn and Si inclusion was also found
on the surface of the flaw [14].
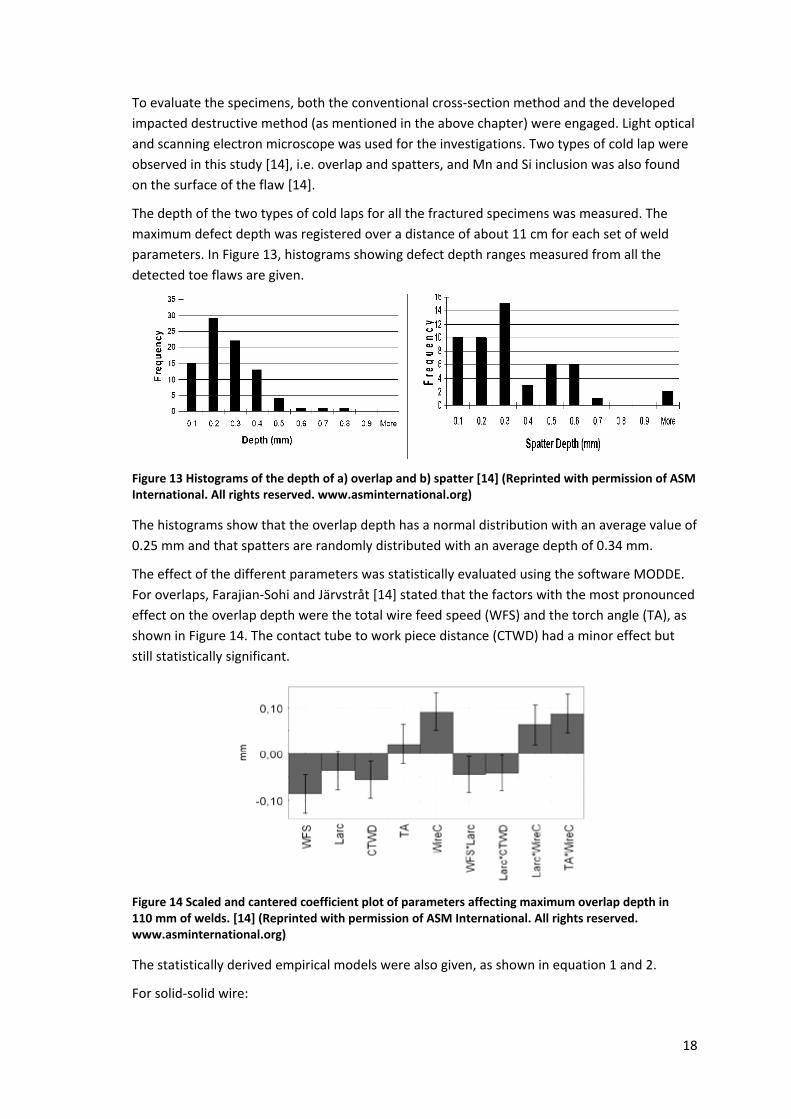
The depth of the two types of cold laps for all the fractured specimens was measured. The
maximum defect depth was registered over a distance of about 11 cm for each set of weld
parameters. In Figure 13, histograms showing defect depth ranges measured from all the
detected toe flaws are given.
Figure 13 Histograms of the depth of a) overlap and b) spatter [14] (Reprinted with permission of ASM International. All rights reserved. www.asminternational.org)
The histograms show that the overlap depth has a normal distribution with an average value of
0.25 mm and that spatters are randomly distributed with an average depth of 0.34 mm.
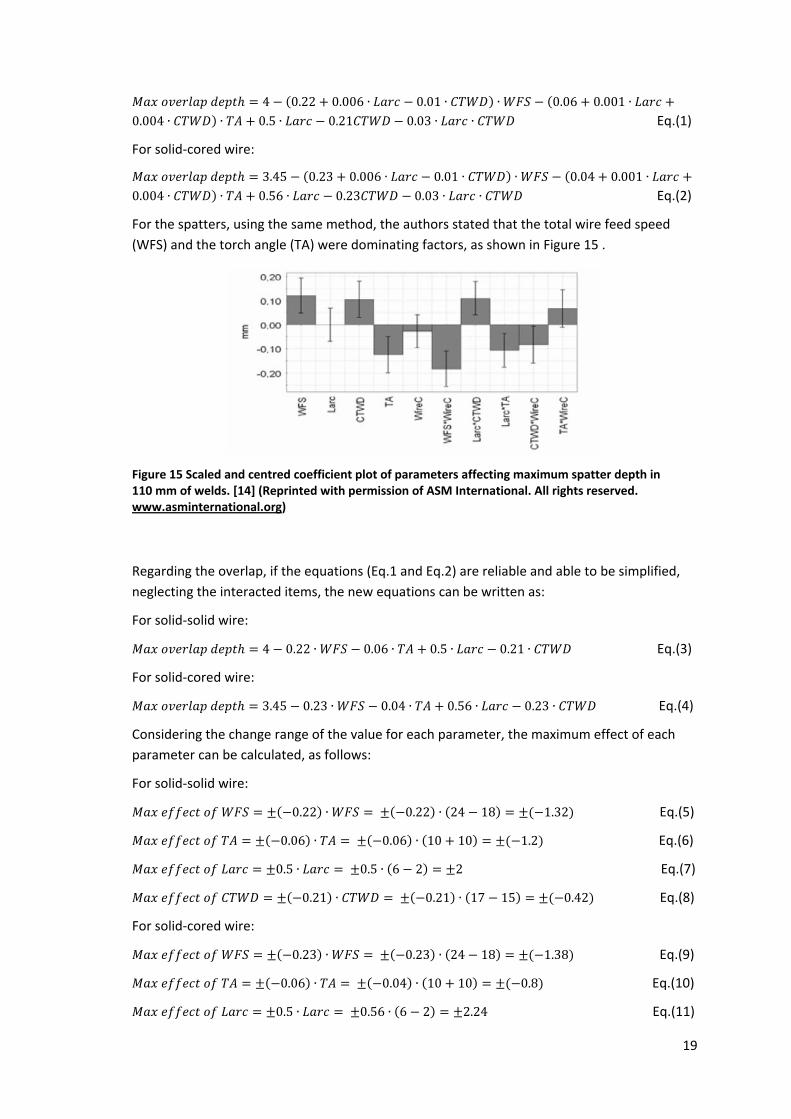
The effect of the different parameters was statistically evaluated using the software MODDE.
For overlaps, Farajian‐Sohi and Järvstråt [14] stated that the factors with the most pronounced
effect on the overlap depth were the total wire feed speed (WFS) and the torch angle (TA), as
shown in Figure 14. The contact tube to work piece distance (CTWD) had a minor effect but
still statistically significant.
Figure 14 Scaled and cantered coefficient plot of parameters affecting maximum overlap depth in 110 mm of welds. [14] (Reprinted with permission of ASM International. All rights reserved. www.asminternational.org)
The statistically derived empirical models were also given, as shown in equation 1 and 2.
For solid‐solid wire:
19
4 0.22 0.006 ∙ 0.01 ∙ ∙ 0.06 0.001 ∙0.004 ∙ ∙ 0.5 ∙ 0.21 0.03 ∙ ∙ Eq.(1) For solid‐cored wire:
3.45 0.23 0.006 ∙ 0.01 ∙ ∙ 0.04 0.001 ∙0.004 ∙ ∙ 0.56 ∙ 0.23 0.03 ∙ ∙ Eq.(2)
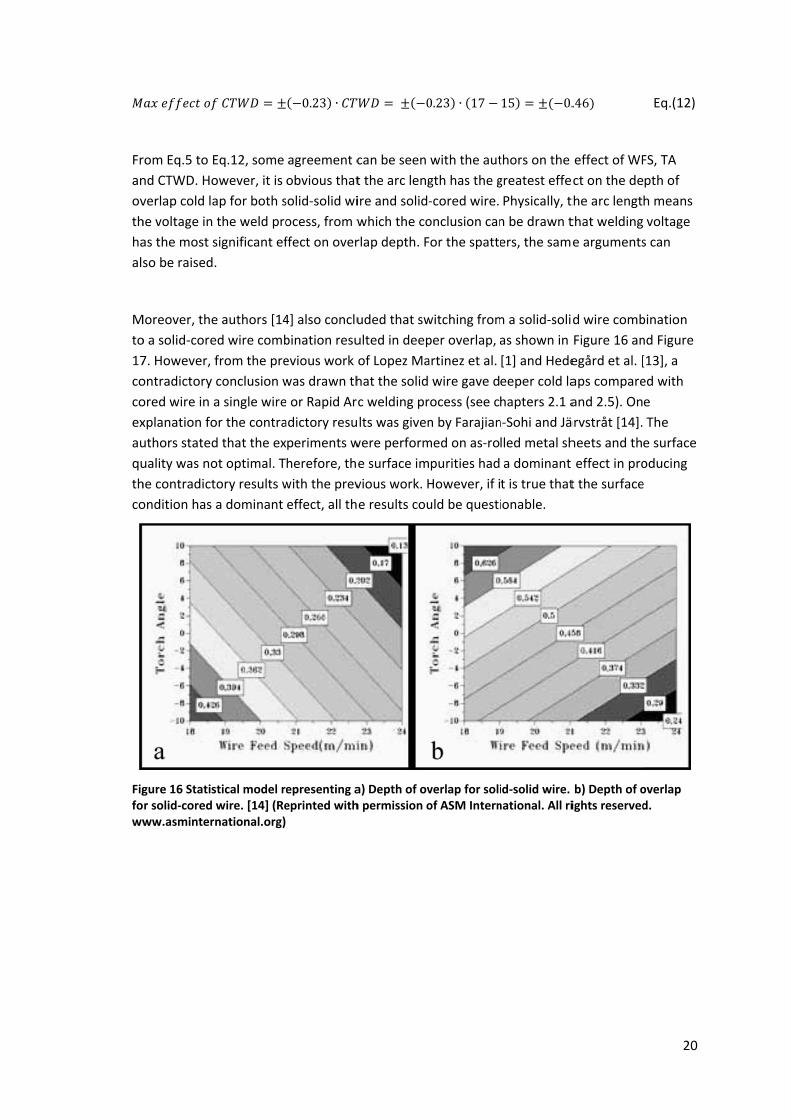
For the spatters, using the same method, the authors stated that the total wire feed speed
(WFS) and the torch angle (TA) were dominating factors, as shown in Figure 15 .
Figure 15 Scaled and centred coefficient plot of parameters affecting maximum spatter depth in 110 mm of welds. [14] (Reprinted with permission of ASM International. All rights reserved. www.asminternational.org)
Regarding the overlap, if the equations (Eq.1 and Eq.2) are reliable and able to be simplified,
neglecting the interacted items, the new equations can be written as:
For solid‐solid wire:
4 0.22 ∙ 0.06 ∙ 0.5 ∙ 0.21 ∙ Eq.(3) For solid‐cored wire:
3.45 0.23 ∙ 0.04 ∙ 0.56 ∙ 0.23 ∙ Eq.(4) Considering the change range of the value for each parameter, the maximum effect of each
parameter can be calculated, as follows:
For solid‐solid wire:
0.22 ∙ 0.22 ∙ 24 18 1.32 Eq.(5) 0.06 ∙ 0.06 ∙ 10 10 1.2 Eq.(6) 0.5 ∙ 0.5 ∙ 6 2 2 Eq.(7) 0.21 ∙ 0.21 ∙ 17 15 0.42 Eq.(8)
For solid‐cored wire:
0.23 ∙ 0.23 ∙ 24 18 1.38 Eq.(9) 0.06 ∙ 0.04 ∙ 10 10 0.8 Eq.(10) 0.5 ∙ 0.56 ∙ 6 2 2.24 Eq.(11)
Fr
an
ov
th
ha
als
M
to
17
co
co
ex
au
qu
th
co
Figfoww
rom Eq.5 to E
nd CTWD. Ho
verlap cold la
he voltage in
as the most s
so be raised
Moreover, the
o a solid‐core
7. However,
ontradictory
ored wire in a
xplanation fo
uthors stated
uality was no
he contradict
ondition has
gure 16 Statisr solid‐cored ww.asminter
Eq.12, some
owever, it is
ap for both s
the weld pro
significant ef
.
e authors [14
ed wire comb
from the pre
conclusion w
a single wire
or the contra
d that the ex
ot optimal. T
tory results w
a dominant
stical model rwire. [14] (Renational.org)
0.23 ∙
agreement c
obvious that
solid‐solid wi
ocess, from w
ffect on over
4] also conclu
bination resu
evious work
was drawn th
e or Rapid Ar
adictory resu
periments w
herefore, th
with the prev
effect, all th
epresenting aeprinted with
0
can be seen
t the arc leng
ire and solid‐
which the co
rlap depth. F
uded that sw
ulted in deep
of Lopez Ma
hat the solid
c welding pr
lts was given
were perform
e surface im
vious work. H
e results cou
a) Depth of ovh permission o
0.23 ∙ 17
with the aut
gth has the g
‐cored wire.
onclusion can
For the spatte
witching from
per overlap, a
artinez et al.
wire gave d
rocess (see c
n by Farajian
med on as‐ro
purities had
However, if i
uld be questi
verlap for soliof ASM Intern
15 0.
thors on the
greatest effe
Physically, t
n be drawn t
ers, the sam
m a solid‐soli
as shown in
[1] and Hede
eeper cold la
hapters 2.1 a
n‐Sohi and Jä
lled metal sh
a dominant
t is true that
ionable.
id‐solid wire. national. All ri
.46
effect of WF
ct on the de
the arc lengt
that welding
e arguments
d wire comb
Figure 16 an
egård et al. [
aps compare
and 2.5). On
ärvstråt [14].
heets and th
effect in pro
t the surface
b) Depth of oights reserved
20
Eq.(12)
FS, TA
pth of
h means
voltage
s can
bination
nd Figure
[13], a
ed with
e
The
e surface
oducing
e
overlap d.
Figsoww
Fu
im
le
ex
fa
sig
Lo
m
sp
us
fa
lo
w
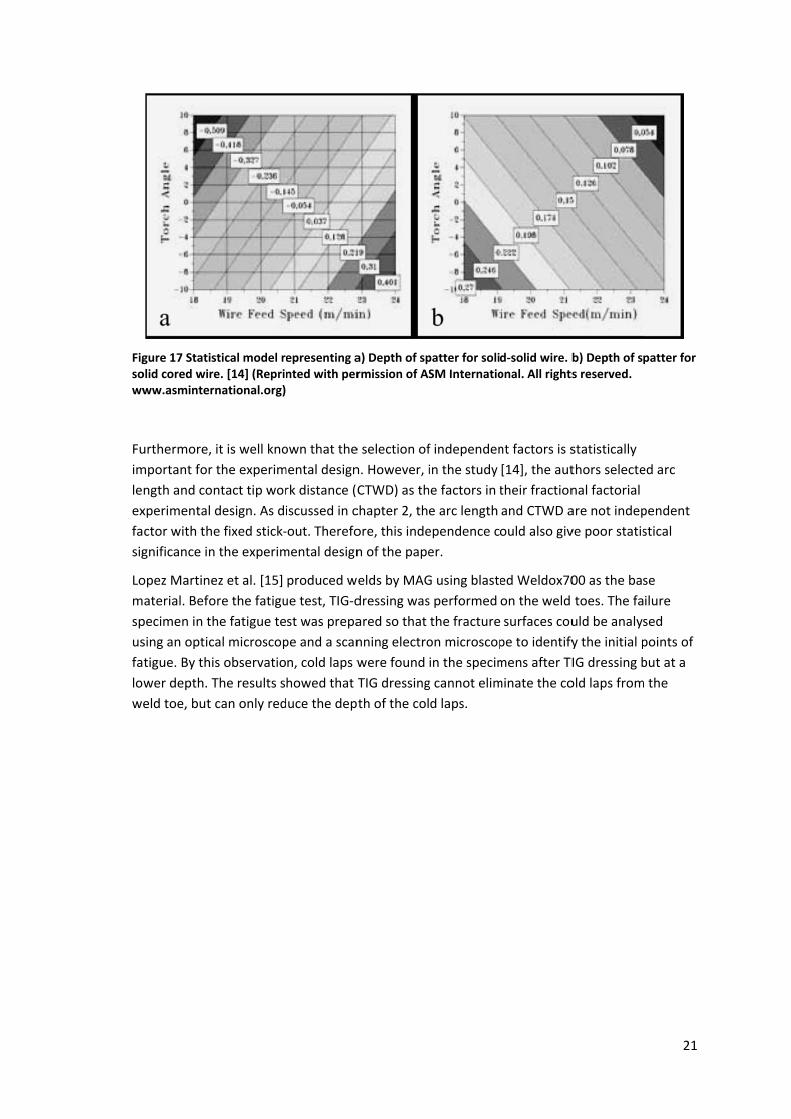
gure 17 Statisolid cored wireww.asminter
urthermore,
mportant for
ngth and con
xperimental
ctor with the
gnificance in
opez Martine
aterial. Befo
pecimen in th
sing an optic
tigue. By thi
wer depth. T
eld toe, but
stical model re. [14] (Reprinational.org)
it is well kno
the experim
ntact tip wor
design. As di
e fixed stick‐
the experim
ez et al. [15]
ore the fatigu
he fatigue te
al microscop
s observatio
The results s
can only red
epresenting anted with per
own that the
mental design
rk distance (C
iscussed in c
‐out. Therefo
mental design
produced w
ue test, TIG‐d
st was prepa
pe and a scan
n, cold laps w
howed that T
duce the dep
a) Depth of sprmission of AS
e selection of
n. However, i
CTWD) as th
chapter 2, th
ore, this inde
n of the pape
elds by MAG
dressing was
ared so that
nning electro
were found
TIG dressing
th of the col
patter for soliSM Internatio
f independen
in the study
he factors in t
e arc length
ependence c
er.
G using blaste
s performed
the fracture
on microscop
in the specim
g cannot elim
d laps.
d‐solid wire. bonal. All rights
nt factors is s
[14], the aut
their fraction
and CTWD a
ould also giv
ed Weldox70
on the weld
surfaces cou
pe to identify
mens after TI
minate the co
b) Depth of ss reserved.
statistically
thors selecte
nal factorial
are not indep
ve poor statis
00 as the bas
toes. The fa
uld be analys
y the initial p
IG dressing b
old laps from
21
patter for
ed arc
pendent
stical
se
ilure
sed
points of
but at a
m the

22
23
4 OxidesinGMAWprocess
Welding can be regarded as a metallurgy process with quick melting, cooling and solidification.
From this rapid process, a sound weld is produced with high strength and toughness compared
with the parent material. The alloy elements in the weld metal are the key to ensuring the
required mechanical properties. For the GMAW welding process, both droplet and weld pool
will experience an extremely high temperature, and oxidization is inevitable. This oxidisation
will consume a certain amount of the beneficial alloy elements. For different parent materials,
the beneficial elements can be different. On the other hand, the alloy elements are important
for the weldability in terms of being free from welding flaws, e.g. proper viscosity of the
molten metal, a lighter oxide which can easily flow up to the weld pool surface, etc. For these
purposes, there are a large number of alloy elements, e.g. C, Si, Mn, Cr, Ni, V, Ti, Co, Mg, N,
Mo, Zr, Nb and Al, etc [8, 9, 11]. However, only the behaviour of manganese and silicon is
focused on in this study, since Mn‐Si oxides were found to be the major oxides in cold laps.
Manganese is a greyish‐white metallic element with an atomic weight of 54.9 and a melting
point of 1245oC. A certain quantity of manganese can commonly be found in most steels, as it
is a helpful additive in iron alloys. Manganese has a stronger affinity to oxygen, sulphur and
carbon than iron. When added to molten iron, manganese reacts with oxygen to form
manganese oxide (MnO). Hence, manganese is a deoxidizer for iron, but it is still less important
than aluminium and silicon. In the melt, Manganese can also react preferentially with sulphur
to form manganese sulphur (MnS). Therefore, the MnS inclusion is common in hot rolled steel
as a thin layer inclusion. Manganese is commonly found as an alloying addition in all types of
carbon and low‐alloy‐steel base metals and filler metals for welding. The purpose of
manganese can generally be summarized as being threefold [16]:
Combines with oxygen in the molten steel as a deoxidizer;
Ties up any sulphur that may be present to avoid hot cracking;
Promotes greater strength by increasing the hardenability of the steel (toughness is
usually improved as a bonus effect)
Silicon has an atomic weight of 28 and a melting point of 1427oC. Silicon is used mainly in
steels as a deoxidizing agent. In steelmaking, the amount of silicon to be added is slightly in
excess of the quantity needed to combine with the oxygen. Silicon and oxygen react vigorously
to liberate a large amount of heat, and silicon dioxide (SiO2) is formed. The silicon dioxide can
either escape to the molten metal surface or form inclusions in the solidified steel. With the
presence of manganese in the molten steel, the silicon dioxide inclusions will often occur as
complex iron‐manganese silicate compounds. If manganese and silicon are added together and
act synergistically, the manganese and silicon can achieve a non‐metallic composition that will
remain liquid at the freezing temperature of the steel [16]. The silicon can also be used as a
ferrite strengthener, and it is stronger in this respect than most other commonly used alloying
elements. Also, silicon is a strong hardenability promoter. Therefore, heat‐treatable alloy
steels have a high proportion of silicon. Finally, silicon can promote the fluidity of the molten
steel. It is sometimes useful in pouring castings and in certain fusion‐welding processes.
24
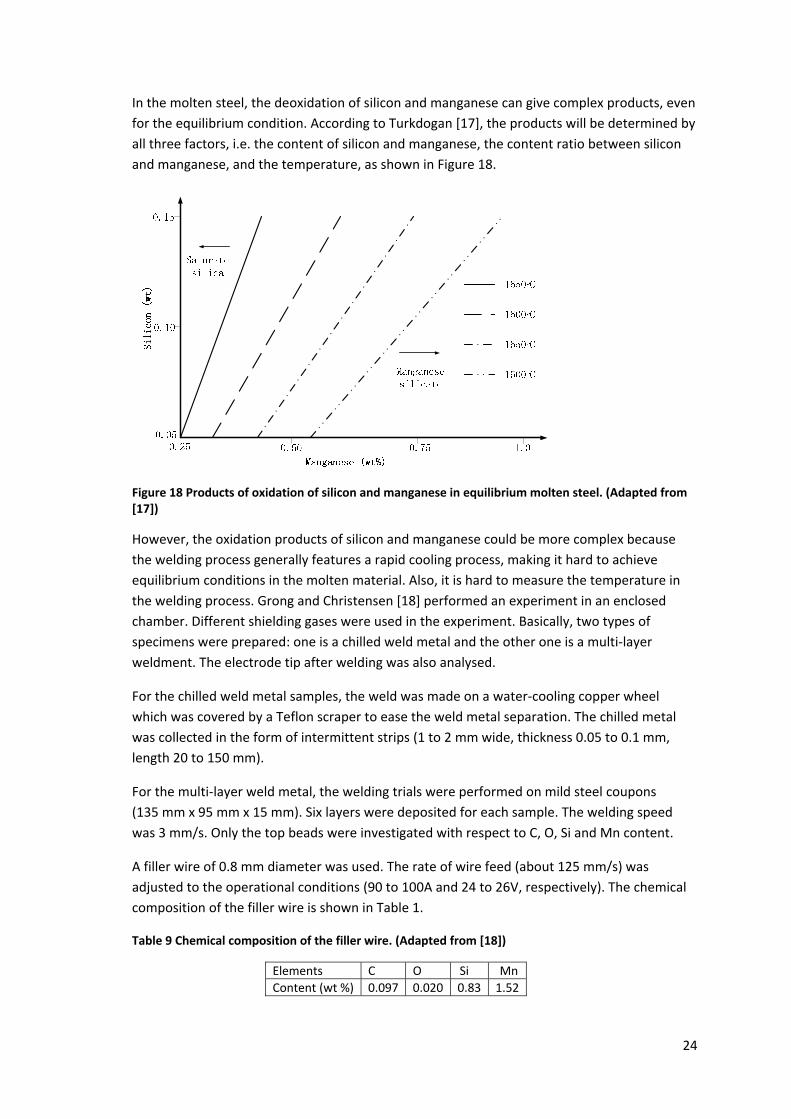
In the molten steel, the deoxidation of silicon and manganese can give complex products, even
for the equilibrium condition. According to Turkdogan [17], the products will be determined by
all three factors, i.e. the content of silicon and manganese, the content ratio between silicon
and manganese, and the temperature, as shown in Figure 18.
Figure 18 Products of oxidation of silicon and manganese in equilibrium molten steel. (Adapted from [17])
However, the oxidation products of silicon and manganese could be more complex because
the welding process generally features a rapid cooling process, making it hard to achieve
equilibrium conditions in the molten material. Also, it is hard to measure the temperature in
the welding process. Grong and Christensen [18] performed an experiment in an enclosed
chamber. Different shielding gases were used in the experiment. Basically, two types of
specimens were prepared: one is a chilled weld metal and the other one is a multi‐layer
weldment. The electrode tip after welding was also analysed.
For the chilled weld metal samples, the weld was made on a water‐cooling copper wheel
which was covered by a Teflon scraper to ease the weld metal separation. The chilled metal
was collected in the form of intermittent strips (1 to 2 mm wide, thickness 0.05 to 0.1 mm,
length 20 to 150 mm).
For the multi‐layer weld metal, the welding trials were performed on mild steel coupons
(135 mm x 95 mm x 15 mm). Six layers were deposited for each sample. The welding speed
was 3 mm/s. Only the top beads were investigated with respect to C, O, Si and Mn content.
A filler wire of 0.8 mm diameter was used. The rate of wire feed (about 125 mm/s) was
adjusted to the operational conditions (90 to 100A and 24 to 26V, respectively). The chemical
composition of the filler wire is shown in Table 1.
Table 9 Chemical composition of the filler wire. (Adapted from [18])
Elements C O Si Mn
Content (wt %) 0.097 0.020 0.83 1.52
25
Both electron probe analysis and chemical analysis were performed for the samples. A
comparison between the results of the chilled weld metal and the multi‐layer weld metal
revealed that the oxidizing reaction of carbon does not normally take place in the weld pool,
but occurs either at the electrode tip or in the arc plasma, or maybe both. Grong and
Christensen [18] also discussed that it is reasonable to assume that the oxidation mainly occurs
on the electrode tip, rather than in the arc plasma. The large metal/atmosphere interface is
the main reason for CO nucleation during droplet formation. Two parts of the droplet were
distinguished in the discussion of carbon oxidation. One is the hot layer, which refers to the
part facing the arc. This part is most likely the location of carbon oxidation. The other part is
the part on the side of the electrode wire (the lower temperature part compared with the part
facing the arc) in which Si and Mn are expected to protect carbon from oxidation. When
reaching the critical CO gas pressure, the carbon reaction is blocked. Thus, silicon and
manganese will take over and control the oxygen level in the metal. One reason for the lack of
carbon oxidation in the arc plasma is an inadequate supply of oxygen due to Mn and Fe vapour
arising from metal superheating. In the hot part of the weld pool (the part simultaneously
beneath and following the arc), the plasma jet blows the Mn and Fe vapour away and provides
a steady supply of oxygen. However, the metal/atmosphere interface may be too small in
volume compared with the droplets to limit the carbon oxidation in this stage. In the cooler
part of the weld pool (the part next to the arc in the weld pool), Si and Mn are normally
expected to prevent any carbon reaction.
Regarding the losses of silicon, Grong and Christensen [18] concluded that losses of silicon
mainly occur in the weld pool and the amount of Si lost on the electrode tip and in the arc
plasma is much smaller. Since no slag is formed on the surface of the chilled metal sample, the
authors believe that the silicon must escape in the form of a gaseous product. On the other
hand, evaporation losses can be excluded in this case due to a very low Si vapour pressure at
the prevailing temperature. Therefore, it is reasonable to assume that SiO is formed on the tip
droplet surface. The silicon losses of chilled metal with increasing oxygen potential of shielding
gas are believed to be caused by the reaction:
SiO2 (in slag) + CO (g) = SiO (g) + CO2 (g)
When comparing the manganese content between the chilled metal samples and the multi‐
layer weld metal samples, Grong and Christensen [18] believed that the losses of Mn are
mainly due to vaporization during extremely high temperature arc plasma (2400oC).
In their conclusion, the authors summarized the results by different location in the welding
process, i.e. electrode tip, arc plasma, hot part of the weld pool, and the cooling part of the
weld pool. For the electrode tip, the temperature was stated to be about 1600oC and carbon
monoxide and manganese silicate slag were formed. Carbon was lost mainly in this stage as
well. A certain amount of silicon was lost as a result of SiO formation in the fumes.
For the arc plasma, with a temperature of about 2400oC, the precipitated manganese slag in
the former stage re‐dissolves in the metal upon heating. Further absorption of oxygen will be
prevented by Fe and Mn vapours. Fumes are formed by metal vapour reacting with oxygen.
26
For the hot part of the weld pool, the temperature range is 2000oC to 1800oC. Oxygen is, to a
large extent, dissolved in the weld pool at the arc root resulting from the interaction with the
plasma gas. Manganese silicate slag formation takes place simultaneously, preventing the
oxygen concentration from exceeding a certain limit. A separation of microslag proceeds
continuously under the existing turbulent conditions. For CO2 welding, a CO gas barrier above
the metal surface, from the decomposition of CO2, prevents the absorption of oxygen.
In the cooling part of the weld pool, the temperature is below 1800oC. Silicon and manganese
react further with dissolved oxygen upon cooling. The microslag separation will be highly
unfavourable due to a nearly stagnant bath. For this reason, the analytical oxygen content is
highly unpredictable, but is nevertheless closely linked to the silicon and manganese
concentrations in the weld metal.
27
5 Experimentaltechniques
5.1 SteelandconsumablematerialsIn the experimental work of this thesis, Domex 355 was used as the parent material and ESAB
OK Autrod 12.51 was used as the welding wire.
Domex 355 is a hot rolled cold forming steel which meets steel S355 MC in EN‐10149‐2. It can
be used in applications such as truck chassis, cranes and earthmoving machines. The chemical
composition of Domex 355 is shown in Table 10 and its mechanical properties in Table 11 [19].
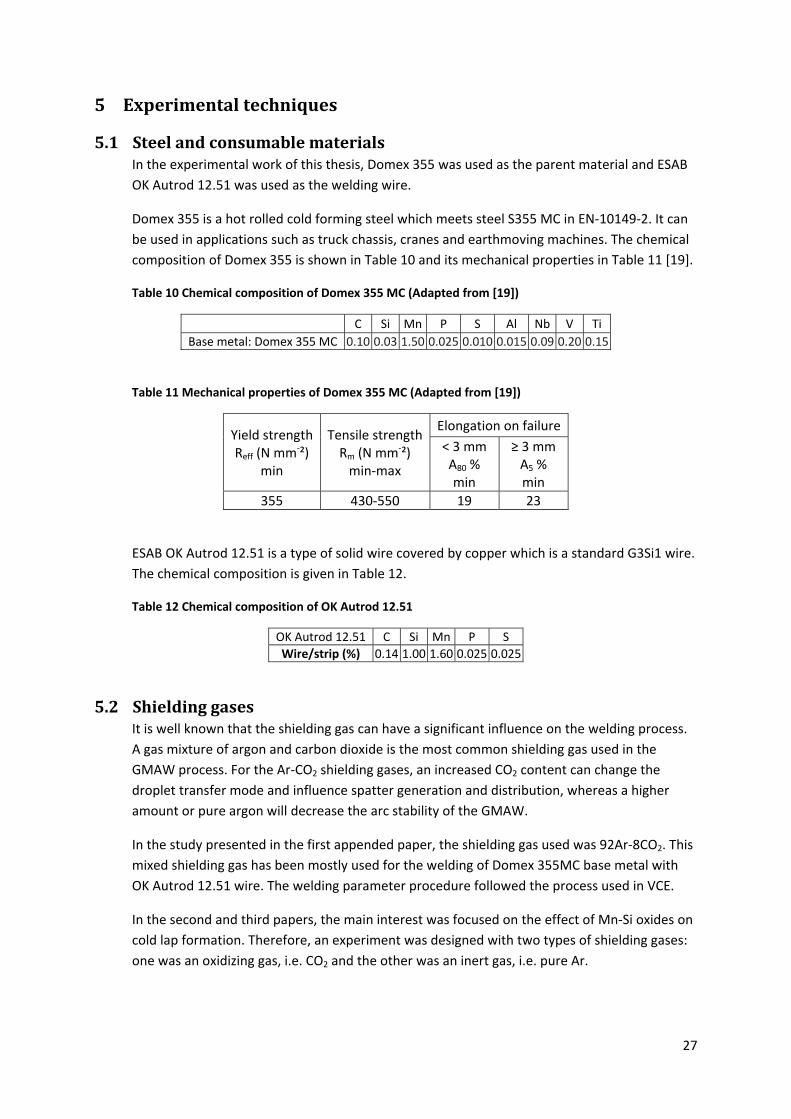
Table 10 Chemical composition of Domex 355 MC (Adapted from [19])
C Si Mn P S Al Nb V Ti
Base metal: Domex 355 MC 0.10 0.03 1.50 0.025 0.010 0.015 0.09 0.20 0.15
Table 11 Mechanical properties of Domex 355 MC (Adapted from [19])
Yield strength Reff (N mm‐²)
min
Tensile strengthRm (N mm‐²) min‐max
Elongation on failure
< 3 mm A80 % min
≥ 3 mm A5 % min
355 430‐550 19 23
ESAB OK Autrod 12.51 is a type of solid wire covered by copper which is a standard G3Si1 wire.
The chemical composition is given in Table 12.
Table 12 Chemical composition of OK Autrod 12.51
OK Autrod 12.51 C Si Mn P S
Wire/strip (%) 0.14 1.00 1.60 0.025 0.025
5.2 ShieldinggasesIt is well known that the shielding gas can have a significant influence on the welding process.
A gas mixture of argon and carbon dioxide is the most common shielding gas used in the
GMAW process. For the Ar‐CO2 shielding gases, an increased CO2 content can change the
droplet transfer mode and influence spatter generation and distribution, whereas a higher
amount or pure argon will decrease the arc stability of the GMAW.
In the study presented in the first appended paper, the shielding gas used was 92Ar‐8CO2. This
mixed shielding gas has been mostly used for the welding of Domex 355MC base metal with
OK Autrod 12.51 wire. The welding parameter procedure followed the process used in VCE.
In the second and third papers, the main interest was focused on the effect of Mn‐Si oxides on
cold lap formation. Therefore, an experiment was designed with two types of shielding gases:
one was an oxidizing gas, i.e. CO2 and the other was an inert gas, i.e. pure Ar.
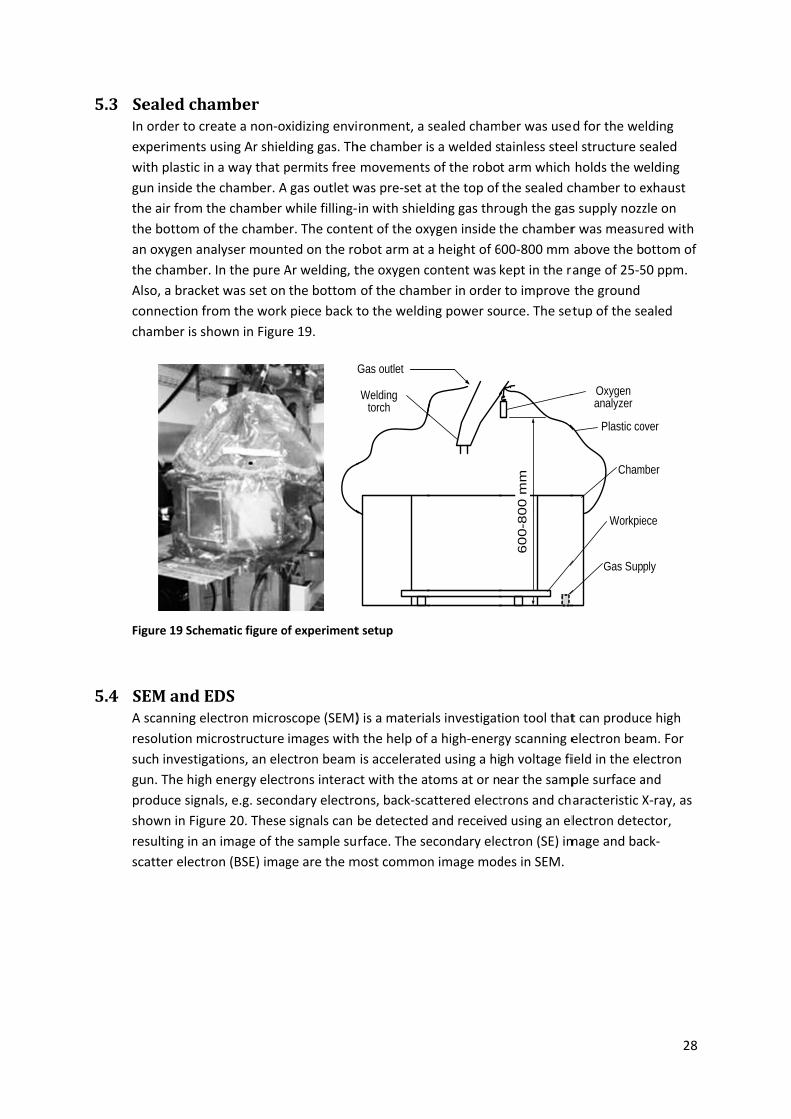
5.3 SeIn
ex
w
gu
th
th
an
th
Al
co
ch
Fig
5.4 SEA
re
su
gu
pr
sh
re
sc
ealedcha order to cre
xperiments u
ith plastic in
un inside the
he air from th
he bottom of
n oxygen ana
he chamber.
so, a bracke
onnection fro
hamber is sho
gure 19 Schem
EMandEscanning ele
esolution mic
uch investiga
un. The high
roduce signa
hown in Figu
esulting in an
catter electro
ambereate a non‐ox
using Ar shie
a way that p
e chamber. A
he chamber w
f the chambe
alyser mount
In the pure A
t was set on
om the work
own in Figur
matic figure o
DSectron micro
crostructure
tions, an ele
energy elect
ls, e.g. secon
re 20. These
n image of th
on (BSE) imag
xidizing envi
lding gas. Th
permits free
A gas outlet w
while filling‐
er. The conte
ted on the ro
Ar welding, t
the bottom
k piece back t
re 19.
G
of experiment
scope (SEM)
images with
ectron beam
trons interac
ndary electro
signals can b
e sample su
ge are the m
ronment, a s
he chamber i
movements
was pre‐set a
in with shiel
ent of the ox
obot arm at a
the oxygen c
of the cham
to the weldin
Welding torch
Gas outlet
t setup
) is a materia
h the help of
is accelerate
ct with the at
ons, back‐sca
be detected
rface. The se
most common
sealed cham
s a welded s
s of the robo
at the top of
ding gas thro
ygen inside t
a height of 6
content was
mber in order
ng power so
als investigat
a high‐energ
ed using a hi
toms at or n
attered elect
and receive
econdary ele
n image mod
ber was use
tainless stee
t arm which
the sealed c
ough the gas
the chamber
600‐800 mm
kept in the r
r to improve
urce. The set
60
0-8
00 m
m
tion tool that
gy scanning e
gh voltage fi
ear the samp
trons and ch
d using an el
ectron (SE) im
des in SEM.
d for the we
el structure s
holds the w
chamber to e
s supply nozz
r was measu
above the b
range of 25‐5
the ground
tup of the se
Gas Sup
Cham
Plastic co
Oxygen analyzer
Workpie
t can produc
electron bea
ield in the el
ple surface a
aracteristic X
lectron dete
mage and ba
28
elding
sealed
elding
exhaust
zle on
red with
ottom of
50 ppm.
ealed
ply
mber
over
ece
ce high
am. For
ectron
and
X‐ray, as
ctor,
ck‐
29
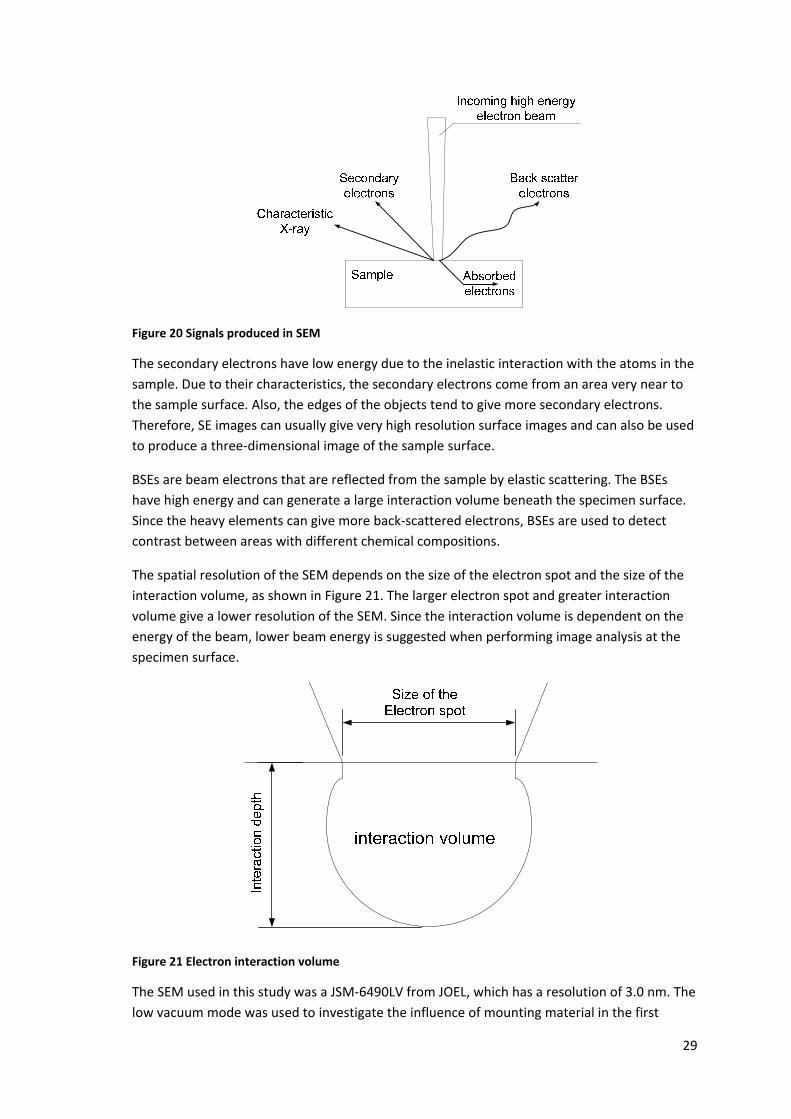
Figure 20 Signals produced in SEM
The secondary electrons have low energy due to the inelastic interaction with the atoms in the
sample. Due to their characteristics, the secondary electrons come from an area very near to
the sample surface. Also, the edges of the objects tend to give more secondary electrons.
Therefore, SE images can usually give very high resolution surface images and can also be used
to produce a three‐dimensional image of the sample surface.
BSEs are beam electrons that are reflected from the sample by elastic scattering. The BSEs
have high energy and can generate a large interaction volume beneath the specimen surface.
Since the heavy elements can give more back‐scattered electrons, BSEs are used to detect
contrast between areas with different chemical compositions.
The spatial resolution of the SEM depends on the size of the electron spot and the size of the
interaction volume, as shown in Figure 21. The larger electron spot and greater interaction
volume give a lower resolution of the SEM. Since the interaction volume is dependent on the
energy of the beam, lower beam energy is suggested when performing image analysis at the
specimen surface.
Figure 21 Electron interaction volume
The SEM used in this study was a JSM‐6490LV from JOEL, which has a resolution of 3.0 nm. The
low vacuum mode was used to investigate the influence of mounting material in the first
30
paper. The high vacuum mode was used in the work presented in the second and third papers
due to the utilization of conductive mounting materials. Standard automated features were
also used in the above mentioned experiments, including Auto Focus, Auto Gun (saturation,
bias and alignment), and automatic contrast and brightness.
Energy‐dispersive spectroscopy (EDS) is an analytical technique used for the elemental analysis
or chemical characterization of a material. As mentioned above, a characteristic X‐ray can be
emitted when the high energy electron beam hits the sample. The number and energy of the
X‐rays emitted from a specimen can be measured using an energy‐dispersive spectrometer. By
analysing the unique X‐ray, EDS allows the identification of different elements in the sample.
The accuracy of the EDS spectrum can be affected by many factors. Windows in front of the
detector can absorb the low‐energy X‐ray (i.e. EDS detectors cannot detect elements with an
atomic number of less than 4, i.e. H, He, and Li). Also, many elements will have overlapping
peaks (e.g. Ti Kβ and V Kα, Mn Kβ and Fe Kα). The accuracy of the spectrum can also be
affected by the nature of the sample. X‐rays can be generated by any atom in the sample that
is sufficiently excited by the incoming beam. These X‐rays are emitted in any direction, and so
they may not all escape the sample. The likelihood of an X‐ray escaping the specimen, and thus
being detected and measured, depends on the energy of the X‐ray and the amount and
density of the material it has to pass through. This can result in reduced accuracy in the case of
inhomogeneous and rough samples.
Two types of SEM and EDS system were used in this study. In the experiment of paper I, the
SEM and EDS system is a high resolution field emission type LEO 1550 Gemini equipped with
an Oxford EDS system. In the experiment of paper II and paper III, the system is a Bruker
Quantax 800 system. The detector is an X‐flash 4010 with a resolution of 127 eV for the Mn‐K
peak.
31
6 SummaryofappendedpapersThree papers have been or will be published regarding the objectives of this thesis:
‐ Classification of cold laps,
‐ Characterization of cold lap interface,
‐ Investigation of the influencing factors on cold lap formation.
This chapter presents a brief summary of the papers which have been reformatted for
uniformity and increased readability.
6.1 PaperIThe main purpose of this paper is to classify cold laps. Secondly, the interface of the
spatter/base metal is supposed to be characterized. A tandem welding experiment was
performed using 92Ar‐8CO2 shielding gas, Domex 355 MC base metal, and ESAB OK Autrod
12.51 wire. A visual test (VT) was first performed on the welded specimens. The specimens
were cut and polished to prepare for the conventional metallographic samples. The samples
were evaluated by light optical microscopy and scanning electron microscope (SEM). Three
types of cold laps were observed, i.e. spatter cold lap, overlap cold lap and spatter‐overlap
cold lap.
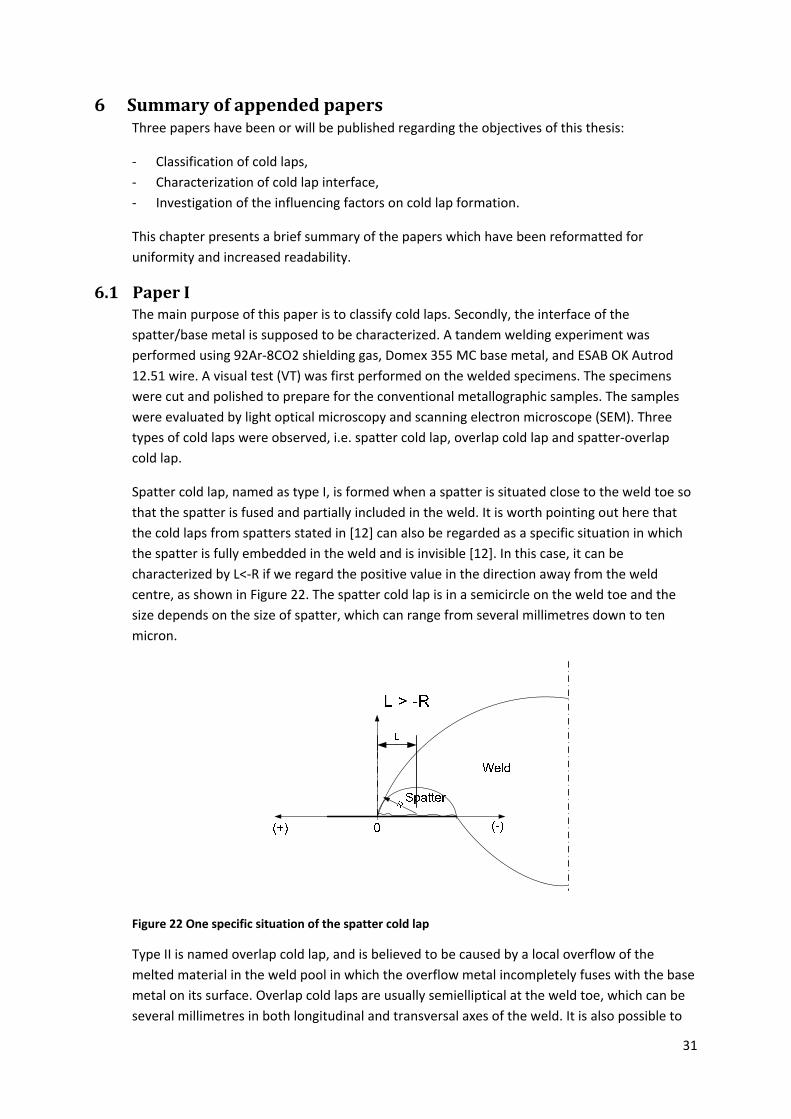
Spatter cold lap, named as type I, is formed when a spatter is situated close to the weld toe so
that the spatter is fused and partially included in the weld. It is worth pointing out here that
the cold laps from spatters stated in [12] can also be regarded as a specific situation in which
the spatter is fully embedded in the weld and is invisible [12]. In this case, it can be
characterized by L<‐R if we regard the positive value in the direction away from the weld
centre, as shown in Figure 22. The spatter cold lap is in a semicircle on the weld toe and the
size depends on the size of spatter, which can range from several millimetres down to ten
micron.
Figure 22 One specific situation of the spatter cold lap
Type II is named overlap cold lap, and is believed to be caused by a local overflow of the
melted material in the weld pool in which the overflow metal incompletely fuses with the base
metal on its surface. Overlap cold laps are usually semielliptical at the weld toe, which can be
several millimetres in both longitudinal and transversal axes of the weld. It is also possible to
32
find cold laps along the entire weld toe (in the longitudinal direction of the weld), which are
usually caused by the poor surface condition of the base metal and improper welding
parameters. Type III is referred to as “spatter‐overlap cold lap”, and can be regarded as a
combination of type I and type II. This usually appears in a worm‐like shape and can be several
millimetres away from the weld toe.
Microscopy analysis of the spatter/base metal interface has revealed a lack of fusion consisting
of both voids and oxides. The main oxides detected were Mn‐Si oxides, which can be
symbolised with the general formula (Mn•Si)On where n varies from 0.3 to 0.5.
6.2 PaperII
The main purpose of this paper is to investigate the influence of the Mn‐Si oxides observed in
paper I on cold laps. Secondly, any other influencing factors on cold laps were studied. A series
of tandem arc welding experiments was performed in a sealed chamber filled up either with
pure argon or with pure CO2 with the purpose of creating oxidizing or non‐oxidizing welding
environments, respectively, and studying the influence of the shielding gas on the formation of
cold laps. Two surface conditions, i.e. an iron sand blasted surface and a burr grinding surface,
were prepared for the base metal. The welded specimens were visually examined using the
naked eye. Spatters were also evaluated in terms of size and distribution on the welded
specimens. In the pure Ar welding process, smaller spatters were generated and concentrated
in a small area close to the weld toe, whereas the spatters in pure CO2 welding were larger in
size and more evenly distributed.
All three types of cold laps were identified and analysed. The interface of different types of
cold laps was examined using a light optical microscope, SEM and EDS. Voids and Mn‐Si oxides
were found in the cold lap interface. The results revealed that the Mn‐Si oxides have the most
significant influence on overlap cold lap occurrence. It was also observed that the blasted
surface can enhance the lack of fusion by easing the air entrapment in the interface. By
evaluating the spatter surface and base metal surface after welding regarding Mn‐Si oxides, it
could be concluded that the Mn‐Si oxides in cold laps came mainly from the oxidization of
droplets before they reached the weld pool.
6.3 PaperIIIThe main purpose of this paper is to reveal the factor(s) behind the cold laps found in the pure
Ar welding in paper II, by studying the spatter/base metal interface. The spatter/base metal
interface was investigated for two different welding conditions, i.e. in pure Ar and in pure CO2.
The contribution of Mn‐Si oxides was confirmed for the lack of fusion formation at the
spatter/base metal interface. The ratio between the length of lack of fusion at the interface
and the entire length of the spatter/base metal interface (RLoF) was introduced in this
investigation. Studying the RLoF against spatter distance and spatter diameter revealed that
the RLoF increased abruptly until the spatter diameter reached a critical value (approx. 1 mm)
as the spatter diameter decreased from its highest value. For lower spatter diameter values
than the critical value (i.e. under 1 mm), the RLoF remained constant (100%) with the
continuous decrement of spatter diameter. A direct proportion was revealed between spatter
distance and RLoF. However, the heat/temperature of the spatter is influenced by both the
33
spatter diameter and the spatter distance regarding the fusion between spatter and base
metal. Therefore, the heat/temperature can be regarded as the other important influence
factor for lack of fusion formation.

34
35
7 ConclusionsandfutureworkThrough the experimental study of cold laps, three types of cold laps were identified, i.e.
overlap old lap, spatter cold lap, and spatter‐overlap cold lap. For all types of cold laps, the
interface was characterized by voids and oxides. The oxides depended on the welding
consumables. For the materials applied in this study, manganese‐silicon oxides were shown to
have significant influence on cold lap occurrence. The influence of temperature on cold laps
was shown by the indicators of spatter diameter and distance from spatter to the weld.
In the future work, the temperature influence of the welding workpiece on cold laps should be
investigated. Also, the behaviour of the welding pool can be studied with help of high speed
imaging technology. Regarding the influence of oxides on cold laps, new consumables of
GMAW, which can avoid oxides in welding process, are of interest to study.

36

37
8 References
1. L.Lopez.Martinez, P.Korsgren. Characterization of Initial Defect Distribution and Weld Geometry in Welded Fatigue Test Specimens. In, Fatigue under spectrum loading and in corrosive environments. Denmark: EMAS; 1993
2. J.Samuelsson. Cold laps and weld quality acceptance limits. In: J.Samuelsson ed, Design and Analysis of Welded High Strength Steel Structures. Stockholm, Sweden: EMAS; 2002:151‐161
3. Z.Barsoum, B.Jonsson. Fatigue assessment and LEFM analysis of cruciform joints fabricated with different welding processes. Welding in the world 2008;52:93‐105
4. M.Lundin, L.Lopez.Martinez, J.Hedegård, K.Weman. High productive MAG welding ‐ Fatigue properties of weldments. In, Welded High‐Strength Steel Structures. Stockholm, Sweden: EMAS; 1997
5. L.Holst, M.Lundin, J.Hedegård, K.Weman. High productive MAG‐Welding‐ Weld toe defects ‐ A new detection method. In, Welded High‐Strength Steel Structures. Stockholm, Sweden: EMAS; 1997
6. K.Weman, M.Lundin, J.Hedegård. High productive MAG welding of vehicle components. In, Welded High‐Strength Steel Structures. Stockholm, Sweden: EMAS; 1997
7. Volvo weld quality standard. In, STD181‐0004. Sweden; 2008 8. K.Weman. Welding Process Handbook: CRC Prss Inc (5 Aug 2003); 2003 9. R.L.O'Brien. WELDING PROCESS. Eighth ed. MIAMI: AMERICAN WELDING SOCIETY; 1995 10. Pritchard D. Soldering, Brazing & Welding‐A Manual Of Techniques: The Crowood Press; 2001 11. L.P.Connor. WELDING TECHNOLOGY. Eighth ed. Miami: AMERICAN WELDING SOCIETY; 1987 12. M.Farajian‐Sohi, N.Järvstråt. A Fractographical Investigation of Weld Toe Imperfections in
Tandem Gas Metal Arc Welding. Steel research international 2006;77 (2006) No.12:889‐895 13. J.Hedegård, L.Lopez.Martinez, N.Moradashkafti, H.Trogen. The influence of welding
parameters on the size and distribution of weld defects for various weld methods. In, VTT Symposium 156:Fatigue Design 1995. Helsinki: VTT Offset print Espoo 1995; 1995
14. M.Farajian‐Sohi, N.Järvstråt, M.Thuvander. Effect of Welding Parameters on Formation of Toe Imperfections in Tandem Gas Metal Arc Welding In, 7th International Conference on Trends in Welding Research. Geogia, USA: ASM; 2005
15. L.Lopez.Martinez, A.F.Blom, J.Samuelsson. Weld defects before and after post weld treatment for MAG and high‐productivity MAG welding. In, Welded High‐Strength Steel Structures. Stockholm, Sweden: EMAS; 1997
16. G.E.Linnert. Welding Metallurgy. Hilton Head Island, South Carolina: AWS; 1994 17. E.T.Turkdogan. Deoxidation of steel. In, Chem Metall of Iron and Steel. Sheffield, U.K.: The
Iron and Steel Institution; 1973:153‐170 18. O.Grong, N.Christensen. Factors Controlling MIG Weld Metal Chemistry. Scandinavian
Journal of Metallurgy 1983;12:155‐165 19. SSAB. Domex 355 MC Datablad. In. Brolänge: SSAB; 2011

38
39
9 Appendedpapers

40