explaining women's success: technological change and the
TRANSCRIPT

NBER WORKING PAPER SERIES
EXPLAINING WOMEN'S SUCCESS:TECHNOLOGICAL CHANGE AND THE SKILL CONTENT OF WOMEN'S WORK
Sandra E. BlackAlexandra Spitz-Oener
Working Paper 13116http://www.nber.org/papers/w13116
NATIONAL BUREAU OF ECONOMIC RESEARCH1050 Massachusetts Avenue
Cambridge, MA 02138May 2007
The authors thank David Autor, Leah Boustan, Michael Burda, and seminar participants at the NBERLabor Studies Program Meeting, Case Western Reserve, Duke University, University of Kentucky,University of Texas, Austin, and Notre Dame University for helpful comments and suggestions. Theviews expressed herein are those of the author(s) and do not necessarily reflect the views of the NationalBureau of Economic Research.
© 2007 by Sandra E. Black and Alexandra Spitz-Oener. All rights reserved. Short sections of text,not to exceed two paragraphs, may be quoted without explicit permission provided that full credit,including © notice, is given to the source.

Explaining Women's Success: Technological Change and the Skill Content of Women's WorkSandra E. Black and Alexandra Spitz-OenerNBER Working Paper No. 13116May 2007JEL No. J01,J16,J2,J31
ABSTRACT
The closing of the gender wage gap is an ongoing phenomenon in industrialized countries. However,research has been limited in its ability to understand the causes of these changes, due in part to aninability to directly compare the work of women to that of men. In this study, we use a new approachfor analyzing changes in the gender pay gap that uses direct measures of job tasks and gives a comprehensivecharacterization of how work for men and women has changed in recent decades. Using data fromWest Germany, we find that women have witnessed relative increases in non-routine analytic tasksand non-routine interactive tasks, which are associated with higher skill levels. The most notable differencebetween the genders is, however, the pronounced relative decline in routine task inputs among womenwith little change for men. These relative task changes explain a substantial fraction of the closingof the gender wage gap. Our evidence suggests that these task changes are driven, at least in part, bytechnological change. We also show that these task changes are related to the recent polarization ofemployment between low and high skilled occupations that we observed in the 1990s.
Sandra E. BlackDepartment of Economics8283 Bunche HallUCLALos Angeles, CA 90095NHH, IZA and [email protected]
Alexandra Spitz-OenerDepartment of Economics and Business StudiesHumboldt University BerlinSpandauer Str. 110178 Berlin, Germanyand ZEW Mannheim and IZA [email protected]

2
I. Introduction The closing of the gender wage gap is an ongoing phenomenon in industrialized
countries. When investigating potential explanations, most research has focused on fac-
tors such as education and experience, for which changes have been more favorable for
women than for men in recent decades. However, a substantial portion of the improve-
ment in women’s labor market opportunities still remains unexplained.1 One reason for
this is that empirical research has been limited in its ability to directly compare women’s
work to that of men.
In this study, we apply a new approach for analyzing changes in the gender pay
gap that uses direct measures of job tasks and gives a comprehensive characterization of
how work for men and women has changed in recent decades. The strategy is based on
the task-based framework introduced by Autor, Levy and Murnane (2003). The advan-
tage of this framework is that, in addition to the analysis of task changes, it also allows us
to investigate one of the potential underlying causes of changes in occupational skill re-
quirements: workplace computerization. In this framework, the work performed in an oc-
cupation is broken down into a series of tasks, each of which can be characterized based
on its substitutability or complementarity with computers. Hence, it becomes predictable
how each occupation is likely to be affected by the introduction of computers.
Using a rich, survey-based data set from West Germany covering 1979 to 1999,
we are able to measure skill requirements directly by using the task composition of occu-
pations; that is, survey participants indicated the activities they perform on the job. Occu-
pational skill requirements are characterized by five categories of tasks: non-routine ana-
lytic (such as researching and analyzing), non-routine interactive (such as managing and 1 For a comprehensive review, see work by Blau and Kahn (1997, 2003, 2006).
3
organizing), routine cognitive (such as calculating and bookkeeping), routine manual
(such as operating machinery) and non-routine manual (such as serving and repairing).
We find that women witnessed relative increases in non-routine analytical and
non-routine interactive task inputs, which are associated with higher skill levels. The
most notable difference between the genders in task changes is, however, the strong de-
cline in routine tasks experienced by women and almost not at all by men. When decom-
posing the closing of the gender wage gap into relative task and relative price changes,
we find that relative task changes would have resulted in wage convergence that is as
large as 85 percent of the one we actually observe. Interestingly, relative changes in ana-
lytical task inputs appear to be the largest single contributor to this development. The re-
sults also show, however, that relative prices did not stay constant and that their relative
movement had a mitigating effect on the convergence of wages of men and women. Rela-
tive task and relative price changes together can explain more than 40 percent of the
wage convergence between the genders.
We then turn to possible explanations for these task changes. Our analysis reveals
that – consistent with the technological change hypothesis – task changes were most pro-
nounced within industry/occupation cells. Only minor parts of the aggregate trends are
attributable to women moving towards more skill intensive occupations or industries, a
phenomenon that has attracted much attention in the literature.2 In addition, the task
changes occurred most rapidly in occupations in which computers have made major
headway.
Overall – and in contrast to recent literature that puts a strong emphasis on only
one dimension of activities on the job, namely interactive tasks – we show that changes in 2 See, for example, Katz and Murphy (1992).

4
job content has evolved differently for men and women along several dimensions.3 While
the relative changes in interactive task input and changes in relative prices for this task
category play an important role in explaining part of the closing of the gender pay gap,
the results suggest that the relative evolution of analytical and routine manual task inputs
is also important.
A by-product of the task-based framework is that it has reinvigorated the discus-
sion on the “polarization” of the labor market that began at the beginning of the 1990s.4
In the task-based framework, computers are a complement to the analytical and interac-
tive tasks that are most often used by high skilled workers, computers are substitutes for
routine tasks that are most often performed by medium educated workers, and they have
no predictable effect for non-routine manual skills most often used by the lowest skilled
workers. As a result, we expect the largest effect of workplace computerization on mid-
dle-educated workers who are most likely to be engaged in routine manual and routine
cognitive skills. Given the distribution of tasks in 1979, we would also expect to find
stronger polarization of employment among women relative to men. We do find evi-
dence of this polarization for both women and men. Interestingly, and in line with the
task changes that we observe for the two genders, the polarization tendency in the labor
market has been larger for women than for men in recent decades.
The paper unfolds as follows. Section 2 reviews the relevant literature, Section 3
presents the data set, and Section 4 presents the patterns of task changes between 1979
and 1999. Section 5 relates these changes to the closing of the gender wage gap. Section
6 examines possible explanations: in particular, changes in technology. Section 7 exam-
3 See, for example, Borghans, ter Weel and Weinberg, 2006, and Weinberg, 2000. 4 See, for example, Levy and Murnane, 1992, Goos and Manning, 2007, and Autor, Katz, Kearney, 2006.

5
ines the relationship between task changes and the polarization of the labor market. Sec-
tion 8 then concludes.
II. Related Literature
In an effort to better understand the link between technological changes and labor
demand, the recent literature has adopted a task-based view of technological change (see
Autor, Levy and Murnane, hereafter ALM, 2003).5 The major feature of this framework
is that it conceptualizes work as a series of tasks and classifies tasks into routine and non-
routine activities, with the terms routine and non-routine characterizing the relationship
between the respective task measure and computer technology. Both manual and cogni-
tive routine tasks are well-defined in the sense that they are easily programmable and can
be performed by computers at economically feasible costs – a feature that makes routine
tasks amenable to substitution by computer capital (Levy and Murnane, 1996). Non-
routine tasks, in contrast, are not well defined and programmable and, as things currently
stand, cannot be easily accomplished by computers. However, computer capital is com-
plementary to both analytical and interactive non-routine cognitive tasks in the sense that
computer technology increases the productivity of employees performing these tasks.
This task-framework is applied in ALM and in recent work by Spitz-Oener
(2006), who document the relationship between computer adoption and changing tasks at
the aggregate level, within industry (ALM, using U.S. data) and within occupations
(Spitz-Oener, using data for West Germany). As predicted, the evidence suggests that
tasks have shifted from routine manual and routine cognitive tasks towards analytic and
5 See Chennells and Van Reenen (1999), Katz and Autor (1999), and Acemoglu (2002) for a review of ear-lier studies in this body of the literature.

6
interactive non-routine tasks at all levels of aggregation in recent decades. The frame-
work thereby identifies the mechanism that underlies the relative increase in the demand
for high-educated employees. However, there is little work using the task-based frame-
work to analyze how the content of work has changed for women relative to men.
So far, most of the literature on the gender wage gap has focused on supply side
explanations such as changing education and experience.6 However, there are a number
of studies that also looked at demand side factors, though with a conceptually different
approach than the one we are using. Katz and Murphy (1992), for example, showed that
there have been changes in product demand that are associated with shifts in employment
towards sectors that are female intensive.7 Unlike this earlier work, we are able to focus
on within-occupation task changes for women relative to men while previous work
mainly emphasized between-occupation (industry) employment shifts.
There are also a number of recent studies that examine the relationship between
computer adoption and gender. Weinberg (2000), for example, shows how computeriza-
tion, by de-emphasizing physical skills, has benefited women’s employment relative to
that of men. He does so by relating the change in women’s share of hours worked to the
change in computer use at the occupation and industry level. However, he is not able to
describe how work has actually changed due to the absence of direct task measures.
Bacolod and Blum (2006) use data from the United States to examine the role of
changing task prices in explaining rising wage inequality and a declining gender wage
6 Again, see work by Blau and Kahn (1997, 2003, 2004). Another study is O’Neill and Polachek (1993). 7 Other studies are Black and Juhn (2000) and Goldin (2004). Welch (2000) attributes the closing of the gender wage gap to the expansion in the value of brains relative to brawn. In addition, recent work by Oli-vetti and Petrongolo (2006) introduces evidence of differential labor market participation as an explanation for across-country differences in the gender wage gap. Mulligan and Rubinstein (2005) also stress the im-portance of changes in the selection process over time into employment in explaining changes in the U.S. gender gap.

7
gap and conclude that price changes can explain a large fraction of the decline in the gen-
der wage gap. However, owing to the choice of task categories, a key limitation of this
work is its inability to relate the changes in task prices to computerization.8 In addition,
data limitations prevent them from looking at changes in tasks within occupations, which
we find to be the primary factor in explaining changes in the tasks performed by women
relative to men.9
Finally, the paper most closely related to our own is recent work by Borghans, ter
Weel, and Weinberg (2006), that focuses on interactive, or people skills. Using data from
Britain, West Germany and the United States, they find that people skills have become
more important in recent decades; in addition, the relative employment of women is high
in occupations in which people tasks are more important.10 However, they neither provide
evidence on how interpersonal task inputs have evolved across genders, nor on how the
evolution of interpersonal task inputs is related to the closing of the gender wage gap in
recent decades. In addition, our evidence suggests that for women relative to men, the
increase in the use of interpersonal skills is not nearly as large as the decline in cognitive
and manual routine skills. Thus, by focusing on a broader spectrum of tasks, including
analytic, interpersonal, routine cognitive, routine manual, and non-routine manual, we
provide a comprehensive analysis of how work has changed for women relative to men
and how these changes are related to the closing of the gender wage gap.
8 In particular, their choice of cognitive skills comprises both routine and non-routine cognitive tasks. Given that, based on the task framework, computers are predicted to have a negative impact on prices of routine cognitive tasks and a positive impact on non-routine cognitive tasks, it is not clear what kind of price changes one should expect for the composite classification. 9 Bacolod and Blum use the Dictionary of Occupational Titles (DOT) dataset for their analysis. See Spen-ner (1983) and references cited there for a detailed criticism of the DOT. In the context of this study, the most important points are that the process in which experts evaluate occupations encourages them to under-estimate the true changes in job content, and that occupational titles in the DOT are not consistent over time. 10 For the analyses concerning West Germany, they use the same data as this study.

8
III. Data
We use two data sets for our analysis, the “Qualification and Career Survey” and
the IAB employment sample. The main advantage of the “Qualification and Career Sur-
vey” is that it includes information on both the activities that employees perform at work
as well as computer use. This data is then matched to the IAB employment sample, an
administrative data set with the major advantage of providing precise information on
wages. The matching is done at the occupation level as both data sets follow the same
occupational classification.
The “Qualification and Career Survey” is an employee survey carried out by the
German Federal Institute for Vocational Training (“Bundesinstitut fur Berufsbildung,
BIBB”) and the Research Institute of the Federal Employment Service (“Institut fur Ar-
beitsmarkt- und Berufsforschung, IAB”). It includes four cross-sections launched in
1979, 1986, 1992 and 1999, each covering about 30,000 individuals, both men and
women.11 For ease of exposition, we use the 1979 and 1999 waves for our analysis, in-
cluding only those occupations with both men and women in both years.12
This data set is particularly well-suited to analyze changes in skill requirements
within occupations for a number of reasons. Unlike the Dictionary of Occupational Titles
(DOT) data set for the United States — the data set often used by researchers for ques-
tions related to tasks — these data use a consistent set of occupational classifications; the
constant occupational titles thus provide the reference point for the analysis.13 Another
11 For details on the data set see Spitz-Oener (2006). 12 We lose approximately 10% of our sample by restricting the data in this way. However, results are in-sensitive to this restriction. 13 Appendix Table 1 provides a list of the occupational classifications at the two digit level.

9
major improvement over previous data is that survey respondents indicated themselves
what kind of activities they perform on the job. It is very unlikely that this causes an un-
derestimation of true changes in job content. In the DOT, experts assign scores to differ-
ent indicators characterizing the occupations, and it is well known that this process en-
courages analysts to underestimate the true changes in job content. Moreover, occupa-
tional titles in the DOT are not consistent over time.14
Occupational skill requirements are based on the activities that employees have to
perform at the workplace. We pool these activities into five task categories. They are:
non-routine analytical tasks, non-routine interactive tasks, routine cognitive tasks, routine
manual tasks, and non-routine manual tasks. Table 1 illustrates the assignment of activi-
ties to the five categories.15
For individual i, the task measures (Tijt) are defined as:
jcategory in activities ofnumber total tin time i individualby performed jcategory in activities ofnumber Tijt = x 100,
where t=1979, 1986, 1992 and 1999; and j represents the task group, including non-
routine analytic tasks, non-routine interactive tasks, routine cognitive tasks, routine man-
ual tasks, and non-routine manual tasks. For example, if individual i indicates that she
14 The credibility of the analysis in the present study would be impaired if the answers provided by male and female survey participants were systematically biased toward certain categories of tasks. This is unlikely as survey participants only indicate whether they perform certain activities or not and do not as-sign scores to the different measures. In addition, most of the analysis is performed in first-differences; the reporting bias therefore would only pose a problem if it changed over time. 15 The data set does not include information about the time spent on different activities. In addition, while most questions remained the same over time, there were some changes in questions concerning the activi-ties employees perform at the workplace. For consistency, we reduced the activities in each category to those that are comparable over time.

10
performs two interactive tasks and the category includes four tasks in total, then her in-
teractive task measure is 50.16
The data set also includes detailed information on the tools and machines used by
the employees at the workplace. Our measure of computer use is a variable indicating
whether the employees use any of the following on the job: computers, terminals, and
electronic data processing machines.
Employees are classified based on their vocational education:17 (1) People with
low levels of education, that is, people with no occupational training; (2) people with a
medium level of education, that is, people with a vocational qualification who might have
either completed an apprenticeship or graduated from a vocational college and (3) people
with a high level of education, that is, people holding a degree from a university or tech-
nical college.
The Administrative Social Security Records, also known as the IAB employment
sample, is a two percent representative sample of administrative social security records in
Germany covering 1975-2001. The sample, which includes more than 200,000 employ-
ment spells per year, provides precise information on daily wages for all individuals who
contribute to the social security system; this represents about 80 percent of the German
workforce (among the excluded groups are the self-employed and civil servants). The
major shortcoming of the data is that it is right-censored at the contribution assessment
ceiling for the pension insurance (a similar problem encountered by researchers using the
Current Population Survey). The deficit mainly concerns employees with high levels of
16 We tested the sensitivity of our results to our choice of task measure by also trying the share of total tasks an individual performs in each category. The results are robust to this choice. 17 School qualifications are not considered, that is, it is not important which of the three different school streams (Hauptschule, Realschule or Gymnasium) an individual attended.
11
education, for which censoring affects more than 50 per cent of the wage observations.
Because of this, we restrict the wage analysis to employees with low and medium levels
of education only.18
Our wage sample consists of prime-age workers (aged 25-55) in West Germany
who are working full-time (38+ hours per week), though they need not work all year
round. Our wage measure is the daily wage, averaged over the number of days the worker
worked in the respective year. In order to adjust for the differences in working days, we
additionally weight the observations by the number of days worked per year in the analy-
sis.19 We present summary statistics of the wage sample in Appendix Table 3.
IV. Patterns of Task Changes
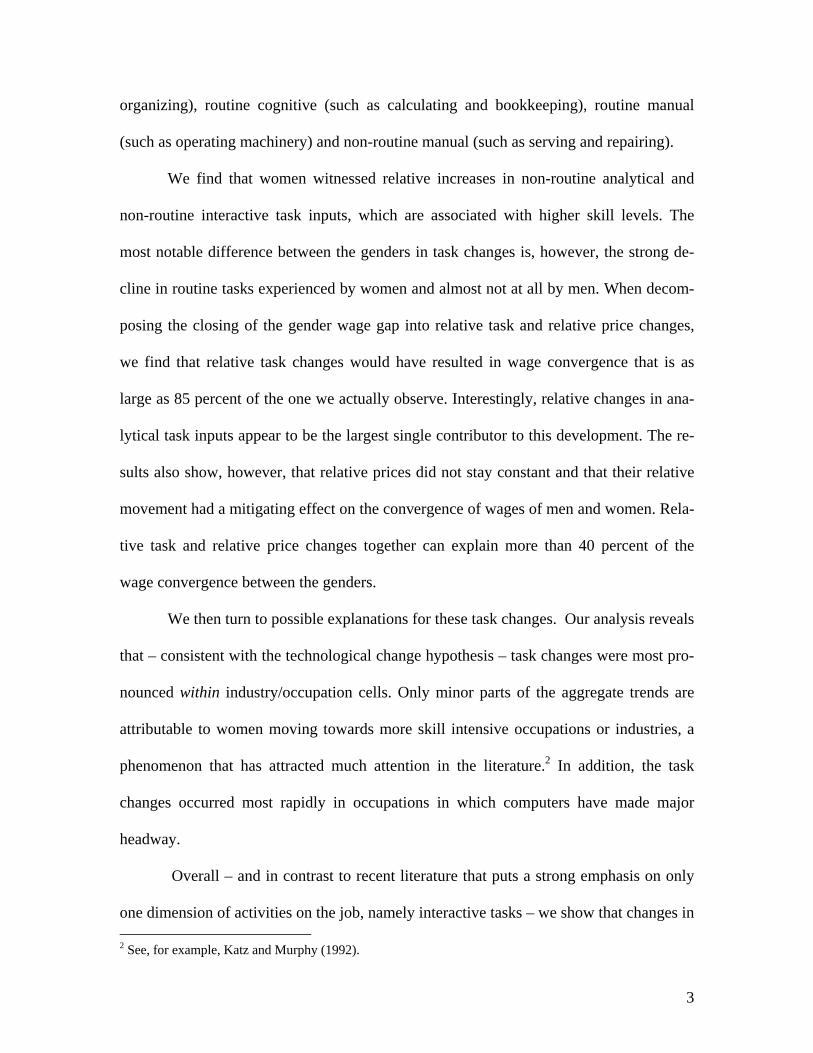
Figure 1 illustrates the evolution of task inputs of women relative to men between
1979 and 1999 by showing the proportional difference in task changes relative to 1979;
that is, growth in female task inputs minus growth in male task inputs. Table 2 shows the
absolute values of task categories for men and women in this period and demonstrates
again how differently they have evolved.20 It is striking that all the changes in task inputs
have been larger for women than for men. In the earliest period, men’s analytical task
inputs were more than twice as high as those for women, while women had higher routine
18 The impact of this restriction is less severe than it might first appear. The reason is that relative changes in task inputs across the genders were most pronounced for low and medium educated employees; hence, they appear to be the most interesting groups to look at. In addition, the gender wage gap convergence has been the most pronounced for low and medium educated employees (Fitzenberger and Wunderlich, 2002). 19 Our results are robust to alternative weighting schemes. 20 Appendix Table 2 presents the summary statistics using an alternative measure of task inputs: the frac-tion of total tasks performed by an employee in each category. The conclusions are consistent across task measures. From now on we focus on the overall period, although Figures 1 and 2 suggest that there are differences across sub-periods that might be interesting to analyze in more detail. However, for the sake of exposition of this study, we leave this for future research. Results are presented for full-time workers only. Results for all worksers are similar.
12
cognitive and routine manual task inputs.21 However, by 1999, women appear to be
catching up to men in terms of analytic skills and, even more, in terms of interactive
skills. For routine cognitive and routine manual skills, where women had dominated 20
years earlier, men have taken over; and non-routine manual skills, which were used pri-
marily by men in 1979, have a larger importance in women’s work relative to that of men
in 1999.22
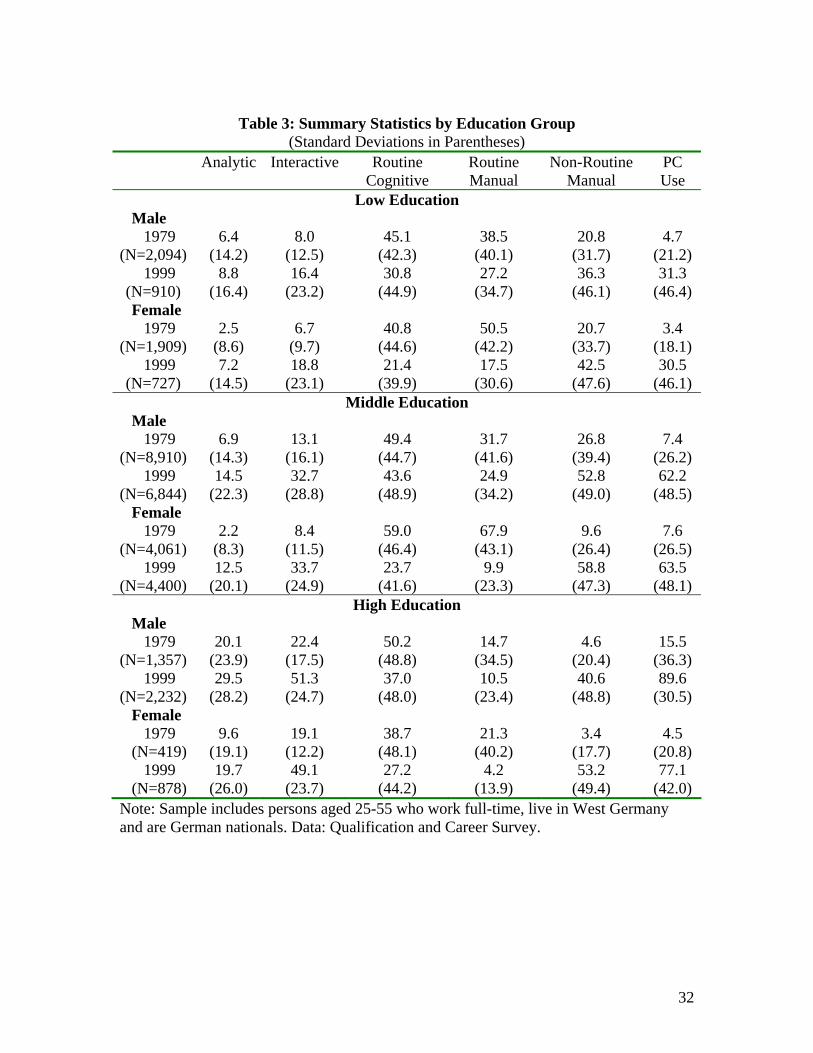
These patterns are very similar across education groups. Table 3 shows the results
for each education group separately. Within each group, women have experienced large
relative increases in analytical task inputs. For low- and medium-educated employees the
differences in analytical skill requirements between the genders is small by 1999, while
for high educated the difference is still notable in 1999. The difference in interactive task
inputs between the genders is small for all education groups by 1999. Women have wit-
nessed large relative decreases in routine tasks — both cognitive and manual — at all
education levels, and large relative increases in non-routine manual task inputs.23, 24
V. Role of Changing Tasks on the Gender Wage Gap
21 Results are presented for full-time workers only. We performed a similar breakdown for all workers for which the descriptive statistics turned out to be very similar. 22 To get a sense of what types of occupations are most affected, sales representatives, bank and insurance clerks, and engineers experienced large declines in routine cognitive tasks, electricians, precision mechan-ics workers, assemblers, gardeners, librarians, and judicial officers all experienced large declines in routine manual tasks, and technical service workers, teachers, clergymen, and social workers experienced large increases in non-routine manual tasks. 23 One concern about looking at these figures is unobserved heterogeneity; we know, for example, that in more recent cohorts girls performed better than boys in school, and it could be that the patterns we are ob-serving are due to cohort effects. To examine this, we look at the evolution of tasks within cohorts (see Appendix Tables 4 and 5). Interestingly, cohort effects do not appear to play a role in explaining task changes within each gender nor in explaining task changes for women relative to men. 24 We restricted the analysis to those occupations that include both men and women, therefore segregated occupations are excluded from our analysis. We did analyze occupational segregation, however. The main finding is that – similar to the developments in the U.S. – occupational segregation has declined in West Germany in recent decades. Most importantly for our analysis is that the pattern of task changes in segre-gated occupations is very similar to those in non-segregated occupations.

13
Given these patterns, we next examine how these changes in tasks relate to the
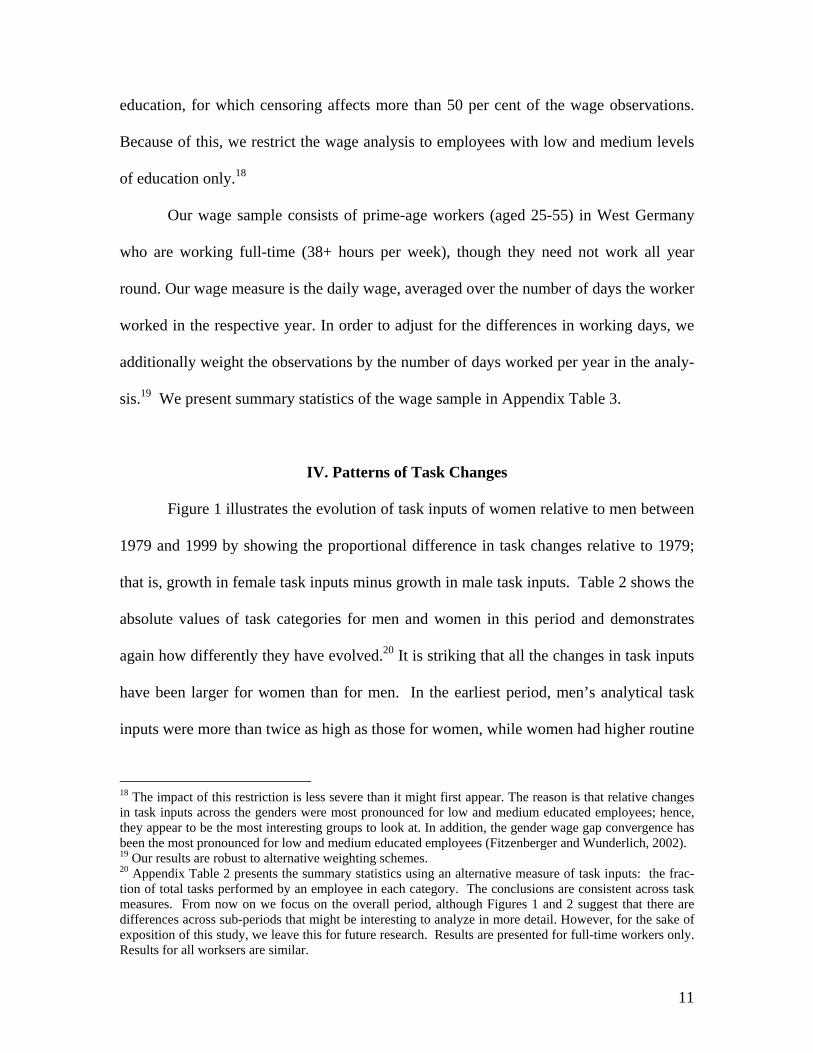
change in the gender wage gap over this period. Figure 2 shows the evolution of the gen-
der wage gap for low and medium educated employees in West Germany. Between 1979
and 1999, the gender wage gap declined by 9.3 percentage points in West Germany. To
investigate the role of task changes, we do a simple decomposition of the rate of wage
convergence into its components, namely, relative task changes and relative price
changes. The decomposition is as follows:
444 3444 21444 3444 21
444 3444 21444 3444 2144444 344444 21
)5(
7999
)4(
7999
)3(
7999
)2(
7999
)1(
7999
)()(
)()()()(
∑∑
∑∑
−−−+
−−−=−−−
jFFF
jMMM
jFFF
jMMMFMFM
ppYppY
YYpYYpWWWW
where gtW is the average log wage for gender g (M=men; F=female) at time t, gtY is the
average value of the skill for gender g at time t, and gtp is the price of the skill for gender
g at time t. Terms (2) and (3) represent the changes in male (2) and female (2) wages that
can be attributed to changes in the “quantity” of tasks – holding prices constant at the av-
erage level over the two time periods. The fourth and fifth terms represent the changes in
male (4) and female (5) wages that can be attributed to changes in the gender-specific
returns – holding gender-specific task inputs constant at the gender average level for the
two periods.
Appendix Table 6 presents the results from the simple wage equation used to gen-
erate the price measures used in the decomposition.25 The log(wage) equations include
controls for education, age, education-gender interactions and age-gender interactions, as
25 Standard errors were adjusted to allow for clustering at the occupation level.

14
well as industry dummies. From Appendix Table 6, Column (1), it is interesting to note
that, on average, women’s rewards for analytical task inputs were much larger than those
for men. This is also the case for the interactive and routine cognitive task category, al-
though the difference in the coefficients is much smaller than in the case of analytic tasks.
Both genders, on average, turn out to be negatively rewarded for routine and non-routine
manual task inputs, with the penalty being larger (smaller) for women than for men for
routine manual tasks (non-routine manual tasks). Both genders have experienced a de-
cline in the price for analytical task inputs and non-routine manual task inputs (column
2); the size of the effect being larger (smaller) for women than for men for the first (lat-
ter) task category. Average prices for interactive tasks have decreased for men but in-
creased for women. Returns to routine cognitive task inputs have decreased for women
but increased for men, whereas average prices for routine manual task inputs have not
changed much for men or women.
Table 4 summarizes the contribution of task changes and price changes to the
gender wage convergence. Of the .093 decline in the gender wage gap over this period,
Column 1 minus Column 2 gives how much of the change in the gender wage gap can be
explained by changes in quantities of these tasks performed, while Column 3 minus Col-
umn 4 gives the amount that can be explained by changes in the prices of these tasks.
Column 5 is the total amount that can be explained by changes in both prices and quanti-
ties (Column 1-Column 2+Column 3-Column 4) and Column 6 gives the total percentage
that can be explained (([Column 5]/.093)*100). Overall, the results suggest that relative
task changes (holding prices fixed at average levels) could explain about 86 percent of
wage convergence ((.08/.093)*100). However, this positive effect of relative task

15
changes was offset by the changes in prices, which would have increased the gender
wage gap by about 45 percent if quantities had been held constant ((-.042/.093)*100).
There are large differences across task categories in how changes in task inputs
have contributed to the gender wage convergence; the relative change in the analytical
task inputs is the largest single contributor to wage convergence (96 percent), followed
by the routine manual task category (66 percent) and the interactive task category (56
percent). The relative changes in the routine cognitive task inputs, by contrast, would
have resulted in a large increase in the gender wage gap (124 percent; that is more than
we actually observed). For this task category, relative price changes add to this pattern, as
they also work in the direction of increasing the gender wage gap (159 percent). For the
interactive task category, in contrast, relative price changes also contributed to the closing
of the gender wage gap (80 percent), so – taking task and price changes together – this
task category was the largest single contributor to wage convergence (135 percent). How-
ever, by solely focusing on this category, one would largely overestimate the gender
wage convergence. The results suggest that in order to being able to identify the factors
contributing to wage convergence, it is important to consider a broader spectrum of tasks.
VI. Sources of Task Changes: Technological Change
Decomposition
What can explain the changes in tasks that we observe? The gender-specific
changes in tasks over time can be broken into two components: (1), changes in the distri-
bution of men and women across occupations and/or industries and, (2), changes in the
task composition within occupations and/or industries. The technological change hy-

16
pothesis predicts that changes in tasks should be observed within industry/occupation to
representing a change in the production process. Changes across industries would be
more consistent with changing product demand, perhaps through increased globalization.
In a first effort to understand the causes of the patterns we observe, we apply a
decomposition similar to that which we did for the change in the gender wage gap. We
decompose the changes in the difference between men and women into those that are due
to changes in the employment of men and women between cells (how much of the differ-
ence can be explained by differential shifts in employment across occupation and/or in-
dustry cells) and those that are due to differential changes in task inputs within cells (how
much of the difference can be explained by the fact that woman and men experience dif-
ferent task changes within occupations and/or industry cells).
Formally, the change in the gender gap in tasks can be decomposed as follows:
444 3444 214444 34444 21
444 3444 21444 3444 214444 34444 21
)5(
7999
)4(
7999
)3(
7999
)2(
7999
)1(
7999
)()(
)()()()(
∑∑
∑∑
−−−+
−−−=−−−
jjFjFFj
jjMjMMj
jjFjFFj
jjMjMMjFMFM
YY
YYYYYYYY
αααα
αα
where gtjY is the average value of the skills for gender g (M=men; F=female) at time t in
occupation j and gtjα is the proportion of gender g employed in cell j at time t. Terms (2)
and (3) represent the fraction of the total change in the gender gap in a particular task that
can be attributed to changes within cells, with the first and second terms representing
within cell task changes for men and women respectively – holding gender-specific em-
ployment shares constant at the average level. The fourth and fifth term represent the
fraction of the total change in the differences that can be attributed to changes in the gen-
17
der-specific employment composition of cells – holding gender-specific task inputs con-
stant at the average level. The fourth term captures the portion that can be attributed to
the changing employment share of men and the final term refers to the portion that can be
attributed to the changing employment share of women.
Table 5 presents the results of this decomposition. The first panel presents results
when we look at occupation cells (and decompose changes in the gender gap in tasks to
within occupation changes and across-occupation changes). The second panel present
results when we look at industry cells, and the final panel presents results when we de-
compose industry*occupation cells.
Column 1 shows the total change in the difference in task inputs of men and
women. Columns (2) and (3) show the within cell task changes by gender, and columns
(4) and (5) show the changes in task inputs for men and women that are due to changes in
the distribution of employment across cells.
From looking down the columns, it is clear that the largest portions of the changes
are coming from within cell task changes, which is consistent with the idea of techno-
logical change altering the task composition of jobs. Interestingly, for all task categories
and all cells, within cell task changes have been larger for women than for men .
The total change in the difference in analytical tasks inputs is not particularly
large, partly because the differences weren’t large to begin with. There have been large
increases in the use of analytic skills for both men and women between 1979 and 1999,
with very little change due to changes across cells. The small decline in the gender gap in
analytical tasks is due to the fact that within cell changes in analytical tasks have been
larger for women than for men. The same is true for interactive skills, although the mag-

18
nitude of the decline in the gender gap in interactive tasks is larger than for the analytical
task category. Again, the primary source of the overall increase in the task measure is the
large increases in the use of interpersonal tasks within cells for both men and women.
Once we turn to the routine tasks, a different pattern emerges. For both cognitive
and manual routine tasks, the gender task gap has increased considerably, although the
use of these tasks has in fact declined for both genders (only exception: routine cognitive
task category within industries). Similar to the non-routine cognitive task categories, the
changes have been most pronounced within cells and the changes have been much larger
for women than for men. The large increase in the task difference results from the fact
that women had larger values of routine tasks in 1979, whereas by 1999 this pattern had
reversed and it was the men who had the highest values in the routine tasks.
The gender gap in the non-routine manual task category experienced the largest
decline between 1979 and 1999. Again, task changes within cells account for the largest
part of the change. The decline in the gap is a result of a considerable relative increase in
non-routine manual activities within cells for women.
Overall, this decomposition suggests that task changes have occurred primarily
within occupations and industries, which is consistent with the idea that technological
developments are a major cause for the changing skill patterns we observe.
Computer Adoption
In this paper, we focus on workplace computerization as our measure of techno-
logical change. The last column in Table 2 shows that not only the evolution of tasks has
been different between the genders; the proliferation of computers has also evolved dif-

19
ferently. In 1979, men were about 20 percent more likely to use computers than women,
while the difference in computer use had declined to 6 percent by 1999.
The task framework makes two specific predictions about which occupations will
adopt computers most rapidly as computer prices declined: (1) occupations intensive in
cognitive and manual routine tasks, for which computers are direct substitutes, and (2)
occupation intensive in non-routine cognitive tasks, for which computers are relative
complements to labor. As men and women had very different occupational skill require-
ments in 1979, these predictions are important in the context of this study. We test them
by fitting the following model:
jjj TC εβα ++=∆ − 1979,19991979, ,
where 19991979, −∆ jC is the percentage point change in the share of employees using a com-
puter in occupation j between 1979 and 1999, 1979,jT is the measure of task intensity in
occupation j in 1979 and jε is an error term.
Table 6 shows the results. The more intensive an occupation was in terms of cog-
nitive and manual routine task in 1979, the faster was the growth in computerization be-
tween 1979 and 1999. This was also the case for non-routine cognitive tasks. In contrast,
occupations intensive in non-routine manual tasks computerized significantly less than
others. Thus, given the different task content of jobs of men and women in the late-1970s,
we would expect computers to alter women’s work relatively more than that of men – an
idea that we can test directly.
We next turn to examine the effect of computer adoption on task inputs, allowing
the effect to vary by gender. In this case, we estimate the following specification:

20
jijtiijti
ijtiijtiijtijt
XYFCYF
YCFCYFCT
εβββ
ββββββ
++++
+++++=
81999719996
19995419993210
)**()*(
)*()*(
where, again, Tijt is the task measure for individual i in occupation j at time t, Cijt is an
indicator of computer use by individual i in occupation j at time t, Fi indicates whether
the individual is female, Y1999 is an indicator if the year is 1999, and Xijt is a vector of
other controls, including gender-specific-education and occupation controls. 5β describes
how the relationship between computers and the task measure has changed between 1979
and 1999, and 7β describes whether this relationship has changed differently for women
relative to men. The task framework suggests that we should see a positive relationship
between computerization and non-routine cognitive skills (analytic and interactive) but a
negative relationship between computerization and routine skills (manual and cognitive).
As the specification includes occupation dummies, we test the relationship between
changes in computer use and changes in task inputs within occupations.
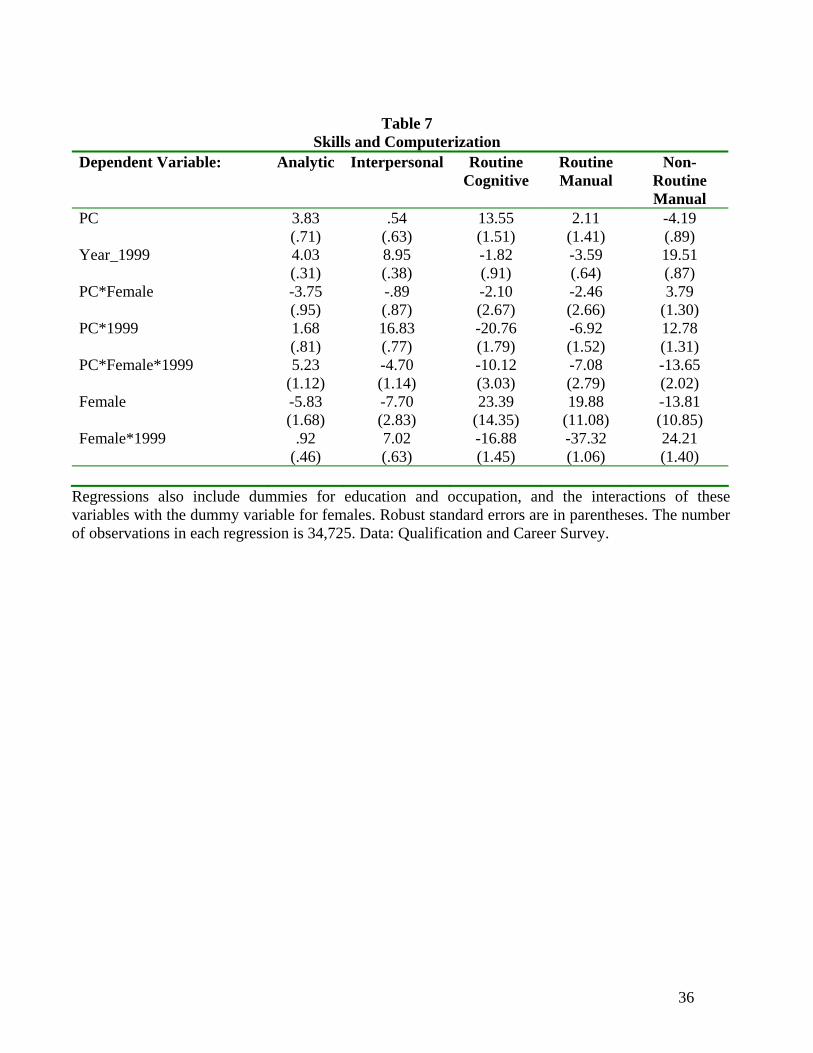
Table 7 shows the results for each task category separately. As before, we restrict
the analysis to the overall period, 1979-1999, so the regressions are based on the pooled
1979- and 1999-waves. The dependent variables are the respective task measures in 1979
and 1999.26
We first look at analytic skills (Column 1). We can see from the interaction of PC
and 1999 that increasing computer use is associated with an increase in analytical tasks.
In addition, we can see from the coefficient on PC*1999*Female that the computeriza-
tion effect is stronger for women than men (the coefficient represents the difference in the
effect for women relative to men). Given that women started out with lower levels of ana-
26 Results are robust to the exclusion of some/all of the controls.

21
lytical task inputs, this catching up effect for female computer users is not very surpris-
ing.
The results for the interactive task category are shown in Column 2. As with the
analytical task category, computer adoption is associated with an increase in interactive
skills. The effect is much stronger for men relative to women. The overall results sug-
gest that computers are relative complements to non-routine interactive task inputs, par-
ticularly among men.
In the case of routine skills, we predict a negative change between computeriza-
tion and task inputs. Column 3 shows the results for the routine cognitive task category.
Female computer users and male computer users have experienced declines in routine
cognitive task inputs, though the effect is larger for women. Column 4 then shows that
the results are similar for the routine manual task category. Again, a possible explanation
for this larger effect of computer use on women’s tasks even within occupations is that
women started out with higher levels ex ante and so, even within occupations, there is
more room for computers to affect skills.27 However, for these two task categories, it is
actually also interesting to note that the coefficient for the interaction term “Fe-
male*1999” is significantly negative and large in size (much larger than the time effects
for men; Year_1999); so the results suggest that part of the larger declines in routine
tasks inputs for women is not explained by computerization.
Based on the task framework, we do not have testable hypotheses about the rela-
tionship between computers and non-routine manual activities. However, as the relation-
27 In order to examine this further, for each task category we break our occupations into 10 deciles based on the 1979 distribution of individual tasks. We then allow the effects to vary by decile of this distribution and find that the effects of computerization are the same for men and women, suggesting that it is the rela-tive starting point that allows for differential effects for men and women.

22
ship might still be interesting, Column 5 presents the results for this task category. We
see that computer adoption is associated with significantly more non-routine manual
tasks among men; however, this effect is much smaller among women. In addition, for
men and (even more so for) women, changes in non-routine tasks not explained by work-
place computerization is large.28
VII. Polarization
There is one dimension along which the task-based framework diverges from the
traditional skill-biased technological change hypothesis: in its prediction about who is
most affected by technological change. The traditional skill-biased technological change
hypothesis predicts an increased demand for skilled jobs relative to unskilled jobs. The
task-based framework presents a more nuanced view of this (see Autor, Katz and Kear-
ney, 2006, Goos and Manning, 2007, and Spitz-Oener, 2006). The argument is that it is
jobs that employ middle education workers that are going to be most affected by comput-
erization, which will lead to a hollowing-out of the distribution of jobs by skill. Comput-
erization substitutes for routine cognitive tasks, which affects mainly employees with
medium levels of education such as bookkeepers and bank clerks. Non-routine manual
tasks, in contrast, that at present cannot be accomplished by computers, are often found in
occupations held by employees with low levels of education, such as waiters or cleaning
staff. As a result, one would expect to see a polarization of employment into tasks origi-
nally performed by the lowest and highest skilled workers as a result of computerization.
28 We also analyzed the relationship between task changes and workplace computerization for each educa-tion group separately. Our overall conclusions also hold within education groups.

23
Given the initial distribution of tasks in 1979, we suspect that the polarization
pressure in the labor market was larger for women than for men in the last three decades.
The question of polarization concerns the evolution of employment across occupations
based on their levels of skills. As a proxy for skills, we divide occupations into 10 dec-
iles based on their median wages in 1979 (separately by gender), so that the occupations
in the first group have the lowest median wages in 1979 and the occupations in the 10th
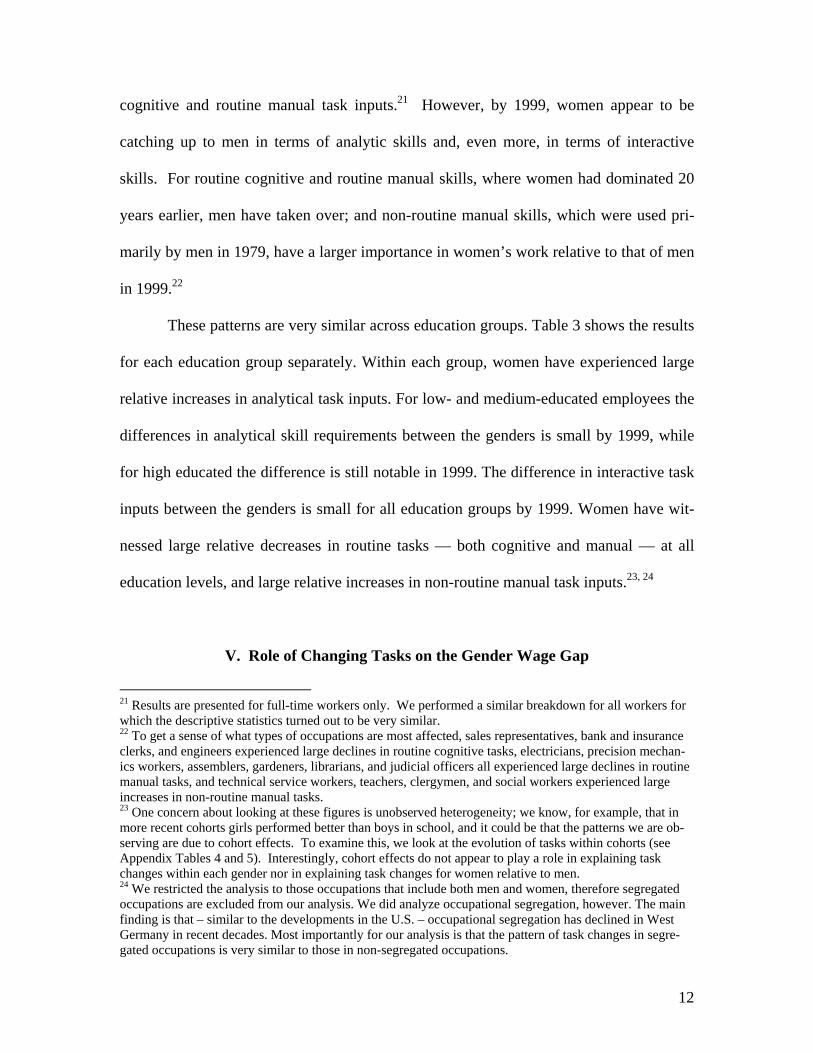
group have the largest median wages in 1979. Figure 3 shows the proportion change in
(full-time) employment shares between 1979 and 1999 for the ten groups for men and
women separately. The graphs for men and women look quite different, with the “hol-
lowing out” tendency of the labor market being more pronounced for women than for
men. While the employment share for men has grown by about 37 percent and that of
women by more then 100 percent in the tenth group between 1979 and 1999, the decline
in the employment share in the first group was smaller for women (about 10 percent) than
for men (close to 20 percent). In contrast, the decline in employment shares in the “mid-
dle” occupations has been more pronounced for women, with the largest difference being
in the second group in which the employment share has shrunk by 52 percent for women
and by 23 percent for men.
VIII. Conclusion
Since the 1970s, women have experienced great improvements in terms of labor
market success. Most research has attributed this success story to supply factors, whereas
demand side explanations played only a minor role. In this study, we investigate the clos-
ing of the gender wage gap using direct measures of job tasks. The advantage of this

24
task-based approach is that we are able to directly compare the content of women’s work
to that of men. In addition, we are also able to relate the changes to technological devel-
opments, a major argument for demand side changes in the labor market.
While we are using data from West Germany, there is no reason to believe that
technology adoption was different in West Germany relative to other countries. How-
ever, to examine this, we also analyzed a number of specifications that allow us to com-
pare our results to those of earlier work using United States data; these comparisons sug-
gest that the patterns we observe in West Germany are not unique to that country.29 In
addition, computer use has evolved quite similarly in the United States and West Ger-
many (with West Germany only lagging behind in the early-1980s), and we have little
reason to believe that the adoption of these new technologies would have different effects
in West Germany relative to the U.S. or other countries.
We find that changes in work content have been larger for women than for men
along all dimensions we consider, a result that is particularly interesting in light of recent
work focusing solely on interactive, or “people” skills. We show that, although women
experienced large relative increases in non-routine interactive tasks and also in non-
routine analytic tasks, the most striking difference between the genders is the marked de-
cline in routine tasks experienced by women and almost not at all by men. 29The results in ALM (2003) and Spitz-Oener (2006) show that aggregate task changes have followed the same pattern in both countries. In ALM (2003), the authors present task means broken down by gender. Although the numbers themselves are not comparable, we can compare the relative distribution of tasks across men and women. In their case, as in ours, men’s analytic skills exceed those of women in 1980 but women make significant strides towards closing the gap by 1998/9. This is also the case for interactive skills, though women actually catch up and surpass men by 1998/9. In the case of routine cognitive and routine manual skills, in the U.S., women start out much higher than men but, by the end, women decline by substantially more than men. In the case of routine cognitive skills, women are lower than men by 1998/9, whereas for routine manual, women have narrowed the gap substantially. In West Germany, we see the same pattern except that women start higher and end lower than men in both categories. Finally, ALM find almost no change in non-routine manual skills for men and women while we have evidence of an increase in non-routine manual skills for women but a decline for men. Overall, the comparison sug-gests that the relative distribution of skills may be similar in the U.S. and West Germany.

25
In addition, we find that relative task changes are important in explaining the clos-
ing of the gender wage gap. Task changes and price changes are able to account for a
substantial fraction of the closing of the gender wage gap in recent decades.
When investigating the potential sources of task changes, we find that technologi-
cal change might be important in explaining the phenomena, as 1) task changes were
most pronounced within industries and occupations, and 2) task changes occurred most
rapidly in occupations in which computers have made major headway.
The paper also contributes to the discussion on polarization that has experienced
revitalization owing to the task-based approach. We find evidence of polarization in em-
ployment for both women and men. Interestingly and in line with the task changes that
we observe for the two genders, the polarization tendency in the labor market has been
larger for women than for men in recent decades.

26
References Acemoglu, D. (2002), “Technical Change, Inequality and the Labor Market”, Journal of Economic Literature, Vol. 40(1), 7-72. Autor, D.H., L.F. Katz, and M.S. Kearney (2006), “The Polarization of the U.S. Labor Market,” American Economic Review Papers and Proceedings, Vol. 96(2), 189-194. Autor, D.H., F. Levy, and R.J. Murnane (2003), “The Skill Content of Recent Techno-logical Change: An Empirical Exploration,” Quarterly Journal of Economics, Vol. 118(4), 1279-1333. Bacolod, Marigee and Bernard S. Blum (2005), “Two Sides of the Same Coin: U. S. “Re-sidual” Inequality and the Gender Gap,” Unpublished manuscript. Black, S. and C. Juhn (2000), “The Rise in Female Professionals: Are Women Respond-ing to Skill Demand”, American Economic Review Papers and Proceedings, Vol. 90(2), 450-455. Blau, F.D., and L.M. Kahn (1997), “Swimming Upstream: Trends in the Gender Wage Differential in the 1980s,” Journal of Labor Economics, Vol. 15(1), 1-42. Blau, F.D., and L.M. Kahn (2003), “Understanding International Differences in the Gen-der Pay Gap,” Journal of Labor Economics, Vol. 21(1), 106-144. Blau, F.D., and L.M. Kahn (2006), “The U.S. Gender Pay Gap in the 1990s: Slowing Convergence,” Industrial and Labor Relations Review, Vol. 60(1), 45-66. Borghans, L., B. ter Weel, and Bruce A. Weinberg (2006), “People People: Social Capital and the Labor-Market Outcomes of Underrepresented Groups,” NBER Working Paper 11985. Chennells, L., and J. van Reenen (1999), “Has Technology Hurt Less Skilled Workers”, IFS Working Paper No. W99/27. Fitzenberger, B. and G. Wunderlich (2002), “Gender Wage Differences in West Ger-many: A Cohort Analysis”, German Economic Review, Vol. 3(4), 379-414. Goos, M. and A. Manning (2007), “Lousy and Lovely Jobs: The Rising Polarization of Work in Britain,” Review of Economics and Statistics, Vol. 89(1), 118-133. Katz, L.F., D.H. Autor (1999), “Changes in the Wage Structure and Earnings Inequality”, in Handbook of Labor Economics, Ed. O. Ashenfelter and D. Card, 1463-1555. Katz, L.F. and K.M. Murphy (1992), “Changes in Relative Wages, 1963-1987: Supply and Demand Factors”, Quarterly Journal of Economics, Vol. 107(1), 35-78.
27
Levy, F. and R. Murnane (1992), “U.S. Earnings Levels and earnings Inequality: A Re-view of Recent Trends and Proposed Explanations”, Journal of Economic Literature, 30, 1333-1381. Mulligan, C.B. and Y. Rubinstein (2005), “Selection, Investment and Women’s Relative Wages Since 1975”, NBER WP 11159. Olivetti, C. and B. Petrongolo (2006), “Unequal Pay or Unequal Employment? A Cross-country Analysis of Gender Gaps”, CEPR DP 5506 February. O’Neill, J. and S. Polachek (1993), “Why the Gender Wage Gap Narrowed in the 1980s”, Journal of Labor Economics, 11(1), 205-228. Spitz-Oener, A. (2006), “Technical Change, Job Tasks, and Rising Educational De-mands: Looking Outside the Wage Structure”, Journal of Labor Economics, 24(2), 235-270. Weinberg, B.A. (2000), “Computer Use and the Demand for Female Workers,” Industrial and Labor Relations Review, Vol. 53(2), 290-308. Welch, F. (2000), “Growth in Women’s Relative Wages and in Inequality among Men: One Phenomenon or Two?” American Economic Review Papers and Proceedings, Vol. 90(2), 444-449.

28
-1.5
-1-.5
0.5
1Fe
mal
e R
elat
ive
Task
Cha
nges
1979 1985 1991 1999
Analytic InteractiveRoutine Cognitive Routine ManualNon-routine Manual
Note: Female relative task changes are defined as growth in female task inputs minus growth inmale task inputs (both relative to 1979). Data source: BIBB-IAB
Figure 1: Female Relative Task Changes.
.74
.76
.78
.8.8
2W
age
Gap
1975 1980 1985 1990 1995 2000year
Note: Low- and medium-educated persons aged 25-55 who work full-time, live in West Germanyand are German nationals. The wage gap is a 3-year centered moving average of the ratio of un-conditional median male and female real daily wages.Data source: IAB employment sample
Figure 2: Evolution of the Gender Wage Gap—West Germany, 1975-2001.

29
-60
-40
-20
020
4060
8010
0
1 5 10 1 5 10
Men FemaleC
hang
es in
Em
ploy
men
t Sha
res
(in P
erce
nt)
Note: The figure shows percentage changes in (full-time) employment shares between 1979 and 1999for occupations that are ranked in 10 groups according to their median wages in 1979.Data: IAB Employment Sample
Figure 3: Changes in Employment Shares by 1979 Median Wages

30
Table 1: Assignment of Activities
Classification Tasks Non-routine analytic researching/analyzing/evaluating and planning, making
plans/constructions/designing and sketching, working out rules/prescriptions, using and interpreting rules
Non-routine interactive negotiating/lobbying/coordinating/organizing, teaching/training, selling/buying/advising customers/advertising, entertaining/presenting, employ/manage personnel
Routine cognitive calculating/bookkeeping, correcting of texts/data, measuring of length/weight/temperature
Routine manual operating/controlling machines, equipping machines
Non-routine manual repairing/renovation of houses/apartments/machines/vehicles, restoring of art/monuments, serving or accommodating
Note: Overview of how activities asked for in the Qualification and Career Survey (col-umn 2) are grouped into the task categories.

31
Table 2: Summary Statistics: Full-Time Workers Only
(Standard Deviations in Parentheses) Analytic Interactive Routine
Cognitive Routine Manual
Non-Routine Manual
PC Use
Male 1979 (N=12,361)
8.3 (16.2)
13.3 (16.1)
48.8 (44.8)
31.0 (41.1)
23.4 (37.4)
7.8 (26.9)
1999 (N=9,986)
17.3 (24.2)
35.4 (29.1)
40.9 (48.5)
21.9 (32.7)
48.6 (49.1)
65.5 (47.5)
Change 1979-1999 9.0 22.1 -7.9 -9.1 15.2 57.7 Female 1979 (N=6,389)
2.8 (9.6)
8.6 (11.4)
52.2 (46.9)
59.6 (44.5)
12.5 (28.8)
6.2 (24.0)
1999 (N=5,989)
12.9 (20.8)
34.2 (25.7)
24.0 (41.8)
9.9 (23.4)
56.1 (48.0)
61.6 (48.6)
Change 1979-1999 10.1 25.6 -28.2 -49.7 43.6 55.4 Difference (Male-Female) 1979
5.5 (.2)
4.7 (.2)
-3.4 (.7)
-28.6 (.6)
10.9 (.5)
1.6 (.4)
1999
4.4 (.4)
1.2 (.5)
16.8 (.8)
11.9 (.5)
-7.5 (.8)
3.9 (.8)
Note: Sample includes persons aged 25-55 who work full-time, live in West Germany and are German nationals. Data: Qualification and Career Survey.
32
Table 3: Summary Statistics by Education Group
(Standard Deviations in Parentheses) Analytic Interactive Routine
Cognitive Routine Manual
Non-Routine Manual
PC Use
Low Education Male 1979 (N=2,094)
6.4 (14.2)
8.0 (12.5)
45.1 (42.3)
38.5 (40.1)
20.8 (31.7)
4.7 (21.2)
1999 (N=910)
8.8 (16.4)
16.4 (23.2)
30.8 (44.9)
27.2 (34.7)
36.3 (46.1)
31.3 (46.4)
Female 1979 (N=1,909)
2.5 (8.6)
6.7 (9.7)
40.8 (44.6)
50.5 (42.2)
20.7 (33.7)
3.4 (18.1)
1999 (N=727)
7.2 (14.5)
18.8 (23.1)
21.4 (39.9)
17.5 (30.6)
42.5 (47.6)
30.5 (46.1)
Middle Education Male 1979 (N=8,910)
6.9 (14.3)
13.1 (16.1)
49.4 (44.7)
31.7 (41.6)
26.8 (39.4)
7.4 (26.2)
1999 (N=6,844)
14.5 (22.3)
32.7 (28.8)
43.6 (48.9)
24.9 (34.2)
52.8 (49.0)
62.2 (48.5)
Female 1979 (N=4,061)
2.2 (8.3)
8.4 (11.5)
59.0 (46.4)
67.9 (43.1)
9.6 (26.4)
7.6 (26.5)
1999 (N=4,400)
12.5 (20.1)
33.7 (24.9)
23.7 (41.6)
9.9 (23.3)
58.8 (47.3)
63.5 (48.1)
High Education Male 1979 (N=1,357)
20.1 (23.9)
22.4 (17.5)
50.2 (48.8)
14.7 (34.5)
4.6 (20.4)
15.5 (36.3)
1999 (N=2,232)
29.5 (28.2)
51.3 (24.7)
37.0 (48.0)
10.5 (23.4)
40.6 (48.8)
89.6 (30.5)
Female 1979 (N=419)
9.6 (19.1)
19.1 (12.2)
38.7 (48.1)
21.3 (40.2)
3.4 (17.7)
4.5 (20.8)
1999 (N=878)
19.7 (26.0)
49.1 (23.7)
27.2 (44.2)
4.2 (13.9)
53.2 (49.4)
77.1 (42.0)
Note: Sample includes persons aged 25-55 who work full-time, live in West Germany and are German nationals. Data: Qualification and Career Survey.

33
Table 4: Decomposition of the Wage Convergence: 1979-1999
Rate of Wage Convergence: .093
Changes in Quantities:
Female
(1)
Changes in Quantities:
Male
(2)
Changes in Prices: Female
(3)
Changes in Prices
Male
(4)
Predicted Change in
Gender Wage Gap
(5)
Percentage of Change in Wage Gap Explained
(6) Analytic .116 .027 -.016 -.011 .084 90.3 Interactive .153 .100 .042 -.032 .126 135.5 Routine Cognitive -.119 -.003 -.117 .031 -.263 -282.8 Routine Manual .064 .002 .015 .003 .074 79.6 Non-Routine Manual -.025 -.017 -.056 -.081 .018 19.4 Total: .189 .109 -.132 -.090 .039 41.9 Predicted Change in Gender Wage Gap:
.08 -.042 41.9
Note: Task prices and changes in task prices are estimated using wage regressions; the detailed results of these wage regressions can be found in Table 6 in the appendix. Data: Qualification and Career Survey and IAB employment sample.

34
Table 5
Decomposition of the Change in the Task Difference: 1979-1999 Total
Change in Difference
(1)
Within Male
(2)
Within Female
(3)
Between Male
(4)
Between Female
(5)
Occupation (N=46)
Analytic -1.1 8.1 9.4 1.0 .7 Interactive -3.4 20.6 23.2 1.5 2.3 Routine Cognitive 20.5 -8.2 -29.0 .4 .7 Routine Manual 40.6 -7.8 -47.1 -1.3 -2.6 Non-Routine Manual
-18.3 25.2 41.5 .01 2.1
Industry (N=38)
Analytic -1.8 8.0 9.6 .6 .8 Interactive -5.6 18.6 24.2 1.0 1.0 Routine Cognitive 28.6 1.5 -29.4 -.3 2.0 Routine Manual 44.6 -3.1 -47.8 -1.4 -1.4 Non-Routine Manual
-24.0 19.2 43.1 .4 .5
Industry x Occupation (N=288)
Analytic -.9 8.9 10.1 .9 .6 Interactive -2.4 22.7 24.0 .5 1.6 Routine Cognitive 15.5 -14.6 -32.8 -.1 2.5 Routine Manual 37.1 -14.5 -47.8 -.6 -4.3 Non-Routine Manual -15.4 28.9 43.7 1.9 2.4 Note: Sample includes persons aged 25-55 who work full-time, live in West Germany and are German na-tionals. Each panel represents decompositions at different levels, first within/across occupation, then within/across industry, and finally within/across industry*occupation cells. Means across panels are differ-ent because of slightly different samples; however, results are entirely consistent when calculated using a constant sample. Each row represents a separate component of the decomposition, where the columns are numbered as follows:
444 3444 214444 34444 21
444 3444 21444 3444 214444 34444 21
)5(
7999
)4(
7999
)3(
7999
)2(
7999
)1(
7999
)()(
)()()()(
∑∑
∑∑
−−−+
−−−=−−−
jjFjFFj
jjMjMMj
jjFjFFj
jjMjMMjFMFM
YY
YYYYYYYY
αααα
αα
Data: Qualification and Career Survey.

35
Table 6: Predicting Occupational Computer Adoption Dependent Variable: Change in PC Use (1979-1999)
1979 Value:
Analytic
1.76 (.50)
Interactive
1.36 (.53)
Routine Cognitive
.81 (.10)
Routine Manual
.26 (.18)
Non-Routine Manual
-.68 (.13)
N=46 Each cell represents the coefficient from a separate regression estimat-ing the relationship between the 1979 mean occupational level of the specified task and the change in occupational PC use between 1979 and 1999. Regressions are weighted by the number of employees in occupations in 1979. Data: Qualification and Career Survey.
36
Table 7
Skills and Computerization Dependent Variable: Analytic Interpersonal Routine
Cognitive Routine Manual
Non-Routine Manual
PC 3.83 (.71)
.54 (.63)
13.55 (1.51)
2.11 (1.41)
-4.19 (.89)
Year_1999 4.03 (.31)
8.95 (.38)
-1.82 (.91)
-3.59 (.64)
19.51 (.87)
PC*Female -3.75 (.95)
-.89 (.87)
-2.10 (2.67)
-2.46 (2.66)
3.79 (1.30)
PC*1999 1.68 (.81)
16.83 (.77)
-20.76 (1.79)
-6.92 (1.52)
12.78 (1.31)
PC*Female*1999 5.23 (1.12)
-4.70 (1.14)
-10.12 (3.03)
-7.08 (2.79)
-13.65 (2.02)
Female
-5.83 (1.68)
-7.70 (2.83)
23.39 (14.35)
19.88 (11.08)
-13.81 (10.85)
Female*1999 .92 (.46)
7.02 (.63)
-16.88 (1.45)
-37.32 (1.06)
24.21 (1.40)
Regressions also include dummies for education and occupation, and the interactions of these variables with the dummy variable for females. Robust standard errors are in parentheses. The number of observations in each regression is 34,725. Data: Qualification and Career Survey.

37
Appendix Table 1
List of Occupations 1 Agricultural Worker 48 Plasterer 2 Animal Producer and Related Worker 49 Interior decorator 3 Administration worker in agriculture 50 Wood and plastic processing worker 5 Gardener, horticultural worker 51 Painter/varnisher 6 Forestry and Hunting Worker 52 Product tester 7 Miner 53 Unskilled worker 8 Mineral processing worker 54 Machine operator 10 Stone Cutter and Carver 55 Machine installer 11 Construction Material Manufacturer 60 Engineer 12 Potter 61 Chemist, Physicist, Mathematician 13 Worker in glass production and processing 62 Technician 14 Chemistry worker 63 Technical service worker 15 Worker in plastics production 64 Technician draftsperson 16 Paper production and processing worker 65 Foremen 17 Printing and related trades worker 66 Sales person 18 Wood and textile worker 67 Wholesale and retailing worker 19 Steel and smelter worker 68 Sales representative 20 Foundry worker 69 Bank and insurance clerk 21 Metal molder 70 Other (unspecified) sales person 22 Metal machine-cutter 71 Land traffic operator 23 Precision worker in metal 72 Water and air traffic operator 24 Metal welder 73 Communication worker 25 Metal construction worker 74 Storekeeper 26 Sheet metal and construction worker 75 Management Consultant 27 Machine construction and maintenance
worker 76 Member of Parliament
28 Vehicle and aircraft construc-tion/maintenance worker
77 Computer scientist/accountant
29 Tool and mould construction worker 78 Office clerk 30 Precision mechanics worker 79 Guard/watchmen 31 Electrician 80 Security personnel 32 Assembler 81 Judicial officer 33 Weaver, spinner 82 Librarian/translator/publicist 34 Textile producer 83 Artist/performer 35 Textile processing worker 84 Physician/pharmacist 36 Textile refinement worker 85 Medical service worker 37 Leather and fur processing worker 86 Social worker 39 Baker 87 Teachers 40 Butcher 88 Scientist in humanities and natural sciences 41 Cooks 89 Clergyman 42 Beverage and foodstuff production worker 90 Hairdresser/cosmetician/personal hygiene tech-
nician 43 Worker in other nutrition industries 91 Hotel and guesthouse worker 44 Building construction worker 92 Housekeeper/dietician 46 Underground construction worker 93 Cleaning and waste disposal worker 47 Unskilled construction worker

38
Appendix Table 2 Summary Statistics: Full-Time Workers Only
Alternative Measure of Tasks (Standard Deviations in Parentheses)
Analytic Interactive Routine Cognitive
Routine Manual
Non-Routine Manual
PC Use
Male 1979 (N=12,361)
10.0 (21.7)
31.1 (32.7)
24.8 (28.2)
16.6 (25.8)
17.5 (30.1)
7.9 (26.9)
1999 (N=10,012)
9.4 (15.7)
47.2 (31.1)
12.2 (15.9)
14.9 (22.7)
16.3 (20.1)
65.5 (47.5)
Change 1979-1999 -.6 16.1 -12.6 -1.7 -1.2 57.6 Female 1979 (N=6,389)
3.8 (14.4)
25.3 (32.8)
27.8 (28.7)
33.1 (28.8)
10.0 (24.2)
6.2 (24.0)
1999 (N=6,007)
8.5 (16.4)
55.3 (29.6)
7.8 (14.3)
7.6 (18.5)
20.9 (22.8)
61.6 (48.6)
Change 1979-1999 4.7 30.0 -20.0 -25.5 10.9 55.4 Difference (Male-Female) 1979
6.2 5.8 -3.0 -16.5 7.5 1.7
1999
0.9 -8.1 4.4 7.3 -4.6 3.9
Note: The task measure is the share of total tasks performed by an individual in each category. Data: Qualification and Career Survey.

39
Appendix Table 3
Summary Statistics: Wage Sample Full-Time Workers Only
N Mean Std. Dev. Minimum Maximum All Age 334,359 38.73 8.57 25 55 Real Daily Wage (in €) 334,359 77.77 28.24 2.02 143.07 Fraction of Woman 334,359 40.76 49.14 0 100 Low Educated Age 51,182 41.18 8.54 25 55 Real Daily Wage (in €) 51,182 63.79 23.30 2.02 143.07 Fraction of Woman 51,182 51.21 49.98 0 100 Medium Educated Age 283,177 38.29 8.50 25 55 Real Daily Wage (in €) 283,177 80.30 28.32 2.02 143.07 Fraction of Woman 283,177 38.88 48.74 0 100 Note: Persons aged 25-55 who work full-time, live in West Germany and are German nationals. Data: IAB employment sample; Years 1979 and 1999.

40
Appendix Table 4 Cohort Analysis
Year of Birth: Analytic Interactive Routine Cognitive
Routine Manual
Non-Routine Manual
1979 1999 1979 1999 1979 1999 1979 1999 1979 1999 Males After 1970 11.9 26.8 40.8 24.0 56.1 1950-1969 7.0 17.9 10.7 36.0 46.6 42.1 35.8 22.7 28.4 48.0 1930-1949 9.0 19.2 14.4 39.1 49.3 37.9 28.6 18.4 22.3 45.4 Before 1930
7.7 13.2 50.0 31.4 19.8
Average Change: Within Cohort 10.5 25.0 -7.9 -11.6 21.4 Within Age
8.4 21.2 -8.3 -10.2 26.3
Females After 1970 11.0 31.2 22.7 9.9 62.0 1950-1969 3.1 13.7 8.9 35.2 58.1 25.0 65.3 10.2 9.1 54.6 1930-1949 2.7 13.2 8.7 35.2 48.4 22.6 56.8 9.3 14.0 52.1 Before 1930
1.7 7.4 42.9 48.3 20.0
Average Change: Within Cohort 10.5 26.4 -29.5 -51.3 41.8 Within Age 10.1 25.6 -26.4 -47.0 41.8
Note: Each cell represents the average value of the task measure for a particular cohort in a particular year. Data: Qualification and Career Survey.

41
Appendix Table 5 Cohort Analysis
By Education Group Year of Birth: Analytic Interactive Routine
Cognitive Routine Manual
Non-Routine Manual
1979 1999 1979 1999 1979 1999 1979 1999 1979 1999 Low Education Males After 1970 9.9 15.1 31.4 25.7 43.6 1950-1969 8.2 8.6 6.8 16.4 46.6 31.6 45.4 28.5 16.3 35.6 1930-1949 6.0 8.1 8.3 17.6 43.2 27.8 35.9 25.1 22.5 31.2 Before 1930
5.3 8.4 47.5 37.3 21.7
Females After 1970 6.9 18.8 18.6 14.5 58.0 1950-1969 3.8 6.9 8.2 19.2 51.1 23.1 54.5 18.9 14.1 39.5 1930-1949 2.1 8.1 6.1 18.1 37.1 20.3 51.2 17.2 22.6 33.7 Before 1930 1.2 5.5 32.5 43.1 26.8 Middle Education Males After 1970 10.3 27.3 43.1 25.1 59.6 1950-1969 5.5 15.1 10.8 33.1 46.3 44.6 35.3 25.6 32.9 52.5 1930-1949 7.6 16.2 14.1 35.7 50.4 41.1 29.7 22.6 25.5 48.5 Before 1930
6.8 13.4 51.0 32.1 21.7
Females After 1970 10.7 31.7 23.3 9.7 63.5 1950-1969 2.4 13.3 8.3 34.4 61.6 24.8 71.9 10.3 7.9 57.6 1930-1949 2.1 13.2 8.6 34.7 56.0 21.0 64.9 8.7 10.6 54.9 Before 1930 1.7 8.2 55.3 56.7 15.3 High Education Males After 1970 27.9 37.5 34.1 13.1 44.1 1950-1969 19.4 29.5 18.4 51.6 49.9 38.8 21.1 12.2 7.9 39.4 1930-1949 20.5 29.7 23.5 53.7 50.8 33.4 13.6 6.2 4.4 42.5 Before 1930
19.1 22.5 48.4 12.2 2.2
Females After 1970 19.8 44.0 22.1 5.3 51.0 1950-1969 9.8 20.0 18.4 48.6 40.0 27.0 22.2 4.0 5.0 52.2 1930-1949 10.4 18.3 20.0 54.1 39.6 31.2 20.1 4.1 2.9 58.2 Before 1930 5.4 17.7 30.3 23.5 0.0
Note: Each cell represents the average value of the task measure for a particular cohort in a particular year. Data: Qualification and Career Survey.

42
Appendix Table 6: Task Prices Dependent Variable: Log Real Daily Wages
Analytic .383 (.012) .430 (.017) Interactive .593 (.006) .810 (.013) Routine Cognitive .130 (.002) .126 (.007) Routine Manual -.047 (.004) -.064 (.007) Non-routine Manual
-.086 (.003) .007 (.007)
Analytic*woman .838 (.029) .893 (.053) Interactive*woman .085 (.016) -.323 (.042) Routine Cognitive*woman .264 (.007) .371 (.011) Routine Manual*woman -.080 (.009) .028 (.013) Non-routine Manual*woman
.016 (.006) .061 (.016)
Analytic*d_99 -.112 (.025) Interactive*d_99 -.154 (.016) Routine Cognitive*d_99 .070 (.009) Routine Manual*d_99 .010 (.010) Non-routine Manual*d_99
-.214 (.010)
Analytic*woman*d_99 -.113 (.067) Interactive*woman*d_99 .374 (.051) Routine Cognitive*woman*d_99 -.392 (.017) Routine Manual*woman*d_99 .034 (.023) Non-routine Manual*woman*d_99
.059 (.020)
Woman -.211 (.009) -.285 (.016) d_99 .010 (.002) .073 (.009) Woman*d_99 .116 (.017) R^2 .355 .359 N 334,359 Note: The regressions are based on the IAB employment sample with task measures from the Qualification and Career Survey merged to the data on the occupational level. The regressions include controls for education, age (linearly), education-gender interactions and age-gender interactions, as well as industry dummies. Only employees with low and medium level of education are considered. Regressions are weighted by the number of days worked per year. Robust standard errors are in parentheses.