exploration use of high resolution magnetotellurics
TRANSCRIPT

1
EXPLORATION USE OF HIGH RESOLUTION MAGNETOTELLURICS
Daniel A. Woods, President
Digital Magnetotelluric Technologies
Broken Arrow, Oklahoma
Dr. Robert Olson, Consultant
Digital Magnetotelluric Technologies
Broken Arrow, Oklahoma
ABSTRACT
High Resolution Magnetotellurics is a passive electromagnetic (EM) system for the exploration for oil and gas in the earth’s subsurface. The research on and use of Controlled Source ElectroMagnetic (CSEM) sounding for offshore hydrocarbons by the major oil companies during the last several years has brought increased oil industry acceptance of the use of electromagnetic technology in the exploration for oil and gas. Passive ElectroMagnetic (EM) sounding, notably Magnetotellurics (MT), uses the natural electromagnetic waves produced by the interaction of earth’s magnetic field with the solar wind. This signal source carries all frequencies. With Controlled Source ElectroMagnetic sounding, the surveyor must generate the source electromagnetic wave that is induced into the earth, and select which subsurface returning frequencies to analyze.
Passive magnetotellurics (MT) must capture and analyze the proper frequencies from the naturally occurring electromagnetic waves returning to the surface from the subsurface of the earth. With Digital Magnetotelluric Technologies’ proprietary Z-SCAN, the raw Magnetotellurics EM signal is demodulated to an audio format for analysis. With a trained operator, using both analog and digital computers, the audio signal can be interpreted (Z-SCAN) to give formation depth (+- 25 feet) (7.5 m) andthickness (> 3 feet) (1 m). Approximately 2,800 feet (850 m) of vertical log can be analyzed per day. Signal strength and character can give a subjective estimate of porosity while phase changes can help identify fluid characteristics. The recorded passive electromagnetic data can also be analyzed entirely by the computer with our proprietaryDIGILOG system. The DIGILOG process (which is still under development) can analyze from 1,300 feet (400 m) to 16,000 feet (5,000 m) in a single pass with a depth

2
accuracy of +- 250 feet (80 m) and will normally flag hydrocarbon zones thicker than 15feet (5 m). This can usually be completed in one day.
The Z-SCAN and DIGILOG systems in various forms have been in operation since 1994. The results can be divided into two interpretation categories: negative calls and positive calls. The negative calls are over 99% correct. Over 250 positive recommendations have been drilled to date and the success rate is approaching 50%. As with any remote sensing system, including CSEM and High Resolution Magnetotellurics, false positives do occur. We endeavor to reduce the number of false positive recommendations by using area specific calibration to known wells and the integration of available geological, geophysical, and geochemical constraints.
Introduction
Since the early 1990’s, research and the use of Controlled Source
ElectroMagnetic (CSEM) exploration for deep water oil and gas has added significant
credibility to the use of electromagnetics in exploration (Smit and Wood, 2006).
Controlled Source ElectroMagnetics involves inducing an electromagnetic signal into the
subsurface and recording the returning signal.
In the Exxon Mobil news release ears to the ground, Exxon Mobil’s chief
research geoscientist, Dr. Len Srnka asks: “How can you “hear” oil and gas hidden miles
beneath the ocean floor?” and states: “the R3M technology we developed allows us to
listen to the Earth’s response to electromagnetic fields” (Srnka, 2008). Dr. Mark
Rosenquist, senior staff geophysicist, Shell E&P research says of CSEM: “If you have
high saturation hydrocarbons it gives a really strong response, and with low saturations
you get nothing back. ….it’s almost like an on/off switch” (Durham, 2006). These
observations are also applicable to DMT’s high resolution magnetotelluric system.

3
Further, new industry research uses a combination of Controlled Source
ElectroMagnetic Surveys and Magnetotelluric Surveys to provide different insights into
the subsurface (Brady, et al., 2009). This is an attempt to reduce false positives generated
by CSEM (Brady, et al., 2009, p. 19). In other words, there are responses in the
subsurface that appear to be hydrocarbons that are not hydrocarbons.
This new CSEM research has renewed interest in passive EM exploration
techniques which use natural electromagnetic energy as the signal source. Of principle
interest are telluric and magnetotelluric passive source EM systems. Telluric current
methods and results were discussed in papers from 1948 through 1963 (Boissonnas and
Leonardon, 1948; Mainguy and Grepin, 1953; Vozoff and Burke, 1964). Additional
insight into the use of a different telluric instrument (electrotelluric) and method is
discussed by Elam (1986). A more detailed discussion of this telluric method of
investigating the earth’s subsurface is given in the passive geophysical prospecting patent
by Kober and Procter-Gregg (1987) and then followed by an article discussing theory in
more detail by Elam (1990). LeSchack, Wyman and Jackson (2004) discuss the
integration of two types of passive telluric systems into an exploration program and the
positive results.
In 1953, the advantages gained by looking at both the electric field component
and the magnetic field component of the natural occurring EM waves were introduced in
the form of the magnetotelluric method (Cagniard, 1953). The High Resolution
Magnetotellurics systems we call Z-SCAN and DIGILOG, and Cagniard’s classical
Magnetotellurics system are both passive source EM systems. These utilize natural
electromagnetic energy generated in part from the complex interaction between the

4
earth’s permanent geomagnetic field, the solar wind, the magnetosphere and the
ionosphere (Orange, 1989; Berdichevsky and Dmitriev, 2002; Brady, et al., 2009, p. 5).
Sunlight influences the degree of polarization in the ionosphere (Brady, et al., 2009, p. 6).
The signal utilized by Z-SCAN and DIGILOG becomes operational approximately one
hour after sunrise and wanes approximately one hour before sunset. The natural
electromagnetic field contains large quantities of energy over a wide spectrum of
frequencies. Kauffman and Keller (1981) state:
“The strengths of such electromagnetic fields are many orders ofmagnitude greater than the strengths of fields that can be generated with man-made sources on the surface of the earth”.
The quality of the input electromagnetic field used for surveying that originates in the
ionosphere can be monitored from the NOAA Geostationary Operational Environmental
Satellites (GOES) data displayed at www.sec.noaa.gov/today.html, with the variability of
the E and H fields evidenced by Electron Flux (electric field) and GOES Hp (Magnetic
field) curves. Another plotted curve, Kp index (www.user.gwdg.de/~rhennin/kp.html) is
graphed. A Kp index of 3 or less indicates ideal conditions, while a Kp index of 4 has
borderline stability and a Kp index greater than 4 indicates too high a signal activity level
for stable Z-SCAN and DIGILOG signal use. Figure 1 displays stable signal conditions
on August 28 and 29, 2009 and becoming unstable in the later hours of August 30 (Kp =
6). Kp index actual and predicted data, updated every fifteen minutes, is also available at
http://www.swpc.noaa.gov/rpc/costello/index.html.
The large amplitude, essentially “white”, electromagnetic signal enters the earth
perpendicular to the air-ground interface and propagates to depth (Brady, et al., 2009, p.
6). The returning signal, re-emanated at changes in electrical impedance boundaries, can

5
be recorded digitally on magnetic tape or other digitally recordable media (Brady, et al.,
2009, p. 6). The data can then be analyzed digitally (DIGILOG) with very little human
intervention or by a combination of a digital computer and analog electronic circuits
interfaced with a highly trained operator to interpret results in the audio domain (Z-
SCAN).
Z-SCAN utilizes electronic circuits for the demodulation of the recorded EM
signal to an audio format for interpreting amplitude information for apparent resistivity
(Z, impedance) and phase variability for rock fluid identification. A trained operator
evaluates and interprets the audio signal characteristics used to generate the apparent
resistivity changes and rock fluid data. These results are presented in an electric-log type
format which can be readily correlated with down-hole electric logs. The analysis is
focused on client-specified depths and normally has a depth accuracy of +/- 25 feet (7.5
m) or better. Hydrocarbon zones 3 feet (1 m) or thicker can be resolved to depths of
7500 feet (2300 m). Thickness resolution diminishes to 7-10 feet (3 m) at depths to
20,000 feet (6100 m). Fluid responses are classified into oil-like, gas-like or water-like
or combinations thereof.
For DIGILOG, recorded time data are processed by means of a proprietary 1-D
inversion algorithm using the principals outlined by Whittall and Oldenburg (1981).
Fourier transforms give the amplitude and phase data available for input into the
algorithm to yield the derived electric (green), magnetic (black), and apparent resistivity
(red) curves, as shown on the figures. Also produced are electric and magnetic curves for
the incremental phase distortion (hydrocarbon activity level) needed for rock fluid
analysis. The DIGILOG algorithm combines multiple recorded time segment solutions to

6
generate a continuous final E-Log- type display from 1,300 feet (400 m) to 16,000 feet
(5000 m). Depth accuracy is +/- 250 feet (80 m). By using porosity and activity level
thresholds determined from calibration to a known well, potential hydrocarbon zones
thicker than approximately 15 feet (5 m) are flagged by the process.
In most areas, a nearby well electric log normally gives a reasonable empirical
local calibration for fine tuning of the Z-SCAN and DIGILOG depth, apparent resistivity,
and reservoir fluid responses. Once these subtle area-dependent changes are noted, they
can be applied to improve the results of the exploration data stations. With our higher
frequency sampling than would be predicted by classical MT formulae ( Cagniard, 1953)
and thus denser depth sampling, the most applicable depth range for the Z-SCAN and
DIGILOG technologies is from 0 feet (0 m) to 20,000 feet (6100 m).
Depth and Porosity-Permeability Response
“The EM waves interact with conductive formations and induce a response wave
that propagates back to the surface” (Brady et al., 2009, p. 6). The air-ground interface
marks a large impedance mismatch to the electromagnetic waves returning to the surface
reflected from electrical interfaces in the subsurface (Brady, et al., 2009, p. 7-8; Torres-
Verdin, 1992). This large impedance mismatch generates a series of higher frequency
electromagnetic waves carrying information about the reflected or subsurface returning
signals. The resultant currents are sometimes called telluric (electric field) and
geomagnetic (magnetic field). “On land, the electric field responds significantly to
changes in resistivity in subsurface layers, but the magnetic field has much less
7
variation.” (Brady et al., 2009, p. 9). By recording the total electric field and the total
magnetic field, the frequency, amplitude and phase responses of these two fields can be
analyzed. The electromagnetic field recorded by the Z-SCAN and DIGILOG antenna
system is in the range of 10 to 22,000 Hertz. These are much higher frequencies than
predicted by classical Magnetotelluric (MT) formulae (Cagniard, 1953) for normal oil
and gas exploration depths.
A good discussion of the basic MT equations is presented by Nabighian (1988),
Kauffman, et al. (1981). The first exponential term of the simplified Maxwell’s
equations, generally referred to as the “Skin Depth”, can be solved for depth by
substituting the higher frequency information to form a new, non classical, frequency
versus depth solution. Changes in the electrical conductivity in the various subsurface
rock formations are calculated from the ratio of the electric to magnetic field components
for each of the new frequencies (depths). These changes are integrated over a specified
depth interval to form a high resolution apparent resistivity log. One example of a low
resolution solution using classical MT data is shown in a paper by Orange (1989) where a
resistivity type log is generated using the Bostick 1-D inversion transform. The depth
scale for this log is from 102 to 106 feet (approximately 10 to 300,000 m) at a very broad
subsurface sampling density. The proprietary DIGILOG algorithm utilizes a similar
concept with higher frequency input to achieve denser subsurface sampling. Electronic
circuits accomplish this denser sampling in the Z-SCAN.
The integrated apparent resistivity curve becomes the basis for interpreting the
relative porosity-permeability of the subsurface formations. Low resistivity indicates

8
probable commercial porosity and permeability in the rock while higher resistivity on
either the electric or magnetic field curves indicates poorer porosity or permeability. Gas
zones tend to indicate overall higher resistivity even in a good porous-permeable zone.
This is a result of less available salt water within the gas reservoir as discussed in the
Fluid Content section below.
Fluid Content
Analysis for fluid content is accomplished by comparing the phase shift and phase
distortions of the electric field and the magnetic fields at each tuned frequency, i.e.
depth. The passive natural EM source signal is relatively steady during the 20 minute
recording time of each data station. This is envisioned as a quasi-steady state input
signal. Analysis of the time-variant phase distortion, at a depth-specific frequency is the
basis for the Z-SCAN interpretation of the reservoir fluid content. The DIGILOG
algorithm utilizes a vertical stack of the 1-D inversion results of several segments of the
recorded field data. This analytical process preserves the sum of the depth-specific, time-
variant phase distortions.
CSEM utilizes a variable frequency source and uses offset gather data processing
for the inversion modeling (Brady, et al., 2009, p. 11-12). This data acquisition and
processing sequence may “stack out” the depth-specific, time-variant signals that carry
reservoir fluid content information.

9
Oil
Oil reservoirs are usually water wet. This means the meniscus connate fluid is
water, commonly salt water. Therefore, the oil is electrically resistive and the connate
water is electrically conductive. Since the electric field component of the
electromagnetic wave will seek the path of least resistance, it will follow the lower-
resistivity connate water, bypassing the higher-resistivity rock matrix and any resistive
contaminate. These paths, however, are tortuous when a highly resistive contaminate
such as hydrocarbon is inserted. Therefore, there will be a travel time differential
between alternate paths, thus a phase distortion. An oil reservoir is not the only
phenomena that can cause this distortion. Any highly resistive contaminant to a salt
water saturated reservoir will appear as a phase anomaly. A shaly sand can cause a phase
distortion that can sometimes be mistaken for an oil zone. Highly organic shales such as
the Woodford Shale in Oklahoma, or Bakken Shale in the Rockies, give a phase anomaly
that is very similar to an oil signal. Careful analysis of the prospect geometry and
gathering enough data points to add additional petroleum engineering data such as a gas
cap or a depth consistent hydrocarbon/water contact will reduce the overall prospect risk.
In solid rock there is normally no phase shift, thus no, or a very low strength fluid
signal. Since in an oil reservoir there are multiple interconnected low-resistive connate
water paths, the phase shift can be highly variable and dynamic. This response is usually
crisp and can be recognized by the analog-digital system (Z-SCAN) and/or the pure
digital system (DIGILOG).
10
Gas
Gas reservoirs are usually oil wet. Much of the normal connate water has
evaporated over geologic time, leaving an oil film. So, the pore fluid (gas) is resistive,
the meniscus fluid (oil film) is resistive, and the matrix (sand or limestone) is normally
resistive. There also may be micro-thin clay lining of the pore space that may contain
bound water which is conductive. The alternate conductive paths in this case are less
variable than in an oil reservoir. This significantly changes the relative phase velocities
for the electromagnetic wave propagation and gives a phase character with less intense
distortion and amplitude throughout the reservoir; yielding another unique phase-shift
signature.
Water
Water in the reservoir pore space provides high conductivity with only the matrix
being resistive. Since the water in the pore space is interconnected in a permeable
reservoir, the high-resistive rock matrix is bypassed by the electromagnetic waves and the
phase differentials are very small. Thus the phase shift or distortion for water alone is
almost nonexistent when compared to oil or gas. The relatively smooth phase signal for
water is also distinctive.
Equipment
One of the distinct advantages of the High Resolution Magnetotelluic field
recording system is its small surface footprint. All the equipment is easily carried in a
small suitcase-sized case. The field system is comprised of an antenna box containing

11
antenna arrays and dual channel amplifiers, an external power supply for the antenna
system and a digital recording device. The antenna enclosure houses six orthogonal
antenna elements, three electric and three magnetic. Due to our higher operating
frequencies, these antennas are constructed with small wound coils for the magnetic
elements and capacitive plates for the electric elements. Also, unlike classical MT, the
recording periods to gain information at all needed frequencies are shortened from
several hours to 20 minutes per station. Since the recording time is so short, there is no
need to have data from a magnetic base station to remove the earth’s diurnal magnetic
field changes from the recorded magnetic field component of our instrumentation.
Processing of the recorded signal is normally accomplished back at the home base, but
processing can be accomplished at field accommodations if it is necessary to meet
deadlines.
Results and Examples:
The Z-SCAN and DIGILOG systems in various forms have been in operation for
clients since 1994. As a result of evaluating hundreds of prospects and leads for clients,
our records indicate through 2008, over 250 wells have been recommended by us and
drilled on positive indications from the technology, with a success rate approaching 50%.
Nearly as important, our success in predicting the absence of hydrocarbons is over 99%.
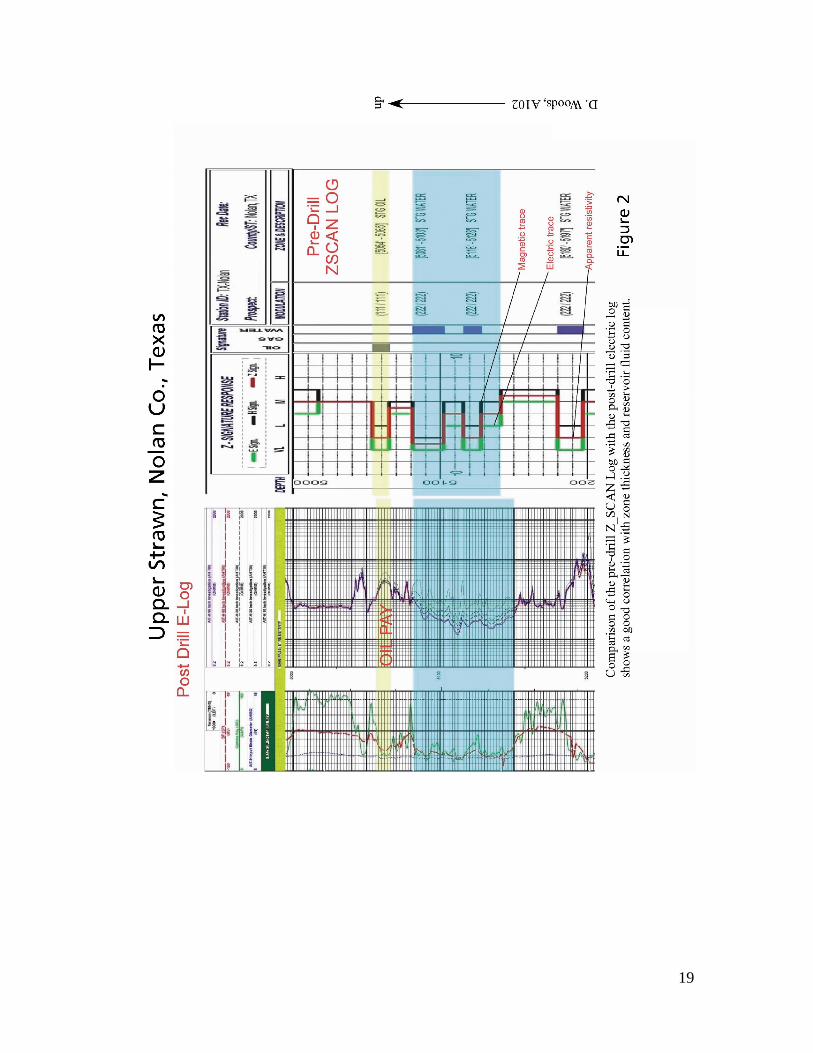
Even though many clients are guarded with our results, a few recent examples of
pre-drill Z-SCAN logs versus post drill successful Electric Log results are shown in
Figures 2, 3 and 4. In each case, the green curve under Z-Signature Response column is
the processed electric-field relative resistivity curve, the black curve is the processed

12
magnetic-field relative resistivity curve and the red curve is the combination of the curves
or the Apparent Relative Resistivity curve. The resistivity scale goes from VL (very low)
to H for high. The best porosity and permeability is suggested by a close grouping of the
3 curves with maximum displacement to the left (lowest relative resistivity). The fluid
signature column has the result of the phase distortion analysis for oil, gas and water
using the summed results of the phase modulation indicators. The solid shading
represents the strongest result, while the dashed shading indicates a weak result. The
modulation column exhibits two sets of numbers ranging from 1 to 3 to indicate the
character of the phase-signature fluid identification. These are analyzed separately for the
electric and magnetic components of the EM signal for a given constant frequency
(depth) over time. From left to right, the first three numbers that pertain to the electric
field evaluation are, (1) modulation intensity, varying from 1 for high to 3 for low; (2) the
distribution of the distortion in the phase pattern varies from 1 for low to 3 for high; and
(3) the variability of the wave pattern is from 1 for highly chaotic to 3 for orderly. The
second three numbers repeat the analysis for the magnetic field. Interestingly, our best
gas response is a combination of strong gas signature coupled with a weak or strong oil
signature. We have had successful results with only strong gas indicated, especially in
the Black Warrior Basin, but much of the time a gas only response suggests a tighter,
lower porosity or lower permeability reservoir. Strong oil response and a strong water
response are indicative of porous permeable reservoirs with the respective fluid result.
For an example of the DIGILOG compared to an electric log in a productive zone,
see Figure 5. Figure 6 compares Z-SCAN and DIGILOG results to an electric log in a
gas pay zone.

13
A Few Notes on Using the Technology
The electromagnetic wave propagates in the subsurface normal incident to the
bedding planes, so “migration” is necessary in steeper dips. A simple program is
available for predicting the true subsurface image point. Also, the antenna setup does not
record a point source under the antenna but instead looks at a cone of an ever expanding-
with-depth area under and around the antenna. Formulae exist for calculating the
diameter of the imaged area. This becomes important in mapping voids in our application
to solution mining cavern storage and in the mapping of subsurface channels. The
integrated area imaged by the antenna preferentially responds to fluid attributes over non-
fluid attributes. Thus we see a brine-filled cavern void as extending further than it
actually does as well as seeing channels wider than they actually are. This exaggerated
area can be mathematically corrected to true size.
Conditions which preclude the utilization of the technology are high levels of
solar activity, Kp higher than 4, and high levels of moisture in the atmosphere or in the
ground at the air-ground interface. No useable signal is present during moisture-laden
cloud cover, rain or when the surface soil is damper than “moist”.
Conclusion
The High Resolution Magnetotelluric technology, though not perfect in
subsurface predictions (as with all remote sensing tools), is an excellent addition to the
exploration tool chest. It easily blends with standard electric log data as well as 2-D and

14
3-D seismic. The cost of a reasonably dense Z-SCAN survey is approximately 25% of the
cost of a 3-D seismic survey. Since both Z-SCAN and DIGILOG have a narrow depth
focus in the subsurface, they can evaluate specific reservoirs which potentially contain
hydrocarbon and verify the depth they occur. This verification attribute also allows the
technology to be an excellent follow-up and confirmation tool for surface based direct
hydrocarbon indicators such as iodine concentration, radiometric ratios, geomicrobial,
micromagnetics, as well as soil hydrocarbon sampling, to name a few. Further, the ability
to determine potential hydrocarbon presence, thickness and areal extent using the
DIGILOG and Z-SCAN systems can give the explorationist a valuable economic
measure of reservoir potential early in the prospect confirmation and assembly process.
15
References
1. Berdichevsky, M.N. and V.I. Dmitriev, 2002, Magnetotellurics in the context of
the theory of ill posed problems: Society of Exploration Geophysicists, p. 20
2. Boissonnas, E. and Leonardon, E. G. , 1948. Geophysical exploration by telluric
currents with special reference to a survey of the Haynesville Salt Dome, Wood
County, Texas, Geophysics 13, 387-403.
3. Brady, J., T. Campbell, A. Fenwick, M. Ganz, S.K. Sandberg, M.P.P. Buonora,
L.F. Rodrigues, C. Campbell, L. Combea, A. Ferstar, K.E. Umbach, T.
Lambruzzo, A. Zerilli, E.A. Nichols, S. Patmore, J. Stilling, Oilfield Review
Spring 2009: 21, No. 1, Copyright: 2009, Schlumberger (a)
4. Cagniard, L., 1953. Basic theory of the magnetotelluric method of geophysical
prospecting. Geophysics, 18: 605-635
5. Durham, L.S., Correspondent, “Separating the Oil from the Water, EM Detecting
Fluids on the Rocks”, AAPG Explorer, December, 2006.
http://www.aapg.org/explorer/2006/12dec/em_technology.cfm
6. Elam, J.G., 1986, New method helps to refine subsurface interpretations, World
Oil, October, 1986, p. 55-58
7. Elam, J.G., 1990, Part 2 – Theory, New method helps to refine subsurface
interpretations, World Oil, June, 1990, p. 45-55.
8. Kauffman, A. A. and G. V. Keller, 1981, The Magnetotelluric Sounding Method:
Elsevier Scientific Publishing Company

16
9. Kober, C.L., D. Procter-Gregg (1987), U.S. Patent #4,686,475, Passive
Geophysical Prospection System Based Upon the Detection of the Vertical
Electric Field Component of Telluric Currents and Method Therefore.
10. LeSchack, L., R. Wyman, J. Jackson, 2004, Surface exploration successful in
finding Alberta Leduc Pinnacle reefs, AAPG Annual meeting, April 18-21, 2004;
Dallas, Texas
11. Mainguy, M. and A. Grepin (1953), Some Practical Examples of Interpretation of
Telluric Methods in Languedoc, S. E. France, Geophysical Prospecting, VI,
pp 233-240
12. Nabighian, M. N., 1988, Electromagnetic Methods in Applied Geophysics, Vol.
1, Theory: Society of Exploration Geophysicists
13. Orange, A. S., 1989, Magnetotelluric Exploration for Hydrocarbons: Proceedings
of the IEEE, v. 77, no. 2, 287-317
14. Smit, D. and P. R. Wood, 2006, Experience is crucial to expanding CSEM use:
World Oil (September 2006), pgs 37-43
15. Srnka, L., Exxon Mobil news release, June 12, 2008
http:/www.exxonmobil.com/corporate/news_opeds_20080612_earsground.aspx
16. Torres-Verdin, C., F.X. Bostick, Jr., Implications of the Born approximation for
the magnetotelluric problem in three-dimensional environments, Geophysics, Vol.
57, No. 4 (April 1992), pgs 587-602
17. K. Vozoff, R.M. Ellis, and M.D. Burke, 1964, Telluric currents and their use in
petroleum exploration, AAPG Bulletin; December 1964; v. 48; no. 12; p. 1890-
1901

17
18. Whittall, K.P., D.W. Oldenburg, 1992, Geophysical Monograph Series, Number
5, Inversion of Magnetotelluric Data for a one-dimensional conductivity, Society
of Exploration Geophysicists.

18
19

20

21

22

23