exploratory interactive tools for spatial data analysis interactive tools for spatial data analysis...
TRANSCRIPT
Exploratory interactive tools for spatial data analysis
Exploratory interactive tools for spatial dataanalysis
Thibault LAURENT, Anne RUIZ-GAZEN and ChristineTHOMAS-AGNAN
GREMAQ, Toulouse School of Economics
8 juillet 2009
T. Laurent, A. Ruiz-Gazen and C. Thomas-Agnan Exploratory interactive tools for spatial data analysis
Exploratory interactive tools for spatial data analysis
Introduction
Plan
1 Introduction
2 GeoXp : Interactivity between statistic plots with maps
3 Innovations of GeoXp
4 Perspectives
T. Laurent, A. Ruiz-Gazen and C. Thomas-Agnan Exploratory interactive tools for spatial data analysis
Exploratory interactive tools for spatial data analysis
Introduction
Data Set
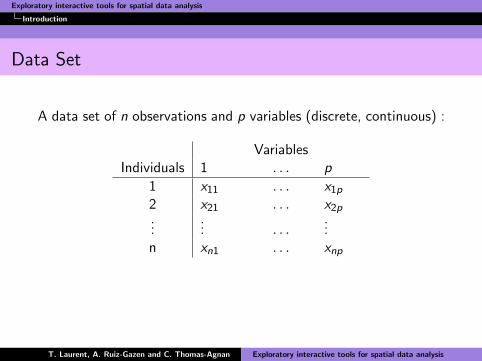
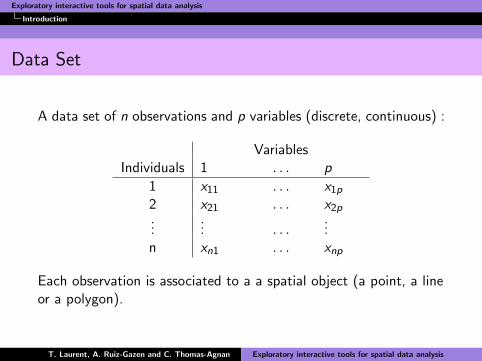
A data set of n observations and p variables (discrete, continuous) :
VariablesIndividuals 1 . . . p
1 x11 . . . x1p
2 x21 . . . x2p...
... . . ....
n xn1 . . . xnp
Each observation is associated to a a spatial object (a point, a lineor a polygon).
T. Laurent, A. Ruiz-Gazen and C. Thomas-Agnan Exploratory interactive tools for spatial data analysis
Exploratory interactive tools for spatial data analysis
Introduction
Data Set
A data set of n observations and p variables (discrete, continuous) :
VariablesIndividuals 1 . . . p
1 x11 . . . x1p
2 x21 . . . x2p...
... . . ....
n xn1 . . . xnp
Each observation is associated to a a spatial object (a point, a lineor a polygon).
T. Laurent, A. Ruiz-Gazen and C. Thomas-Agnan Exploratory interactive tools for spatial data analysis
Exploratory interactive tools for spatial data analysis
Introduction
Definition and objectives of Spatial Exploratory DataAnalysis (SEDA)
Definition : combine information given by techniques of EDAwith spatial information using mapping, interactivity betweenstatistical plots with maps or by creating new methods usingfor example neighborhood matrices.
Objectives : give qualitative response to the usual problems ofspatial analysis like detection of spatial autocorrelation,detection of local or global extreme values, detection ofspatial heterogeneity...
T. Laurent, A. Ruiz-Gazen and C. Thomas-Agnan Exploratory interactive tools for spatial data analysis
Exploratory interactive tools for spatial data analysis
Introduction
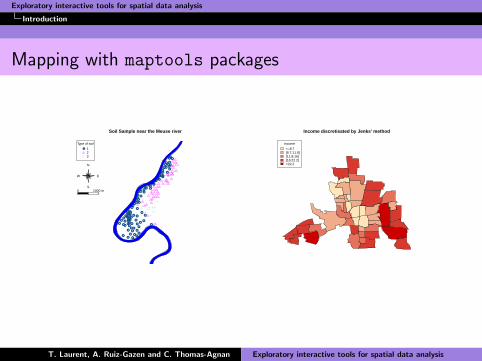
Mapping with maptools packages
Soil Sample near the Meuse river
●● ●
●●
●
●●●
●●
●●
●●●●●●
●●●●●●
●●
●
●●
●●
●●
●●
●●
●●●
●●●●●
●●
●●
●
●
●
●●
●
● ●●
●
●●
●
●●●
●●
●
●●
●
●●
●
●
●
●
● ●
●●●
● ●●
●●
●●●
●
●●
●●●
●
Type of soil
123
0 1000 m
E
N
W
S
Income
<=8.7]8.7;11.8]]11.8;16]]16;22.2]>22.2
Income discretisated by Jenks' method
T. Laurent, A. Ruiz-Gazen and C. Thomas-Agnan Exploratory interactive tools for spatial data analysis
Exploratory interactive tools for spatial data analysis
Introduction
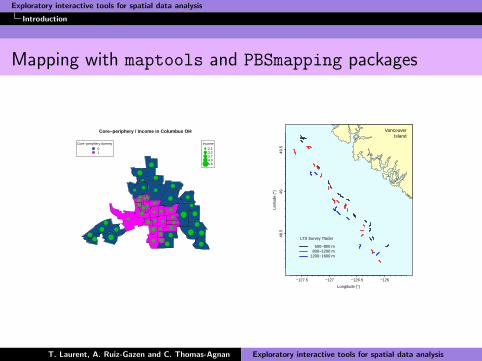
Mapping with maptools and PBSmapping packages
Core−periphery dummy
01
Core−periphery / Income in Columbus OH
●
●●
●
●●
●●
● ●●●●●
●● ●
●●
●●
●●● ● ●
●●●●● ●●
● ●● ● ●
● ● ●●
● ●●●
●●
●
●
●●●●
Income
2.13.23.74.35.6
−127.5 −127 −126.5 −12648
.549
49.5
Longitude (°)
Latit
ude
(°)
500−800 m800−1200 m
1200−1600 m
LTS Survey Tracks
VancouverIsland
T. Laurent, A. Ruiz-Gazen and C. Thomas-Agnan Exploratory interactive tools for spatial data analysis
Exploratory interactive tools for spatial data analysis
Introduction
Some advices
Which projection system ? Which reference system (veryimportant to give units to the distances) ?
Choice of palettes is important (see RColorBrewer package).
How find class intervals for continuous numerical variables :classInt package (“equal interval”, “quantile”, “K-means”,etc).
Interpolation can be useful to have a global view of spatialdistribution of : variables, residuals, coefficients of GWRmodel, etc (see package akima).
T. Laurent, A. Ruiz-Gazen and C. Thomas-Agnan Exploratory interactive tools for spatial data analysis
Exploratory interactive tools for spatial data analysis
Interactivity
Interactivity between statistic plots with maps
1 Introduction
2 GeoXp : Interactivity between statistic plots with maps
3 Innovations of GeoXp
4 Perspectives
T. Laurent, A. Ruiz-Gazen and C. Thomas-Agnan Exploratory interactive tools for spatial data analysis
Exploratory interactive tools for spatial data analysis
Interactivity
Package GeoXp
GeoXp (C. Thomas-Agnan et al.), an R package for interactiveexploratory spatial data analysis : it links dynamicallystatistical plots like boxplot, histogram, scatterplot, etc. witha map.
Selection of a zone on the map results in the automatichighlighting of the corresponding points on the statisticalgraph.
Selection of a portion of the graph results in the automatichighlighting of the corresponding sites on the map.
T. Laurent, A. Ruiz-Gazen and C. Thomas-Agnan Exploratory interactive tools for spatial data analysis
Exploratory interactive tools for spatial data analysis
Interactivity
EDA functions
The main statistical plots of EDA have been included in GeoXp :
Descriptive functions : univariate or bivariate graphs such ashistogram, barplot, scatterplot, etc.
Multivariate functions : principal component analysis, clusteranalysis.
T. Laurent, A. Ruiz-Gazen and C. Thomas-Agnan Exploratory interactive tools for spatial data analysis
Exploratory interactive tools for spatial data analysis
Interactivity
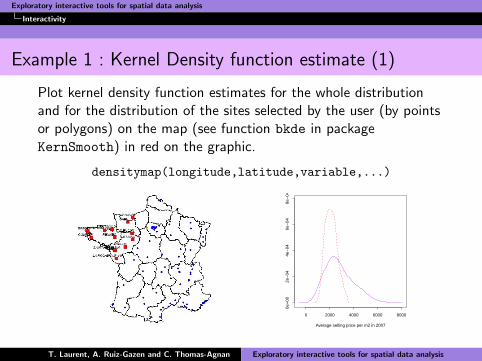
Example 1 : Kernel Density function estimate (1)
Plot kernel density function estimates for the whole distributionand for the distribution of the sites selected by the user (by pointsor polygons) on the map (see function bkde in packageKernSmooth) in red on the graphic.
densitymap(longitude,latitude,variable,...)
0 2000 4000 6000 8000
0e+
002e
−04
4e−
046e
−04
8e−
04
Average selling price per m2 in 2007
T. Laurent, A. Ruiz-Gazen and C. Thomas-Agnan Exploratory interactive tools for spatial data analysis
Exploratory interactive tools for spatial data analysis
Interactivity
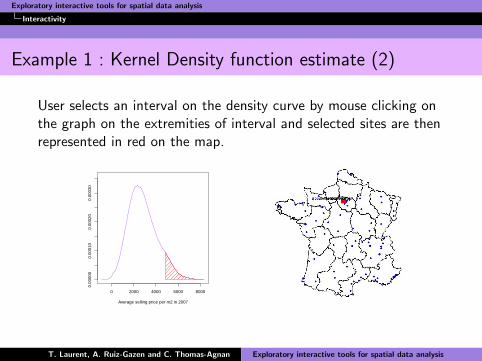
Example 1 : Kernel Density function estimate (2)
User selects an interval on the density curve by mouse clicking onthe graph on the extremities of interval and selected sites are thenrepresented in red on the map.
0 2000 4000 6000 8000
0.00
000
0.00
010
0.00
020
0.00
030
Average selling price per m2 in 2007
T. Laurent, A. Ruiz-Gazen and C. Thomas-Agnan Exploratory interactive tools for spatial data analysis
Exploratory interactive tools for spatial data analysis
Interactivity
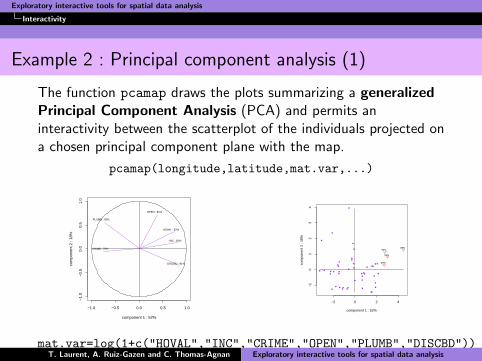
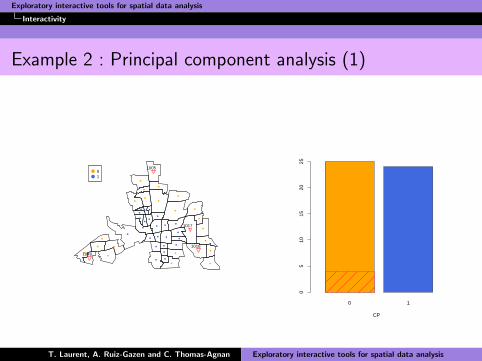
Example 2 : Principal component analysis (1)
The function pcamap draws the plots summarizing a generalizedPrincipal Component Analysis (PCA) and permits aninteractivity between the scatterplot of the individuals projected ona chosen principal component plane with the map.
pcamap(longitude,latitude,mat.var,...)
−1.0 −0.5 0.0 0.5 1.0
−1.
0−
0.5
0.0
0.5
1.0
component 1 : 52%
com
pone
nt 2
: 18
%
HOVAL : 82%
INC : 81%
CRIME : 75%
OPEN : 81%
PLUMB : 92%
DISCBD : 91%
−2 0 2 4
−1
01
23
4component 1 : 52%
com
pone
nt 2
: 18
%
●
●
●● ●
●
●
●
●
●
●●
●
●
●
●
●
●●
●
●
●
● ●
●
●
●
●
●
●
●
●
●
●
●
●
●
●
●
●
●
●
●
●
●
95%
88%
96%
94%
mat.var=log(1+c("HOVAL","INC","CRIME","OPEN","PLUMB","DISCBD"))T. Laurent, A. Ruiz-Gazen and C. Thomas-Agnan Exploratory interactive tools for spatial data analysis
Exploratory interactive tools for spatial data analysis
Interactivity
Example 2 : Principal component analysis (1)
●
●
●
●
●
●
●
●●●●
●
●
●
● ●
●
●
●
●
●●● ●
●
●●●●
●●
●●
● ● ●
●●
●
●●
●
●
●
●
●●
01
1005
1017
1016
1048
0 1
CP
05
1015
2025
T. Laurent, A. Ruiz-Gazen and C. Thomas-Agnan Exploratory interactive tools for spatial data analysis
Exploratory interactive tools for spatial data analysis
Interactivity
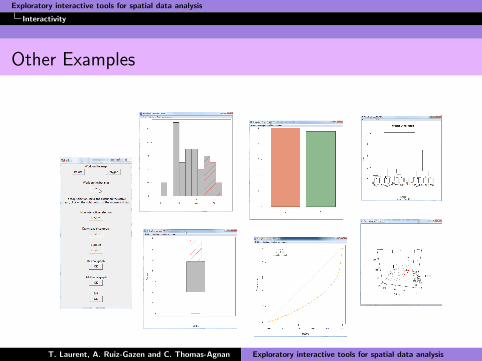
Other Examples
T. Laurent, A. Ruiz-Gazen and C. Thomas-Agnan Exploratory interactive tools for spatial data analysis
Exploratory interactive tools for spatial data analysis
Interactivity
Specific statistical plots
Statistical plots specific to spatial analysis :
Geostatistic functions : angle plot, drift plot.
Spatial Econometric functions : Moran plot, neighbour plot
T. Laurent, A. Ruiz-Gazen and C. Thomas-Agnan Exploratory interactive tools for spatial data analysis
Exploratory interactive tools for spatial data analysis
Interactivity
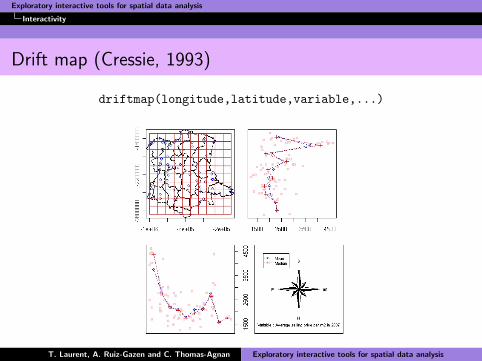
Drift map (Cressie, 1993)
driftmap(longitude,latitude,variable,...)
T. Laurent, A. Ruiz-Gazen and C. Thomas-Agnan Exploratory interactive tools for spatial data analysis

Exploratory interactive tools for spatial data analysis
Interactivity
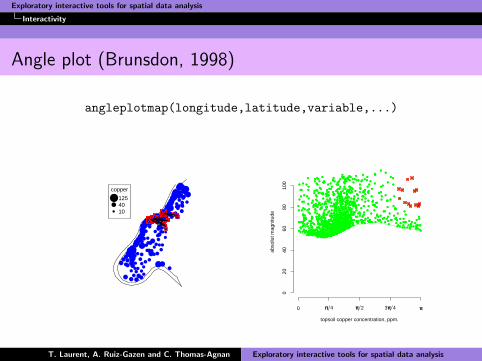
Angle plot (Brunsdon, 1998)
represents the absolute difference between the values of avariable at two sites si and sj as a function of the anglebetween vector ~si sj and the x-axis,
possibility to draw only couples of sites whose absolutedifference is larger than some α regression quantile smoothingsplines.
T. Laurent, A. Ruiz-Gazen and C. Thomas-Agnan Exploratory interactive tools for spatial data analysis
Exploratory interactive tools for spatial data analysis
Interactivity
Angle plot (Brunsdon, 1998)
angleplotmap(longitude,latitude,variable,...)
●●●●●●●●●●●●
●●●●●●●●●●●●●●●●●
●
●●●●●●●●●●●●●
●
●●●●●
●●
●●●●●●●●●●●●●●●●
●●
●●●●●●●●
●●●●
●
●
●
●●
●●
●● ●●
●
●●
●●●●
● ●●
●
●●
●
●●
●●●
●●●●
●●
●
●●
●●●
●●
●●
●
●
●
●
●
●
●
●●●
●●●
● ●●
●●●●● ●
●●
●● ●●
●●●
copper
1254010
topsoil copper concentration, ppm.
abso
lut m
agni
tude
0 ππ 4 ππ 2 3ππ 4 ππ
020
4060
8010
0
●●●●●
●●●
●
●●●
●
●
●●
●●
●
●●●●●
●●●
●●●
●
●
●● ●●
●
●
●
●●
●
●
●
●
●
●
●●
●●●
●
●●●
●●●●
●
●
●●●
●
●●
●●
●●
●
●
●● ●●
●
●
●●●
●
●
●
●●●
●
●●●●
●●
● ●●●●
●●●
●●●
●
●
●
●●
●
●●●●●
●●●●●
●
●
●● ●●
●
●
●●
●
●
●
●
●
●
●
●●●
●
●●●●
●
●
●
●
●
●
●
●
●
●
●
●
●●
●
●
●
●
●
●
●
●
●●
●●
●
●
●
●
●
●
●
●
●
●
●
●
●
●
●
●●●
●
●
●
●
●
●
●
●
●
●
●
●●●
●
●
●
●●
●
●
●
●
●
●
●●●
●
●●
●
●●●●
●●
●
●
●● ●●
● ●●
●
●●●
●●
●
●
●●
●
●●
●
●●
●
●
●
●
●
●
●
●●
●●
●
●●●●●
●●●
●●
●
●●
●
●
●●
●
●●●
● ●
●
●●
●
●
●
●
●
●
●
●
●●
●●●
●
●
●
●●
●
●
●●
●
●
●
●
●●
●●
●●
●
●
●
●
●
●
●
●
●●
●●
●●●●●
●●●
●
●●●
●
●
●●
●●
●
●●●●●
●●●
●●●
●
●
●● ●●
●
●
●
●●●
●
●
●
●
●●
●●●
●
●●
●
●
●
●●
●●
●
●●●
●
●
● ●
●●
●
●
●● ●
●
●
● ●●
●
●●●
●●
●
●
●●
●
●
●●
●
●●
●
●
●
●
●●
●
●
●
●●
●●
●
●●●●●
●●●
●●
●
●●
●
●
●●
●
●●●
● ●
●
●●
●
●
●
●
●
●
●
●
●
●●
●●●
●
●
●
●●
●
●
●
●
●
●
●
●
●
●
●
●
●●
●
●
●
●
●
●●
●●
●
●
●
●
●
●
●● ●
●
●
●●
●
●
●
●
●
●●
●
●
●●
●
●
●
●
●
●
●
●● ●
● ●
●
●
●●
●
●
●
●
●
●
●
●
●●
●
●
●
●
●
●● ●
●
●●
●
●●
●
●
●
●
●
●
●
●● ●
● ●
●
●
●
●
●
●
●
●
●
●
●
●
●●●
● ●
●
●●
●
●
●
●
●●
●
●
●
●
●
●
●
●
●
●
●
●
●● ●
● ●
●
●●
●
●
●
●
●
●●
●
●●
●
●
●
●
●
●
●
●
●●
●
●
●
●
●●
●
●
●
●
●
●●
●
●
●
●
●
●●●●● ●● ●
●
●
●
●●●
●
● ●●
●
●●
●
●●●
●
●
●
●●
●●
●
●
●●●
●
●
●●●
●●
●●●
●
●●
●
●
●
●●
●
●●
●
●
●
●
●●
●
●●
●
●
●
●
●●
●
●
●
●●
●●
●
● ● ●●●
●●
●
●●
●
●●
●
●
●●
●
●●●
●
●
●
●
●●
●
●
●
●
●
●
●
●
●
●
●●
●●●
●
●●
●
●
●
●●
●
●
●
●
●●
●
●
●
●
●●
●
●
●●
●
●
●
●
●
●
●
●
●● ●
● ●
●
● ●
●●
●
●
●
●
●
●
●
●
●● ●
● ●
●
● ●
●●
●
●
●
●
●
●
●
●
●● ●
● ●
●
●
●
●
●
●
●
●
●
●
●
●
●
●
●
●
●
●
●
●●
●
●
●
●
●
●
●
●
●●
● ●●
●
●
●
●
●
●
●
●
●
●
●
●
●
●
●
●●
● ●
●
●
●
●
●
●
●●
●
●●●
●
●
●
●●
●
●●
●●
●
●
●●●
●
●
●●●
●
●
●
●
●●●
● ●
●
●●
●
●
●
●●
●●
●
●
●
●●
●
●
●
●
●
●●
●
●
●
●●
●
●
●
●
●●
●
●
●
●●
●●
●
● ● ●● ●
●●
●
●●
●
●●
●
●
●●
●
●
●●●
●
●
●
●
●●
●
●
●
●
●
●
●
●
●
●
●●
●●●
●
●●
●
●
●
●●
●
●
●
●
●
●
●●
●
●●●
●
●
●
●●
●●
●
●
●●●
●
●
●●●
●
●
●
●●●
● ●
●
●●
●
●
●
●●
●
●●
●
●
●
●
●
●●
●
●●
●
●
●
●
●●
●
●
●
●●
●●
●
● ● ● ● ●
●●
●
●●
●
●●
●
●
●●
●
●●●
●
●
●
●
●●
●
●
●
●
●
●
●
●
●
●
●●
●●●
●
●●
●
●
●
●●
●
●
●
●
●
●●
●
●●●
●
●
●●
●●
●
●
●●●
●
●
●●●
●
●
●
●●●
●
●●
●
●
●
●●
●
●●
●
●
●●
●
●●
●
●
●
●
●●
●
●
●
●●
●●
●
● ● ● ● ●
●●
●
●●
●
●●
●
●
●●
●
●●●
●
●
●
●
●●
●
●
●
●
●
●
●
●
●
●●
●●●
●
●●
●
●
●
●●
●
●
●
●
●●●●● ●
●
●●
●
●
●
●
●
●●
●
●
●
●
●●
●●
●
●●●
●
●
●●
●●
●
●
●●●
●
●
●●●
● ●
●●●
●●
●●
●
●
●
●●
●
●
●
●
●
●
●●
●●
●
● ● ●● ●
●●
●
●●●
●
●
●● ●●
●
●
●
●●
●
●
●
●
●
●
●
●
●
●●
●●●
●
●
●●
●
●
●●●●
●●
●
●
●●●●
●
●● ●
● ●●
●●
●
●
●
●●●●●
●●
●●●●●●●
●●
●
●
●
●●●●●●
●●●●●●●
●
● ●
●
●
●●●
●●●
●
● ●●●●●●
●
● ●●●
●●
●
●
●
● ●●●●●●
●
●●●
●●●●
●●
●●
●
●
●
●
●
●
●
●●
●
●
●
●
●
●
●
●
●
●
●
●
●
●
●
●
●
●
●
●●
●
●
●●
●
●
●●
●
●
●
●
●●
●
●
●
●
●
●
●●
●●
●●●
●
●
●●
●●
●
●
●●●
●
●
●●●
● ●
●●●
●●
●
●
●
●
●
●● ●
●
●
●
●
●●
●
● ● ●● ●
●●
●
●●
●
● ●
●
●
●●
●
● ●●
●●
●
●●
●
●
●
●
●
●
●
●
●●●● ● ●
●
●●
●●●
●
●
●●
●
●
●●●
●
●
●●●
● ●
●●●
●●
●
●●
●
●●
●●
● ●● ●
●●
●
●● ●
●
●
●●
●
● ●●
●●
●
●●
●
●
●
●
●
●
● ● ●
●
●
●● ●●●
●
●●
●
●
●
●
●●
●
●
●●
●
●
●
●
●
●
●
●●
●●
●
●
●
●
●
●
●
●
●●
● ●●
●
●
●
●
●●
●
●
●
●
●●
●
●
●
●
●●
●
●
●
●
●
●
●
●
●●
●
●
●
●
●
●●
●
●
●
●
●●
●
●
●
●
●●
●
●●
●
●
●
●
●
●
●
●●
●
●
●
●●
●
●
●
●
●
●
●
●●
●
●
●
●
●
●
●
●
●
●
●
●
●
●
●
●
●
●
●●●
●●
●
●
●
●
●
●
●
●
●●
●
●●
●
●
●
●
●
●
●
●●
●
●●
●
●
●
●
●
●
●
●
●
●
●
●
●
●●
●
●
●
●
●
●
●
●●
●
●●
●
●
●
●
●
●
●
●●
●●
●
●
●
●
●
●
●
●
●●
●●
●
●
●
●
●
●
●
●
●●
● ●
●
●
●
●
●
●
●
●
●●
●
●
●●
●
●
●
●
●
●
●
●
●
● ●
●
●●
●●
●
●
●
●
●
●
●
●●
●●
●
●
●
●
●
●
●
●
●●
●
●●
●
●
●
●
●●
●
●
●
●
●
●
●
●●
●
●●
●
●
●
●
●
●
●●
●
●
●
●
●
●
●
●●
● ●
●●
●
●
●
●
●
●
●
●●
●
●
●●
●
●
●
●
●
●
●
●
●
● ●
●
●
●
●●
●
●
●
●
●
●
●
●
●●
●
●
●●
●
●
●
●
●
●
●
●
●
●
●
●●
●●
●
●
●
●
●
●
●
●
●●
●
●
●●
●
●
●
●
●
●
●
●●
●
●
●
●
●
●
●
●
● ●
●
● ●
●●
●
●
●
●
●
●
●
●
●
●
●
●●
●●
●
●
●
●
●
●
●
●
●●
●
●
●
●
●
●
●
●
●
●●
●
●
●
●
●
●●
●
●
●
●
●
●
●
●●
●
●
●
●
●
●
●
●
●● ●
● ●
●
●
●
●●
●
●
●
●
●
●
●
●
●●●
●
● ●
●
●
● ●
●●
●
●
●
●
●
●
●
●
●● ●
●
● ●
●
●
●
●
●●
●
●
●
●
●
●●
●
●●
●
●
●
●
●●
●
●●
●
●
●
●
●
●
●
●
●
●
●
●
●●
●
●
●
●
●
●
●
●
●●
●
●
●
●
●
●
●
●
●
●
●
●
●
●
●● ●
● ●
●
●
●
●●
●
●
●
●
●
●
●
●
●
●● ●
●
● ●
●
●
●
●●
●
●
●●
●
●
●
●
●●
●
●
●●
●
●
●
●
●
●
●
●●
●
●●
●
●
●
●
●●
●
●
●
●
●
●
●
●
●
●
●
●
●
●
●
●
●
●●
●●
●
●
●
●
●
●
●
●●
●
●
●●
●
●
●
●
●
●
●
●●
●
●
●●
●
●
●
●
●
●
●
●●
●
●●
●
●
●
●
●
●
●
●
●
●
●
●
●
●●
●
●
●
●
●
●
●
●●
●●
●
●
●
●
●
●
●
●●
●●
●
●
●
●
●
●
●
●
●●
●
●
●
●●
●
●
●
●
●
●
●
●
●●
●
● ●
●
●
●
●
●
●
●
●
●
●
●
●
●
●●
●
●
●
●
●
●
●
●●●
●
●
●
●
●
●
T. Laurent, A. Ruiz-Gazen and C. Thomas-Agnan Exploratory interactive tools for spatial data analysis
Exploratory interactive tools for spatial data analysis
Innovations
Innovations of GeoXp
1 Introduction
2 GeoXp : Interactivity between statistic plots with maps
3 Innovations of GeoXp
4 Perspectives
T. Laurent, A. Ruiz-Gazen and C. Thomas-Agnan Exploratory interactive tools for spatial data analysis
Exploratory interactive tools for spatial data analysis
Innovations
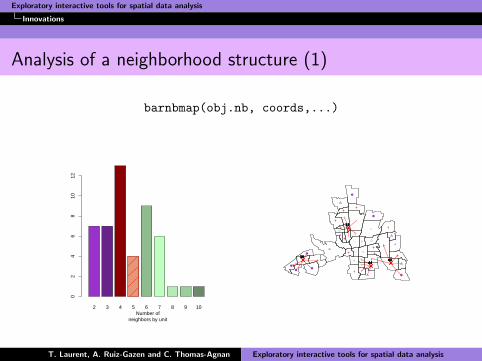
Analysis of a neighborhood structure (1)
barnbmap(obj.nb, coords,...)
2 3 4 5 6 7 8 9 10Number of
neighbors by unit
02
46
810
12
●
●
●
●
●●
●
1111111111
36363636364040404040
4444444444
T. Laurent, A. Ruiz-Gazen and C. Thomas-Agnan Exploratory interactive tools for spatial data analysis
Exploratory interactive tools for spatial data analysis
Innovations
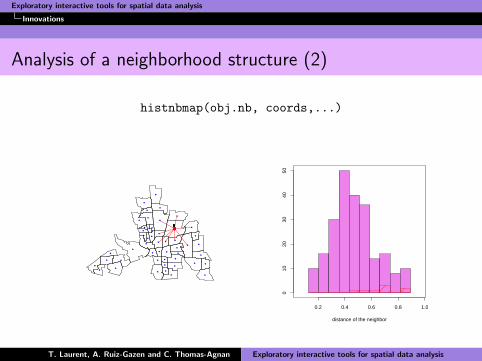
Analysis of a neighborhood structure (2)
histnbmap(obj.nb, coords,...)
●
●
●
●
●
●
●
●
●●●●
●
●
● ●
●
●
●
●
●
●●● ●
●
●●●●
●●
●●
● ● ●
●
● ●
●
●●
●●
●
●
●
●9●9●9●9●9●9●9●9
0.2 0.4 0.6 0.8 1.0
010
2030
4050
distance of the neighbor
T. Laurent, A. Ruiz-Gazen and C. Thomas-Agnan Exploratory interactive tools for spatial data analysis
Exploratory interactive tools for spatial data analysis
Innovations
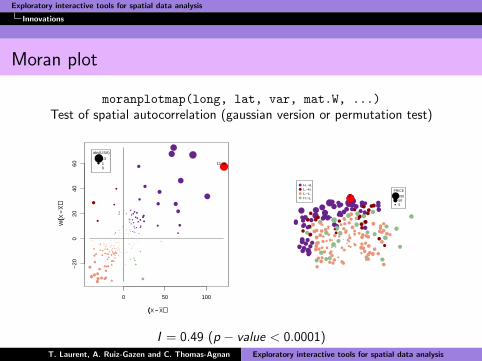
Moran plot
moranplotmap(long, lat, var, mat.W, ...)Test of spatial autocorrelation (gaussian version or permutation test)
0 50 100
−20
020
4060
((X −− X))
W((X
−−X
))
●
●
●
●
●
●
●
●
●●
●
●
●
●
●
●●
●
●
●
●
●
●
●
●
●
●●
●
●
●
●
●
●
●
●
●
●
●
●
●
●
●
●
●
●
●
●
●
●
●
●
●
●
●
●
●●
●
●
●
●
●
●
●
●
●
●
●
●
●
●
●
●
●
●
● ●
●
●
●
● ●
●
●
●
●
●
●
●●
●
●●
●
●
●
● ●
●
●
●
●
●
●
●
●
●
●
●
●
●
●
●
●
●
●
●● ●●
●
●
●
●
●
●
●●
●
●
●●●
●
●
●
●
●
●●
●
●
●
●
●
●
●
●
●
●
●●
●
●
●
●
●
●
●
●
●
●
●
●
●
●
●
●
●
●
●
●
●
●
●
●
●
●
●
●
●
●
●
●
●
●
●
●
●
●
●
●
●
●
●
●
●
●
●
●
●
●
●
●●
●
●
●
●
●12.46
●●
●
abs(LISA)
1310
●
●●●●● ●●
●
●●
●●
●●
●
●●
●●
●●
●
● ●●●
● ●
●
●●
●●●
●● ●
●●
●
●
●
●●●
●
●●
● ●
●●● ●●●
●
●●●●●
●
●
●
●●
●
●
●
●●
●
●
●●●
●●
●
●●
●
●
● ●●
●●
●
●
●●●
●
●●
● ● ●
●
●
●●
●●
●
●●
●
●
●
●
●
●
●● ●●
●●
●
●
●
●
●●
●
●● ●● ●●
●● ●●
●
●●●
●
●● ●●●
●●●
●●
●●●
●
●
●●●
●
●●
●
●●
●●
●● ●
●●●
●
●
●
●●●
●
●
● ●
●
●●
●●●
●●
● ●
●●
●
●
●●
●●● ●●
●● ●●
●●
●
PRICE
150505
●●●●
H.−H.L.−H.L.−L.H.−L. ●
3
●3
●3
●3
I = 0.49 (p − value < 0.0001)T. Laurent, A. Ruiz-Gazen and C. Thomas-Agnan Exploratory interactive tools for spatial data analysis

Exploratory interactive tools for spatial data analysis
Innovations
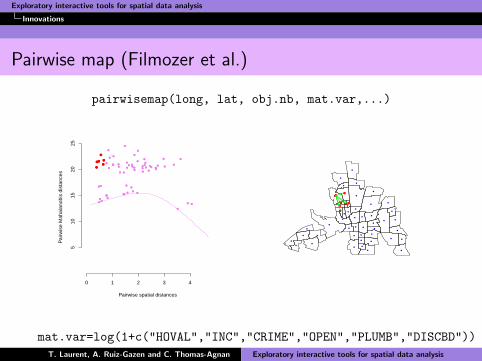
Pairwise map (Filmozer et al.)
“Local outliers” : observations which differ from their neighbours.We propose to use pairwise robust Mahalanobis distances :
MD(xi ; xj ; C ) = {(xi − xj)′C−1(xi − xj)}1/2
R-packages : mvoutliers and rrcov.
T. Laurent, A. Ruiz-Gazen and C. Thomas-Agnan Exploratory interactive tools for spatial data analysis
Exploratory interactive tools for spatial data analysis
Innovations
Pairwise map (Filmozer et al.)
pairwisemap(long, lat, obj.nb, mat.var,...)
Pairwise spatial distances
Pai
rwis
e M
ahal
anob
is d
ista
nces
0 1 2 3 4
510
1520
25
●
●
●
●
●
●
●
●
●
●
●
●
●
●
● ● ●●
●
●
●
●
● ●
●
●
●● ●● ●
●
●
●●
●
●
●●●
●
●
●
●
●
●
●●● ●
● ●
●
●●
● ● ●
●
●
●
●
●
●
●
● ●
●
●
●
●
●●●
●
●
●
●●
● ●
●
●
●
●
●
●
●
●●
●
●
●
● ●
●
●
●
●●
●
●
●
●●●
●
●
●
●
●
●
●
●
●
●
●
●●● ●
● ●
●
●
●
●●
●●
●
●
● ●●
●
●
●
● ●
●
●
●
●
●
●
●
●
●●●●
●
●
●
● ●
●
●
●
●
●
●●● ●
●
●●●●
●●
●●
● ● ●
●
● ●
●
●●
●●
●
●
●
●●
●
●
●
●
●
●
●
●
●
●
●●
●
●
●
●
●
●
●
●
●
●
mat.var=log(1+c("HOVAL","INC","CRIME","OPEN","PLUMB","DISCBD"))T. Laurent, A. Ruiz-Gazen and C. Thomas-Agnan Exploratory interactive tools for spatial data analysis

Exploratory interactive tools for spatial data analysis
Perspectives
Perspectives
1 Introduction
2 GeoXp : Interactivity between statistic plots with maps
3 Innovations of GeoXp
4 Perspectives
T. Laurent, A. Ruiz-Gazen and C. Thomas-Agnan Exploratory interactive tools for spatial data analysis
Exploratory interactive tools for spatial data analysis
Perspectives
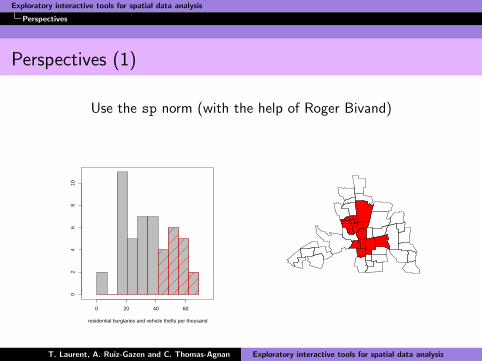
Perspectives (1)
Use the sp norm (with the help of Roger Bivand)
0 20 40 60
02
46
810
residential burglaries and vehicle thefts per thousand
T. Laurent, A. Ruiz-Gazen and C. Thomas-Agnan Exploratory interactive tools for spatial data analysis
Exploratory interactive tools for spatial data analysis
Perspectives
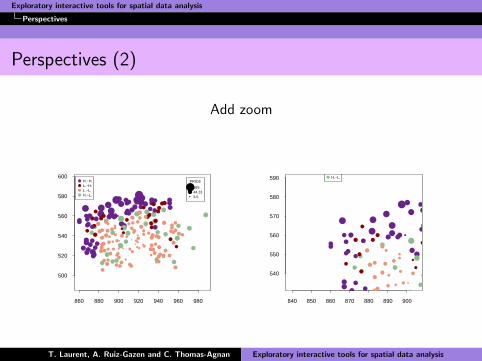
Perspectives (2)
Add zoom
860 880 900 920 940 960 980
500
520
540
560
580
600
●
●●●●● ●●
●
●●
●●
●●
●
●●
●●
●●
●
● ●●●
● ●
●
●●
●●●
●● ●
●●
●
●
●
●●●
●
●●
● ●
●●● ●●●
●
●●●●●
●
●
●
●●
●
●
●
●●
●
●
●●●
●●
●
●●
●
●
● ●●
●●
●
●
●●●
●
●●
● ● ●
●
●
●●
●●
●
●●
●
●
●
●
●
●
●● ●●
●●
●
●
●
●
●●
●
●● ●● ●●
●● ●●
●
●●●
●
●● ●●●
●●●
●●
●●●
●
●
●●●
●
●●
●
●●
●●
●● ●
●●●
●
●
●
●●●
●
●
● ●
●
●●
●●●
●●
● ●
●●
●
●
●●
●●● ●●
●● ●●
●●
●
PRICE
16544.313.5
●●●●
H.−H.L.−H.L.−L.H.−L.
840 850 860 870 880 890 900
540
550
560
570
580
590
●
● ●●
●●
●
●
●
●●
●●
●
●●
●●
●
●
● ●
●
●
●
●
●
●
●●
●
●
●
● ●
●
●
● ●●●
●
●
●
●●
●
●
●
●
●
●
●
●
●●
●
●
●
●
●
●
●
●
●●
●
● ●
●
●
●●●
●
● ●
●
●●
●● ●
●
●
●●
●●
●●
●
●
●
●
●
●●
●
●
●
●●
●
●●
●●
●
●
●
●
●
●●●●
H.−H.L.−H.L.−L.H.−L.
T. Laurent, A. Ruiz-Gazen and C. Thomas-Agnan Exploratory interactive tools for spatial data analysis
Exploratory interactive tools for spatial data analysis
Perspectives
Perspectives (3)
A new interface (close to Rcmdr window)
Add a number “unlimited” of interactive graphic window as inGeoDa
Add origin-destination flow graphics
A R vignette should appear on CRAN soon
Thanks for attention ! (my e-mail :[email protected])
T. Laurent, A. Ruiz-Gazen and C. Thomas-Agnan Exploratory interactive tools for spatial data analysis