extended abstract final
TRANSCRIPT

1
Anaerobic digestion monitoring under high ammonia concentrations – A
Case Study
Isabel de Sousa Baeta Paixão
Master Degree in Biological Engineering, Instituto Superior Técnico, Lisbon, Portugal Tratolixo E.I.M., Anaerobic Digestion Plant, Mafra, Portugal
June 2016 Abstract
Anaerobic Digestion (AD) is a microbiological process that provides an answer to two of the most important problems of the XXI century: clean energy production and sustainable waste management. The AD process at Tratolixo plant, in Mafra, transforms the biodegradable organic matter present in the pre-sorted municipal solid waste plus source collected biodegradable waste into biogas, under mesophilic regime, in three parallel digesters with a working volume of 3150m3/each. The objective of this work was to monitor and analyse of the most important operational parameters and waste degradation inhibitors at the AD Plant process, in an effort to understand their influence in biogas production and quality, especially regarding ammonia concentrations. This parameter was measured by direct Kjeldahl distillation method, in order to assess also the reliability of the methods used in the plant. Main results highlight that an average biogas productivity of 600 Nm3/ t VS is being achieved at a feeding loading rate of 7.2 t VS/m3.d. Waste feeding TS content average is 50% of which 35% are VS. The process depends mostly on waste load and composition, available alkalinity and pH as well as feeding and temperature selected regimes. Ammonia nitrogen even at 4±1g/L was not inhibiting methanogens mainly due to operating temperature and pH. AD plant has been successful in obtaining a good biogas yield and quality (57% CH4). Liquid effluent is sent to an in house WWTP with a soluble COD content of 25g/L, which includes VFA ranging from 2-4g/L, and ammonia nitrogen content within 2-4g/L.
Keywords: Anaerobic Digestion, Ammonia Inhibition, Ammonia Quantification, COD, AD Monitoring
1. Introduction
Fossil fuels have been powering the world’s economy since the Industrial Revolution. However, being a finite resource, prices have been suffering severe increases, following the tendency of demand. The burning of fossil fuels have been accounted as the main cause for Greenhouse Gas Emissions (GHG), leading to global warming and climate change, which have been in the spotlight recently due to increased public and political awareness regarding environmental issues. As population increases and searches for a higher standard of living, the tendency is to consume more goods (Tchobanoglous G. K., 2002). Consequently, Municipal Solid Waste (MSW) production has been growing severely. Until recently, the most widely spread method of MSW disposal was landfilling, but despite being the easiest and least expensive way for disposal, many environmental risks and constraints are associated with it, such as soil pollution and GHG emissions. In addition, as a significant portion of waste can be reused and recycled, by promoting these practices we are contributing to minimize the amount of waste accumulated, and in need of disposal, while simultaneously turning waste materials into resources, lowering environmental impacts and reducing the amount of energy consumed in making new goods. This is the basis for the Circular Economy Strategy. Anaerobic Digestion (AD) is a process by which the Organic Fraction of Municipal Solid Waste (OFMSW) is decomposed by microorganisms, resulting in biogas with high energy potential, and a nutrient rich digestate that can
be used as a soil conditioner. OFMSW is the largest fraction of MSW (accounting from 35% to 50% (Castro, 2015)), and has been recognized for several decades as a valuable resource due to its potential of conversion into useful sub-products. While producing added-value products, such as biogas which can be used to generate clean energy, from materials that would be otherwise be thrown away, the process allows for a carbon neutral cycle (Vögeli, 2014), also reducing the amount of waste sent to landfill and its subsequent GHG emissions, complying with European goals and legislation. Biogas is generally composed of 48-65% of Methane (CH4), 36-41% of Carbon Dioxide (CO2), about 17% of Nitrogen, and traces of O2, H2S and other gases (Khalid, 2011). Biogas can be produced from energy crops, such as maize, or biodegradable wastes, including sewage and food waste. Different sources lead to different specific compositions. Its yield is affected by several factors. Europe had almost 8 million tons of organic treatment capacity in 244 plants, accounting for 25% of Europe’s biological treatment (Adekunle, 2015).
1.1. The AD Process
1.1.1. Hydrolysis
In this step, organic polymers and other insoluble organic molecules are broken down into smaller soluble compounds by strict anaerobes and facultative bacteria. Nitrogen plays an important role in AD, being necessary for the formation of new biomass and ammonia, which is released in this step and is a major contributor to pH

2
stabilization in the reactor, despite its inhibitory potential which occur at high concentrations (Fricke, 2007). 1.1.2. Acidogenesis
In this step, the components previously formed suffer further degradation by facultative and obligatory anaerobic bacteria (Adekunle, 2015), being converted into short-chain volatile fatty acids (VFA), from C1 to C5, which highly inhibit the AD process beyond a certain concentration. 1.1.3. Acetogenesis
In this step, products previously produced that cannot be directly converted into CH4, such as VFA, are converted by homoacetogenic bacteria into hydrogen and CO2, to be further used as substrates by the methanogenetic bacteria. This conversion of VFA is of great importance, given that when accumulation occurs the process suffers severe inhibitory effects. From a thermodynamics point of view, these acetogenic reactions are endergonic. However, acetogenic bacteria are obligatory H2 producers, and constantly reduce exergonic Hydrogen (H2) to CO2 and acetic acid. Therefore, the acetate formation from VFA is thermodynamically viable solely under a very low H2 partial pressure (Deublein, 2008). The acetogens therefore rely on a symbiosis with methanogens, which can only survive under high H2 partial pressure. They remove the products formed by acetogens from the medium, keeping the pressure low enough to suit acetogens (Adekunle, 2015), (Deublein, 2008). 1.1.4. Methanogenesis
In this step, CH4 and CO2, which are the primary components of biogas, are produced by methanogens under strict anaerobic conditions. H2 is removed from the substrate and its partial pressure in the medium is kept low, which allows the conversion reactions of VFA in the previous step, minimizing its accumulation and its related inhibitory effects.
1.2. Operational and Control Parameters
Several parameters influence the AD process. The most important are VFA concentration, pH, alkalinity, temperature, ammonia concentrations, organic load and biogas quality and production.
1.2.1. Volatile Fatty Acids (VFA)
VFA act as a substrate for methanogenic bacteria and are essential to the process. VFA concentration in digesters depend on the digester feed, and generally range between 200-2000 mg/L acetate equivalent (Mata-Alvarez, 2003). However, more important than the real VFA value is a sudden and steady increase in the digester’s effluent. Accumulation causes microbial stress at increased concentrations, especially in their dissociated form, penetrating inside the cellular membrane as lipophilics, denaturating cell proteins and causing severe problems (Deublein, 2008), (Di Berardino, 2006). Labatut and Gooch stated that for concentrations between 1500 and 2000 mg/L acetate equivalent, biogas production suffers inhibitory effects. (Labatut, 2012). McCarty and McKinney proposed a VFA concentration under 2000 mg/L acetate equivalent and a pH of about 7.5 as optimal process conditions (McCarty, 1964). The inhibitory effect is intensified by pH decreases.
Higher concentrations are also related to peaks in loading. If too much VFA is fed to the digester within a short period of time, inhibitory acidification takes place. Therefore, increases in load should be preferably performed in small increments rather than suddenly, providing enough time to the microorganisms to acclimate themselves. 1.2.2. Alkalinity and pH
Methanogens are extremely sensitive to acid accumulation and consequently to pH variations. Some studies state that the optimal pH value for anaerobic digestion is between 5.5 and 8.5 (RISE-AT, 1998). Lay et al
stated that methanogenesis only occurs at high-rate when pH is neutral, demonstrating that CH4 rate production in high moisture feeds (90-96%) is optimal at pH 6.8, functional at pH between 6.6 and 7.8 and failure occurs for pH values lower than 6.1 or higher than 8.3 (Lay, 1997). Its growth rate decreases severely for pH levels below 6.6. Regarding acetogens, the optimal pH level is 7, while for acidogens is about 6 (Schön, 2009). pH is also related to NH3. An increase in pH results in increased NH3 toxicity, due to a shift in the NH3/NH4
+ equilibrium, favoring NH3 which is more toxic (Chen, 2008). In addition, a decrease in pH leads to an increase in VFA accumulation, leading again to a decrease in NH3. Alkalinity is the medium’s capacity to resist changes in pH, caused by increases in VFA, and is usually expressed in terms of CaCO3. Typical values in digesters range between 2000-4000 mg/L CaCO3. An unbalanced system with fast acidification and slow methanogenesis may result in a substantial accumulation of VFA and a severe decrease in pH, therefore needing a greater amount of buffer. Alkalinity variations occurs faster compared to pH, meaning that when a variation in pH is detected, the buffering capacity (alkalinity) of the system is already lost (Mata-Alvarez, 2003) VFA and alkalinity concentrations show fast variations when the system is upset, VFA tending to increase while alkalinity decreases. Therefore, the ratio between these two parameters is a valuable tool for stability assessment. Appels et al stated that a molar ratio of at least 1.1:1 of alkalinity/VFA should be maintained for stable and well-buffered digestion (Appels, 2008), while Mata-Alvarez et al suggest a ratio of 0.3 (Mata-Alvarez, 2003). 1.2.3. Ammonia (NH3)
NH3 results from the anaerobic degradation of nitrogen compounds. In general, concentrations below 200mg/L are beneficial to the process, since nitrogen is an essential nutrient. In addition, it ensures sufficient buffer capacity, increasing process stability (Rajagopal, 2013). Several mechanisms regarding NH3 have been proposed, such as changes in intracellular pH, increase of maintenance energy requirements and inhibition of enzymes (Chen, 2008). NH3 in high concentrations has a powerful inhibitory effect. It exists in the form of Free Ammonia (FA) and (Ammonium) NH4
+, and together they are the main forms of inorganic ammonia in solution, in a pH dependent equilibrium. High pH and temperature values shift the equilibrium between NH3/NH4
+ towards the formation of FA (Deublein, 2008). Membrane-permeable FA has been identified as the main inhibition cause (De Baere L. D., 1984). Associated with NH3 instability is VFA accumulation, which, in turn, leads to a decrease in pH, and thereby a decrease in FA (Chen, 2008). This relationship between VFA, pH and ammonia lead
3
to an “inhibited steady state”, a condition where the process is stable but with low CH4 yields (Chen, 2008). Studies show that methanogenic bacteria are the most sensitive to high values of FA (Deublein, 2008). Loster and Lettinga showed that as NH3 concentrations increased, methanogenic bacteria lost about half of its activity, while acidogenic population were hardly affected (Koster, 1988), (Chen, 2008). Some stains showed severe inhibition in concentrations in the order of 4 g/L, while others showed resistance up to 10g/L (Chen, 2008). Some studies relate ammonia inhibition to Total Ammonia Nitrogen (TAN), which is a combination of FA and NH4
+. McCarty stated that when TAN concentration exceeds 3000mg/L the process is inhibited at any pH (McCarty, 1964). Calli et al and Labatut reported inhibitory effects above 1500 mg/L for pH values higher than 7.4 (Calli, 2005), while Kroeker et al reported 50% CH4 production for TAN ranging 1.7-14g/L (Kroeker, 1979), (Koster, 1988). Methanogenic organisms can adapt themselves to various environmental conditions, if given enough time to adjust (Chen, 2008). Once adapted, they retain viability at concentrations far beyond the initial inhibitory concentrations (Kroeker, 1979). Koster and Lettinga reported that while unacclimated methanogens failed to produce methane for NH3 concentrations ranging 1.9-2g/L, after adaptation they tolerated up to 11g/L (Koster, 1988). Adaptation to ammonia concentrations above 5g/L have been reported in manure-feeding systems (Labatut, 2012), (Calli, 2005). Other studies state levels as high as 8-9g/L of TAN with no significant decrease in CH4 production after acclimation. 1.2.4. Temperature
There are 3 ranges of temperature considered optimal for digestion, and microbial populations can be separated into categories: psychrophiles (<20ºC), mesophiles (20-45ºC) and thermophiles (>45ºC) (Alves, 2007). Methanogenic bacteria present optimal grow in the mesophilic range between 30-38ºC and in the thermophilic range between 49-47 (Alves, 2007). An increase in temperature usually has a positive effect on the metabolic rate, however it results in higher FA. Studies show that high concentrations of FA inhibit thermophilic digestions more severely that mesophilic digestions (Wang, 2014), while others state that thermophilic flora tolerates FA twice as much when compared to mesophilic flora (Chen, 2008). Gallert et al stated that under mesophilic conditions, FA becomes inhibitory in concentrations ranging 80-150 mg/L, at a pH of 7.5. However, for thermophilic conditions and FA concentration of 620 mg/L, biogas yield showed a decrease in 21% (Gallert, 2014). Wang et al noticed that increased temperature resulted in increased pH and CH4 potential (Wang, 2014). 1.2.5. Feed Characteristics
1.2.5.1. Total Solids (TS)
TS highly influences biogas production efficiency. Wet AD (10-15% solids) leads to higher costs and reactor volumes compared to dry AD (22-40% solids). Duan et al stated that high-solids systems could reach higher CH4 production rates compared with low-solids systems, at the same retention time (Duan, 2012). Abbassi-Guendouz et al showed that CH4 production decreased with TS increasing from 10 to 25% (Abbassi-Guendouz, 2012), while Yi et al obtained an increase in production for higher TS, in food
waste (Yi, 2014), which points to the importance of substrate type and its biodegradability. 1.2.5.2. Volatile Solids
Kayhaninan stated that VS matter provides a good estimation on the biodegradability of the waste (Kayhanian, 1995). The extent of stabilization depends on the system and the substrate’s physicochemical characteristics, ranging from 30-42% for manure-only digesters (Labatut, 2012). Residues with high VS contents and low non-biodegradable matter (such as lignin) are best suited for AD (Verma, 2002). 1.2.6. Organic Loading Rate (OLR)
ORL measures the biological conversion of the system, and is expressed as the ratio between feed and reactor volume, in kg VS/m3.day or COD/m3.day (Verma, 2002), (TRATOLIXO E.I.M., 2008). Usually, as OLR increases so does bacterial activity and biogas production, as long as the increase is performed sufficiently low in order to allow adaptation of microorganisms (TRATOLIXO E.I.M., 2008). Higher than a certain level, which is the maximum OLR the system can receive, VFA accumulation occurs due to acidification, accompanied by a decrease in pH and biogas yield.
1.2.7. Biogas content, Production Rate and Productivity
CH4 content is a good process indicator, affected by all other parameters and inhibitors. In a well-operated digester treating manure, CH4 content ranges between 58-65%. Production is the most important parameter in monitorization. Higher productions lead to higher energy generation. Productivity is expressed in Nm3/t, and is usually considered an average. Usually, CH4 content, production and productivity are fairly stable over time and, therefore, are an important indicators of process disturbance. However, neither production nor content alone can give the necessary information to perform corrections to the process in time, in case of failure. 1.3. The Anaerobic Digestion Plant (ADP) of TRATOLIXO
TRATOLIXO is an inter-municipal company, responsible for the treatment, final deposition, re-use and recycling, trading of transformed materials and other services regarding waste, operating according to sustainable principles and national and international legislation. The ADP of Abrunheira, Mafra, with a biological treatment capacity of 75.000 tons of organic waste per year, allows the production of 20.000 tons of compost, as well as biogas, resulting in 22.8 GWh of electrical energy injected in the national electrical grid in 2015. TRATOLIXO’s ADP has been successful in obtaining a good yield in biogas, despite its amount of ammonia in the digesters, whose inhibitory effect does not appear to have much influence in the process. The operating parameters selected to provide information about the biological processes stability are biogas quality (% CH4), pH, VFA and VFA/Alkalinity. Hence, set-points for each parameter were established, accordingly to process optimal, alarm and critical states (green, yellow and red), as described in table 1 (TRATOLIXO E.I.M., 2008). Ammonia concentrations are also included, given the insight valuable insight it provides, regarding inhibition.

4
Table 1 - Operating parameters and set-points according to
process optimal, alarm and critical states.
PARAMETER OPTIMAL ALARM CRITICAL
Quality (% CH4) >49 45-49 <45 VFA/Alkalinity (acetate/CaCO3)
<0.6 0.6-1 >1
VFA (g/L acetate) <8 8-12 >12 pH >7.5 7-7.5 <7 NH3 (g/L) <5 5-6 >6
1.4. Aim of Study
This study had three objectives. The first was a real experience in an ADP. To better understand how the process runs, the AD process was followed during 15 weeks, which involved all process indicators, from sample collection to feeding substrate and digestate characterization. While at the ADP, a fully laboratory work was undertaken, including content quantification of the main potential inhibitors, e.g. VFA and ammonia. The obtained results, complemented with other data gently supplied by Tratolixo, were interpreted, as well as their impact on the process performance regarding biogas production rate and quality (% CH4). The second objective relates to NH3 content, especially in terms of operating test reliability. NH3 measurement analytical techniques used at the ADP were compared to digestate analysis of Kjeldahl nitrogen, or total organic nitrogen, assessing the biodegradability extent of nitrogenous compounds and NH3 content by alkaline steam distillation, followed by titration. Also, given that a quarterly analysis performed by an external laboratory usually measures NH3 in the press liquid fraction instead of directly in the digestate, a comparison between substrates was performed regarding NH3 measurements, in an effort to identify any differences. The third objective was to determine total and soluble COD for the digestate and tank samples, in order to characterize their variability, given that COD is only determined once every quarter, and only for digestate samples. 2. Materials and Methods
MSW, digestate, liquid effluents, organic load and biogas production and quality were closely monitored during a period of 15 weeks at the ADP. MSW, digestate and effluent samples were collected every day, and measurements of solid content were performed in all. Digestate sample was collected after 20 minutes of recirculation, and the following parameters were measured: VFA, alkalinity, pH, temperature and ammonia. Ammonia was measured at the ADP by the semi-quantitative QUANTOFIX® test once a week. Tank samples were collected in the morning, plus a second sample of tank 5 (which receives the effluent from the centrifuges and sends it to the in-house WWTP) in the afternoon, due to significant differences in TS content. Total Dissolved Solids (TDS), Total Suspended Solids (TSS) and Settleable Solids (S/S) were also measured for tank 5. Biogas production was accounted as the sum of biogas used by the motor-generators and burner, every day, and quality was measured as the percentage of CH4 before filtering and desulphurization, every day. A separate set of digestate and tank samples were recovered once a week, between week 4 and week 9, and taken to the Environmental and Ecoprocess Engineering
Research Group, at Instituto Superior Técnico, in order to determine total and soluble COD, as well as total organic nitrogen by Kjeldahl Digestion and NH3 by alkaline steam distillation. 2.1. Solid Content
All samples were evaporated and dried to constant weight at 105º. VS content was determined by the weight loss after igniting the dry samples at 550ºC. Glass and inert materials under 0.5 mm in the ash residue were also weighted after screening. The grab samples taken from tank 5 were centrifuged at 4200 rpm for 10 minutes. TDS and TSS were measured by weight loss of the pellet and supernatant fractions, respectively. S/S content was determined by measuring the volume of settled solids after 24 hours in an Imhoff cone. These procedures were performed according to the ADP’s biological manual (TRATOLIXO E.I.M., 2008) 2.2. Chemical Oxygen Demand (COD)
The COD test was performed according to the Standard Methods for the Examination of Water and Wastewater (SMEWW), section 5220 B (APHA, 2005). The procedure consisted in using a TR 420 Spectroquant Digester from Merck, adding to each tube 1.5ml of sample, 1ml of potassium dichromate solution and 2ml of sulphuric acid reagent. Each sample was tested in triplicate and left in the digester for 2.5 hours, at 150ºC. The blank assays were prepared similarly, using distilled water instead of sample. The sample’s organic and inorganic matter suffers oxidation by an excess of dichromate, in the presence of a catalyst. A titration was performed in order to determine the excess dichromate using the FAS solution 0.0125M as titrant. The turning point of the titration occurs when the solution turns from light blue to bright orange. 2.3. Ammonia Analysis
NH3 measurements were performed using the Quantofix® kit (from Macherey-Nagel). A sample of the digestate effluent was centrifuged at 4200 rpm for 10 minutes, with 10% (w/w) flocculant. 1 ml of supernatant was collected and diluted 1:100. 5 ml of solution were placed in the measurement vessel and added 10 drops of the ammonia reagent. A test strip was dipped into the solution and its colour compared to the colour scale of the kit (0, 10, 25, 50, 100, 200 and 400 mg NH4
+/L.) The result is calculated by equation 4, where DF stands for the dilution factor used. Also, it is necessary to take into account the percentage of flocculant used in the sample preparation and adjust the result. The measuring range goes from 10-400 mg/L NH4
+ visually, and 10-350 mg/L NH4
+ reflectometrically.
𝑁𝐻4+(𝑚𝑔. 𝐿−1)𝑠𝑎𝑚𝑝𝑙𝑒 = 𝑁𝐻4
+(𝑚𝑔. 𝐿−1)𝑚𝑒𝑎𝑠𝑢𝑟𝑒𝑑 × 𝐷𝐹 Eq. 1
2.3.1. Kjeldahl Digestion
This method is used for the quantitative determination of organic nitrogen. Samples of the digestate were collected in the morning and centrifuged at 4200 rpm for 10 minutes, with 10% (w/w) flocculant. 5 ml of supernatant were collected and diluted 1:20. In the first week, samples were recovered and digested by the Kjeldahl method, according to the SMEWW, section 4500-Norg B (APHA, 2005). The method consists in three steps: digestion, a steam distillation and a titration. Only the distillation and titration steps were performed from

5
week 2 forward (SMEWW, section 4500-NH3 B (APHA, 2005)). The digestion step is performed by adding sulphuric acid (to heat the sample and digest it by oxidation), potassium sulphate (to rise the boiling point) and a catalyst. The heating was performed as described in table 2. Digestion converts the nitrogen present in the sample into NH3 (other than that which is in the form of nitrates or nitrites), and organic matter into CO2 and H2O (McClements, 2016). Ammonia is in the form of ammonium ion (NH4
+), and binds itself with the sulphate ion (SO4
2-) remaining in solution.
Table 2 – Kjeldahl Digestion step heating scheme
Temperature (ºC) Time (min)
110 90 120 30 250 30 385 60
Cooling 60
This step was not performed from week 2 forward. Regarding digestate samples, 6ml were added to 6ml of concentrated sulphuric acid and 150 ml of ultrapure water (milli-Q). The mixtures were made alkaline by addition of sodium hydroxide, which converts the ammonium sulphate into NH3 gas, according to equation 2 (McClements, 2016). (𝑁𝐻4)2𝑆𝑂4 + 2𝑁𝑎𝑂𝐻 → 2𝑁𝐻3 + 2𝐻2𝑂 + 𝑁𝑎2𝑆𝑂4 Eq. 2
NH3 was also quantified in samples collected from tanks by alkaline steam distillation, followed by titration. Flasks containing 1g of sample were placed into a distillation unit (K-355, BUCHI); pH was raised up to 12 by adding NaOH (32% w/v) and steam distilled for 10 minutes. The NH3 gas is released from the solution, moving into a receiving flask containing 50ml of the indicative solution of boric acid (prepared as described in Appendix II), which by lowering pH converts NH3 gas into the ammonium ion and the boric acid into the borate ion, according to equation 3 (McClements, 2016). In the presence of NH3, the boric acid solution turns its colour from pale lavender to green.
𝑁𝐻3 + 𝐻3𝐵𝑂3 → 𝑁𝐻4+ + 𝐻2𝐵𝑂3
− Eq. 3
In the titration step, the ammonium borate is titrated with sulphuric acid 0.025N, until the solution turns lavender again. The concentration of H+ required to reach the end-point is equivalent to the concentration of nitrogen initially present in the sample. The nitrogen concentration can be determined by equation 4, where A is the titrant volume titrated for the sample, B the titrant volume titrated for blank, 0.025 is for the titrant molarity and 14.01 is the nitrogen molecular weight (g/mol).
𝑁𝐻3 − N(𝑚𝑔/𝐿 𝑜𝑟 𝑚𝑔/𝑘𝑔) =(𝐴−𝐵)× 0.025×14.01
𝑚𝑙 𝑜𝑟 𝑤𝑡 𝑖𝑛 𝑠𝑎𝑚𝑝𝑙𝑒 Eq. 4
Despite being the most widely used method due to its universality, high precision and good reproducibility, it does not give an absolute result since some of the nitrogen present in the sample is in the form of proteins and other compounds. Therefore, when using this method, the total Kjeldahl nitrogen (TKN) results need to be considered as the sum of NH3, nitrogen and ammonium. 2.4. Volatile Fatty Acids (VFA)
The digester’s samples were centrifuged at 4200 rpm for 10 minutes, with 10% (w/w) flocculant. 5 ml of
supernatant were collected and diluted 1:20. The solution was then titrated with agitation, with sulphuric acid 0.1N, to pH 5.1 and pH 3.5, and the alkalinity and VFA values were determined by the following equations. These procedures were performed according to the ADP’s biological manual, based on the assumption that acid titration volume correlates with the change in equilibrium of VFA and carbonate alkalinity (Lützhoft, 2014), that both VFA and bicarbonates are water soluble, and no other molecules interfere in the measurements (TRATOLIXO E.I.M., 2008), (Lützhoft, 2014).
[𝐻2𝑆𝑂4]𝑝𝐻=5.1 =𝑉1×𝑁
𝑉𝑆 Eq. 5
[𝐻2𝑆𝑂4]𝑝𝐻=3.5 =𝑉2×𝑁
𝑉𝑆 Eq. 6
𝐴1 =10−5.1−10−𝑝𝐻𝑖
𝐾1+10−5.1 Eq. 7
𝐴2 =10−3.5−10−𝑝𝐻𝑖
𝐾1+10−3.5 Eq. 8
𝐵1 =10−5.1−10−𝑝𝐻𝑖
𝐾2+10−5.1 Eq. 9
𝐵2 =10−3.5−10−𝑝𝐻𝑖
𝐾2+10−3.5 Eq. 10
𝑉𝐹𝐴𝑖𝑜𝑛𝑖𝑧𝑒𝑑 =([𝐻2𝑆𝑂4]𝑝𝐻=3.5 × 𝐵1) − ([𝐻2𝑆𝑂4]𝑝𝐻=5.1 × 𝐵2)
(𝐵1 × 𝐴2) − (𝐵2 × 𝐴1)
× 1000 (𝑚𝑒𝑞
𝐿)
Eq. 11
𝐴𝑙𝑘𝑎𝑙𝑖𝑛𝑖𝑡𝑦 =([𝐻2𝑆𝑂4]𝑝𝐻=5.1 × 𝐴2) − ([𝐻2𝑆𝑂4]𝑝𝐻=3.5 × 𝐴1)
(𝐵1 × 𝐴2) − (𝐵2 × 𝐴1)
× 1000 (𝑚𝑒𝑞
𝐿)
Eq. 12
𝑇𝑜𝑡𝑎𝑙 𝑉𝐹𝐴 (𝑔 𝑎𝑐𝑒𝑡𝑎𝑡𝑒 𝑒𝑞. 𝐿−1) =𝑉𝐹𝐴𝑖𝑜𝑛𝑖𝑧𝑒𝑑 × 60
1000
Eq. 13
𝑇𝑜𝑡𝑎𝑙 𝐴𝑘𝑎𝑙𝑖𝑛𝑖𝑡𝑦 (𝑔 𝐶𝑎𝐶𝑂3 𝑒𝑞. 𝐿−1) =𝑉𝐹𝐴𝑖𝑜𝑛𝑖𝑧𝑒𝑑 × 60
1000
Eq. 14
Where: Vs = sample volume, V1 = titrant volume spent at pH 5.1, V2 = titrant volume spent at pH 3.5 N = Acid normality (0.1) K1 = 1.76x10⁻⁵, the thermodynamic constant of VFA K2 = 4.8x10⁻⁷, the thermodynamic constant of bicarbonates pHi = initial pH value, measured immediately before titration
2.5. Data Analysis
In order to understand performance and behaviour of the process, all parameters were studied in a period of 15 weeks. Tables 3 and 4 present weekly operating conditions regarding constraints. Table 3 - Operating conditions at the ADP in the observed
period (15 weeks).
Week Date
dd/m
Operating conditions
1 03/1 No constraints observed
2 10/1 Equipment repair
3 17/1 No constraints observed
4 24/1 Equipment repair
5 31/1 Equipment repair
6 07/2 Equipment repair
6
Table 4 (continuation) - Operating conditions at the ADP in
the observed period (15 weeks).
Week Date
dd/m
Operating conditions
7 14/2 Equipment repair
8 21/2 No constraints observed
9 28/2 Equipment repair
10 06/3 Equipment repair
11 13/3 Equipment repair
12 20/3 Equipment repair
13 27/3 No constraints observed
14 03/4 Equipment repair
15 10/4 No constraints observed
3. Results and Discussion
3.1. ADP Performance
3.1.1. Waste Feeding Characterization
Two types of waste are being processed at the ADP, MSW and BW, figure A-I 1. On average, 250 tonnes of waste is daily received, of which 30% is BW. Total solids content and moisture of waste was almost constant and ca. 50%, in a weekly basis, figure A-I 2. Anaerobic digesters are being operated with 30% TS and thus moisture is corrected by recirculating liquid effluent from the centrifuges in the dewatering stage. Inert content is quite high, which can influence the HRT within digesters and equipment performance, provoking pumps failure mainly due to clogging. However, inert content is not unusual given the typical quality of MSW. Glass and metal was also quite high, ca. 30% of TS, interfering with digester walls integrity, screen damaging, among other problems, associated with abrasion phenomena. 3.1.2. Operating Parameters
Figure A-I 3 resumes MSW mass loading rate during the observed period of time (15 weeks). Severe variability can be noticed associated with daily operating conditions. Waste (MSW and BW) as received is discharged into a receiving pit, where homogenization is attempted prior to digesters feeding. VS content of waste fed to each reactor vary significantly due to the different amounts of type of waste available, besides source generation rate, collection route and season. In figure A-I 4, it is shown the VS content of the feeding being noticeable the large variation within weekdays. Moreover, it can be observed that two of the reactors received substrate with same quality while a third one was fed with waste with different composition. Thus, it should be related to the digester’s feeding schedule. This variability can lead to VFA accumulation in the system, which will be discussed in more detail in the next sections. The daily volumetric loading rate (VLR), expressed as kg VS/m3.d, figure A-I 5, is just a function of the amount of waste available as digester’s working volumes remain almost constant (estimated as 3150 m3 per digester, within the observed period). Therefore, VLR follows daily and weekly variation patterns according to weekday and season, averaging 7±2 kg VS/m3.day.
3.1.3. Biogas Production and Quality
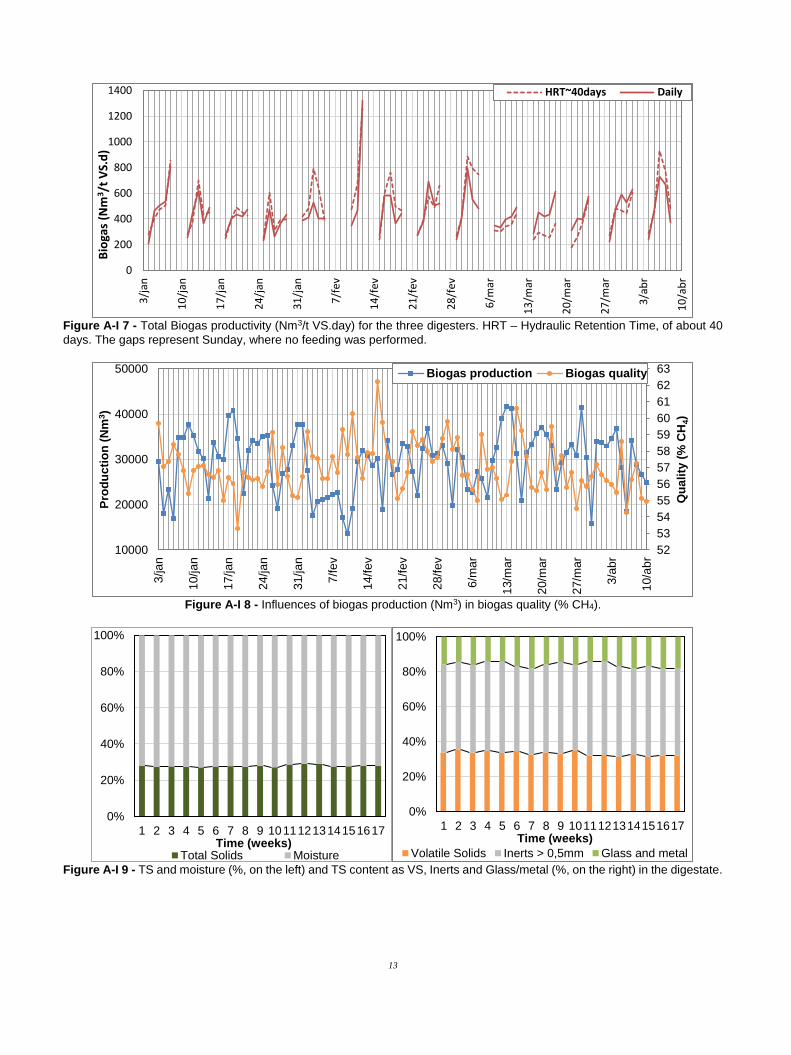
Daily biogas production pattern is similar to VFA accumulation, figure A-I 6. It is noteworthy the minimum values verified every Monday, associated with the lowest values of VFA measured in the digestate. In this figure, VFA accumulation in digester 2 is representative of all digesters. On Saturday VFA are not monitored but it seems that VFA start to diminish after Friday if it follows the same pattern observed within the week. Two phenomena could contribute to this behaviour such as the lack of feeding on Sunday and different characteristics of the waste that is being fed on Saturday. Despite the low weekly production in week 5, that was the week with less production variations. Weeks 4 and 10 showed higher variability. Average minimum weekly production values were between 13.000 Nm3 in week 6 and 26.000 Nm3, while average maximum weekly production ranged between 22.000 Nm3 in week 5 and 41.000 Nm3, in week 10. Analysing biogas productivity, as represented in figure A-I 7, we can that it also presents variation within the observed period. In some of the weeks, we can see minimum values in the beginning of the week, and tendency to increase towards the end of the week. This behaviour is similar to the performance of the organic mass loading rate, which is expected, given that biogas production is highly influenced by load. Unexpected minimum values are also related with periods of malfunctions and repairs in the equipments, as described in table 4. Figure A-I 8 represents biogas quality, quantified by the content in CH4 expressed as percentage, which averaged 57% in the observed period. Quality suffers variations throughout the weeks, with a tendency to decrease toward the end of the week. Increased quality pattern tends to relate with a decrease in production. 3.1.4. Digestate Characterization
3.1.4.1. Solid Content
On average, VS content in the digestate was 35% of TS while on feeding waste was around 50%, providing an idea of the biodegradability of the waste, figure A-I 9. The amount of VS removed was estimated as a weekly average due to the lack of daily measurements of inert content in the feeding and digestate, figure A-I 10. The removal efficiency of VS was on average 50%, if outliers are not taken into account. 3.1.4.2. Volatile Fatty Acids
Figure A-I 11 represent VFA content in the digestate of the three digesters, and figure A-I 12 show digester 2 in detail. Minimum values were observed on the beginning of the week (Monday or Tuesday) with a visible tendency to increase by the end of the week (Thursday and Friday). VFA peaks (accumulation) may be related with the increase in VS of the waste loading, within the observed period. We can also observe that the digestate presented approximately a 50% reduction in VFA concentration over the weekend. A change in feeding schedule (alternate feeding days) or even a decrease in loading could be alternatives, in an effort to make the best use of VFA amount not consumed, or even a new smaller digester, especially to receive digestate before it is send to the dewatering stage.

7
VFA values are a little high when compared to the ones described in the literature review, however they all fall within the ADP’s optimal state (green performance, in table 1). Protein content ability to absorb CO2 present (in biogas) may have created an additional buffer effect which, combined with the amount of alkalinity in the system, was enough to sustain VFA variations. However, TAN is not being quantified, and thus protein content is uncertain. Moreover, since pH values were between 7.6-7.8, VFA inhibition was not foreseen, even with 3.5 g acetate/L. pH influence which will be further discussed in the next section. 3.1.4.3. Alkalinity and pH
Peaks in VFA (figure A-I 12) relate to lower values in Alkalinity, as expected. Figure A-I 13 shows alkalinity variation in the digestate of DG2, which was considered representative of the three digesters. In fact, analysing the daily Alkalinity, we can observe the minimum values occurring on Friday while maximum is verified on Monday. pH values do not present severe variability, ranging between 7.6-7.8, even with severe variations in VFA. This could be explained by the system’s high buffer capacity, provided by the amount of alkalinity, as shown in figure A-I 14. Also, as already discussed, VFA increases do not present an inhibitory risk in these ranges of pH. Average minimum pH values occur by the end of the week (Thursday and Friday), in agreement with average minimum values in Alkalinity, while maximum pH values occur in the beginning of the week (Monday and Tuesday). As described in the literature review, methanogenesis was promoted by high concentrations of bicarbonate alkalinity. Despite severe VFA variations, the weekly biogas quality tended to be stable, following the weekly tendency of alkalinity, figure A-I 15. The different pattern found in the last three weeks can be due to an increase of the OLR, which positively influenced biogas quality, but also VFA concentration, which in turn promoted a drop in alkalinity. 3.1.4.4. VFA/Alkalinity ratio
In the observed period, VFA/Alkalinity ratio has suffered significant variations, figure A-I 16, but without major disturbances in the process. The ratio value was always lower than the ratios described in the literature review. Minimum values tend to occur in the beginning of the week, while maximum values occur in the end. Despite the imbalance in the beginning of the week, the ratio performance seemed fairly constant, between 0.17 and 0.24, within the ADP’s optimal state range (Table 1), leading to the conclusion that the system is well-buffered and capable on enduring VFA variations without major disturbances. 3.1.4.5. Temperature
Temperature patterns in the three digesters are similar, figure A-I 17, performing always in the mesophilic range. Between weeks 5 to 7 a severe decrease in temperature has occurred for all three digesters. In the same period biogas production rocketed up. As this observation is unique within the observed period, is difficult to relate this fact with any inhibition effect around 40ºC comparatively to the high performance observed at 39ºC. VFA also suffered an increase but due to a stable value of alkalinity (and pH), its inhibitory effects should have been minimal. Its relationship with free ammonia inhibition should
be further investigated. For values close to 38ºC and a pH range between 7.6-7.8, the amount of free ammonia in the system is below 10%. Nonetheless, a more fine analysis indicates that FA content is varying between 6 and 7.6%, which denotes an increase of ca. 25% in FA content, described in table 5. Table 5 - Free Ammonia content, in percent, as a function of
pH and temperature (adapted from Thurston, 1979).
T (ºC) pH
7.64 7.7 7.72
38.8 5.98 6.25
39.4 6.15 7
39.8 7.17 7.48
40 7.25 7.57
3.1.4.6. Ammonia
Figure A-I 18 shows the influence of ammonia in biogas production (on the right) and in quality (on the left). As previously stated in the literature review, ammonia beyond a certain concentration inhibits methanogens and therefore a decrease in biogas quality is expected. Ammonia was measured at the ADP by the Quantofix® test, which will be further analysed in the next sections, and despite a slight decrease in quality in weeks 1 to 4, ammonia values were equal in all weeks as both quality and production suffered variations. The colour gradation of the Quantofix® test (ranging visually from bright yellow to bright orange) indicates progressive concentrations levels (0, 10, 25, 50, 100, 200 and 400 mg/L NH4
+). Given this gradation scheme, a visual measurement has a significant reading error, and therefore there is a certain degree of uncertainty regarding the ammonia measurements performed by this method. 3.1.4.7. COD Content
In all digesters, there was a decrease from weeks 4 to 7 in all digesters (for Total COD), and a subsequent increase from week 8 to 9, as shown in figure A-I 19. A fair amount of organic matter possibly biodegradable could still be present, which could be digested anaerobically before being discarded. Total COD could present a high content in fibers, which are more difficult to degrade, leading to its high values in all tanks. Lower COD improve biogas efficiency and may facilitate solid removal by settling. 3.1.5. Effluent Characterization
The final destination of the liquid effluent is an in-house WWTP. It is received in tank 5 and characterized by an ammonia content of ca. 3 g/L, a total COD content, around 50 g O2/L and, on average, a soluble COD content of 25 g O2/L. In terms of solid content, is presents a TS content of about 3.5 %, 70% of VS, 2.41% TDS and 0.34% TSS. 73.1% of its solids settle after a period of 24h. As the AD downstream processing are constituted mainly by the dewatering step, all of these parameters were also measured in the remaining effluents (tanks 1 to 4) in order to understand their variations throughout the ADP dewatering step.

8
3.1.5.1. Ammonia
In the dewatering step, ammonium nitrogen decreases up to 50% as observed in figure A-I 20, which can be explained by ammonia release into the building’s atmosphere. The effluent sent to the WWTP contains about 2.5 g/L of ammonium nitrogen. In addition to the weekly monitoring, another ammonia test is performed every quarter, for quality purposes. Due to method limitations, the substrate in which they perform this measurements is the liquid fraction collected from the presses (of the dewatering stage), and not the digestate effluent. These results are usually a little lower than the results measured at the ADP, ranging between 2.17 g/L and 5.20 g/L in the years 2015 and 2016. In an effort to understand if this change in substrate had an impact on the measurements, samples were also collected from the liquid fraction of the presses in order to measure ammonia by the Kjeldahl method, and values were compared to the digestate effluent. Two samples were tested for two digesters and the results are presented in figure A-I 21, DG1 on the left, and DG3 on the right. pH values measured in situ during sampling were the following: 7.7 for DG1 and 7.9 for the press in week 6, 7.6 for DG3 and 7.9 for the press in week 7, 7.7 for DG1 and 7.9 for the press in week 8, and 7.7 for DG3 and 7.9 for the press in week 9. The liquid fraction is extremely similar to the raw digestate since no treatment was performed other than pressing. The results do not differ very much for both substrates for DG 1, while for DG 3 the pressed sample showed higher ammonia concentrations, when compared to the direct effluent. This result is merely indicative since only two weeks were analysed for each sample, therefore more studies should be performed in a wider period of time to fully understand in which sample the results are more reliable. 3.1.5.2. COD Content
Tank 1 and 2 have the highest values of COD, which is expected, as these tanks receive the effluents from the presses and the sieves, respectively. COD does not suffer extreme variations, except regarding tank 2 in week 8, reaching a total COD of 206 gO2/L, figure A-I 22. COD for tank 3 and 4 seem to have a similar behaviour, but reaching higher values for tank 4 than for tank 3, figure A-I 23. Also, these two tanks are the ones with the less constant tendency when compared with the other tanks. Tank 5 behaved very constantly, in the morning and in the afternoon. 3.1.5.3. Solid Content
Solid content was also measured in all dewatering tanks. For tank 5, two separate samples were collected, one in the morning and one in the afternoon, in order to measure separately TS content. TDS, TSS and S/S were also quantified in tank 5, in order to characterize this effluent before being sent to the WWTP. Figure A-I 24 illustrates TS and VS in tanks. Tank 1 and 2 have the highest values of TS, as it was also verified regarding COD. Their TS content is fairly constant throughout the weeks, always within project value range, except for tank 1 in week 7, when it reached 19.1%, and tank 2 in week 12, when it reached 16%. TS contents of Tanks 3, 4 and 5, which receive effluents from three separate centrifuges, were always within range. VS content in the observed period was always below the limit values. Tanks 3 and 4 are the ones with the less constant tendency in TS (as
it was also observed regarding COD), and usually have high TS contents, of about 11%. However, as their function is to recirculate into the digesters to serve as dilution liquid, their TS content need to be lower, about 9%. In order to achieve that, both tank 3 and 4 are mixed with tank 5 effluent, which has a TS content of about 4%, therefore obtaining the desired content. VS content in the observed period was, as observed for tank 1 and 2, always below the limit values. In tank 5, which sends its effluent directly to the WWTP, VS content was also below the limit values in the observed period. In terms of TS content for the morning and afternoon samples, figure A-I 25, a 50% variation seems to occur between the morning and afternoon samples, which was expected, due to the washing cycles of equipment (performed by night), which decreases TS content in the next day’s morning samples. Therefore, the system could be optimized with, for instance, an equalization basin. Figure A-I 26 represents TSS and TDS contents as well as S/S content, in the morning sample of tank 5. Since the morning sample is the least concentrated sample of the day, these values are underestimated. TDS represents mainly dissolved salts, and ranged between 1.97% for week 2 and 2.81% for week 12, with an average of 2.41%, while TSS represents probably fibber content, ranging between 0.15% in week 10 and 0.73% in week 3, with an average of 0.34%. S/S content was measured after 24 hours in an Imhoff cone. This period of time was found to be appropriate to properly read S/S, because the sample is extremely dark and the reading is impossible to perform in the day of collection. The objective is to closely monitor S/S values, in an effort to minimize subsequent solid settling in the equalization basin at the WWTP. We can observe that suspended solids are fairly settleable in about 10% of its volume in 24h, therefore eliminating about 50% of the COD present on the sample. This effluent probably is not compatible with the implementation of a gravity system at the WWTP due to its high fermentation potential, which creates gas bubbles, that when rising to the surface disturb sedimentation. 3.2. Ammonia Quantification
In order to assess the reliability of the measurements currently in use at the ADP, one-grab samples of the digestate and effluents were collected, between weeks 4 and 9, measured by the Quantofix® test and compared with Kjeldahl digestion and steam distillation measurements. One round of samples were submitted to Kjeldahl digestion and then compared with the un-digested results, as described in table 6. Table 6 - Ammonia content (g/L) in the digestate by Kjeldahl
method. Comparison between digested samples and un-digested samples.
Digester NH3-N (g/L)
Digested Un-digested
DG 1 3.63 3.60
DG 2 3.63 3.63
DG 3 3.59 3.63
9
Usually, if the measurements are not performed in the same day as sampling, samples need to be preserved in sulfuric acid, as to maintain a pH≤2, as described in the literature (APHA, 2005). However, the optimization of the methodology led to unforeseen delays in the measurements and therefore all the samples were stored at 4ºC without acidification, and so a certain degree of degradation need to be taken into account. Measurements performed by the Kjeldahl method result in lower and more constant values, with an average of 3.7 ± 0.07 g/L for DG1, 4.0 ± 0.06 g/L for DG2 and 3.8 ± 0.09 g/L for DG3. The Quantofix ® method averaged 5.7 g/L, 5.5 g/L and 5.4 g/L, for DG1, DG2 and DG3, respectively, possibly validating the hypothesis of visual error due to the colour scheme of the Quantofix® test. In conclusion, direct measurement of NH3-N by distillation seems enough for ammonia control. Besides its accuracy, the steam distillation step is relatively fast, taking about 20 minutes to process each sample (10 minutes for the analysis and another 10 minutes for cleaning), while the digestion step takes more time (about 5 hours). However, TAN quantification would be a step forward in the control of the biodegradability of this complex substrate. The investment to acquire the equipment would be of about €10.000, however, given the accuracy and the present difficulties in understanding the real ammonia values, it could be a good alternative to the current methodologies performed at the ADP. Also, it could be interesting to validate the degree of protein degradation in MSW, by performing a comparison between the amount of N-organic compounds in MSW and in the digestate. 4. Conclusions and Future Perspectives
Process proved to be robust, highly buffered and therefore capable of enduring VFA variations without major disturbances in biogas production. The increased buffer capacity denoted by pH prevented an eventual VFA toxicity by accumulation during the week. Therefore, the reading of pH without other parameters is not enough to ascertain process stability. The anaerobic digester’s are fed with 7.2 kg VS/m3.d, with an HRT of ca. 40 days, producing an average of 600 Nm3/t VS, leading to a 50% reduction in VS content, as expected. This efficiency could be underestimated, since most of the waste is unsorted waste, containing some plastic that interferes with VS measures. Quality behaved with an average of 57%, which is within the expected range of values described in the literature. The parameters that appear to have the most influence in quality and production seem to be the feed and mass load, which showed high variability throughout the weeks, with a VS content of about 30%, leading to VFA accumulation, which decreases over the weekend. Average values of 3.5 g acetate/L in the digestate are reduced to 2.0 g/L. High inert content reduces retention time of the biodegradable fraction and conducts to a low conversion efficiency of VFA during the week. It is foreseen an optimization of the process by reducing inert material percentage or with the implementation of a new digester due to the digestate’s high potential for a new digestion process, in order to obtain extra CH4 production. It was not observed any ammonia inhibition, in the pH and temperature ranges of operation, probably due to the presence of high-tolerant ammonia strains. All proteins present seem to have been transformed, with no N-organic compounds present in the digestate. It should be further
studied and taken into account protein and TAN in the feeding and digestate, in order to determine protein hydrolysis efficiency and its contribution to system buffer capacity. Moreover, NH3-N content quantified by Kjeldahl method showed a high discrepancy with operating values taken with a commercial kit currently in use at the ADP. Soluble COD can be attributed to the remaining VFA and some non-degraded matter. Thus, the optimization of the process seems critical to reduce the organic load of the liquid effluents to be sent to the WWTP. This effluent also presents a 50% variation in TS between the morning and the afternoon, and the system could be improved with an equalization basin. Solids are fairly settleable in 10% of the volume, possibly not compatible with a gravity system at the WWTP due to the high fermentation potential of the tank 5 effluent. However, it would be interesting to evaluate its BOD content. References
ABBASSI-GUENDOUZ, A. B. (2012). Total solids content drives high solid anaerobic digestion via mass transfer limitation. Bioresources Technology, 111:55-61.
ADEKUNLE, K. O. (2015). A Review of Biochemical Process of Anaerobic Digestion. Advances in Bioscience and Biotechnology, 6:205-212.Tchobanoglous, G. K. (2002). Handbook of Solid Waste Management. McGraw-Hill.
CASTRO, R. A. (2015). The potential for electricity generation in anaerobic digestion of MSW - The case of Tratolixo. Modelling, Innovation, Sustainability and Technology - MIST.
ALVES, M. M. (2007). Reactores para tratamento anaeróbio. In M. T. Fonseca, Reactores Biológicos (pp. 373-392). Lisboa: Lidel - Edições Técnicas.
CALLI, B. M. (2005). Effects of high free ammonia concentrations on the performances of anaerobic bioreactors. Process Biochemistry, 40:1285-1292.
CHEN, Y. C. (2008). Inhibition of anaerobic digestion process: A review. Bioresource Technology, 99:4044-4064.
DE BAERE, L. D. (1984). Influence of high NaCl and NH4Cl salt levels on methanogenic associations. Water Resources, 18:543-548.
DEUBLEIN, D. S. (2008). Biogas from Waste and Renewable Resources. Weinheim, Germany: Wiley-VCH Verlag GmbH & Co. KGaA.
DI BERARDINO, S. (2015). Produção de biogás a partir de resídios verdes. Workshop - Bioenergia Portugal, Projecto GR3. Portalegre.
DUAN, N. D. (2012). High-solid anaerobic digestion of sewage sludge under mesophilic conditions: feasibility study. Bioresources Technology, 104:150-156.
FRICKE, K. S. (2007). Operating problems in anaerobic digestion plants resulting from nitrogen in MSW. Waste Management, 27:30-43.
GALLERT, C. W. (2014). Mesophilic and thermophilic anaerobic digestion of source-sorted organic wastes: effect of ammonia on glucose degradation and methane production. PLoS ONE, 9(5):e97265.
KAYHANIAN, M. (1995). Biodegradability of the organic fraction of municipal solid waste in a high solids anaerobic digester. Waste Management & Research, 13:123-136.
KHALID, A. A. (2011). The anaerobic digestion of solid organic waste. Waste Management, 31: 1737-1744.
10
KOSTER, I. L. (1988). Anaerobic digestion at extreme ammonia concentrations. Biol. Wastes, 25:51-99.
KROEKER, E. S. (1979). Anaerobic treatment process stability. J. Water. Pollut. Control Fed., 51:718-727.
LABATUT, R. G. (2012). Monitoring of Anaerobic Digestion Process to Optimize Performance and Prevent System Failure. Proceedings of Got Manure? Enhancing Environmental and Economic Sustainability (pp. 209-225). New York: Cornell University, Ithaca, NY.
LAY, J.-J. L.-Y. (1997). Influences of pH and Moisture Content on the Methane Production in High-Solids Sludge Digestion. War. Res. Vol 31, 6:1518-1524.
MATA-ALVAREZ, J. (2003). Biomethanization of the Organic Fraction of Municipal Solid Wastes. Cornwall, UK: IWA Publishing.
MCCARTY, P. (1964). Anaerobic waste treatment fundamentals III. In P. McCarty, Public Works, 95 (p. p.91).
RAJAGOPAL, R. M. (2013). A critical review on inhibition of anaerobic digestion process by excess ammonia. Bioresource Technology, 143:632-641.
REGIONAL INFORMATION SERVICE CENTRE FOR SOUTH EAST ASIA
ON APPROPRIATE TECHNOLOGY (RISE-AT). (1998). Review of current status of Anaerobic Digestion Technology for treatment of MSW. Asia Biodiversity Conservation and Database Network (ABCDNet).
SCHÖN, M. (2009). Numerical Modelling of Anaerobic Digestion Processes in Agricultural Biogas Plants - Dissertation submitted to the University of Innsbruck, Faculty of Civil Engineering for obtaining the academic degree of
Doctor of Technical Sciences. Innsbruck, Austria: University of Innsbruck.
THURSTON, R. V. (1979). Aqueous Ammonia Equilibrium - Tabulation of Percent Un-ionized Ammonia. Duluth, Minnesota, U.S.A: Environmental Research Laboratory - Duluth, U.S. Environmental Protection Agency.
TRATOLIXO E.I.M. (2008). Manual Biológico do centro de metanização da Abrunheira - MAFRA.
VERMA, S. (2002). Anaerobic Digestion of Biodegradable Organics in Municipal Solid Waste. Thesis submitted in partial fulfillment of the requirements for Master of Science Degree in Earth Resources Engineering. New York: Columbia University.
VÖGELI, Y. L. (2014). Anaerobic Digestion of Biowaste in Developing Countries: Practical Information and Case Studies. Dübendorf, Switzerland: Swiss Federal Institute of Aquatic Science and Technology (Eawag).
WANG, Q. K. (1999). Degradation of volatile fatty acids in highly efficient anaerobic digestion. Biomass and Energy, 16:407-416.
WANG, X. L. (2014). Effects of Temperature and Carbon-Nitrogen (C/N) Ratio on the Performance of Anaerobic Co-Digestion of Dairy Manure, Chicken Manure and Rice Straw: Focusing on Ammonia Inhibition. PLoS ONE, 9(5):e97265.
YI, J. D. (2014). Effect of Increasing Total Solids Contents on Anaerobic Digestion of Food Waste under Mesophilic Conditions: Performance and Microbial Characteristics Analysis.PLoSONE,9(7):e102548.

11
APPENDIX
Figure A-I 1 - Characterization of the waste received at the ADP
Figure A-I 2 - TS and moisture (%, on the left) and TS content as VS, Inerts and Glass/metal (%, on the right) in the feed.
Figure A-I 3 - MSW mass loading rate (t/day) for the three digesters. The gaps represent Sunday, where no feeding was
performed.
0
20
40
60
80
100
120
140
160
180
2003
/jan
10
/jan
17
/jan
24
/jan
31
/jan
7/f
ev
14
/fev
21
/fev
28
/fev
6/m
ar
13
/mar
20
/mar
27
/mar
3/a
br
10
/ab
r
Was
te S
ou
rce
s (t
/d)
Total MSW Total BW
0
20
40
60
80
100
120
3/ja
n
10/ja
n
17/ja
n
24/ja
n
31/ja
n
7/fev
14/fev
21/fev
28/fev
6/m
ar
13/m
ar
20/m
ar
27/m
ar
3/a
br
10/a
br
MS
W m
ass l
oa
din
g (
t/d
ay)
Digester 1 (MSW) Digester 2 (MSW) Digester 3 (MSW)

12
Figure A-I 4 - VS content, in percent, in the three digesters. The gaps represent Sunday, where no feeding was performed.
Figure A-I 5 - Volumetric loading rate (kg VS/m3.d) for the three digesters. Each value calculated considering the working
volume of each digester. The gaps represent Sunday, where no feeding was performed.
Figure A-I 6 - Biogas production (Nm3/d), measured after cleaning. VFA accumulation (g acetate/L) in DG2.
0.23
0.27
0.31
0.35
0.39
0.43
3/ja
n
10/ja
n
17/ja
n
24/ja
n
31/ja
n
7/fev
14/fev
21/fev
28/fev
6/m
ar
13/m
ar
20/m
ar
27/m
ar
3/a
br
10/a
br
VS
(%
)Digester 1 (MSW) Digester 2 (MSW) Digester 3 (MSW)
1
3
5
7
9
11
13
3/ja
n
10/jan
17/ja
n
24/ja
n
31/ja
n
7/fev
14/fev
21/fev
28/fev
6/m
ar
13/m
ar
20/m
ar
27/m
ar
3/a
br
10/a
br
Vo
lum
etr
ic L
oa
din
g r
ate
(kg
VS
/m3.d
)
VLR 1 VLR 2 VLR 3
0.0
0.5
1.0
1.5
2.0
2.5
3.0
3.5
4.0
4.5
5.0
10000
15000
20000
25000
30000
35000
40000
45000
3/ja
n
10/ja
n
17/jan
24/ja
n
31/ja
n
7/fev
14/fev
21/fev
28/fev
6/m
ar
13/m
ar
20/m
ar
27/m
ar
3/a
br
10/a
br
VF
A D
G2
(g a
ceta
te/L
)
Bio
ga
s P
rod
uc
tio
n (
Nm
3)
Daily Biogas Production VFA DG2
13
Figure A-I 7 - Total Biogas productivity (Nm3/t VS.day) for the three digesters. HRT – Hydraulic Retention Time, of about 40
days. The gaps represent Sunday, where no feeding was performed.
Figure A-I 8 - Influences of biogas production (Nm3) in biogas quality (% CH4).
Figure A-I 9 - TS and moisture (%, on the left) and TS content as VS, Inerts and Glass/metal (%, on the right) in the digestate.
0
200
400
600
800
1000
1200
1400
3/j
an
10
/jan
17
/jan
24
/jan
31
/jan
7/f
ev
14
/fev
21
/fev
28
/fev
6/m
ar
13
/mar
20
/mar
27
/mar
3/a
br
10
/ab
r
Bio
gas
(Nm
3 /t
VS.
d)
HRT~40days Daily
52
53
54
55
56
57
58
59
60
61
62
63
10000
20000
30000
40000
50000
3/ja
n
10/ja
n
17/ja
n
24/ja
n
31/ja
n
7/fe
v
14/f
ev
21/f
ev
28/f
ev
6/m
ar
13/m
ar
20/m
ar
27/m
ar
3/a
br
10/a
br
Qu
ali
ty (
% C
H4)
Pro
du
cti
on
(N
m3)
Biogas production Biogas quality
0%
20%
40%
60%
80%
100%
1 2 3 4 5 6 7 8 9 1011121314151617Time (weeks)
Total Solids Moisture
0%
20%
40%
60%
80%
100%
1 2 3 4 5 6 7 8 9 1011121314151617Time (weeks)
Volatile Solids Inerts > 0,5mm Glass and metal

14
Figure A-I 10 - VS removed in percent. Weekly average of the three digesters.
Figure A-I 11 - VFA content (g acetate/L) in the digestate of the three digesters. The gaps represent the weekends, where no
measurements were performed.
Figure A-I 12 - DG2 feeding VS content and VFA accumulation.
25
30
35
40
45
50
55
60
1 2 3 4 5 6 7 8 9 10 11 12 13 14 15
% V
S re
mo
ved
Time (weeks)
0.15
0.20
0.25
0.30
0.35
0.40
0.45
2.2
2.7
3.2
3.7
4.2
4.7
5.2
3/ja
n
10/ja
n
17/ja
n
24/ja
n
31/ja
n
7/fe
v
14/f
ev
21/f
ev
28/f
ev
6/m
ar
13/m
ar
20/m
ar
27/m
ar
3/a
br
10/a
br
VF
A D
G2
(g a
ce
tte
/L)
VS
fe
ed
ing
(%
)
VFA DG2 VS DG2

15
Figure A-I 13 - pH and Alkalinity measurements in the digestate of digester 2. The gaps represent the weekends, where no
measurements were performed.
Figure A-I 14 - pH as a function of Alkalinity for the three digesters.
Figure A-I 15 - Average Alkalinity (g CaCO3/L) of the three digesters, measured in the digestate and its influence on total
biogas quality (% CH4).
16
17
18
19
20
21
22
7.0
7.2
7.4
7.6
7.8
8.0
8.2
3/ja
n
10/ja
n
17/ja
n
24/ja
n
31/ja
n
7/fe
v
14/f
ev
21/f
ev
28/f
ev
6/m
ar
13/m
ar
20/m
ar
27/m
ar
3/a
br
10/a
br
Alk
ali
nit
y (
g C
aC
O3/L
)
pH
pH Alkalinity
7.55
7.60
7.65
7.70
7.75
7.80
7.85
15 16 17 18 19 20 21 22
pH
Alkalinity (g CaCO3/L)
DG1 DG2 DG3
16.5
17.0
17.5
18.0
18.5
19.0
19.5
20.0
52
54
56
58
60
62
64
3/ja
n
10/ja
n
17/ja
n
24/ja
n
31/ja
n
7/fe
v
14/f
ev
21/f
ev
28/f
ev
6/m
ar
13/m
ar
20/m
ar
27/m
ar
3/a
br
10/a
br
Alk
ali
nit
y (
g C
aC
O3/L
)
Bio
ga
s Q
ua
lity
(%
CH
4)
Biogas quality Alkalinity

16
Figure A-I 16 - VFA to Alkalinity ratio in the digestate of the three digesters. The gaps represent the weekends, where no
measurements were performed.
Figure A-I 17 - Temperature (ºC) in the digestate of the three digesters. The gaps represent the weekends, where no
measurements were performed.
Figure A-I 18 - Influence of ammonia (g/L, one grab sample) on biogas quality (% CH4, on the left) and on biogas production
(Nm3, on the right), in the digestate of the three digesters.
0.12
0.14
0.16
0.18
0.20
0.22
0.24
0.26
0.28
0.30
0.32
3/ja
n
10/ja
n
17/ja
n
24/ja
n
31/ja
n
7/fe
v
14/f
ev
21/f
ev
28/f
ev
6/m
ar
13/m
ar
20/m
ar
27/m
ar
3/a
br
10/a
br
VF
A/A
lka
lin
ity
(g a
ce
tate
/g C
aC
O3)
DG1 DG2 DG3
38.6
39.0
39.4
39.8
40.2
40.6
41.0
3/ja
n
10/ja
n
17/ja
n
24/ja
n
31/ja
n
7/fe
v
14/f
ev
21/f
ev
28/f
ev
6/m
ar
13/m
ar
20/m
ar
27/m
ar
3/a
br
10/a
br
Te
mp
era
ture
(ºC
)
DG1 DG2 DG3
54
56
58
60
62
0
2
4
6
8
0 5 10 15 20
Qu
alit
y (%
CH
4)
NH
3(g
/L)
Time (weeks)Quantofix ® Method Biogas Quality
2.E+04
3.E+04
4.E+04
5.E+04
6.E+04
0
2
4
6
8
0 5 10 15 20
Pro
du
ctio
n (
Nm
3)
NH
3(g
/L)
Time (weeks)Quantofix ® Method Biogas Average Production

17
Figure A-I 19 - Total COD (g O2/L, on the left) and soluble COD (g O2/L, on the right) in digesters. Samples collected from
inside the digesters after 20 minutes of recirculation.
Figure A-I 20 - Ammonia content (g/L) obtained by the Kjeldahl method (one grab sample), in the effluents of the dewatering stage. Tank 1 receives effluent from presses and sends it to the sieves; Tank 2 receives from sieves and sends it to the centrifuges. Centrifuge outlet are collected in tanks 3 and 4 from where liquid effluent can be recirculated to the digesters as water balance. Tank 5 receives from centrifuges and sends to the WWTP the liquid effluent in excess.
Figure A-I 21 - Comparison between digestate and press liquid fraction in DG1 and DG3. Content in NH3-N (Kjeldahl Method).
50
100
150
200
250
300
4 5 6 7 8 9
Tota
l CO
D (
gO2/
L)
Time (weeks)DG1 DG2 DG3
0
40
80
120
160
200
4 5 6 7 8 9
Solu
ble
CO
D (
gO2/
L)
Time (weeks)
DG1 DG2 DG3
0
2
4
6
4 5 6 7 8 9
NH
3-N
(g
/L)
Time (weeks)
Tank 01 Tank 02 Tank 03 Tank 04
0
2
4
6
4 5 6 7 8 9
NH
3-N
(g
/L)
Time (weeks)
Tank 05 morning Tank 05 afternoon
2
3
4
5
6
5 6 7 8 9
NH
3-N
(g/L
)
Time (weeks)DG1 Press
2
3
4
5
6
5 6 7 8 9
NH
3-N
(g/L
)
Time (weeks)
DG3 Press

18
Figure A-I 22 - Total COD (g O2/L, on the left) and soluble COD (g O2/L, on the right) in tanks 1, 2 and 5. One-grab samples
collected from inside the tanks, when the equipments are operating. Tank 1 receive effluent from presses an sends it to the sieves, Tank 2 receives from sieves and sends it to the centrifuges, and Tank 5 receives from centrifuges and sends it to the WWTP.
Figure A-I 23 - Total COD (g O2/L, on the left) and soluble COD (g O2/L, on the right) in tanks 3 and 4. One-grab samples from inside the tanks, when the equipments are operating. Tanks 3 and 4 receive effluent from centrifuges in order to perform recirculation into the digesters.
Figure A-I 24 - TS (%, on the left) and VS (%, on the right) contents in tanks from the dewatering stage.
0
50
100
150
200
250
4 5 6 7 8 9
Tota
l CO
D (
g O
2/L
)
Time (weeks)Tank 01 Tank 02Tank 05 morning Tank 05 afternoon
0
25
50
75
100
125
4 5 6 7 8 9
Solu
ble
CO
D (
g O
2/L
)
Time (weeks)Tank 01 Tank 02Tank 05 morning Tank 05 afternoon
0
30
60
90
120
150
4 5 6 7 8 9
Tota
l CO
D (
g O
2/L
)
Time (weeks)Tank 03 Tank 04
0
10
20
30
40
50
4 5 6 7 8 9
Solu
ble
CO
D (
g O
2/L
)
Time (weeks)Tank 03 Tank 04
0%
5%
10%
15%
20%
25%
0 5 10 15
TS (
%)
Time (weeks)
Tank 1 Tank 2
Tank 3 Tank 4
Tank 5 morning Tank 5 afternoon
30%
40%
50%
60%
70%
0 5 10 15
VS
(%)
Time (weeks)
Tank 1 Tank 2Tank 3 Tank 4Tank 5 morning

19
Figure A-I 25 - Tank 5 TS content, measured in the morning and afternoon samples.
Figure A-I 26 - Weekly measurements of TDS and TSS (in percent, on the left) and S/S (ml/L, on the right), performed in the
morning sample of Tank 5. S/S was performed after 24h.
0%
1%
2%
3%
4%
1 2 3 4 5 6 7 8 9 10 11 12 13 14 15
Time (weeks)
TDS TSS
0
200
400
600
800
1000
1 2 3 4 5 6 7 8 9 10 11 12 13 14 15
S/S
(ml/
L)
Time (weeks)

20
Figure A-I 27 - Comparison between ammonia measurements (g/L) obtained by the Quantofix® Method (one,-grab sample)
and the Kjeldahl method (one grab sample), in the digestate of the three digesters.
1 3