extensionextensionpublications.unl.edu/assets/pdf/mp94.pdf · low-fat wet distillers grains and...
TRANSCRIPT
N E
B R
A S
K A
Agricultural Research DivisionUniversity of Nebraska Extension
Institute of Agriculture and Natural ResourcesUniversity of Nebraska–Lincoln
Extension is a Division of the Institute of Agriculture and Natural Resources at the University ofNebraska–Lincoln cooperating with the Counties and the United States Department of Agriculture.
University of Nebraska–Lincoln Extension educational programs abide with the nondiscrimination policies of the University of Nebraska–Lincoln and the United States Department of Agriculture.
© 2010, The Board of Regents of the University of Nebraska. All rights reserved.
2011Beef Cattle
Report
MP94
Know how. Know now.
EXTENSION®
Page 2 — 2011 Nebraska Beef Cattle Report © The Board of Regents of the University of Nebraska. All rights reserved.
ACKNOWLEDGMENTSAppreciation is expressed to the following firms, associations, or agencies who provided grant support for research in the beef cattle program.
Archer Daniels, Midland, Colo., Columbus, Neb.Cargill Corn Milling, Blair, Neb.Nebraska Center for Energy Sciences Research, University
of Nebraska, Lincoln, Neb.Elanco Animal Health, Indianapolis, Ind.Intervet/Shering-Plough, Millsboro, Del.Nebraska Beef Council, Kearney, Neb.National Cattlemen’s Beef Association, Centennial, Colo.Nebraska Cattlemen, Inc., Lincoln, Neb.Nebraska Corn Board, Lincoln, Neb.North Central Region, Sustainable Agriculture Research &
Education Program, USDA
Pfizer Animal Health, New York, N.Y.Poet Nutrition, Sioux Falls, S.D.The Beef Checkoff, Centennial, Colo.University of Nebraska Program of Excellence FundingUSDA Animal Health Research and Disease Program USDA NRCS Conservation Innovation GrantUSDA-CSREES Grant # 2005-55101-16369. Managed
EcosystemsUSDA/NIFA Nebraska Animal Health FundsUSDA Ruminant Reproduction W1112 Regional Research
ProjectVet Life, West Des Moines, Iowa
Intervet, Millsboro, Del.Iowa Limestone, Des Moines, IowaLiquid Feed Commodities, Fremont, Neb.Mead Cattle Co., Mead, Neb.Merial Igenity, Deluth, Ga.North American Limousin Foundation, Centennial, Colo.Novus International, Inc., St. Charles, Mo.Pfizer Animal Health, New York, N.Y.Pharmacia Upjohn, Kalamazoo, Mich.PharmAgra Labs, Inc., Brevard, N.C.Red Angus Association of America, Denton, Tex.Rex Ranch, Ashby, Neb.Tyson Foods, Inc., Dakota City, Neb.USDA Meat Grading and Certification Branch, Omaha, Neb.
Appreciation is also expressed to the following firms who provided products or services
American Angus Association, St. Joseph, Mo.Archer Daniels Midland, CO, Columbus, Neb.American Gelbvieh Association, Westminster, Colo.American Hereford Association, Kansas City, Mo.American Simmental Association, Bozeman, Mont.American-International Charolais Association, Kansas
City, Mo.Boehringer Ingelheim Vetmedica, St. Joseph, Mo.Cargill Corn Milling, Blair, Neb.Cargill Meat Solutions, Wichita, Kan./Schuyler, Neb./High
River, Alberta, CanadaDixon County Feedyard, Allen, Neb.Elanco Animal Health, Indianapolis, Ind.Fort Dodge Animal Health, Overland Park, Kan.Greater Omaha Pack, Omaha, Neb.
Appreciation is also expressed to the following Research Technicians, Unit Managers, and Crew involved in the Research Programs at our various locations.
Agricultural Research & Development Center, IthacaJosh BentonJeff BergmanLyle BlaseDave CajkaWill GriffinSarah Hersh
Brian LashleySteve MaserAllison MillerKarl MolineChuck Rezac
Ken RezacMark SchroederMatt SillivanDoug WatsonDan Wiley
Department of Animal Science, Lincoln Nerissa AhrenCrystal BucknerVirgil BremerVanessa BrauerRuth Diedrichsen
Tommi JonesJill KerlClyde NaberBrandon NuttelmanKelsey Rolfe
Lindsey SalestromCalvin SchrockWilliam PohlmeierJacqualine Smith
Gudmundsen Sandhills Laboratory, WhitmanAndy ApplegarthC.R. Jewell
John NolletteJay Holthus
Panhandle Research & Extension Center, Scottsbluff Nabor Guzman Paul McMillenStephanie Furman Doug Pieper
Jacki Musgrave
West Central Research & Extension Center, North PlatteKevin Jess T. L. Meyer Jim Teichert
Northeast Research & Extension Center, NorfolkKevin Heithold Lee Johnson Leslie Johnson
Dalbey Halleck FarmMark Dragastin
Electronic copies of Nebraska Beef Reports and Summaries available at: http://beef.unl.edu. Click on reports.

© The Board of Regents of the University of Nebraska. All rights reserved. 2011 Nebraska Beef Cattle Report — Page 3
Table of Contents 2010 Nebraska Beef Cattle Report
Cow/Calf
Winter Grazing System and Supplementation of Beef Cows During Late Gestation Influence Heifer Progeny ........................ 5Influencing Steer Performance Through Maternal Nutrition ........................................................................................................ 8Integration of DNA Marker Information into Breeding Value Predictions ..................................................................................11Granulosa Cell Gene Expression is Altered in Follicles from Cows with Differing Reproductive Longevity ............................13
Growing
Performance of Growing Cattle Fed Corn Silage or Grazing Corn Residue from Second Generation Insect-protected (MON 89034), Parental, or Reference Corn Hybrids ........................................................................................................16Nutrient Composition of Spoiled Wet Byproducts Mixed and Stored with Straw .......................................................................18Use of Dry Rolled Corn, Dry or Wet distillers Grains Plus Solubles as an Energy Source in High Forage Diets for Growing Cattle ...............................................................................................................................................................20Effect of Corn Hybrid on Amount of Residue Available for Grazing .............................................................................................22Supplementing DDGS to Steers Grazing Smooth Bromegrass Pastures ........................................................................................24Economic Analysis of Supplementing DDGS to Grazing Cattle ....................................................................................................26Replacement of Grazed Forage with WDGS and Poor Quality Hay Mixtures ..............................................................................28Supplementing Modified Wet Distillers Grains with Solubles to Long Yearling Steers Grazing Native Range ..........................31Effect of Stocking Rate on Animal Performance and Diet Quality While Grazing Cornstalks ..................................................33Digestibility of Crop Residue after Chemical Treatment and Anaerobic Storage .........................................................................35
Finishing
Economics for Feeding Distillers Grains to Finishing Cattle .........................................................................................................37Meta-Analysis of Feeding Calf-feds or Yearlings Wet Distillers Grains with Different Corn Processing .................................. 40Impact of Distillers Grains Moisture and Inclusion Level on Greenhouse Gas Emissions in the Corn-Ethanol-Livestock Life Cycle ................................................................................................................................... 42Performance and Carcass Characteristics of Finishing Steers Fed Low Fat and Normal Fat Wet Distillers Grains ................. 44Review: Lipid Addition to Corn Finishing Diets ............................................................................................................................ 46Comparing Different Drying Methods for Distillers Grains and Its Effect on Feedlot Cattle Performance ..............................48Comparing Dry, Wet, or Modified Distillers Grains Plus Solubles on Feedlot Cattle Performance ...........................................50The Effect of Drying Distillers Grains on Nutrient Metabolism ....................................................................................................53Effect of Feeding More than 70% Wet distillers Grains Plus Solubles on Feedlot Cattle Performance ......................................55Effects of Feeding a Combination of Modified Distillers Grains Plus Solubles and Wet Corn Gluten Feed to Adapt Cattle to Finishing Diets......................................................................................................................................57Effect of Source and Level of Sulfur on Rumen Metabolism and Finishing Performance .......................................................... 60Effects of Sulfur Concentration in Distillers Grains with Solubles in Finishing Cattle Diets .....................................................62Effects of Adaptation Diets Containing Wet Distillers Grains with Solubles or Wet Corn Gluten Feed on Ruminal pH, Intake and Hydrogen Sulfide .................................................................................................................65Effects of Sulfur Content of Distillers Grains in Beef Cattle Finishing Diets on Intake, Ruminal pH, and Hydrogen Sulfide .................................................................................................................................................................68Economic Impact of Sulfur Levels in Distillers Grains Diets Fed to Beef Cattle ..........................................................................70Effects of Lactobacillus Acidophilus and Yucca Schidigera on Finishing Performance and Carcass Traits of Feedlot Cattle .................................................................................................................................................................72Feeding Strategies of Optaflexx on Growth Performance and Carcass Characteristics of Feedlot Steers ..................................74Feedlot Cattle Performance When Fed Silage and Grain from Second-Generation Insect Protected Corn, Parental Line or Reference Hybrids ...................................................................................................................................76Effects of Glycerin in Steam Flaked Corn Feedlot Diets .................................................................................................................78Protein, Fiber, and Digestibility of Selected Alternative Crops for Beef Cattle .............................................................................80Mud Effects on Feedlot Cattle ...........................................................................................................................................................82Effect of Pen Cleaning Frequency and Feeding Distillers Grains and Wheat Straw on Nutrient Mass Balance and Performance of Feedlot Steers .................................................................................................................................... 84
Page 4 — 2011 Nebraska Beef Cattle Report © The Board of Regents of the University of Nebraska. All rights reserved.
Relationship Between Morbidity and Performance in Feedlot Cattle.......................................................................................... 87
Effects of a Dietary Antioxidant on Performance and Carcass Characteristics of Feedlot Cattle With or Without WDGS ............................................................................................................................................................. 90
Beef Products
Effects of Feeding High Levels of Wet Distillers Grains and Straw on Beef Cattle ..................................................................... 92Low-fat Wet Distillers Grains and Beef Quality ............................................................................................................................ 96Shelf Life of m. longissimus lumborum from Beef Fed Antioxidants and Wet Distillers Grains ................................................100Effects of the Synthetic Antioxidants on Shelf Life of m.psoas major and m. triceps brachii Muscles from Beef Fed Wet Distillers Grains ..........................................................................................................................................103Intramuscular Tenderness and Muscle Fiber Orientation of Beef Round Muscles .....................................................................105Marketing Source-Verified Beef to Restaurant Patrons .................................................................................................................109
Statistics Used in the Nebraska Beef Report and Their Purpose ..................................................................................................113

© The Board of Regents of the University of Nebraska. All rights reserved. 2011 Nebraska Beef Cattle Report — Page 5
(Continued on next page)
Winter Grazing System and Supplementation of Beef Cows During Late Gestation Influence Heifer Progeny
Rick N. FunstonJeremy L. Martin
Adam F. SummersDon C. Adams
Jacqueline A. MusgraveT. L. Meyer
Daniel M. Larson1
Summary
Effects of cow winter grazing system and supplementation on heifer progeny were evaluated. Cows grazed range (WR) or corn residue (CR) with (PS) or without (NS) supplement. Both PS and CR increased weaning weight. Heifers from WR-NS dams weighed less at breeding and pregnancy diagnosis than WR-PS. Heifers from PS dams were younger at puberty, and pregnancy rate tended to be greater. Heifers from CR-PS dams gained the least and were least efficient. First-calf production and rebreeding were similar. There appear to be fetal programming effects of dam winter grazing system and supplementa-tion on heifer progeny.
Introduction
Previous reports indicate no repro-ductive benefits from protein supple-mentation of spring calving beef cows grazing dormant Sandhills range during late gestation, despite the fact nutrient requirements are greater than nutrient content of the grazed forage. Supplementation of the dam during late gestation increases progeny wean-ing BW and increases fertility of heifer progeny. A study with steer mates to heifers utilized in the current study found late gestation supplementation altered post-weaning growth, carcass composition, and calf health in the feedlot, potentially through fetal pro-gramming.
The fetal programming hypoth-esis states postnatal growth and
physiology can be influenced by stimuli experienced in utero. Previous research utilizing the same cowherd indicates dam protein supplementa-tion increases heifer BW and fertility. There is potential for maternal nutri-tion to affect not only cow productiv-ity but lifelong productivity of the heifer calf.
The objective of the current study was to determine the effects of grazing dormant Sandhills range or corn crop residue, with or without supplemen-tation, on gain, feed efficiency, and reproduction in heifer-calf progeny.
Procedure
Cow and Calf Management
A three year study utilized com-posite Red Angus x Simmental cows and their progeny at Gudmundsen Sandhills Laboratory (GSL), Whit-man, Neb. (preweaning data collec-tion) and West Central Research and Extension Center (WCREC), North Platte, Neb. (postweaning data col-lection). Cows were used in a com-pletely randomized design with a 2 x 2 factorial arrangement of treatments to determine effects of grazing dor-mant Sandhills winter range (WR) or corn crop residue (CR) and receiving CP supplement (PS) or no supple-ment (NS) on cow and heifer progeny performance. One hundred nine pregnant, spring-calving cows (1,098 ± 33 lb initial BW) between 3 and 5 years of age were stratified by age and weaning BW of their previous calf and assigned randomly to treatment in year 1. Cows remained on the same treatment for the length of the study, unless removed due to reproductive failure or injury. Pregnant 3-year-old cows were stratified by age and wean-ing BW of their previous calf and assigned randomly to treatment to replace cows removed from the study
and to increase numbers as forage availability allowed. Data are reported for 2005 (109 cows), 2006 (114 cows), and 2007 (116 cows).
From late November until early March each year, cows grazing winter range were divided into four, 79-acre upland pastures; two pastures received CP supplement, and two did not. From November to March each year, cows grazing CR were maintained in four fields; two fields received CP supplement, two did not. Cows were shipped approximately 52 miles to corn residue fields on Nov. 15th and returned to GSL on Feb. 25th each year. Irrigated corn fields were planted in April and harvested in October , with an average annual yield of 200 bu/ac. On a pasture or field basis, cows received the equivalent of 1 lb/day of a 28% CP (DM basis) supplement three times/week or no CP supplement from Dec. 1 until Feb. 28 on WR, or until Feb. 25th on CR. The supplement contained 62.0% dried distillers grains plus solubles, 11% wheat middlings, 9.0% cotton-seed meal, 5.0% dried corn gluten feed, 5.0% molasses, 2.0% urea, and 6.0% vitamin and trace mineral pre-mix. The supplement was formulated to meet vitamin and trace mineral requirements of the 3-year-old cows and supply 80 mg /head/day monensin (Rumensin, Elanco Animal Health, Indianapolis, Ind.).
After winter grazing, cows were managed in a single group and fed hay harvested from subirrigated meadows and CP supplement. The average calving date was March 26. Cows returned to upland range in late May and remained in a single group throughout the breeding season until the subsequent winter grazing period. Cows were exposed to fertile bulls at a ratio of approximately 1 bull to 25 cows for 60 days each year, beginning on approximately June 5.
Page 6 — 2011 Nebraska Beef Cattle Report © The Board of Regents of the University of Nebraska. All rights reserved.
Heifer Calf Management
Treatments included only dam winter grazing system and late gesta-tion CP supplementation; no further treatments were applied to calves. Approximately 14 days following weaning, calves were transported to the WCREC, North Platte, Neb. Heifers remained in a single group for approximately 55 days following transport to the WCREC, and grazed a dormant winter pasture. Subse-quently, heifers were offered a diet containing 20% wet corn gluten feed (WCGF) and 80% prairie hay (DM basis) ad libitum for 45 days. Interim BW and blood samples were collected every 10-11 days. Heifers from WR cows in year 1 and a subset of heifers from WR and CR dams in years 2 and 3 were assigned randomly to one of four pens containing Calan individual feeding systems (American Calan, Northwood, N.H.) to evaluate indi-vidual feed efficiency.
After a 30-day adaptation and training period, heifers were individu-ally fed for a minimum of 84 days. Heifers were exposed to ambient tem-perature and light conditions. Three-day consecutive BW were taken at the beginning and end of the feeding period following a five day limit feed-ing period.
Following completion of the in-dividual feeding period in early May each year, heifers returned to GSL.
Heifers were exposed to bulls (1:25; bull:heifer) for 45 days. Estrus was synchronized with a single injection of PGF
2α administered 108 hours after bulls were placed with the heifers. Pregnancy diagnosis was performed via transrectal ultrasonography approximately 45 days following the breeding season.
Statistical Analysis
As treatments were applied on a field basis, winter pasture (n = 4/year) or corn residue field (n = 4/year) were considered the experimental units for heifer performance and reproduc-tive data. In addition, CP was or was not provided to two winter pastures and two corn residue fields per year (n = 4/CP treatment/year). Data were analyzed using PROC MIXED of SAS (SAS Inst., Inc., Cary, N.C.). The sta-tistical model included winter grazing system, CP supplementation, and the interaction. Cow age was included as a covariate for heifer calf data collected until weaning, where it represented a significant source of variation. Pasture nested with the effect of year x grazing treatment x CP treatment was includ-ed as a random variable in all analy-ses. In addition, pen nested within rep x year was included for data collected during and immediately after indi-vidual feeding, including gain, feed efficiency, and first season reproduc-tive data.
Results
Heifer Performance and Reproduction
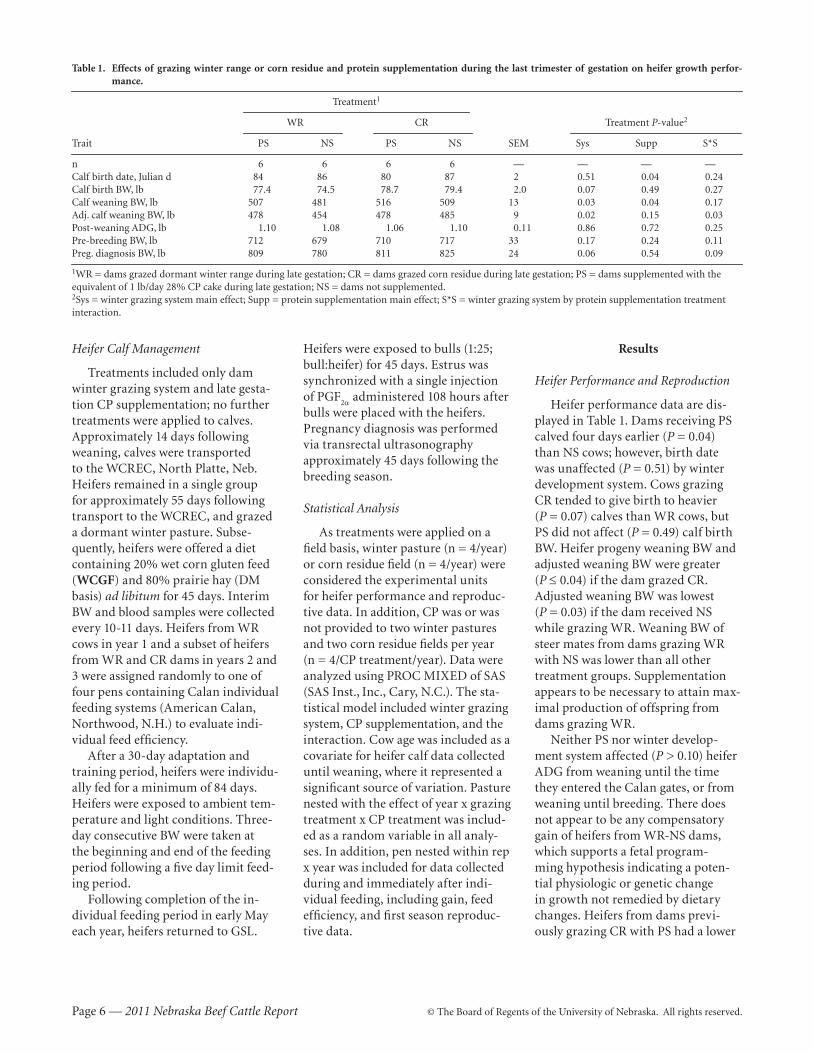
Heifer performance data are dis-played in Table 1. Dams receiving PS calved four days earlier (P = 0.04) than NS cows; however, birth date was unaffected (P = 0.51) by winter development system. Cows grazing CR tended to give birth to heavier (P = 0.07) calves than WR cows, but PS did not affect (P = 0.49) calf birth BW. Heifer progeny weaning BW and adjusted weaning BW were greater (P ≤ 0.04) if the dam grazed CR. Adjusted weaning BW was lowest (P = 0.03) if the dam received NS while grazing WR. Weaning BW of steer mates from dams grazing WR with NS was lower than all other treatment groups. Supplementation appears to be necessary to attain max-imal production of offspring from dams grazing WR.
Neither PS nor winter develop-ment system affected (P > 0.10) heifer ADG from weaning until the time they entered the Calan gates, or from weaning until breeding. There does not appear to be any compensatory gain of heifers from WR-NS dams, which supports a fetal program-ming hypothesis indicating a poten-tial physiologic or genetic change in growth not remedied by dietary changes. Heifers from dams previ-ously grazing CR with PS had a lower
Table 1. Effects of grazing winter range or corn residue and protein supplementation during the last trimester of gestation on heifer growth perfor-mance.
Treatment1
WR CR Treatment P-value2
Trait PS NS PS NS SEM Sys Supp S*S
n 6 6 6 6 — — — —Calf birth date, Julian d 84 86 80 87 2 0.51 0.04 0.24Calf birth BW, lb 77.4 74.5 78.7 79.4 2.0 0.07 0.49 0.27Calf weaning BW, lb 507 481 516 509 13 0.03 0.04 0.17Adj. calf weaning BW, lb 478 454 478 485 9 0.02 0.15 0.03Post-weaning ADG, lb 1.10 1.08 1.06 1.10 0.11 0.86 0.72 0.25Pre-breeding BW, lb 712 679 710 717 33 0.17 0.24 0.11Preg. diagnosis BW, lb 809 780 811 825 24 0.06 0.54 0.09
1WR = dams grazed dormant winter range during late gestation; CR = dams grazed corn residue during late gestation; PS = dams supplemented with the equivalent of 1 lb/day 28% CP cake during late gestation; NS = dams not supplemented. 2Sys = winter grazing system main effect; Supp = protein supplementation main effect; S*S = winter grazing system by protein supplementation treatment interaction.
© The Board of Regents of the University of Nebraska. All rights reserved. 2011 Nebraska Beef Cattle Report — Page 7
(P = 0.03) ADG during the individual feeding period than all other heifers. Pre-breeding BW of WR-NS heifers tended to be lower (P = 0.11) than other treatments. The reduced BW at weaning appears to be maintained to pre-breeding, which agrees with previous research. Post-weaning ADG was similar (P ≥ 0.25) among treat-ments resulting in continued lower (P = 0.09) BW at pregnancy diagnosis for WR-NS heifers, which is similar to previous findings. Steer progeny mates from cows receiving NS during gestation displayed more illness dur-ing post-weaning development than counterparts from PS dams. However, there was no effect (P ≥ 0.21) of winter system or PS on illness between birth and weaning or between weaning and breeding in heifer progeny.
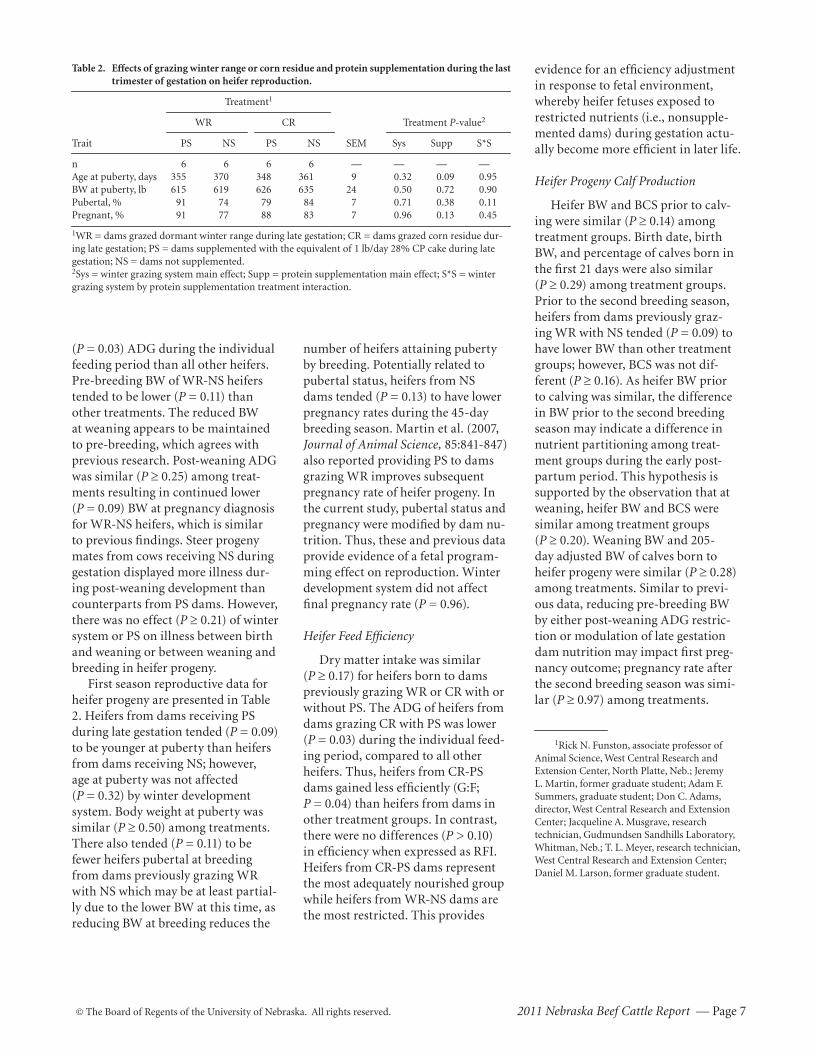
First season reproductive data for heifer progeny are presented in Table 2. Heifers from dams receiving PS during late gestation tended (P = 0.09) to be younger at puberty than heifers from dams receiving NS; however, age at puberty was not affected (P = 0.32) by winter development system. Body weight at puberty was similar (P ≥ 0.50) among treatments. There also tended (P = 0.11) to be fewer heifers pubertal at breeding from dams previously grazing WR with NS which may be at least partial-ly due to the lower BW at this time, as reducing BW at breeding reduces the
number of heifers attaining puberty by breeding . Potentially related to pubertal status, heifers from NS dams tended (P = 0.13) to have lower pregnancy rates during the 45-day breeding season. Martin et al. (2007, Journal of Animal Science, 85:841-847) also reported providing PS to dams grazing WR improves subsequent pregnancy rate of heifer progeny. In the current study, pubertal status and pregnancy were modified by dam nu-trition. Thus, these and previous data provide evidence of a fetal program-ming effect on reproduction. Winter development system did not affect final pregnancy rate (P = 0.96).
Heifer Feed Efficiency
Dry matter intake was similar (P ≥ 0.17) for heifers born to dams previously grazing WR or CR with or without PS. The ADG of heifers from dams grazing CR with PS was lower (P = 0.03) during the individual feed-ing period, compared to all other heifers . Thus, heifers from CR-PS dams gained less efficiently (G:F; P = 0.04) than heifers from dams in other treatment groups. In contrast, there were no differences (P > 0.10) in efficiency when expressed as RFI. Heifers from CR-PS dams represent the most adequately nourished group while heifers from WR-NS dams are the most restricted. This provides
evidence for an efficiency adjustment in response to fetal environment, whereby heifer fetuses exposed to restricted nutrients (i.e., nonsupple-mented dams) during gestation actu-ally become more efficient in later life.
Heifer Progeny Calf Production
Heifer BW and BCS prior to calv-ing were similar (P ≥ 0.14) among treatment groups. Birth date, birth BW, and percentage of calves born in the first 21 days were also similar (P ≥ 0.29) among treatment groups. Prior to the second breeding season, heifers from dams previously graz-ing WR with NS tended (P = 0.09) to have lower BW than other treatment groups; however, BCS was not dif-ferent (P ≥ 0.16). As heifer BW prior to calving was similar, the difference in BW prior to the second breeding season may indicate a difference in nutrient partitioning among treat-ment groups during the early post-partum period. This hypothesis is supported by the observation that at weaning, heifer BW and BCS were similar among treatment groups (P ≥ 0.20). Weaning BW and 205-day adjusted BW of calves born to heifer progeny were similar (P ≥ 0.28) among treatments. Similar to previ-ous data, reducing pre-breeding BW by either post-weaning ADG restric-tion or modulation of late gestation dam nutrition may impact first preg-nancy outcome; pregnancy rate after the second breeding season was simi-lar (P ≥ 0.97) among treatments.
1Rick N. Funston, associate professor of Animal Science, West Central Research and Extension Center, North Platte, Neb.; Jeremy L. Martin, former graduate student; Adam F. Summers, graduate student; Don C. Adams, director, West Central Research and Extension Center; Jacqueline A. Musgrave, research technician, Gudmundsen Sandhills Laboratory, Whitman, Neb.; T. L. Meyer, research technician, West Central Research and Extension Center; Daniel M. Larson, former graduate student.
Table 2. Effects of grazing winter range or corn residue and protein supplementation during the last trimester of gestation on heifer reproduction.
Treatment1
WR CR Treatment P-value2
Trait PS NS PS NS SEM Sys Supp S*S
n 6 6 6 6 — — — —Age at puberty, days 355 370 348 361 9 0.32 0.09 0.95BW at puberty, lb 615 619 626 635 24 0.50 0.72 0.90Pubertal, % 91 74 79 84 7 0.71 0.38 0.11Pregnant, % 91 77 88 83 7 0.96 0.13 0.45
1WR = dams grazed dormant winter range during late gestation; CR = dams grazed corn residue dur-ing late gestation; PS = dams supplemented with the equivalent of 1 lb/day 28% CP cake during late gestation; NS = dams not supplemented. 2Sys = winter grazing system main effect; Supp = protein supplementation main effect; S*S = winter grazing system by protein supplementation treatment interaction.
Page 8 — 2011 Nebraska Beef Cattle Report © The Board of Regents of the University of Nebraska. All rights reserved.
Influencing Steer Performance Through Maternal NutritionAdam F. Summers
Kenneth H. RamsayJim TeichertT.L. Meyer
Rick N. Funston1
Summary
Cows were fed a 28% CP cube at one of two supplement levels, high (HN) or low (LN), while grazing dormant winter range during late gestation to determine the effects of maternal supplementation level on male progeny performance and carcass characteristics. Steer initial BW did not differ between treatments; how-ever, year 1 steers from cows fed higher supplement levels had greater final BW, HCW, marbling scores, and carcass value compared with steers from cows receiving lower supplement levels. Year 2 HN steers had greater proportions grading USDA quality grade modest or greater when compared to steers from both treatments in year 1, but only dif-fered numerically from LN steers from year 2. Steer performance and carcass characteristics were improved in year 1 when dam protein supplementation levels were increased.
Introduction
Providing protein supplementa-tion through winter grazing has been a common practice in the Nebraska Sandhills (2006 Nebraska Beef Cattle Report , pp. 7-9; 2009 Nebraska Beef Cattle Report, pp. 5-8). Late gestation protein supplementation has increased progeny weaning BW (2006 Nebraska Beef Cattle Report, pp. 7-9; 2009 Nebraska Beef Cattle Report, pp. 5-8), improved post-weaning calf health, increased HCW, and increased the proportion of calves grading USDA Choice or greater (2009 Nebraska Beef Report, pp. 5-8). These results indicate maternal nutrition during gestation can influence postnatal growth and health, which is hypothesized as fe-tal programming. The objective of the current study was to evaluate the effects of two dam protein supplemen-tation levels while grazing dormant
Sandhills forage on subsequent steer progeny growth, feed efficiency, and carcass quality.
Procedure
Cow and Calf Management
The University of Nebraska–Lincoln Institutional Animal Care and Use Committee approved the procedures and facilities used in this experiment.
A two-year study was conducted at two units of the Rex Ranch, Ashby, Neb. Spring calving multiparous com-posite beef cows comprised of 50% Red Angus , 25% Simmental, and 25% South Devon or other breeds were managed in a year-round grazing system. Cows were pasture exposed to bulls of similar breeding at each location for 70 days beginning mid-June through August. Forty-five days following the breeding season, pregnancy rates were deter-mined via rectal palpation.
Cows grazed dormant forage pas-tures from November to late February with a protein supplement (28% CP cubes) delivered three times weekly. The supplement offered was 62.0% dried distillers grains plus solubles, 11.0% wheat middlings, 9.0% cot-tonseed meal, 5.0% dried corn gluten feed, 5.0% molasses, 2.0% urea, and 6.0% vitamin and trace mineral pre-mix. The supplement was formulated to meet the vitamin and trace mineral requirements of the cows.
Cows were offered supplement and meadow hay at both locations at the discretion of the manager with cows at one location (year 1 = 754; year 2 = 700) receiving higher levels of supple-ment (HN; 2.62 lb/day year 1; 2.05 lb/day year 2) and cows at the second location (year 1 = 673; year 2 = 766) being fed lower levels of supplement (LN; 0.85 lb/day year 1; 0.94 lb/day year 2). During calving (March and April) cows received meadow hay in the form of large round bales with HN cows receiving 13.9 lb/day in year 1 and 12.0 lb/day in year 2, and LN cows receiving 10.2 and 14.4 lb/day in year 1 and year 2, respectively. After wean-
ing (early to mid-September), calves grazed meadow pasture while receiv-ing 3 lb/day of the CP supplement until shipping (year 1 = Nov. 12; year 2 = Nov. 18).
Steer Calf Management
A random sample of steers from each treatment group (year 1 = 50 HN, 50 LN; year 2 = 50 HN, 50 LN) were shipped approximately 132 miles to the West Central Research and Exten-sion Center, North Platte, Neb. Steers were grouped together in one pen and fed a starter diet (20% CP, DM basis) for five days prior to being weighed on 2 consecutive days to determine ini-tial BW. Implants providing 20 mg of estradiol benzoate and 200 mg proges-terone (Synovex S, Fort Dodge Animal Health, Overland Park, Kan.) were administered at second initial weight collection. Steers were transitioned to a finishing diet (16% CP, DM basis) over a 21 day period. Approximately 100 days prior to slaughter, steers were implanted with 24 mg estradiol and 120 mg trenbolone acetate (Revalor S, Intervet, Millsboro, Del.). Steers were slaughtered at a commercial abattoir 218 days after entering the feedlot. Final BW was calculated from HCW using a common dressing percentage (63%), and carcass data were collected after a 24-hour chill.
To determine the effect of the two supplementation levels on profitability, a partial budget analysis was conduct-ed. Supplementation costs included a delivery charge ($0.03/lb) and were val-ued similar to Larson et al. (2009, Jour-nal of Animal Science, 87: 1147-1155). Meadow hay values were taken from Nebraska state average monthly price based on USDA Agricultural Market-ing Service. Calf sale prices were the Nebraska weighted average feeder cattle price reported for the given year at the time of entry into the feedlot, as reported by the USDA Agricultural Marketing Service. Feedlot ration costs were valued at $0.064/lb and non-feed costs were charged at $0.50/day, including veterinary charges, trucking,
© The Board of Regents of the University of Nebraska. All rights reserved. 2011 Nebraska Beef Cattle Report — Page 9
(Continued on next page)
yardage, and implants. The value of the steer at harvest was based on the Nebraska dressed steer price for the day of harvest, with grid premium and discounts applied as reported by USDA Agricultural Marketing Service. Dif-ferences in partial budget net returns were summarized for the cow-calf and feedlot phases.
Statistical Analysis
Supplementation levels were applied to the dams on a location level (n = 1) during a two-year period ; therefore, location was considered the experi-mental unit for steer performance and carcass data. Data were analyzed using PROC MIXED (SAS Inst. Inc., Cary, N.C.) with a P ≤ 0.10. The statistical model included dam treatment, year, and the inter action. The proportion of steers grading USDA Choice and USDA quality grade of modest or higher were analyzed using χ2 procedures in PROC FREQ of SAS.
Results
Steer Production
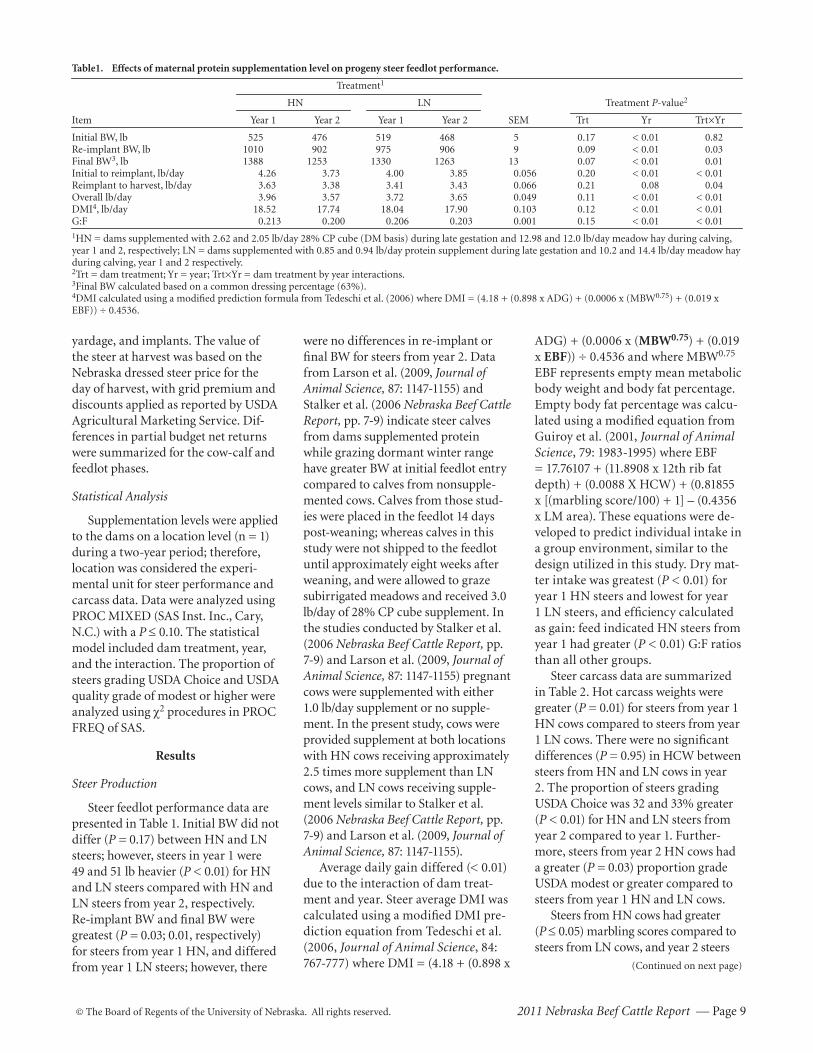
Steer feedlot performance data are presented in Table 1. Initial BW did not differ (P = 0.17) between HN and LN steers; however, steers in year 1 were 49 and 51 lb heavier (P < 0.01) for HN and LN steers compared with HN and LN steers from year 2, respectively. Re-implant BW and final BW were greatest (P = 0.03; 0.01, respectively) for steers from year 1 HN, and differed from year 1 LN steers; however, there
were no differences in re-implant or final BW for steers from year 2. Data from Larson et al. (2009, Journal of Animal Science, 87: 1147-1155) and Stalker et al. (2006 Nebraska Beef Cattle Report, pp. 7-9) indicate steer calves from dams supplemented protein while grazing dormant winter range have greater BW at initial feedlot entry compared to calves from nonsupple-mented cows. Calves from those stud-ies were placed in the feedlot 14 days post-weaning; whereas calves in this study were not shipped to the feedlot until approximately eight weeks after weaning, and were allowed to graze subirrigated meadows and received 3.0 lb/day of 28% CP cube supplement. In the studies conducted by Stalker et al. (2006 Nebraska Beef Cattle Report, pp. 7-9) and Larson et al. (2009, Journal of Animal Science, 87: 1147-1155) pregnant cows were supplemented with either 1.0 lb/day supplement or no supple-ment. In the present study, cows were provided supplement at both locations with HN cows receiving approximately 2.5 times more supplement than LN cows, and LN cows receiving supple-ment levels similar to Stalker et al. (2006 Nebraska Beef Cattle Report, pp. 7-9) and Larson et al. (2009, Journal of Animal Science, 87: 1147-1155).
Average daily gain differed (< 0.01)due to the interaction of dam treat-ment and year. Steer average DMI was calculated using a modified DMI pre-diction equation from Tedeschi et al. (2006, Journal of Animal Science, 84: 767-777) where DMI = (4.18 + (0.898 x
ADG) + (0.0006 x (MBW0.75) + (0.019 x EBF)) ÷ 0.4536 and where MBW0.75 EBF represents empty mean metabolic body weight and body fat percentage. Empty body fat percentage was calcu-lated using a modified equation from Guiroy et al. (2001, Journal of Animal Science, 79: 1983-1995) where EBF = 17.76107 + (11.8908 x 12th rib fat depth) + (0.0088 X HCW) + (0.81855 x [(marbling score/100) + 1] – (0.4356 x LM area). These equations were de-veloped to predict individual intake in a group environment, similar to the design utilized in this study. Dry mat-ter intake was greatest (P < 0.01) for year 1 HN steers and lowest for year 1 LN steers, and efficiency calculated as gain: feed indicated HN steers from year 1 had greater (P < 0.01) G:F ratios than all other groups.
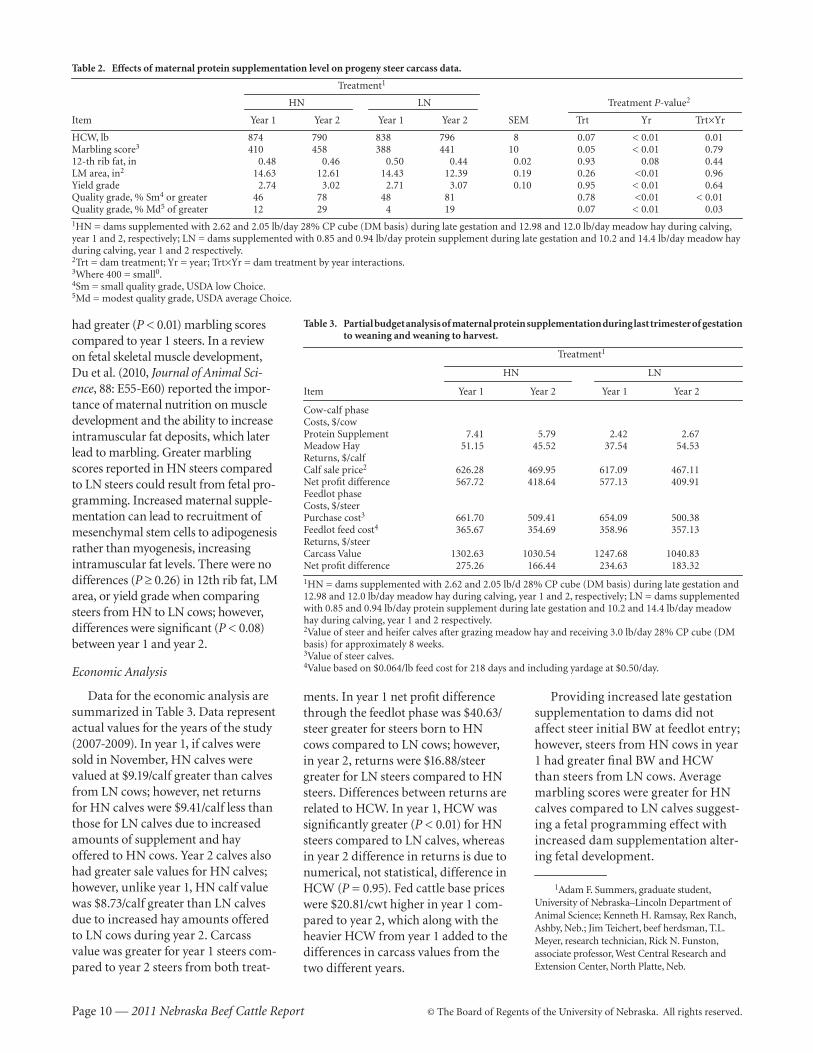
Steer carcass data are summarized in Table 2. Hot carcass weights were greater (P = 0.01) for steers from year 1 HN cows compared to steers from year 1 LN cows. There were no significant differences (P = 0.95) in HCW between steers from HN and LN cows in year 2. The proportion of steers grading USDA Choice was 32 and 33% greater (P < 0.01) for HN and LN steers from year 2 compared to year 1. Further-more, steers from year 2 HN cows had a greater (P = 0.03) proportion grade USDA modest or greater compared to steers from year 1 HN and LN cows.
Steers from HN cows had greater (P ≤ 0.05) marbling scores compared to steers from LN cows, and year 2 steers
Table1. Effects of maternal protein supplementation level on progeny steer feedlot performance.
Treatment1
HN LN Treatment P-value2
Item Year 1 Year 2 Year 1 Year 2 SEM Trt Yr Trt×Yr
Initial BW, lb 525 476 519 468 5 0.17 < 0.01 0.82Re-implant BW, lb 1010 902 975 906 9 0.09 < 0.01 0.03Final BW3, lb 1388 1253 1330 1263 13 0.07 < 0.01 0.01Initial to reimplant, lb/day 4.26 3.73 4.00 3.85 0.056 0.20 < 0.01 < 0.01Reimplant to harvest, lb/day 3.63 3.38 3.41 3.43 0.066 0.21 0.08 0.04Overall lb/day 3.96 3.57 3.72 3.65 0.049 0.11 < 0.01 < 0.01DMI4, lb/day 18.52 17.74 18.04 17.90 0.103 0.12 < 0.01 < 0.01G:F 0.213 0.200 0.206 0.203 0.001 0.15 < 0.01 < 0.011HN = dams supplemented with 2.62 and 2.05 lb/day 28% CP cube (DM basis) during late gestation and 12.98 and 12.0 lb/day meadow hay during calving, year 1 and 2, respectively; LN = dams supplemented with 0.85 and 0.94 lb/day protein supplement during late gestation and 10.2 and 14.4 lb/day meadow hay during calving, year 1 and 2 respectively.2Trt = dam treatment; Yr = year; Trt×Yr = dam treatment by year interactions.3Final BW calculated based on a common dressing percentage (63%).4DMI calculated using a modified prediction formula from Tedeschi et al. (2006) where DMI = (4.18 + (0.898 x ADG) + (0.0006 x (MBW0.75) + (0.019 x EBF)) ÷ 0.4536.
Page 10 — 2011 Nebraska Beef Cattle Report © The Board of Regents of the University of Nebraska. All rights reserved.
had greater (P < 0.01) marbling scores compared to year 1 steers. In a review on fetal skeletal muscle development, Du et al. (2010, Journal of Animal Sci-ence, 88: E55-E60) reported the impor-tance of maternal nutrition on muscle development and the ability to increase intramuscular fat deposits, which later lead to marbling. Greater marbling scores reported in HN steers compared to LN steers could result from fetal pro-gramming. Increased maternal supple-mentation can lead to recruitment of mesenchymal stem cells to adipogenesis rather than myogenesis, increasing intramuscular fat levels. There were no differences (P ≥ 0.26) in 12th rib fat, LM area, or yield grade when comparing steers from HN to LN cows; however, differences were significant (P < 0.08) between year 1 and year 2.
Economic Analysis
Data for the economic analysis are summarized in Table 3. Data represent actual values for the years of the study (2007-2009). In year 1, if calves were sold in November, HN calves were valued at $9.19/calf greater than calves from LN cows; however, net returns for HN calves were $9.41/calf less than those for LN calves due to increased amounts of supplement and hay offered to HN cows. Year 2 calves also had greater sale values for HN calves; however, unlike year 1, HN calf value was $8.73/calf greater than LN calves due to increased hay amounts offered to LN cows during year 2. Carcass value was greater for year 1 steers com-pared to year 2 steers from both treat-
ments. In year 1 net profit difference through the feedlot phase was $40.63/steer greater for steers born to HN cows compared to LN cows; however, in year 2, returns were $16.88/steer greater for LN steers compared to HN steers. Differences between returns are related to HCW. In year 1, HCW was significantly greater (P < 0.01) for HN steers compared to LN calves, whereas in year 2 difference in returns is due to numerical, not statistical, difference in HCW (P = 0.95). Fed cattle base prices were $20.81/cwt higher in year 1 com-pared to year 2, which along with the heavier HCW from year 1 added to the differences in carcass values from the two different years.
Providing increased late gestation supplementation to dams did not affect steer initial BW at feedlot entry ; however, steers from HN cows in year 1 had greater final BW and HCW than steers from LN cows. Average marbling scores were greater for HN calves compared to LN calves suggest-ing a fetal programming effect with increased dam supplementation alter-ing fetal development.
1Adam F. Summers, graduate student, University of Nebraska–Lincoln Department of Animal Science; Kenneth H. Ramsay, Rex Ranch, Ashby, Neb.; Jim Teichert, beef herdsman, T.L. Meyer, research technician, Rick N. Funston, associate professor, West Central Research and Extension Center, North Platte, Neb.
Table 2. Effects of maternal protein supplementation level on progeny steer carcass data.
Treatment1
HN LN Treatment P-value2
Item Year 1 Year 2 Year 1 Year 2 SEM Trt Yr Trt×Yr
HCW, lb 874 790 838 796 8 0.07 < 0.01 0.01Marbling score3 410 458 388 441 10 0.05 < 0.01 0.7912-th rib fat, in 0.48 0.46 0.50 0.44 0.02 0.93 0.08 0.44LM area, in2 14.63 12.61 14.43 12.39 0.19 0.26 <0.01 0.96Yield grade 2.74 3.02 2.71 3.07 0.10 0.95 < 0.01 0.64Quality grade, % Sm4 or greater 46 78 48 81 0.78 <0.01 < 0.01Quality grade, % Md5 of greater 12 29 4 19 0.07 < 0.01 0.031HN = dams supplemented with 2.62 and 2.05 lb/day 28% CP cube (DM basis) during late gestation and 12.98 and 12.0 lb/day meadow hay during calving, year 1 and 2, respectively; LN = dams supplemented with 0.85 and 0.94 lb/day protein supplement during late gestation and 10.2 and 14.4 lb/day meadow hay during calving, year 1 and 2 respectively.2Trt = dam treatment; Yr = year; Trt×Yr = dam treatment by year interactions.3Where 400 = small0.4Sm = small quality grade, USDA low Choice.5Md = modest quality grade, USDA average Choice.
Table 3. Partial budget analysis of maternal protein supplementation during last trimester of gestation to weaning and weaning to harvest.
Treatment1
HN LN
Item Year 1 Year 2 Year 1 Year 2
Cow-calf phaseCosts, $/cowProtein Supplement 7.41 5.79 2.42 2.67Meadow Hay 51.15 45.52 37.54 54.53Returns, $/calf Calf sale price2 626.28 469.95 617.09 467.11Net profit difference 567.72 418.64 577.13 409.91Feedlot phase Costs, $/steer Purchase cost3 661.70 509.41 654.09 500.38Feedlot feed cost4 365.67 354.69 358.96 357.13Returns, $/steer Carcass Value 1302.63 1030.54 1247.68 1040.83Net profit difference 275.26 166.44 234.63 183.32
1HN = dams supplemented with 2.62 and 2.05 lb/d 28% CP cube (DM basis) during late gestation and 12.98 and 12.0 lb/day meadow hay during calving, year 1 and 2, respectively; LN = dams supplemented with 0.85 and 0.94 lb/day protein supplement during late gestation and 10.2 and 14.4 lb/day meadow hay during calving, year 1 and 2 respectively.2Value of steer and heifer calves after grazing meadow hay and receiving 3.0 lb/day 28% CP cube (DM basis) for approximately 8 weeks.3Value of steer calves.4Value based on $0.064/lb feed cost for 218 days and including yardage at $0.50/day.
© The Board of Regents of the University of Nebraska. All rights reserved. 2011 Nebraska Beef Cattle Report — Page 11
(Continued on next page)
Integration of DNA Marker Informationinto Breeding Value Predictions
Matthew L. SpanglerStephen D. KachmanKathryn J. Hanford
Mark ThallmanGary L. BennettWarren Snelling
Larry KuehnJohn Pollak1
Summary
Calves from 20 herds representing seven breeds were genotyped with a reduced DNA marker panel for wean-ing weight. The marker panel used was derived using MARC Cycle VII animals. The results suggest marker effects based on this small panel are not robust across breeds and that methodology exists to integrate genomic information into the prediction of breeding values in a single breed context.
Introduction
Currently, several commer-cial DNA tests (marker panels) are available for complex traits. In the fall of 2009, the American Angus Association integrated the results of an Angus-specific marker panel from a single commercial company into their national cattle evalua-tion for carcass traits. Despite this advancement, there still exists tre-mendous confusion by producers as to the efficacy of DNA diagnostics within and across breeds. The Weight Trait Project (WTP) was designed to address issues associated with creating and implementing DNA-based selection in conjunction with expected progeny differences (EPDs). The WTP is a unified effort among researchers, breed associations, seed-stock producers, and a DNA testing company to improve the process of developing and validating DNA tests and to investigate the infrastructure necessary for the flow of information
needed to deliver Marker-Assisted EPDs to producers. Consequently, the objectives of the current study were to illustrate methodology for incor-porating DNA marker information into breeding value predictions for the trait of weaning weight, and develop mechanisms for disseminating this information to producers.
Procedure
Single nucleotide polymorphisms (SNPs), the smallest change in DNA sequence, for weaning weight were identified through an association study of markers on the Illumina 50K assay with weight traits collected at the U.S. Meat Animal Research Cen-ter (USMARC). The Ilumina assay provides the opportunity to detect DNA variations at more than 50,000 locations across the cattle genome.
Weaning weight records (N = 3,328) of calves from the fol-lowing populations were used in the selection at USMARC of SNPs associated with adjusted weaning weight. The total pedigree included 5,222 animals. Of the 3,328 calves in the training population , the average breed contributions were 26% Angus, 19% Hereford, and 6.5% each of Red Angus, Simmental, Charolais, Limou-sin, and Gelbvieh. Thus, the effective number of animals contributing to training by breed were 871 Angus, 632 Hereford, and 215 each of Red Angus, Simmental, Charolais, Limousin, and Gelbvieh.
Breed associations representing the seven breeds (Table 1) in the USMARC Cycle VII population identified seedstock producers in the region surrounding USMARC to provide DNA samples (hair follicles from the tail switch) from calves born in the 2009 calf crop and their dams. A reduced panel of 192 SNPs was constructed based on the most significant SNPs from the USMARC
association analysis with the addi-tion of 192 SNPs from IGENITY® (96 trained on yearling weight in an Angus population and the other 96 from the IGENITY parentage panel). In total, the reduced panel consisted of 384 SNPs. IGENITY served as the genetic service provider partner in this project and genotyped animals with the reduced panel. After editing SNPs based on deviation from Hardy-Weinberg Equilibrium (a statistical criterion based on expected genotype frequencies), and call rates, a total of 159 of the diagnostic SNPs (not parentage) were used in the analysis. The population included over 19,000 animals from 20 seedstock enterprises and four university herds. Bull calves (n = 3,500) were genotyped with the reduced panel, and molecular breed-ing values (MBVs) were calculated based on prediction equations derived at USMARC for weaning weight (WW) and post-weaning gain (PWG). Data, including a four-generation pedigree, adjusted weaning weight phenotypes, and pedigree index EPDs were obtained from the respective breed associations for each herd in the project. MBVs were fit as a correlated trait in both two- and three-trait animal models. Contemporary group effects included herd and sex of calf. Weaning weight was fit with both a direct and maternal component while MBVs were assumed to have only a direct genetic component.
Results
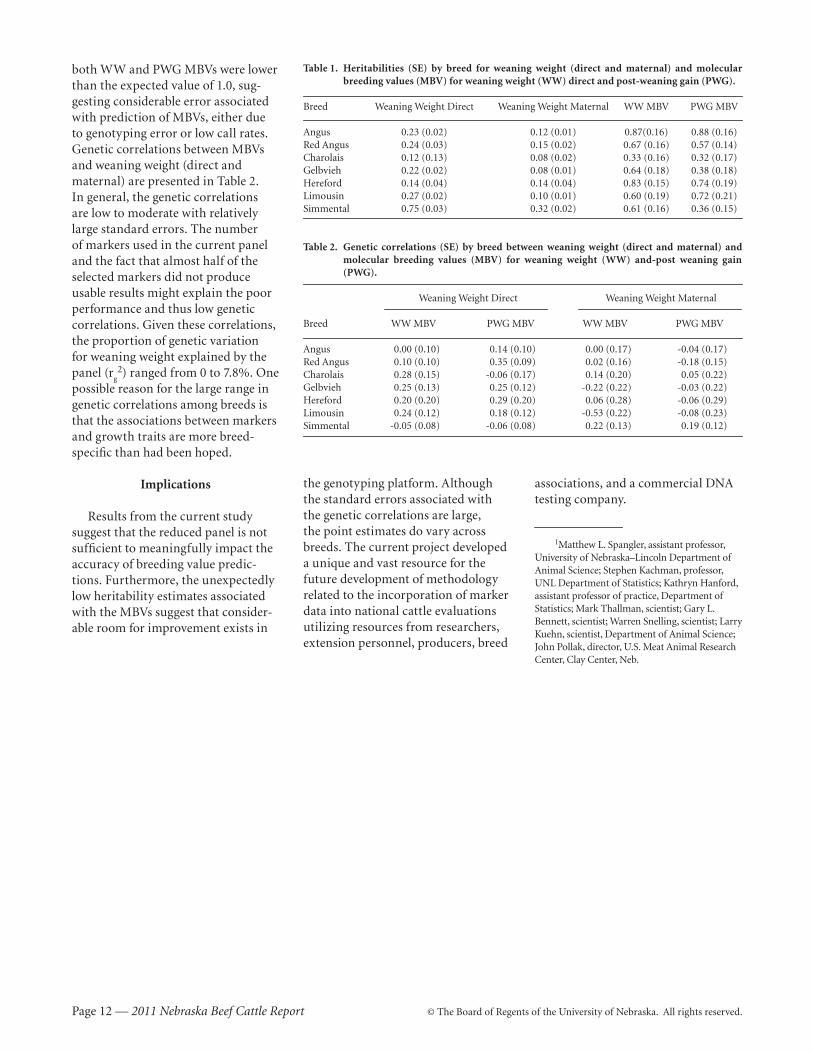
Heritabilities for weaning weight (direct and maternal) and MBVs (WW and PWG) by breed are summa-rized in Table 1. In general, the heri-tability estimates for WW direct were within expected ranges except for Simmental, which is likely due to the data structure of the Simmental herds in this study. Heritability estimates for
Page 12 — 2011 Nebraska Beef Cattle Report © The Board of Regents of the University of Nebraska. All rights reserved.
both WW and PWG MBVs were lower than the expected value of 1.0, sug-gesting considerable error associated with prediction of MBVs, either due to genotyping error or low call rates. Genetic correlations between MBVs and weaning weight (direct and maternal) are presented in Table 2. In general, the genetic correlations are low to moderate with relatively large standard errors. The number of markers used in the current panel and the fact that almost half of the selected markers did not produce usable results might explain the poor performance and thus low genetic correlations. Given these correlations, the proportion of genetic variation for weaning weight explained by the panel (r
g2) ranged from 0 to 7.8%. One
possible reason for the large range in genetic correlations among breeds is that the associations between markers and growth traits are more breed-specific than had been hoped.
Implications
Results from the current study suggest that the reduced panel is not sufficient to meaningfully impact the accuracy of breeding value predic-tions. Furthermore, the unexpectedly low heritability estimates associated with the MBVs suggest that consider-able room for improvement exists in
Table 1. Heritabilities (SE) by breed for weaning weight (direct and maternal) and molecular breeding values (MBV) for weaning weight (WW) direct and post-weaning gain (PWG).
Breed Weaning Weight Direct Weaning Weight Maternal WW MBV PWG MBV
Angus 0.23 (0.02) 0.12 (0.01) 0.87(0.16) 0.88 (0.16)Red Angus 0.24 (0.03) 0.15 (0.02) 0.67 (0.16) 0.57 (0.14)Charolais 0.12 (0.13) 0.08 (0.02) 0.33 (0.16) 0.32 (0.17)Gelbvieh 0.22 (0.02) 0.08 (0.01) 0.64 (0.18) 0.38 (0.18)Hereford 0.14 (0.04) 0.14 (0.04) 0.83 (0.15) 0.74 (0.19)Limousin 0.27 (0.02) 0.10 (0.01) 0.60 (0.19) 0.72 (0.21)Simmental 0.75 (0.03) 0.32 (0.02) 0.61 (0.16) 0.36 (0.15)
Table 2. Genetic correlations (SE) by breed between weaning weight (direct and maternal) and molecular breeding values (MBV) for weaning weight (WW) and-post weaning gain (PWG).
Weaning Weight Direct Weaning Weight Maternal
Breed WW MBV PWG MBV WW MBV PWG MBV
Angus 0.00 (0.10) 0.14 (0.10) 0.00 (0.17) -0.04 (0.17)Red Angus 0.10 (0.10) 0.35 (0.09) 0.02 (0.16) -0.18 (0.15)Charolais 0.28 (0.15) -0.06 (0.17) 0.14 (0.20) 0.05 (0.22)Gelbvieh 0.25 (0.13) 0.25 (0.12) -0.22 (0.22) -0.03 (0.22)Hereford 0.20 (0.20) 0.29 (0.20) 0.06 (0.28) -0.06 (0.29)Limousin 0.24 (0.12) 0.18 (0.12) -0.53 (0.22) -0.08 (0.23)Simmental -0.05 (0.08) -0.06 (0.08) 0.22 (0.13) 0.19 (0.12)
the genotyping platform. Although the standard errors associated with the genetic correlations are large, the point estimates do vary across breeds. The current project developed a unique and vast resource for the future development of methodology related to the incorporation of marker data into national cattle evaluations utilizing resources from researchers, extension personnel, producers, breed
associations, and a commercial DNA testing company.
1Matthew L. Spangler, assistant professor, University of Nebraska–Lincoln Department of Animal Science; Stephen Kachman, professor, UNL Department of Statistics; Kathryn Hanford, assistant professor of practice, Department of Statistics; Mark Thallman, scientist; Gary L. Bennett, scientist; Warren Snelling, scientist; Larry Kuehn, scientist, Department of Animal Science; John Pollak, director, U.S. Meat Animal Research Center, Clay Center, Neb.
© The Board of Regents of the University of Nebraska. All rights reserved. 2011 Nebraska Beef Cattle Report — Page 13
Granulosa Cell Gene Expression is Altered in Folliclesfrom Cows with Differing Reproductive Longevity
Andrea S. CuppJennifer R. Wood
Renee McFeeRacheal G. Slattery
Kevin A. BeaversWilliam E. Pohlmeier
Kevin M. SargentNingxia Lu
Jacqueline E. SmithJill G. Kerl
Vanessa M. BrauerAdam F. SummersStetson P. Weber
Robert A. Cushman1
Summary
Heifers and cows that were culled from the herd due to failure to become pregnant were categorized into groups with low (< 2 year), moderate (>2 and < 6 year) or high (≥ 6 year) fertility. Antral follicle counts were numerically lower in the low group and increased in the moderate- and high-fertility group. Granulosa cells from dominant follicles in moderate- and high-fertility cows had a greater ratio of Vascular Endo thelial Growth Factor 164 (VEGF164) to VEGF164B compared to the low-fertility cows. Furthermore, there was more CARTPT in granulosa cells from sub-ordinate follicles in moderate- and high-fertility cows than low. Gene expression is altered in granulosa cells from cows differing in fertility, suggesting these are candidate genes that may be used as markers to assist in determining repro-ductive longevity in beef cows.
Introduction
Cows that stay in the herd longer and continue to produce a calf have greater reproductive longevity. While we may be able to predict reproductive longevity by a combination of number of antral follicles on the ovary, ovar-ian size, and reproductive tract score, there are no conclusive genetic or
phenotypic markers of reproductive fertility in beef cattle. The long-term goal is to develop markers of repro-ductive longevity that may be imple-mented prior to selecting replacement heifers. A first step for this goal is to determine what genes are altered in granulosa cells (cells that communi-cate with and support egg maturation) to determine how ovarian follicle development (and development of the egg) may differ in cows culled from the herd at different ages due to preg-nancy failure.
Procedure
All procedures were approved by the University of Nebraska–Lincoln Institutional Animal Care and Use Committee (IACUC).
Beef cows ranging in age from 1.5 to 11 years were synchronized with a modified Co-Synch proto-col, and upon CIDR removal were injected with Lutalyse, and ovaries were removed by flank laparotomy (surgical incision) 36 hours later to obtain dominant and subordinate follicles prior to ovulation. Ovaries
were weighed, measured for length and width, and all visible surface fol-licles were counted. Granulosa cells were collected and extracted for RNA. Quantitative Polymerase Chain Reac-tion (QPCR) was conducted to deter-mine expression of genes known to influence follicle growth (VEGF164), follicle arrest (VEGF164B), and atresia (CARTPT). The expression of these genes was also correlated to follicle diameter (another potential biomark-er of fertility).
Results
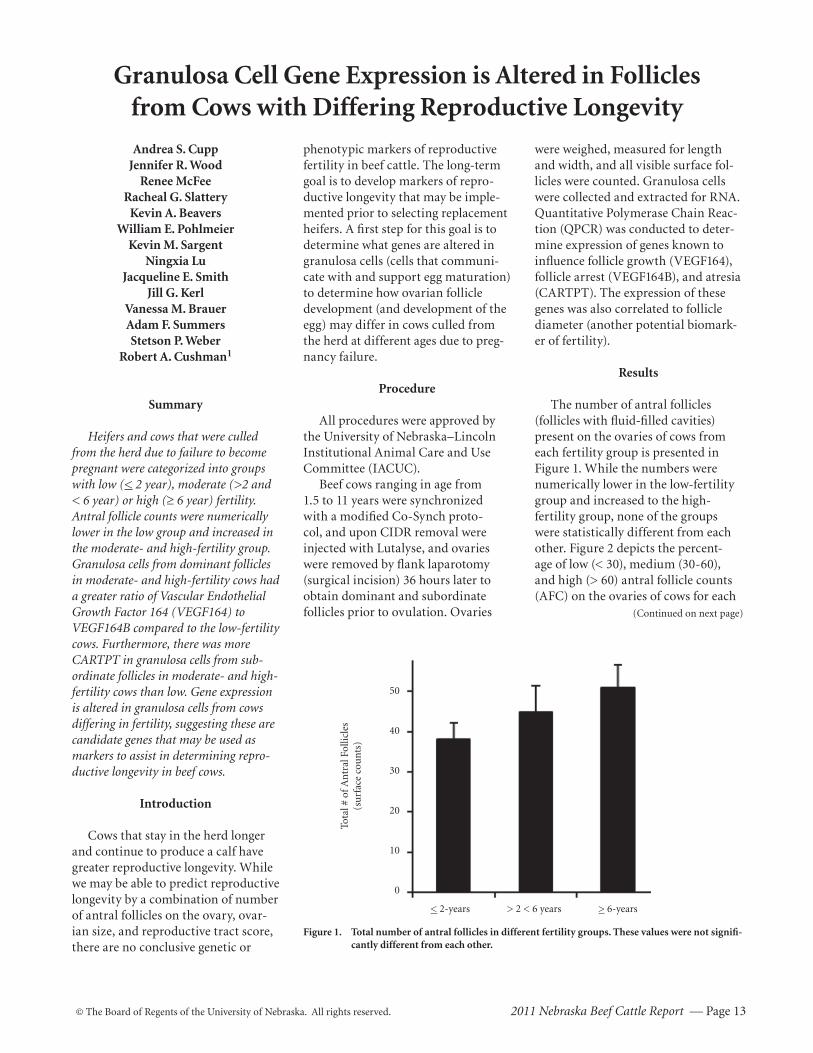
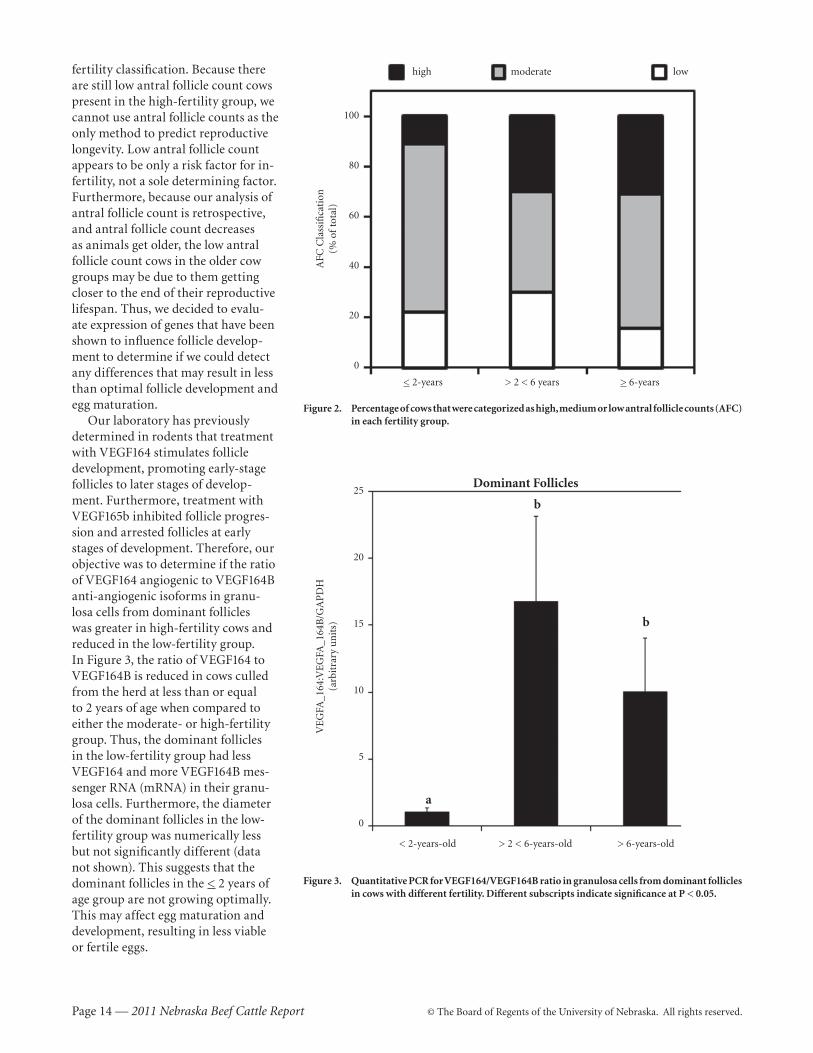
The number of antral follicles (follicles with fluid-filled cavities) present on the ovaries of cows from each fertility group is presented in Figure 1. While the numbers were numerically lower in the low-fertility group and increased to the high-fertility group, none of the groups were statistically different from each other. Figure 2 depicts the percent-age of low (< 30), medium (30-60), and high (> 60) antral follicle counts (AFC) on the ovaries of cows for each
(Continued on next page)
< 2-years > 2 < 6 years > 6-years
Figure 1. Total number of antral follicles in different fertility groups. These values were not signifi-cantly different from each other.
50
40
30
20
10
0
Tota
l # o
f A
ntr
al F
ollic
les
(su
rfac
e co
un
ts)
Page 14 — 2011 Nebraska Beef Cattle Report © The Board of Regents of the University of Nebraska. All rights reserved.
fertility classification. Because there are still low antral follicle count cows present in the high-fertility group, we cannot use antral follicle counts as the only method to predict reproductive longevity. Low antral follicle count appears to be only a risk factor for in-fertility, not a sole determining factor. Furthermore, because our analysis of antral follicle count is retrospective, and antral follicle count decreases as animals get older, the low antral follicle count cows in the older cow groups may be due to them getting closer to the end of their reproductive lifespan. Thus, we decided to evalu-ate expression of genes that have been shown to influence follicle develop-ment to determine if we could detect any differences that may result in less than optimal follicle development and egg maturation.
Our laboratory has previously determined in rodents that treatment with VEGF164 stimulates follicle development, promoting early-stage follicles to later stages of develop-ment. Furthermore, treatment with VEGF165b inhibited follicle progres-sion and arrested follicles at early stages of development. Therefore, our objective was to determine if the ratio of VEGF164 angiogenic to VEGF164B anti-angiogenic isoforms in granu-losa cells from dominant follicles was greater in high-fertility cows and reduced in the low-fertility group. In Figure 3, the ratio of VEGF164 to VEGF164B is reduced in cows culled from the herd at less than or equal to 2 years of age when compared to either the moderate- or high-fertility group. Thus, the dominant follicles in the low-fertility group had less VEGF164 and more VEGF164B mes-senger RNA (mRNA) in their granu-losa cells. Furthermore, the diameter of the dominant follicles in the low-fertility group was numerically less but not significantly different (data not shown). This suggests that the dominant follicles in the < 2 years of age group are not growing optimally. This may affect egg maturation and development, resulting in less viable or fertile eggs.
Figure 2. Percentage of cows that were categorized as high, medium or low antral follicle counts (AFC) in each fertility group.
high moderate low
100
80
60
40
20
0
AFC
Cla
ssifi
cati
on(%
of
tota
l)
< 2-years > 2 < 6 years > 6-years
Figure 3. Quantitative PCR for VEGF164/VEGF164B ratio in granulosa cells from dominant follicles in cows with different fertility. Different subscripts indicate significance at P < 0.05.
Dominant Follicles25
20
15
10
5
0
VE
GFA
_164
:VE
GFA
_164
B/G
AP
DH
(arb
itra
ry u
nit
s)
a
b
b
< 2-years-old > 2 < 6-years-old > 6-years-old
© The Board of Regents of the University of Nebraska. All rights reserved. 2011 Nebraska Beef Cattle Report — Page 15
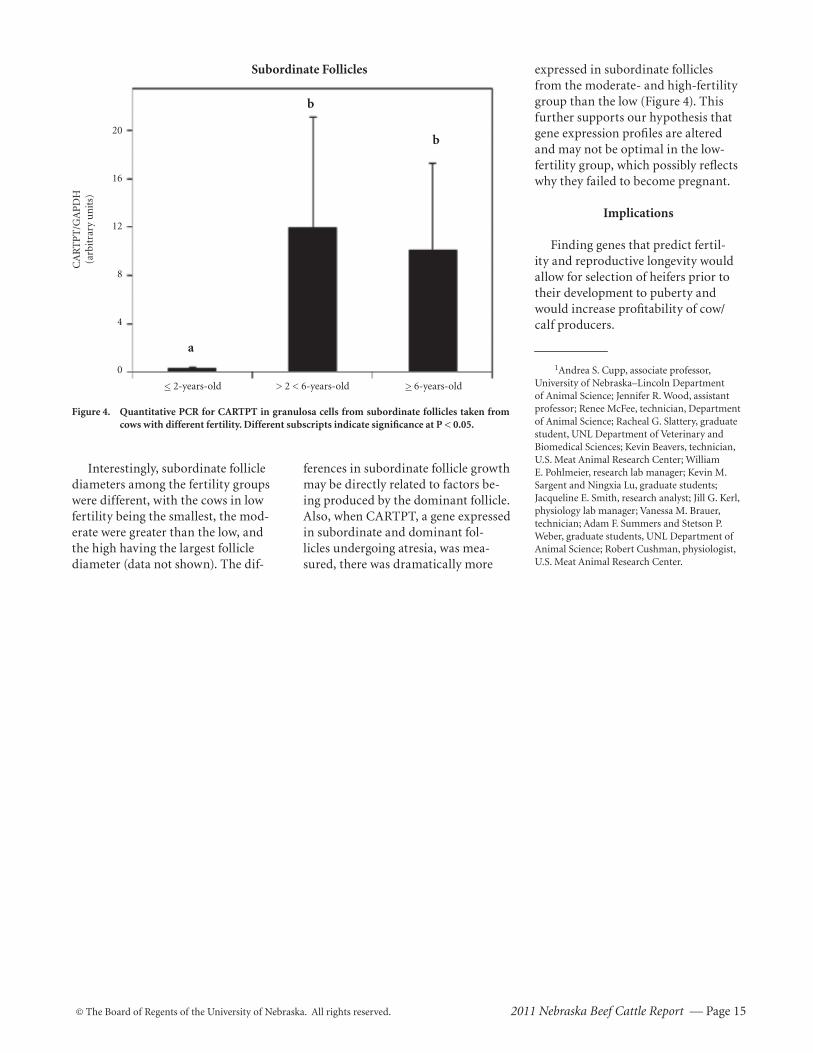
expressed in subordinate follicles from the moderate- and high-fertility group than the low (Figure 4). This further supports our hypothesis that gene expression profiles are altered and may not be optimal in the low-fertility group, which possibly reflects why they failed to become pregnant.
Implications
Finding genes that predict fertil-ity and reproductive longevity would allow for selection of heifers prior to their development to puberty and would increase profitability of cow/calf producers.
1Andrea S. Cupp, associate professor, University of Nebraska–Lincoln Department of Animal Science; Jennifer R. Wood, assistant professor; Renee McFee, technician, Department of Animal Science; Racheal G. Slattery, graduate student, UNL Department of Veterinary and Biomedical Sciences; Kevin Beavers, technician, U.S. Meat Animal Research Center; William E. Pohlmeier, research lab manager; Kevin M. Sargent and Ningxia Lu, graduate students; Jacqueline E. Smith, research analyst; Jill G. Kerl, physiology lab manager; Vanessa M. Brauer, technician; Adam F. Summers and Stetson P. Weber, graduate students, UNL Department of Animal Science; Robert Cushman, physiologist, U.S. Meat Animal Research Center.
< 2-years-old > 2 < 6-years-old > 6-years-old
Figure 4. Quantitative PCR for CARTPT in granulosa cells from subordinate follicles taken from cows with different fertility. Different subscripts indicate significance at P < 0.05.
Subordinate Follicles
20
16
12
8
4
0
CA
RT
PT
/GA
PD
H(a
rbit
rary
un
its)
a
b
b
Interestingly, subordinate follicle diameters among the fertility groups were different, with the cows in low fertility being the smallest, the mod-erate were greater than the low, and the high having the largest follicle diameter (data not shown). The dif-
ferences in subordinate follicle growth may be directly related to factors be-ing produced by the dominant follicle. Also, when CARTPT, a gene expressed in subordinate and dominant fol-licles undergoing atresia, was mea-sured, there was dramatically more
Page 16 — 2011 Nebraska Beef Cattle Report © The Board of Regents of the University of Nebraska. All rights reserved.
Performance of Growing Cattle Fed Corn Silageor Grazing Corn Residue from Second Generation
Insect-Protected (MON 89034), Parental, orReference Corn Hybrids
Barry M. WeberBrandon L. Nuttelman
William A. GriffinJosh R. Benton
Galen E. EricksonTerry J. Klopfenstein1
Summary
Effects of feeding second generation insect-protected transgenic corn (MON 89034) on growing steer performance was evaluated in two experiments. In Experiment 1, a corn silage-based diet was fed to growing steers in pens, and the transgenic test hybrid was compared to a non-transgenic parental hybrid and two commercially available reference hybrids. In Experiment 2, steers grazing corn resi-due of the transgenic test hybrid were com-pared to steers grazing a non-transgenic parental hybrid. In both experiments, growing performance was not affected by source of corn silage or residue.
Introduction
Given that the majority of domestic corn production is used for livestock feed and the highest percentage is fed to feedlot cattle, it is important for producers to know if cattle perform similarly when fed transgenic corn compared to non-transgenic corn. Furthermore, it is also essential to see comparable results when grazing transgenic crop residue or feeding transgenic silage in growing situa-tions.
The objective of Experiment 1 was to compare the performance of grow-ing steers fed second generation insect-protected corn silage (MON 89034) with the non-transgenic parental hybrid (DKC 63-78) and two non-transgenic reference hybrids (DKC 61-42 and DKC 62-30). The objective of Experiment 2 was to compare the performance
of steers grazing the insect-protected (MON 89034) corn residue with that of steers grazing the non-transgenic paren-tal hybrid (DKC 63-78).
Procedure
Experiment 1
Animals. Crossbred British x Con-tinental steers (n = 240; initial BW = 614 ± 44 lb) were used in a ran-domized complete block design ex-periment. Steers were received at the University of Nebraska Agricultural Development and Research Center (Ithaca, Neb.) during the fall of 2009. Steers were weighed and vaccinated (Bovishield Gold 5, Somubac, Decto-max) and treated with Micotil (Elanco Animal Health) on arrival. Following a 14- to 21-day receiving period , steers were limit fed five days to minimize variation in rumen fill. The limit fed ration contained a 1:1 ratio of wet corn gluten feed and alfalfa hay fed
at 2% BW. Steers were weighed in-dividually on two consecutive days in the morning before feeding to obtain an accurate initial BW. Steers were blocked by BW, stratified within block, and assigned randomly to 1 of 20 pens based on day 0 BW. Pens were then assigned randomly to one of four treatments. Diets for each treatment are shown in Table 1.
Treatments. Treatments consisted of two reference hybrids, a non-transgenic parental hybrid, and the second-generation Bt hybrid (MON 89034). All corn was grown at the Agricultural Research and Develop-ment Center near Ithaca, Neb., un-der identity preserved methods. All hybrids were cut for silage at similar moisture levels (34.2% DM ± 2.1%) and stored in silo bags by hybrid. Samples of all hybrids were collected and sent to Monsanto Company, where the presence or absence of the genes was verified.
Table 1. Growing Diet Composition (%DM).1
Ingredient MON PAR REF1 REF2
Corn silage W 80.0Corn silage X 80.0Corn silage Y 80.0 Corn silage Z 80.0WDGS 15.0 15.0 15.0 15.0Supplement2
Fine ground milo 3.006 3.006 3.006 3.006 Limestone 0.916 0.916 0.916 0.916 Salt 0.300 0.300 0.300 0.300 Urea 0.574 0.574 0.574 0.574 Tallow 0.125 0.125 0.125 0.125 Trace mineral 0.050 0.050 0.050 0.050 Vitamin A-D-E 0.015 0.015 0.015 0.015 Rumensin-80 0.014 0.014 0.014 0.014Nutrient composition CP 13.3 12.6 12.7 13.4 NDF 39.4 35.7 33.0 36.3 Ca 0.67 0.53 0.54 0.70 P 0.28 0.27 0.27 0.36 K 0.78 0.78 0.89 0.82
1REF1 = reference hybrid DKC 61-42, REF2 = reference hybrid DKC 62-30, PAR = non-transgenic parental hybrid, MON = corn silage containing Cry1A.105 and Cry2Ab2 proteins (MON 89034).2Formulated to provide 200mg/head/day.
© The Board of Regents of the University of Nebraska. All rights reserved. 2011 Nebraska Beef Cattle Report — Page 17
Prior to experiment initiation, corn silage samples were collected and sent to a commercial laboratory (Romer Labs, Union, Mo.) to test for the presence of mycotoxins. Small amounts of Deoxynivalenol (Vomi-toxin) and Zearalenone were found in the test hybrid (MON) and the non-transgenic parental hybrid (PAR) silage. In all samples, the amount of mycotoxins present was well below the level for concern. Ingredient and diet samples were collected weekly, composited by month, and sent to a commercial laboratory (Dairy One, Ithaca, N.Y.) for nutrient analysis.
Data were analyzed using the MIXED procedures of SAS (SAS Institute, Cary, N.C.). Pens were the experimental unit (5/treatment). Block was treated as a fixed effect in the model. Only one replication was included in the heavy block, with four replications in the other weight block. Data were analyzed and statistics are based on this analysis. However, least square means are not presented due to adjustment for unequal replication of blocks. Arithmetic means are pre-sented by treatment (Table 2).
The study was blind to feedlot personnel. Each hybrid was assigned a letter before beginning the trial. All treatments, silage bags, pen assign-ments, feed sheets, and observation documents were designated by letter to limit possible partiality to treatment.
Experiment 2
Animals. Crossbred British x Continental steers (n = 64; initial BW = 549 ± 17 lb) were used in a completely randomized design ex-periment. Prior to initiation of the trial, steers were limit fed five days to minimize variation in rumen fill (1:1 blend of wet corn gluten feed and alfalfa hay at 2% BW). Individual weights were taken on two consecu-tive days in the morning before feed-ing to obtain an accurate initial BW. Steers were stratified by BW recorded on day 0 and assigned randomly to a paddock (8 steers/paddock) and treat-ment. Steers were fed a supplement (2.5 lb/steer daily) formulated to meet protein requirements. The supple-ment was dry distillers grain-based (93.8%) and included limestone, tal-low, Rumensin -80, trace minerals, selenium, and vitamin A-D-E.
Treatments. Treatments consisted of two 30.7-acre fields separated into four 7.7-acre paddocks per field. The fields consisted of corn crop residue from either the second generation insect-protected corn (MON 89034) or the non-transgenic parental hybrid (DKC 63-78).
Residual corn from each paddock was estimated by sampling three ran-dom 300 x 2.5 ft strips. Whole and partial ears were collected and shelled to determine bushels of acre residual corn for each paddock and hybrid.
Shelled corn was dried in a 60oC oven for 48 hours to determine DM/acre of residual corn. Downed corn in MON 89034 paddocks was estimated at 101.0 lb DM/ac or 2.41 bu/ac. Estimates of downed corn in the PAR paddocks were 103.3 lb DM/ac or 2.48 bu/ac.
Data were analyzed using the MIXED procedures of SAS (SAS Insti-tute, Cary, N.C.). Paddocks were the experimental unit (4/treatment).
Due to adverse winter weather con-ditions, the experiment ended on day 40, earlier than originally planned. One steer from MON treatment died due to weather related stress on day 39 and was removed from experiment analysis.
Results
Growing performance is shown in Table 2. No significant differences were observed. Because initial BW was statistically different, it was used as a covariate of analysis. Across-treatment averages were 20.7, 3.61, and 5.75 for DMI, ADG, and F:G, respectively. Steers fed MON were numerically the most efficient at 5.62 F:G. Cattle fed silage-based growing rations had very good DMI, ADG, and F:G due to good feeding conditions from February to May. No statistical differences were observed in grazing experiment performance (Table 3).
Cattle in this trial were not affected by source of corn, whether grazing residue or fed silage from transgenic or non-transgenic hybrids. Intake and ADG were numerically similar and certainly suggest no perfor-mance problems in the feeding value of trans genic corn when compared to non-transgenic corn. Mon 89034 is nutritionally equivalent to non-transgenic corn.
1Barry M. Weber, graduate student; Brandon L. Nuttelman, research technician; William A. Griffin, research technician; Josh R. Benton, previous research technician; Galen E. Erickson, professor; Terry J. Klopfenstein, professor, University of Nebraska–Lincoln Department of Animal Science.
Table 2. Growing Performance on Corn Silage-based Diet for 86 days.1
Variable MON PAR REF1 REF2 P-value
Initial BW, lb 613 616 612 614 .01Ending BW, lb 925 927 925 919 .53DMI, lb/day 20.4 20.8 20.9 20.8 .40ADG, lb 3.63 3.62 3.64 3.54 .56F:G2 5.62 5.74 5.75 5.89 .25
1REF1 = reference hybrid DKC 61-42, REF2 = reference hybrid DKC 62-30, PAR = non-transgenic pa-rental hybrid, MON = corn silage containing Cry 1A.105 and Cry2Ab2 proteins (MON 89034).2Analyzed as gain:feed, reported as feed:gain.
Table 3. Grazing Performance.
MON PAR SEM P-value
Initial BW, lb 547 550 1 .07Ending BW, lb 567 566 4 .89ADG, lb 0.52 0.39 .06 .20
MON = corn containing Cry1A.105 and Cry2Ab2 proteins (MON 89034), PAR = non-transgenic pa-rental hybrid.
Page 18 — 2011 Nebraska Beef Cattle Report © The Board of Regents of the University of Nebraska. All rights reserved.
Nutrient Composition of Spoiled and Non-Spoiled WetByproducts Mixed and Stored With Straw
Jennifer R. YeldenCrystal D. Buckner
Kelsey M. RolfeDana L. ChristensenTerry J. Klopfenstein
Galen E. Erickson1
Summary
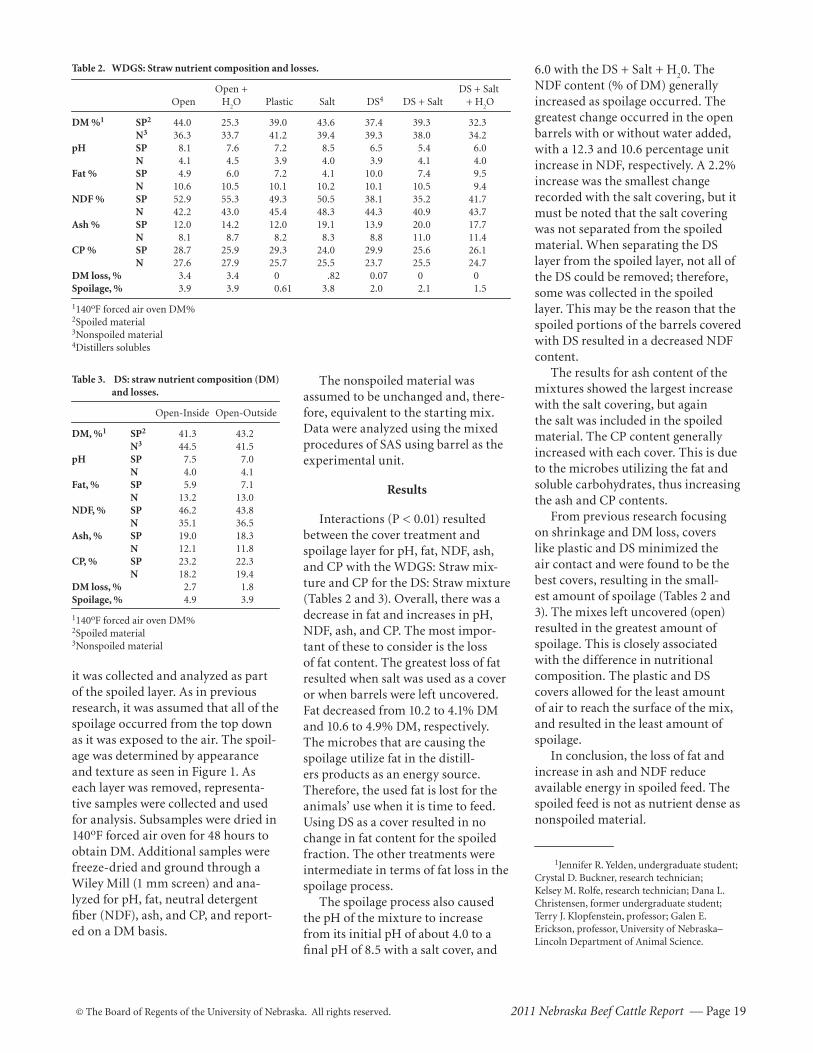
Wet corn byproducts were mixed with straw and stored in 55 gallon barrels for 56 days to simulate bunker storage. The spoilage process caused a decrease in fat content and an increase in pH, NDF, ash, and CP. Covering with plastic or distillers solubles reduced the amount of spoilage and the change in nutrient composition.
Introduction
Mixing wet distillers grains plus solubles (WDGS) or distillers solubles (DS) with straw allows storage in bunkers (2008 Nebraska Beef Cattle Report, pp. 23-25; 2010 Nebraska Beef Cattle Report, pp. 21-25). When the surface of WDGS is exposed to air it will spoil. As previous research shows, spoilage process will result in loss of DM at the surface of the bunker (2010 Nebraska Beef Cattle Report, pp. 21-25). To minimize the amount of spoilage to surfaces exposed to oxy-gen, several cover treatments may be applied.
Along with a loss of DM, nutri-ent composition of stored mixes may change during spoilage. In most cases, producers feed the spoiled material along with the unspoiled. The pur-pose of this experiment was to de-termine the nutritional composition of the spoiled feed fractions and how different covers affect these nutri-tional changes.
Procedure
Storage
To simulate bunker storage, 55 gal-lon barrels were packed with one of
two mixes: 70% WDGS and 30% straw mixture or 60% DS and 40% straw (both on a DM basis). Barrels were filled to approximately the same weight (300 lb) and packed to similar heights. All barrels (except DS: straw open-outside) were stored inside the Animal Science building at the University of Nebraska–Lincoln in a temperature-controlled room. Table 1 describes the
barrel covers that were assigned ran-domly to barrels with two replications per treatment.
Opening Barrels
After 56 days of storage, each barrel was opened by carefully removing the solubles layer (if applied), the spoiled portion, and then the nonspoiled por-tion. When salt was used as a cover,
Table 1. Cover treatments.
WDGS: Straw Open Barrels were left uncovered.
Open + H2O Uncovered with water added at a rate of 0.6 in weekly to mimic average
Nebraska precipitation.
Plastic Six mil plastic covering the surface of the mixture, weighed down with sand, and the edges sealed with tape. This treatment would be compa-rable to plastic and tires in a bunker setting.
Salt Salt was sprinkled over the surface of the mixture at a rate of 1 lb/ft2.
Distillers solubles (DS) DS were poured over the surface of the mixture to make a 3-inch layer (45 lb as-is).
DS + Salt DS and salt added at rates previously discussed and mixed together before application.
DS + Salt + H2O DS and salt added at rates previously discussed and water added at 0.6
inch weekly.
DS: Straw Open, inside Barrels left uncovered and stored inside.
Open, outside Barrels left uncovered and stored outside at the University of Nebraska Feedlot near Mead, Neb., and exposed to any rainfall.
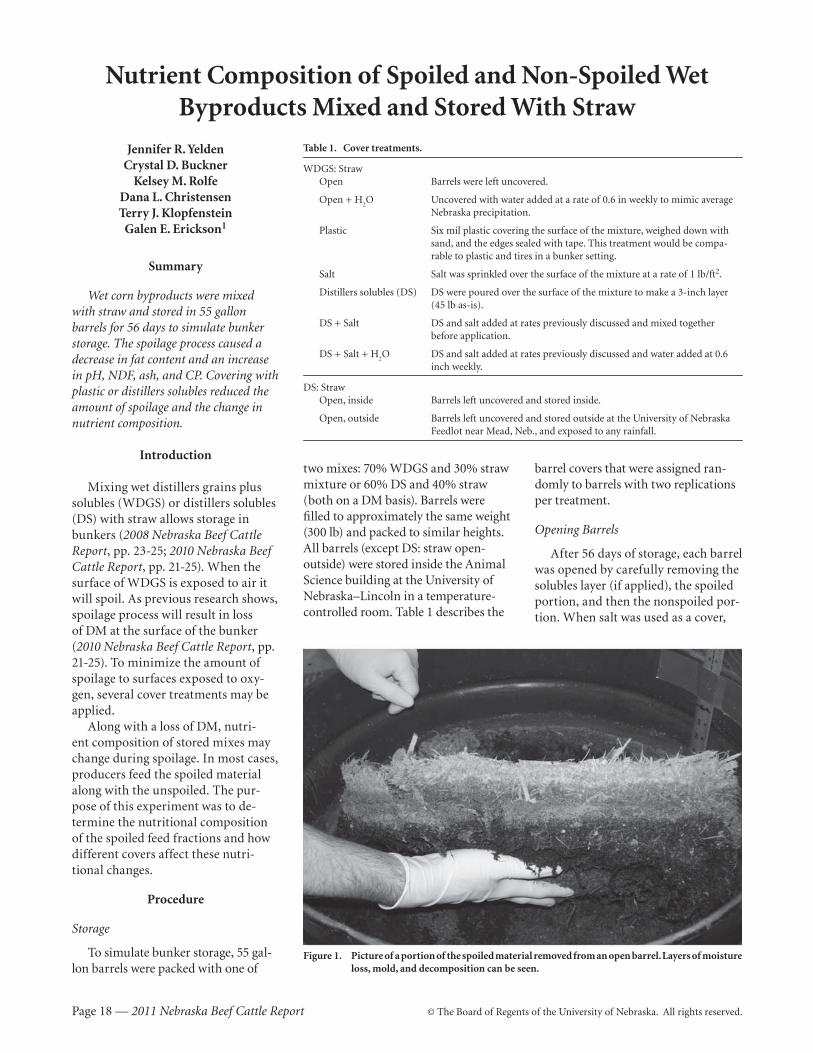
Figure 1. Picture of a portion of the spoiled material removed from an open barrel. Layers of moisture loss, mold, and decomposition can be seen.
© The Board of Regents of the University of Nebraska. All rights reserved. 2011 Nebraska Beef Cattle Report — Page 19
it was collected and analyzed as part of the spoiled layer. As in previous research, it was assumed that all of the spoilage occurred from the top down as it was exposed to the air. The spoil-age was determined by appearance and texture as seen in Figure 1. As each layer was removed, representa-tive samples were collected and used for analysis. Subsamples were dried in 140oF forced air oven for 48 hours to obtain DM. Additional samples were freeze-dried and ground through a Wiley Mill (1 mm screen) and ana-lyzed for pH, fat, neutral detergent fiber (NDF), ash, and CP, and report-ed on a DM basis.
The nonspoiled material was assumed to be unchanged and, there-fore, equivalent to the starting mix. Data were analyzed using the mixed procedures of SAS using barrel as the experimental unit.
Results
Interactions (P < 0.01) resulted between the cover treatment and spoilage layer for pH, fat, NDF, ash, and CP with the WDGS: Straw mix-ture and CP for the DS: Straw mixture (Tables 2 and 3). Overall, there was a decrease in fat and increases in pH, NDF, ash, and CP. The most impor-tant of these to consider is the loss of fat content. The greatest loss of fat resulted when salt was used as a cover or when barrels were left uncovered. Fat decreased from 10.2 to 4.1% DM and 10.6 to 4.9% DM, respectively. The microbes that are causing the spoilage utilize fat in the distill-ers products as an energy source. Therefore, the used fat is lost for the animals’ use when it is time to feed. Using DS as a cover resulted in no change in fat content for the spoiled fraction. The other treatments were intermediate in terms of fat loss in the spoilage process.
The spoilage process also caused the pH of the mixture to increase from its initial pH of about 4.0 to a final pH of 8.5 with a salt cover, and
6.0 with the DS + Salt + H20. The
NDF content (% of DM) generally increased as spoilage occurred. The greatest change occurred in the open barrels with or without water added, with a 12.3 and 10.6 percentage unit increase in NDF, respectively. A 2.2% increase was the smallest change recorded with the salt covering, but it must be noted that the salt covering was not separated from the spoiled material. When separating the DS layer from the spoiled layer, not all of the DS could be removed; therefore, some was collected in the spoiled layer. This may be the reason that the spoiled portions of the barrels covered with DS resulted in a decreased NDF content.
The results for ash content of the mixtures showed the largest increase with the salt covering, but again the salt was included in the spoiled material. The CP content generally increased with each cover. This is due to the microbes utilizing the fat and soluble carbohydrates, thus increasing the ash and CP contents.
From previous research focusing on shrinkage and DM loss, covers like plastic and DS minimized the air contact and were found to be the best covers , resulting in the small-est amount of spoilage (Tables 2 and 3). The mixes left uncovered (open) resulted in the greatest amount of spoilage. This is closely associated with the difference in nutritional composition. The plastic and DS covers allowed for the least amount of air to reach the surface of the mix, and resulted in the least amount of spoilage.
In conclusion, the loss of fat and increase in ash and NDF reduce available energy in spoiled feed. The spoiled feed is not as nutrient dense as nonspoiled material.
1Jennifer R. Yelden, undergraduate student; Crystal D. Buckner, research technician; Kelsey M. Rolfe, research technician; Dana L. Christensen, former undergraduate student; Terry J. Klopfenstein, professor; Galen E. Erickson, professor, University of Nebraska–Lincoln Department of Animal Science.
Table 2. WDGS: Straw nutrient composition and losses.
Open + DS + Salt Open H
2O Plastic Salt DS4 DS + Salt + H
2O
DM %1 SP2 44.0 25.3 39.0 43.6 37.4 39.3 32.3 N3 36.3 33.7 41.2 39.4 39.3 38.0 34.2 pH SP 8.1 7.6 7.2 8.5 6.5 5.4 6.0 N 4.1 4.5 3.9 4.0 3.9 4.1 4.0 Fat % SP 4.9 6.0 7.2 4.1 10.0 7.4 9.5 N 10.6 10.5 10.1 10.2 10.1 10.5 9.4 NDF % SP 52.9 55.3 49.3 50.5 38.1 35.2 41.7 N 42.2 43.0 45.4 48.3 44.3 40.9 43.7 Ash % SP 12.0 14.2 12.0 19.1 13.9 20.0 17.7 N 8.1 8.7 8.2 8.3 8.8 11.0 11.4 CP % SP 28.7 25.9 29.3 24.0 29.9 25.6 26.1 N 27.6 27.9 25.7 25.5 23.7 25.5 24.7 DM loss, % 3.4 3.4 0 .82 0.07 0 0Spoilage, % 3.9 3.9 0.61 3.8 2.0 2.1 1.5
1140oF forced air oven DM%2Spoiled material3Nonspoiled material4Distillers solubles
Table 3. DS: straw nutrient composition (DM) and losses.
Open-Inside Open-Outside
DM, %1 SP2 41.3 43.2 N3 44.5 41.5 pH SP 7.5 7.0 N 4.0 4.1 Fat, % SP 5.9 7.1 N 13.2 13.0 NDF, % SP 46.2 43.8 N 35.1 36.5 Ash, % SP 19.0 18.3 N 12.1 11.8 CP, % SP 23.2 22.3 N 18.2 19.4 DM loss, % 2.7 1.8Spoilage, % 4.9 3.9
1140oF forced air oven DM%2Spoiled material3Nonspoiled material
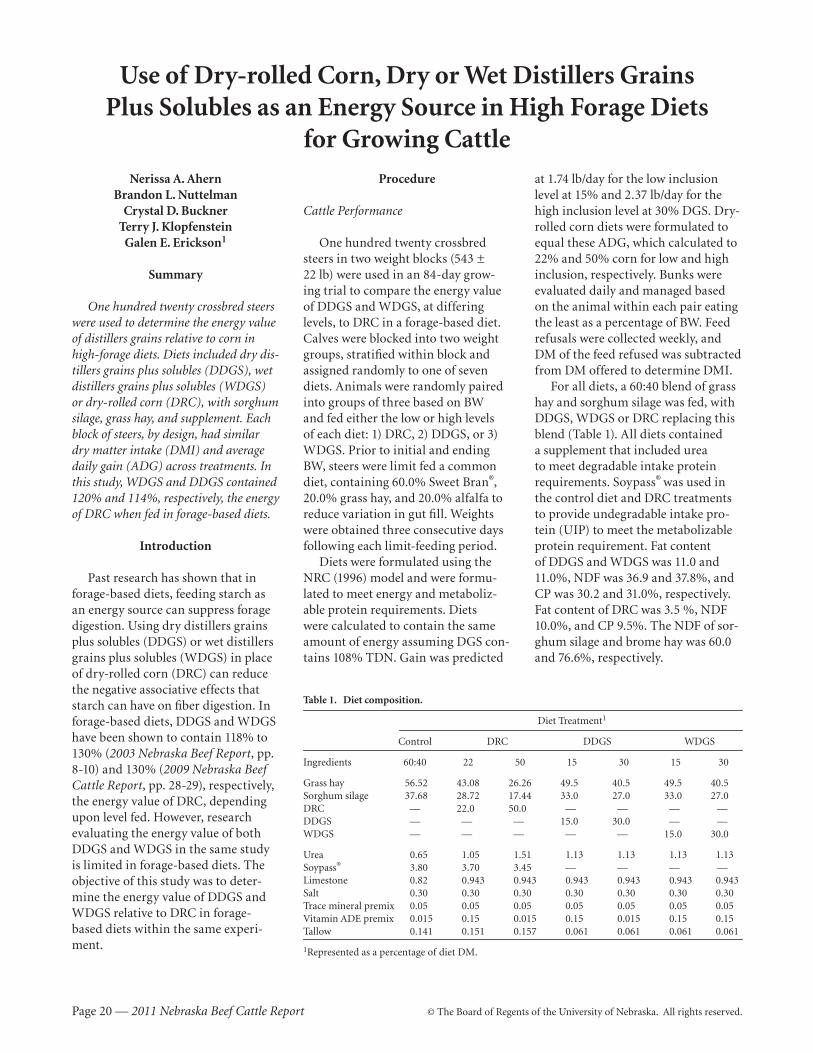
Page 20 — 2011 Nebraska Beef Cattle Report © The Board of Regents of the University of Nebraska. All rights reserved.
Use of Dry-rolled Corn, Dry or Wet Distillers GrainsPlus Solubles as an Energy Source in High Forage Diets
for Growing CattleNerissa A. Ahern
Brandon L. Nuttelman Crystal D. Buckner
Terry J. Klopfenstein Galen E. Erickson1
Summary
One hundred twenty crossbred steers were used to determine the energy value of distillers grains relative to corn in high-forage diets. Diets included dry dis-tillers grains plus solubles (DDGS), wet distillers grains plus solubles (WDGS) or dry-rolled corn (DRC), with sorghum silage, grass hay, and supplement. Each block of steers, by design, had similar dry matter intake (DMI) and average daily gain (ADG) across treatments. In this study, WDGS and DDGS contained 120% and 114%, respectively, the energy of DRC when fed in forage-based diets.
Introduction
Past research has shown that in forage-based diets, feeding starch as an energy source can suppress forage digestion. Using dry distillers grains plus solubles (DDGS) or wet distillers grains plus solubles (WDGS) in place of dry-rolled corn (DRC) can reduce the negative associative effects that starch can have on fiber digestion. In forage-based diets, DDGS and WDGS have been shown to contain 118% to 130% (2003 Nebraska Beef Report, pp. 8-10) and 130% (2009 Nebraska Beef Cattle Report, pp. 28-29), respectively, the energy value of DRC, depending upon level fed. However, research evaluating the energy value of both DDGS and WDGS in the same study is limited in forage-based diets. The objective of this study was to deter-mine the energy value of DDGS and WDGS relative to DRC in forage-based diets within the same experi-ment.
Procedure
Cattle Performance
One hundred twenty crossbred steers in two weight blocks (543 ± 22 lb) were used in an 84-day grow-ing trial to compare the energy value of DDGS and WDGS, at differing levels, to DRC in a forage-based diet. Calves were blocked into two weight groups, stratified within block and assigned randomly to one of seven diets. Animals were randomly paired into groups of three based on BW and fed either the low or high levels of each diet: 1) DRC, 2) DDGS, or 3) WDGS. Prior to initial and ending BW, steers were limit fed a common diet, containing 60.0% Sweet Bran®, 20.0% grass hay, and 20.0% alfalfa to reduce variation in gut fill. Weights were obtained three consecutive days following each limit-feeding period.
Diets were formulated using the NRC (1996) model and were formu-lated to meet energy and metaboliz-able protein requirements. Diets were calculated to contain the same amount of energy assuming DGS con-tains 108% TDN. Gain was predicted
at 1.74 lb/day for the low inclusion level at 15% and 2.37 lb/day for the high inclusion level at 30% DGS. Dry-rolled corn diets were formulated to equal these ADG, which calculated to 22% and 50% corn for low and high inclusion, respectively. Bunks were evaluated daily and managed based on the animal within each pair eating the least as a percentage of BW. Feed refusals were collected weekly, and DM of the feed refused was subtracted from DM offered to determine DMI.
For all diets, a 60:40 blend of grass hay and sorghum silage was fed, with DDGS, WDGS or DRC replacing this blend (Table 1). All diets contained a supplement that included urea to meet degradable intake protein requirements . Soypass® was used in the control diet and DRC treatments to provide undegradable intake pro-tein (UIP) to meet the metabolizable protein requirement. Fat content of DDGS and WDGS was 11.0 and 11.0%, NDF was 36.9 and 37.8%, and CP was 30.2 and 31.0%, respectively. Fat content of DRC was 3.5 %, NDF 10.0%, and CP 9.5%. The NDF of sor-ghum silage and brome hay was 60.0 and 76.6%, respectively.
Table 1. Diet composition.
Diet Treatment1
Control DRC DDGS WDGS
Ingredients 60:40 22 50 15 30 15 30
Grass hay 56.52 43.08 26.26 49.5 40.5 49.5 40.5Sorghum silage 37.68 28.72 17.44 33.0 27.0 33.0 27.0DRC — 22.0 50.0 — — — —DDGS — — — 15.0 30.0 — —WDGS — — — — — 15.0 30.0
Urea 0.65 1.05 1.51 1.13 1.13 1.13 1.13Soypass® 3.80 3.70 3.45 — — — —Limestone 0.82 0.943 0.943 0.943 0.943 0.943 0.943Salt 0.30 0.30 0.30 0.30 0.30 0.30 0.30Trace mineral premix 0.05 0.05 0.05 0.05 0.05 0.05 0.05Vitamin ADE premix 0.015 0.15 0.015 0.15 0.015 0.15 0.15Tallow 0.141 0.151 0.157 0.061 0.061 0.061 0.061
1Represented as a percentage of diet DM.
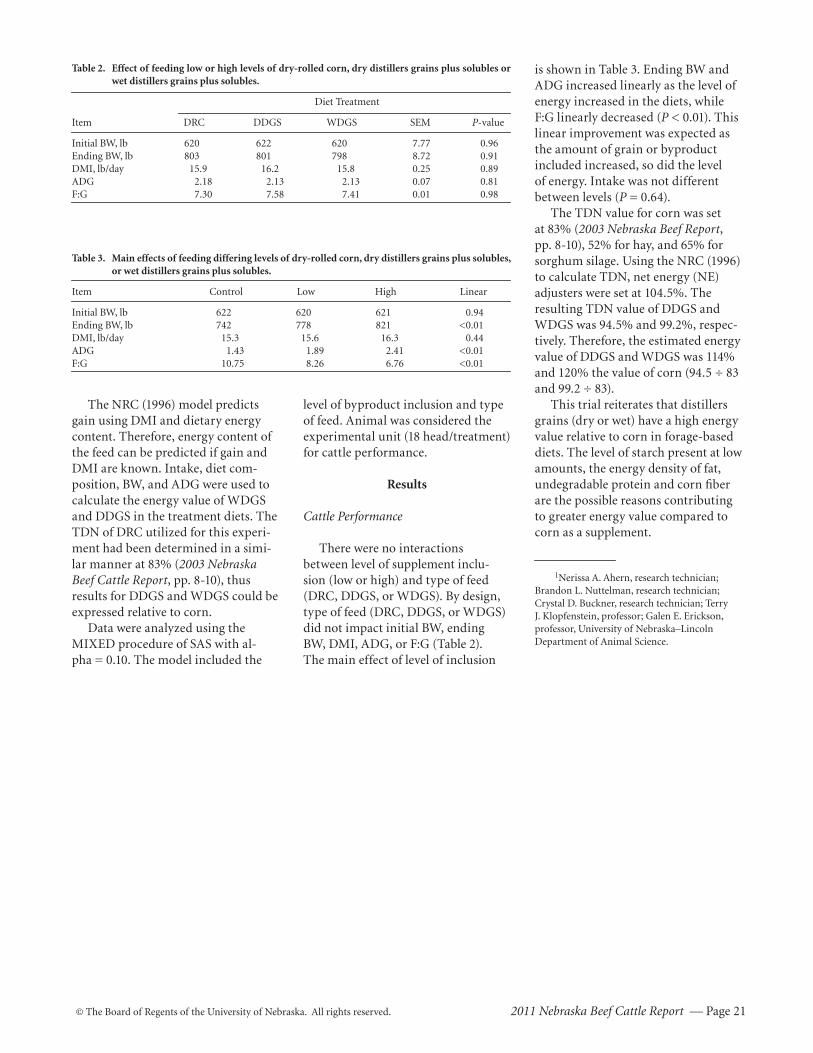
© The Board of Regents of the University of Nebraska. All rights reserved. 2011 Nebraska Beef Cattle Report — Page 21
The NRC (1996) model predicts gain using DMI and dietary energy content. Therefore, energy content of the feed can be predicted if gain and DMI are known. Intake, diet com-position, BW, and ADG were used to calculate the energy value of WDGS and DDGS in the treatment diets. The TDN of DRC utilized for this experi-ment had been determined in a simi-lar manner at 83% (2003 Nebraska Beef Cattle Report, pp. 8-10), thus results for DDGS and WDGS could be expressed relative to corn.
Data were analyzed using the MIXED procedure of SAS with al-pha = 0.10. The model included the
level of byproduct inclusion and type of feed. Animal was considered the experimental unit (18 head/treatment) for cattle performance.
Results
Cattle Performance
There were no interactions between level of supplement inclu-sion (low or high) and type of feed (DRC, DDGS, or WDGS). By design, type of feed (DRC, DDGS, or WDGS) did not impact initial BW, ending BW, DMI, ADG, or F:G (Table 2). The main effect of level of inclusion
Table 2. Effect of feeding low or high levels of dry-rolled corn, dry distillers grains plus solubles or wet distillers grains plus solubles.
Diet Treatment
Item DRC DDGS WDGS SEM P-value
Initial BW, lb 620 622 620 7.77 0.96Ending BW, lb 803 801 798 8.72 0.91DMI, lb/day 15.9 16.2 15.8 0.25 0.89ADG 2.18 2.13 2.13 0.07 0.81F:G 7.30 7.58 7.41 0.01 0.98
Table 3. Main effects of feeding differing levels of dry-rolled corn, dry distillers grains plus solubles, or wet distillers grains plus solubles.
Item Control Low High Linear
Initial BW, lb 622 620 621 0.94Ending BW, lb 742 778 821 <0.01DMI, lb/day 15.3 15.6 16.3 0.44ADG 1.43 1.89 2.41 <0.01F:G 10.75 8.26 6.76 <0.01
is shown in Table 3. Ending BW and ADG increased linearly as the level of energy increased in the diets, while F:G linearly decreased (P < 0.01). This linear improvement was expected as the amount of grain or byproduct included increased, so did the level of energy. Intake was not different between levels (P = 0.64).
The TDN value for corn was set at 83% (2003 Nebraska Beef Report, pp. 8-10), 52% for hay, and 65% for sorghum silage. Using the NRC (1996) to calculate TDN, net energy (NE) adjusters were set at 104.5%. The resulting TDN value of DDGS and WDGS was 94.5% and 99.2%, respec-tively. Therefore, the estimated energy value of DDGS and WDGS was 114% and 120% the value of corn (94.5 ÷ 83 and 99.2 ÷ 83).
This trial reiterates that distillers grains (dry or wet) have a high energy value relative to corn in forage-based diets. The level of starch present at low amounts, the energy density of fat, undegradable protein and corn fiber are the possible reasons contributing to greater energy value compared to corn as a supplement.
1Nerissa A. Ahern, research technician; Brandon L. Nuttelman, research technician; Crystal D. Buckner, research technician; Terry J. Klopfenstein, professor; Galen E. Erickson, professor, University of Nebraska–Lincoln Department of Animal Science.
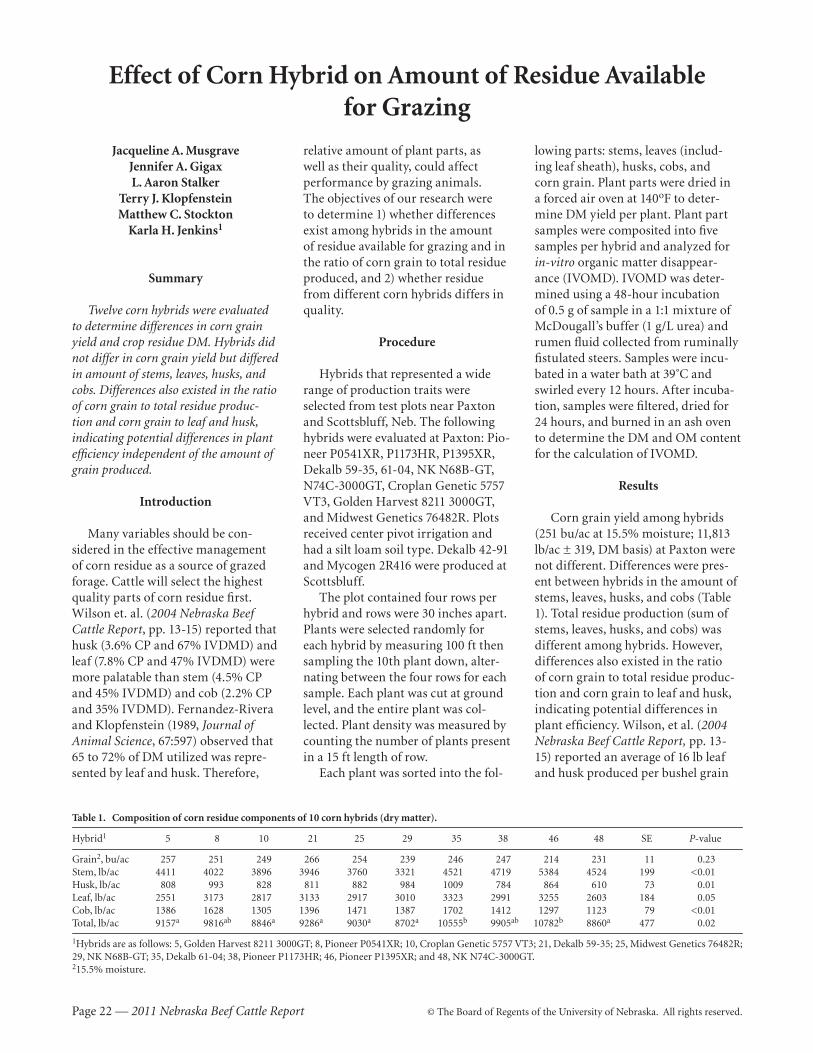
Page 22 — 2011 Nebraska Beef Cattle Report © The Board of Regents of the University of Nebraska. All rights reserved.
Effect of Corn Hybrid on Amount of Residue Availablefor Grazing
Jacqueline A. MusgraveJennifer A. GigaxL. Aaron Stalker
Terry J. KlopfensteinMatthew C. Stockton
Karla H. Jenkins1
Summary
Twelve corn hybrids were evaluated to determine differences in corn grain yield and crop residue DM. Hybrids did not differ in corn grain yield but differed in amount of stems, leaves, husks, and cobs. Differences also existed in the ratio of corn grain to total residue produc-tion and corn grain to leaf and husk, indicating potential differences in plant efficiency independent of the amount of grain produced.
Introduction
Many variables should be con-sidered in the effective management of corn residue as a source of grazed forage. Cattle will select the highest quality parts of corn residue first. Wilson et. al. (2004 Nebraska Beef Cattle Report, pp. 13-15) reported that husk (3.6% CP and 67% IVDMD) and leaf (7.8% CP and 47% IVDMD) were more palatable than stem (4.5% CP and 45% IVDMD) and cob (2.2% CP and 35% IVDMD). Fernandez-Rivera and Klopfenstein (1989, Journal of Animal Science, 67:597) observed that 65 to 72% of DM utilized was repre-sented by leaf and husk. Therefore ,
relative amount of plant parts, as well as their quality, could affect performance by grazing animals. The objectives of our research were to determine 1) whether differences exist among hybrids in the amount of residue available for grazing and in the ratio of corn grain to total residue produced, and 2) whether residue from different corn hybrids differs in quality.
Procedure
Hybrids that represented a wide range of production traits were selected from test plots near Paxton and Scottsbluff, Neb. The following hybrids were evaluated at Paxton: Pio-neer P0541XR, P1173HR, P1395XR, Dekalb 59-35, 61-04, NK N68B-GT, N74C-3000GT, Croplan Genetic 5757 VT3, Golden Harvest 8211 3000GT, and Midwest Genetics 76482R. Plots received center pivot irrigation and had a silt loam soil type. Dekalb 42-91 and Mycogen 2R416 were produced at Scottsbluff.
The plot contained four rows per hybrid and rows were 30 inches apart. Plants were selected randomly for each hybrid by measuring 100 ft then sampling the 10th plant down, alter-nating between the four rows for each sample. Each plant was cut at ground level, and the entire plant was col-lected. Plant density was measured by counting the number of plants present in a 15 ft length of row.
Each plant was sorted into the fol-
lowing parts: stems, leaves (includ-ing leaf sheath), husks, cobs, and corn grain. Plant parts were dried in a forced air oven at 140oF to deter-mine DM yield per plant. Plant part samples were composited into five samples per hybrid and analyzed for in-vitro organic matter disappear-ance (IVOMD ). IVOMD was deter-mined using a 48-hour incubation of 0.5 g of sample in a 1:1 mixture of McDougall’ s buffer (1 g/L urea) and rumen fluid collected from ruminally fistulated steers. Samples were incu-bated in a water bath at 39˚C and swirled every 12 hours. After incuba-tion, samples were filtered, dried for 24 hours, and burned in an ash oven to determine the DM and OM content for the calculation of IVOMD.
Results
Corn grain yield among hybrids (251 bu/ac at 15.5% moisture; 11,813 lb/ac ± 319, DM basis) at Paxton were not different. Differences were pres-ent between hybrids in the amount of stems, leaves, husks, and cobs (Table 1). Total residue production (sum of stems, leaves, husks, and cobs) was different among hybrids. However, differences also existed in the ratio of corn grain to total residue produc-tion and corn grain to leaf and husk, indicating potential differences in plant efficiency. Wilson, et al. (2004 Nebraska Beef Cattle Report, pp. 13-15) reported an average of 16 lb leaf and husk produced per bushel grain
Table 1. Composition of corn residue components of 10 corn hybrids (dry matter).
Hybrid1 5 8 10 21 25 29 35 38 46 48 SE P-value
Grain2, bu/ac 257 251 249 266 254 239 246 247 214 231 11 0.23Stem, lb/ac 4411 4022 3896 3946 3760 3321 4521 4719 5384 4524 199 <0.01Husk, lb/ac 808 993 828 811 882 984 1009 784 864 610 73 0.01Leaf, lb/ac 2551 3173 2817 3133 2917 3010 3323 2991 3255 2603 184 0.05Cob, lb/ac 1386 1628 1305 1396 1471 1387 1702 1412 1297 1123 79 <0.01Total, lb/ac 9157a 9816ab 8846a 9286a 9030a 8702a 10555b 9905ab 10782b 8860a 477 0.02
1Hybrids are as follows: 5, Golden Harvest 8211 3000GT; 8, Pioneer P0541XR; 10, Croplan Genetic 5757 VT3; 21, Dekalb 59-35; 25, Midwest Genetics 76482R; 29, NK N68B-GT; 35, Dekalb 61-04; 38, Pioneer P1173HR; 46, Pioneer P1395XR; and 48, NK N74C-3000GT.215.5% moisture.
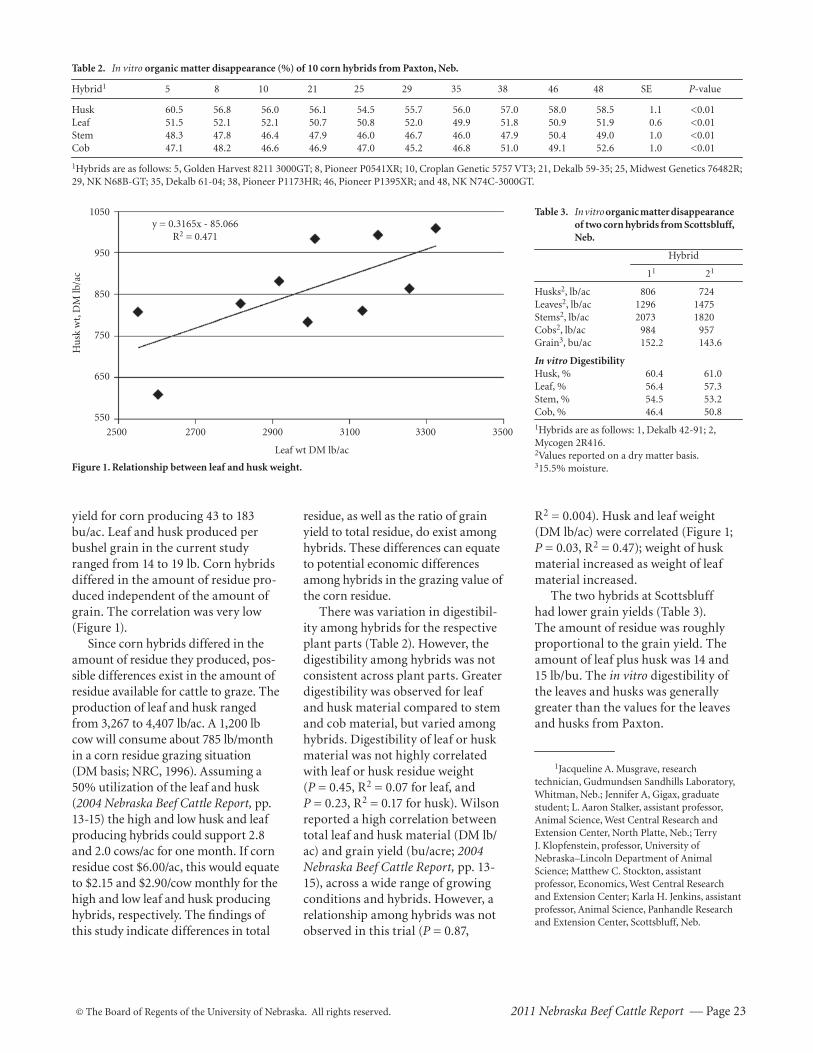
© The Board of Regents of the University of Nebraska. All rights reserved. 2011 Nebraska Beef Cattle Report — Page 23
yield for corn producing 43 to 183 bu/ac. Leaf and husk produced per bushel grain in the current study ranged from 14 to 19 lb. Corn hybrids differed in the amount of residue pro-duced independent of the amount of grain. The correlation was very low (Figure 1).
Since corn hybrids differed in the amount of residue they produced, pos-sible differences exist in the amount of residue available for cattle to graze. The production of leaf and husk ranged from 3,267 to 4,407 lb/ac. A 1,200 lb cow will consume about 785 lb/month in a corn residue grazing situation (DM basis; NRC, 1996). Assuming a 50% utilization of the leaf and husk (2004 Nebraska Beef Cattle Report, pp. 13-15) the high and low husk and leaf producing hybrids could support 2.8 and 2.0 cows/ac for one month. If corn residue cost $6.00/ac, this would equate to $2.15 and $2.90/cow monthly for the high and low leaf and husk producing hybrids , respectively . The findings of this study indicate differences in total
residue, as well as the ratio of grain yield to total residue, do exist among hybrids. These differences can equate to potential economic differences among hybrids in the grazing value of the corn residue.
There was variation in digestibil-ity among hybrids for the respective plant parts (Table 2). However, the digestibility among hybrids was not consistent across plant parts. Greater digestibility was observed for leaf and husk material compared to stem and cob material, but varied among hybrids . Digestibility of leaf or husk material was not highly correlated with leaf or husk residue weight (P = 0.45, R2 = 0.07 for leaf, and P = 0.23, R2 = 0.17 for husk). Wilson reported a high correlation between total leaf and husk material (DM lb/ac) and grain yield (bu/acre; 2004 Nebraska Beef Cattle Report, pp. 13-15), across a wide range of growing conditions and hybrids. However, a relationship among hybrids was not observed in this trial (P = 0.87,
R2 = 0.004). Husk and leaf weight (DM lb/ac) were correlated (Figure 1; P = 0.03, R2 = 0.47); weight of husk material increased as weight of leaf material increased.
The two hybrids at Scottsbluff had lower grain yields (Table 3). The amount of residue was roughly proportional to the grain yield. The amount of leaf plus husk was 14 and 15 lb/bu. The in vitro digestibility of the leaves and husks was generally greater than the values for the leaves and husks from Paxton.
1Jacqueline A. Musgrave, research technician, Gudmundsen Sandhills Laboratory, Whitman, Neb.; Jennifer A, Gigax, graduate student; L. Aaron Stalker, assistant professor, Animal Science, West Central Research and Extension Center, North Platte, Neb.; Terry J. Klopfenstein, professor, University of Nebraska–Lincoln Department of Animal Science; Matthew C. Stockton, assistant professor, Economics, West Central Research and Extension Center; Karla H. Jenkins, assistant professor, Animal Science, Panhandle Research and Extension Center, Scottsbluff, Neb.
Table 2. In vitro organic matter disappearance (%) of 10 corn hybrids from Paxton, Neb.
Hybrid1 5 8 10 21 25 29 35 38 46 48 SE P-value
Husk 60.5 56.8 56.0 56.1 54.5 55.7 56.0 57.0 58.0 58.5 1.1 <0.01Leaf 51.5 52.1 52.1 50.7 50.8 52.0 49.9 51.8 50.9 51.9 0.6 <0.01Stem 48.3 47.8 46.4 47.9 46.0 46.7 46.0 47.9 50.4 49.0 1.0 <0.01Cob 47.1 48.2 46.6 46.9 47.0 45.2 46.8 51.0 49.1 52.6 1.0 <0.01
1Hybrids are as follows: 5, Golden Harvest 8211 3000GT; 8, Pioneer P0541XR; 10, Croplan Genetic 5757 VT3; 21, Dekalb 59-35; 25, Midwest Genetics 76482R; 29, NK N68B-GT; 35, Dekalb 61-04; 38, Pioneer P1173HR; 46, Pioneer P1395XR; and 48, NK N74C-3000GT.
Figure 1. Relationship between leaf and husk weight.
Hu
sk w
t, D
M lb
/ac
1050
950
850
750
650
550
2500 2700 2900 3100 3300 3500
Leaf wt DM lb/ac
y = 0.3165x - 85.066R2 = 0.471
Table 3. In vitro organic matter disappearance of two corn hybrids from Scottsbluff, Neb.
Hybrid
11 21
Husks2, lb/ac 806 724Leaves2, lb/ac 1296 1475Stems2, lb/ac 2073 1820Cobs2, lb/ac 984 957Grain3, bu/ac 152.2 143.6
In vitro DigestibilityHusk, % 60.4 61.0Leaf, % 56.4 57.3Stem, % 54.5 53.2Cob, % 46.4 50.8
1Hybrids are as follows: 1, Dekalb 42-91; 2, Mycogen 2R416.2Values reported on a dry matter basis.315.5% moisture.
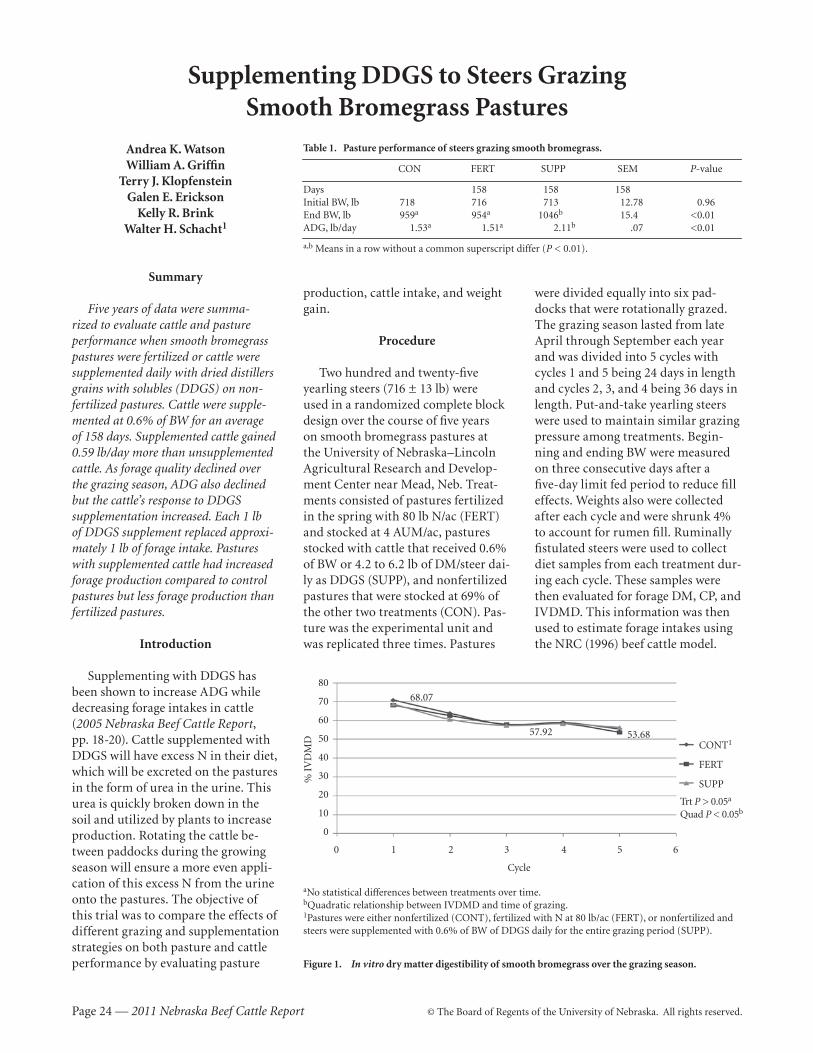
Page 24 — 2011 Nebraska Beef Cattle Report © The Board of Regents of the University of Nebraska. All rights reserved.
Supplementing DDGS to Steers GrazingSmooth Bromegrass Pastures
Andrea K. WatsonWilliam A. Griffin
Terry J. KlopfensteinGalen E. Erickson
Kelly R. BrinkWalter H. Schacht1
Summary
Five years of data were summa-rized to evaluate cattle and pasture performance when smooth bromegrass pastures were fertilized or cattle were supplemented daily with dried distillers grains with solubles (DDGS) on non-fertilized pastures. Cattle were supple-mented at 0.6% of BW for an average of 158 days. Supplemented cattle gained 0.59 lb/day more than unsupplemented cattle. As forage quality declined over the grazing season, ADG also declined but the cattle’s response to DDGS supplementation increased. Each 1 lb of DDGS supplement replaced approxi-mately 1 lb of forage intake. Pastures with supplemented cattle had increased forage production compared to control pastures but less forage production than fertilized pastures.
Introduction
Supplementing with DDGS has been shown to increase ADG while decreasing forage intakes in cattle (2005 Nebraska Beef Cattle Report, pp. 18-20). Cattle supplemented with DDGS will have excess N in their diet, which will be excreted on the pastures in the form of urea in the urine. This urea is quickly broken down in the soil and utilized by plants to increase production. Rotating the cattle be-tween paddocks during the growing season will ensure a more even appli-cation of this excess N from the urine onto the pastures. The objective of this trial was to compare the effects of different grazing and supplementation strategies on both pasture and cattle performance by evaluating pasture
production, cattle intake, and weight gain.
Procedure
Two hundred and twenty-five yearling steers (716 ± 13 lb) were used in a randomized complete block design over the course of five years on smooth bromegrass pastures at the University of Nebraska–Lincoln Agricultural Research and Develop-ment Center near Mead, Neb. Treat-ments consisted of pastures fertilized in the spring with 80 lb N/ac (FERT) and stocked at 4 AUM/ac, pastures stocked with cattle that received 0.6% of BW or 4.2 to 6.2 lb of DM/steer dai-ly as DDGS (SUPP), and nonfertilized pastures that were stocked at 69% of the other two treatments (CON). Pas-ture was the experimental unit and was replicated three times. Pastures
were divided equally into six pad-docks that were rotationally grazed. The grazing season lasted from late April through September each year and was divided into 5 cycles with cycles 1 and 5 being 24 days in length and cycles 2, 3, and 4 being 36 days in length. Put-and-take yearling steers were used to maintain similar grazing pressure among treatments. Begin-ning and ending BW were measured on three consecutive days after a five-day limit fed period to reduce fill effects. Weights also were collected after each cycle and were shrunk 4% to account for rumen fill. Ruminally fistulated steers were used to collect diet samples from each treatment dur-ing each cycle. These samples were then evaluated for forage DM, CP, and IVDMD. This information was then used to estimate forage intakes using the NRC (1996) beef cattle model.
Table 1. Pasture performance of steers grazing smooth bromegrass.
CON FERT SUPP SEM P-value
Days 158 158 158Initial BW, lb 718 716 713 12.78 0.96 End BW, lb 959a 954a 1046b 15.4 <0.01ADG, lb/day 1.53a 1.51a 2.11b .07 <0.01
a,b Means in a row without a common superscript differ (P < 0.01).
CONT1
FERT
SUPP
aNo statistical differences between treatments over time.bQuadratic relationship between IVDMD and time of grazing.1Pastures were either nonfertilized (CONT), fertilized with N at 80 lb/ac (FERT), or nonfertilized and steers were supplemented with 0.6% of BW of DDGS daily for the entire grazing period (SUPP).
Figure 1. In vitro dry matter digestibility of smooth bromegrass over the grazing season.
80
70
60
50
40
30
20
10
0
% I
VD
MD
0 1 2 3 4 5 6
Cycle
68.07
57.92 53.68
Trt P > 0.05a
Quad P < 0.05b
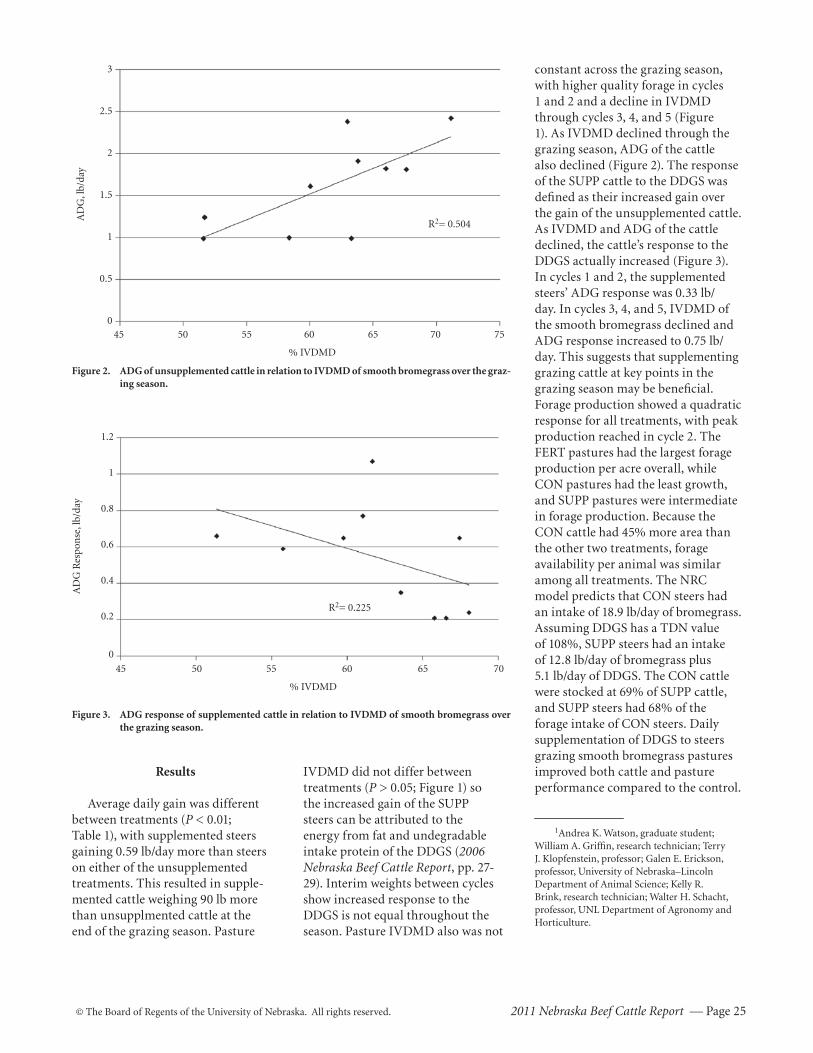
© The Board of Regents of the University of Nebraska. All rights reserved. 2011 Nebraska Beef Cattle Report — Page 25
constant across the grazing season, with higher quality forage in cycles 1 and 2 and a decline in IVDMD through cycles 3, 4, and 5 (Figure 1). As IVDMD declined through the grazing season, ADG of the cattle also declined (Figure 2). The response of the SUPP cattle to the DDGS was defined as their increased gain over the gain of the unsupplemented cattle. As IVDMD and ADG of the cattle declined, the cattle’s response to the DDGS actually increased (Figure 3). In cycles 1 and 2, the supplemented steers’ ADG response was 0.33 lb/day. In cycles 3, 4, and 5, IVDMD of the smooth bromegrass declined and ADG response increased to 0.75 lb/day. This suggests that supplementing grazing cattle at key points in the grazing season may be beneficial. Forage production showed a quadratic response for all treatments, with peak production reached in cycle 2. The FERT pastures had the largest forage production per acre overall, while CON pastures had the least growth, and SUPP pastures were intermediate in forage production. Because the CON cattle had 45% more area than the other two treatments, forage availability per animal was similar among all treatments. The NRC model predicts that CON steers had an intake of 18.9 lb/day of bromegrass. Assuming DDGS has a TDN value of 108%, SUPP steers had an intake of 12.8 lb/day of bromegrass plus 5.1 lb/day of DDGS. The CON cattle were stocked at 69% of SUPP cattle, and SUPP steers had 68% of the forage intake of CON steers. Daily supplementation of DDGS to steers grazing smooth bromegrass pastures improved both cattle and pasture performance compared to the control.
1Andrea K. Watson, graduate student; William A. Griffin, research technician; Terry J. Klopfenstein, professor; Galen E. Erickson, professor, University of Nebraska–Lincoln Department of Animal Science; Kelly R. Brink, research technician; Walter H. Schacht, professor, UNL Department of Agronomy and Horticulture.
Figure 2. ADG of unsupplemented cattle in relation to IVDMD of smooth bromegrass over the graz-ing season.
AD
G, l
b/da
y3
2.5
2
1.5
1
0.5
045 50 55 60 65 70 75
% IVDMD
R2= 0.504
Figure 3. ADG response of supplemented cattle in relation to IVDMD of smooth bromegrass over the grazing season.
1.2
1
0.8
0.6
0.4
0.2
0
AD
G R
espo
nse
, lb/
day
R2= 0.225
45 50 55 60 65 70
% IVDMD
Results
Average daily gain was different between treatments (P < 0.01; Table 1), with supplemented steers gaining 0.59 lb/day more than steers on either of the unsupplemented treatments. This resulted in sup ple-mented cattle weighing 90 lb more than unsupplmented cattle at the end of the grazing season. Pasture
IVDMD did not differ between treatments (P > 0.05; Figure 1) so the increased gain of the SUPP steers can be attributed to the energy from fat and undegradable intake protein of the DDGS (2006 Nebraska Beef Cattle Report, pp. 27-29). Interim weights between cycles show increased response to the DDGS is not equal throughout the season. Pasture IVDMD also was not
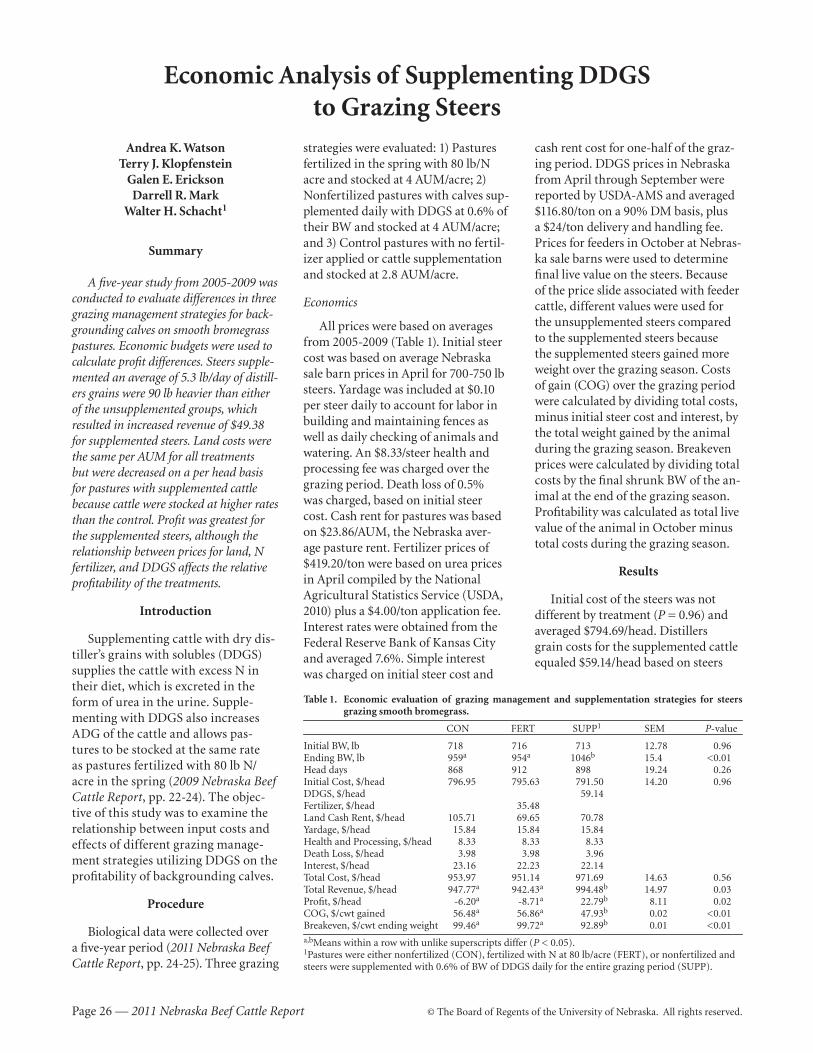
Page 26 — 2011 Nebraska Beef Cattle Report © The Board of Regents of the University of Nebraska. All rights reserved.
Economic Analysis of Supplementing DDGS to Grazing Steers
Andrea K. WatsonTerry J. Klopfenstein
Galen E. EricksonDarrell R. Mark
Walter H. Schacht1
Summary
A five-year study from 2005-2009 was conducted to evaluate differences in three grazing management strategies for back-grounding calves on smooth bromegrass pastures. Economic budgets were used to calculate profit differences. Steers supple-mented an average of 5.3 lb/day of distill-ers grains were 90 lb heavier than either of the unsupplemented groups, which resulted in increased revenue of $49.38 for supplemented steers. Land costs were the same per AUM for all treatments but were decreased on a per head basis for pastures with supplemented cattle because cattle were stocked at higher rates than the control. Profit was greatest for the supplemented steers, although the relationship between prices for land, N fertilizer, and DDGS affects the relative profitability of the treatments.
Introduction
Supplementing cattle with dry dis-tiller’s grains with solubles (DDGS) supplies the cattle with excess N in their diet, which is excreted in the form of urea in the urine. Supple-menting with DDGS also increases ADG of the cattle and allows pas-tures to be stocked at the same rate as pastures fertilized with 80 lb N/acre in the spring (2009 Nebraska Beef Cattle Report, pp. 22-24). The objec-tive of this study was to examine the relationship between input costs and effects of different grazing manage-ment strategies utilizing DDGS on the profitability of backgrounding calves.
Procedure
Biological data were collected over a five-year period (2011 Nebraska Beef Cattle Report, pp. 24-25). Three grazing
strategies were evaluated: 1) Pastures fertilized in the spring with 80 lb/N acre and stocked at 4 AUM/acre; 2) Nonfertilized pastures with calves sup-plemented daily with DDGS at 0.6% of their BW and stocked at 4 AUM/acre; and 3) Control pastures with no fertil-izer applied or cattle supplementation and stocked at 2.8 AUM/acre.
Economics
All prices were based on averages from 2005-2009 (Table 1). Initial steer cost was based on average Nebraska sale barn prices in April for 700-750 lb steers. Yardage was included at $0.10 per steer daily to account for labor in building and maintaining fences as well as daily checking of animals and watering. An $8.33/steer health and processing fee was charged over the grazing period. Death loss of 0.5% was charged, based on initial steer cost. Cash rent for pastures was based on $23.86/AUM, the Nebraska aver-age pasture rent. Fertilizer prices of $419.20/ton were based on urea prices in April compiled by the National Agricultural Statistics Service (USDA, 2010) plus a $4.00/ton application fee. Interest rates were obtained from the Federal Reserve Bank of Kansas City and averaged 7.6%. Simple interest was charged on initial steer cost and
cash rent cost for one-half of the graz-ing period. DDGS prices in Nebraska from April through September were reported by USDA-AMS and averaged $116.80/ton on a 90% DM basis, plus a $24/ton delivery and handling fee. Prices for feeders in October at Nebras-ka sale barns were used to determine final live value on the steers. Because of the price slide associated with feeder cattle, different values were used for the unsupplemented steers compared to the supplemented steers because the supplemented steers gained more weight over the grazing season. Costs of gain (COG) over the grazing period were calculated by dividing total costs, minus initial steer cost and interest, by the total weight gained by the animal during the grazing season. Breakeven prices were calculated by dividing total costs by the final shrunk BW of the an-imal at the end of the grazing season. Profitability was calculated as total live value of the animal in October minus total costs during the grazing season.
Results
Initial cost of the steers was not different by treatment (P = 0.96) and averaged $794.69/head. Distillers grain costs for the supplemented cattle equaled $59.14/head based on steers
Table 1. Economic evaluation of grazing management and supplementation strategies for steers grazing smooth bromegrass.
CON FERT SUPP1 SEM P-value
Initial BW, lb 718 716 713 12.78 0.96Ending BW, lb 959a 954a 1046b 15.4 <0.01Head days 868 912 898 19.24 0.26Initial Cost, $/head 796.95 795.63 791.50 14.20 0.96DDGS, $/head 59.14Fertilizer, $/head 35.48Land Cash Rent, $/head 105.71 69.65 70.78Yardage, $/head 15.84 15.84 15.84Health and Processing, $/head 8.33 8.33 8.33Death Loss, $/head 3.98 3.98 3.96Interest, $/head 23.16 22.23 22.14Total Cost, $/head 953.97 951.14 971.69 14.63 0.56Total Revenue, $/head 947.77a 942.43a 994.48b 14.97 0.03Profit, $/head -6.20a -8.71a 22.79b 8.11 0.02COG, $/cwt gained 56.48a 56.86a 47.93b 0.02 <0.01Breakeven, $/cwt ending weight 99.46a 99.72a 92.89b 0.01 <0.01a,bMeans within a row with unlike superscripts differ (P < 0.05).1Pastures were either nonfertilized (CON), fertilized with N at 80 lb/acre (FERT), or nonfertilized and steers were supplemented with 0.6% of BW of DDGS daily for the entire grazing period (SUPP).
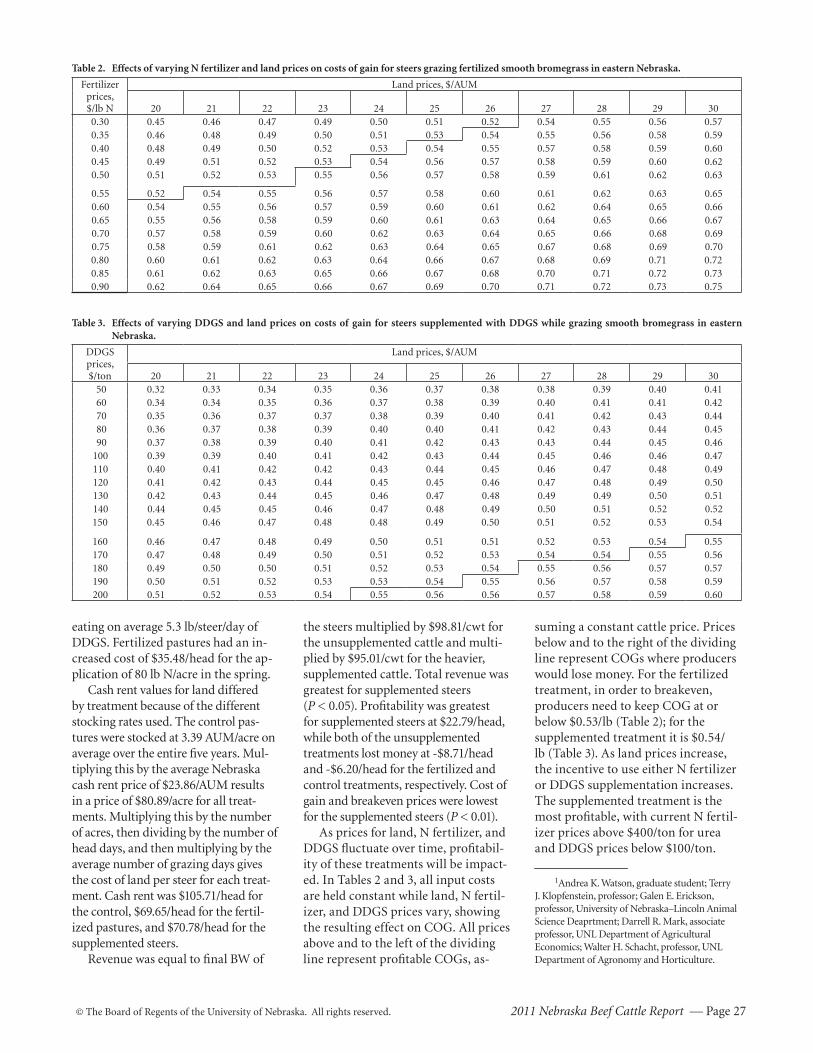
© The Board of Regents of the University of Nebraska. All rights reserved. 2011 Nebraska Beef Cattle Report — Page 27
eating on average 5.3 lb/steer/day of DDGS. Fertilized pastures had an in-creased cost of $35.48/head for the ap-plication of 80 lb N/acre in the spring.
Cash rent values for land differed by treatment because of the different stocking rates used. The control pas-tures were stocked at 3.39 AUM/acre on average over the entire five years. Mul-tiplying this by the average Nebraska cash rent price of $23.86/AUM results in a price of $80.89/acre for all treat-ments. Multiplying this by the number of acres, then dividing by the number of head days, and then multiplying by the average number of grazing days gives the cost of land per steer for each treat-ment. Cash rent was $105.71/head for the control, $69.65/head for the fertil-ized pastures, and $70.78/head for the supplemented steers.
Revenue was equal to final BW of
the steers multiplied by $98.81/cwt for the unsupplemented cattle and multi-plied by $95.01/cwt for the heavier, supplemented cattle. Total revenue was greatest for supplemented steers (P < 0.05). Profitability was greatest for supplemented steers at $22.79/head, while both of the unsupplemented treatments lost money at -$8.71/head and -$6.20/head for the fertilized and control treatments, respectively. Cost of gain and breakeven prices were lowest for the supplemented steers (P < 0.01).
As prices for land, N fertilizer, and DDGS fluctuate over time, profitabil-ity of these treatments will be impact-ed. In Tables 2 and 3, all input costs are held constant while land, N fertil-izer, and DDGS prices vary, showing the resulting effect on COG. All prices above and to the left of the dividing line represent profitable COGs, as-
suming a constant cattle price. Prices below and to the right of the dividing line represent COGs where producers would lose money. For the fertilized treatment, in order to breakeven, producers need to keep COG at or below $0.53/lb (Table 2); for the supplemented treatment it is $0.54/lb (Table 3). As land prices increase, the incentive to use either N fertilizer or DDGS supplementation increases. The supplemented treatment is the most profitable, with current N fertil-izer prices above $400/ton for urea and DDGS prices below $100/ton.
1Andrea K. Watson, graduate student; Terry J. Klopfenstein, professor; Galen E. Erickson, professor, University of Nebraska–Lincoln Animal Science Deaprtment; Darrell R. Mark, associate professor, UNL Department of Agricultural Economics; Walter H. Schacht, professor, UNL Department of Agronomy and Horticulture.
Table 2. Effects of varying N fertilizer and land prices on costs of gain for steers grazing fertilized smooth bromegrass in eastern Nebraska.
Fertilizer prices,$/lb N
Land prices, $/AUM
20 21 22 23 24 25 26 27 28 29 300.30 0.45 0.46 0.47 0.49 0.50 0.51 0.52 0.54 0.55 0.56 0.570.35 0.46 0.48 0.49 0.50 0.51 0.53 0.54 0.55 0.56 0.58 0.590.40 0.48 0.49 0.50 0.52 0.53 0.54 0.55 0.57 0.58 0.59 0.600.45 0.49 0.51 0.52 0.53 0.54 0.56 0.57 0.58 0.59 0.60 0.620.50 0.51 0.52 0.53 0.55 0.56 0.57 0.58 0.59 0.61 0.62 0.63
0.55 0.52 0.54 0.55 0.56 0.57 0.58 0.60 0.61 0.62 0.63 0.650.60 0.54 0.55 0.56 0.57 0.59 0.60 0.61 0.62 0.64 0.65 0.660.65 0.55 0.56 0.58 0.59 0.60 0.61 0.63 0.64 0.65 0.66 0.670.70 0.57 0.58 0.59 0.60 0.62 0.63 0.64 0.65 0.66 0.68 0.690.75 0.58 0.59 0.61 0.62 0.63 0.64 0.65 0.67 0.68 0.69 0.700.80 0.60 0.61 0.62 0.63 0.64 0.66 0.67 0.68 0.69 0.71 0.720.85 0.61 0.62 0.63 0.65 0.66 0.67 0.68 0.70 0.71 0.72 0.730.90 0.62 0.64 0.65 0.66 0.67 0.69 0.70 0.71 0.72 0.73 0.75
Table 3. Effects of varying DDGS and land prices on costs of gain for steers supplemented with DDGS while grazing smooth bromegrass in eastern Nebraska .
DDGS prices,$/ton
Land prices, $/AUM
20 21 22 23 24 25 26 27 28 29 30 50 0.32 0.33 0.34 0.35 0.36 0.37 0.38 0.38 0.39 0.40 0.41 60 0.34 0.34 0.35 0.36 0.37 0.38 0.39 0.40 0.41 0.41 0.42 70 0.35 0.36 0.37 0.37 0.38 0.39 0.40 0.41 0.42 0.43 0.44 80 0.36 0.37 0.38 0.39 0.40 0.40 0.41 0.42 0.43 0.44 0.45 90 0.37 0.38 0.39 0.40 0.41 0.42 0.43 0.43 0.44 0.45 0.46100 0.39 0.39 0.40 0.41 0.42 0.43 0.44 0.45 0.46 0.46 0.47110 0.40 0.41 0.42 0.42 0.43 0.44 0.45 0.46 0.47 0.48 0.49120 0.41 0.42 0.43 0.44 0.45 0.45 0.46 0.47 0.48 0.49 0.50130 0.42 0.43 0.44 0.45 0.46 0.47 0.48 0.49 0.49 0.50 0.51140 0.44 0.45 0.45 0.46 0.47 0.48 0.49 0.50 0.51 0.52 0.52150 0.45 0.46 0.47 0.48 0.48 0.49 0.50 0.51 0.52 0.53 0.54
160 0.46 0.47 0.48 0.49 0.50 0.51 0.51 0.52 0.53 0.54 0.55170 0.47 0.48 0.49 0.50 0.51 0.52 0.53 0.54 0.54 0.55 0.56180 0.49 0.50 0.50 0.51 0.52 0.53 0.54 0.55 0.56 0.57 0.57190 0.50 0.51 0.52 0.53 0.53 0.54 0.55 0.56 0.57 0.58 0.59200 0.51 0.52 0.53 0.54 0.55 0.56 0.56 0.57 0.58 0.59 0.60
Page 28 — 2011 Nebraska Beef Cattle Report © The Board of Regents of the University of Nebraska. All rights reserved.
Replacement of Grazed Forage with WDGS and Poor Quality Hay Mixtures
Sandra VillasantiL. Aaron Stalker
Terry J. KlopfensteinWalter H. SchachtJerry D. Volesky1
Summary
A grazing study was conducted at the Gudmundsen Sandhills Laboratory, Whitman, Neb., to evaluate the effects of mixtures of wet distillers grains (WDGS) and straw or hay on grazed forage intake. There was no difference in ADG between the control and 70% hay/30% WDGS; however, steers supplemented with 60:40 blends of straw or hay with WDGS had higher ADG than the other two treatments. Range forage intake was decreased by 44% to 54% when steers were supplemented with the mixes. Feeding a mixture of WDGS and low-quality harvested-forage to cattle grazing rangeland may allow increasing stocking rate without decreasing animal performance.
Introduction
The increasing value of rangelands has led producers to look for alterna-tives that allow stocking rates to increase without needing additional land. With increased production of ethanol in Nebraska, the supply of wet distillers grains plus solubles (WDGS) is increasing, making the prices competitive relative to rangeland forage. Because intake in grazing situations is limited by fill, replacement of grazed forage using low-quality harvested forages mixed with WDGS to increase palatability seems to be a good way to increase carrying capacity or provide additional forage in years affected by drought. Previous research has shown mixing WDGS with wheat straw decreased grazed forage intake and improved animal performance (2008 Nebraska Beef Cattle Report, pp.
29-31; 2010 Nebraska Beef Cattle Report, pp. 19-21). However, low-quality hay is more readily available than wheat straw in the Sandhills. The objective of our study was to determine the effect of supplementing WDGS mixed with low-quality hay compared to wheat straw on range forage replacement and animal performance.
Procedure
The experiment was conducted during the summer of 2009 at the University of Nebraska Gudmundsen Sandhills Laboratory located near Whitman, Neb. Treatments were assigned randomly to 20 paddocks and consisted of: 1) control (CON) at the recommended stocking rate (0.7 AUM/acre), 2) double stocked (1.32 AUM/acre) and supplemented with a mixture of 60% straw and 40% WDGS (STRAW), 3) double stocked (1.37 AUM/acre) and supplemented with 60% hay and 40% WDGS (LOHAY), and 4) double stocked (1.36 AUM/acre) and supplemented with 70% hay and 30% WDGS (HIHAY).
Forty summer-born yearling steers (712 ± 75 lb initial weight) were stratified by BW and assigned randomly to treatment, using five steers per replication (two blocks). Steers were limit fed a mixture of 60% hay and 40% WDGS at 2% of BW daily for five days to eliminate variation due to gut fill, and weighed for three consecutive days at the beginning and at the end of the trial. The averages of the three-day weights were used as the initial and ending body weights. Cattle in the control treatment received 0.8 lb/day of a protein supplement to meet their metabolizable protein requirements, composed of 50% soypass, 45% corn gluten meal, and 5% molasses. The WDGS and hay or straw were mixed in a vertical mixer and stored in silage bags for 30 days prior to the
initiation of the trial. Cattle in the supplemented treatments were offered 8 lb/steer DM daily of the mixes in feed bunks located next to the paddocks to accurately measure any feed refusals.
The experiment was replicated over two blocks based on location (east and west) due to variations in species composition and topography. Within a block, each treatment was applied to five paddocks that were rotationally grazed, with a single occupation per paddock, during the experimental period of 68 days from June 18 to Aug. 26, with days of grazing per paddock adjusted to account for stage of plant growth. The control paddocks had 2.4 acres while the paddocks grazed at double stocking rates were divided in half on a diagonal with a temporary electric fence to decrease area of grazing, allowing the cattle to graze 1.2 acre per grazing period.
At the conclusion of grazing of each paddock, standing crop was determined by clipping all standing vegetation at ground level in 5 randomly placed quadrats (2.69 ft2) in each paddock. Samples were sorted by live grass, standing dead grass, forbs, shrubs, and litter. Samples were dried in a forced air oven for 48 hours at 60oC. Forage quality IVOMD, CP, and NDF were analyzed from extrusa samples collected from each paddock at midpoint of grazing period using esophageally fistulated cows. In vitro organic matter digestibility was determined using the Tilley and Terry method (1963) modified by the addition of 1g/L of urea to the McDougall’s buffer. Two separate in vitro runs were conducted and five forage standards of different qualities and known in vivo OM digestibilities were included in all of the IVOMD runs. To correct the IVOMD to in vivo values, regression equations were generated for each run, by regressing the IVOMD values of the standards
© The Board of Regents of the University of Nebraska. All rights reserved. 2011 Nebraska Beef Cattle Report — Page 29
(Continued on next page)
on their known digestibilities. Range forage intake was estimated
using the 1996 beef NRC model. The model uses net energy content of the diet in conjunction with feed intake to predict animal performance. Therefore, if animal performance and energy values of the supplements and range forage consumed are known, range forage intake can be predicted. Data for animal ADG, supplement intake, and energy content of the supplements were obtained from the trial. Net energy for maintenance and gain were calculated from in vitro estimates of TDN using the NE equations in the Beef NRC. All data were analyzed using the MIXED procedure of SAS (SAS Inst. Inc., Cary, N.C.).
Results
Similar ADG was observed for the CON and HIHAY treatments (P = 0.46); however, steers in the LOHAY and STRAW treatments showed significantly higher ADG than the steers in the CON (P < 0.05). Steers in the LOHAY and STRAW treatments also outgained HIHAY treatment steers by 0.28 lb and 0.26 lb per day, respectively (P < 0.05; Table 1). These data show animal performance was either not affected or improved when supplementing with low-quality forage mixed with WDGS.
Range forage quality was not
affected by supplementation treatment. During the grazing period, average values of 54%, 73%, and 7.9% were found for IVOMD, NDF, and CP, respectively. Table 2 shows the variation in range forage quality through the grazing season. IVOMD decreased during the grazing period, with highest value observed early in the season in the first paddock (55%) and the lowest towards the end of the season in the fourth paddock (52%). Variation in NDF did not show a consistent pattern, decreasing from 73% to 68% from paddock 1 to 3 and then increasing again to 78% from paddock 3 to 5 (P < 0.05). Average percentages of CP tended to decline during the grazing period, with 8.8% and 9.1% early and 7.7%, 7.1% and 6.8% late (P < 0.05). From these results it can be observed that forage quality decreased later in the growing season. This could be attributable to the fact that nutrient content decreases as the plant becomes more mature later in the growing season, and also to the large amount of rainfall that occurred during the experimental period, which caused the forage to grow and mature even more rapidly, increasing forage availability but decreasing forage quality.
Daily range forage and supplement intakes are presented in Table 3. Supplementation with a low-quality harvested forage and WDGS reduced intake of range forage by 54%, 48% and 44% for the HIHAY, STRAW,
and LOHAY treatments, respectively, compared to the CON. A difference also was detected between the HIHAY and LOHAY treatments; steers offered the mix with higher proportion of hay consumed 26% less grazed forage than the animals in the LOHAY treatment. Grazed forage intake for steers in the STRAW treatment was intermediate between the LOHAY and HIHAY treatments. Consumption of the supplement was not different among treatments, with steers consuming 0.92% BW of the mixes. Total DMI was similar among treatments, varying between 17.8 lb and 15.8 lb — the highest value for the CON and the lowest for the HIGH treatment. Considering the amount of range forage replaced and the amount of supplement consumed by the supplemented treatments, we calculate that 1 lb of the HIHAY, LOHAY, and STRAW treatments replaced 1.28 lb, 1.11 lb, and 1.18 lb of range forage, respectively.
The amount of standing crop after the paddocks were grazed was significantly higher for the CON than for the other three treatments (P < 0.05); however, there was not a significant difference among the supplemented treatments (Table 3). Since the stocking rates were doubled in the supplemented groups, less standing crop might be expected for these groups. However, our objective was to replace range forage with the mixtures of hay (straw) and WDGS. The lower standing crop at conclusion of grazing indicates we were not completely successful. Perhaps more of the mixtures should have been fed. On average, the mixtures were 44% of total intake.
Total NDF consumed was examined to see if it had an effect on DMI (Table 3). Diets composed of forages are thought to be limited by physical distention in the gastrointestinal tract. When NDF from total DMI was considered, steers in the CON treatment showed higher NDF intake (12.9 lb) than the steers in the supplemented groups;
Table 1. Animal performance.
Control High Low Straw SE P-value
Initial BW (lb) 722 720 727 706 26.16 0.95Ending BW (lb) 795 797 823 798 24 0.82ADG (lb) 1.08a 1.13a 1.42b 1.40b 0.11 0.04
a,bDifferent letters represent differences between treatments (P < 0.05).
Table 2. Forage quality by paddock (time)1
Item 1 2 3 4 5 SE P-value
IVOMD % 55a 54ab 53ab 52b 53ab 0.71 0.03NDF % 73ab 73ab 68a 73ab 78b 2.97 0.04CP % 8.8a 9.1a 7.7b 7.1b 6.8b 0.32 <0.001
1Sequence of grazing of paddocks, June 18 to Aug. 26.a,bDifferent letters represent differences between treatments (P < 0.05).

Page 30 — 2011 Nebraska Beef Cattle Report © The Board of Regents of the University of Nebraska. All rights reserved.
however, NDF intake was similar among the HIHAY, LOHAY and STRAW treatments (10.7, 11.3, and 11 lb respectively). Even though NDF intakes between supplemented and control treatments were not the same, there could have been a similar filling effect, since a great percentage of the NDF in supplemented groups came from hay and wheat straw that are composed mainly of stems, which are more bulky than grazed forage.
The findings of this study show mixing WDGS with low-quality forage is an effective tool to increase stocking rates without hurting animal
performance, and the reduction in intake increased with the level of fiber in the supplement. From these results the 70:30 blend seems to be the best combination to get the higher amount of grazed forage replacement.
1Sandra Villasanti, graduate student, University of Nebraska–Lincoln, Department of Animal Science; L. Aaron Stalker, assistant professor, West Central Research and Extension Center, North Platte, Neb.; Walter H. Schacht, professor, UNL Department of Agronomy and Horticulture; Jerry D. Volesky, associate professor, West Central Research and Extension Center; Terry J. Klopfenstein, professor, UNL Department of Animal Science.
Table 3. Range forage, mix, and NDF intake, and standing crop residue.
Control HIHAY LOHAY Straw SE P-value
Range forage intake (lb) 17.8 8.3 9.9 9.4 Mix intake (lb) 0 7.5 7 7.2 Total DM intake (lb) 17.8 15.8 16.9 16.6 NDF intake (lb) 12.9 10.7 11.3 11 Standing crop (lb/acre) 980a 707b 729b 707b 47 0.0013
a,bDifferent letters represent differences between treatments (P < 0.05).

© The Board of Regents of the University of Nebraska. All rights reserved. 2011 Nebraska Beef Cattle Report — Page 31
(Continued on next page)
Supplementing Modified Wet Distillers Grains with Solubles to Long Yearling Steers Grazing Native Range
Kelsey M. RolfeWilliam A. Griffin
Terry J. KlopfensteinGalen E. EricksonDennis E. Bauer1
Summary
Modified wet distillers grains with solubles (MDGS) were supplemented on the ground to yearling steers with access to native range during summer grazing. Supplemented steers had greater ADG than non-supplemented steers, and were heavier entering the feedlot. Supplemented steers also required 24 fewer days in the feedlot to reach a constant end point, compared to non-supplemented steers. Energy calculations suggest 1.0 lb of MDGS replaced 0.65 lb of summer range.
Introduction
Yearling production systems capitalize on the use of the animal to harvest forage, as opposed to more intensive systems that require harvested forages and longer grain feeding. Yearling production systems are further segregated into: short yearlings, which are received in the fall, backgrounded during the winter, then re-enter the feedlot in the spring; or long yearlings, which are received in the fall and backgrounded for approximately one year, at which time they re-enter the feedlot. Co-products of the corn dry milling industry fit well into forage production systems, because distillers grains provide a highly fermentable fiber source that does not negatively impact forage digestion (2004 Nebraska Beef Cattle Report, pp. 22-24), and also supply additional UIP to meet metabolizable protein deficiencies common to lighter weight cattle grazing forage.
The objective of the current
research was to determine effects of supplementing modified wet distillers grains with solubles (MDGS) on the ground to long yearling steers while grazing native Sandhills range.
Procedure
Two hundred forty long yearling steers (BW = 505 ± 14 lb) were backgrounded on cornstalk residue from late fall to mid-spring (145 days) in 2007 and 2008. While grazing cornstalks, calves were supplemented 5.0 lb/steer daily of Sweet Bran® (Cargill, Blair, Neb.) each year. Following backgrounding, steers were allowed to graze smooth bromegrass pastures for approximately 21 days. Before grazing smooth bromegrass pastures, calves were weighed, stratified by BW, and assigned randomly to summer grazing treatments. After grazing brome, steers were relocated to graze Sandhills range at the University of Nebraska Barta Brothers Ranch near Rose, Neb. Summer grazing treatments included: grazing native range with no supplementation (CON), and grazing native range with MDGS supplementation at 0.6% BW (SUPP). Weights were projected using ADG for determination of summer grazing supplementation. Modified wet distillers grains with solubles were fed daily on the ground with a tractor and feed wagon, allowing steers to be distributed to different locations within each pasture at the time of feeding. Steers grazed Sandhills range for an average of 136 days before entering the feedlot in late September each year. Steers were limit fed at 1.8% BW (DM basis) for five days before smooth-bromegrass grazing and after summer grazing; initial and final BW for summer were the mean of weights taken on two consecutive days. Upon re-entry in the feedlot, steers were
targeted to harvest at a constant backfat depth of 5 inches.
Data were analyzed using the Mixed Procedure of SAS (SAS Institute, Cary N.C.) as a completely randomized design; feedlot pen was the experimental unit. Summer grazing treatment was considered a fixed effect, with animal nested within summer grazing treatment and residual as random effects.
Results
At the time of summer treatment assignment, BW was not different between SUPP and CON steers (P = 0.36); however, SUPP steers had 0.68 lb greater (P < 0.01) ADG during summer grazing than CON steers (Table 1). Consequently, SUPP steers were 103 lb heavier (P < 0.01) than CON steers at feedlot entry. When taken to a constant end point, SUPP steers required 24 fewer (P < 0.01) days on feed during the finishing phase, compared to CON steers.
Using summer performance data, in vitro dry matter digestibility of the native Sandhills range from the two previous years, and NRC energy equations, it was determined that 0.65 lb grass was saved for every 1.0 lb MDGS fed (DM basis). Based on previous research (2010 Nebraska Beef Cattle Report, pp. 17-18), loss of MDGS fed on the ground was estimated at 15%, which was accounted for when estimating forage replacement. Also, based on visual appraisal, feeding MDGS on the ground did not have a negative impact on native range.
A meta-analysis of 12 pasture grazing experiments (2009 Nebraska Beef Cattle Report, pp. 37-39) where dried distillers grains with solubles (DDGS) was fed in a bunk, found a quadratic response to DDGS for ADG
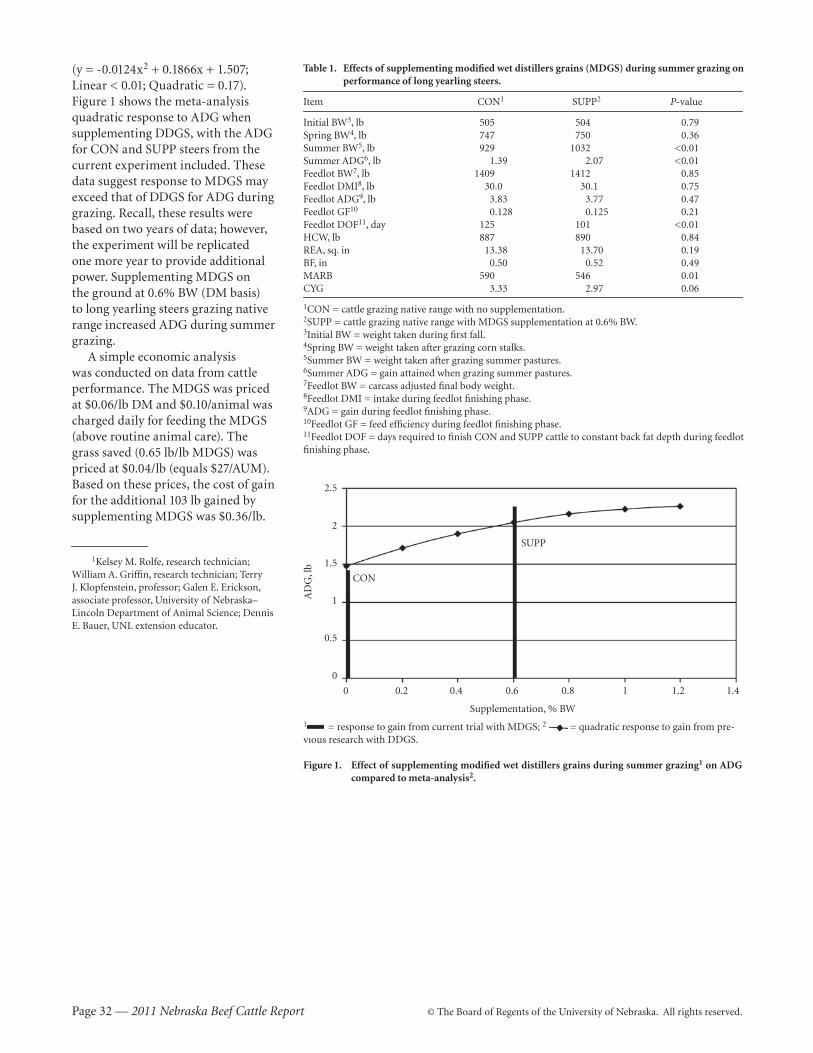
Page 32 — 2011 Nebraska Beef Cattle Report © The Board of Regents of the University of Nebraska. All rights reserved.
(y = -0.0124x2 + 0.1866x + 1.507; Linear < 0.01; Quadratic = 0.17). Figure 1 shows the meta-analysis quadratic response to ADG when supplementing DDGS, with the ADG for CON and SUPP steers from the current experiment included. These data suggest response to MDGS may exceed that of DDGS for ADG during grazing. Recall, these results were based on two years of data; however, the experiment will be replicated one more year to provide additional power. Supplementing MDGS on the ground at 0.6% BW (DM basis) to long yearling steers grazing native range increased ADG during summer grazing.
A simple economic analysis was conducted on data from cattle performance. The MDGS was priced at $0.06/lb DM and $0.10/animal was charged daily for feeding the MDGS (above routine animal care). The grass saved (0.65 lb/lb MDGS) was priced at $0.04/lb (equals $27/AUM). Based on these prices, the cost of gain for the additional 103 lb gained by supplementing MDGS was $0.36/lb.
1Kelsey M. Rolfe, research technician; William A. Griffin, research technician; Terry J. Klopfenstein, professor; Galen E. Erickson, associate professor, University of Nebraska–Lincoln Department of Animal Science; Dennis E. Bauer, UNL extension educator.
0 0.2 0.4 0.6 0.8 1 1.2 1.4
Supplementation, % BW
1 = response to gain from current trial with MDGS; 2 = quadratic response to gain from pre-vious research with DDGS.
Figure 1. Effect of supplementing modified wet distillers grains during summer grazing1 on ADG compared to meta-analysis2.
2.5
2
1.5
1
0.5
0
AD
G, l
b
CON
SUPP
Table 1. Effects of supplementing modified wet distillers grains (MDGS) during summer grazing on performance of long yearling steers.
Item CON1 SUPP2 P-value
Initial BW3, lb 505 504 0.79Spring BW4, lb 747 750 0.36 Summer BW5, lb 929 1032 <0.01Summer ADG6, lb 1.39 2.07 <0.01Feedlot BW7, lb 1409 1412 0.85Feedlot DMI8, lb 30.0 30.1 0.75Feedlot ADG9, lb 3.83 3.77 0.47Feedlot GF10 0.128 0.125 0.21Feedlot DOF11, day 125 101 <0.01HCW, lb 887 890 0.84REA, sq. in 13.38 13.70 0.19BF, in 0.50 0.52 0.49MARB 590 546 0.01CYG 3.33 2.97 0.06
1CON = cattle grazing native range with no supplementation.2SUPP = cattle grazing native range with MDGS supplementation at 0.6% BW.3Initial BW = weight taken during first fall.4Spring BW = weight taken after grazing corn stalks.5Summer BW = weight taken after grazing summer pastures.6Summer ADG = gain attained when grazing summer pastures.7Feedlot BW = carcass adjusted final body weight.8Feedlot DMI = intake during feedlot finishing phase.9ADG = gain during feedlot finishing phase.10Feedlot GF = feed efficiency during feedlot finishing phase.11Feedlot DOF = days required to finish CON and SUPP cattle to constant back fat depth during feedlot finishing phase.
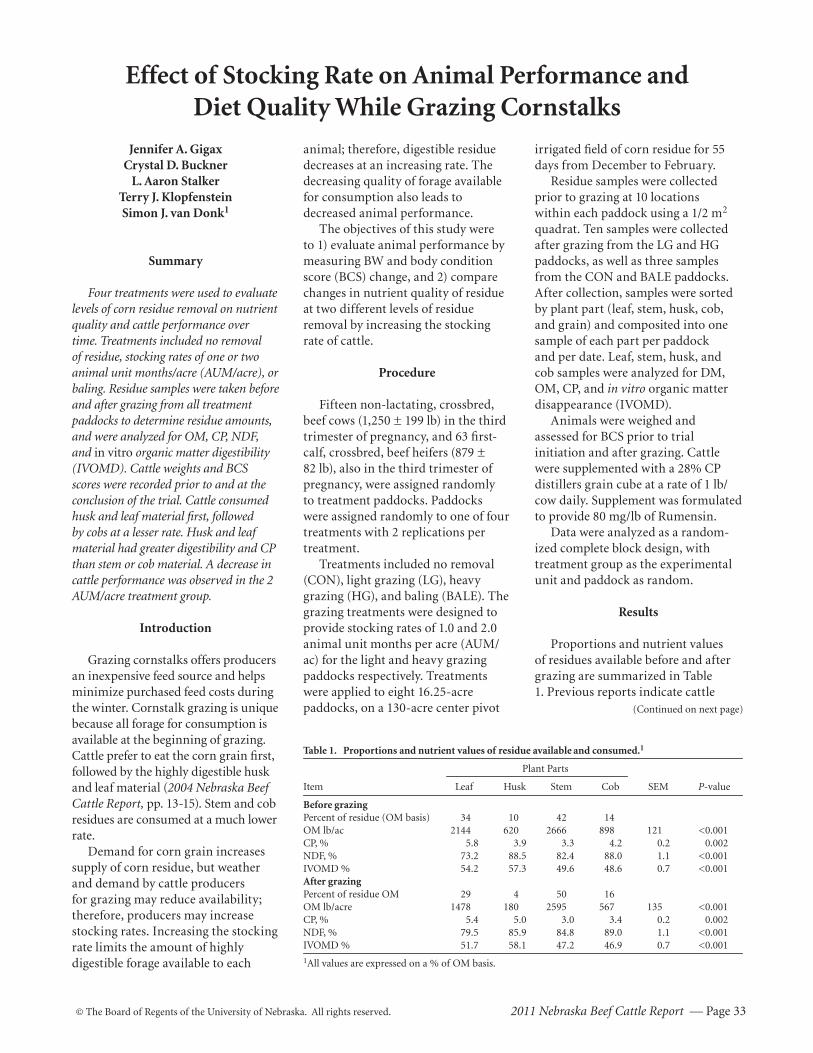
© The Board of Regents of the University of Nebraska. All rights reserved. 2011 Nebraska Beef Cattle Report — Page 33
Effect of Stocking Rate on Animal Performance and Diet Quality While Grazing Cornstalks
Jennifer A. GigaxCrystal D. Buckner
L. Aaron StalkerTerry J. KlopfensteinSimon J. van Donk1
Summary
Four treatments were used to evaluate levels of corn residue removal on nutrient quality and cattle performance over time. Treatments included no removal of residue, stocking rates of one or two animal unit months/acre (AUM/acre), or baling. Residue samples were taken before and after grazing from all treatment paddocks to determine residue amounts, and were analyzed for OM, CP, NDF, and in vitro organic matter digestibility (IVOMD). Cattle weights and BCS scores were recorded prior to and at the conclusion of the trial. Cattle consumed husk and leaf material first, followed by cobs at a lesser rate. Husk and leaf material had greater digestibility and CP than stem or cob material. A decrease in cattle performance was observed in the 2 AUM/acre treatment group.
Introduction
Grazing cornstalks offers producers an inexpensive feed source and helps minimize purchased feed costs during the winter. Cornstalk grazing is unique because all forage for consumption is available at the beginning of grazing. Cattle prefer to eat the corn grain first, followed by the highly digestible husk and leaf material (2004 Nebraska Beef Cattle Report, pp. 13-15). Stem and cob residues are consumed at a much lower rate.
Demand for corn grain increases supply of corn residue, but weather and demand by cattle producers for grazing may reduce availability; therefore, producers may increase stocking rates. Increasing the stocking rate limits the amount of highly digestible forage available to each
animal; therefore, digestible residue decreases at an increasing rate. The decreasing quality of forage available for consumption also leads to decreased animal performance.
The objectives of this study were to 1) evaluate animal performance by measuring BW and body condition score (BCS) change, and 2) compare changes in nutrient quality of residue at two different levels of residue removal by increasing the stocking rate of cattle.
Procedure
Fifteen non-lactating, crossbred, beef cows (1,250 ± 199 lb) in the third trimester of pregnancy, and 63 first-calf, crossbred, beef heifers (879 ± 82 lb), also in the third trimester of pregnancy, were assigned randomly to treatment paddocks. Paddocks were assigned randomly to one of four treatments with 2 replications per treatment.
Treatments included no removal (CON), light grazing (LG), heavy grazing (HG), and baling (BALE). The grazing treatments were designed to provide stocking rates of 1.0 and 2.0 animal unit months per acre (AUM/ac) for the light and heavy grazing paddocks respectively. Treatments were applied to eight 16.25-acre paddocks, on a 130-acre center pivot
irrigated field of corn residue for 55 days from December to February.
Residue samples were collected prior to grazing at 10 locations within each paddock using a 1/2 m2
quadrat. Ten samples were collected after grazing from the LG and HG paddocks, as well as three samples from the CON and BALE paddocks. After collection, samples were sorted by plant part (leaf, stem, husk, cob, and grain) and composited into one sample of each part per paddock and per date. Leaf, stem, husk, and cob samples were analyzed for DM, OM, CP, and in vitro organic matter disappearance (IVOMD).
Animals were weighed and assessed for BCS prior to trial initiation and after grazing. Cattle were supplemented with a 28% CP distillers grain cube at a rate of 1 lb/cow daily. Supplement was formulated to provide 80 mg/lb of Rumensin.
Data were analyzed as a random-ized complete block design, with treatment group as the experimental unit and paddock as random.
Results
Proportions and nutrient values of residues available before and after grazing are summarized in Table 1. Previous reports indicate cattle
(Continued on next page)
Table 1. Proportions and nutrient values of residue available and consumed.1
Plant Parts
Item Leaf Husk Stem Cob SEM P-value
Before grazing Percent of residue (OM basis) 34 10 42 14OM lb/ac 2144 620 2666 898 121 <0.001CP, % 5.8 3.9 3.3 4.2 0.2 0.002NDF, % 73.2 88.5 82.4 88.0 1.1 <0.001IVOMD % 54.2 57.3 49.6 48.6 0.7 <0.001After grazingPercent of residue OM 29 4 50 16OM lb/acre 1478 180 2595 567 135 <0.001CP, % 5.4 5.0 3.0 3.4 0.2 0.002NDF, % 79.5 85.9 84.8 89.0 1.1 <0.001IVOMD % 51.7 58.1 47.2 46.9 0.7 <0.001
1All values are expressed on a % of OM basis.
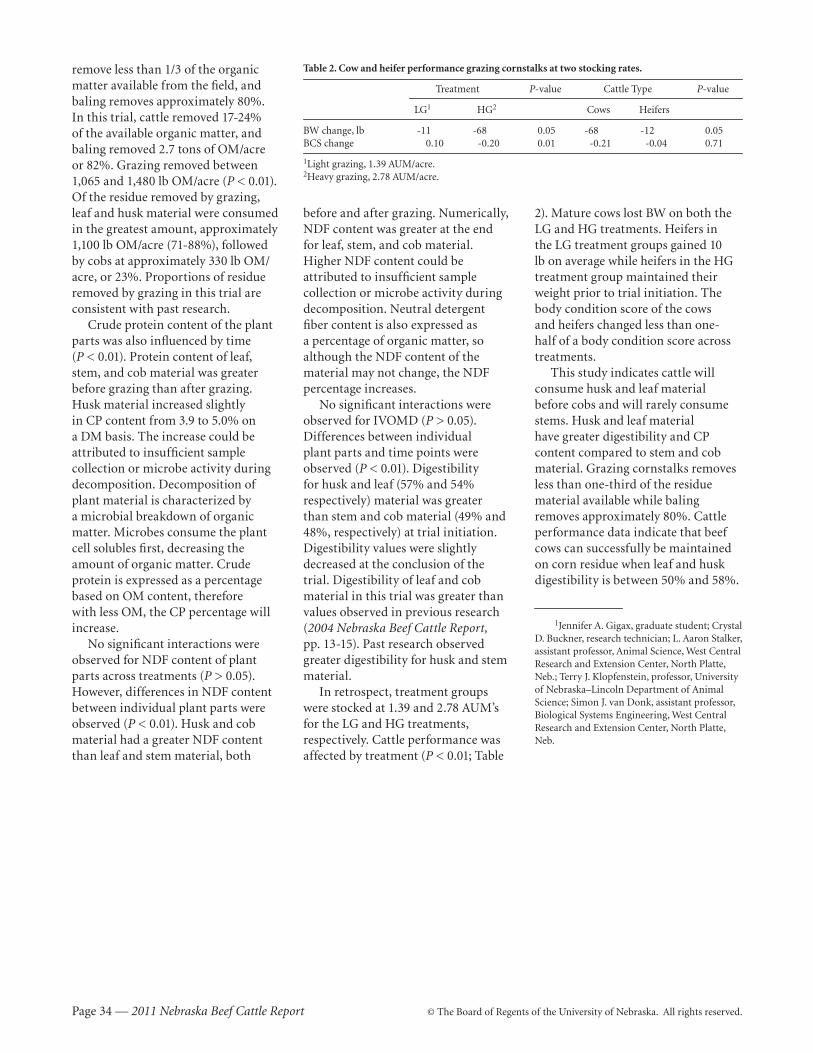
Page 34 — 2011 Nebraska Beef Cattle Report © The Board of Regents of the University of Nebraska. All rights reserved.
remove less than 1/3 of the organic matter available from the field, and baling removes approximately 80%. In this trial, cattle removed 17-24% of the available organic matter, and baling removed 2.7 tons of OM/acre or 82%. Grazing removed between 1,065 and 1,480 lb OM/acre (P < 0.01). Of the residue removed by grazing, leaf and husk material were consumed in the greatest amount, approximately 1,100 lb OM/acre (71-88%), followed by cobs at approximately 330 lb OM/acre, or 23%. Proportions of residue removed by grazing in this trial are consistent with past research.
Crude protein content of the plant parts was also influenced by time (P < 0.01). Protein content of leaf, stem, and cob material was greater before grazing than after grazing. Husk material increased slightly in CP content from 3.9 to 5.0% on a DM basis. The increase could be attributed to insufficient sample collection or microbe activity during decomposition. Decomposition of plant material is characterized by a microbial breakdown of organic matter. Microbes consume the plant cell solubles first, decreasing the amount of organic matter. Crude protein is expressed as a percentage based on OM content, therefore with less OM, the CP percentage will increase.
No significant interactions were observed for NDF content of plant parts across treatments (P > 0.05). However, differences in NDF content between individual plant parts were observed (P < 0.01). Husk and cob material had a greater NDF content than leaf and stem material, both
before and after grazing. Numerically, NDF content was greater at the end for leaf, stem, and cob material. Higher NDF content could be attributed to insufficient sample collection or microbe activity during decomposition. Neutral detergent fiber content is also expressed as a percentage of organic matter, so although the NDF content of the material may not change, the NDF percentage increases.
No significant interactions were observed for IVOMD (P > 0.05). Differences between individual plant parts and time points were observed (P < 0.01). Digestibility for husk and leaf (57% and 54% respectively) material was greater than stem and cob material (49% and 48%, respectively) at trial initiation. Digestibility values were slightly decreased at the conclusion of the trial. Digestibility of leaf and cob material in this trial was greater than values observed in previous research (2004 Nebraska Beef Cattle Report, pp. 13-15). Past research observed greater digestibility for husk and stem material.
In retrospect, treatment groups were stocked at 1.39 and 2.78 AUM’s for the LG and HG treatments, respectively. Cattle performance was affected by treatment (P < 0.01; Table
2). Mature cows lost BW on both the LG and HG treatments. Heifers in the LG treatment groups gained 10 lb on average while heifers in the HG treatment group maintained their weight prior to trial initiation. The body condition score of the cows and heifers changed less than one-half of a body condition score across treatments.
This study indicates cattle will consume husk and leaf material before cobs and will rarely consume stems. Husk and leaf material have greater digestibility and CP content compared to stem and cob material. Grazing cornstalks removes less than one-third of the residue material available while baling removes approximately 80%. Cattle performance data indicate that beef cows can successfully be maintained on corn residue when leaf and husk digestibility is between 50% and 58%.
1Jennifer A. Gigax, graduate student; Crystal D. Buckner, research technician; L. Aaron Stalker, assistant professor, Animal Science, West Central Research and Extension Center, North Platte, Neb.; Terry J. Klopfenstein, professor, University of Nebraska–Lincoln Department of Animal Science; Simon J. van Donk, assistant professor, Biological Systems Engineering, West Central Research and Extension Center, North Platte, Neb.
Table 2. Cow and heifer performance grazing cornstalks at two stocking rates.
Treatment P-value Cattle Type P-value
LG1 HG2 Cows Heifers
BW change, lb -11 -68 0.05 -68 -12 0.05BCS change 0.10 -0.20 0.01 -0.21 -0.04 0.71
1Light grazing, 1.39 AUM/acre.2Heavy grazing, 2.78 AUM/acre.
© The Board of Regents of the University of Nebraska. All rights reserved. 2011 Nebraska Beef Cattle Report — Page 35
Digestibility of Crop Residues After Chemical Treatment and Anaerobic Storage
Adam L. ShreckCrystal D. BucknerGalen E. Erickson
Terry J. KlopfensteinMichael J. Cecava1
Summary
Two experiments were conducted to evaluate factors affecting crop residue digestibility. Corn stover, corn cobs, and wheat straw were alkaline treated at low (35%) or high (50%) moisture and then anaerobically stored at 30oC or 40oC. Chemical treatment increased in vitro DM digestibility of all residues by 14 to 21 percentage units (35% to 62% improvement ). Samples stored at 50% DM and 40oC were most digestible. Cobs were inherently more digestible than straw or corn stalks. Percentage of total improvement in DM digest-ibility by optimizing DM, ambient tem-perature, and chemical treatment was: stalks, 43%; wheat straw, 38%;, and cobs, 34%. Digestibility of low quality crop residues can be improved markedly by chemical treatment.
Introduction
Agricultural crop residues typically are used as roughage or bedding for cattle because of their inherent poor digestibility. Many studies have shown that digestibility of forages and crop residues can be improved by treat-ment with sodium hydroxide, calcium oxide, or a blend of the two. Histori-cally, the improvements in digestibil-ity from calcium oxide have been moderate. Calcium oxide compared to sodium hydroxide, however, is easier to handle and presents lesser human health risks. Therefore, the objective of this study was to determine the optimum treatment combinations for improving DM and fiber digestibility of different crop residues for eventual on-farm treatment options.
Procedure
Experiment 1
The first experiment was designed as a 3x4x2 factorial with 4 replica-tions. Treatments included: three crop residues (ground stalks, corn cobs, and wheat straw), four chemical treatments (5% CaO, 4% CaO +1% NaOH, and 3% CaO +2% NaOH plus a control stored anaerobicaly), and moisture content (35% and 50% DM). The CaO was standard quicklime (Mississippi Lime Company, Kansas City, Mo.). The CaO and NaOH (pel-lets) were solubilized in water to form concentrated caustic solutions, which then were applied to residues. Chemi-cal treatments were applied to forage on a DM basis, along with water, to the targeted DM level. Samples were mixed in a batch mixer and sealed us-ing a food grade vacuum bagger. Bags were stored anaerobically at room temperature and allowed to react for 30 days. Bags were then opened and sampled. Samples were freeze dried and ground to pass through a 1-mm screen. Samples were assayed for in vitro DM digestibility (IVDMD). Inoculum for IVDMD was obtained by collecting a mixture of rumen fluid (strained through four layers of cheesecloth) from two steers consum-ing a 30% concentrate–70% rough-age diet. Inoculum was mixed with McDougall’s buffer at a 1:1 ratio along with 1 gram of urea/L of rumen fluid. A 0.5 gram sample was added to a 200 mL test tube, and 50 mL of inoculum was added. Test tubes were placed in a water bath at 39oC and allowed to fer-ment for 48 hours. Fermentation was ended by adding 6 mL of 20% HCl per test tube, along with 2 ml of 5% pep-sin solution. Tubes were placed back in the water bath for an additional 24 hours. Residue was filtered, dried at 100oC, and weighed to determine IVDMD.
Experiment 2
A second experiment was con-ducted to evaluate the effects of temperature and storage time on digestibility. The experiment was designed as a 2x3x2x3 factorial with 3 replications. Treatments included two chemical treatments (5% CaO, and 3% CaO +2% NaOH), three crop resi-dues (ground stalks, corn cobs, and wheat straw), two temperatures (40oC or ambient temperature), and three storage times (7, 14, and 28 days). Water was added during treatment to adjust all samples to 60% DM. Effects of temperature were applied using an incubator set at 40oC. All other procedures (application of chemical treatment and analysis) were the same as Experiment 1.
Statistical Analysis
Data were analyzed using the MIXED procedure of SAS (SAS Institute , Cary, N.C.). The effects of treatment and all interactions were analyzed and separated using the pDiff option.
Results
Experiment 1
Data are summarized in Table 1. The three-way interaction between crop residue type, treatment, and DM was significant. All main effects were significant. Dry matter digestibility was greatest for cobs, intermedi-ate with straw, and least with stalks. Chemical treatment was effective in improving IVDMD (P < 0.001). Dry matter digestibility was greater for treatments containing NaOH, com-pared with CaO alone. Dry matter digestibility was improved for 50% compared to 35% DM. The reason this occurred is unclear. At 50% DM, 3% CaO + 2% NaOH relative to CaO improved IVDMD 14.5% and 10% for
(Continued on next page)
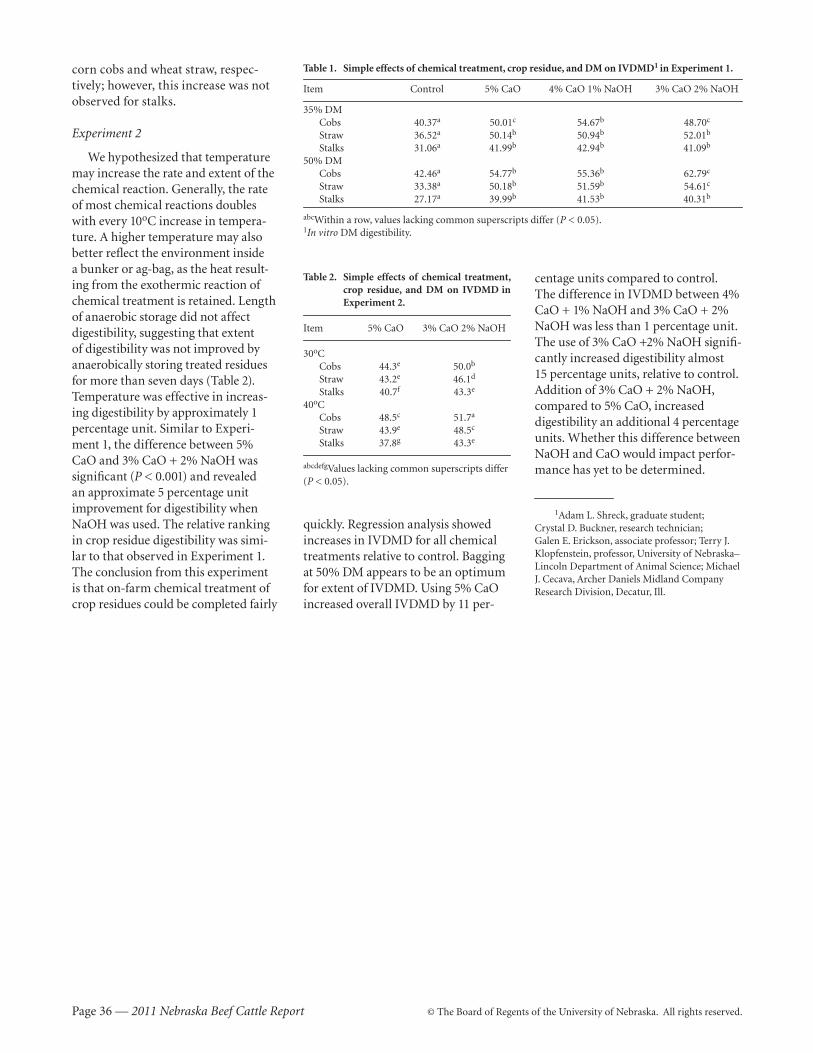
Page 36 — 2011 Nebraska Beef Cattle Report © The Board of Regents of the University of Nebraska. All rights reserved.
corn cobs and wheat straw, respec-tively; however, this increase was not observed for stalks.
Experiment 2
We hypothesized that temperature may increase the rate and extent of the chemical reaction. Generally, the rate of most chemical reactions doubles with every 10oC increase in tempera-ture. A higher temperature may also better reflect the environment inside a bunker or ag-bag, as the heat result-ing from the exothermic reaction of chemical treatment is retained . Length of anaerobic storage did not affect digestibility, suggesting that extent of digestibility was not improved by anaerobically storing treated residues for more than seven days (Table 2). Temperature was effective in increas-ing digestibility by approximately 1 percentage unit. Similar to Experi-ment 1, the dif ference between 5% CaO and 3% CaO + 2% NaOH was significant (P < 0.001) and revealed an approximate 5 percentage unit improvement for digestibility when NaOH was used. The relative ranking in crop residue digestibility was simi-lar to that observed in Experiment 1. The conclusion from this experiment is that on-farm chemical treatment of crop residues could be completed fairly
centage units compared to control. The difference in IVDMD between 4% CaO + 1% NaOH and 3% CaO + 2% NaOH was less than 1 percentage unit. The use of 3% CaO +2% NaOH signifi-cantly increased digestibility almost 15 percentage units, relative to control. Addition of 3% CaO + 2% NaOH, compared to 5% CaO, increased digestibility an additional 4 percentage units. Whether this difference between NaOH and CaO would impact perfor-mance has yet to be determined.
1Adam L. Shreck, graduate student; Crystal D. Buckner, research technician; Galen E. Erickson, associate professor; Terry J. Klopfenstein, professor, University of Nebraska–Lincoln Department of Animal Science; Michael J. Cecava, Archer Daniels Midland Company Research Division, Decatur, Ill.
Table 1. Simple effects of chemical treatment, crop residue, and DM on IVDMD1 in Experiment 1.
Item Control 5% CaO 4% CaO 1% NaOH 3% CaO 2% NaOH
35% DM Cobs 40.37a 50.01c 54.67b 48.70c
Straw 36.52a 50.14b 50.94b 52.01b
Stalks 31.06a 41.99b 42.94b 41.09b
50% DM Cobs 42.46a 54.77b 55.36b 62.79c
Straw 33.38a 50.18b 51.59b 54.61c
Stalks 27.17a 39.99b 41.53b 40.31b
abcWithin a row, values lacking common superscripts differ (P < 0.05).1In vitro DM digestibility.
Table 2. Simple effects of chemical treatment, crop residue, and DM on IVDMD in Experiment 2.
Item 5% CaO 3% CaO 2% NaOH
30oC Cobs 44.3e 50.0b
Straw 43.2e 46.1d
Stalks 40.7f 43.3e
40oC Cobs 48.5c 51.7a
Straw 43.9e 48.5c
Stalks 37.8g 43.3e
abcdefgValues lacking common superscripts differ (P < 0.05).
quickly. Regression analysis showed increases in IVDMD for all chemical treatments relative to control. Bagging at 50% DM appears to be an optimum for extent of IVDMD. Using 5% CaO increased overall IVDMD by 11 per-
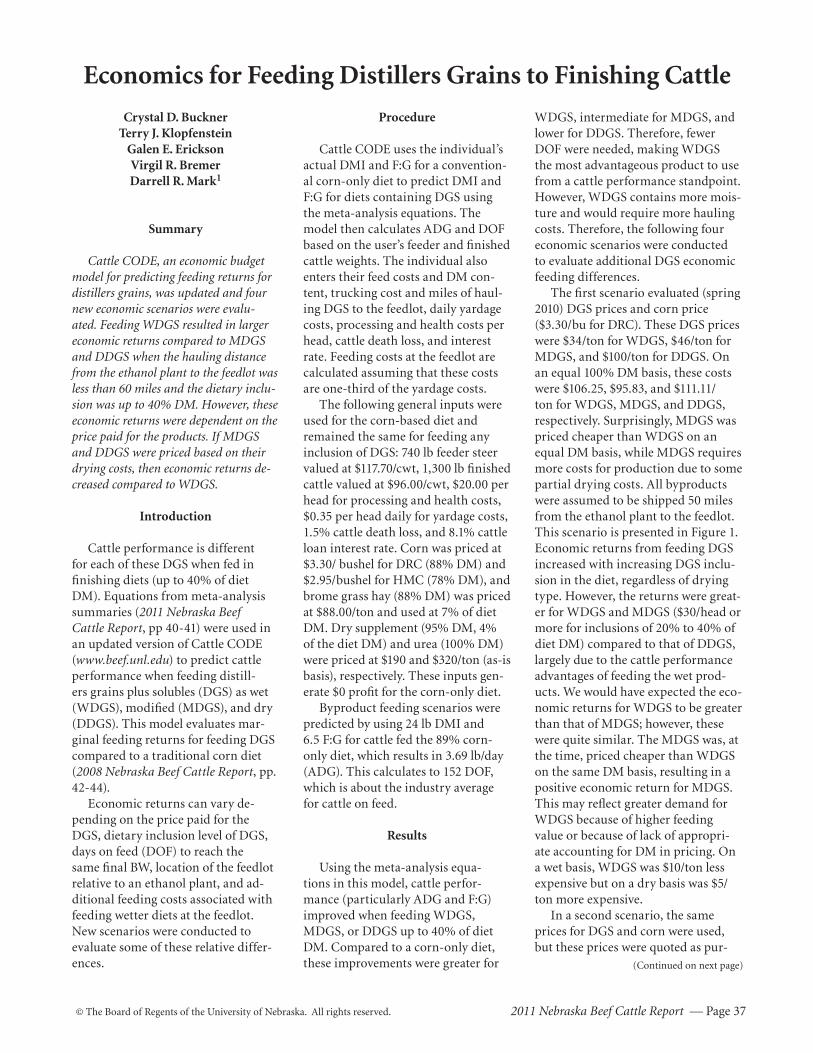
© The Board of Regents of the University of Nebraska. All rights reserved. 2011 Nebraska Beef Cattle Report — Page 37
Economics for Feeding Distillers Grains to Finishing Cattle
Crystal D. BucknerTerry J. Klopfenstein
Galen E. EricksonVirgil R. BremerDarrell R. Mark1
Summary
Cattle CODE, an economic budget model for predicting feeding returns for distillers grains, was updated and four new economic scenarios were evalu-ated. Feeding WDGS resulted in larger economic returns compared to MDGS and DDGS when the hauling distance from the ethanol plant to the feedlot was less than 60 miles and the dietary inclu-sion was up to 40% DM. However, these economic returns were dependent on the price paid for the products. If MDGS and DDGS were priced based on their drying costs, then economic returns de-creased compared to WDGS.
Introduction
Cattle performance is different for each of these DGS when fed in finishing diets (up to 40% of diet DM). Equations from meta-analysis summaries (2011 Nebraska Beef Cattle Report, pp 40-41) were used in an updated version of Cattle CODE (www.beef.unl.edu) to predict cattle performance when feeding distill-ers grains plus solubles (DGS) as wet (WDGS), modified (MDGS), and dry (DDGS). This model evaluates mar-ginal feeding returns for feeding DGS compared to a traditional corn diet (2008 Nebraska Beef Cattle Report, pp. 42-44).
Economic returns can vary de-pending on the price paid for the DGS, dietary inclusion level of DGS, days on feed (DOF) to reach the same final BW, location of the feedlot relative to an ethanol plant, and ad-ditional feeding costs associated with feeding wetter diets at the feedlot. New scenarios were conducted to evaluate some of these relative differ-ences.
Procedure
Cattle CODE uses the individual’s actual DMI and F:G for a convention-al corn-only diet to predict DMI and F:G for diets containing DGS using the meta-analysis equations. The model then calculates ADG and DOF based on the user’s feeder and finished cattle weights. The individual also enters their feed costs and DM con-tent, trucking cost and miles of haul-ing DGS to the feedlot, daily yardage costs, processing and health costs per head, cattle death loss, and interest rate. Feeding costs at the feedlot are calculated assuming that these costs are one-third of the yardage costs.
The following general inputs were used for the corn-based diet and remained the same for feeding any inclusion of DGS: 740 lb feeder steer valued at $117.70/cwt, 1,300 lb finished cattle valued at $96.00/cwt, $20.00 per head for processing and health costs, $0.35 per head daily for yardage costs, 1.5% cattle death loss, and 8.1% cattle loan interest rate. Corn was priced at $3.30/ bushel for DRC (88% DM) and $2.95/bushel for HMC (78% DM), and brome grass hay (88% DM) was priced at $88.00/ton and used at 7% of diet DM. Dry supplement (95% DM, 4% of the diet DM) and urea (100% DM) were priced at $190 and $320/ton (as-is basis), respectively. These inputs gen-erate $0 profit for the corn-only diet.
Byproduct feeding scenarios were predicted by using 24 lb DMI and 6.5 F:G for cattle fed the 89% corn-only diet, which results in 3.69 lb/day (ADG). This calculates to 152 DOF, which is about the industry average for cattle on feed.
Results
Using the meta-analysis equa-tions in this model, cattle perfor-mance (particularly ADG and F:G) improved when feeding WDGS, MDGS, or DDGS up to 40% of diet DM. Compared to a corn-only diet, these improvements were greater for
WDGS, intermediate for MDGS, and lower for DDGS. Therefore, fewer DOF were needed, making WDGS the most advantageous product to use from a cattle performance standpoint. However, WDGS contains more mois-ture and would require more hauling costs. Therefore, the following four economic scenarios were conducted to evaluate additional DGS economic feeding differences.
The first scenario evaluated (spring 2010) DGS prices and corn price ($3.30/bu for DRC). These DGS prices were $34/ton for WDGS, $46/ton for MDGS, and $100/ton for DDGS. On an equal 100% DM basis, these costs were $106.25, $95.83, and $111.11/ton for WDGS, MDGS, and DDGS, respectively. Surprisingly, MDGS was priced cheaper than WDGS on an equal DM basis, while MDGS requires more costs for production due to some partial drying costs. All byproducts were assumed to be shipped 50 miles from the ethanol plant to the feedlot. This scenario is presented in Figure 1. Economic returns from feeding DGS increased with increasing DGS inclu-sion in the diet, regardless of drying type. However, the returns were great-er for WDGS and MDGS ($30/head or more for inclusions of 20% to 40% of diet DM) compared to that of DDGS, largely due to the cattle performance advantages of feeding the wet prod-ucts. We would have expected the eco-nomic returns for WDGS to be greater than that of MDGS; however, these were quite similar. The MDGS was, at the time, priced cheaper than WDGS on the same DM basis, resulting in a positive economic return for MDGS. This may reflect greater demand for WDGS because of higher feeding value or because of lack of appropri-ate accounting for DM in pricing. On a wet basis, WDGS was $10/ton less expensive but on a dry basis was $5/ton more expensive.
In a second scenario, the same prices for DGS and corn were used, but these prices were quoted as pur-
(Continued on next page)
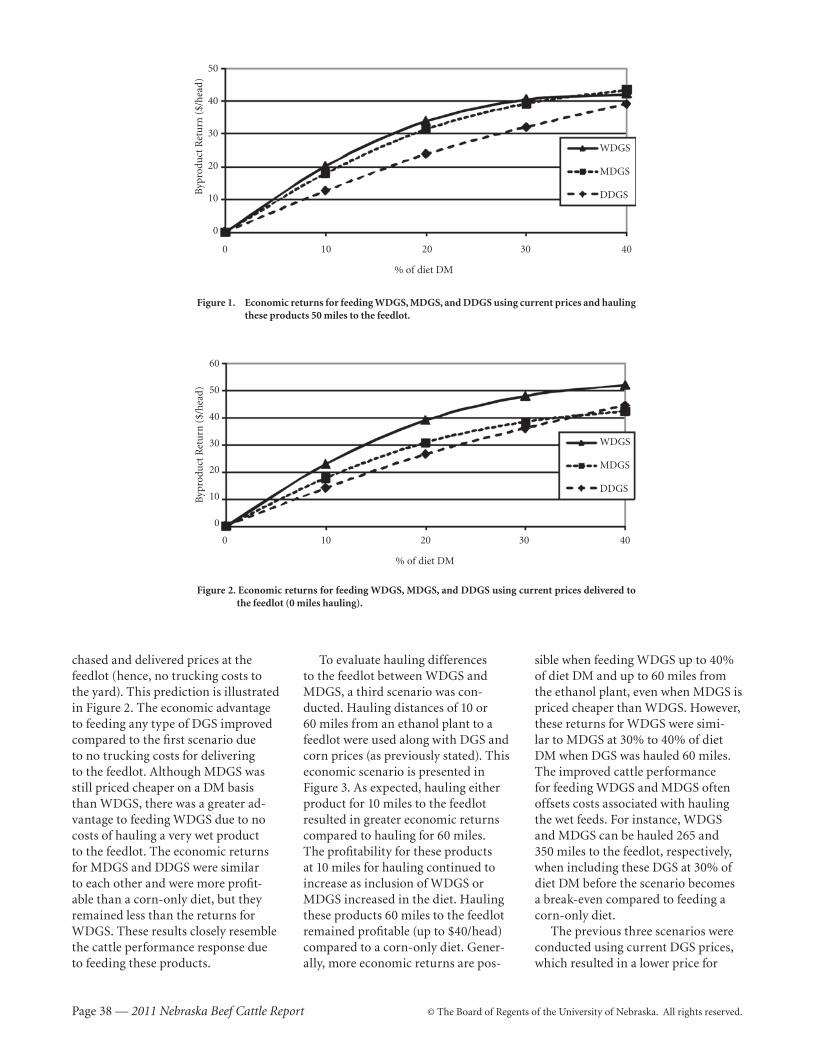
Page 38 — 2011 Nebraska Beef Cattle Report © The Board of Regents of the University of Nebraska. All rights reserved.
chased and delivered prices at the feedlot (hence, no trucking costs to the yard). This prediction is illustrated in Figure 2. The economic advantage to feeding any type of DGS improved compared to the first scenario due to no trucking costs for delivering to the feedlot. Although MDGS was still priced cheaper on a DM basis than WDGS, there was a greater ad-vantage to feeding WDGS due to no costs of hauling a very wet product to the feedlot. The economic returns for MDGS and DDGS were similar to each other and were more profit-able than a corn-only diet, but they remained less than the returns for WDGS. These results closely resemble the cattle performance response due to feeding these products.
Figure 1. Economic returns for feeding WDGS, MDGS, and DDGS using current prices and hauling these products 50 miles to the feedlot.
50
40
30
20
10
0
Byp
rodu
ct R
etu
rn (
$/h
ead)
WDGS
MDGS
DDGS
0 10 20 30 40
% of diet DM
0 10 20 30 40
% of diet DM
Figure 2. Economic returns for feeding WDGS, MDGS, and DDGS using current prices delivered to the feedlot (0 miles hauling).
60
50
40
30
20
10
0
Byp
rodu
ct R
etu
rn (
$/h
ead)
WDGS
MDGS
DDGS
To evaluate hauling differences to the feedlot between WDGS and MDGS, a third scenario was con-ducted. Hauling distances of 10 or 60 miles from an ethanol plant to a feedlot were used along with DGS and corn prices (as previously stated). This economic scenario is presented in Figure 3. As expected, hauling either product for 10 miles to the feedlot resulted in greater economic returns compared to hauling for 60 miles. The profitability for these products at 10 miles for hauling continued to increase as inclusion of WDGS or MDGS increased in the diet. Hauling these products 60 miles to the feedlot remained profitable (up to $40/head) compared to a corn-only diet. Gener-ally, more economic returns are pos-
sible when feeding WDGS up to 40% of diet DM and up to 60 miles from the ethanol plant, even when MDGS is priced cheaper than WDGS. However, these returns for WDGS were simi-lar to MDGS at 30% to 40% of diet DM when DGS was hauled 60 miles. The improved cattle performance for feeding WDGS and MDGS often offsets costs associated with hauling the wet feeds. For instance, WDGS and MDGS can be hauled 265 and 350 miles to the feedlot, respectively, when including these DGS at 30% of diet DM before the scenario becomes a break-even compared to feeding a corn-only diet.
The previous three scenarios were conducted using current DGS prices, which resulted in a lower price for
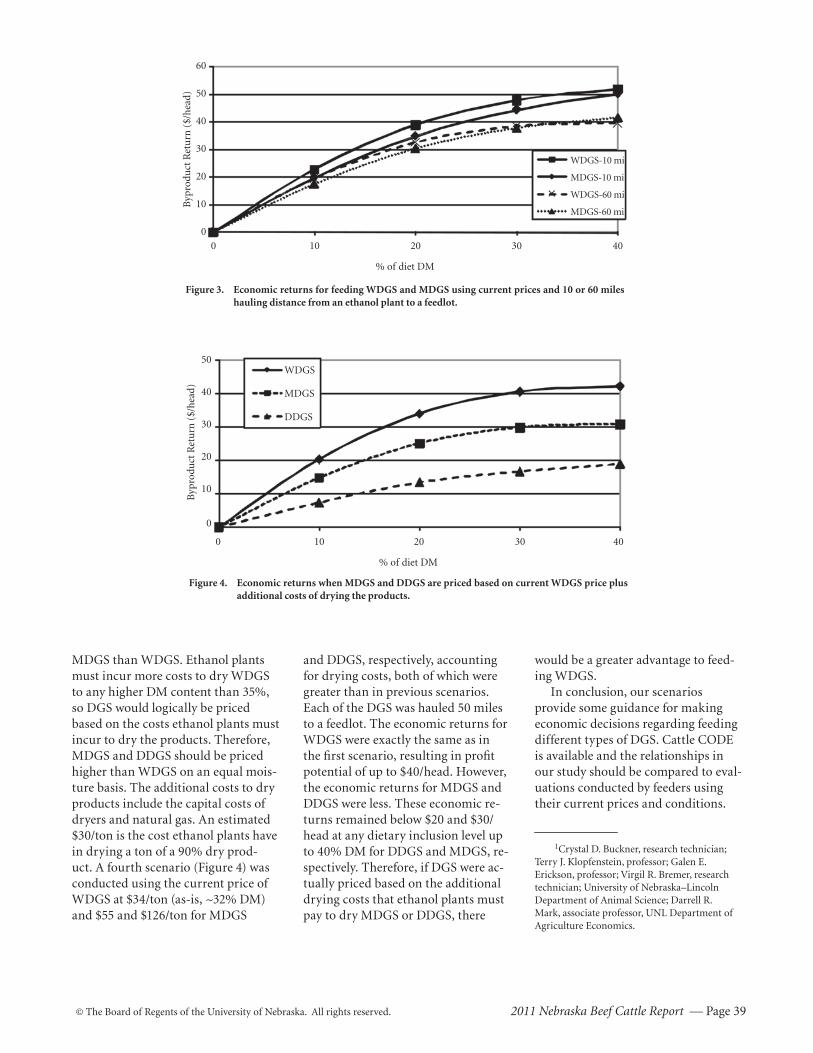
© The Board of Regents of the University of Nebraska. All rights reserved. 2011 Nebraska Beef Cattle Report — Page 39
would be a greater advantage to feed-ing WDGS.
In conclusion, our scenarios provide some guidance for making economic decisions regarding feeding different types of DGS. Cattle CODE is available and the relationships in our study should be compared to eval-uations conducted by feeders using their current prices and conditions.
1Crystal D. Buckner, research technician; Terry J. Klopfenstein, professor; Galen E. Erickson, professor; Virgil R. Bremer, research technician; University of Nebraska–Lincoln Department of Animal Science; Darrell R. Mark, associate professor, UNL Department of Agriculture Economics.
Figure 3. Economic returns for feeding WDGS and MDGS using current prices and 10 or 60 miles hauling distance from an ethanol plant to a feedlot.
60
50
40
30
20
10
0
Byp
rodu
ct R
etu
rn (
$/h
ead)
WDGS-10 mi
MDGS-10 mi
WDGS-60 mi
MDGS-60 mi
0 10 20 30 40
% of diet DM
Figure 4. Economic returns when MDGS and DDGS are priced based on current WDGS price plus additional costs of drying the products.
50
40
30
20
10
0
Byp
rodu
ct R
etu
rn (
$/h
ead)
WDGS
MDGS
DDGS
0 10 20 30 40
% of diet DM
MDGS than WDGS. Ethanol plants must incur more costs to dry WDGS to any higher DM content than 35%, so DGS would logically be priced based on the costs ethanol plants must incur to dry the products. Therefore, MDGS and DDGS should be priced higher than WDGS on an equal mois-ture basis. The additional costs to dry products include the capital costs of dryers and natural gas. An estimated $30/ton is the cost ethanol plants have in drying a ton of a 90% dry prod-uct. A fourth scenario (Figure 4) was conducted using the current price of WDGS at $34/ton (as-is, ~32% DM) and $55 and $126/ton for MDGS
and DDGS, respectively, accounting for drying costs, both of which were greater than in previous scenarios. Each of the DGS was hauled 50 miles to a feedlot. The economic returns for WDGS were exactly the same as in the first scenario, resulting in profit potential of up to $40/head. However, the economic returns for MDGS and DDGS were less. These economic re-turns remained below $20 and $30/head at any dietary inclusion level up to 40% DM for DDGS and MDGS, re-spectively. Therefore, if DGS were ac-tually priced based on the additional drying costs that ethanol plants must pay to dry MDGS or DDGS, there
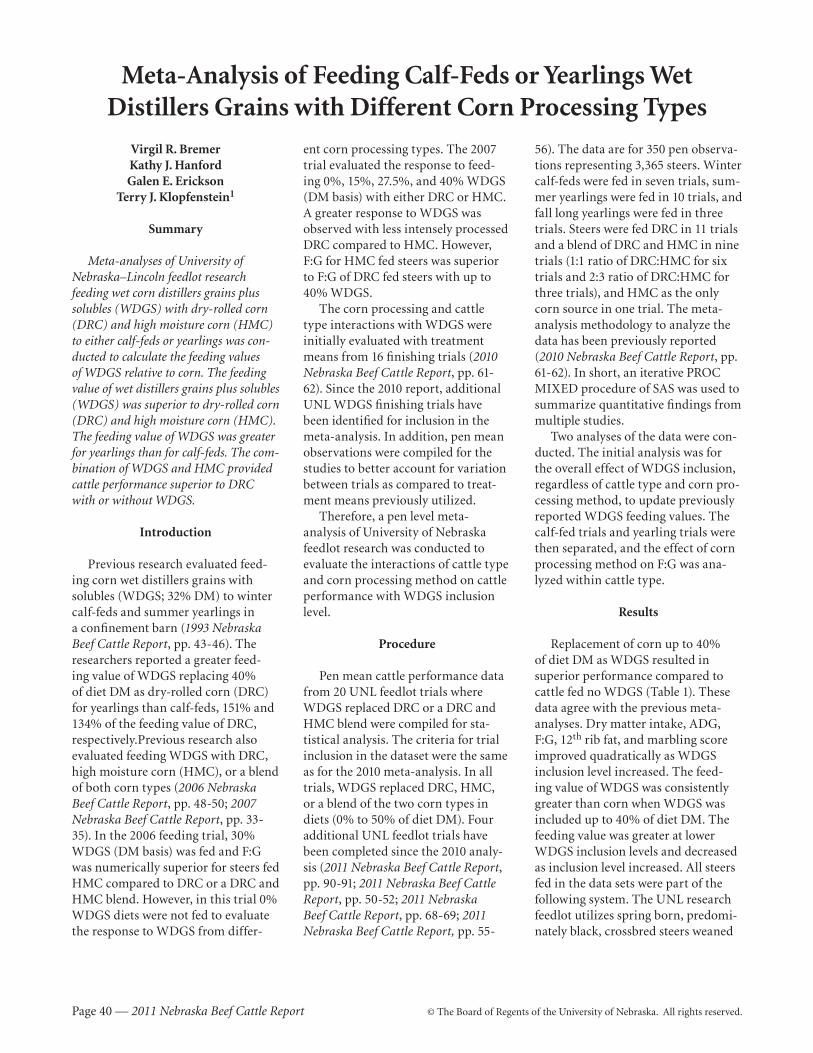
Page 40 — 2011 Nebraska Beef Cattle Report © The Board of Regents of the University of Nebraska. All rights reserved.
Meta-Analysis of Feeding Calf-Feds or Yearlings WetDistillers Grains with Different Corn Processing Types
Virgil R. BremerKathy J. HanfordGalen E. Erickson
Terry J. Klopfenstein1
Summary
Meta-analyses of University of Nebraska –Lincoln feedlot research feeding wet corn distillers grains plus solubles (WDGS) with dry-rolled corn (DRC) and high moisture corn (HMC) to either calf-feds or yearlings was con-ducted to calculate the feeding values of WDGS relative to corn. The feeding value of wet distillers grains plus solubles (WDGS) was superior to dry-rolled corn (DRC) and high moisture corn (HMC). The feeding value of WDGS was greater for yearlings than for calf-feds. The com-bination of WDGS and HMC provided cattle performance superior to DRC with or without WDGS.
Introduction
Previous research evaluated feed-ing corn wet distillers grains with solubles (WDGS; 32% DM) to winter calf-feds and summer yearlings in a confinement barn (1993 Nebraska Beef Cattle Report, pp. 43-46). The researchers reported a greater feed-ing value of WDGS replacing 40% of diet DM as dry-rolled corn (DRC) for yearlings than calf-feds, 151% and 134% of the feeding value of DRC, respectively.Previous research also evaluated feeding WDGS with DRC, high moisture corn (HMC), or a blend of both corn types (2006 Nebraska Beef Cattle Report , pp. 48-50; 2007 Nebraska Beef Cattle Report, pp. 33-35). In the 2006 feeding trial, 30% WDGS (DM basis ) was fed and F:G was numerically superior for steers fed HMC compared to DRC or a DRC and HMC blend. However, in this trial 0% WDGS diets were not fed to evaluate the response to WDGS from differ-
ent corn processing types. The 2007 trial evaluated the response to feed-ing 0%, 15%, 27.5%, and 40% WDGS (DM basis) with either DRC or HMC. A greater response to WDGS was observed with less intensely processed DRC compared to HMC. However, F:G for HMC fed steers was superior to F:G of DRC fed steers with up to 40% WDGS.
The corn processing and cattle type interactions with WDGS were initially evaluated with treatment means from 16 finishing trials (2010 Nebraska Beef Cattle Report, pp. 61-62). Since the 2010 report, additional UNL WDGS finishing trials have been identified for inclusion in the meta-analysis. In addition, pen mean observations were compiled for the studies to better account for variation between trials as compared to treat-ment means previously utilized.
Therefore, a pen level meta-analysis of University of Nebraska feedlot research was conducted to evaluate the interactions of cattle type and corn processing method on cattle performance with WDGS inclusion level.
Procedure
Pen mean cattle performance data from 20 UNL feedlot trials where WDGS replaced DRC or a DRC and HMC blend were compiled for sta-tistical analysis. The criteria for trial inclusion in the dataset were the same as for the 2010 meta-analysis. In all trials, WDGS replaced DRC, HMC, or a blend of the two corn types in diets (0% to 50% of diet DM). Four additional UNL feedlot trials have been completed since the 2010 analy-sis (2011 Nebraska Beef Cattle Report, pp. 90-91; 2011 Nebraska Beef Cattle Report, pp. 50-52; 2011 Nebraska Beef Cattle Report , pp. 68-69; 2011 Nebraska Beef Cattle Report , pp. 55-
56). The data are for 350 pen observa-tions representing 3,365 steers. Winter calf-feds were fed in seven trials, sum-mer yearlings were fed in 10 trials, and fall long yearlings were fed in three trials. Steers were fed DRC in 11 trials and a blend of DRC and HMC in nine trials (1:1 ratio of DRC:HMC for six trials and 2:3 ratio of DRC:HMC for three trials), and HMC as the only corn source in one trial. The meta-analysis methodology to analyze the data has been previously reported (2010 Nebraska Beef Cattle Report, pp. 61-62). In short, an iterative PROC MIXED procedure of SAS was used to summarize quantitative findings from multiple studies.
Two analyses of the data were con-ducted. The initial analysis was for the overall effect of WDGS inclusion, regardless of cattle type and corn pro-cessing method, to update previously reported WDGS feeding values. The calf-fed trials and yearling trials were then separated, and the effect of corn processing method on F:G was ana-lyzed within cattle type.
Results
Replacement of corn up to 40% of diet DM as WDGS resulted in superior performance compared to cattle fed no WDGS (Table 1). These data agree with the previous meta-analyses . Dry matter intake, ADG, F:G, 12th rib fat, and marbling score improved quadratically as WDGS inclusion level increased. The feed-ing value of WDGS was consistently greater than corn when WDGS was included up to 40% of diet DM. The feeding value was greater at lower WDGS inclusion levels and decreased as inclusion level increased. All steers fed in the data sets were part of the following system. The UNL research feedlot utilizes spring born, predomi-nately black, crossbred steers weaned
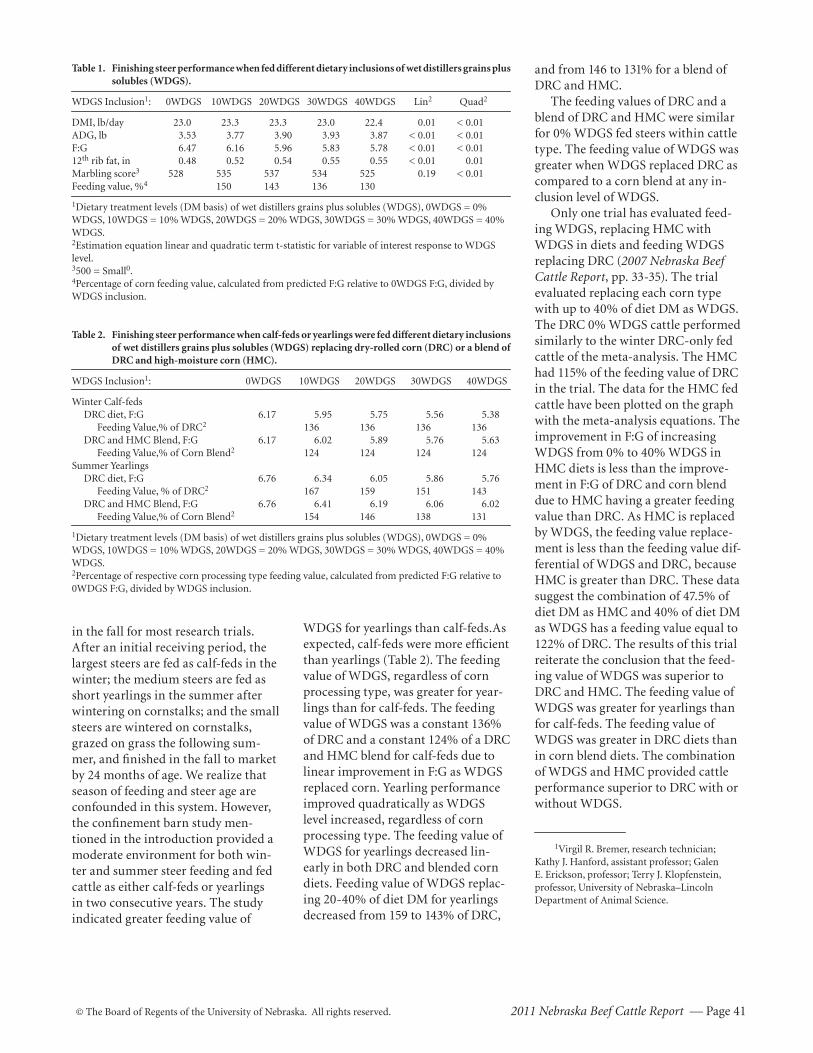
© The Board of Regents of the University of Nebraska. All rights reserved. 2011 Nebraska Beef Cattle Report — Page 41
in the fall for most research trials. After an initial receiving period, the largest steers are fed as calf-feds in the winter; the medium steers are fed as short yearlings in the summer after wintering on cornstalks; and the small steers are wintered on cornstalks, grazed on grass the following sum-mer, and finished in the fall to market by 24 months of age. We realize that season of feeding and steer age are confounded in this system. However, the confinement barn study men-tioned in the introduction provided a moderate environment for both win-ter and summer steer feeding and fed cattle as either calf-feds or yearlings in two consecutive years. The study indicated greater feeding value of
WDGS for yearlings than calf-feds.As expected, calf-feds were more efficient than yearlings (Table 2). The feeding value of WDGS, regardless of corn processing type, was greater for year-lings than for calf-feds. The feeding value of WDGS was a constant 136% of DRC and a constant 124% of a DRC and HMC blend for calf-feds due to linear improvement in F:G as WDGS replaced corn. Yearling performance improved quadratically as WDGS level increased, regardless of corn processing type. The feeding value of WDGS for yearlings decreased lin-early in both DRC and blended corn diets. Feeding value of WDGS replac-ing 20-40% of diet DM for yearlings decreased from 159 to 143% of DRC,
and from 146 to 131% for a blend of DRC and HMC.
The feeding values of DRC and a blend of DRC and HMC were similar for 0% WDGS fed steers within cattle type. The feeding value of WDGS was greater when WDGS replaced DRC as compared to a corn blend at any in-clusion level of WDGS.
Only one trial has evaluated feed-ing WDGS, replacing HMC with WDGS in diets and feeding WDGS replacing DRC (2007 Nebraska Beef Cattle Report, pp. 33-35). The trial evaluated replacing each corn type with up to 40% of diet DM as WDGS. The DRC 0% WDGS cattle performed similarly to the winter DRC-only fed cattle of the meta-analysis. The HMC had 115% of the feeding value of DRC in the trial. The data for the HMC fed cattle have been plotted on the graph with the meta-analysis equations. The improvement in F:G of increasing WDGS from 0% to 40% WDGS in HMC diets is less than the improve-ment in F:G of DRC and corn blend due to HMC having a greater feeding value than DRC. As HMC is replaced by WDGS, the feeding value replace-ment is less than the feeding value dif-ferential of WDGS and DRC, because HMC is greater than DRC. These data suggest the combination of 47.5% of diet DM as HMC and 40% of diet DM as WDGS has a feeding value equal to 122% of DRC. The results of this trial reiterate the conclusion that the feed-ing value of WDGS was superior to DRC and HMC. The feeding value of WDGS was greater for yearlings than for calf-feds. The feeding value of WDGS was greater in DRC diets than in corn blend diets. The combination of WDGS and HMC provided cattle performance superior to DRC with or without WDGS.
1Virgil R. Bremer, research technician; Kathy J. Hanford, assistant professor; Galen E. Erickson, professor; Terry J. Klopfenstein, professor, University of Nebraska–Lincoln Department of Animal Science.
Table 1. Finishing steer performance when fed different dietary inclusions of wet distillers grains plus solubles (WDGS).
WDGS Inclusion1: 0WDGS 10WDGS 20WDGS 30WDGS 40WDGS Lin2 Quad2
DMI, lb/day 23.0 23.3 23.3 23.0 22.4 0.01 < 0.01 ADG, lb 3.53 3.77 3.90 3.93 3.87 < 0.01 < 0.01 F:G 6.47 6.16 5.96 5.83 5.78 < 0.01 < 0.01 12th rib fat, in 0.48 0.52 0.54 0.55 0.55 < 0.01 0.01 Marbling score3 528 535 537 534 525 0.19 < 0.01 Feeding value, %4 150 143 136 130
1Dietary treatment levels (DM basis) of wet distillers grains plus solubles (WDGS), 0WDGS = 0% WDGS, 10WDGS = 10% WDGS, 20WDGS = 20% WDGS, 30WDGS = 30% WDGS, 40WDGS = 40% WDGS.2Estimation equation linear and quadratic term t-statistic for variable of interest response to WDGS level.3500 = Small0.4Percentage of corn feeding value, calculated from predicted F:G relative to 0WDGS F:G, divided by WDGS inclusion.
Table 2. Finishing steer performance when calf-feds or yearlings were fed different dietary inclusions of wet distillers grains plus solubles (WDGS) replacing dry-rolled corn (DRC) or a blend of DRC and high-moisture corn (HMC).
WDGS Inclusion1: 0WDGS 10WDGS 20WDGS 30WDGS 40WDGS
Winter Calf-feds DRC diet, F:G 6.17 5.95 5.75 5.56 5.38 Feeding Value,% of DRC2 136 136 136 136 DRC and HMC Blend, F:G 6.17 6.02 5.89 5.76 5.63 Feeding Value,% of Corn Blend2 124 124 124 124Summer Yearlings DRC diet, F:G 6.76 6.34 6.05 5.86 5.76 Feeding Value, % of DRC2 167 159 151 143 DRC and HMC Blend, F:G 6.76 6.41 6.19 6.06 6.02 Feeding Value,% of Corn Blend2 154 146 138 131
1Dietary treatment levels (DM basis) of wet distillers grains plus solubles (WDGS), 0WDGS = 0% WDGS, 10WDGS = 10% WDGS, 20WDGS = 20% WDGS, 30WDGS = 30% WDGS, 40WDGS = 40% WDGS.2Percentage of respective corn processing type feeding value, calculated from predicted F:G relative to 0WDGS F:G, divided by WDGS inclusion.

Page 42 — 2011 Nebraska Beef Cattle Report © The Board of Regents of the University of Nebraska. All rights reserved.
Impact of Distillers Grains Moistureand Inclusion Level on Greenhouse Gas Emissions
in the Corn-Ethanol-Livestock Life Cycle
Virgil R. BremerAdam J. Liska
Galen E. EricksonKenneth G. Cassman
Kathy J. HanfordTerry J. Klopfenstein1
Summary
Updated meta-analysis of cattle per-formance equations were incorporated into the Biofuel Energy Systems Simula-tor (BESS) to more accurately evaluate the greenhouse gas (GHG) benefit of corn ethanol relative to gasoline. Partial drying or complete drying of wet distill-ers grains (DGS) reduces the feeding value of DGS for cattle and increases ethanol GHG emissions. Feeding wet DGS provides the optimum GHG bene-fit relative to gasoline, with associated ethanol emissions being 40% of gasoline. Ethanol production with dried DGS results in about 60% of the GHG emis-sions of gasoline when dry DGS is fed to feedlot cattle, dairy cows, and finishing swine.
Introduction
The Biofuel Energy Systems Simulator (BESS; www.bess.unl.edu) was developed to compare ethanol produced from the corn-ethanol-livestock life cycle to gasoline as a combustible motor fuel. A discussion of energy and associated GHG emis-sions associated with corn production, ethanol plant operation, and livestock response to DGS feeding parameters of BESS have been published (2010 Nebraska Beef Cattle Report, pp. 56-57).
The corn and protein replacement value of DGS is moisture level, dietary inclusion level, and livestock type dependent. Previous University of Nebraska –Lincoln research has evalu-ated feeding wet DGS (WDGS; 68% moisture), modified DGS (MDGS;
54% moisture), and dried DGS (DDGS; 10% moisture) to feedlot cat-tle. The DGS products all contained greater feeding value than corn, but feeding value decreases as moisture level decreases and as inclusion level increases for feedlot cattle. Dairy and finishing swine research does not indicate a feeding value of DGS great-er than the corn and soybean meal replaced in diets. Therefore, there is a direct replacement of corn and soybean meal (lb for lb of DM) when DGS is fed to these animal classes.
Previous cattle performance equations of the BESS model were developed, with initial studies feed-ing wet, modified, and dry DGS to feedlot cattle. Several trials have been completed since the BESS model was developed. Meta-analysis equations developed from these larger databases will improve the accuracy of predicted BESS outcomes.
Therefore, an updated evaluation of the impact of distiller grains (DGS) moisture and inclusion level on GHG emissions from the corn-ethanol-livestock life cycle on ethanol relative to gasoline was conducted.
Procedure
The methodology for meta-analysis of pen mean observations to develop cattle performance equations when fed WDGS have been published elsewhere in this publication (2011 Nebraska Beef Cattle Report, pp. 40-41). This methodology was utilized to revise cattle performance equations when fed MDGS and DDGS. Modi-fied DGS equations were developed from four UNL feedlot trials repre-senting 85 pens and 680 steers (2008 Nebraska Beef Cattle Report, pp. 36-38; 2008 Nebraska Beef Cattle Report, pp. 53-56; 2009 Nebraska Beef Cattle Report, pp. 43-46; 2011 Nebraska Beef Cattle Report , pp. 50-52). Dried DGS
equations were developed from four UNL feedlot trials representing 66 pens and 581 steers (1994 Nebraska Beef Cattle Report, pp. 38-40; 2006 Nebraska Beef Cattle Report, pp. 57-58; 2011 Nebraska Beef Cattle Report, pp. 50-52; 2011 Nebraska Beef Cattle Report , pp. 62-64).
These equations were incorporated into BESS to evaluate the impact of feeding WDGS, MDGS, and DDGS to feedlot cattle and dairy cattle on the GHG emissions of ethanol compared to gasoline. The feeding of DDGS to finishing swine also was evaluated.
Results
Meta-analysis of feedlot steer per-formance when fed DGS at different moistures and inclusion levels are presented in Table 1. The MDGS and DDGS values have been scaled to the WDGS 0% DGS intercepts so that performance of the different moisture products may be directly compared. The feeding value of WDGS was 143% to 130% of the corn replaced in the diet from 20% to 40% of diet DM. Using the same approach, the feeding value of MDGS was 124% to 117%, and 112% for DDGS. These data indicate a similar relationship of the different moisture DGS prod-ucts as a study where all three DGS moistures were fed in the same trial (2011 Nebraska Beef Cattle Report, pp. 50-52)
Corn ethanol GHG emissions were less than 60% of gasoline (97.7 gC0
2e/MJ) for all scenarios analyzed
(Figures 1A and 1B). Feeding WDGS to feedlot cattle provided optimum ethanol GHG emissions relative to gasoline, with 38% to 43% of gasoline GHG emissions for 10% to 40% of diet DM as WDGS, respectively. Etha-nol GHG emissions, when MDGS was fed to feedlot cattle, were intermediate of WDGS and DDGS and were 46%
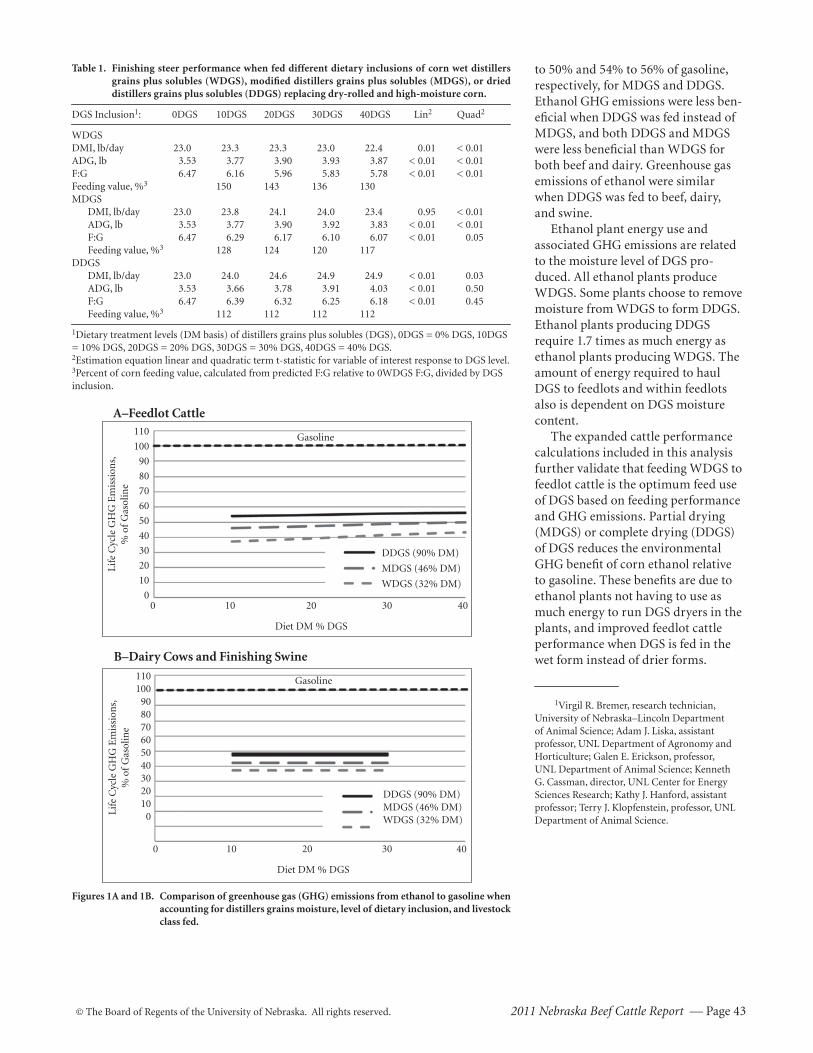
© The Board of Regents of the University of Nebraska. All rights reserved. 2011 Nebraska Beef Cattle Report — Page 43
to 50% and 54% to 56% of gasoline, respectively, for MDGS and DDGS. Ethanol GHG emissions were less ben-eficial when DDGS was fed instead of MDGS, and both DDGS and MDGS were less beneficial than WDGS for both beef and dairy. Greenhouse gas emissions of ethanol were similar when DDGS was fed to beef, dairy, and swine.
Ethanol plant energy use and associated GHG emissions are related to the moisture level of DGS pro-duced. All ethanol plants produce WDGS. Some plants choose to remove moisture from WDGS to form DDGS. Ethanol plants producing DDGS require 1.7 times as much energy as ethanol plants producing WDGS. The amount of energy required to haul DGS to feedlots and within feedlots also is dependent on DGS moisture content.
The expanded cattle performance calculations included in this analysis further validate that feeding WDGS to feedlot cattle is the optimum feed use of DGS based on feeding performance and GHG emissions. Partial drying (MDGS) or complete drying (DDGS) of DGS reduces the environmental GHG benefit of corn ethanol relative to gasoline. These benefits are due to ethanol plants not having to use as much energy to run DGS dryers in the plants, and improved feedlot cattle performance when DGS is fed in the wet form instead of drier forms.
1Virgil R. Bremer, research technician, University of Nebraska–Lincoln Department of Animal Science; Adam J. Liska, assistant professor, UNL Department of Agronomy and Horticulture; Galen E. Erickson, professor, UNL Department of Animal Science; Kenneth G. Cassman, director, UNL Center for Energy Sciences Research; Kathy J. Hanford, assistant professor; Terry J. Klopfenstein, professor, UNL Department of Animal Science.
Table 1. Finishing steer performance when fed different dietary inclusions of corn wet distillers grains plus solubles (WDGS), modified distillers grains plus solubles (MDGS), or dried distillers grains plus solubles (DDGS) replacing dry-rolled and high-moisture corn.
DGS Inclusion1: 0DGS 10DGS 20DGS 30DGS 40DGS Lin2 Quad2
WDGSDMI, lb/day 23.0 23.3 23.3 23.0 22.4 0.01 < 0.01 ADG, lb 3.53 3.77 3.90 3.93 3.87 < 0.01 < 0.01 F:G 6.47 6.16 5.96 5.83 5.78 < 0.01 < 0.01 Feeding value, %3 150 143 136 130 MDGS DMI, lb/day 23.0 23.8 24.1 24.0 23.4 0.95 < 0.01 ADG, lb 3.53 3.77 3.90 3.92 3.83 < 0.01 < 0.01 F:G 6.47 6.29 6.17 6.10 6.07 < 0.01 0.05 Feeding value, %3 128 124 120 117 DDGS DMI, lb/day 23.0 24.0 24.6 24.9 24.9 < 0.01 0.03 ADG, lb 3.53 3.66 3.78 3.91 4.03 < 0.01 0.50 F:G 6.47 6.39 6.32 6.25 6.18 < 0.01 0.45 Feeding value, %3 112 112 112 112
1Dietary treatment levels (DM basis) of distillers grains plus solubles (DGS), 0DGS = 0% DGS, 10DGS = 10% DGS, 20DGS = 20% DGS, 30DGS = 30% DGS, 40DGS = 40% DGS.2Estimation equation linear and quadratic term t-statistic for variable of interest response to DGS level.3Percent of corn feeding value, calculated from predicted F:G relative to 0WDGS F:G, divided by DGS inclusion.
A–Feedlot Cattle110
100
90
80
70
60
50
40
30
20
10
0
Life
Cyc
le G
HG
Em
issi
ons,
%
of
Gas
olin
e
Gasoline
DDGS (90% DM)
MDGS (46% DM)
WDGS (32% DM)
0 10 20 30 40
Diet DM % DGS
B–Dairy Cows and Finishing Swine
Figures 1A and 1B. Comparison of greenhouse gas (GHG) emissions from ethanol to gasoline when accounting for distillers grains moisture, level of dietary inclusion, and livestock class fed.
110100
908070605040302010
0Life
Cyc
le G
HG
Em
issi
ons,
%
of
Gas
olin
e
Gasoline
DDGS (90% DM)MDGS (46% DM)WDGS (32% DM)
0 10 20 30 40
Diet DM % DGS
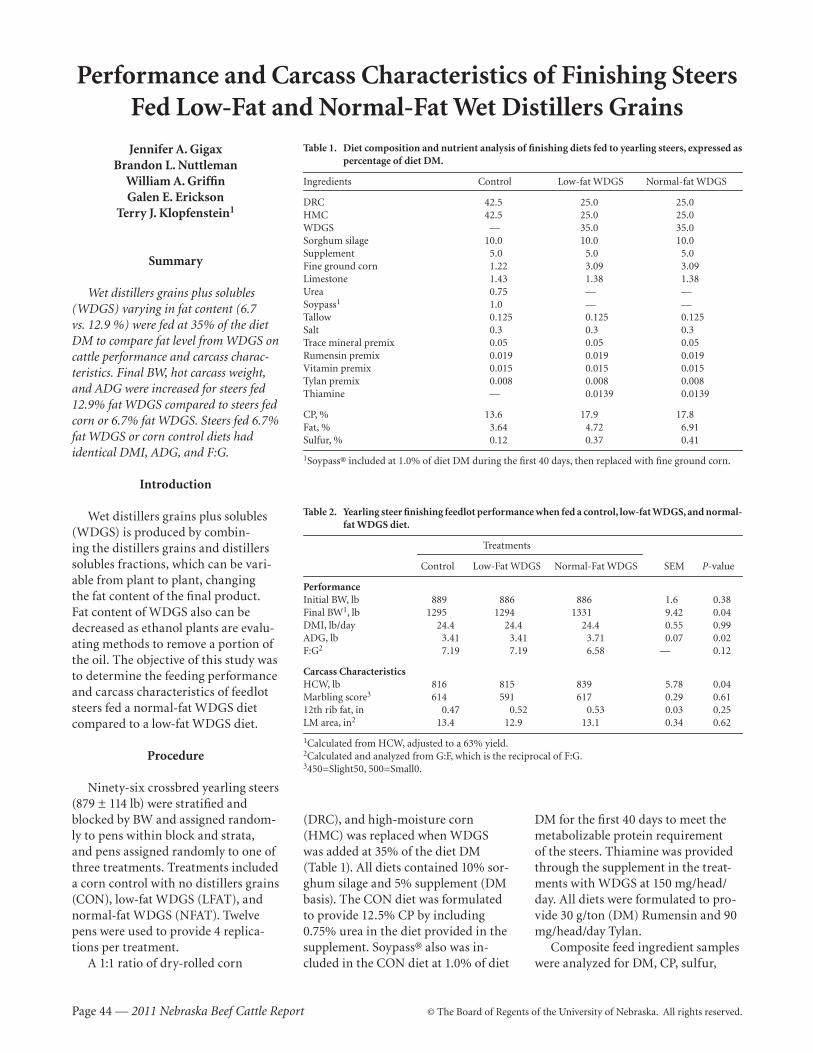
Page 44 — 2011 Nebraska Beef Cattle Report © The Board of Regents of the University of Nebraska. All rights reserved.
Performance and Carcass Characteristics of Finishing Steers Fed Low-Fat and Normal-Fat Wet Distillers Grains
Jennifer A. GigaxBrandon L. Nuttleman
William A. GriffinGalen E. Erickson
Terry J. Klopfenstein1
Summary
Wet distillers grains plus solubles (WDGS) varying in fat content (6.7 vs. 12.9 %) were fed at 35% of the diet DM to compare fat level from WDGS on cattle performance and carcass charac-teristics. Final BW, hot carcass weight, and ADG were increased for steers fed 12.9% fat WDGS compared to steers fed corn or 6.7% fat WDGS. Steers fed 6.7% fat WDGS or corn control diets had identical DMI, ADG, and F:G.
Introduction
Wet distillers grains plus solubles (WDGS) is produced by combin-ing the distillers grains and distillers solubles fractions, which can be vari-able from plant to plant, changing the fat content of the final product. Fat content of WDGS also can be decreased as ethanol plants are evalu-ating methods to remove a portion of the oil. The objective of this study was to determine the feeding performance and carcass characteristics of feedlot steers fed a normal-fat WDGS diet compared to a low-fat WDGS diet.
Procedure
Ninety-six crossbred yearling steers (879 ± 114 lb) were stratified and blocked by BW and assigned random-ly to pens within block and strata, and pens assigned randomly to one of three treatments. Treatments included a corn control with no distillers grains (CON), low-fat WDGS (LFAT), and normal-fat WDGS (NFAT). Twelve pens were used to provide 4 replica-tions per treatment.
A 1:1 ratio of dry-rolled corn
(DRC), and high-moisture corn (HMC) was replaced when WDGS was added at 35% of the diet DM (Table 1). All diets contained 10% sor-ghum silage and 5% supplement (DM basis). The CON diet was formulated to provide 12.5% CP by including 0.75% urea in the diet provided in the supplement. Soypass® also was in-cluded in the CON diet at 1.0% of diet
DM for the first 40 days to meet the metabolizable protein requirement of the steers. Thiamine was provided through the supplement in the treat-ments with WDGS at 150 mg/head/day. All diets were formulated to pro-vide 30 g/ton (DM) Rumensin and 90 mg/head/day Tylan.
Composite feed ingredient samples were analyzed for DM, CP, sulfur,
Table 1. Diet composition and nutrient analysis of finishing diets fed to yearling steers, expressed as percentage of diet DM.
Ingredients Control Low-fat WDGS Normal-fat WDGS
DRC 42.5 25.0 25.0HMC 42.5 25.0 25.0WDGS — 35.0 35.0Sorghum silage 10.0 10.0 10.0Supplement 5.0 5.0 5.0Fine ground corn 1.22 3.09 3.09Limestone 1.43 1.38 1.38Urea 0.75 — —Soypass1 1.0 — —Tallow 0.125 0.125 0.125Salt 0.3 0.3 0.3Trace mineral premix 0.05 0.05 0.05Rumensin premix 0.019 0.019 0.019Vitamin premix 0.015 0.015 0.015Tylan premix 0.008 0.008 0.008Thiamine — 0.0139 0.0139
CP, % 13.6 17.9 17.8Fat, % 3.64 4.72 6.91Sulfur, % 0.12 0.37 0.41
1Soypass® included at 1.0% of diet DM during the first 40 days, then replaced with fine ground corn.
Table 2. Yearling steer finishing feedlot performance when fed a control, low-fat WDGS, and normal-fat WDGS diet.
Treatments
Control Low-Fat WDGS Normal-Fat WDGS SEM P-value
PerformanceInitial BW, lb 889 886 886 1.6 0.38Final BW1, lb 1295 1294 1331 9.42 0.04DMI, lb/day 24.4 24.4 24.4 0.55 0.99ADG, lb 3.41 3.41 3.71 0.07 0.02F:G2 7.19 7.19 6.58 — 0.12
Carcass CharacteristicsHCW, lb 816 815 839 5.78 0.04Marbling score3 614 591 617 0.29 0.6112th rib fat, in 0.47 0.52 0.53 0.03 0.25LM area, in2 13.4 12.9 13.1 0.34 0.62
1Calculated from HCW, adjusted to a 63% yield.2Calculated and analyzed from G:F, which is the reciprocal of F:G.3450=Slight50, 500=Small0.
© The Board of Regents of the University of Nebraska. All rights reserved. 2011 Nebraska Beef Cattle Report — Page 45
and fat. The low-fat WDGS contained 34.8% CP, 6.7% fat, and 0.85% sulfur. The normal-fat WDGS contained 34.5% CP, 12.9% fat, and 0.94% sulfur. Steers were slaughtered at a commercial abattoir (Greater Omaha Pack, Omaha, Neb.) in two weight blocks, heavy and light, at either 102 or 131 days on feed. Hot carcass weights (HCW) and liver scores were collected on the day of slaughter. After a 48-hour chill, marbling score, 12th rib fat thickness, and LM area data were collected. Final carcass adjusted BW, ADG and F:G were calculated by dividing HCW by a common dressing percentage of 63%.
Cattle performance and carcass characteristics were analyzed using the MIXED procedure of SAS. Pen was considered the experimental unit,
and treatments were analyzed as a randomized complete block design.
Results
Performance and carcass char-acteristics are presented in Table 2. Carcass adjusted final BW and HCW were greater, by 36 and 23 pounds, respectively, for the NFAT treatment compared to the CON and LFAT treatments (P < 0.03). Average daily gain was 0.3 lb/day greater for the NFAT treatment compared to the CON and LFAT treatments (P = 0.02). No differences were observed across treatments for LM area, 12th rib fat thickness, marbling, or DMI (P > 0.25). A tendency for a decrease in F:G (P > 0.12) was observed for the NFAT treatment. Interestingly, the carcass
adjusted final BW, HCW, and ADG for the CON and LFAT treatments were identical.
This study indicates that cattle per-formance and carcass characteristics when feeding low-fat WDGS are com-parable to feeding a corn-based diet. Low-fat WDGS has a lower energy value than normal fat WDGS due to the lower fat content, which decreases gain and weights, and likely increases F:G.
1Jennifer A. Gigax, graduate student; Brandon L. Nuttleman and William A. Griffin, research technicians; Galen E. Erickson, professor; Terry J. Klopfenstein, professor, University of Nebraska–Lincoln Department of Animal Science.
Page 46 — 2011 Nebraska Beef Cattle Report © The Board of Regents of the University of Nebraska. All rights reserved.
Review: Lipid Addition to Corn Finishing Diets
Virgil R. BremerGalen E. Erickson
Terry J. Klopfenstein1
Summary
The fat content of distillers grains with solubles (DGS) partially accounts for DGS feeding value being greater than corn. Finishing diets containing DGS to supply up to 8% of diet DM as fat may be fed without depressing cattle performance. However, feeding diets containing 8% diet fat with corn oil depresses cattle performance. The dif-ference in rumen metabolism of these two fats is due to physical protection of DGS fat from interaction with rumen microbes. Due to an unknown mecha-nism, condensed corn distillers solubles, a liquid fat source, does not limit rumi-nal metabolism like corn oil. Optimum dietary fat level is dependent on the sources of fat in the diet.
Introduction
Based on greater caloric density of fat versus starch and protein, it makes sense to replace a portion of lesser energy starch or protein from feedlot diets with fat. However, there are upper limits to the level of diet-ary fat that cattle in a feedlot can ingest without affecting rumen func-tion and depressing feeding perfor-mance. These upper limits may be lipid source dependant based on the degree of fatty acid saturation and physical structure. Therefore, Uni-versity of Nebraska–Lincoln feedlot research evaluating fat addition to dry-rolled (DRC) and high-moisture corn (HMC) diets was summarized to evaluate feeding traditional and by-product fat sources.
Procedure
A series of six feedlot and metabo-lism studies evaluating different fat sources compared to distillers grains
with solubles (DGS) were reviewed to better understand fat metabolism of different feedstuffs. Evaluated was the addition of fat to corn diets from corn oil, tallow, condensed corn distillers soluble (CCDS), or DGS, in addi-tion to the impact of decreasing lipid content of DGS on cattle feeding per-formance (2004 Nebraska Beef Cattle Report, pp. 45-48; 2007 Nebraska Beef Cattle Report, pp. 39-42; 2009 Nebraska Beef Cattle Report, pp. 64-66; 2010 Nebraska Beef Cattle Report, pp. 74-76; 2011 Nebraska Beef Cattle Report, pp. 44-45).
Review
CCDS and DGS Products
Both CCDS and DGS fats are from the dry milling ethanol industry. These fats both have been subjected to a low pH environment during the fermentation process of producing ethanol and heating to distill etha-nol. Once the ethanol is removed, the remaining stillage is centrifuged to separate the liquid distillers solubles fraction from the remaining fermen-tation solids. Water is removed from the soluble stream (95% moisture) to form CCDS (65% moisture). Often times, the CCDS are combined back with the grains fraction to make wet DGS (WDGS; 65% moisture). The WDGS may have additional heat energy applied to produce dry DGS (DDGS; 10% moisture). The CCDS accounts for about 20% of DGS DM. Some ethanol plants also sell CCDS as a separate feed ingredient.
Different Forms of Fat
Corn oil, CCDS, and DGS fat all originate from corn. However, these fats are not equal in feeding value. Differences are partially due to physical form. Fat in vegetable oils is mainly in the form of unsaturated fatty acids. Unsaturated fats differ from saturated fats in the bonding structure of the carbons in the fatty
acid molecules. Saturated fats are “saturated” when they have as many hydrogen atoms attached to the car-bons as possible. Unsaturated fats have fatty acids that contain stronger bonds between carbons that can ac-cept additional hydrogens and alter the shape of the fatty acids. Corn oil is a liquid at room temperature, and thus, unsaturated and is readily avail-able for rumen microbial interaction. The CCDS also is a liquid. The fat of CCDS is slightly more saturated than the fat in corn oil due to the fermenta-tion and heat used to produce ethanol. However, CCDS not only contains fat (10-35% of CCDS DM) but also protein from yeast cells and corn, in addition to other nutrients. The fat in the grains fraction of DGS is trapped in the ground corn germ particles. This fat is protected from interaction with rumen microbes due to the germ particles physically inhibiting inter-action of lipid with microbes. The ratio of CCDS to grains at the ethanol plant and CCDS % fat impacts the final fat profile of DGS. The corn fiber and protein also are concentrated in grains fraction of DGS.
Beef tallow is an example of how ruminants can modify dietary unsat-urated fatty acids to a more saturated fatty acid profile. The tallow is from cattle fed unsaturated corn fatty acids, but the ruminal microbes have altered the corn oil fat before the fat was in-corporated into carcass tissues. The more saturated fatty acids of tallow are not as detrimental to microbial function in the rumen as corn oil.
Fat and Rumen Function
The ruminant has the unique abili-ty to modify dietary unsaturated fatty acids to saturated fatty acids with ru-men microbes. This process is known as biohydrogenation. Fatty acid bio-hydrogenation is what causes beef to have harder fat than pork. One of the explanations of why the microbes biohydrogenate the fatty acids is to combat the inhibition of fermentation
© The Board of Regents of the University of Nebraska. All rights reserved. 2011 Nebraska Beef Cattle Report — Page 47
that can occur with unsaturated fatty acids. Another explanation is that the unsaturated fatty acids serve as a sink for free hydrogen ions in the rumen.
Results
Cattle Performance When Fed Different Fat Sources
Replacing a blend of DRC and HMC to create diets with 6.4% to-tal diet ether extract, with either 2.5% corn oil or 20% of diet DM with WDGS, resulted in similar or improved feeding performance rela-tive to the corn diet for individually fed heifers . When total diet ether extract was increased to 8.8%, with either 5% corn oil or 40% WDGS, feed conversion was greater for the 40% WDGS diet relative to 20% WDGS. The 5% corn oil diet resulted in depressed performance relative to the corn diet. This trial indicated that 8.8% diet fat from 5% corn oil was detrimental to rumen function.
In a second trial, HMC was replaced by 1.3% or 2.6% tallow or 20% or 40% DDGS in diets contain-ing 20% wet corn gluten feed (WCGF; Sweet Bran®). Feeding performance was similar for all treatments. Maxi-mum dietary ether extract was 6.0% and 5.0% for tallow and DDGS, respectively . This trial indicates that 2.6% tallow was not enough saturated fat to depress cattle performance with 20% WCGF diets.
A third finishing trial evaluated
replacing HMC in 35% WCGF diets with either CCDS or WDGS. Inclu-sion of 20% of diet DM as CCDS or 40% WDGS resulted in diets contain-ing 6.2% and 6.9% diet fat, respective-ly. The CCDS diets resulted in similar performance as the WDGS diets. The combined interpretation of the first and third studies shows that CCDS does not depress feeding performance like corn oil. These data substantiate that the form of fat in DGS and CCDS have a different effect on rumen func-tion relative to corn oil.
Two metabolism trials evaluated fat digestion of corn, WDGS, and corn with corn oil diets. Both studies found less ruminal biohydrogena-tion of WDGS fatty acids, compared to corn and corn with corn oil diets. Steaks from steers consuming WDGS had increased proportion of unsatu-rated fatty acids relative to saturated fatty acids compared to steaks from corn fed cattle. One of the metabolism studies also evaluated CCDS lipid bio-hydrogenation and noted that omasal contents from CCDS fed steers were biohydrogenated to a similar level of saturation as omasal content from corn, corn oil, and tallow diets and omasal contents of WDGS fed steers were less satuated than the other treatments. These trials indicate that CCDS diet fat is not protected from biohydrogenation like the grains frac-tion of WDGS.
A finishing trial evaluated feeding 35% of diet DM as wet distillers grains
without CCDS (6.7% fat; DM basis), 35% normal WDGS (13.0% fat; DM basis), and a corn diet. Dry matter intake was similar for all three treat-ments. However, ADG of the lower fat WDGS was similar to the corn diet and the ADG of the normal WDGS fed steers was superior to the other two diets. The feeding values of the lower fat distillers grains and normal WDGS were 102% and 127 % of corn, respectively. This trial indicates the importance of the lipid component of DGS on the feeding value of DGS products.
High fat DGS finishing diets (8% dietary fat) may be fed to feedlot cattle with improved performance relative to cattle fed corn. Feeding 8% fat diets containing corn and corn oil depress-es feeding performance compared to corn fed cattle. The difference in ruminant biological processing of corn oil and DGS diets is partially due to the physical form of the fat in DGS being protected from interaction with ruminal microbes. Although CCDS fatty acids are not protected from ruminal biohydrogenation, CCDS fat does not appear to limit ruminal fer-mentation like diets with corn oil. The CCDS fat in WDGS partially accounts for WDGS feeding value being greater than corn.
1Virgil R. Bremer, research technician; Galen E. Erickson, professor; Terry J. Klopfenstein, professor, University of Nebraska–Lincoln Department of Animal Science.
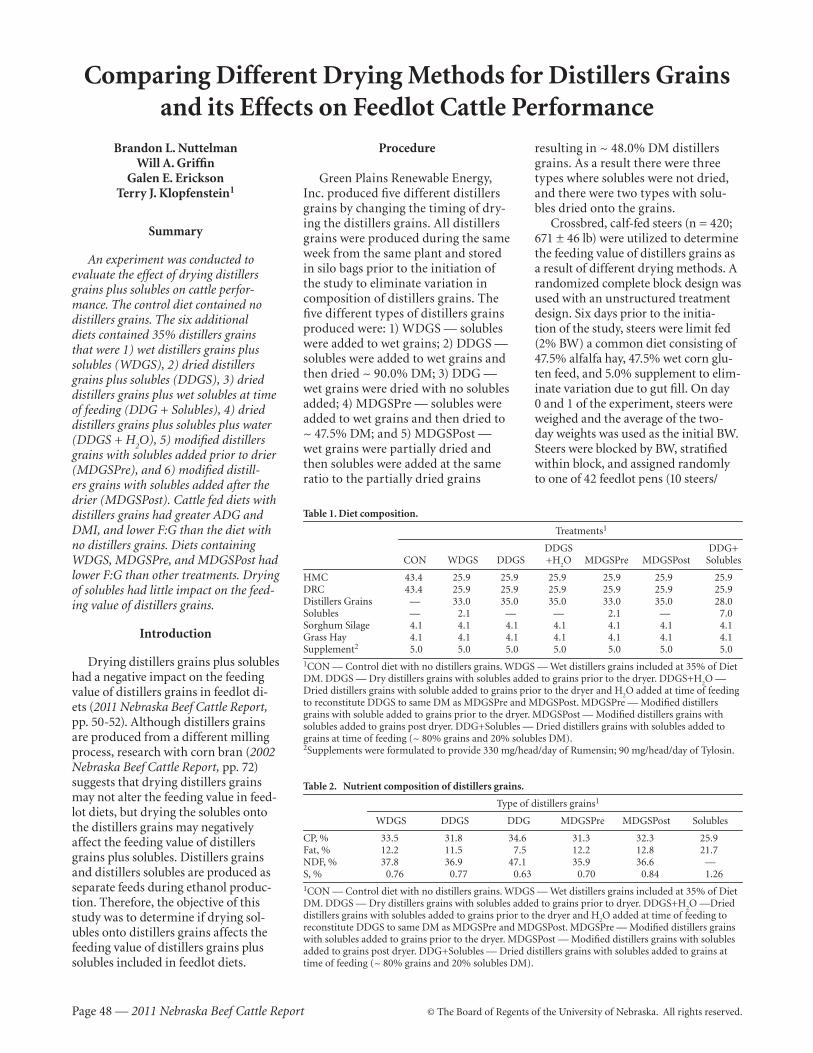
Page 48 — 2011 Nebraska Beef Cattle Report © The Board of Regents of the University of Nebraska. All rights reserved.
Comparing Different Drying Methods for Distillers Grains and its Effects on Feedlot Cattle Performance
Brandon L. Nuttelman Will A. Griffin
Galen E. Erickson Terry J. Klopfenstein1
Summary
An experiment was conducted to evaluate the effect of drying distillers grains plus solubles on cattle perfor-mance. The control diet contained no distillers grains. The six additional diets contained 35% distillers grains that were 1) wet distillers grains plus solubles (WDGS), 2) dried distillers grains plus solubles (DDGS), 3) dried distillers grains plus wet solubles at time of feeding (DDG + Solubles), 4) dried distillers grains plus solubles plus water (DDGS + H
2O), 5) modified distillers
grains with solubles added prior to drier (MDGSPre), and 6) modified distill-ers grains with solubles added after the drier (MDGSPost). Cattle fed diets with distillers grains had greater ADG and DMI, and lower F:G than the diet with no distillers grains. Diets containing WDGS, MDGSPre, and MDGSPost had lower F:G than other treatments. Drying of solubles had little impact on the feed-ing value of distillers grains.
Introduction
Drying distillers grains plus solubles had a negative impact on the feeding value of distillers grains in feedlot di-ets (2011 Nebraska Beef Cattle Report, pp. 50-52). Although distillers grains are produced from a different milling process, research with corn bran (2002 Nebraska Beef Cattle Report, pp. 72) suggests that drying distillers grains may not alter the feeding value in feed-lot diets, but drying the solubles onto the distillers grains may negatively affect the feeding value of distillers grains plus solubles. Distillers grains and distillers solubles are produced as separate feeds during ethanol produc-tion. Therefore, the objective of this study was to determine if drying sol-ubles onto distillers grains affects the feeding value of distillers grains plus solubles included in feedlot diets.
Procedure
Green Plains Renewable Energy, Inc. produced five different distillers grains by changing the timing of dry-ing the distillers grains. All distillers grains were produced during the same week from the same plant and stored in silo bags prior to the initiation of the study to eliminate variation in composition of distillers grains. The five different types of distillers grains produced were: 1) WDGS — solubles were added to wet grains; 2) DDGS — solubles were added to wet grains and then dried ~ 90.0% DM; 3) DDG — wet grains were dried with no solubles added; 4) MDGSPre — solubles were added to wet grains and then dried to ~ 47.5% DM; and 5) MDGSPost — wet grains were partially dried and then solubles were added at the same ratio to the partially dried grains
resulting in ~ 48.0% DM distillers grains. As a result there were three types where solubles were not dried, and there were two types with solu-bles dried onto the grains.
Crossbred, calf-fed steers (n = 420; 671 ± 46 lb) were utilized to determine the feeding value of distillers grains as a result of different drying methods. A randomized complete block design was used with an unstructured treatment design. Six days prior to the initia-tion of the study, steers were limit fed (2% BW) a common diet consisting of 47.5% alfalfa hay, 47.5% wet corn glu-ten feed, and 5.0% supplement to elim-inate variation due to gut fill. On day 0 and 1 of the experiment, steers were weighed and the average of the two-day weights was used as the initial BW. Steers were blocked by BW, stratified within block, and assigned randomly to one of 42 feedlot pens (10 steers/
Table 1. Diet composition.
Treatments1
DDGS DDG+ CON WDGS DDGS +H
2O MDGSPre MDGSPost Solubles
HMC 43.4 25.9 25.9 25.9 25.9 25.9 25.9 DRC 43.4 25.9 25.9 25.9 25.9 25.9 25.9Distillers Grains — 33.0 35.0 35.0 33.0 35.0 28.0Solubles — 2.1 — — 2.1 — 7.0Sorghum Silage 4.1 4.1 4.1 4.1 4.1 4.1 4.1 Grass Hay 4.1 4.1 4.1 4.1 4.1 4.1 4.1 Supplement2 5.0 5.0 5.0 5.0 5.0 5.0 5.01CON — Control diet with no distillers grains. WDGS — Wet distillers grains included at 35% of Diet DM. DDGS — Dry distillers grains with solubles added to grains prior to the dryer. DDGS+H
2O —
Dried distillers grains with soluble added to grains prior to the dryer and H2O added at time of feeding
to reconstitute DDGS to same DM as MDGSPre and MDGSPost. MDGSPre — Modified distillers grains with soluble added to grains prior to the dryer. MDGSPost — Modified distillers grains with solubles added to grains post dryer. DDG+Solubles — Dried distillers grains with solubles added to grains at time of feeding (~ 80% grains and 20% solubles DM). 2Supplements were formulated to provide 330 mg/head/day of Rumensin; 90 mg/head/day of Tylosin.
Table 2. Nutrient composition of distillers grains.
Type of distillers grains1
WDGS DDGS DDG MDGSPre MDGSPost Solubles
CP, % 33.5 31.8 34.6 31.3 32.3 25.9Fat, % 12.2 11.5 7.5 12.2 12.8 21.7NDF, % 37.8 36.9 47.1 35.9 36.6 —S, % 0.76 0.77 0.63 0.70 0.84 1.26 1CON — Control diet with no distillers grains. WDGS — Wet distillers grains included at 35% of Diet DM. DDGS — Dry distillers grains with solubles added to grains prior to dryer. DDGS+H
2O —Dried
distillers grains with solubles added to grains prior to the dryer and H2O added at time of feeding to
reconstitute DDGS to same DM as MDGSPre and MDGSPost. MDGSPre — Modified distillers grains with solubles added to grains prior to the dryer. MDGSPost — Modified distillers grains with solubles added to grains post dryer. DDG+Solubles — Dried distillers grains with solubles added to grains at time of feeding (~ 80% grains and 20% solubles DM).
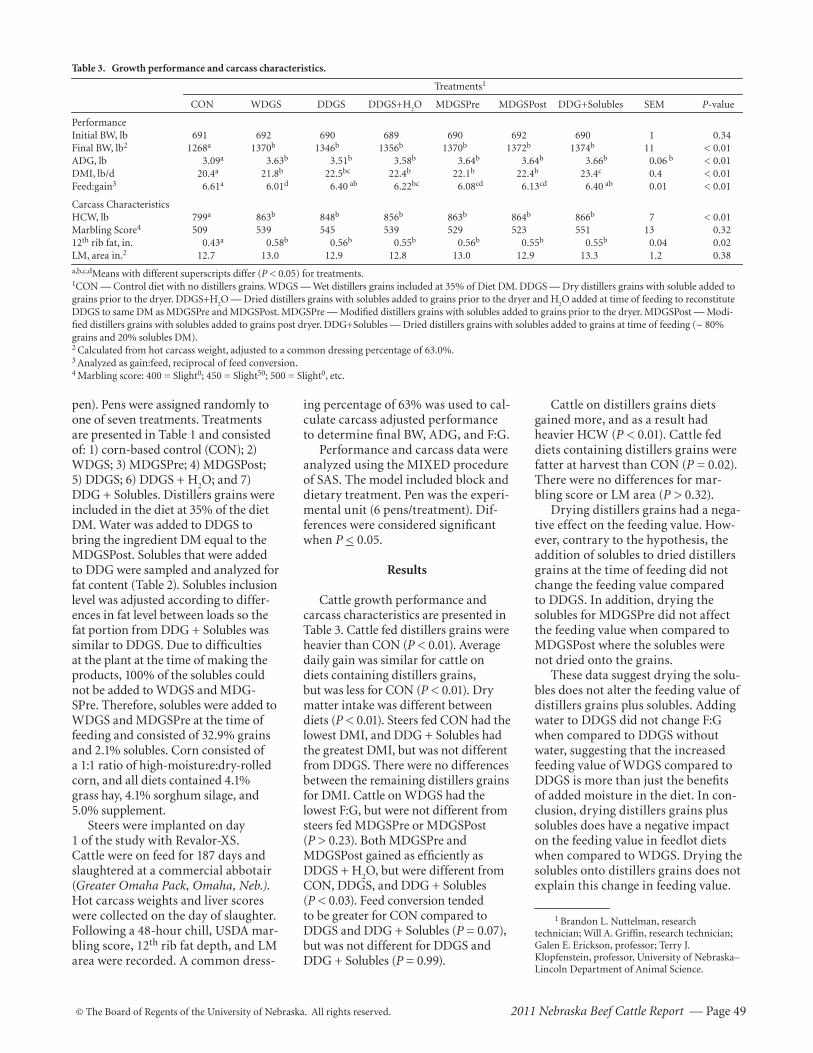
© The Board of Regents of the University of Nebraska. All rights reserved. 2011 Nebraska Beef Cattle Report — Page 49
pen). Pens were assigned randomly to one of seven treatments. Treatments are presented in Table 1 and consisted of: 1) corn-based control (CON); 2) WDGS; 3) MDGSPre; 4) MDGSPost; 5) DDGS; 6) DDGS + H
2O; and 7)
DDG + Solubles. Distillers grains were included in the diet at 35% of the diet DM. Water was added to DDGS to bring the ingredient DM equal to the MDGSPost. Solubles that were added to DDG were sampled and analyzed for fat content (Table 2). Solubles inclusion level was adjusted according to differ-ences in fat level between loads so the fat portion from DDG + Solubles was similar to DDGS. Due to difficulties at the plant at the time of making the products, 100% of the solubles could not be added to WDGS and MDG-SPre. Therefore, solubles were added to WDGS and MDGSPre at the time of feeding and consisted of 32.9% grains and 2.1% solubles. Corn consisted of a 1:1 ratio of high-moisture:dry-rolled corn, and all diets contained 4.1% grass hay, 4.1% sorghum silage, and 5.0% supplement.
Steers were implanted on day 1 of the study with Revalor-XS. Cattle were on feed for 187 days and slaughtered at a commercial abbotair (Greater Omaha Pack, Omaha, Neb.). Hot carcass weights and liver scores were collected on the day of slaughter. Following a 48-hour chill, USDA mar-bling score, 12th rib fat depth, and LM area were recorded. A common dress-
Table 3. Growth performance and carcass characteristics.
Treatments1
CON WDGS DDGS DDGS+H2O MDGSPre MDGSPost DDG+Solubles SEM P-value
PerformanceInitial BW, lb 691 692 690 689 690 692 690 1 0.34Final BW, lb2 1268a 1370b 1346b 1356b 1370b 1372b 1374b 11 < 0.01 ADG, lb 3.09a 3.63b 3.51b 3.58b 3.64b 3.64b 3.66b 0.06 b < 0.01DMI, lb/d 20.4a 21.8b 22.5bc 22.4b 22.1b 22.4b 23.4c 0.4 < 0.01Feed:gain3 6.61a 6.01d 6.40 ab 6.22bc 6.08cd 6.13cd 6.40 ab 0.01 < 0.01
Carcass CharacteristicsHCW, lb 799a 863b 848b 856b 863b 864b 866b 7 < 0.01Marbling Score4 509 539 545 539 529 523 551 13 0.3212th rib fat, in. 0.43a 0.58b 0.56b 0.55b 0.56b 0.55b 0.55b 0.04 0.02LM, area in.2 12.7 13.0 12.9 12.8 13.0 12.9 13.3 1.2 0.38
a,b,c,dMeans with different superscripts differ (P < 0.05) for treatments.1CON — Control diet with no distillers grains. WDGS — Wet distillers grains included at 35% of Diet DM. DDGS — Dry distillers grains with soluble added to grains prior to the dryer. DDGS+H
2O — Dried distillers grains with solubles added to grains prior to the dryer and H
2O added at time of feeding to reconstitute
DDGS to same DM as MDGSPre and MDGSPost. MDGSPre — Modified distillers grains with solubles added to grains prior to the dryer. MDGSPost — Modi-fied distillers grains with solubles added to grains post dryer. DDG+Solubles — Dried distillers grains with solubles added to grains at time of feeding (~ 80% grains and 20% solubles DM). 2 Calculated from hot carcass weight, adjusted to a common dressing percentage of 63.0%.3 Analyzed as gain:feed, reciprocal of feed conversion.4 Marbling score: 400 = Slight0; 450 = Slight50; 500 = Slight0, etc.
ing percentage of 63% was used to cal-culate carcass adjusted performance to determine final BW, ADG, and F:G.
Performance and carcass data were analyzed using the MIXED procedure of SAS. The model included block and dietary treatment. Pen was the experi-mental unit (6 pens/treatment). Dif-ferences were considered significant when P < 0.05.
Results
Cattle growth performance and carcass characteristics are presented in Table 3. Cattle fed distillers grains were heavier than CON (P < 0.01). Average daily gain was similar for cattle on diets containing distillers grains, but was less for CON (P < 0.01). Dry matter intake was different between diets (P < 0.01). Steers fed CON had the lowest DMI, and DDG + Solubles had the greatest DMI, but was not different from DDGS. There were no differences between the remaining distillers grains for DMI. Cattle on WDGS had the lowest F:G, but were not different from steers fed MDGSPre or MDGSPost (P > 0.23). Both MDGSPre and MDGSPost gained as efficiently as DDGS + H
2O, but were different from
CON, DDGS, and DDG + Solubles (P < 0.03). Feed conversion tended to be greater for CON compared to DDGS and DDG + Solubles (P = 0.07), but was not different for DDGS and DDG + Solubles (P = 0.99).
Cattle on distillers grains diets gained more, and as a result had heavier HCW (P < 0.01). Cattle fed diets containing distillers grains were fatter at harvest than CON (P = 0.02). There were no differences for mar-bling score or LM area (P > 0.32).
Drying distillers grains had a nega-tive effect on the feeding value. How-ever, contrary to the hypothesis, the addition of solubles to dried distillers grains at the time of feeding did not change the feeding value compared to DDGS. In addition, drying the solubles for MDGSPre did not affect the feeding value when compared to MDGSPost where the solubles were not dried onto the grains.
These data suggest drying the solu-bles does not alter the feeding value of distillers grains plus solubles. Adding water to DDGS did not change F:G when compared to DDGS without water, suggesting that the increased feeding value of WDGS compared to DDGS is more than just the benefits of added moisture in the diet. In con-clusion, drying distillers grains plus solubles does have a negative impact on the feeding value in feedlot diets when compared to WDGS. Drying the solubles onto distillers grains does not explain this change in feeding value.
1 Brandon L. Nuttelman, research technician; Will A. Griffin, research technician; Galen E. Erickson, professor; Terry J. Klopfenstein, professor, University of Nebraska–Lincoln Department of Animal Science.
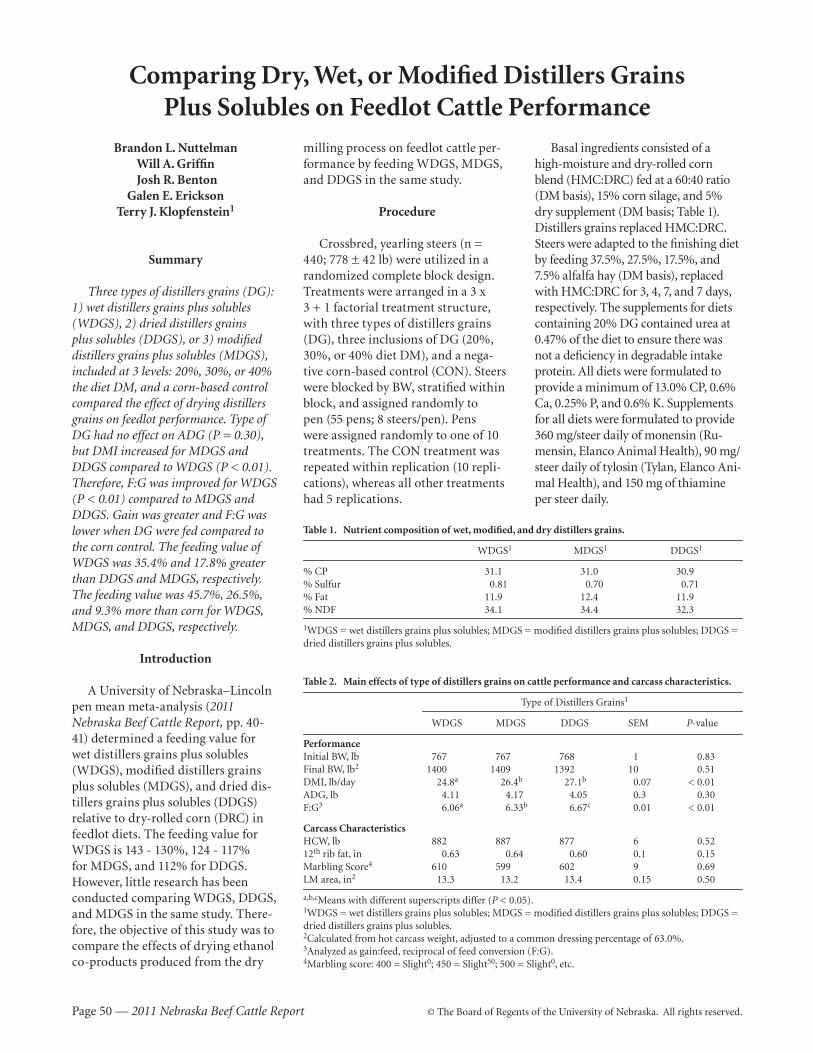
Page 50 — 2011 Nebraska Beef Cattle Report © The Board of Regents of the University of Nebraska. All rights reserved.
Comparing Dry, Wet, or Modified Distillers GrainsPlus Solubles on Feedlot Cattle Performance
milling process on feedlot cattle per-formance by feeding WDGS, MDGS, and DDGS in the same study.
Procedure
Crossbred, yearling steers (n = 440; 778 ± 42 lb) were utilized in a randomized complete block design. Treatments were arranged in a 3 x 3 + 1 factorial treatment structure, with three types of distillers grains (DG), three inclusions of DG (20%, 30%, or 40% diet DM), and a nega-tive corn-based control (CON). Steers were blocked by BW, stratified within block, and assigned randomly to pen (55 pens; 8 steers/pen). Pens were assigned randomly to one of 10 treatments. The CON treatment was repeated within replication (10 repli-cations), whereas all other treatments had 5 replications.
Basal ingredients consisted of a high-moisture and dry-rolled corn blend (HMC:DRC) fed at a 60:40 ratio (DM basis), 15% corn silage, and 5% dry supplement (DM basis; Table 1). Distillers grains replaced HMC:DRC. Steers were adapted to the finishing diet by feeding 37.5%, 27.5%, 17.5%, and 7.5% alfalfa hay (DM basis), replaced with HMC:DRC for 3, 4, 7, and 7 days, respectively. The supplements for diets containing 20% DG contained urea at 0.47% of the diet to ensure there was not a deficiency in degradable intake protein. All diets were formulated to provide a minimum of 13.0% CP, 0.6% Ca, 0.25% P, and 0.6% K. Supplements for all diets were formulated to provide 360 mg/steer daily of monensin (Ru-mensin, Elanco Animal Health), 90 mg/steer daily of tylosin (Tylan, Elanco Ani-mal Health), and 150 mg of thiamine per steer daily.
Brandon L. Nuttelman Will A. Griffin
Josh R. Benton Galen E. Erickson
Terry J. Klopfenstein1
Summary
Three types of distillers grains (DG): 1) wet distillers grains plus solubles (WDGS), 2) dried distillers grains plus solubles (DDGS), or 3) modified distillers grains plus solubles (MDGS), included at 3 levels: 20%, 30%, or 40% the diet DM, and a corn-based control compared the effect of drying distillers grains on feedlot performance. Type of DG had no effect on ADG (P = 0.30), but DMI increased for MDGS and DDGS compared to WDGS (P < 0.01). Therefore, F:G was improved for WDGS (P < 0.01) compared to MDGS and DDGS. Gain was greater and F:G was lower when DG were fed compared to the corn control. The feeding value of WDGS was 35.4% and 17.8% greater than DDGS and MDGS, respectively. The feeding value was 45.7%, 26.5%, and 9.3% more than corn for WDGS, MDGS, and DDGS, respectively.
Introduction
A University of Nebraska–Lincoln pen mean meta-analysis (2011 Nebraska Beef Cattle Report, pp. 40-41) determined a feeding value for wet distillers grains plus solubles (WDGS), modified distillers grains plus solubles (MDGS), and dried dis-tillers grains plus solubles (DDGS) relative to dry-rolled corn (DRC) in feedlot diets. The feeding value for WDGS is 143 - 130%, 124 - 117% for MDGS, and 112% for DDGS. However, little research has been conducted comparing WDGS, DDGS, and MDGS in the same study. There-fore, the objective of this study was to compare the effects of drying ethanol co-products produced from the dry
Table 1. Nutrient composition of wet, modified, and dry distillers grains.
WDGS1 MDGS1 DDGS1
% CP 31.1 31.0 30.9% Sulfur 0.81 0.70 0.71% Fat 11.9 12.4 11.9% NDF 34.1 34.4 32.3
1WDGS = wet distillers grains plus solubles; MDGS = modified distillers grains plus solubles; DDGS = dried distillers grains plus solubles.
Table 2. Main effects of type of distillers grains on cattle performance and carcass characteristics.
Type of Distillers Grains1
WDGS MDGS DDGS SEM P-value
PerformanceInitial BW, lb 767 767 768 1 0.83Final BW, lb2 1400 1409 1392 10 0.51DMI, lb/day 24.8a 26.4b 27.1b 0.07 < 0.01ADG, lb 4.11 4.17 4.05 0.3 0.30F:G3 6.06a 6.33b 6.67c 0.01 < 0.01
Carcass CharacteristicsHCW, lb 882 887 877 6 0.5212th rib fat, in 0.63 0.64 0.60 0.1 0.15Marbling Score4 610 599 602 9 0.69LM area, in2 13.3 13.2 13.4 0.15 0.50
a,b,cMeans with different superscripts differ (P < 0.05).1WDGS = wet distillers grains plus solubles; MDGS = modified distillers grains plus solubles; DDGS = dried distillers grains plus solubles.2Calculated from hot carcass weight, adjusted to a common dressing percentage of 63.0%.3Analyzed as gain:feed, reciprocal of feed conversion (F:G).4Marbling score: 400 = Slight0; 450 = Slight50; 500 = Slight0, etc.
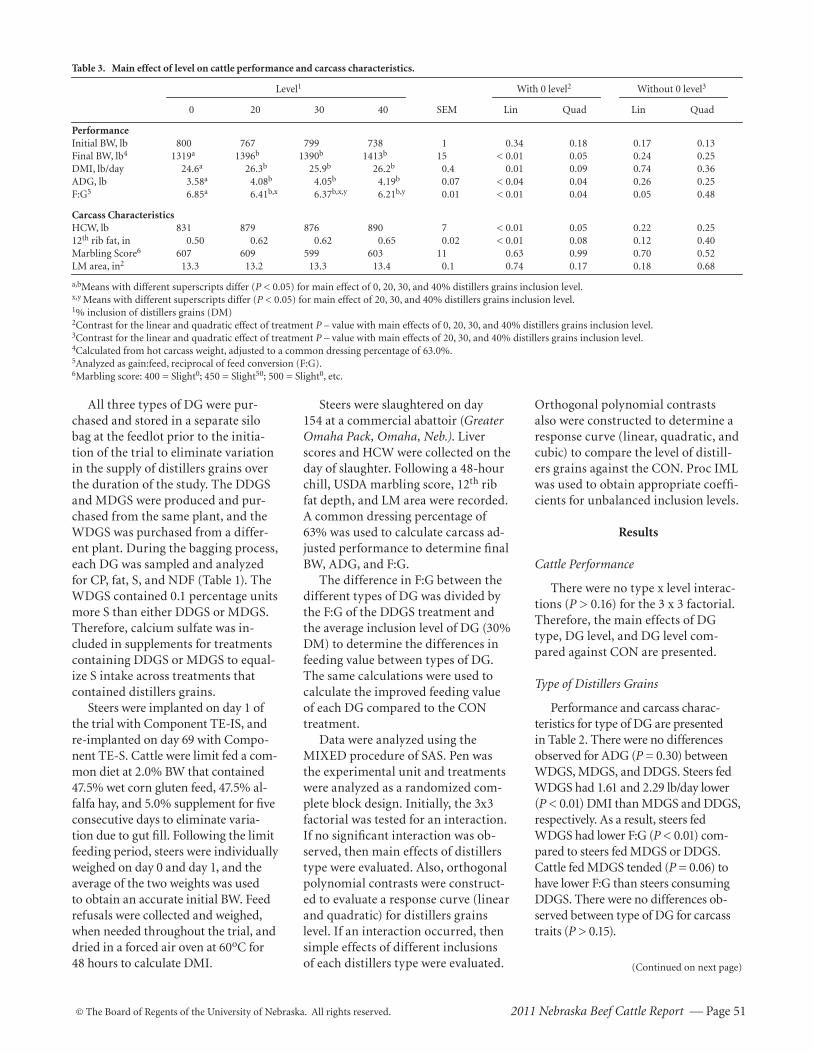
© The Board of Regents of the University of Nebraska. All rights reserved. 2011 Nebraska Beef Cattle Report — Page 51
All three types of DG were pur-chased and stored in a separate silo bag at the feedlot prior to the initia-tion of the trial to eliminate variation in the supply of distillers grains over the duration of the study. The DDGS and MDGS were produced and pur-chased from the same plant, and the WDGS was purchased from a differ-ent plant. During the bagging process, each DG was sampled and analyzed for CP, fat, S, and NDF (Table 1). The WDGS contained 0.1 percentage units more S than either DDGS or MDGS. Therefore, calcium sulfate was in-cluded in supplements for treatments containing DDGS or MDGS to equal-ize S intake across treatments that contained distillers grains.
Steers were implanted on day 1 of the trial with Component TE-IS, and re-implanted on day 69 with Compo-nent TE-S. Cattle were limit fed a com-mon diet at 2.0% BW that contained 47.5% wet corn gluten feed, 47.5% al-falfa hay, and 5.0% supplement for five consecutive days to eliminate varia-tion due to gut fill. Following the limit feeding period, steers were individually weighed on day 0 and day 1, and the average of the two weights was used to obtain an accurate initial BW. Feed refusals were collected and weighed, when needed throughout the trial, and dried in a forced air oven at 60oC for 48 hours to calculate DMI.
Table 3. Main effect of level on cattle performance and carcass characteristics.
Level1 With 0 level2 Without 0 level3
0 20 30 40 SEM Lin Quad Lin Quad
PerformanceInitial BW, lb 800 767 799 738 1 0.34 0.18 0.17 0.13Final BW, lb4 1319a 1396b 1390b 1413b 15 < 0.01 0.05 0.24 0.25DMI, lb/day 24.6a 26.3b 25.9b 26.2b 0.4 0.01 0.09 0.74 0.36ADG, lb 3.58a 4.08b 4.05b 4.19b 0.07 < 0.04 0.04 0.26 0.25F:G5 6.85a 6.41b,x 6.37b,x,y 6.21b,y 0.01 < 0.01 0.04 0.05 0.48
Carcass CharacteristicsHCW, lb 831 879 876 890 7 < 0.01 0.05 0.22 0.2512th rib fat, in 0.50 0.62 0.62 0.65 0.02 < 0.01 0.08 0.12 0.40Marbling Score6 607 609 599 603 11 0.63 0.99 0.70 0.52LM area, in2 13.3 13.2 13.3 13.4 0.1 0.74 0.17 0.18 0.68
a,bMeans with different superscripts differ (P < 0.05) for main effect of 0, 20, 30, and 40% distillers grains inclusion level. x,y Means with different superscripts differ (P < 0.05) for main effect of 20, 30, and 40% distillers grains inclusion level. 1% inclusion of distillers grains (DM)2Contrast for the linear and quadratic effect of treatment P – value with main effects of 0, 20, 30, and 40% distillers grains inclusion level.3Contrast for the linear and quadratic effect of treatment P – value with main effects of 20, 30, and 40% distillers grains inclusion level. 4Calculated from hot carcass weight, adjusted to a common dressing percentage of 63.0%.5Analyzed as gain:feed, reciprocal of feed conversion (F:G).6Marbling score: 400 = Slight0; 450 = Slight50; 500 = Slight0, etc.
Steers were slaughtered on day 154 at a commercial abattoir (Greater Omaha Pack, Omaha, Neb.). Liver scores and HCW were collected on the day of slaughter. Following a 48-hour chill, USDA marbling score, 12th rib fat depth, and LM area were recorded. A common dressing percentage of 63% was used to calculate carcass ad-justed performance to determine final BW, ADG, and F:G.
The difference in F:G between the different types of DG was divided by the F:G of the DDGS treatment and the average inclusion level of DG (30% DM) to determine the differences in feeding value between types of DG. The same calculations were used to calculate the improved feeding value of each DG compared to the CON treatment.
Data were analyzed using the MIXED procedure of SAS. Pen was the experimental unit and treatments were analyzed as a randomized com-plete block design. Initially, the 3x3 factorial was tested for an interaction. If no significant interaction was ob-served, then main effects of distillers type were evaluated. Also, orthogonal polynomial contrasts were construct-ed to evaluate a response curve (linear and quadratic) for distillers grains level. If an interaction occurred, then simple effects of different inclusions of each distillers type were evaluated.
Orthogonal polynomial contrasts also were constructed to determine a response curve (linear, quadratic, and cubic) to compare the level of distill-ers grains against the CON. Proc IML was used to obtain appropriate coeffi-cients for unbalanced inclusion levels.
Results
Cattle Performance
There were no type x level interac-tions (P > 0.16) for the 3 x 3 factorial. Therefore, the main effects of DG type, DG level, and DG level com-pared against CON are presented.
Type of Distillers Grains
Performance and carcass charac-teristics for type of DG are presented in Table 2. There were no differences observed for ADG (P = 0.30) between WDGS, MDGS, and DDGS. Steers fed WDGS had 1.61 and 2.29 lb/day lower (P < 0.01) DMI than MDGS and DDGS, respectively. As a result, steers fed WDGS had lower F:G (P < 0.01) com-pared to steers fed MDGS or DDGS. Cattle fed MDGS tended (P = 0.06) to have lower F:G than steers consuming DDGS. There were no differences ob-served between type of DG for carcass traits (P > 0.15).
(Continued on next page)
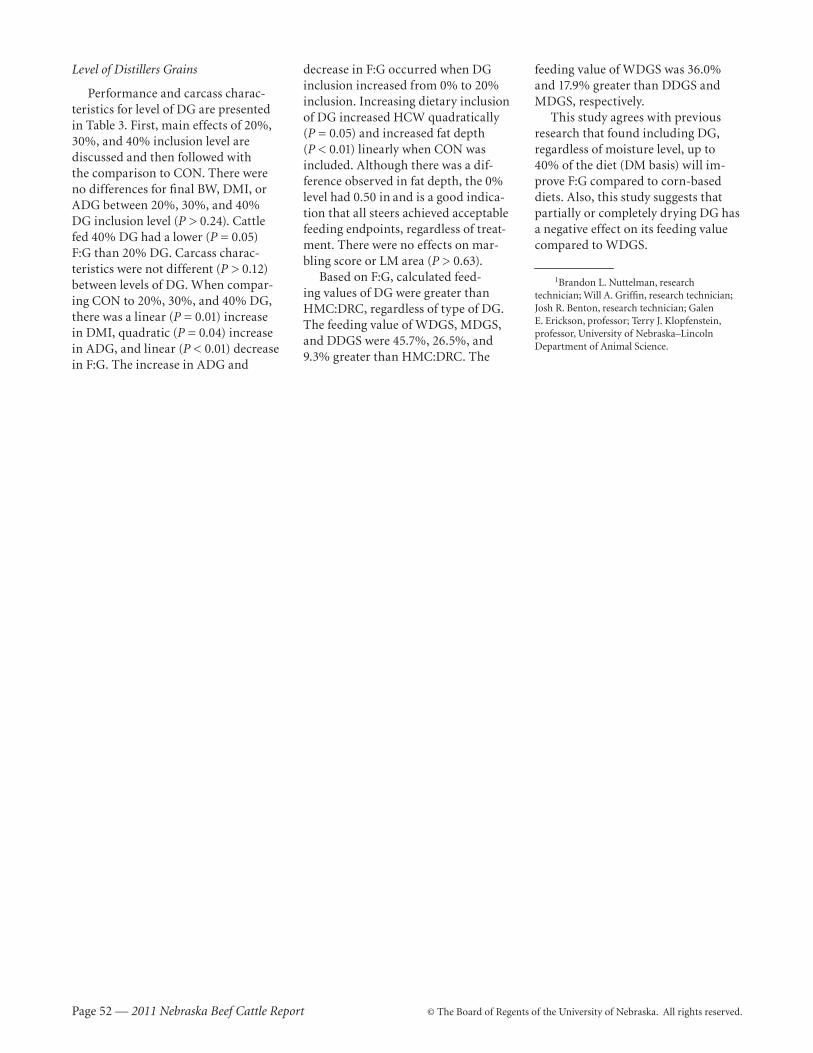
Page 52 — 2011 Nebraska Beef Cattle Report © The Board of Regents of the University of Nebraska. All rights reserved.
Level of Distillers Grains
Performance and carcass charac-teristics for level of DG are presented in Table 3. First, main effects of 20%, 30%, and 40% inclusion level are discussed and then followed with the comparison to CON. There were no differences for final BW, DMI, or ADG between 20%, 30%, and 40% DG inclusion level (P > 0.24). Cattle fed 40% DG had a lower (P = 0.05) F:G than 20% DG. Carcass charac-teristics were not different (P > 0.12) between levels of DG. When compar-ing CON to 20%, 30%, and 40% DG, there was a linear (P = 0.01) increase in DMI, quadratic (P = 0.04) increase in ADG, and linear (P < 0.01) decrease in F:G. The increase in ADG and
decrease in F:G occurred when DG inclusion increased from 0% to 20% inclusion. Increasing dietary inclusion of DG increased HCW quadratically (P = 0.05) and increased fat depth (P < 0.01) linearly when CON was included. Although there was a dif-ference observed in fat depth, the 0% level had 0.50 in and is a good indica-tion that all steers achieved acceptable feeding endpoints, regardless of treat-ment. There were no effects on mar-bling score or LM area (P > 0.63).
Based on F:G, calculated feed-ing values of DG were greater than HMC:DRC, regardless of type of DG. The feeding value of WDGS, MDGS, and DDGS were 45.7%, 26.5%, and 9.3% greater than HMC:DRC. The
feeding value of WDGS was 36.0% and 17.9% greater than DDGS and MDGS, respectively.
This study agrees with previous research that found including DG, regardless of moisture level, up to 40% of the diet (DM basis) will im-prove F:G compared to corn-based diets. Also, this study suggests that partially or completely drying DG has a negative effect on its feeding value compared to WDGS.
1Brandon L. Nuttelman, research technician; Will A. Griffin, research technician; Josh R. Benton, research technician; Galen E. Erickson, professor; Terry J. Klopfenstein, professor, University of Nebraska–Lincoln Department of Animal Science.
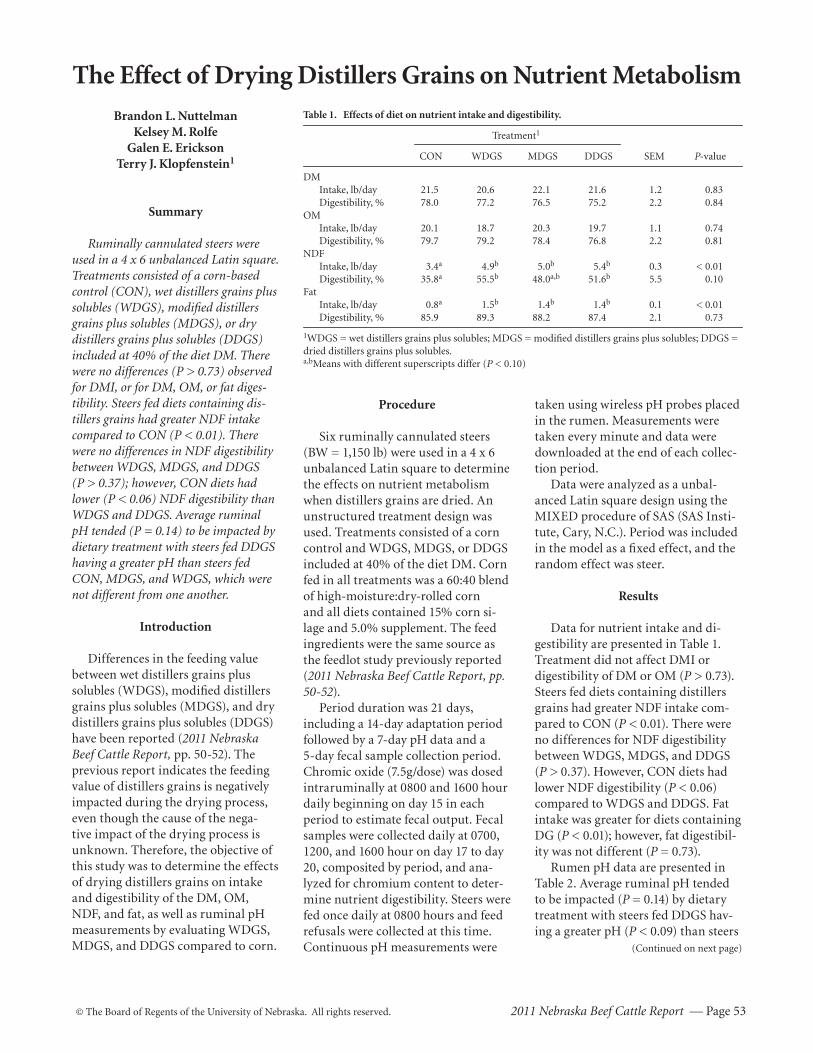
© The Board of Regents of the University of Nebraska. All rights reserved. 2011 Nebraska Beef Cattle Report — Page 53
(Continued on next page)
The Effect of Drying Distillers Grains on Nutrient Metabolism
Brandon L. Nuttelman Kelsey M. Rolfe
Galen E. Erickson Terry J. Klopfenstein1
Summary
Ruminally cannulated steers were used in a 4 x 6 unbalanced Latin square. Treatments consisted of a corn-based control (CON), wet distillers grains plus solubles (WDGS), modified distillers grains plus solubles (MDGS), or dry distillers grains plus solubles (DDGS) included at 40% of the diet DM. There were no differences (P > 0.73) observed for DMI, or for DM, OM, or fat diges-ti bility. Steers fed diets containing dis-tillers grains had greater NDF intake compared to CON (P < 0.01). There were no differences in NDF digestibility between WDGS, MDGS, and DDGS (P > 0.37); however, CON diets had lower (P < 0.06) NDF digestibility than WDGS and DDGS. Average ruminal pH tended (P = 0.14) to be impacted by dietary treatment with steers fed DDGS having a greater pH than steers fed CON, MDGS, and WDGS, which were not different from one another.
Introduction
Differences in the feeding value between wet distillers grains plus solubles (WDGS), modified distillers grains plus solubles (MDGS), and dry distillers grains plus solubles (DDGS) have been reported (2011 Nebraska Beef Cattle Report, pp. 50-52). The previous report indicates the feeding value of distillers grains is negatively impacted during the drying process, even though the cause of the nega-tive impact of the drying process is unknown. Therefore, the objective of this study was to determine the effects of drying distillers grains on intake and digestibility of the DM, OM, NDF, and fat, as well as ruminal pH measurements by evaluating WDGS, MDGS, and DDGS compared to corn.
Procedure
Six ruminally cannulated steers (BW = 1,150 lb) were used in a 4 x 6 unbalanced Latin square to determine the effects on nutrient metabolism when distillers grains are dried. An unstructured treatment design was used. Treatments consisted of a corn control and WDGS, MDGS, or DDGS included at 40% of the diet DM. Corn fed in all treatments was a 60:40 blend of high-moisture:dry-rolled corn and all diets contained 15% corn si-lage and 5.0% supplement. The feed ingredients were the same source as the feedlot study previously reported (2011 Nebraska Beef Cattle Report, pp. 50-52).
Period duration was 21 days, including a 14-day adaptation period followed by a 7-day pH data and a 5-day fecal sample collection period. Chromic oxide (7.5g/dose) was dosed intraruminally at 0800 and 1600 hour daily beginning on day 15 in each period to estimate fecal output. Fecal samples were collected daily at 0700, 1200, and 1600 hour on day 17 to day 20, composited by period, and ana-lyzed for chromium content to deter-mine nutrient digestibility. Steers were fed once daily at 0800 hours and feed refusals were collected at this time. Continuous pH measurements were
taken using wireless pH probes placed in the rumen. Measurements were taken every minute and data were downloaded at the end of each collec-tion period.
Data were analyzed as a unbal-anced Latin square design using the MIXED procedure of SAS (SAS Insti-tute, Cary, N.C.). Period was included in the model as a fixed effect, and the random effect was steer.
Results
Data for nutrient intake and di-gestibility are presented in Table 1. Treatment did not affect DMI or digestibility of DM or OM (P > 0.73). Steers fed diets containing distillers grains had greater NDF intake com-pared to CON (P < 0.01). There were no differences for NDF digestibility between WDGS, MDGS, and DDGS (P > 0.37). However, CON diets had lower NDF digestibility (P < 0.06) compared to WDGS and DDGS. Fat intake was greater for diets containing DG (P < 0.01); however, fat digestibil-ity was not different (P = 0.73).
Rumen pH data are presented in Table 2. Average ruminal pH tended to be impacted (P = 0.14) by dietary treatment with steers fed DDGS hav-ing a greater pH (P < 0.09) than steers
Table 1. Effects of diet on nutrient intake and digestibility.
Treatment1
CON WDGS MDGS DDGS SEM P-value
DM Intake, lb/day 21.5 20.6 22.1 21.6 1.2 0.83 Digestibility, % 78.0 77.2 76.5 75.2 2.2 0.84OM Intake, lb/day 20.1 18.7 20.3 19.7 1.1 0.74 Digestibility, % 79.7 79.2 78.4 76.8 2.2 0.81NDF Intake, lb/day 3.4a 4.9b 5.0b 5.4b 0.3 < 0.01 Digestibility, % 35.8a 55.5b 48.0a,b 51.6b 5.5 0.10Fat Intake, lb/day 0.8a 1.5b 1.4b 1.4b 0.1 < 0.01 Digestibility, % 85.9 89.3 88.2 87.4 2.1 0.73
1WDGS = wet distillers grains plus solubles; MDGS = modified distillers grains plus solubles; DDGS = dried distillers grains plus solubles.a,bMeans with different superscripts differ (P < 0.10)
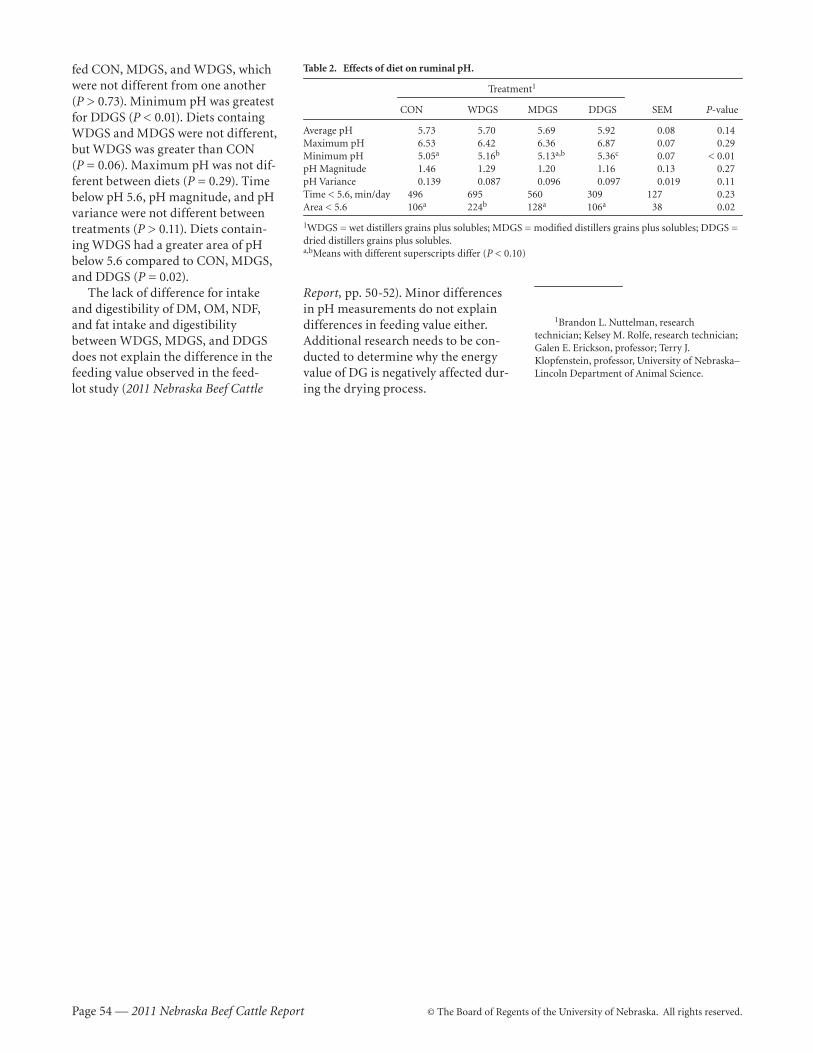
Page 54 — 2011 Nebraska Beef Cattle Report © The Board of Regents of the University of Nebraska. All rights reserved.
fed CON, MDGS, and WDGS, which were not different from one another (P > 0.73). Minimum pH was greatest for DDGS (P < 0.01). Diets containg WDGS and MDGS were not different, but WDGS was greater than CON (P = 0.06). Maximum pH was not dif-ferent between diets (P = 0.29). Time below pH 5.6, pH magnitude, and pH variance were not different between treatments (P > 0.11). Diets contain-ing WDGS had a greater area of pH below 5.6 compared to CON, MDGS, and DDGS (P = 0.02).
The lack of difference for intake and digestibility of DM, OM, NDF, and fat intake and digestibility between WDGS, MDGS, and DDGS does not explain the difference in the feeding value observed in the feed-lot study (2011 Nebraska Beef Cattle
Table 2. Effects of diet on ruminal pH.
Treatment1
CON WDGS MDGS DDGS SEM P-value
Average pH 5.73 5.70 5.69 5.92 0.08 0.14Maximum pH 6.53 6.42 6.36 6.87 0.07 0.29Minimum pH 5.05a 5.16b 5.13a,b 5.36c 0.07 < 0.01pH Magnitude 1.46 1.29 1.20 1.16 0.13 0.27pH Variance 0.139 0.087 0.096 0.097 0.019 0.11Time < 5.6, min/day 496 695 560 309 127 0.23Area < 5.6 106a 224b 128a 106a 38 0.02
1WDGS = wet distillers grains plus solubles; MDGS = modified distillers grains plus solubles; DDGS = dried distillers grains plus solubles.a,bMeans with different superscripts differ (P < 0.10)
Report , pp. 50-52). Minor differences in pH measurements do not explain differences in feeding value either. Additional research needs to be con-ducted to determine why the energy value of DG is negatively affected dur-ing the drying process.
1Brandon L. Nuttelman, research technician; Kelsey M. Rolfe, research technician; Galen E. Erickson, professor; Terry J. Klopfenstein, professor, University of Nebraska–Lincoln Department of Animal Science.
© The Board of Regents of the University of Nebraska. All rights reserved. 2011 Nebraska Beef Cattle Report — Page 55
Effect of Feeding More Than 70% Wet Distillers Grains Plus Solubles On Feedlot Cattle Performance
Amy R. RichGalen E. Erickson
Terry J. KlopfensteinMatt K. LuebbeJosh R. BentonWill A. Griffin
Darrell R. Mark1
Summary
A finishing trial evaluated effects of feeding greater than 70% wet distillers grains plus solubles (WDGS) on feedlot cattle performance. The WDGS was fed at 40, 70, 77, and 85% of diet dry mat-ter (DM), while roughage levels ranged from 5 to 25% across treatments. Larger ADG and G:F were observed with 40% WDGS and 5% roughage. Higher levels of WDGS were successfully fed with levels of roughage above 8% but the diets were less profitable than the 40% WDGS diet.
Introduction
Replacing corn up to 50% of diet DM as WDGS resulted in superior performance compared to cattle fed 0% WDGS (2010 Nebraska Beef Cattle Report, pp. 61-62). The feeding value was consistently greater for WDGS up to 50% of diet DM, compared to corn. Incidences of polioencephalomalacia (polio) increased slightly when cattle were fed diets above 0.46% sulfur and dramatically increased when greater than 0.56% with roughages at 5-7% (2009, Nebraska Beef Report, pp. 79-80; 2010 Nebraska Beef Cattle Report, pp. 68-69). Polio risk is decreased when roughage level is maintained or increased in the ration. Another trial (2009, Nebraska Beef Cattle Report, pp. 76-78) determined effects of feeding WDGS with or without corn on feed-lot performance. The objectives of our study were to evaluate the effects of feeding increased amounts of WDGS with typical or increasing levels of roughage on feedlot cattle perfor-mance and economics.
Procedure
A finishing study was conducted using 336 crossbred steers (BW = 741 ± 20 lb) that were assigned randomly (8 steers/pen) in a randomized com-plete block design. Two consecutive day individual weights were collected for initial BW. Cattle were stratified by BW within respective weight block and assigned randomly to 42 pens. Seven treatments included: 1) control (CON) of 85% dry-rolled corn (DRC), 4.7% wheat straw, and 5.0% molasses; 2) (40-5) 40% WDGS, 50.3% DRC, and 4.7% wheat straw, ; 3) (70-8) 70% WDGS, 16.8% DRC, and 8.2% wheat straw; 4) (77-9) 77.5% WDGS, 8.4% DRC, and 9.1% wheat straw; 5) (85-10) 85% WDGS and 10% wheat straw; 6) (77-17) 77.5% WDGS and 17.5% wheat straw; 7) (70-25) 70% WDGS and 25% wheat straw all on a DM basis. Table 1 provides DM, fat, CP, and S of WDGS used in this trial. All diets contained a supplement at 5.0%, which was to keep the Ca:P ratio at a minimum of 1.2 to 1. Supplements also were for-mulated to provide Rumensin at 30 g/ton DM , Tylan at 90 mg/steer/day, and thiamine at 130 mg/steer/day.
An adaptation period of 21 days was utilized and steers received Revelor-XS on day 1 of the feeding trial. Steers on treatments CON, 40-5, 70-8, and 77-17 were fed for 183 days, from November to May, and steers on treatments 85-10, 77-17, and 70-25 were fed for 225 days, from November to June, to achieve similar final BW. Steers were harvested at a commercial abattoir (Greater OmahPack, Omaha,
Neb.). Hot carcass weights (HCW) and liver scores were collected on the day of slaughter. After a 48-hour chill, LM area, 12th rib fat thickness, and USDA marbling scores were recorded. USDA yield grade (YG) was calculated from HCW, fat depth, LM area and an assumed 2.5% kidney, pelvic, and heart fat (KPH). A common dressing percentage (63%) was used to calcu-late carcass adjusted performance of final BW, ADG, and feed efficiency.
Weekly feed samples were taken for DM analysis using a 60̊ forced air oven for 48-hours. Composite samples for each ingredient over the feeding period were analyzed for CP, fat, and sulfur (S).
Finishing Economics
Budgets were created for all seven diets using the average 2008 five-area yearly weighted direct slaughter steer live price from USDA Market News Service ($93.13/cwt). Initial steer price was calculated as the average initial BW of pens multiplied by $126.39/cwt to make the CON steers profit equal zero. The price of corn was set at $3.50/bu, WDGS price was constant at 85% the price of corn, and wheat straw was constant at $72.70/DM ton (delivered and processed). Yardage was charged at $0.40 per steer daily with health and processing costs of $20 per steer and a death loss of 1.5%. Interest was estimated as 8.0% for feed costs and initial steer cost. Total production costs included total feed costs with interest; all health, process-ing, and death loss costs; and initial
Table 1. Composition of diets.
Corn No corn
Ingredient CON 40-5 70-8 77-9 85-10 77-17 70-25
WDGS1 — 40 70 77-5 85 77.5 70DRC2 85 50.3 16.8 8.4 — — —Wheat straw 4.7 4.7 8.2 9.1 10 17.5 25
% Sulfur 0.11 0.41 0.63 0.68 0.74 0.68 0.63% Fat 3.61 7.23 9.66 10.26 10.80 9.90 9.001WDGS = wet distillers grains plus soluble.2DRC = dry-rolled corn.
(Continued on next page)
Page 56 — 2011 Nebraska Beef Cattle Report © The Board of Regents of the University of Nebraska. All rights reserved.
steer cost with interest. Cost of gain (COG) was calculated by dividing total finishing cost by average gain per pen. Slaughter breakeven (BE) was calculated by dividing the total cost of production by the carcass-adjusted final BW. Profit or loss (P/L) was cal-culated by subtracting the total cost of production from the final steer value.
Statistical Analysis
All data were analyzed using MIXED procedures of SAS as a ran-domized complete block design with pen as the experimental unit. The effects of treatment and block were in-cluded in the model. Treatment means were compared using a protected F-test and means separation when the F-test statistic was significant.
Results
Performance Results
Two steers were pulled from the trial for respiratory illness, and no steers were diagnosed with polio. Cattle performance data are sum-marized in Table 2. Treatments 85-10, 77-17, and 70-25 were fed for a total of 225 days to achieve similar final BW, where treatments CON, 40-5, 70-8, and 77-9 were fed for 183 days. Steers fed the 40-5 had the greatest (P < 0.01) ADG, F:G, and HCW; however, F: G was similar to steers fed the 77-9. Steers fed 70-25 had the least (P < 0.01) ADG, F:G, and HCW. DMI was the great-est (P < 0.05) for the 40-5 and CON followed by the 70-8 and 77-17 steers, 77-9, and lastly the 70-25 and 85-10 steers. Steers being fed the CON, 70-8, and 77-9 had similar ADG, followed by steers fed 77-17, then 85-10, which were different (P < 0.01). Steers fed CON, 85-10, and 77-17 had similar G:F (P > 0.10) but less (P < 0.05) than 40-5, 70-8, and 77-9. However, steers fed 85-10, 77-17, and 70-25 were fed 42 days longer. Carcass characteristics also are reported in Table 2. Overall, 40-5 had the greatest and 70-25 had the least marbling scores, LM area, 12th rib fat, and YG when compared to the other treatments. Marbling score was greatest (P < 0.05) for CON and
Table 2. Performance results for treatments.
Dietary Treatment1: CON 40-5 70-8 77-9 85-10 70-17 70-25 SEM
Performance DOF 183 183 183 183 225 225 225 — Initial BW, lb 594 595 593 593 595 593 593 9 Final BW, lb 1254b 1389a 1261b 1246b 1242b 1282b 1153c 15 DMI, lb/day 22.6b 22.9a 20.2b 19.1c 17.8d 19.1bc 18.2d 0.24 ADG, lb 3.60a 4.33a 3.65b 3.57b 2.88d 3.07c 2.49e 0.06 F:G 6.25b 5.29a 5.52b 5.35ab 6.17c 6.37c 2.63d —Carcass Characteristics HCW, lb 790b 875a 795b 785b 783b 807b 726c 9.62 Marbling score 525a 523a 491b 468bc 457c 467bc 404d 9.12 LM area, in2 12.35ab 12.9a 12.22bc 12.10bc 11.63c 11.75c 11.97bc 0.002 12th rib fat, in 0.42c 0.61a 0.48bc 0.44bc 0.43c 0.5b 0.27d 0.02 YG 3.0de 3.7a 3.4bc 3.2cde 3.3cd 3.6ab 2.5f 0.1 1CON = control diet of 85% DRC; 40-5 = 40% WDGS and 5% wheat straw; 70-8 = 70% WDGS and 8% wheat straw; 77-9 = 77% WDGS and 9% wheat straw; 85-10 = 85% WDGS and 10% wheat straw; 77-17 = 77% WDGS and 17% wheat straw; 70-25 = 70% WDGS and 25% wheat straw.a,b,c,d,e,fWithin a row, means without common superscript differ (P<0.05).
Table 3. Effect of Inclusion of WDGS on economics when corn is $3.50/bu and WDGS is 85% the price of corn.
Treatments1 (%DM)
Dietary Treatments1 CON 40-5 70-8 77-9 85-10 77-17 70-25
BE, $/cwt2 93.13 84.18 89.87 89.52 95.42 91.73 101.20P/L, $/head3 0.00 124.33 54.61 45.02 -28.42 17.97 -93.04COG, $/cwt4 64.00 52.90 55.35 55.94 67.58 61.90 75.021CON = control diet of 85% DRC; 40-5 = 40% WDGS and 5% wheat straw; 70-8 = 70% WDGS and 8% wheat straw; 77-9 = 77% WDGS and 9% wheat straw; 85-10 = 85% WDGS and 10% wheat straw; 77-17 = 77% WDGS and 17% wheat straw; 70-25 = 70% WDGS and 25% wheat straw.2Breakeven (BE) = (initial steer cost ($126.39/cwt) + feed cost5 + interest6 + health&processing7 + yardage8 + deathloss9) / FW.3Profit/Loss (P/L) = final steer value ($93.13/cwt) – (initial steer cost ($126.39/cwt) + feed cost5 + interest 6 + health & processing7 + yardage8 + deathloss9).4Cost of Gain (COG) = (feed cost5 + interest6 + health&processing7 + yardage8 + deathloss9) / (FW-IW).5Feedcost = DRC($3.50/bu); WDGS ($125/DM ton); Wheat straw ($72.70/DM ton).6Interest = 8.0% interest applied to initial steer value (initial BW * $126.39/cwt) and to feed costs.7Health & Processing = $20/steer applied8Yardage = $0.40/steer/d applied9Death loss = 1.5% death loss applied
40-5, least (P < 0.05) for 70-25, and intermediate for the other treatments. Fat depth at the 12th rib was greatest for the 40-5 treatment, followed by the intermediate treatments and CON having subtle differences. The lowest rib fat was observed for cattle fed the 70-25 treatment.
Economic Results
When corn is priced at $3.50/bu and WDGS is 85% the cost of corn, then the 70-25 treatment had the greatest breakeven value at $101.20. The 40-5 treatment had the lowest breakeven value at $84.18/cwt, followed by the 77-9, 70-8, 77-17, CON, and lastly 85-10. When CON is equal to zero, the great-est loss is seen with the 70-25 treatment at -$93.04/head followed by 85-10, and the greatest profit is observed with the 40-5 treatment with $124.33 followed by the 70-8, 77-9, and lastly the 77-17.
Likewise, COG was greatest for the 70-25 treatment, followed by the 85-10, and 77-17 due to these treatments hav-ing lower final BW and extended DOF. The 40-5 treatment has the least COG, followed by the 70-8 and 77-9, which were similar, and lastly CON with a COG at $64.00/cwt. Treatments with the blend of WDGS and some inclu-sion of corn (70-8, 77-9) had greater profit, lower COG, and lower breakev-en prices than the treatments with no corn (85-10, 77-17, 70-25) or the CON treatment.
1Amy R. Rich, graduate student; Galen E. Erickson, professor; Terry J. Klopfenstein, professor; Matt K. Luebbe, research technician; Josh R. Benton, research technician; Will A. Griffin, research technician, University of Nebraska–Lincoln Department of Animal Science; Darrell R. Mark, associate professor, UNL Department of Agricultural Economics.
© The Board of Regents of the University of Nebraska. All rights reserved. 2011 Nebraska Beef Cattle Report — Page 57
Table 1. Adaptation and finishing diets using a combination of WCGF and MDGS compared to forage during the adaptation period.
Days fed: 1 to 9 10 to 16 17 to 23 24 to 30 31 to 39Adaptation: Step 1 Step 2 Step 3 Step 4 Finisher
CONTROLDRC1 20 30 40 50 57.5Alfalfa 45 35 25 15 7.5MDGS2 18 18 18 18 18WCGF3 12 12 12 12 12Supplement3 5 5 5 5 5SYNERGYDRC1 0 14.4 28.8 43.2 57.5Alfalfa 7.5 7.5 7.5 7.5 7.5MDGS2 52.5 43.9 35.2 26.6 18WCGF3 35 29.2 23.5 17.7 12Supplement3 5 5 5 5 5
1DRC: Dry-rolled corn.2MDGS: Modified distillers grains plus solubles.3WCGF: Wet corn gluten feed.4Supplement formulated to provide 90 mg/head/day of tylosin, 360 mg/head/day of monensin and 150 mg/head/day of thiamine.
Table 2. Analyzed nutrient analysis for feeds fed, % DM.
Analysis MDGS WCGF DRC Alfalfa
DM 62.5 44.1 86.4 87.8CP 32.5 21.3 7.9 18.6Ether Extract 11.3 3.3 3.9 0.9NDF 38.6 54.7 10.4 63.9Sulfur 0.81 0.48 0.11 0.29Ash 0.06 0.04 0.01 0.09
(Continued on next page)
Effects Of Feeding A Combination Of Modified Distillers Grains Plus Solubles and Wet Corn Gluten Feed to Adapt
Cattle to Finishing Diets
Marco G. DibKelsey M. Rolfe
Jhones O. SarturiGalen E. Erickson
Terry J. KlopfensteinRon Lindquist1
Summary
Two 39-day metabolism trials were conducted using a combination of modi-fied distillers grains and wet corn gluten feed (Synergy, ADM) to adapt beef cattle to finishing diets (SYNERGY). During adaptation, DMI expressed as % of BW tended to be greater for steers on traditional grain adaptation with forage (CON) compared to SYNERGY during the first period (steps 1), but was not different in subsequent adaptation diets (steps 2, 3, and 4). Average ruminal pH was lower for SYNERGY on steps 1 and 2 compared to CON in Experiment 1 with no difference observed in Experi-ment 2. No difference in ruminal pH was observed between treatments for steps 3 and 4. Both adaptation methods resulted in safe ruminal pH and H
2S
concentrations (<36μmol/L gas). Sig-nificant difference was observed for DM digestibility (DMD) between treatments during step 1 with higher values for the SYNERGY treatment.
Introduction
Metabolism and feedlot research using wet corn gluten feed produced by Cargill (Sweet Bran®; Blair, Neb.) to adapt beef cattle found that decreas ing Sweet Bran instead of forage is a viable method for adapting feedlot cattle to feedlot finishing diets (2009 Nebraska Beef Cattle Report, pp. 53-55, 56-58). A metabolism trial has been con-ducted using wet distillers grains plus solubles (WDGS) to adapt cattle, and the results suggest WDGS may be used instead of forage, but no performance data are available and DMI was lower
for the WDGS treatment initially (2010 Nebraska Beef Cattle Report, pp. 66-67). Therefore, the objective of this study was to test a combination of modified distillers grains plus solubles (MDGS) and wet corn gluten feed (WCGF), and evaluate the responses in ruminal pH, intake, H
2S concentration, in situ
fiber digestibility, and DM digestibil-ity when compared to the traditional forage method of cattle adaptation to finishing diets. The combination of MDGS and WCGF was similar to a new feed produced by ADM (Synergy, Columbus, Neb.).
Procedure
Experiment 1
Six yearling crossbred steers (BW = 891 + 44 lb) with rumen fistula were
brought off pasture following sum-mer grazing to represent yearlings that would enter a feedlot. Steers were assigned randomly into one of two adaptation treatments in a CRD with three steers per treatment. One week before the start of the experiment, the steers were fed 20 lb/day of grass hay (DM). Table 1 represents diets for the SYNERGY and CON treatments. SYNERGY steers were fed decreasing levels of the MDGS and WCGF com-bination (87.5% to 30%) while CON animals were fed the traditional grain adaptation diets with decreasing forage from 45% to 7.5%. In both adaptation schemes, dry-rolled corn increased (up to 57.5%). Cattle were fed ad libitum once daily. Five adaptation diets were used to increase corn with diets fed

Page 58 — 2011 Nebraska Beef Cattle Report © The Board of Regents of the University of Nebraska. All rights reserved.
9, 7, 7, 7, and 9 days, respectively. The last 9-day period consisted of a com-mon finishing diet containing Synergy at 30% of diet DM. All diets provided 320 to 360 mg/steer of Rumensin, 90 mg/steer of Tylan, and 150 mg/steer of thiamine daily. Steers were fed once daily at 0800, and feed refusals were collected and dried to calculate DMI. Intake and pH (wireless pH probes) measurements were collected every minute during the entire study. Ruminal gas samples were collected eight hours post feeding on the last two days of each period , and H
2S concen-
trations were analyzed. Dacron bags (50 mm pore size) containing alfalfa and corn bran were incubated for 24 and 32 hours each to determine in situ NDF digestibility. Chromic oxide (Cr
2O
3) was
intraruminally dosed at 7.5g at 0700 and 1700 hour daily during the first and last period of the study to determine total tract digestibility. Fecal samples were collected at 0600, 1200, and 1800 hour on days 6, 7, 8, and 9 (step 1) and also days 36, 37, 38, and 39 (finisher period ). Fecal composites were analyzed via atomic absorption spectrophotometer for quantification of chromium.
Table 4. Experiment 1 results for DMI, ruminal pH, H2S production and DM digestibility during
finishing diet.
Treatments Control Synergy SEM P-value
DMI, % BW 2.85 2.80 0.11 0.74Average pH 5.61 5.80 0.19 <0.01Maximum pH 6.23 6.41 0.09 0.13Minimum pH 5.36 5.18 0.06 0.02pH variance 0.06 0.04 0.006 0.02Area <5.61 170.61 39.67 50.49 0.06Time <5.6, min. 731.21 320.29 149.90 0.05Area <5.31 26.61 0.18 12.68 0.10Time <5.3, min. 242.47 8.57 97.67 0.07H
2S, μmol/L 22.44 22.14 12.79 0.98
DMD, % 67.89 70.68 2.77 0.51
1Area under curve (magnitude of pH < 5.6 by minute).
Table 3. Experiment1 results for DMI, ruminal pH, H2S production, and total tract DM digestibility for the adaptation period when comparing forage and
co-product diets to adapt cattle to a high grain finishing diet.
Adaptation 1 Adaptation 2 Adaptation 3 Adaptation 4
Treatments Control Synergy P-value Control Synergy P-value Control Synergy P-value Control Synergy P-value
DMI, % BW 2.32 2.05 0.09 2.72 2.37 0.18 2.93 2.67 0.34 2.98 2.79 0.37Average pH 6.18 5.76 <0.01 6.07 5.75 <0.01 5.89 5.84 0.44 5.62 5.67 0.75Maximum pH 6.38 6.54 <0.01 6.66 6.32 <0.01 6.52 6.41 0.11 6.27 6.36 0.63Minimum pH 5.8 5.48 <0.01 5.48 5.4 0.24 5.31 5.36 0.53 5.1 5.26 0.36pH variance 0.03 0.05 0.23 0.06 0.04 0.17 0.07 0.04 0.02 0.07 0.05 0.04Area <5.61 6.85 21.44 0.29 6.7 40.3 0.03 51.54 48.8 0.92 191.64 149.04 0.65Time <5.6, min. 82.3 173.1 0.38 36.55 411.03 0.02 307.29 318.94 0.93 740.43 688.74 0.81H
2S, μmol/L 24.81 13.94 0.2 24.49 6.11 <0.01 31.12 23.51 0.52 36.36 24.05 0.35
DM digestibility, % 57.69 67.96 0.051Area under curve (magnitude of pH < 5.6 by minute).
Experiment 2
Six fistulated calf-fed steers (BW = 564 + 30 lb) were used to repeat Experiment 1 for DMI, ruminal pH, and total tract DM digestibility.
The same methods of data collec-tion and statistical analyses described for Experiment 1 were applied to Experiment 2, except H
2S concentra-
tion and in situ NDF digestibility were not measured on Experiment 2.
Data were analyzed using the GLIMMIX procedure of SAS. Steer was considered the experimental unit,
and the residual was used to test for treatment effects. Variables were DMI, ruminal pH, ruminal H
2S concentra-
tion, in situ fiber digestibility and total tract DM digestibility, for the first adaptation diet and the finishing diet.
Results
Experiment 1
During adaptation, DMI expressed as % of BW tended (P = 0.09) to be greater for steers fed CON compared to SYNERGY during step 1, but was
Table 5. Experiment 2 results for DMI, ruminal pH, H2S production, and total tract DM digestibility for the adaptation period when comparing forage and
co-product diets to adapt cattle to a high grain finishing diet.
Adaptation 1 Adaptation 2 Adaptation 3 Adaptation 4
Treatments Control Synergy P-value Control Synergy P-value Control Synergy P-value Control Synergy P-value
DMI, % BW 2.33 1.95 0.14 2.68 2.76 0.64 2.93 2.71 0.08 3.15 2.8 0.32Average pH 6.1 6.61 0.29 6.22 6.15 0.59 6.23 6.13 0.33 6.06 5.95 0.31Maximum pH 6.75 6.75 0.99 6.88 6.65 0.33 6.92 6.5 0.16 6.87 6.46 0.18Minimum pH 5.53 6.31 0.19 5.17 5.27 0.88 5.61 5.78 0.13 5.54 5.53 0.95pH variance 0.24 0.18 0.15 0.27 0.21 0.25 0.29 0.15 0.07 0.27 0.19 0.22Area <5.61 2.63 5.33 0.49 7.23 4.77 0.71 2 0 0.15 3.54 4.91 0.77Time <5.6, min. 38.29 108.84 0.28 9.5 6.53 0.73 28.16 0 0.14 52.39 10.22 0.26DM digestibility, % 57.58 68.64 0.27
1Area under curve (magnitude of pH < 5.6 by minute).

© The Board of Regents of the University of Nebraska. All rights reserved. 2011 Nebraska Beef Cattle Report — Page 59
average ruminal pH (> 5.6). H2S con-
centrations observed were always lower than 36μmol/L gas with the SYNERGY treatment group being less than the CON group. Statistical difference (P < 0.10) was observed for DM digest-ibility between treatments for step 1, with higher values for the SYNERGY treatment, and no difference was observed during the finishing diet. A three-way interaction was observed for the in situ DMD for type of feed (alfalfa and corn bran), time (24 and 32 hours) and whether incubated in CON or SYNERGY steers. One time was cho-sen (32 hours) to represent the trends observed for NDF digestibility, and it is presented in Figure 1. Corn bran was more digestible during all adaptation periods compared to alfalfa.
Experiment 2.
DMI expressed as % of BW was greater for steers fed CON compared to SYNERGY during the third period, but was not different during other adaptation periods (P > 0.14). Average pH was only different (P < 0.03) during the finishing period with greater values for SYNERGY (6.14 vs. 5.91). No differ-ence (P > 0.29) was observed between treatments in ruminal pH for adapta-tion 1, 2, 3, and 4. Area and time below pH 5.6 were not significantly different among treatments during Experiment 2 in any of the periods . Variance of pH was significantly different in Adapta-tion 3 with higher values for animals fed the CON diets. However, DM digestibility was numerically greater (P < 0.27) for the SYNERGY treatment compared to CON (68.64 vs. 57.58) during step 1, and significant in the finisher.
Results suggest that decreasing inclusio of a combination of distillers grains and gluten feed was as effective as the traditional method using forage for adapting feedlot cattle to high-concentrate diets.
1Marco G. Dib, graduate student; Kelsey M. Rolfe, research technician; Jhones O. Sarturi, graduate student; Galen E. Erickson, associate professor; Terry J. Klopfenstein, professor; University of Nebraska–Lincoln Department of Animal Science; Ron Lindquist, ADM, Columbus, Neb.
Table 6. Experiment 2 results for DMI, ruminal pH, H2S production and DM digestibility during
finishing diet.
Treatments Control Synergy SEM P-value
DMI, % BW 3.17 3.08 0.21 0.66Average pH 5.91 6.14 0.06 0.03Maximum pH 6.36 6.88 0.05 <0.01Minimum pH 5.47 5.62 0.05 0.05pH variance 0.18 0.26 0.02 0.03Area <5.61 6.88 0.96 3.32 0.17Time <5.6, min. 92.11 19.97 43.87 0.20DMD, % 56.64 73.07 4.03 0.02
1Area under curve (magnitude of pH < 5.6 by minute).
In situ NDF digestibility (alfalfa)
60
55
50
45
40
35
30
25
20
Dig
esti
bilit
y, %
Dig
esti
bilit
y, %
CON
Syn
CON
Syn
1 2 3 4 5
Periods
In situ NDF digestibility (corn bran)
Figures 1 and 2 represent the in situ digestibility during the four adaptation steps and finishing diet for forage and byproduct treatments for alfalfa and corn bran NDF digestibility (32 hour time frame).
60
55
50
45
40
35
30
25
20 1 2 3 4 5
Periods
not different in subsequent adaptation diets (P > 0.20). Average pH was lower (P < 0.01) for SYNERGY on step 1 and 2 compared to CON (5.76 vs. 6.18; 5.75 vs. 6.07, respectively). No differ-ence (P > 0.44) was observed between treatments for ruminal pH during steps 3 and 4. Average pH was lower (P < 0.01) for CON on the last period when both treatments were being fed the same diet (5.61 vs. 5.80), suggest-ing that SYNERGY adaptation treat-ment may have a positive effect with
finishing diets containing 30% of the Synergy product. Area and time below pH 5.6 followed the same pattern with greater values (21.44 and 173.10 vs. 6.85 and 82.30) on the second period (P < 0.03) and lower values (39.67 and 320.29 vs. 170.61 and 731.21) during the finisher period (P < 0.06) for the SYNERGY compared to CON. Vari-ance of pH was significantly different on the last three periods with higher values for animals fed the CON diets. Both adaptation methods resulted in
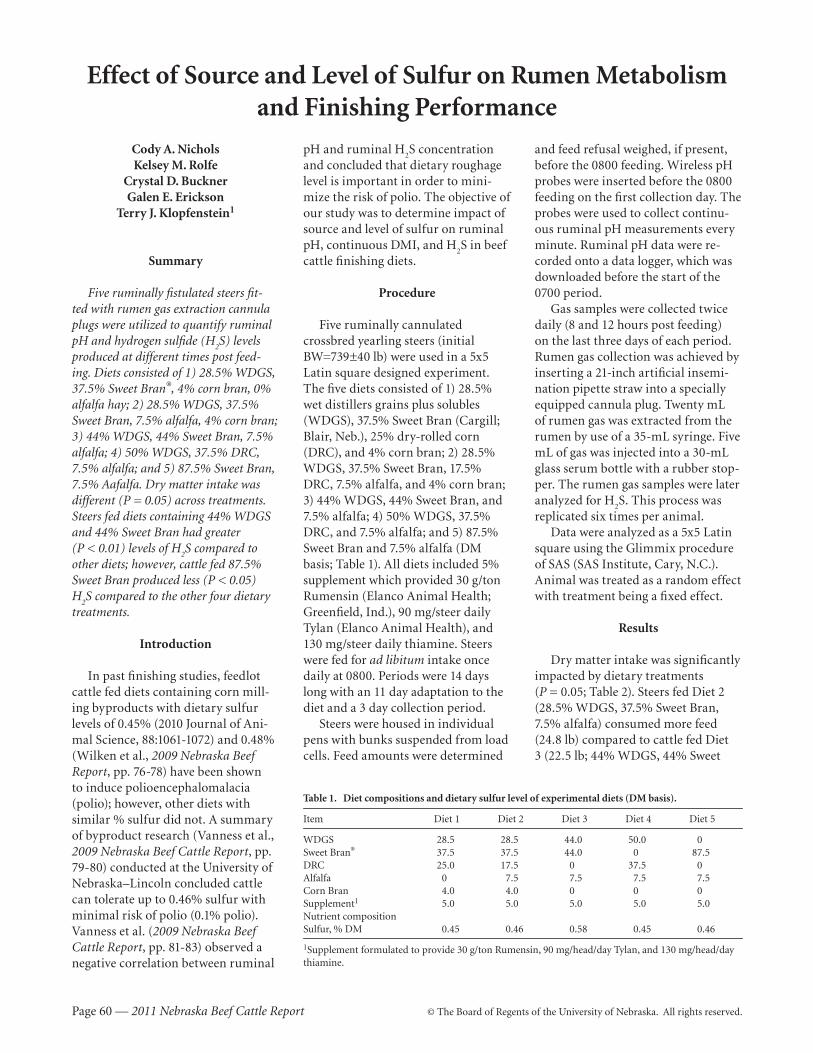
Page 60 — 2011 Nebraska Beef Cattle Report © The Board of Regents of the University of Nebraska. All rights reserved.
Effect of Source and Level of Sulfur on Rumen Metabolism and Finishing Performance
Cody A. NicholsKelsey M. Rolfe
Crystal D. BucknerGalen E. Erickson
Terry J. Klopfenstein1
Summary
Five ruminally fistulated steers fit-ted with rumen gas extraction cannula plugs were utilized to quantify ruminal pH and hydrogen sulfide (H
2S) levels
produced at different times post feed-ing. Diets consisted of 1) 28.5% WDGS, 37.5% Sweet Bran®, 4% corn bran, 0% alfalfa hay; 2) 28.5% WDGS, 37.5% Sweet Bran, 7.5% alfalfa, 4% corn bran; 3) 44% WDGS, 44% Sweet Bran, 7.5% alfalfa; 4) 50% WDGS, 37.5% DRC, 7.5% alfalfa; and 5) 87.5% Sweet Bran, 7.5% Aafalfa. Dry matter intake was different (P = 0.05) across treatments. Steers fed diets containing 44% WDGS and 44% Sweet Bran had greater (P < 0.01) levels of H
2S compared to
other diets; however, cattle fed 87.5% Sweet Bran produced less (P < 0.05) H
2S compared to the other four dietary
treatments.
Introduction
In past finishing studies, feedlot cattle fed diets containing corn mill-ing byproducts with dietary sulfur levels of 0.45% (2010 Journal of Ani-mal Science, 88:1061-1072) and 0.48% (Wilken et al., 2009 Nebraska Beef Report, pp. 76-78) have been shown to induce polioencephalomalacia (polio); however, other diets with similar % sulfur did not. A summary of byproduct research (Vanness et al., 2009 Nebraska Beef Cattle Report, pp. 79-80) conducted at the University of Nebraska–Lincoln concluded cattle can tolerate up to 0.46% sulfur with minimal risk of polio (0.1% polio). Vanness et al. (2009 Nebraska Beef Cattle Report, pp. 81-83) observed a negative correlation between ruminal
and feed refusal weighed, if present, before the 0800 feeding. Wireless pH probes were inserted before the 0800 feeding on the first collection day. The probes were used to collect continu-ous ruminal pH measurements every minute. Ruminal pH data were re-corded onto a data logger, which was downloaded before the start of the 0700 period.
Gas samples were collected twice daily (8 and 12 hours post feeding) on the last three days of each period. Rumen gas collection was achieved by inserting a 21-inch artificial insemi-nation pipette straw into a specially equipped cannula plug. Twenty mL of rumen gas was extracted from the rumen by use of a 35-mL syringe. Five mL of gas was injected into a 30-mL glass serum bottle with a rubber stop-per. The rumen gas samples were later analyzed for H
2S. This process was
replicated six times per animal.Data were analyzed as a 5x5 Latin
square using the Glimmix procedure of SAS (SAS Institute, Cary, N.C.). Animal was treated as a random effect with treatment being a fixed effect.
Results
Dry matter intake was significantly impacted by dietary treatments (P = 0.05; Table 2). Steers fed Diet 2 (28.5% WDGS, 37.5% Sweet Bran, 7.5% alfalfa ) consumed more feed (24.8 lb) compared to cattle fed Diet 3 (22.5 lb; 44% WDGS, 44% Sweet
pH and ruminal H2S concentration
and concluded that dietary roughage level is important in order to mini-mize the risk of polio. The objective of our study was to determine impact of source and level of sulfur on ruminal pH, continuous DMI, and H
2S in beef
cattle finishing diets.
Procedure
Five ruminally cannulated crossbred yearling steers (initial BW=739±40 lb) were used in a 5x5 Latin square designed experiment. The five diets consisted of 1) 28.5% wet distillers grains plus solubles (WDGS), 37.5% Sweet Bran (Cargill; Blair, Neb.), 25% dry-rolled corn (DRC), and 4% corn bran; 2) 28.5% WDGS, 37.5% Sweet Bran, 17.5% DRC, 7.5% alfalfa, and 4% corn bran; 3) 44% WDGS, 44% Sweet Bran, and 7.5% alfalfa; 4) 50% WDGS, 37.5% DRC, and 7.5% alfalfa; and 5) 87.5% Sweet Bran and 7.5% alfalfa (DM basis; Table 1). All diets included 5% supplement which provided 30 g/ton Rumensin (Elanco Animal Health; Greenfield, Ind.), 90 mg/steer daily Tylan (Elanco Animal Health), and 130 mg/steer daily thiamine. Steers were fed for ad libitum intake once daily at 0800. Periods were 14 days long with an 11 day adaptation to the diet and a 3 day collection period.
Steers were housed in individual pens with bunks suspended from load cells. Feed amounts were determined
Table 1. Diet compositions and dietary sulfur level of experimental diets (DM basis).
Item Diet 1 Diet 2 Diet 3 Diet 4 Diet 5
WDGS 28.5 28.5 44.0 50.0 0 Sweet Bran® 37.5 37.5 44.0 0 87.5DRC 25.0 17.5 0 37.5 0Alfalfa 0 7.5 7.5 7.5 7.5Corn Bran 4.0 4.0 0 0 0Supplement1 5.0 5.0 5.0 5.0 5.0Nutrient compositionSulfur, % DM 0.45 0.46 0.58 0.45 0.46
1Supplement formulated to provide 30 g/ton Rumensin, 90 mg/head/day Tylan, and 130 mg/head/day thiamine.
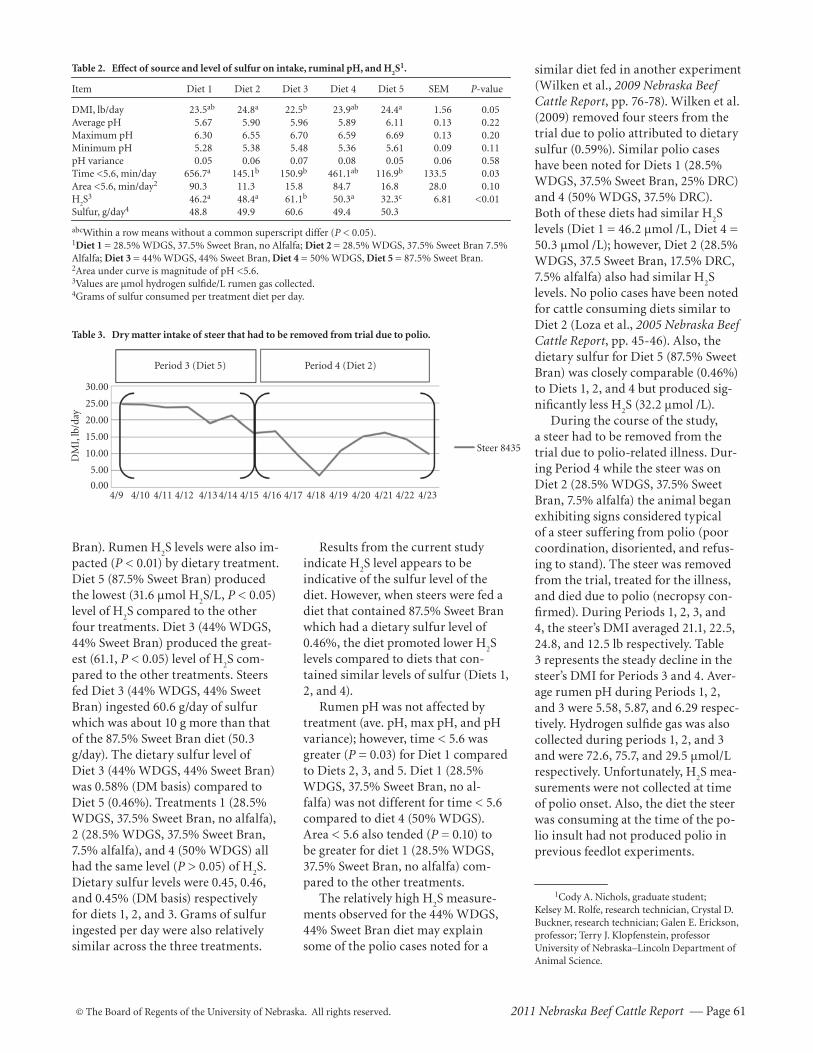
© The Board of Regents of the University of Nebraska. All rights reserved. 2011 Nebraska Beef Cattle Report — Page 61
Bran). Rumen H2S levels were also im-
pacted (P < 0.01) by dietary treatment. Diet 5 (87.5% Sweet Bran) produced the lowest (31.6 μmol H
2S/L, P < 0.05)
level of H2S compared to the other
four treatments. Diet 3 (44% WDGS, 44% Sweet Bran) produced the great-est (61.1, P < 0.05) level of H
2S com-
pared to the other treatments. Steers fed Diet 3 (44% WDGS, 44% Sweet Bran) ingested 60.6 g/day of sulfur which was about 10 g more than that of the 87.5% Sweet Bran diet (50.3 g/day). The dietary sulfur level of Diet 3 (44% WDGS, 44% Sweet Bran) was 0.58% (DM basis) compared to Diet 5 (0.46%). Treatments 1 (28.5% WDGS, 37.5% Sweet Bran, no alfalfa), 2 (28.5% WDGS, 37.5% Sweet Bran, 7.5% alfalfa), and 4 (50% WDGS) all had the same level (P > 0.05) of H
2S.
Dietary sulfur levels were 0.45, 0.46, and 0.45% (DM basis ) respectively for diets 1, 2, and 3. Grams of sulfur ingested per day were also relatively similar across the three treatments.
Results from the current study indicate H
2S level appears to be
indica tive of the sulfur level of the diet. However, when steers were fed a diet that contained 87.5% Sweet Bran which had a dietary sulfur level of 0.46%, the diet promoted lower H
2S
levels compared to diets that con-tained similar levels of sulfur (Diets 1, 2, and 4).
Rumen pH was not affected by treatment (ave. pH, max pH, and pH variance); however, time < 5.6 was greater (P = 0.03) for Diet 1 compared to Diets 2, 3, and 5. Diet 1 (28.5% WDGS, 37.5% Sweet Bran, no al-falfa) was not different for time < 5.6 compared to diet 4 (50% WDGS). Area < 5.6 also tended (P = 0.10) to be greater for diet 1 (28.5% WDGS, 37.5% Sweet Bran, no alfalfa) com-pared to the other treatments.
The relatively high H2S measure-
ments observed for the 44% WDGS, 44% Sweet Bran diet may explain some of the polio cases noted for a
similar diet fed in another experiment (Wilken et al., 2009 Nebraska Beef Cattle Report, pp. 76-78). Wilken et al. (2009) removed four steers from the trial due to polio attributed to dietary sulfur (0.59%). Similar polio cases have been noted for Diets 1 (28.5% WDGS, 37.5% Sweet Bran, 25% DRC) and 4 (50% WDGS, 37.5% DRC). Both of these diets had similar H
2S
levels (Diet 1 = 46.2 μmol /L, Diet 4 = 50.3 μmol /L); however, Diet 2 (28.5% WDGS, 37.5 Sweet Bran, 17.5% DRC, 7.5% alfalfa) also had similar H
2S
levels. No polio cases have been noted for cattle consuming diets similar to Diet 2 (Loza et al., 2005 Nebraska Beef Cattle Report, pp. 45-46). Also, the dietary sulfur for Diet 5 (87.5% Sweet Bran) was closely comparable (0.46%) to Diets 1, 2, and 4 but produced sig-nificantly less H
2S (32.2 μmol /L).
During the course of the study, a steer had to be removed from the trial due to polio-related illness. Dur-ing Period 4 while the steer was on Diet 2 (28.5% WDGS, 37.5% Sweet Bran, 7.5% alfalfa) the animal began exhibiting signs considered typical of a steer suffering from polio (poor coordination, disoriented, and refus-ing to stand). The steer was removed from the trial, treated for the illness, and died due to polio (necropsy con-firmed). During Periods 1, 2, 3, and 4, the steer’s DMI averaged 21.1, 22.5, 24.8, and 12.5 lb respectively. Table 3 represents the steady decline in the steer’s DMI for Periods 3 and 4. Aver-age rumen pH during Periods 1, 2, and 3 were 5.58, 5.87, and 6.29 respec-tively. Hydrogen sulfide gas was also collected during periods 1, 2, and 3 and were 72.6, 75.7, and 29.5 μmol/L respectively. Unfortunately, H
2S mea-
surements were not collected at time of polio onset. Also, the diet the steer was consuming at the time of the po-lio insult had not produced polio in previous feedlot experiments.
1Cody A. Nichols, graduate student; Kelsey M. Rolfe, research technician, Crystal D. Buckner, research technician; Galen E. Erickson, professor; Terry J. Klopfenstein, professor University of Nebraska–Lincoln Department of Animal Science.
Table 2. Effect of source and level of sulfur on intake, ruminal pH, and H2S1.
Item Diet 1 Diet 2 Diet 3 Diet 4 Diet 5 SEM P-value
DMI, lb/day 23.5ab 24.8a 22.5b 23.9ab 24.4a 1.56 0.05Average pH 5.67 5.90 5.96 5.89 6.11 0.13 0.22Maximum pH 6.30 6.55 6.70 6.59 6.69 0.13 0.20Minimum pH 5.28 5.38 5.48 5.36 5.61 0.09 0.11pH variance 0.05 0.06 0.07 0.08 0.05 0.06 0.58Time <5.6, min/day 656.7a 145.1b 150.9b 461.1ab 116.9b 133.5 0.03Area <5.6, min/day2 90.3 11.3 15.8 84.7 16.8 28.0 0.10H
2S3 46.2a 48.4a 61.1b 50.3a 32.3c 6.81 <0.01
Sulfur, g/day4 48.8 49.9 60.6 49.4 50.3
abcWithin a row means without a common superscript differ (P < 0.05).1Diet 1 = 28.5% WDGS, 37.5% Sweet Bran, no Alfalfa; Diet 2 = 28.5% WDGS, 37.5% Sweet Bran 7.5% Alfalfa; Diet 3 = 44% WDGS, 44% Sweet Bran, Diet 4 = 50% WDGS, Diet 5 = 87.5% Sweet Bran.2Area under curve is magnitude of pH <5.6.3Values are μmol hydrogen sulfide/L rumen gas collected. 4Grams of sulfur consumed per treatment diet per day.
Table 3. Dry matter intake of steer that had to be removed from trial due to polio.
Period 3 (Diet 5) Period 4 (Diet 2)
30.00
25.00
20.00
15.00
10.00
5.00
0.00
DM
I, lb
/day
Steer 8435
4/9 4/10 4/11 4/12 4/13 4/14 4/15 4/16 4/17 4/18 4/19 4/20 4/21 4/22 4/23
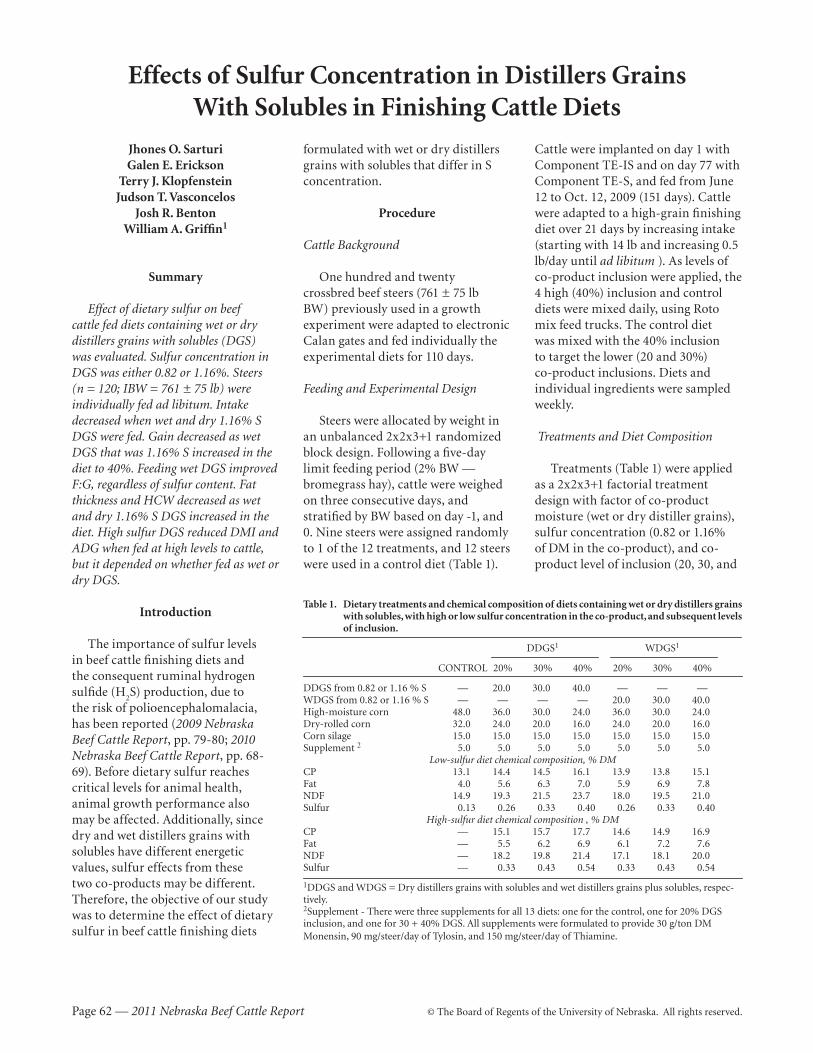
Page 62 — 2011 Nebraska Beef Cattle Report © The Board of Regents of the University of Nebraska. All rights reserved.
Effects of Sulfur Concentration in Distillers GrainsWith Solubles in Finishing Cattle Diets
Jhones O. SarturiGalen E. Erickson
Terry J. KlopfensteinJudson T. Vasconcelos
Josh R. BentonWilliam A. Griffin1
Summary
Effect of dietary sulfur on beef cattle fed diets containing wet or dry distillers grains with solubles (DGS) was evaluated. Sulfur concentration in DGS was either 0.82 or 1.16%. Steers (n = 120; IBW = 761 ± 75 lb) were individually fed ad libitum. Intake decreased when wet and dry 1.16% S DGS were fed. Gain decreased as wet DGS that was 1.16% S increased in the diet to 40%. Feeding wet DGS improved F:G, regardless of sulfur content. Fat thickness and HCW decreased as wet and dry 1.16% S DGS increased in the diet. High sulfur DGS reduced DMI and ADG when fed at high levels to cattle, but it depended on whether fed as wet or dry DGS.
Introduction
The importance of sulfur levels in beef cattle finishing diets and the consequent ruminal hydrogen sulfide (H
2S) production, due to
the risk of polioencephalomalacia, has been reported (2009 Nebraska Beef Cattle Report, pp. 79-80; 2010 Nebraska Beef Cattle Report, pp. 68-69). Before dietary sulfur reaches critical levels for animal health, animal growth performance also may be affected. Additionally, since dry and wet distillers grains with solubles have different energetic values, sulfur effects from these two co-products may be different. Therefore, the objective of our study was to determine the effect of dietary sulfur in beef cattle finishing diets
formulated with wet or dry distillers grains with solubles that differ in S concentration.
Procedure
Cattle Background
One hundred and twenty crossbred beef steers (761 ± 75 lb BW) previously used in a growth experiment were adapted to electronic Calan gates and fed individually the experimental diets for 110 days.
Feeding and Experimental Design
Steers were allocated by weight in an unbalanced 2x2x3+1 randomized block design. Following a five-day limit feeding period (2% BW — brome grass hay), cattle were weighed on three consecutive days, and stratified by BW based on day -1, and 0. Nine steers were assigned randomly to 1 of the 12 treatments, and 12 steers were used in a control diet (Table 1).
Cattle were implanted on day 1 with Component TE-IS and on day 77 with Component TE-S, and fed from June 12 to Oct. 12, 2009 (151 days). Cattle were adapted to a high-grain finishing diet over 21 days by increasing intake (starting with 14 lb and increasing 0.5 lb/day until ad libitum ). As levels of co-product inclusion were applied, the 4 high (40%) inclusion and control diets were mixed daily, using Roto mix feed trucks. The control diet was mixed with the 40% inclusion to target the lower (20 and 30%) co-product inclusions. Diets and individual ingredients were sampled weekly.
Treatments and Diet Composition
Treatments (Table 1) were applied as a 2x2x3+1 factorial treatment design with factor of co-product moisture (wet or dry distiller grains), sulfur concentration (0.82 or 1.16% of DM in the co-product), and co-product level of inclusion (20, 30, and
Table 1. Dietary treatments and chemical composition of diets containing wet or dry distillers grains with solubles, with high or low sulfur concentration in the co-product, and subsequent levels of inclusion.
DDGS1 WDGS1
CONTROL 20% 30% 40% 20% 30% 40%
DDGS from 0.82 or 1.16 % S — 20.0 30.0 40.0 — — —WDGS from 0.82 or 1.16 % S — — — — 20.0 30.0 40.0High-moisture corn 48.0 36.0 30.0 24.0 36.0 30.0 24.0Dry-rolled corn 32.0 24.0 20.0 16.0 24.0 20.0 16.0Corn silage 15.0 15.0 15.0 15.0 15.0 15.0 15.0Supplement 2 5.0 5.0 5.0 5.0 5.0 5.0 5.0
Low-sulfur diet chemical composition, % DMCP 13.1 14.4 14.5 16.1 13.9 13.8 15.1Fat 4.0 5.6 6.3 7.0 5.9 6.9 7.8NDF 14.9 19.3 21.5 23.7 18.0 19.5 21.0Sulfur 0.13 0.26 0.33 0.40 0.26 0.33 0.40
High-sulfur diet chemical composition , % DMCP — 15.1 15.7 17.7 14.6 14.9 16.9Fat — 5.5 6.2 6.9 6.1 7.2 7.6NDF — 18.2 19.8 21.4 17.1 18.1 20.0Sulfur — 0.33 0.43 0.54 0.33 0.43 0.54
1DDGS and WDGS = Dry distillers grains with solubles and wet distillers grains plus solubles, respec-tively.2Supplement - There were three supplements for all 13 diets: one for the control, one for 20% DGS inclusion, and one for 30 + 40% DGS. All supplements were formulated to provide 30 g/ton DM Monensin , 90 mg/steer/day of Tylosin, and 150 mg/steer/day of Thiamine.
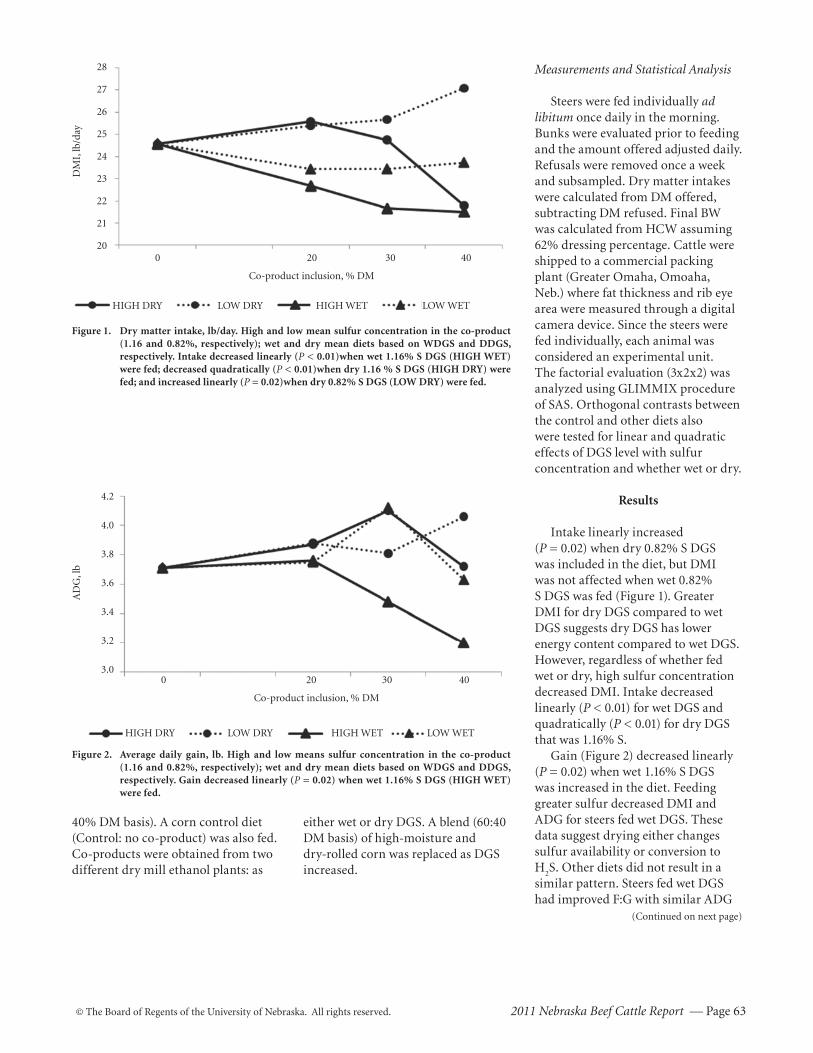
© The Board of Regents of the University of Nebraska. All rights reserved. 2011 Nebraska Beef Cattle Report — Page 63
Measurements and Statistical Analysis
Steers were fed individually ad libitum once daily in the morning. Bunks were evaluated prior to feeding and the amount offered adjusted daily. Refusals were removed once a week and subsampled. Dry matter intakes were calculated from DM offered, subtracting DM refused. Final BW was calculated from HCW assuming 62% dressing percentage. Cattle were shipped to a commercial packing plant (Greater Omaha, Omoaha, Neb.) where fat thickness and rib eye area were measured through a digital camera device. Since the steers were fed individually, each animal was considered an experimental unit. The factorial evaluation (3x2x2) was analyzed using GLIMMIX procedure of SAS. Orthogonal contrasts between the control and other diets also were tested for linear and quadratic effects of DGS level with sulfur concentration and whether wet or dry.
Results
Intake linearly increased (P = 0.02) when dry 0.82% S DGS was included in the diet, but DMI was not affected when wet 0.82% S DGS was fed (Figure 1). Greater DMI for dry DGS compared to wet DGS suggests dry DGS has lower energy content compared to wet DGS. However, regardless of whether fed wet or dry, high sulfur concentration decreased DMI. Intake decreased linearly (P < 0.01) for wet DGS and quadratically (P < 0.01) for dry DGS that was 1.16% S.
Gain (Figure 2) decreased linearly (P = 0.02) when wet 1.16% S DGS was increased in the diet. Feeding greater sulfur decreased DMI and ADG for steers fed wet DGS. These data suggest drying either changes sulfur availability or conversion to H
2S. Other diets did not result in a
similar pattern. Steers fed wet DGS had improved F:G with similar ADG
Figure 1. Dry matter intake, lb/day. High and low mean sulfur concentration in the co-product (1.16 and 0.82%, respectively); wet and dry mean diets based on WDGS and DDGS, respectively . Intake decreased linearly (P < 0.01)when wet 1.16% S DGS (HIGH WET) were fed; decreased quadratically (P < 0.01)when dry 1.16 % S DGS (HIGH DRY) were fed; and increased linearly (P = 0.02)when dry 0.82% S DGS (LOW DRY) were fed.
28
27
26
25
24
23
22
21
20
DM
I, lb
/day
0 20 30 40
Co-product inclusion, % DM
HIGH DRY LOW DRY HIGH WET LOW WET
Figure 2. Average daily gain, lb. High and low means sulfur concentration in the co-product (1.16 and 0.82%, respectively); wet and dry mean diets based on WDGS and DDGS, respectively. Gain decreased linearly (P = 0.02) when wet 1.16% S DGS (HIGH WET) were fed.
4.2
4.0
3.8
3.6
3.4
3.2
3.0
AD
G, l
b
0 20 30 40
Co-product inclusion, % DM
HIGH DRY LOW DRY HIGH WET LOW WET
(Continued on next page)
40% DM basis). A corn control diet (Control: no co-product) was also fed. Co-products were obtained from two different dry mill ethanol plants: as
either wet or dry DGS. A blend (60:40 DM basis) of high-moisture and dry-rolled corn was replaced as DGS increased.
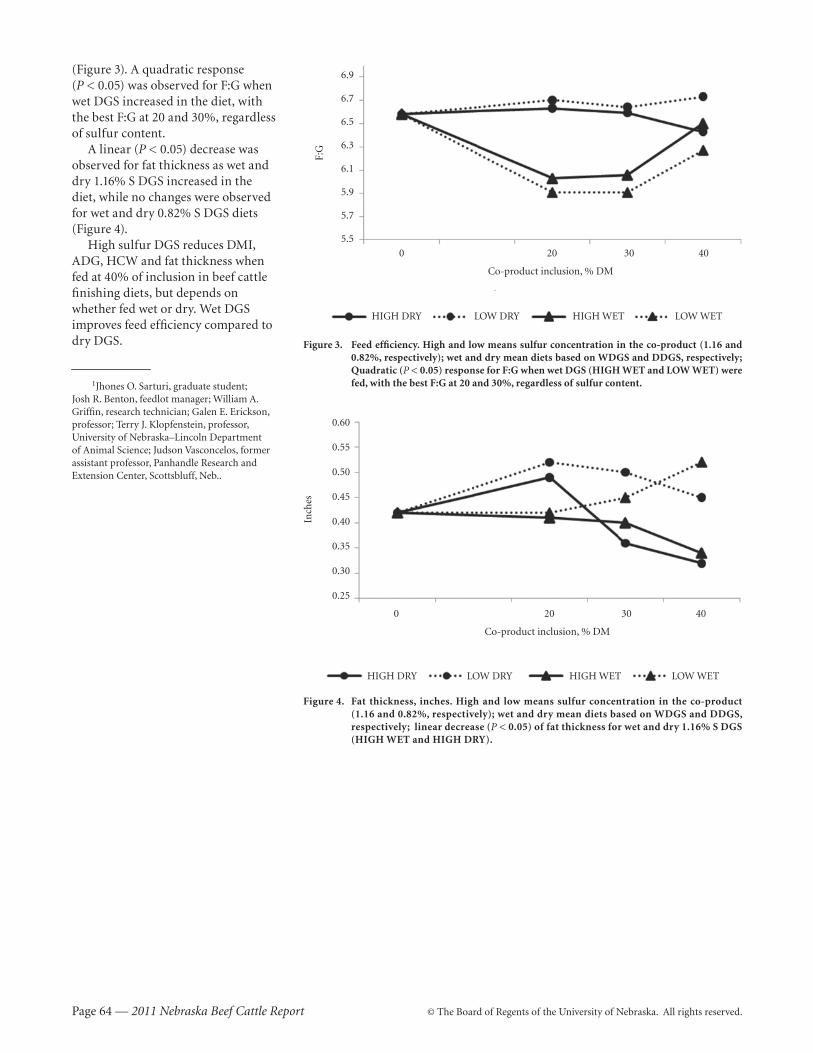
Page 64 — 2011 Nebraska Beef Cattle Report © The Board of Regents of the University of Nebraska. All rights reserved.
(Figure 3). A quadratic response (P < 0.05) was observed for F:G when wet DGS increased in the diet, with the best F:G at 20 and 30%, regardless of sulfur content.
A linear (P < 0.05) decrease was observed for fat thickness as wet and dry 1.16% S DGS increased in the diet, while no changes were observed for wet and dry 0.82% S DGS diets (Figure 4).
High sulfur DGS reduces DMI, ADG, HCW and fat thickness when fed at 40% of inclusion in beef cattle finishing diets, but depends on whether fed wet or dry. Wet DGS improves feed efficiency compared to dry DGS.
1Jhones O. Sarturi, graduate student; Josh R. Benton, feedlot manager; William A. Griffin, research technician; Galen E. Erickson, professor; Terry J. Klopfenstein, professor, University of Nebraska–Lincoln Department of Animal Science; Judson Vasconcelos, former assistant professor, Panhandle Research and Extension Center, Scottsbluff, Neb..
Figure 3. Feed efficiency. High and low means sulfur concentration in the co-product (1.16 and 0.82%, respectively); wet and dry mean diets based on WDGS and DDGS, respectively; Quadratic (P < 0.05) response for F:G when wet DGS (HIGH WET and LOW WET) were fed, with the best F:G at 20 and 30%, regardless of sulfur content.
6.9
6.7
6.5
6.3
6.1
5.9
5.7
5.5
F:G
0 20 30 40
Co-product inclusion, % DM
HIGH DRY LOW DRY HIGH WET LOW WET
Figure 4. Fat thickness, inches. High and low means sulfur concentration in the co-product (1.16 and 0.82%, respectively); wet and dry mean diets based on WDGS and DDGS, respectively; linear decrease (P < 0.05) of fat thickness for wet and dry 1.16% S DGS (HIGH WET and HIGH DRY).
0.60
0.55
0.50
0.45
0.40
0.35
0.30
0.25
Inch
es
0 20 30 40
Co-product inclusion, % DM
HIGH DRY LOW DRY HIGH WET LOW WET
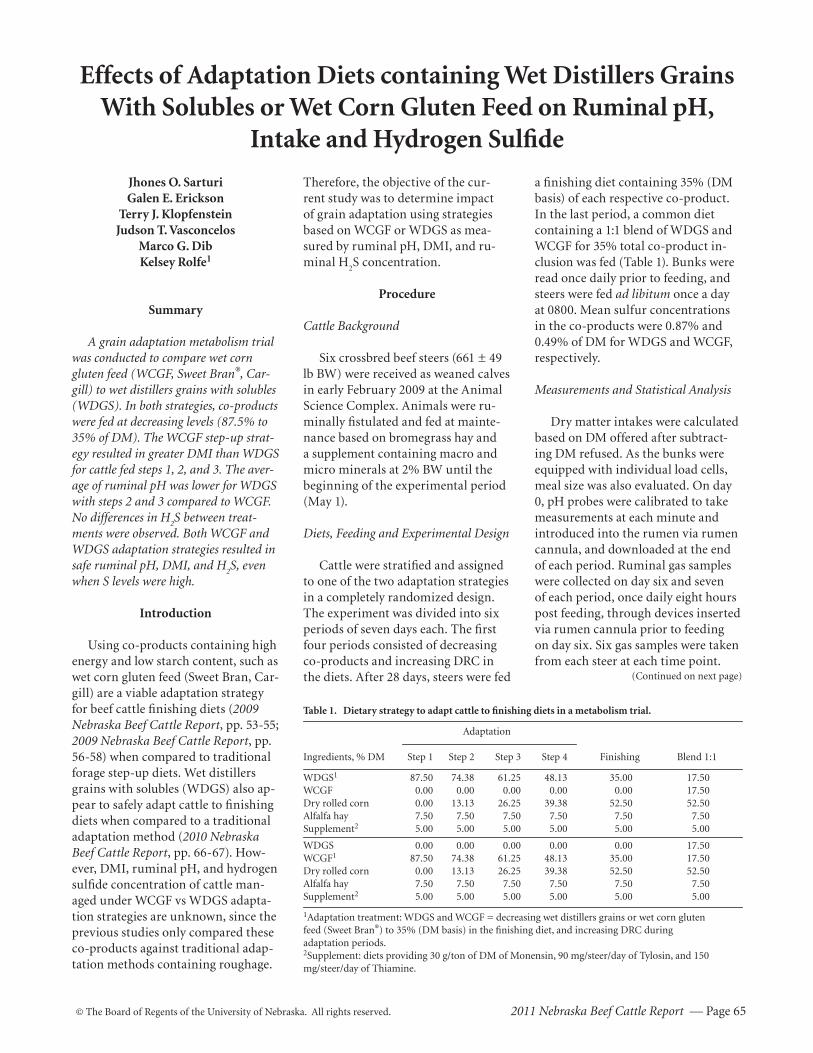
© The Board of Regents of the University of Nebraska. All rights reserved. 2011 Nebraska Beef Cattle Report — Page 65
(Continued on next page)
Effects of Adaptation Diets containing Wet Distillers Grains With Solubles or Wet Corn Gluten Feed on Ruminal pH,
Intake and Hydrogen Sulfide
Jhones O. SarturiGalen E. Erickson
Terry J. KlopfensteinJudson T. Vasconcelos
Marco G. DibKelsey Rolfe1
Summary
A grain adaptation metabolism trial was conducted to compare wet corn gluten feed (WCGF, Sweet Bran®, Car-gill) to wet distillers grains with solubles (WDGS). In both strategies, co-products were fed at decreasing levels (87.5% to 35% of DM). The WCGF step-up strat-egy resulted in greater DMI than WDGS for cattle fed steps 1, 2, and 3. The aver-age of ruminal pH was lower for WDGS with steps 2 and 3 compared to WCGF. No differences in H
2S between treat-
ments were observed. Both WCGF and WDGS adaptation strategies resulted in safe ruminal pH, DMI, and H
2S, even
when S levels were high.
Introduction
Using co-products containing high energy and low starch content, such as wet corn gluten feed (Sweet Bran, Car-gill) are a viable adaptation strategy for beef cattle finishing diets (2009 Nebraska Beef Cattle Report, pp. 53-55; 2009 Nebraska Beef Cattle Report, pp. 56-58) when compared to traditional forage step-up diets. Wet distillers grains with solubles (WDGS) also ap-pear to safely adapt cattle to finishing diets when compared to a traditional adaptation method (2010 Nebraska Beef Cattle Report, pp. 66-67). How-ever, DMI, ruminal pH, and hydrogen sulfide concentration of cattle man-aged under WCGF vs WDGS adapta-tion strategies are unknown, since the previous studies only compared these co-products against traditional adap-tation methods containing roughage.
Therefore, the objective of the cur-rent study was to determine impact of grain adaptation using strategies based on WCGF or WDGS as mea-sured by ruminal pH, DMI, and ru-minal H
2S concentration.
Procedure
Cattle Background
Six crossbred beef steers (661 ± 49 lb BW) were received as weaned calves in early February 2009 at the Animal Science Complex. Animals were ru-minally fistulated and fed at mainte-nance based on bromegrass hay and a supplement containing macro and micro minerals at 2% BW until the beginning of the experimental period (May 1).
Diets, Feeding and Experimental Design
Cattle were stratified and assigned to one of the two adaptation strategies in a completely randomized design. The experiment was divided into six periods of seven days each. The first four periods consisted of decreasing co-products and increasing DRC in the diets. After 28 days, steers were fed
a finishing diet containing 35% (DM basis) of each respective co-product. In the last period, a common diet containing a 1:1 blend of WDGS and WCGF for 35% total co-product in-clusion was fed (Table 1). Bunks were read once daily prior to feeding, and steers were fed ad libitum once a day at 0800. Mean sulfur concentrations in the co-products were 0.87% and 0.49% of DM for WDGS and WCGF, respectively.
Measurements and Statistical Analysis
Dry matter intakes were calculated based on DM offered after subtract-ing DM refused. As the bunks were equipped with individual load cells, meal size was also evaluated. On day 0, pH probes were calibrated to take measurements at each minute and introduced into the rumen via rumen cannula, and downloaded at the end of each period. Ruminal gas samples were collected on day six and seven of each period, once daily eight hours post feeding, through devices inserted via rumen cannula prior to feeding on day six. Six gas samples were taken from each steer at each time point.
Table 1. Dietary strategy to adapt cattle to finishing diets in a metabolism trial.
Adaptation Ingredients, % DM Step 1 Step 2 Step 3 Step 4 Finishing Blend 1:1
WDGS1 87.50 74.38 61.25 48.13 35.00 17.50WCGF 0.00 0.00 0.00 0.00 0.00 17.50Dry rolled corn 0.00 13.13 26.25 39.38 52.50 52.50Alfalfa hay 7.50 7.50 7.50 7.50 7.50 7.50Supplement2 5.00 5.00 5.00 5.00 5.00 5.00
WDGS 0.00 0.00 0.00 0.00 0.00 17.50WCGF1 87.50 74.38 61.25 48.13 35.00 17.50Dry rolled corn 0.00 13.13 26.25 39.38 52.50 52.50Alfalfa hay 7.50 7.50 7.50 7.50 7.50 7.50Supplement2 5.00 5.00 5.00 5.00 5.00 5.00
1Adaptation treatment: WDGS and WCGF = decreasing wet distillers grains or wet corn gluten feed (Sweet Bran®) to 35% (DM basis) in the finishing diet, and increasing DRC duringadaptation periods.2Supplement: diets providing 30 g/ton of DM of Monensin, 90 mg/steer/day of Tylosin, and 150mg/steer/day of Thiamine.
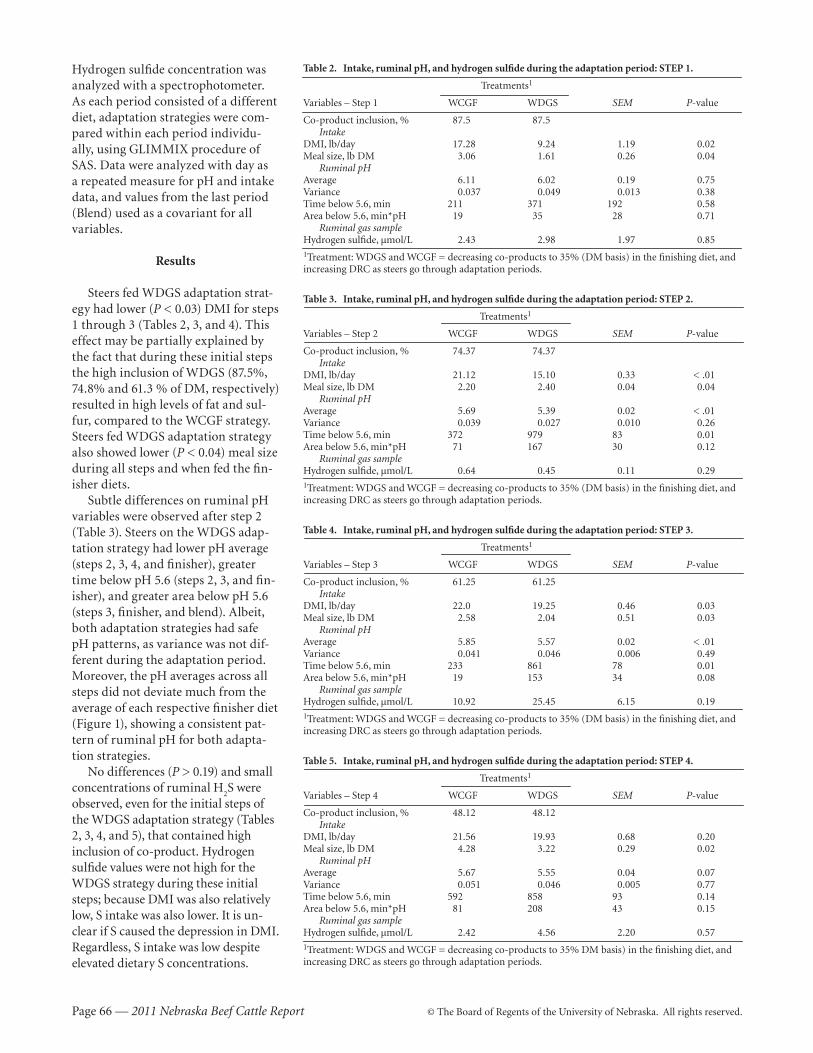
Page 66 — 2011 Nebraska Beef Cattle Report © The Board of Regents of the University of Nebraska. All rights reserved.
Hydrogen sulfide concentration was analyzed with a spectrophotometer. As each period consisted of a different diet, adaptation strategies were com-pared within each period individu-ally, using GLIMMIX procedure of SAS. Data were analyzed with day as a repeated measure for pH and intake data, and values from the last period (Blend) used as a covariant for all variables.
Results
Steers fed WDGS adaptation strat-egy had lower (P < 0.03) DMI for steps 1 through 3 (Tables 2, 3, and 4). This effect may be partially explained by the fact that during these initial steps the high inclusion of WDGS (87.5%, 74.8% and 61.3 % of DM, respectively) resulted in high levels of fat and sul-fur, compared to the WCGF strategy. Steers fed WDGS adaptation strategy also showed lower (P < 0.04) meal size during all steps and when fed the fin-isher diets.
Subtle differences on ruminal pH variables were observed after step 2 (Table 3). Steers on the WDGS adap-tation strategy had lower pH average (steps 2, 3, 4, and finisher), greater time below pH 5.6 (steps 2, 3, and fin-isher), and greater area below pH 5.6 (steps 3, finisher, and blend). Albeit, both adaptation strategies had safe pH patterns, as variance was not dif-ferent during the adaptation period. Moreover, the pH averages across all steps did not deviate much from the average of each respective finisher diet (Figure 1), showing a consistent pat-tern of ruminal pH for both adapta-tion strategies.
No differences (P > 0.19) and small concentrations of ruminal H
2S were
observed, even for the initial steps of the WDGS adaptation strategy (Tables 2, 3, 4, and 5), that contained high inclusion of co-product. Hydrogen sulfide values were not high for the WDGS strategy during these initial steps; because DMI was also relatively low, S intake was also lower. It is un-clear if S caused the depression in DMI. Regardless, S intake was low despite elevated dietary S concentrations.
Table 2. Intake, ruminal pH, and hydrogen sulfide during the adaptation period: STEP 1.
Treatments1
Variables – Step 1 WCGF WDGS SEM P-value
Co-product inclusion, % 87.5 87.5 IntakeDMI, lb/day 17.28 9.24 1.19 0.02Meal size, lb DM 3.06 1.61 0.26 0.04 Ruminal pHAverage 6.11 6.02 0.19 0.75Variance 0.037 0.049 0.013 0.38Time below 5.6, min 211 371 192 0.58Area below 5.6, min*pH 19 35 28 0.71 Ruminal gas sampleHydrogen sulfide, μmol/L 2.43 2.98 1.97 0.851Treatment: WDGS and WCGF = decreasing co-products to 35% (DM basis) in the finishing diet, and increasing DRC as steers go through adaptation periods.
Table 3. Intake, ruminal pH, and hydrogen sulfide during the adaptation period: STEP 2.
Treatments1
Variables – Step 2 WCGF WDGS SEM P-value
Co-product inclusion, % 74.37 74.37 IntakeDMI, lb/day 21.12 15.10 0.33 < .01Meal size, lb DM 2.20 2.40 0.04 0.04 Ruminal pHAverage 5.69 5.39 0.02 < .01Variance 0.039 0.027 0.010 0.26Time below 5.6, min 372 979 83 0.01Area below 5.6, min*pH 71 167 30 0.12 Ruminal gas sampleHydrogen sulfide, μmol/L 0.64 0.45 0.11 0.291Treatment: WDGS and WCGF = decreasing co-products to 35% (DM basis) in the finishing diet, and increasing DRC as steers go through adaptation periods.
Table 4. Intake, ruminal pH, and hydrogen sulfide during the adaptation period: STEP 3.
Treatments1
Variables – Step 3 WCGF WDGS SEM P-value
Co-product inclusion, % 61.25 61.25 IntakeDMI, lb/day 22.0 19.25 0.46 0.03Meal size, lb DM 2.58 2.04 0.51 0.03 Ruminal pHAverage 5.85 5.57 0.02 < .01Variance 0.041 0.046 0.006 0.49Time below 5.6, min 233 861 78 0.01Area below 5.6, min*pH 19 153 34 0.08 Ruminal gas sampleHydrogen sulfide, μmol/L 10.92 25.45 6.15 0.191Treatment: WDGS and WCGF = decreasing co-products to 35% (DM basis) in the finishing diet, and increasing DRC as steers go through adaptation periods.
Table 5. Intake, ruminal pH, and hydrogen sulfide during the adaptation period: STEP 4.
Treatments1
Variables – Step 4 WCGF WDGS SEM P-value
Co-product inclusion, % 48.12 48.12 IntakeDMI, lb/day 21.56 19.93 0.68 0.20Meal size, lb DM 4.28 3.22 0.29 0.02 Ruminal pHAverage 5.67 5.55 0.04 0.07Variance 0.051 0.046 0.005 0.77Time below 5.6, min 592 858 93 0.14Area below 5.6, min*pH 81 208 43 0.15 Ruminal gas sampleHydrogen sulfide, μmol/L 2.42 4.56 2.20 0.571Treatment: WDGS and WCGF = decreasing co-products to 35% DM basis) in the finishing diet, and increasing DRC as steers go through adaptation periods.
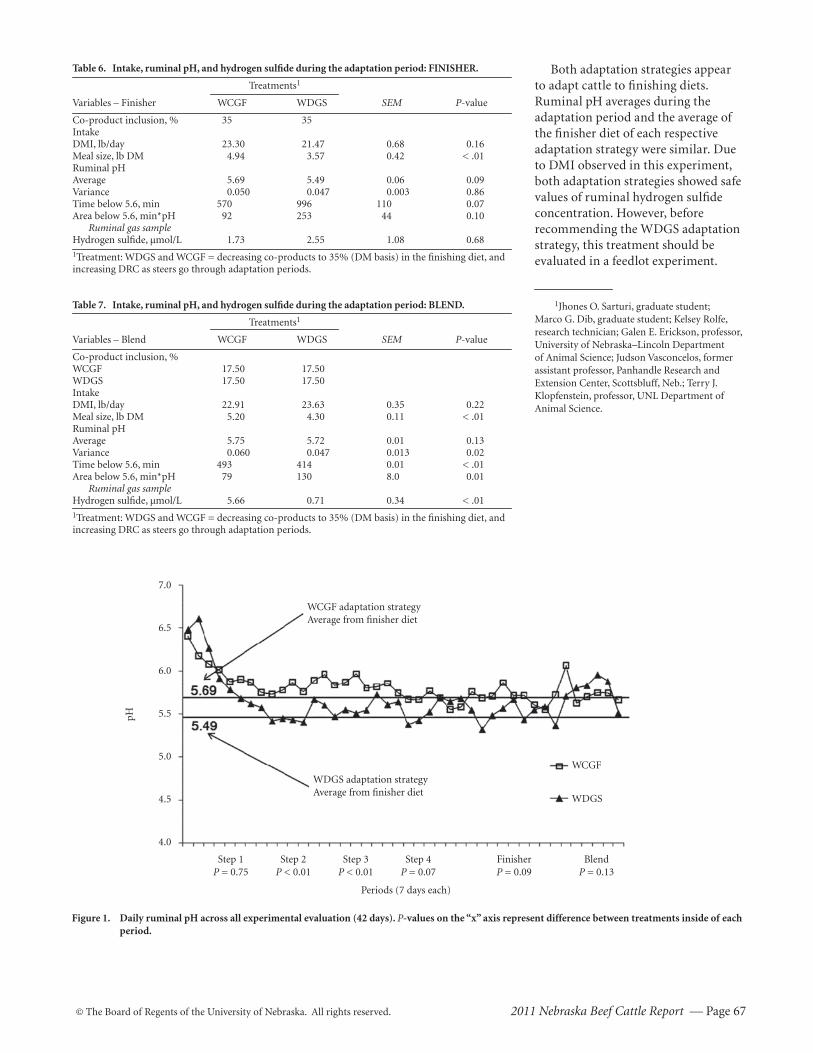
© The Board of Regents of the University of Nebraska. All rights reserved. 2011 Nebraska Beef Cattle Report — Page 67
Both adaptation strategies appear to adapt cattle to finishing diets. Ruminal pH averages during the adaptation period and the average of the finisher diet of each respective adaptation strategy were similar. Due to DMI observed in this experiment, both adaptation strategies showed safe values of ruminal hydrogen sulfide concentration. However, before recommending the WDGS adaptation strategy, this treatment should be evaluated in a feedlot experiment.
1Jhones O. Sarturi, graduate student; Marco G. Dib, graduate student; Kelsey Rolfe, research technician; Galen E. Erickson, professor, University of Nebraska–Lincoln Department of Animal Science; Judson Vasconcelos, former assistant professor, Panhandle Research and Extension Center, Scottsbluff, Neb.; Terry J. Klopfenstein, professor, UNL Department of Animal Science.
Figure 1. Daily ruminal pH across all experimental evaluation (42 days). P-values on the “x” axis represent difference between treatments inside of each period.
7.0
6.5
6.0
5.5
5.0
4.5
4.0
pH
WCGF adaptation strategyAverage from finisher diet
WDGS adaptation strategyAverage from finisher diet
WCGF
WDGS
Step 1 Step 2 Step 3 Step 4 Finisher Blend P = 0.75 P < 0.01 P < 0.01 P = 0.07 P = 0.09 P = 0.13
Periods (7 days each)
Table 6. Intake, ruminal pH, and hydrogen sulfide during the adaptation period: FINISHER.
Treatments1
Variables – Finisher WCGF WDGS SEM P-value
Co-product inclusion, % 35 35IntakeDMI, lb/day 23.30 21.47 0.68 0.16Meal size, lb DM 4.94 3.57 0.42 < .01Ruminal pHAverage 5.69 5.49 0.06 0.09Variance 0.050 0.047 0.003 0.86Time below 5.6, min 570 996 110 0.07Area below 5.6, min*pH 92 253 44 0.10 Ruminal gas sampleHydrogen sulfide, μmol/L 1.73 2.55 1.08 0.681Treatment: WDGS and WCGF = decreasing co-products to 35% (DM basis) in the finishing diet, and increasing DRC as steers go through adaptation periods.
Table 7. Intake, ruminal pH, and hydrogen sulfide during the adaptation period: BLEND.
Treatments1
Variables – Blend WCGF WDGS SEM P-value
Co-product inclusion, %WCGF 17.50 17.50WDGS 17.50 17.50IntakeDMI, lb/day 22.91 23.63 0.35 0.22Meal size, lb DM 5.20 4.30 0.11 < .01Ruminal pHAverage 5.75 5.72 0.01 0.13Variance 0.060 0.047 0.013 0.02Time below 5.6, min 493 414 0.01 < .01Area below 5.6, min*pH 79 130 8.0 0.01 Ruminal gas sampleHydrogen sulfide, μmol/L 5.66 0.71 0.34 < .011Treatment: WDGS and WCGF = decreasing co-products to 35% (DM basis) in the finishing diet, and increasing DRC as steers go through adaptation periods.
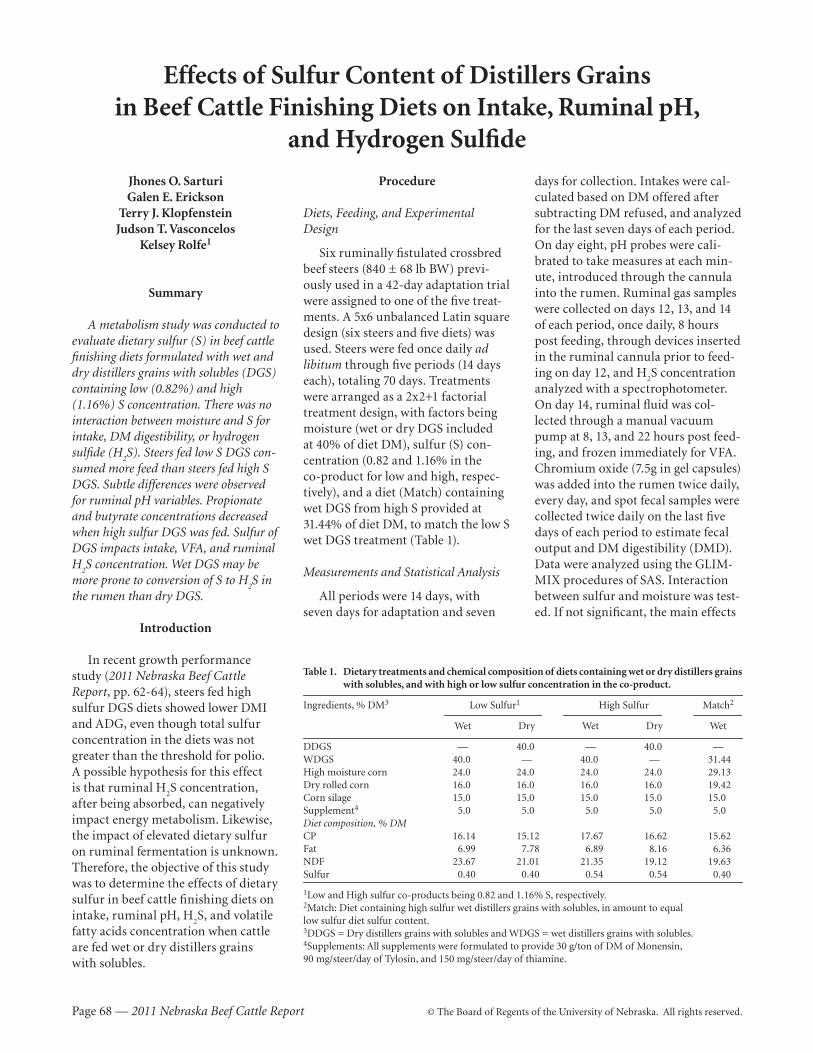
Page 68 — 2011 Nebraska Beef Cattle Report © The Board of Regents of the University of Nebraska. All rights reserved.
Effects of Sulfur Content of Distillers Grains in Beef Cattle Finishing Diets on Intake, Ruminal pH,
and Hydrogen Sulfide
Jhones O. SarturiGalen E. Erickson
Terry J. KlopfensteinJudson T. Vasconcelos
Kelsey Rolfe1
Summary
A metabolism study was conducted to evaluate dietary sulfur (S) in beef cattle finishing diets formulated with wet and dry distillers grains with solubles (DGS) containing low (0.82%) and high (1.16%) S concentration. There was no interaction between moisture and S for intake, DM digestibility, or hydrogen sulfide (H
2S). Steers fed low S DGS con-
sumed more feed than steers fed high S DGS. Subtle differences were observed for ruminal pH variables. Propionate and butyrate concentrations decreased when high sulfur DGS was fed. Sulfur of DGS impacts intake, VFA, and ruminal H
2S concentration. Wet DGS may be
more prone to conversion of S to H2S in
the rumen than dry DGS.
Introduction
In recent growth performance study (2011 Nebraska Beef Cattle Report, pp. 62-64), steers fed high sulfur DGS diets showed lower DMI and ADG, even though total sulfur concentration in the diets was not greater than the threshold for polio. A possible hypothesis for this effect is that ruminal H
2S concentration,
after being absorbed, can negatively impact energy metabolism. Likewise, the impact of elevated dietary sulfur on ruminal fermentation is unknown. Therefore, the objective of this study was to determine the effects of dietary sulfur in beef cattle finishing diets on intake, ruminal pH, H
2S, and volatile
fatty acids concentration when cattle are fed wet or dry distillers grains with solubles.
Procedure
Diets, Feeding, and Experimental Design
Six ruminally fistulated crossbred beef steers (840 ± 68 lb BW) previ-ously used in a 42-day adaptation trial were assigned to one of the five treat-ments. A 5x6 unbalanced Latin square design (six steers and five diets) was used. Steers were fed once daily ad libitum through five periods (14 days each), totaling 70 days. Treatments were arranged as a 2x2+1 factorial treatment design, with factors being moisture (wet or dry DGS included at 40% of diet DM), sulfur (S) con-centration (0.82 and 1.16% in the co-product for low and high, respec-tively), and a diet (Match) containing wet DGS from high S provided at 31.44% of diet DM, to match the low S wet DGS treatment (Table 1).
Measurements and Statistical Analysis
All periods were 14 days, with seven days for adaptation and seven
days for collection. Intakes were cal-culated based on DM offered after subtracting DM refused, and analyzed for the last seven days of each period. On day eight, pH probes were cali-brated to take measures at each min-ute, introduced through the cannula into the rumen. Ruminal gas samples were collected on days 12, 13, and 14 of each period, once daily, 8 hours post feeding, through devices inserted in the ruminal cannula prior to feed-ing on day 12, and H
2S concentration
analyzed with a spectrophotometer. On day 14, ruminal fluid was col-lected through a manual vacuum pump at 8, 13, and 22 hours post feed-ing, and frozen immediately for VFA. Chromium oxide (7.5g in gel capsules) was added into the rumen twice daily, every day, and spot fecal samples were collected twice daily on the last five days of each period to estimate fecal output and DM digestibility (DMD). Data were analyzed using the GLIM-MIX procedures of SAS. Interaction between sulfur and moisture was test-ed. If not significant, the main effects
Table 1. Dietary treatments and chemical composition of diets containing wet or dry distillers grains with solubles, and with high or low sulfur concentration in the co-product.
Ingredients, % DM3 Low Sulfur1 High Sulfur Match2
Wet Dry Wet Dry Wet
DDGS — 40.0 — 40.0 —WDGS 40.0 — 40.0 — 31.44High moisture corn 24.0 24.0 24.0 24.0 29.13Dry rolled corn 16.0 16.0 16.0 16.0 19.42Corn silage 15.0 15.0 15.0 15.0 15.0Supplement4 5.0 5.0 5.0 5.0 5.0Diet composition, % DMCP 16.14 15.12 17.67 16.62 15.62Fat 6.99 7.78 6.89 8.16 6.36NDF 23.67 21.01 21.35 19.12 19.63Sulfur 0.40 0.40 0.54 0.54 0.40
1Low and High sulfur co-products being 0.82 and 1.16% S, respectively.2Match: Diet containing high sulfur wet distillers grains with solubles, in amount to equallow sulfur diet sulfur content.3DDGS = Dry distillers grains with solubles and WDGS = wet distillers grains with solubles.4Supplements: All supplements were formulated to provide 30 g/ton of DM of Monensin,90 mg/steer/day of Tylosin, and 150 mg/steer/day of thiamine.
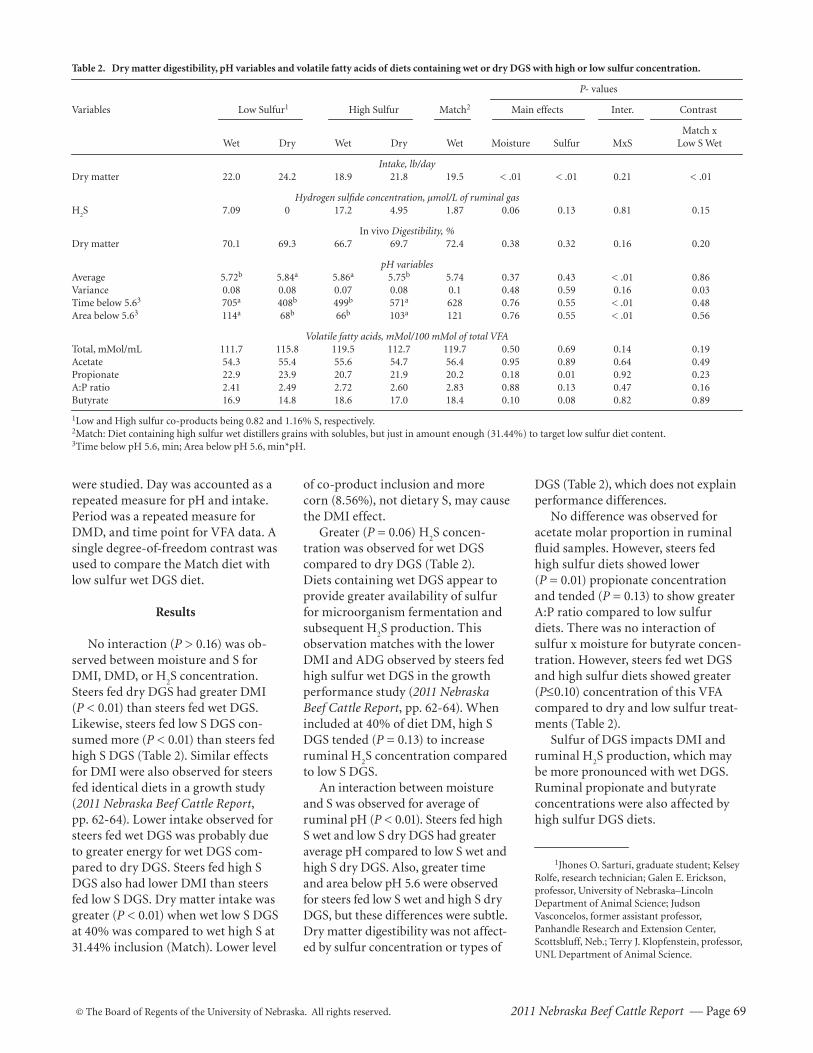
© The Board of Regents of the University of Nebraska. All rights reserved. 2011 Nebraska Beef Cattle Report — Page 69
were studied. Day was accounted as a repeated measure for pH and intake. Period was a repeated measure for DMD, and time point for VFA data. A single degree-of-freedom contrast was used to compare the Match diet with low sulfur wet DGS diet.
Results
No interaction (P > 0.16) was ob-served between moisture and S for DMI, DMD, or H
2S concentration.
Steers fed dry DGS had greater DMI (P < 0.01) than steers fed wet DGS. Likewise, steers fed low S DGS con-sumed more (P < 0.01) than steers fed high S DGS (Table 2). Similar effects for DMI were also observed for steers fed identical diets in a growth study (2011 Nebraska Beef Cattle Report, pp. 62-64). Lower intake observed for steers fed wet DGS was probably due to greater energy for wet DGS com-pared to dry DGS. Steers fed high S DGS also had lower DMI than steers fed low S DGS. Dry matter intake was greater (P < 0.01) when wet low S DGS at 40% was compared to wet high S at 31.44% inclusion (Match). Lower level
Table 2. Dry matter digestibility, pH variables and volatile fatty acids of diets containing wet or dry DGS with high or low sulfur concentration.
P- values
Variables Low Sulfur1 High Sulfur Match2 Main effects Inter. Contrast Match x Wet Dry Wet Dry Wet Moisture Sulfur MxS Low S Wet
Intake, lb/dayDry matter 22.0 24.2 18.9 21.8 19.5 < .01 < .01 0.21 < .01
Hydrogen sulfide concentration, μmol/L of ruminal gasH
2S 7.09 0 17.2 4.95 1.87 0.06 0.13 0.81 0.15
In vivo Digestibility, %Dry matter 70.1 69.3 66.7 69.7 72.4 0.38 0.32 0.16 0.20
pH variablesAverage 5.72b 5.84a 5.86a 5.75b 5.74 0.37 0.43 < .01 0.86Variance 0.08 0.08 0.07 0.08 0.1 0.48 0.59 0.16 0.03Time below 5.63 705a 408b 499b 571a 628 0.76 0.55 < .01 0.48Area below 5.63 114a 68b 66b 103a 121 0.76 0.55 < .01 0.56
Volatile fatty acids, mMol/100 mMol of total VFATotal, mMol/mL 111.7 115.8 119.5 112.7 119.7 0.50 0.69 0.14 0.19Acetate 54.3 55.4 55.6 54.7 56.4 0.95 0.89 0.64 0.49Propionate 22.9 23.9 20.7 21.9 20.2 0.18 0.01 0.92 0.23A:P ratio 2.41 2.49 2.72 2.60 2.83 0.88 0.13 0.47 0.16Butyrate 16.9 14.8 18.6 17.0 18.4 0.10 0.08 0.82 0.89
1Low and High sulfur co-products being 0.82 and 1.16% S, respectively.2Match: Diet containing high sulfur wet distillers grains with solubles, but just in amount enough (31.44%) to target low sulfur diet content.3Time below pH 5.6, min; Area below pH 5.6, min*pH.
of co-product inclusion and more corn (8.56%), not dietary S, may cause the DMI effect.
Greater (P = 0.06) H2S concen-
tration was observed for wet DGS compared to dry DGS (Table 2). Diets containing wet DGS appear to provide greater availability of sulfur for microorganism fermentation and subsequent H
2S production. This
observation matches with the lower DMI and ADG observed by steers fed high sulfur wet DGS in the growth performance study (2011 Nebraska Beef Cattle Report, pp. 62-64). When included at 40% of diet DM, high S DGS tended (P = 0.13) to increase ruminal H
2S concentration compared
to low S DGS. An interaction between moisture
and S was observed for average of ruminal pH (P < 0.01). Steers fed high S wet and low S dry DGS had greater average pH compared to low S wet and high S dry DGS. Also, greater time and area below pH 5.6 were observed for steers fed low S wet and high S dry DGS, but these differences were subtle. Dry matter digestibility was not affect-ed by sulfur concentration or types of
DGS (Table 2), which does not explain performance differences.
No difference was observed for acetate molar proportion in ruminal fluid samples. However, steers fed high sulfur diets showed lower (P = 0.01) propionate concentration and tended (P = 0.13) to show greater A:P ratio compared to low sulfur diets . There was no interaction of sulfur x moisture for butyrate concen-tration. However, steers fed wet DGS and high sulfur diets showed greater (P≤0.10) concentration of this VFA compared to dry and low sulfur treat-ments (Table 2).
Sulfur of DGS impacts DMI and ruminal H
2S production, which may
be more pronounced with wet DGS. Ruminal propionate and butyrate concentrations were also affected by high sulfur DGS diets.
1Jhones O. Sarturi, graduate student; Kelsey Rolfe, research technician; Galen E. Erickson, professor, University of Nebraska–Lincoln Department of Animal Science; Judson Vasconcelos, former assistant professor, Panhandle Research and Extension Center, Scottsbluff, Neb.; Terry J. Klopfenstein, professor, UNL Department of Animal Science.
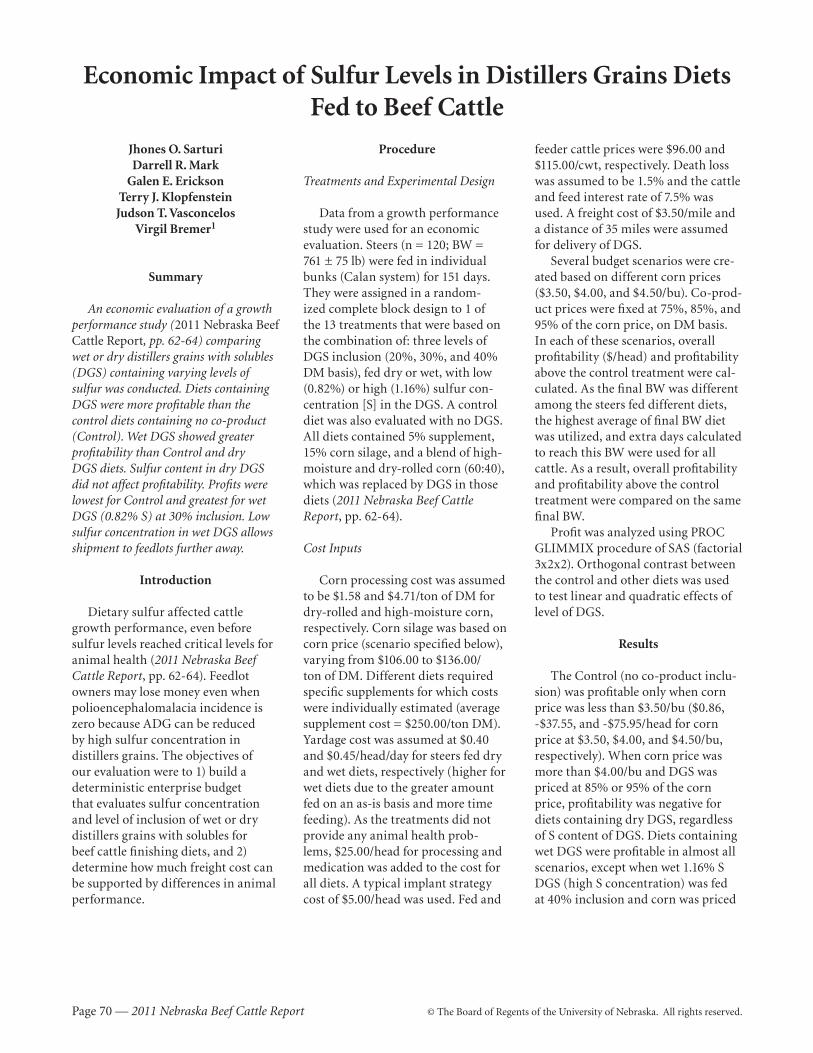
Page 70 — 2011 Nebraska Beef Cattle Report © The Board of Regents of the University of Nebraska. All rights reserved.
Economic Impact of Sulfur Levels in Distillers Grains Diets Fed to Beef Cattle
Jhones O. SarturiDarrell R. Mark
Galen E. EricksonTerry J. Klopfenstein
Judson T. VasconcelosVirgil Bremer1
Summary
An economic evaluation of a growth performance study (2011 Nebraska Beef Cattle Report, pp. 62-64) comparing wet or dry distillers grains with solubles (DGS) containing varying levels of sulfur was conducted. Diets containing DGS were more profitable than the control diets containing no co-product (Control). Wet DGS showed greater profitability than Control and dry DGS diets. Sulfur content in dry DGS did not affect profitability. Profits were lowest for Control and greatest for wet DGS (0.82% S) at 30% inclusion. Low sulfur concentration in wet DGS allows shipment to feedlots further away.
Introduction
Dietary sulfur affected cattle growth performance, even before sulfur levels reached critical levels for animal health (2011 Nebraska Beef Cattle Report, pp. 62-64). Feedlot owners may lose money even when polioencephalomalacia incidence is zero because ADG can be reduced by high sulfur concentration in distillers grains. The objectives of our evaluation were to 1) build a deterministic enterprise budget that evaluates sulfur concentration and level of inclusion of wet or dry distillers grains with solubles for beef cattle finishing diets, and 2) determine how much freight cost can be supported by differences in animal performance.
Procedure
Treatments and Experimental Design
Data from a growth performance study were used for an economic evaluation. Steers (n = 120; BW = 761 ± 75 lb) were fed in individual bunks (Calan system) for 151 days. They were assigned in a random-ized complete block design to 1 of the 13 treatments that were based on the combination of: three levels of DGS inclusion (20%, 30%, and 40% DM basis) , fed dry or wet, with low (0.82%) or high (1.16%) sulfur con-centration [S] in the DGS. A control diet was also evaluated with no DGS. All diets contained 5% supplement, 15% corn silage, and a blend of high-moisture and dry-rolled corn (60:40), which was replaced by DGS in those diets (2011 Nebraska Beef Cattle Report , pp. 62-64).
Cost Inputs
Corn processing cost was assumed to be $1.58 and $4.71/ton of DM for dry-rolled and high-moisture corn, respectively. Corn silage was based on corn price (scenario specified below), varying from $106.00 to $136.00/ton of DM. Different diets required specific supplements for which costs were individually estimated (average supplement cost = $250.00/ton DM). Yardage cost was assumed at $0.40 and $0.45/head/day for steers fed dry and wet diets, respectively (higher for wet diets due to the greater amount fed on an as-is basis and more time feeding). As the treatments did not provide any animal health prob-lems, $25.00/head for processing and medication was added to the cost for all diets . A typical implant strategy cost of $5.00/head was used. Fed and
feeder cattle prices were $96.00 and $115.00/cwt, respectively. Death loss was assumed to be 1.5% and the cattle and feed interest rate of 7.5% was used. A freight cost of $3.50/mile and a distance of 35 miles were assumed for delivery of DGS.
Several budget scenarios were cre-ated based on different corn prices ($3.50, $4.00, and $4.50/bu). Co-prod-uct prices were fixed at 75%, 85%, and 95% of the corn price, on DM basis. In each of these scenarios, overall profitability ($/head) and profitability above the control treatment were cal-culated. As the final BW was different among the steers fed different diets, the highest average of final BW diet was utilized, and extra days calculated to reach this BW were used for all cattle. As a result, overall profitability and profitability above the control treatment were compared on the same final BW.
Profit was analyzed using PROC GLIMMIX procedure of SAS (factorial 3x2x2). Orthogonal contrast between the control and other diets was used to test linear and quadratic effects of level of DGS.
Results
The Control (no co-product inclu-sion) was profitable only when corn price was less than $3.50/bu ($0.86, -$37.55, and -$75.95/head for corn price at $3.50, $4.00, and $4.50/bu, respectively). When corn price was more than $4.00/bu and DGS was priced at 85% or 95% of the corn price, profitability was negative for diets containing dry DGS, regardless of S content of DGS. Diets containing wet DGS were profitable in almost all scenarios, except when wet 1.16% S DGS (high S concentration) was fed at 40% inclusion and corn was priced
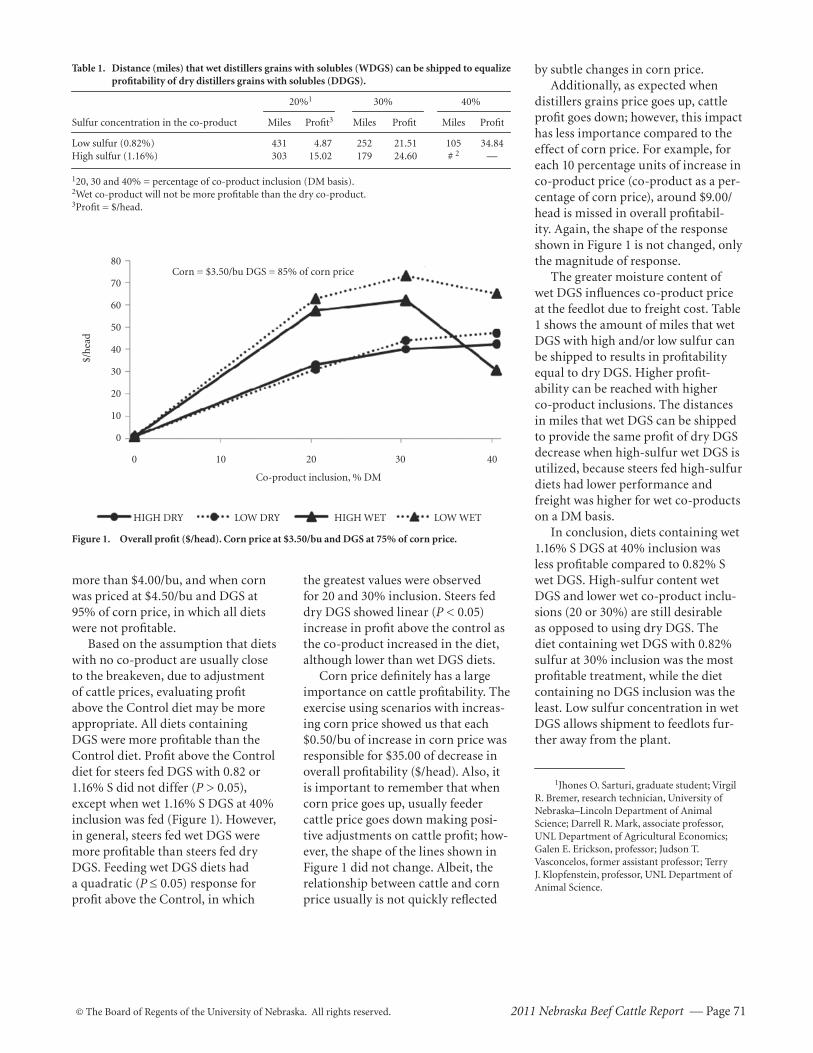
© The Board of Regents of the University of Nebraska. All rights reserved. 2011 Nebraska Beef Cattle Report — Page 71
by subtle changes in corn price. Additionally, as expected when
distillers grains price goes up, cattle profit goes down; however, this impact has less importance compared to the effect of corn price. For example, for each 10 percentage units of increase in co-product price (co-product as a per-centage of corn price), around $9.00/head is missed in overall profitabil-ity. Again, the shape of the response shown in Figure 1 is not changed, only the magnitude of response.
The greater moisture content of wet DGS influences co-product price at the feedlot due to freight cost. Table 1 shows the amount of miles that wet DGS with high and/or low sulfur can be shipped to results in profitability equal to dry DGS. Higher profit-ability can be reached with higher co-product inclusions. The distances in miles that wet DGS can be shipped to provide the same profit of dry DGS decrease when high-sulfur wet DGS is utilized, because steers fed high-sulfur diets had lower performance and freight was higher for wet co-products on a DM basis.
In conclusion, diets containing wet 1.16% S DGS at 40% inclusion was less profitable compared to 0.82% S wet DGS . High-sulfur content wet DGS and lower wet co-product inclu-sions (20 or 30%) are still desirable as opposed to using dry DGS. The diet containing wet DGS with 0.82% sulfur at 30% inclusion was the most profitable treatment, while the diet containing no DGS inclusion was the least. Low sulfur concentration in wet DGS allows shipment to feedlots fur-ther away from the plant.
1Jhones O. Sarturi, graduate student; Virgil R. Bremer, research technician, University of Nebraska–Lincoln Department of Animal Science; Darrell R. Mark, associate professor, UNL Department of Agricultural Economics; Galen E. Erickson, professor; Judson T. Vasconcelos, former assistant professor; Terry J. Klopfenstein, professor, UNL Department of Animal Science.
Table 1. Distance (miles) that wet distillers grains with solubles (WDGS) can be shipped to equalize profitability of dry distillers grains with solubles (DDGS).
20%1 30% 40%
Sulfur concentration in the co-product Miles Profit3 Miles Profit Miles Profit
Low sulfur (0.82%) 431 4.87 252 21.51 105 34.84High sulfur (1.16%) 303 15.02 179 24.60 # 2 —
120, 30 and 40% = percentage of co-product inclusion (DM basis).2Wet co-product will not be more profitable than the dry co-product.3Profit = $/head.
Figure 1. Overall profit ($/head). Corn price at $3.50/bu and DGS at 75% of corn price.
80
70
60
50
40
30
20
10
0
$/h
ead
Corn = $3.50/bu DGS = 85% of corn price
0 10 20 30 40
Co-product inclusion, % DM
HIGH DRY LOW DRY HIGH WET LOW WET
more than $4.00/bu, and when corn was priced at $4.50/bu and DGS at 95% of corn price, in which all diets were not profitable.
Based on the assumption that diets with no co-product are usually close to the breakeven, due to adjustment of cattle prices, evaluating profit above the Control diet may be more appropriate. All diets containing DGS were more profitable than the Control diet. Profit above the Control diet for steers fed DGS with 0.82 or 1.16% S did not differ (P > 0.05), except when wet 1.16% S DGS at 40% inclusion was fed (Figure 1). However, in general, steers fed wet DGS were more profitable than steers fed dry DGS. Feeding wet DGS diets had a quadratic (P ≤ 0.05) response for profit above the Control, in which
the greatest values were observed for 20 and 30% inclusion. Steers fed dry DGS showed linear (P < 0.05) increase in profit above the control as the co-product increased in the diet, although lower than wet DGS diets.
Corn price definitely has a large importance on cattle profitability. The exercise using scenarios with increas-ing corn price showed us that each $0.50/bu of increase in corn price was responsible for $35.00 of decrease in overall profitability ($/head). Also, it is important to remember that when corn price goes up, usually feeder cattle price goes down making posi-tive adjustments on cattle profit; how-ever, the shape of the lines shown in Figure 1 did not change. Albeit, the relationship between cattle and corn price usually is not quickly reflected
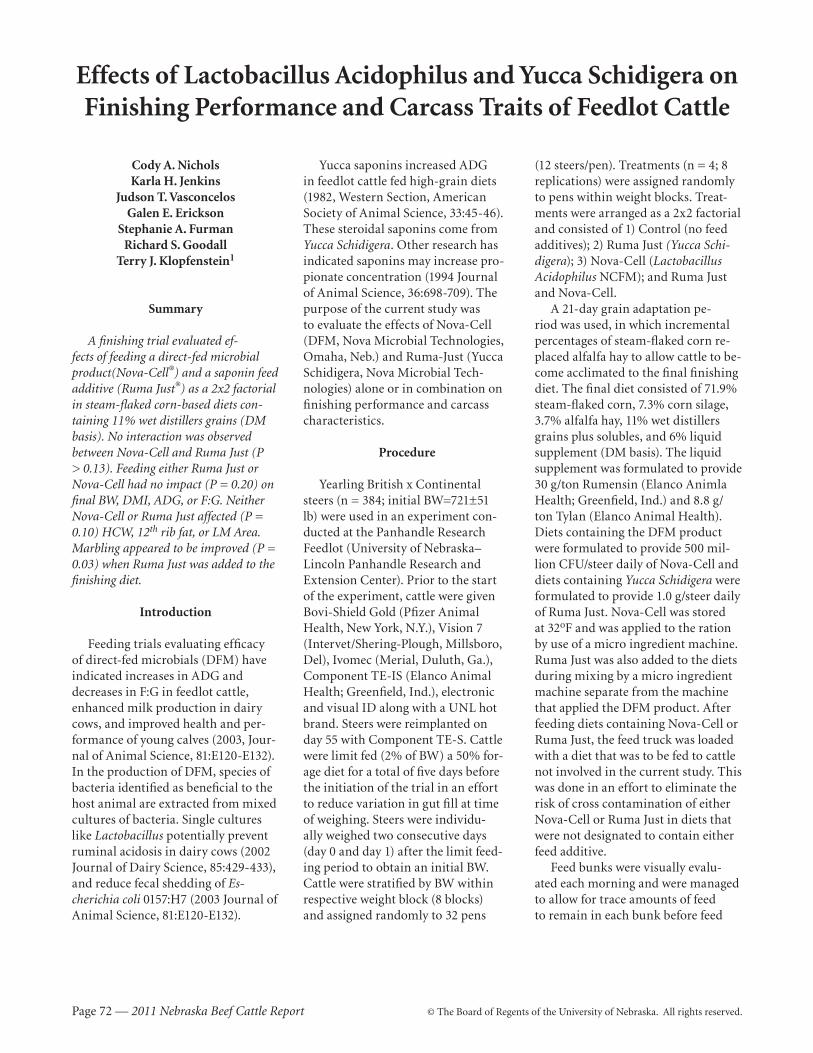
Page 72 — 2011 Nebraska Beef Cattle Report © The Board of Regents of the University of Nebraska. All rights reserved.
Effects of Lactobacillus Acidophilus and Yucca Schidigera on Finishing Performance and Carcass Traits of Feedlot Cattle
Cody A. NicholsKarla H. Jenkins
Judson T. VasconcelosGalen E. Erickson
Stephanie A. FurmanRichard S. Goodall
Terry J. Klopfenstein1
Summary
A finishing trial evaluated ef-fects of feeding a direct-fed microbial product(Nova-Cell®) and a saponin feed additive (Ruma Just®) as a 2x2 factorial in steam-flaked corn-based diets con-taining 11% wet distillers grains (DM basis). No interaction was observed between Nova-Cell and Ruma Just (P > 0.13). Feeding either Ruma Just or Nova-Cell had no impact (P = 0.20) on final BW, DMI, ADG, or F:G. Neither Nova-Cell or Ruma Just affected (P = 0.10) HCW, 12th rib fat, or LM Area. Marbling appeared to be improved (P = 0.03) when Ruma Just was added to the finishing diet.
Introduction
Feeding trials evaluating efficacy of direct-fed microbials (DFM) have indicated increases in ADG and decreases in F:G in feedlot cattle, enhanced milk production in dairy cows, and improved health and per-formance of young calves (2003, Jour-nal of Animal Science, 81:E120-E132). In the production of DFM, species of bacteria identified as beneficial to the host animal are extracted from mixed cultures of bacteria. Single cultures like Lactobacillus potentially prevent ruminal acidosis in dairy cows (2002 Journal of Dairy Science, 85:429-433), and reduce fecal shedding of Es-cherichia coli 0157:H7 (2003 Journal of Animal Science, 81:E120-E132).
Yucca saponins increased ADG in feedlot cattle fed high-grain diets (1982, Western Section, American Society of Animal Science, 33:45-46). These steroidal saponins come from Yucca Schidigera. Other research has indicated saponins may increase pro-pionate concentration (1994 Journal of Animal Science, 36:698-709). The purpose of the current study was to evaluate the effects of Nova-Cell (DFM, Nova Microbial Technologies, Omaha, Neb.) and Ruma-Just (Yucca Schidigera, Nova Microbial Tech-nologies) alone or in combination on finishing performance and carcass characteristics.
Procedure
Yearling British x Continental steers (n = 384; initial BW=721±51 lb) were used in an experiment con-ducted at the Panhandle Research Feedlot (University of Nebraska–Lincoln Panhandle Research and Extension Center). Prior to the start of the experiment, cattle were given Bovi-Shield Gold (Pfizer Animal Health, New York, N.Y.), Vision 7 (Intervet/Shering-Plough, Millsboro, Del), Ivomec (Merial, Duluth, Ga.), Component TE-IS (Elanco Animal Health; Greenfield, Ind.), electronic and visual ID along with a UNL hot brand. Steers were reimplanted on day 55 with Component TE-S. Cattle were limit fed (2% of BW) a 50% for-age diet for a total of five days before the initiation of the trial in an effort to reduce variation in gut fill at time of weighing. Steers were individu-ally weighed two consecutive days (day 0 and day 1) after the limit feed-ing period to obtain an initial BW. Cattle were stratified by BW within respective weight block (8 blocks) and assigned randomly to 32 pens
(12 steers/pen). Treatments (n = 4; 8 replications) were assigned randomly to pens within weight blocks. Treat-ments were arranged as a 2x2 factorial and consisted of 1) Control (no feed additives); 2) Ruma Just (Yucca Schi-digera); 3) Nova-Cell (Lactobacillus Acidophilus NCFM); and Ruma Just and Nova-Cell.
A 21-day grain adaptation pe-riod was used, in which incremental percentages of steam-flaked corn re-placed alfalfa hay to allow cattle to be-come acclimated to the final finishing diet. The final diet consisted of 71.9% steam-flaked corn, 7.3% corn silage, 3.7% alfalfa hay, 11% wet distillers grains plus solubles, and 6% liquid supplement (DM basis). The liquid supplement was formulated to provide 30 g/ton Rumensin (Elanco Animla Health; Greenfield, Ind.) and 8.8 g/ton Tylan (Elanco Animal Health). Diets containing the DFM product were formulated to provide 500 mil-lion CFU/steer daily of Nova-Cell and diets containing Yucca Schidigera were formulated to provide 1.0 g/steer daily of Ruma Just. Nova-Cell was stored at 32oF and was applied to the ration by use of a micro ingredient machine. Ruma Just was also added to the diets during mixing by a micro ingredient machine separate from the machine that applied the DFM product. After feeding diets containing Nova-Cell or Ruma Just, the feed truck was loaded with a diet that was to be fed to cattle not involved in the current study. This was done in an effort to eliminate the risk of cross contamination of either Nova-Cell or Ruma Just in diets that were not designated to contain either feed additive.
Feed bunks were visually evalu-ated each morning and were managed to allow for trace amounts of feed to remain in each bunk before feed
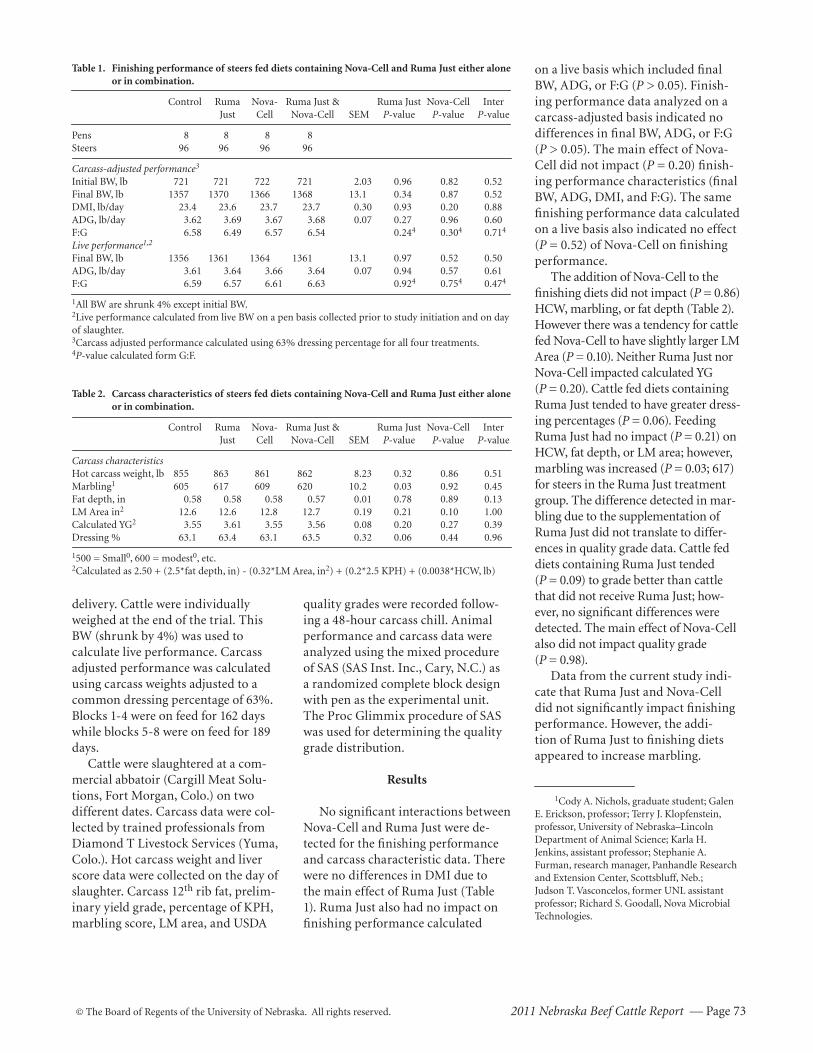
© The Board of Regents of the University of Nebraska. All rights reserved. 2011 Nebraska Beef Cattle Report — Page 73
on a live basis which included final BW, ADG, or F:G (P > 0.05). Finish-ing performance data analyzed on a carcass-adjusted basis indicated no differences in final BW, ADG, or F:G (P > 0.05). The main effect of Nova-Cell did not impact (P = 0.20) finish-ing performance characteristics (final BW, ADG, DMI, and F:G). The same finishing performance data calculated on a live basis also indicated no effect (P = 0.52) of Nova-Cell on finishing performance.
The addition of Nova-Cell to the finishing diets did not impact (P = 0.86) HCW, marbling, or fat depth (Table 2). However there was a tendency for cattle fed Nova-Cell to have slightly larger LM Area (P = 0.10). Neither Ruma Just nor Nova-Cell impacted calculated YG (P = 0.20). Cattle fed diets containing Ruma Just tended to have greater dress-ing percentages (P = 0.06). Feeding Ruma Just had no impact (P = 0.21) on HCW, fat depth, or LM area; however, marbling was increased (P = 0.03; 617) for steers in the Ruma Just treatment group. The difference detected in mar-bling due to the supplementation of Ruma Just did not translate to differ-ences in quality grade data. Cattle fed diets containing Ruma Just tended (P = 0.09) to grade better than cattle that did not receive Ruma Just; how-ever, no significant differences were detected. The main effect of Nova-Cell also did not impact quality grade (P = 0.98).
Data from the current study indi-cate that Ruma Just and Nova-Cell did not significantly impact finishing performance. However, the addi-tion of Ruma Just to finishing diets appeared to increase marbling.
1Cody A. Nichols, graduate student; Galen E. Erickson, professor; Terry J. Klopfenstein, professor, University of Nebraska–Lincoln Department of Animal Science; Karla H. Jenkins, assistant professor; Stephanie A. Furman, research manager, Panhandle Research and Extension Center, Scottsbluff, Neb.; Judson T. Vasconcelos, former UNL assistant professor; Richard S. Goodall, Nova Microbial Technologies.
Table 1. Finishing performance of steers fed diets containing Nova-Cell and Ruma Just either alone or in combination.
Control Ruma Nova- Ruma Just & Ruma Just Nova-Cell Inter Just Cell Nova-Cell SEM P-value P-value P-value
Pens 8 8 8 8Steers 96 96 96 96
Carcass-adjusted performance3
Initial BW, lb 721 721 722 721 2.03 0.96 0.82 0.52Final BW, lb 1357 1370 1366 1368 13.1 0.34 0.87 0.52DMI, lb/day 23.4 23.6 23.7 23.7 0.30 0.93 0.20 0.88ADG, lb/day 3.62 3.69 3.67 3.68 0.07 0.27 0.96 0.60F:G 6.58 6.49 6.57 6.54 0.244 0.304 0.714
Live performance1,2
Final BW, lb 1356 1361 1364 1361 13.1 0.97 0.52 0.50ADG, lb/day 3.61 3.64 3.66 3.64 0.07 0.94 0.57 0.61F:G 6.59 6.57 6.61 6.63 0.924 0.754 0.474
1All BW are shrunk 4% except initial BW.2Live performance calculated from live BW on a pen basis collected prior to study initiation and on day of slaughter.3Carcass adjusted performance calculated using 63% dressing percentage for all four treatments.4P-value calculated form G:F.
Table 2. Carcass characteristics of steers fed diets containing Nova-Cell and Ruma Just either alone or in combination.
Control Ruma Nova- Ruma Just & Ruma Just Nova-Cell Inter Just Cell Nova-Cell SEM P-value P-value P-value
Carcass characteristics Hot carcass weight, lb 855 863 861 862 8.23 0.32 0.86 0.51Marbling1 605 617 609 620 10.2 0.03 0.92 0.45Fat depth, in 0.58 0.58 0.58 0.57 0.01 0.78 0.89 0.13LM Area in2 12.6 12.6 12.8 12.7 0.19 0.21 0.10 1.00Calculated YG2 3.55 3.61 3.55 3.56 0.08 0.20 0.27 0.39Dressing % 63.1 63.4 63.1 63.5 0.32 0.06 0.44 0.96
1500 = Small0, 600 = modest0, etc.2Calculated as 2.50 + (2.5*fat depth, in) - (0.32*LM Area, in2) + (0.2*2.5 KPH) + (0.0038*HCW, lb)
delivery . Cattle were individually weighed at the end of the trial. This BW (shrunk by 4%) was used to calculate live performance. Carcass adjusted performance was calculated using carcass weights adjusted to a common dressing percentage of 63%. Blocks 1-4 were on feed for 162 days while blocks 5-8 were on feed for 189 days.
Cattle were slaughtered at a com-mercial abbatoir (Cargill Meat Solu-tions, Fort Morgan, Colo.) on two different dates. Carcass data were col-lected by trained professionals from Diamond T Livestock Services (Yuma, Colo.). Hot carcass weight and liver score data were collected on the day of slaughter. Carcass 12th rib fat, prelim-inary yield grade, percentage of KPH, marbling score, LM area, and USDA
quality grades were recorded follow-ing a 48-hour carcass chill. Animal performance and carcass data were analyzed using the mixed procedure of SAS (SAS Inst. Inc., Cary, N.C.) as a randomized complete block design with pen as the experimental unit. The Proc Glimmix procedure of SAS was used for determining the quality grade distribution.
Results
No significant interactions between Nova-Cell and Ruma Just were de-tected for the finishing performance and carcass characteristic data. There were no differences in DMI due to the main effect of Ruma Just (Table 1). Ruma Just also had no impact on finishing performance calculated
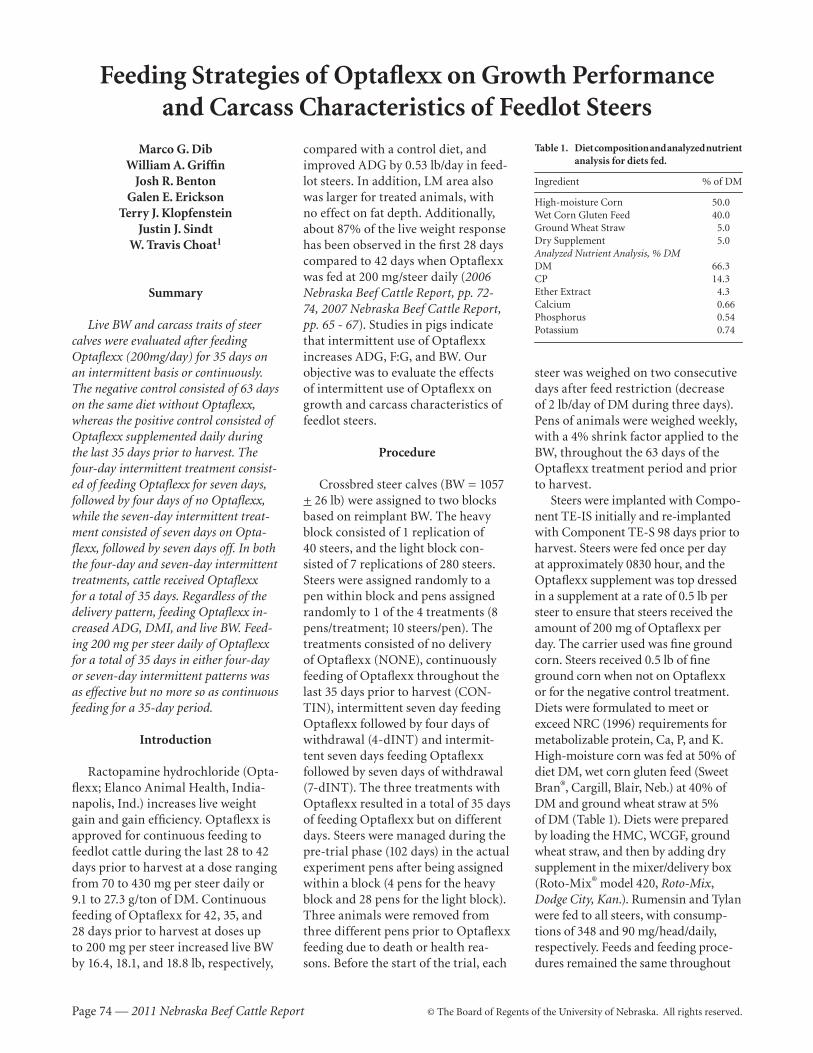
Page 74 — 2011 Nebraska Beef Cattle Report © The Board of Regents of the University of Nebraska. All rights reserved.
Feeding Strategies of Optaflexx on Growth Performance and Carcass Characteristics of Feedlot Steers
Marco G. DibWilliam A. Griffin
Josh R. BentonGalen E. Erickson
Terry J. KlopfensteinJustin J. Sindt
W. Travis Choat1
Summary
Live BW and carcass traits of steer calves were evaluated after feeding Optaflexx (200mg/day) for 35 days on an intermittent basis or continuously. The negative control consisted of 63 days on the same diet without Optaflexx, whereas the positive control consisted of Optaflexx supplemented daily during the last 35 days prior to harvest. The four-day intermittent treatment consist-ed of feeding Optaflexx for seven days, followed by four days of no Optaflexx, while the seven-day intermittent treat-ment consisted of seven days on Opta-flexx, followed by seven days off. In both the four-day and seven-day intermittent treatments, cattle received Optaflexx for a total of 35 days. Regardless of the delivery pattern, feeding Optaflexx in-creased ADG, DMI, and live BW. Feed-ing 200 mg per steer daily of Optaflexx for a total of 35 days in either four-day or seven-day intermittent patterns was as effective but no more so as continuous feeding for a 35-day period.
Introduction
Ractopamine hydrochloride (Opta-flexx; Elanco Animal Health, India-napolis, Ind.) increases live weight gain and gain efficiency. Optaflexx is approved for continuous feeding to feedlot cattle during the last 28 to 42 days prior to harvest at a dose ranging from 70 to 430 mg per steer daily or 9.1 to 27.3 g/ton of DM. Continuous feeding of Optaflexx for 42, 35, and 28 days prior to harvest at doses up to 200 mg per steer increased live BW by 16.4, 18.1, and 18.8 lb, respectively,
compared with a control diet, and improved ADG by 0.53 lb/day in feed-lot steers. In addition, LM area also was larger for treated animals, with no effect on fat depth. Additionally, about 87% of the live weight response has been observed in the first 28 days compared to 42 days when Optaflexx was fed at 200 mg/steer daily (2006 Nebraska Beef Cattle Report, pp. 72-74, 2007 Nebraska Beef Cattle Report, pp. 65 - 67). Studies in pigs indicate that intermittent use of Optaflexx increases ADG, F:G, and BW. Our objective was to evaluate the effects of intermittent use of Optaflexx on growth and carcass characteristics of feedlot steers.
Procedure
Crossbred steer calves (BW = 1057 + 26 lb) were assigned to two blocks based on reimplant BW. The heavy block consisted of 1 replication of 40 steers, and the light block con-sisted of 7 replications of 280 steers. Steers were assigned randomly to a pen within block and pens assigned randomly to 1 of the 4 treatments (8 pens/treatment; 10 steers/pen). The treatments consisted of no delivery of Optaflexx (NONE), continuously feeding of Optaflexx throughout the last 35 days prior to harvest (CON-TIN), intermittent seven day feeding Optaflexx followed by four days of withdrawal (4-dINT) and intermit-tent seven days feeding Optaflexx followed by seven days of withdrawal (7-dINT). The three treatments with Optaflexx resulted in a total of 35 days of feeding Optaflexx but on different days. Steers were managed during the pre-trial phase (102 days) in the actual experiment pens after being assigned within a block (4 pens for the heavy block and 28 pens for the light block). Three animals were removed from three different pens prior to Optaflexx feeding due to death or health rea-sons. Before the start of the trial, each
steer was weighed on two consecutive days after feed restriction (decrease of 2 lb/day of DM during three days). Pens of animals were weighed weekly, with a 4% shrink factor applied to the BW, throughout the 63 days of the Optaflexx treatment period and prior to harvest.
Steers were implanted with Compo-nent TE-IS initially and re-implanted with Component TE-S 98 days prior to harvest. Steers were fed once per day at approximately 0830 hour, and the Optaflexx supplement was top dressed in a supplement at a rate of 0.5 lb per steer to ensure that steers received the amount of 200 mg of Optaflexx per day. The carrier used was fine ground corn. Steers received 0.5 lb of fine ground corn when not on Optaflexx or for the negative control treatment. Diets were formulated to meet or exceed NRC (1996) requirements for metabolizable protein, Ca, P, and K. High-moisture corn was fed at 50% of diet DM, wet corn gluten feed (Sweet Bran®, Cargill, Blair, Neb.) at 40% of DM and ground wheat straw at 5% of DM (Table 1). Diets were prepared by loading the HMC, WCGF, ground wheat straw, and then by adding dry supplement in the mixer/delivery box (Roto-Mix® model 420, Roto-Mix, Dodge City, Kan.). Rumensin and Tylan were fed to all steers, with consump-tions of 348 and 90 mg/head/daily, respectively. Feeds and feeding proce-dures remained the same throughout
Table 1. Diet composition and analyzed nutrient analysis for diets fed.
Ingredient % of DM
High-moisture Corn 50.0Wet Corn Gluten Feed 40.0Ground Wheat Straw 5.0Dry Supplement 5.0Analyzed Nutrient Analysis, % DMDM 66.3CP 14.3Ether Extract 4.3Calcium 0.66Phosphorus 0.54Potassium 0.74
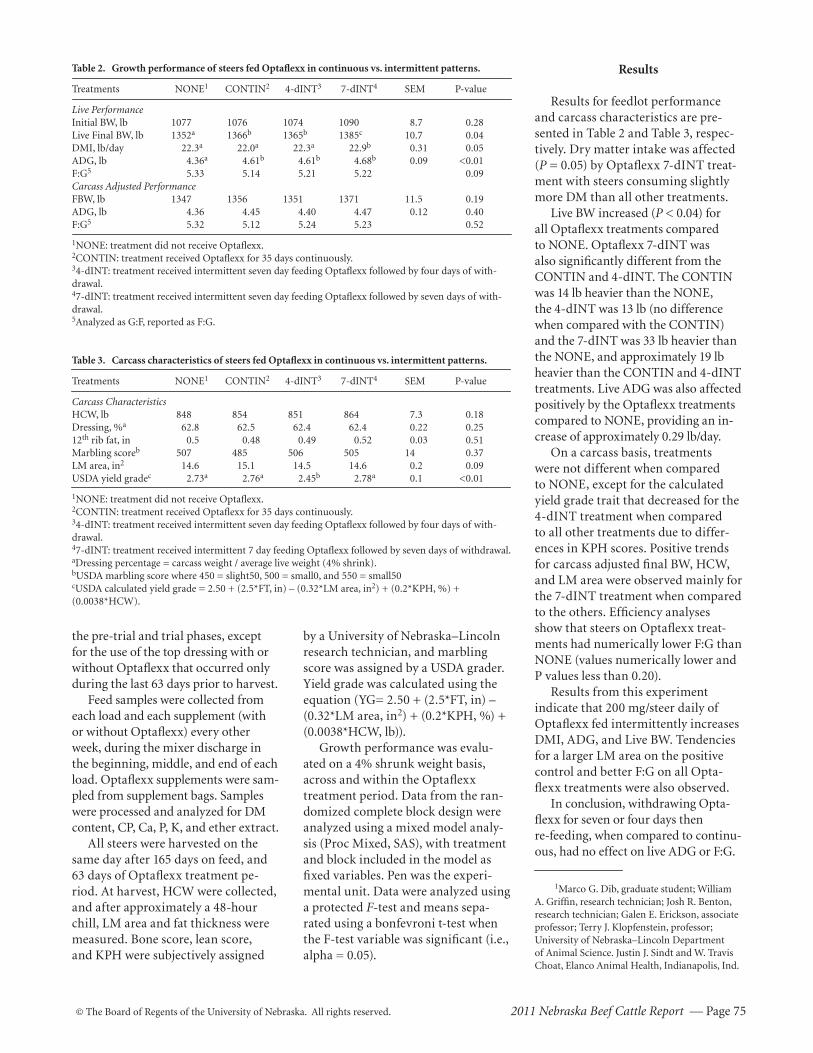
© The Board of Regents of the University of Nebraska. All rights reserved. 2011 Nebraska Beef Cattle Report — Page 75
Results
Results for feedlot performance and carcass characteristics are pre-sented in Table 2 and Table 3, respec-tively. Dry matter intake was affected (P = 0.05) by Optaflexx 7-dINT treat-ment with steers consuming slightly more DM than all other treatments.
Live BW increased (P < 0.04) for all Optaflexx treatments compared to NONE. Optaflexx 7-dINT was also significantly different from the CONTIN and 4-dINT. The CONTIN was 14 lb heavier than the NONE, the 4-dINT was 13 lb (no difference when compared with the CONTIN) and the 7-dINT was 33 lb heavier than the NONE, and approximately 19 lb heavier than the CONTIN and 4-dINT treatments. Live ADG was also affected positively by the Optaflexx treatments compared to NONE, providing an in-crease of approximately 0.29 lb/day.
On a carcass basis, treatments were not different when compared to NONE, except for the calculated yield grade trait that decreased for the 4-dINT treatment when compared to all other treatments due to differ-ences in KPH scores. Positive trends for carcass adjusted final BW, HCW, and LM area were observed mainly for the 7-dINT treatment when compared to the others. Efficiency analyses show that steers on Optaflexx treat-ments had numerically lower F:G than NONE (values numerically lower and P values less than 0.20).
Results from this experiment indicate that 200 mg/steer daily of Optaflexx fed intermittently increases DMI, ADG, and Live BW. Tendencies for a larger LM area on the positive control and better F:G on all Opta-flexx treatments were also observed.
In conclusion, withdrawing Opta-flexx for seven or four days then re-feeding, when compared to continu-ous, had no effect on live ADG or F:G.
1Marco G. Dib, graduate student; William A. Griffin, research technician; Josh R. Benton, research technician; Galen E. Erickson, associate professor; Terry J. Klopfenstein, professor; University of Nebraska–Lincoln Department of Animal Science. Justin J. Sindt and W. Travis Choat, Elanco Animal Health, Indianapolis, Ind.
Table 2. Growth performance of steers fed Optaflexx in continuous vs. intermittent patterns.
Treatments NONE1 CONTIN2 4-dINT3 7-dINT4 SEM P-value
Live PerformanceInitial BW, lb 1077 1076 1074 1090 8.7 0.28Live Final BW, lb 1352a 1366b 1365b 1385c 10.7 0.04DMI, lb/day 22.3a 22.0a 22.3a 22.9b 0.31 0.05ADG, lb 4.36a 4.61b 4.61b 4.68b 0.09 <0.01F:G5 5.33 5.14 5.21 5.22 0.09Carcass Adjusted PerformanceFBW, lb 1347 1356 1351 1371 11.5 0.19ADG, lb 4.36 4.45 4.40 4.47 0.12 0.40F:G5 5.32 5.12 5.24 5.23 0.52
1NONE: treatment did not receive Optaflexx.2CONTIN: treatment received Optaflexx for 35 days continuously.34-dINT: treatment received intermittent seven day feeding Optaflexx followed by four days of with-drawal.47-dINT: treatment received intermittent seven day feeding Optaflexx followed by seven days of with-drawal.5Analyzed as G:F, reported as F:G.
Table 3. Carcass characteristics of steers fed Optaflexx in continuous vs. intermittent patterns.
Treatments NONE1 CONTIN2 4-dINT3 7-dINT4 SEM P-value
Carcass Characteristics HCW, lb 848 854 851 864 7.3 0.18Dressing, %a 62.8 62.5 62.4 62.4 0.22 0.2512th rib fat, in 0.5 0.48 0.49 0.52 0.03 0.51Marbling scoreb 507 485 506 505 14 0.37LM area, in2 14.6 15.1 14.5 14.6 0.2 0.09USDA yield gradec 2.73a 2.76a 2.45b 2.78a 0.1 <0.01
1NONE: treatment did not receive Optaflexx.2CONTIN: treatment received Optaflexx for 35 days continuously.34-dINT: treatment received intermittent seven day feeding Optaflexx followed by four days of with-drawal.47-dINT: treatment received intermittent 7 day feeding Optaflexx followed by seven days of withdrawal.aDressing percentage = carcass weight / average live weight (4% shrink).bUSDA marbling score where 450 = slight50, 500 = small0, and 550 = small50cUSDA calculated yield grade = 2.50 + (2.5*FT, in) – (0.32*LM area, in2) + (0.2*KPH, %) + (0.0038*HCW).
the pre-trial and trial phases, except for the use of the top dressing with or without Optaflexx that occurred only during the last 63 days prior to harvest.
Feed samples were collected from each load and each supplement (with or without Optaflexx) every other week, during the mixer discharge in the beginning, middle, and end of each load. Optaflexx supplements were sam-pled from supplement bags. Samples were processed and analyzed for DM content, CP, Ca, P, K, and ether extract.
All steers were harvested on the same day after 165 days on feed, and 63 days of Optaflexx treatment pe-riod. At harvest, HCW were collected, and after approximately a 48-hour chill, LM area and fat thickness were measured. Bone score, lean score, and KPH were subjectively assigned
by a University of Nebraska–Lincoln research technician, and marbling score was assigned by a USDA grader. Yield grade was calculated using the equation (YG= 2.50 + (2.5*FT, in) – (0.32*LM area, in2) + (0.2*KPH, %) + (0.0038*HCW, lb)).
Growth performance was evalu-ated on a 4% shrunk weight basis, across and within the Optaflexx treatment period. Data from the ran-domized complete block design were analyzed using a mixed model analy-sis (Proc Mixed, SAS), with treatment and block included in the model as fixed variables. Pen was the experi-mental unit. Data were analyzed using a protected F-test and means sepa-rated using a bonfevroni t-test when the F-test variable was significant (i.e., alpha = 0.05).
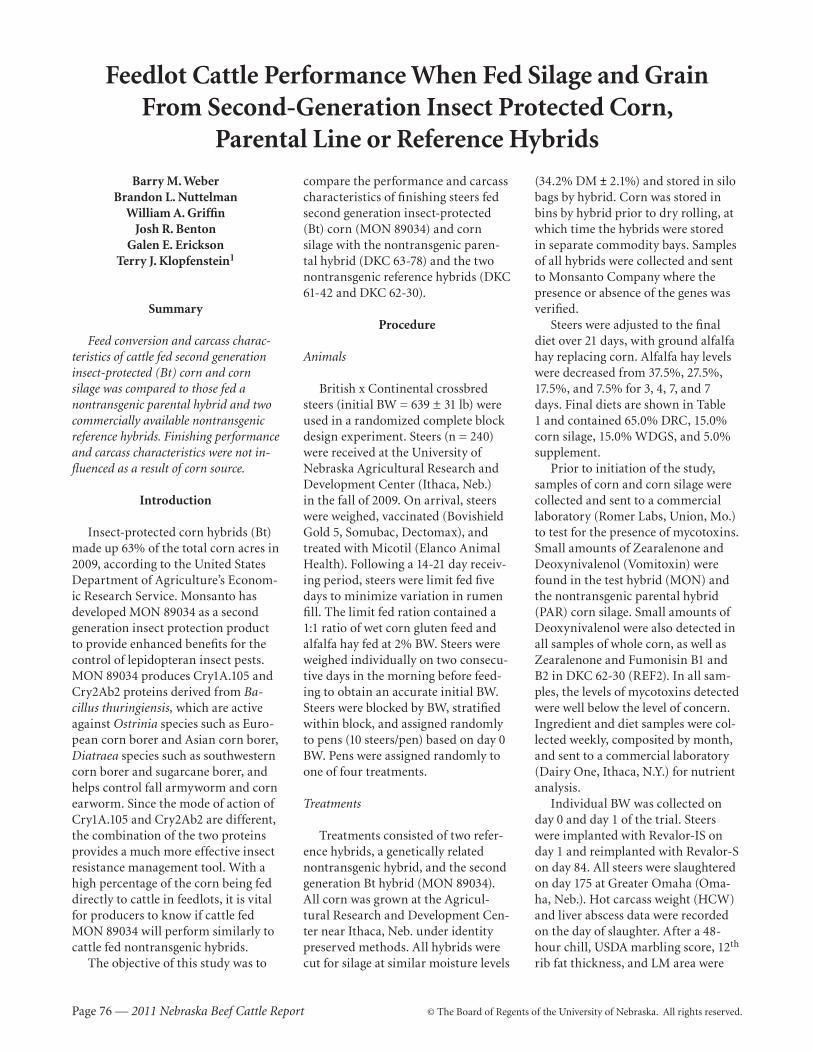
Page 76 — 2011 Nebraska Beef Cattle Report © The Board of Regents of the University of Nebraska. All rights reserved.
Feedlot Cattle Performance When Fed Silage and GrainFrom Second-Generation Insect Protected Corn,
Parental Line or Reference Hybrids
Barry M. WeberBrandon L. Nuttelman
William A. GriffinJosh R. Benton
Galen E. EricksonTerry J. Klopfenstein1
Summary
Feed conversion and carcass charac-teristics of cattle fed second generation insect-protected (Bt) corn and corn silage was compared to those fed a nontransgenic parental hybrid and two commercially available nontransgenic reference hybrids. Finishing performance and carcass characteristics were not in-fluenced as a result of corn source.
Introduction
Insect-protected corn hybrids (Bt) made up 63% of the total corn acres in 2009, according to the United States Department of Agriculture’s Econom-ic Research Service. Monsanto has developed MON 89034 as a second generation insect protection product to provide enhanced benefits for the control of lepidopteran insect pests. MON 89034 produces Cry1A.105 and Cry2Ab2 proteins derived from Ba-cillus thuringiensis, which are active against Ostrinia species such as Euro-pean corn borer and Asian corn borer, Diatraea species such as southwestern corn borer and sugarcane borer, and helps control fall armyworm and corn earworm. Since the mode of action of Cry1A.105 and Cry2Ab2 are different, the combination of the two proteins provides a much more effective insect resistance management tool. With a high percentage of the corn being fed directly to cattle in feedlots, it is vital for producers to know if cattle fed MON 89034 will perform similarly to cattle fed nontransgenic hybrids.
The objective of this study was to
compare the performance and carcass characteristics of finishing steers fed second generation insect-protected (Bt) corn (MON 89034) and corn silage with the nontransgenic paren-tal hybrid (DKC 63-78) and the two nontransgenic reference hybrids (DKC 61-42 and DKC 62-30).
Procedure
Animals
British x Continental crossbred steers (initial BW = 639 ± 31 lb) were used in a randomized complete block design experiment. Steers (n = 240) were received at the University of Nebraska Agricultural Research and Development Center (Ithaca, Neb.) in the fall of 2009. On arrival, steers were weighed, vaccinated (Bovishield Gold 5, Somubac, Dectomax), and treated with Micotil (Elanco Animal Health). Following a 14-21 day receiv-ing period, steers were limit fed five days to minimize variation in rumen fill. The limit fed ration contained a 1:1 ratio of wet corn gluten feed and alfalfa hay fed at 2% BW. Steers were weighed individually on two consecu-tive days in the morning before feed-ing to obtain an accurate initial BW. Steers were blocked by BW, stratified within block, and assigned randomly to pens (10 steers/pen) based on day 0 BW. Pens were assigned randomly to one of four treatments.
Treatments
Treatments consisted of two refer-ence hybrids, a genetically related nontransgenic hybrid, and the second generation Bt hybrid (MON 89034). All corn was grown at the Agricul-tural Research and Development Cen-ter near Ithaca, Neb. under identity preserved methods. All hybrids were cut for silage at similar moisture levels
(34.2% DM ± 2.1%) and stored in silo bags by hybrid. Corn was stored in bins by hybrid prior to dry rolling, at which time the hybrids were stored in separate commodity bays. Samples of all hybrids were collected and sent to Monsanto Company where the presence or absence of the genes was verified.
Steers were adjusted to the final diet over 21 days, with ground alfalfa hay replacing corn. Alfalfa hay levels were decreased from 37.5%, 27.5%, 17.5%, and 7.5% for 3, 4, 7, and 7 days. Final diets are shown in Table 1 and contained 65.0% DRC, 15.0% corn silage, 15.0% WDGS, and 5.0% supplement.
Prior to initiation of the study, samples of corn and corn silage were collected and sent to a commercial laboratory (Romer Labs, Union, Mo.) to test for the presence of mycotoxins. Small amounts of Zearalenone and Deoxynivalenol (Vomitoxin) were found in the test hybrid (MON) and the nontransgenic parental hybrid (PAR) corn silage. Small amounts of Deoxynivalenol were also detected in all samples of whole corn, as well as Zearalenone and Fumonisin B1 and B2 in DKC 62-30 (REF2). In all sam-ples, the levels of mycotoxins detected were well below the level of concern. Ingredient and diet samples were col-lected weekly, composited by month, and sent to a commercial laboratory (Dairy One, Ithaca, N.Y.) for nutrient analysis.
Individual BW was collected on day 0 and day 1 of the trial. Steers were implanted with Revalor-IS on day 1 and reimplanted with Revalor-S on day 84. All steers were slaughtered on day 175 at Greater Omaha (Oma-ha, Neb.). Hot carcass weight (HCW) and liver abscess data were recorded on the day of slaughter. After a 48-hour chill, USDA marbling score, 12th rib fat thickness, and LM area were
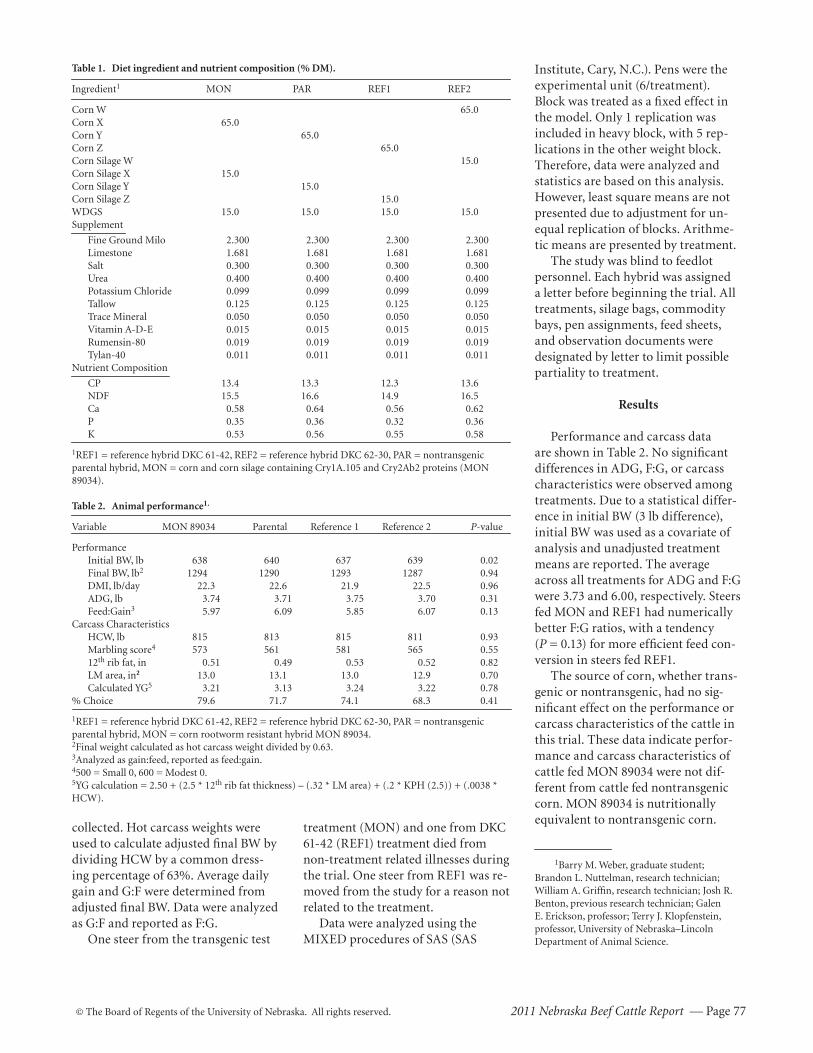
© The Board of Regents of the University of Nebraska. All rights reserved. 2011 Nebraska Beef Cattle Report — Page 77
Institute , Cary, N.C.). Pens were the experimental unit (6/treatment). Block was treated as a fixed effect in the model. Only 1 replication was included in heavy block, with 5 rep-lications in the other weight block. Therefore, data were analyzed and statistics are based on this analysis. However, least square means are not presented due to adjustment for un-equal replication of blocks. Arithme-tic means are presented by treatment.
The study was blind to feedlot personnel. Each hybrid was assigned a letter before beginning the trial. All treatments, silage bags, commodity bays, pen assignments, feed sheets, and observation documents were designated by letter to limit possible partiality to treatment.
Results
Performance and carcass data are shown in Table 2. No significant differences in ADG, F:G, or carcass characteristics were observed among treatments. Due to a statistical differ-ence in initial BW (3 lb difference), initial BW was used as a covariate of analysis and unadjusted treatment means are reported. The average across all treatments for ADG and F:G were 3.73 and 6.00, respectively. Steers fed MON and REF1 had numerically better F:G ratios, with a tendency (P = 0.13) for more efficient feed con-version in steers fed REF1.
The source of corn, whether trans-genic or nontransgenic, had no sig-nificant effect on the performance or carcass characteristics of the cattle in this trial. These data indicate perfor-mance and carcass characteristics of cattle fed MON 89034 were not dif-ferent from cattle fed nontransgenic corn. MON 89034 is nutritionally equivalent to nontransgenic corn.
1Barry M. Weber, graduate student; Brandon L. Nuttelman, research technician; William A. Griffin, research technician; Josh R. Benton, previous research technician; Galen E. Erickson, professor; Terry J. Klopfenstein, professor, University of Nebraska–Lincoln Department of Animal Science.
Table 1. Diet ingredient and nutrient composition (% DM).
Ingredient1 MON PAR REF1 REF2
Corn W 65.0Corn X 65.0Corn Y 65.0Corn Z 65.0Corn Silage W 15.0Corn Silage X 15.0Corn Silage Y 15.0Corn Silage Z 15.0WDGS 15.0 15.0 15.0 15.0Supplement
Fine Ground Milo 2.300 2.300 2.300 2.300 Limestone 1.681 1.681 1.681 1.681 Salt 0.300 0.300 0.300 0.300 Urea 0.400 0.400 0.400 0.400 Potassium Chloride 0.099 0.099 0.099 0.099 Tallow 0.125 0.125 0.125 0.125 Trace Mineral 0.050 0.050 0.050 0.050 Vitamin A-D-E 0.015 0.015 0.015 0.015 Rumensin-80 0.019 0.019 0.019 0.019 Tylan-40 0.011 0.011 0.011 0.011Nutrient Composition
CP 13.4 13.3 12.3 13.6 NDF 15.5 16.6 14.9 16.5 Ca 0.58 0.64 0.56 0.62 P 0.35 0.36 0.32 0.36 K 0.53 0.56 0.55 0.58
1REF1 = reference hybrid DKC 61-42, REF2 = reference hybrid DKC 62-30, PAR = nontransgenic parental hybrid, MON = corn and corn silage containing Cry1A.105 and Cry2Ab2 proteins (MON 89034).
Table 2. Animal performance1.
Variable MON 89034 Parental Reference 1 Reference 2 P-value
Performance Initial BW, lb 638 640 637 639 0.02 Final BW, lb2 1294 1290 1293 1287 0.94 DMI, lb/day 22.3 22.6 21.9 22.5 0.96 ADG, lb 3.74 3.71 3.75 3.70 0.31 Feed:Gain3 5.97 6.09 5.85 6.07 0.13Carcass Characteristics HCW, lb 815 813 815 811 0.93 Marbling score4 573 561 581 565 0.55 12th rib fat, in 0.51 0.49 0.53 0.52 0.82 LM area, in² 13.0 13.1 13.0 12.9 0.70 Calculated YG5 3.21 3.13 3.24 3.22 0.78% Choice 79.6 71.7 74.1 68.3 0.41
1REF1 = reference hybrid DKC 61-42, REF2 = reference hybrid DKC 62-30, PAR = nontransgenic parental hybrid, MON = corn rootworm resistant hybrid MON 89034.2Final weight calculated as hot carcass weight divided by 0.63.3Analyzed as gain:feed, reported as feed:gain.4500 = Small 0, 600 = Modest 0.5YG calculation = 2.50 + (2.5 * 12th rib fat thickness) – (.32 * LM area) + (.2 * KPH (2.5)) + (.0038 * HCW).
collected. Hot carcass weights were used to calculate adjusted final BW by dividing HCW by a common dress-ing percentage of 63%. Average daily gain and G:F were determined from adjusted final BW. Data were analyzed as G:F and reported as F:G.
One steer from the transgenic test
treatment (MON) and one from DKC 61-42 (REF1) treatment died from non-treatment related illnesses during the trial. One steer from REF1 was re-moved from the study for a reason not related to the treatment.
Data were analyzed using the MIXED procedures of SAS (SAS
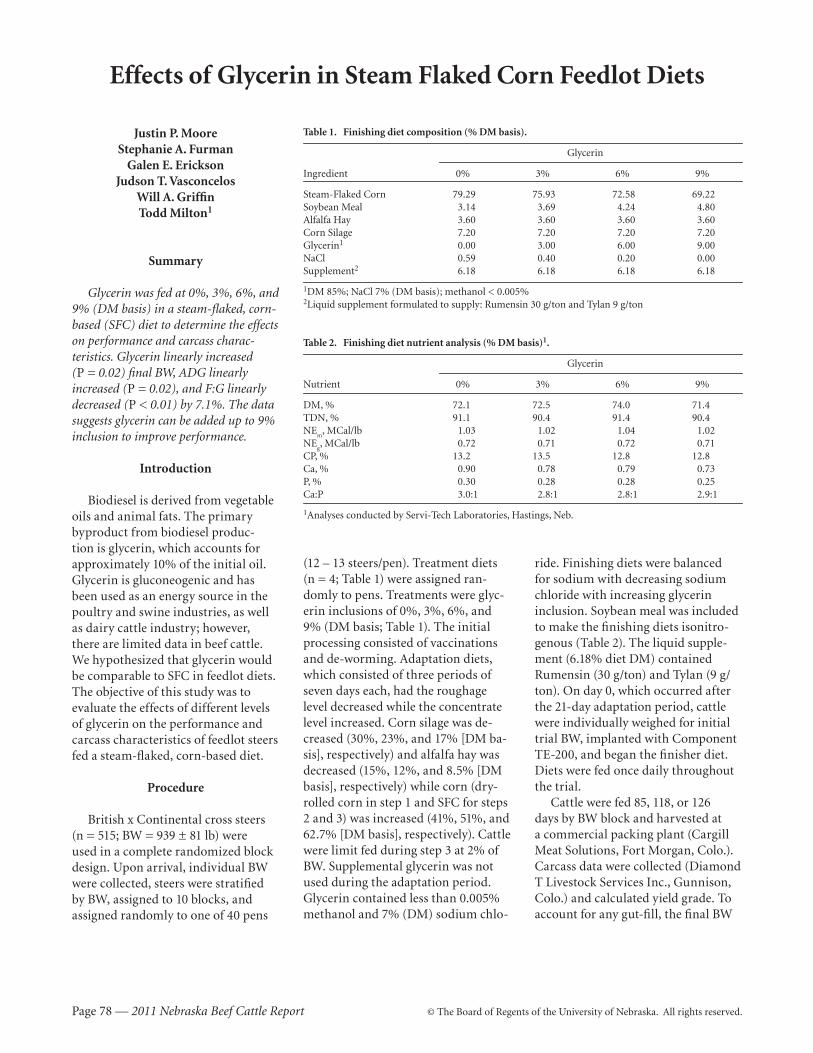
Page 78 — 2011 Nebraska Beef Cattle Report © The Board of Regents of the University of Nebraska. All rights reserved.
Effects of Glycerin in Steam Flaked Corn Feedlot Diets
Justin P. MooreStephanie A. Furman
Galen E. EricksonJudson T. Vasconcelos
Will A. GriffinTodd Milton1
Summary
Glycerin was fed at 0%, 3%, 6%, and 9% (DM basis) in a steam-flaked, corn-based (SFC) diet to determine the effects on performance and carcass charac-teristics. Glycerin linearly increased (P = 0.02) final BW, ADG linearly increased (P = 0.02), and F:G linearly decreased (P < 0.01) by 7.1%. The data suggests glycerin can be added up to 9% inclusion to improve performance.
Introduction
Biodiesel is derived from vegetable oils and animal fats. The primary byproduct from biodiesel produc-tion is glycerin, which accounts for approximately 10% of the initial oil. Glycerin is gluconeogenic and has been used as an energy source in the poultry and swine industries, as well as dairy cattle industry; however, there are limited data in beef cattle. We hypothesized that glycerin would be comparable to SFC in feedlot diets . The objective of this study was to evaluate the effects of different levels of glycerin on the performance and carcass characteristics of feedlot steers fed a steam-flaked, corn-based diet.
Procedure
British x Continental cross steers (n = 515; BW = 939 ± 81 lb) were used in a complete randomized block design. Upon arrival, individual BW were collected, steers were stratified by BW, assigned to 10 blocks, and assigned randomly to one of 40 pens
Table 1. Finishing diet composition (% DM basis).
Glycerin
Ingredient 0% 3% 6% 9%
Steam-Flaked Corn 79.29 75.93 72.58 69.22Soybean Meal 3.14 3.69 4.24 4.80Alfalfa Hay 3.60 3.60 3.60 3.60Corn Silage 7.20 7.20 7.20 7.20Glycerin1 0.00 3.00 6.00 9.00NaCl 0.59 0.40 0.20 0.00Supplement2 6.18 6.18 6.18 6.18
1DM 85%; NaCl 7% (DM basis); methanol < 0.005%2Liquid supplement formulated to supply: Rumensin 30 g/ton and Tylan 9 g/ton
Table 2. Finishing diet nutrient analysis (% DM basis)1.
Glycerin
Nutrient 0% 3% 6% 9%
DM, % 72.1 72.5 74.0 71.4TDN, % 91.1 90.4 91.4 90.4NE
m, MCal/lb 1.03 1.02 1.04 1.02
NEg, MCal/lb 0.72 0.71 0.72 0.71
CP, % 13.2 13.5 12.8 12.8Ca, % 0.90 0.78 0.79 0.73P, % 0.30 0.28 0.28 0.25Ca:P 3.0:1 2.8:1 2.8:1 2.9:1
1Analyses conducted by Servi-Tech Laboratories, Hastings, Neb.
(12 – 13 steers/pen). Treatment diets (n = 4; Table 1) were assigned ran-domly to pens. Treatments were glyc-erin inclusions of 0%, 3%, 6%, and 9% (DM basis; Table 1). The initial processing consisted of vaccinations and de-worming. Adaptation diets, which consisted of three periods of seven days each, had the roughage level decreased while the concentrate level increased. Corn silage was de-creased (30%, 23%, and 17% [DM ba-sis], respectively) and alfalfa hay was decreased (15%, 12%, and 8.5% [DM basis], respectively) while corn (dry-rolled corn in step 1 and SFC for steps 2 and 3) was increased (41%, 51%, and 62.7% [DM basis], respectively). Cattle were limit fed during step 3 at 2% of BW. Supplemental glycerin was not used during the adaptation period. Glycerin contained less than 0.005% methanol and 7% (DM) sodium chlo-
ride. Finishing diets were balanced for sodium with decreasing sodium chloride with increasing glycerin inclusion . Soybean meal was included to make the finishing diets isonitro-genous (Table 2). The liquid supple-ment (6.18% diet DM) contained Rumensin (30 g/ton) and Tylan (9 g/ton). On day 0, which occurred after the 21-day adaptation period, cattle were individually weighed for initial trial BW, implanted with Component TE-200, and began the finisher diet. Diets were fed once daily throughout the trial.
Cattle were fed 85, 118, or 126 days by BW block and harvested at a commercial packing plant (Cargill Meat Solutions, Fort Morgan, Colo.). Carcass data were collected (Diamond T Livestock Services Inc., Gunnison, Colo.) and calculated yield grade. To account for any gut-fill, the final BW
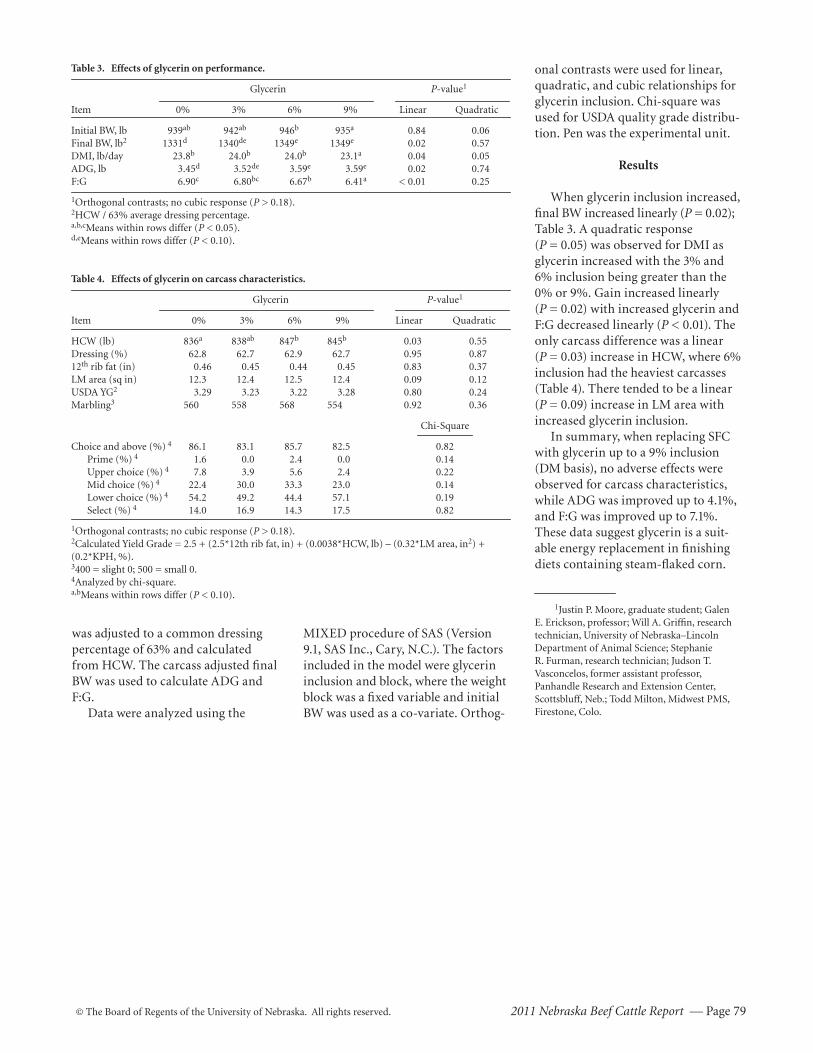
© The Board of Regents of the University of Nebraska. All rights reserved. 2011 Nebraska Beef Cattle Report — Page 79
onal contrasts were used for linear, quadratic, and cubic relationships for glycerin inclusion. Chi-square was used for USDA quality grade distribu-tion. Pen was the experimental unit.
Results
When glycerin inclusion increased, final BW increased linearly (P = 0.02); Table 3. A quadratic response (P = 0.05) was observed for DMI as glycerin increased with the 3% and 6% inclusion being greater than the 0% or 9%. Gain increased linearly (P = 0.02) with increased glycerin and F:G decreased linearly (P < 0.01). The only carcass difference was a linear (P = 0.03) increase in HCW, where 6% inclusion had the heaviest carcasses (Table 4). There tended to be a linear (P = 0.09) increase in LM area with increased glycerin inclusion.
In summary, when replacing SFC with glycerin up to a 9% inclusion (DM basis), no adverse effects were observed for carcass characteristics, while ADG was improved up to 4.1%, and F:G was improved up to 7.1%. These data suggest glycerin is a suit-able energy replacement in finishing diets containing steam-flaked corn.
1Justin P. Moore, graduate student; Galen E. Erickson, professor; Will A. Griffin, research technician, University of Nebraska–Lincoln Department of Animal Science; Stephanie R. Furman, research technician; Judson T. Vasconcelos, former assistant professor, Panhandle Research and Extension Center, Scottsbluff, Neb.; Todd Milton, Midwest PMS, Firestone, Colo.
was adjusted to a common dressing percentage of 63% and calculated from HCW. The carcass adjusted final BW was used to calculate ADG and F:G.
Data were analyzed using the
MIXED procedure of SAS (Version 9.1, SAS Inc., Cary, N.C.). The factors included in the model were glycerin inclusion and block, where the weight block was a fixed variable and initial BW was used as a co-variate. Orthog-
Table 3. Effects of glycerin on performance.
Glycerin P-value1
Item 0% 3% 6% 9% Linear Quadratic
Initial BW, lb 939ab 942ab 946b 935a 0.84 0.06Final BW, lb2 1331d 1340de 1349e 1349e 0.02 0.57DMI, lb/day 23.8b 24.0b 24.0b 23.1a 0.04 0.05ADG, lb 3.45d 3.52de 3.59e 3.59e 0.02 0.74F:G 6.90c 6.80bc 6.67b 6.41a < 0.01 0.25
1Orthogonal contrasts; no cubic response (P > 0.18).2HCW / 63% average dressing percentage.a,b,cMeans within rows differ (P < 0.05).d,eMeans within rows differ (P < 0.10).
Table 4. Effects of glycerin on carcass characteristics.
Glycerin P-value1
Item 0% 3% 6% 9% Linear Quadratic
HCW (lb) 836a 838ab 847b 845b 0.03 0.55Dressing (%) 62.8 62.7 62.9 62.7 0.95 0.8712th rib fat (in) 0.46 0.45 0.44 0.45 0.83 0.37LM area (sq in) 12.3 12.4 12.5 12.4 0.09 0.12USDA YG2 3.29 3.23 3.22 3.28 0.80 0.24Marbling3 560 558 568 554 0.92 0.36
Chi-Square
Choice and above (%) 4 86.1 83.1 85.7 82.5 0.82 Prime (%) 4 1.6 0.0 2.4 0.0 0.14 Upper choice (%) 4 7.8 3.9 5.6 2.4 0.22 Mid choice (%) 4 22.4 30.0 33.3 23.0 0.14 Lower choice (%) 4 54.2 49.2 44.4 57.1 0.19 Select (%) 4 14.0 16.9 14.3 17.5 0.82
1Orthogonal contrasts; no cubic response (P > 0.18).2Calculated Yield Grade = 2.5 + (2.5*12th rib fat, in) + (0.0038*HCW, lb) – (0.32*LM area, in2) + (0.2*KPH, %).3400 = slight 0; 500 = small 0.4Analyzed by chi-square.a,bMeans within rows differ (P < 0.10).
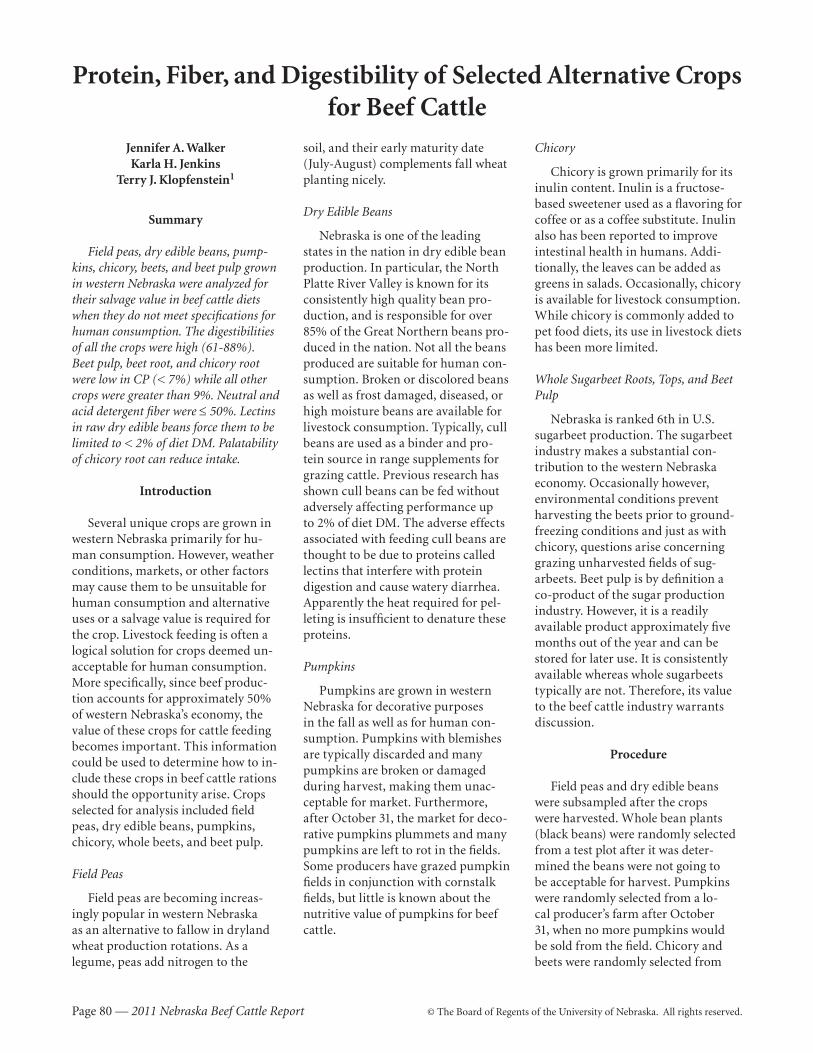
Page 80 — 2011 Nebraska Beef Cattle Report © The Board of Regents of the University of Nebraska. All rights reserved.
Protein, Fiber, and Digestibility of Selected Alternative Crops for Beef Cattle
Jennifer A. WalkerKarla H. Jenkins
Terry J. Klopfenstein1
Summary
Field peas, dry edible beans, pump-kins, chicory, beets, and beet pulp grown in western Nebraska were analyzed for their salvage value in beef cattle diets when they do not meet specifications for human consumption. The digestibilities of all the crops were high (61-88%). Beet pulp, beet root, and chicory root were low in CP (< 7%) while all other crops were greater than 9%. Neutral and acid detergent fiber were ≤ 50%. Lectins in raw dry edible beans force them to be limited to < 2% of diet DM. Palatability of chicory root can reduce intake.
Introduction
Several unique crops are grown in western Nebraska primarily for hu-man consumption. However, weather conditions, markets, or other factors may cause them to be unsuitable for human consumption and alternative uses or a salvage value is required for the crop. Livestock feeding is often a logical solution for crops deemed un-acceptable for human consumption. More specifically, since beef produc-tion accounts for approximately 50% of western Nebraska’s economy, the value of these crops for cattle feeding becomes important. This information could be used to determine how to in-clude these crops in beef cattle rations should the opportunity arise. Crops selected for analysis included field peas, dry edible beans, pumpkins, chicory, whole beets, and beet pulp.
Field Peas
Field peas are becoming increas-ingly popular in western Nebraska as an alternative to fallow in dryland wheat production rotations. As a legume, peas add nitrogen to the
soil, and their early maturity date (July-August) complements fall wheat planting nicely.
Dry Edible Beans
Nebraska is one of the leading states in the nation in dry edible bean production. In particular, the North Platte River Valley is known for its consistently high quality bean pro-duction, and is responsible for over 85% of the Great Northern beans pro-duced in the nation. Not all the beans produced are suitable for human con-sumption. Broken or discolored beans as well as frost damaged, diseased, or high moisture beans are available for livestock consumption. Typically, cull beans are used as a binder and pro-tein source in range supplements for grazing cattle. Previous research has shown cull beans can be fed without adversely affecting performance up to 2% of diet DM. The adverse effects associated with feeding cull beans are thought to be due to proteins called lectins that interfere with protein digestion and cause watery diarrhea. Apparently the heat required for pel-leting is insufficient to denature these proteins.
Pumpkins
Pumpkins are grown in western Nebraska for decorative purposes in the fall as well as for human con-sumption. Pumpkins with blemishes are typically discarded and many pumpkins are broken or damaged during harvest, making them unac-ceptable for market. Furthermore, after October 31, the market for deco-rative pumpkins plummets and many pumpkins are left to rot in the fields. Some producers have grazed pumpkin fields in conjunction with cornstalk fields, but little is known about the nutritive value of pumpkins for beef cattle.
Chicory
Chicory is grown primarily for its inulin content. Inulin is a fructose-based sweetener used as a flavoring for coffee or as a coffee substitute. Inulin also has been reported to improve intestinal health in humans. Addi-tionally, the leaves can be added as greens in salads. Occasionally, chicory is available for livestock consumption. While chicory is commonly added to pet food diets, its use in livestock diets has been more limited.
Whole Sugarbeet Roots, Tops, and Beet Pulp
Nebraska is ranked 6th in U.S. sugarbeet production. The sugarbeet industry makes a substantial con-tribution to the western Nebraska economy. Occasionally however, environmental conditions prevent harvesting the beets prior to ground-freezing conditions and just as with chicory, questions arise concerning grazing unharvested fields of sug-arbeets. Beet pulp is by definition a co-product of the sugar production industry. However, it is a readily available product approximately five months out of the year and can be stored for later use. It is consistently available whereas whole sugarbeets typically are not. Therefore, its value to the beef cattle industry warrants discussion.
Procedure
Field peas and dry edible beans were subsampled after the crops were harvested. Whole bean plants (black beans) were randomly selected from a test plot after it was deter-mined the beans were not going to be accep ta ble for harvest. Pumpkins were randomly selected from a lo-cal producer’s farm after October 31, when no more pumpkins would be sold from the field. Chicory and beets were randomly selected from
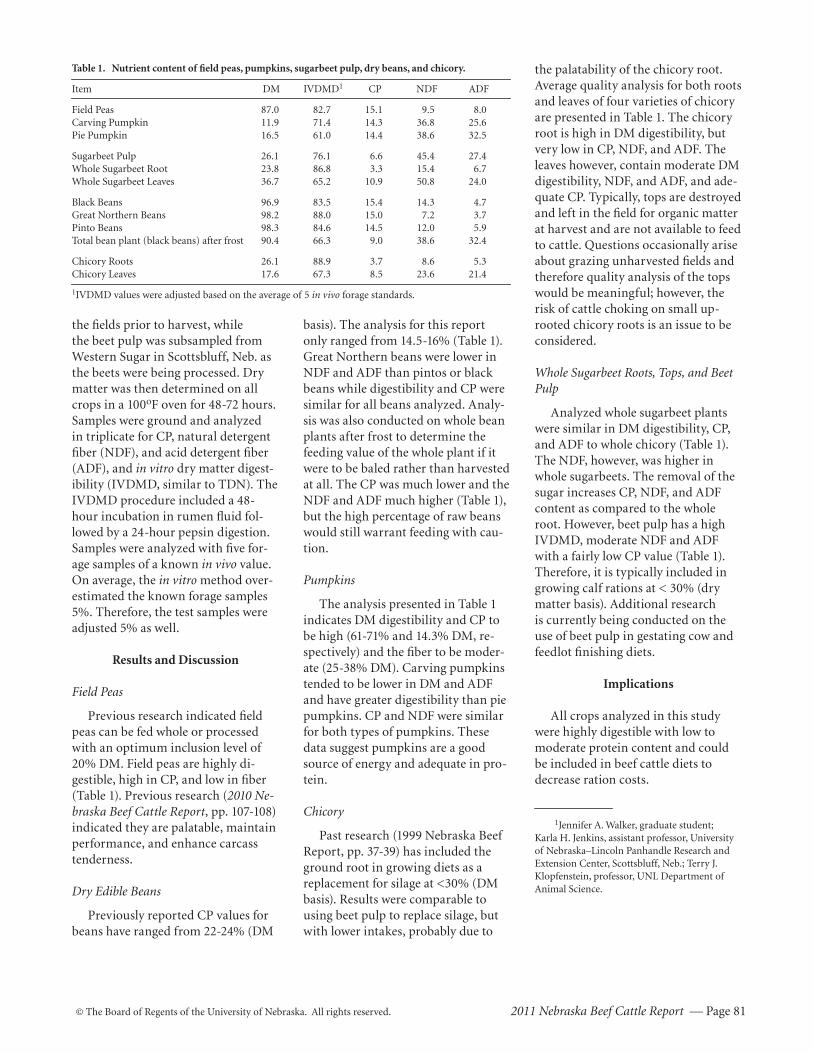
© The Board of Regents of the University of Nebraska. All rights reserved. 2011 Nebraska Beef Cattle Report — Page 81
the fields prior to harvest, while the beet pulp was subsampled from Western Sugar in Scottsbluff, Neb. as the beets were being processed. Dry matter was then determined on all crops in a 100oF oven for 48-72 hours. Samples were ground and analyzed in triplicate for CP, natural detergent fiber (NDF), and acid detergent fiber (ADF), and in vitro dry matter digest-ibility (IVDMD , similar to TDN). The IVDMD procedure included a 48-hour incubation in rumen fluid fol-lowed by a 24-hour pepsin digestion. Samples were analyzed with five for-age samples of a known in vivo value. On average, the in vitro method over-estimated the known forage samples 5%. Therefore, the test samples were adjusted 5% as well.
Results and Discussion
Field Peas
Previous research indicated field peas can be fed whole or processed with an optimum inclusion level of 20% DM. Field peas are highly di-gestible, high in CP, and low in fiber (Table 1). Previous research (2010 Ne-braska Beef Cattle Report, pp. 107-108) indicated they are palatable, maintain performance, and enhance carcass tenderness.
Dry Edible Beans
Previously reported CP values for beans have ranged from 22-24% (DM
basis). The analysis for this report only ranged from 14.5-16% (Table 1). Great Northern beans were lower in NDF and ADF than pintos or black beans while digestibility and CP were similar for all beans analyzed. Analy-sis was also conducted on whole bean plants after frost to determine the feeding value of the whole plant if it were to be baled rather than harvested at all. The CP was much lower and the NDF and ADF much higher (Table 1), but the high percentage of raw beans would still warrant feeding with cau-tion.
Pumpkins
The analysis presented in Table 1 indicates DM digestibility and CP to be high (61-71% and 14.3% DM, re-spectively) and the fiber to be moder-ate (25-38% DM). Carving pumpkins tended to be lower in DM and ADF and have greater digestibility than pie pumpkins. CP and NDF were similar for both types of pumpkins. These data suggest pumpkins are a good source of energy and adequate in pro-tein.
Chicory
Past research (1999 Nebraska Beef Report, pp. 37-39) has included the ground root in growing diets as a replacement for silage at <30% (DM basis). Results were comparable to using beet pulp to replace silage, but with lower intakes, probably due to
the palatability of the chicory root. Average quality analysis for both roots and leaves of four varieties of chicory are presented in Table 1. The chicory root is high in DM digestibility, but very low in CP, NDF, and ADF. The leaves however, contain moderate DM digestibility, NDF, and ADF, and ade-quate CP. Typically, tops are destroyed and left in the field for organic matter at harvest and are not available to feed to cattle. Questions occasionally arise about grazing unharvested fields and therefore quality analysis of the tops would be meaningful; however, the risk of cattle choking on small up-rooted chicory roots is an issue to be considered.
Whole Sugarbeet Roots, Tops, and Beet Pulp
Analyzed whole sugarbeet plants were similar in DM digestibility, CP, and ADF to whole chicory (Table 1). The NDF, however, was higher in whole sugarbeets. The removal of the sugar increases CP, NDF, and ADF content as compared to the whole root. However, beet pulp has a high IVDMD, moderate NDF and ADF with a fairly low CP value (Table 1). Therefore, it is typically included in growing calf rations at < 30% (dry matter basis). Additional research is currently being conducted on the use of beet pulp in gestating cow and feedlot finishing diets.
Implications
All crops analyzed in this study were highly digestible with low to moderate protein content and could be included in beef cattle diets to decrease ration costs.
1Jennifer A. Walker, graduate student; Karla H. Jenkins, assistant professor, University of Nebraska–Lincoln Panhandle Research and Extension Center, Scottsbluff, Neb.; Terry J. Klopfenstein, professor, UNL Department of Animal Science.
Table 1. Nutrient content of field peas, pumpkins, sugarbeet pulp, dry beans, and chicory.
Item DM IVDMD1 CP NDF ADF
Field Peas 87.0 82.7 15.1 9.5 8.0Carving Pumpkin 11.9 71.4 14.3 36.8 25.6Pie Pumpkin 16.5 61.0 14.4 38.6 32.5
Sugarbeet Pulp 26.1 76.1 6.6 45.4 27.4Whole Sugarbeet Root 23.8 86.8 3.3 15.4 6.7Whole Sugarbeet Leaves 36.7 65.2 10.9 50.8 24.0
Black Beans 96.9 83.5 15.4 14.3 4.7Great Northern Beans 98.2 88.0 15.0 7.2 3.7Pinto Beans 98.3 84.6 14.5 12.0 5.9Total bean plant (black beans) after frost 90.4 66.3 9.0 38.6 32.4
Chicory Roots 26.1 88.9 3.7 8.6 5.3Chicory Leaves 17.6 67.3 8.5 23.6 21.4
1IVDMD values were adjusted based on the average of 5 in vivo forage standards.
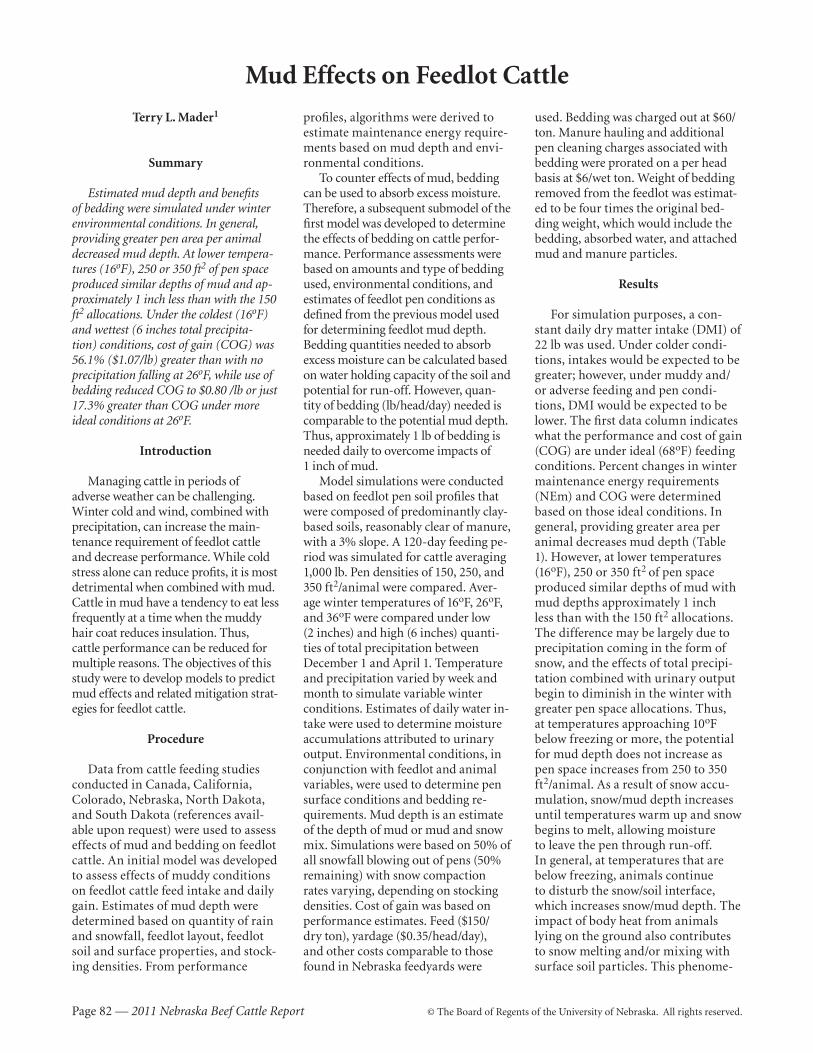
Page 82 — 2011 Nebraska Beef Cattle Report © The Board of Regents of the University of Nebraska. All rights reserved.
Mud Effects on Feedlot Cattle
Terry L. Mader1
Summary
Estimated mud depth and benefits of bedding were simulated under winter environmental conditions. In general, providing greater pen area per animal decreased mud depth. At lower tempera-tures (16oF), 250 or 350 ft2 of pen space produced similar depths of mud and ap-proximately 1 inch less than with the 150 ft2 allocations. Under the coldest (16oF) and wettest (6 inches total precipita-tion) conditions, cost of gain (COG) was 56.1% ($1.07/lb) greater than with no precipitation falling at 26oF, while use of bedding reduced COG to $0.80 /lb or just 17.3% greater than COG under more ideal conditions at 26oF.
Introduction
Managing cattle in periods of adverse weather can be challenging. Winter cold and wind, combined with precipitation, can increase the main-tenance requirement of feedlot cattle and decrease performance. While cold stress alone can reduce profits, it is most detrimental when combined with mud. Cattle in mud have a tendency to eat less frequently at a time when the muddy hair coat reduces insulation. Thus, cattle performance can be reduced for multiple reasons. The objectives of this study were to develop models to predict mud effects and related mitigation strat-egies for feedlot cattle.
Procedure
Data from cattle feeding studies conducted in Canada, California, Colorado, Nebraska, North Dakota, and South Dakota (references avail-able upon request) were used to assess effects of mud and bedding on feedlot cattle. An initial model was developed to assess effects of muddy conditions on feedlot cattle feed intake and daily gain. Estimates of mud depth were determined based on quantity of rain and snowfall, feedlot layout, feedlot soil and surface properties, and stock-ing densities. From performance
used. Bedding was charged out at $60/ton. Manure hauling and additional pen cleaning charges associated with bedding were prorated on a per head basis at $6/wet ton. Weight of bedding removed from the feedlot was estimat-ed to be four times the original bed-ding weight, which would include the bedding, absorbed water, and attached mud and manure particles.
Results
For simulation purposes, a con-stant daily dry matter intake (DMI) of 22 lb was used. Under colder condi-tions, intakes would be expected to be greater; however, under muddy and/or adverse feeding and pen condi-tions, DMI would be expected to be lower. The first data column indicates what the performance and cost of gain (COG) are under ideal (68oF) feeding conditions. Percent changes in winter maintenance energy requirements (NEm) and COG were determined based on those ideal conditions. In general, providing greater area per animal decreases mud depth (Table 1). However, at lower temperatures (16oF), 250 or 350 ft2 of pen space produced similar depths of mud with mud depths approximately 1 inch less than with the 150 ft2 allocations. The difference may be largely due to precipitation coming in the form of snow, and the effects of total precipi-tation combined with urinary output begin to diminish in the winter with greater pen space allocations. Thus, at temperatures approaching 10oF below freezing or more, the potential for mud depth does not increase as pen space increases from 250 to 350 ft2/animal. As a result of snow accu-mulation, snow/mud depth increases until temperatures warm up and snow begins to melt, allowing moisture to leave the pen through run-off. In general, at temperatures that are below freezing, animals continue to disturb the snow/soil interface, which increases snow/mud depth. The impact of body heat from animals lying on the ground also contributes to snow melting and/or mixing with surface soil particles. This phenome-
profiles, algorithms were derived to estimate maintenance energy require-ments based on mud depth and envi-ronmental conditions.
To counter effects of mud, bedding can be used to absorb excess moisture. Therefore, a subsequent submodel of the first model was developed to determine the effects of bedding on cattle perfor-mance. Performance assessments were based on amounts and type of bedding used, environmental conditions, and estimates of feedlot pen conditions as defined from the previous model used for determining feedlot mud depth. Bedding quantities needed to absorb excess moisture can be calculated based on water holding capacity of the soil and potential for run-off. However, quan-tity of bedding (lb/head/day) needed is comparable to the potential mud depth. Thus, approximately 1 lb of bedding is needed daily to overcome impacts of 1 inch of mud.
Model simulations were conducted based on feedlot pen soil profiles that were composed of predominantly clay-based soils, reasonably clear of manure, with a 3% slope. A 120-day feeding pe-riod was simulated for cattle averaging 1,000 lb. Pen densities of 150, 250, and 350 ft2/animal were compared. Aver-age winter temperatures of 16oF, 26oF, and 36oF were compared under low (2 inches) and high (6 inches) quanti-ties of total precipitation between December 1 and April 1. Temperature and precipitation varied by week and month to simulate variable winter conditions. Estimates of daily water in-take were used to determine moisture accumulations attributed to urinary output. Environmental conditions, in conjunction with feedlot and animal variables, were used to determine pen surface conditions and bedding re-quirements. Mud depth is an estimate of the depth of mud or mud and snow mix. Simulations were based on 50% of all snowfall blowing out of pens (50% remaining) with snow compaction rates varying, depending on stocking densities. Cost of gain was based on performance estimates. Feed ($150/dry ton), yardage ($0.35/head/day), and other costs comparable to those found in Nebraska feedyards were
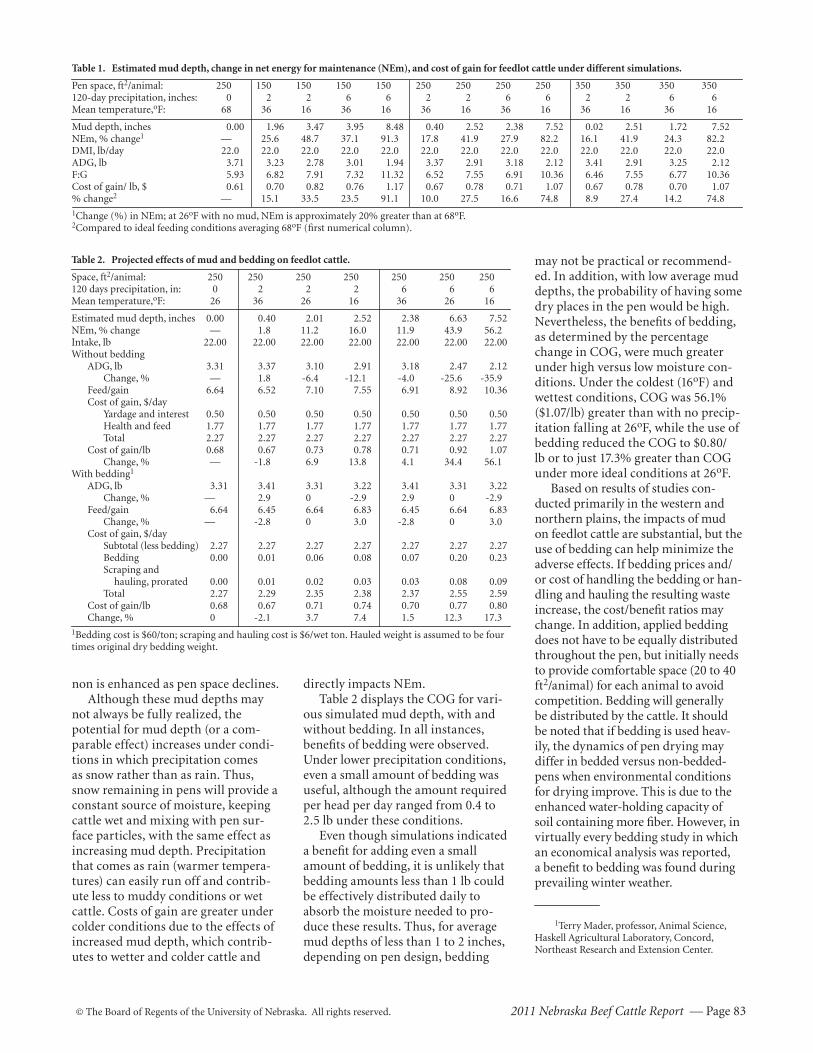
© The Board of Regents of the University of Nebraska. All rights reserved. 2011 Nebraska Beef Cattle Report — Page 83
may not be practical or recommend-ed. In addition, with low average mud depths, the probability of having some dry places in the pen would be high. Nevertheless, the benefits of bedding , as determined by the percentage change in COG, were much greater under high versus low moisture con-ditions. Under the coldest (16oF) and wettest conditions, COG was 56.1% ($1.07/lb) greater than with no precip-itation falling at 26oF, while the use of bedding reduced the COG to $0.80/lb or to just 17.3% greater than COG under more ideal conditions at 26oF.
Based on results of studies con-ducted primarily in the western and northern plains, the impacts of mud on feedlot cattle are substantial, but the use of bedding can help minimize the adverse effects. If bedding prices and/or cost of handling the bedding or han-dling and hauling the resulting waste increase, the cost/benefit ratios may change. In addition, applied bedding does not have to be equally distributed throughout the pen, but initially needs to provide comfortable space (20 to 40 ft2/animal) for each animal to avoid competition. Bedding will generally be distributed by the cattle. It should be noted that if bedding is used heav-ily, the dynamics of pen drying may differ in bedded versus non-bedded-pens when environmental conditions for drying improve. This is due to the enhanced water-holding capacity of soil containing more fiber. However, in virtually every bedding study in which an economical analysis was reported, a benefit to bedding was found during prevailing winter weather.
1Terry Mader, professor, Animal Science, Haskell Agricultural Laboratory, Concord, Northeast Research and Extension Center.
Table 1. Estimated mud depth, change in net energy for maintenance (NEm), and cost of gain for feedlot cattle under different simulations.
Pen space, ft2/animal: 250 150 150 150 150 250 250 250 250 350 350 350 350120-day precipitation, inches: 0 2 2 6 6 2 2 6 6 2 2 6 6Mean temperature,oF: 68 36 16 36 16 36 16 36 16 36 16 36 16
Mud depth, inches 0.00 1.96 3.47 3.95 8.48 0.40 2.52 2.38 7.52 0.02 2.51 1.72 7.52NEm, % change1 — 25.6 48.7 37.1 91.3 17.8 41.9 27.9 82.2 16.1 41.9 24.3 82.2DMI, lb/day 22.0 22.0 22.0 22.0 22.0 22.0 22.0 22.0 22.0 22.0 22.0 22.0 22.0ADG, lb 3.71 3.23 2.78 3.01 1.94 3.37 2.91 3.18 2.12 3.41 2.91 3.25 2.12F:G 5.93 6.82 7.91 7.32 11.32 6.52 7.55 6.91 10.36 6.46 7.55 6.77 10.36Cost of gain/ lb, $ 0.61 0.70 0.82 0.76 1.17 0.67 0.78 0.71 1.07 0.67 0.78 0.70 1.07% change2 — 15.1 33.5 23.5 91.1 10.0 27.5 16.6 74.8 8.9 27.4 14.2 74.81Change (%) in NEm; at 26oF with no mud, NEm is approximately 20% greater than at 68oF.2Compared to ideal feeding conditions averaging 68oF (first numerical column).
Table 2. Projected effects of mud and bedding on feedlot cattle.
Space, ft2/animal: 250 250 250 250 250 250 250120 days precipitation, in: 0 2 2 2 6 6 6Mean temperature,oF: 26 36 26 16 36 26 16
Estimated mud depth, inches 0.00 0.40 2.01 2.52 2.38 6.63 7.52NEm, % change — 1.8 11.2 16.0 11.9 43.9 56.2Intake, lb 22.00 22.00 22.00 22.00 22.00 22.00 22.00Without bedding ADG, lb 3.31 3.37 3.10 2.91 3.18 2.47 2.12 Change, % — 1.8 -6.4 -12.1 -4.0 -25.6 -35.9 Feed/gain 6.64 6.52 7.10 7.55 6.91 8.92 10.36 Cost of gain, $/day Yardage and interest 0.50 0.50 0.50 0.50 0.50 0.50 0.50 Health and feed 1.77 1.77 1.77 1.77 1.77 1.77 1.77 Total 2.27 2.27 2.27 2.27 2.27 2.27 2.27 Cost of gain/lb 0.68 0.67 0.73 0.78 0.71 0.92 1.07 Change, % — -1.8 6.9 13.8 4.1 34.4 56.1With bedding1
ADG, lb 3.31 3.41 3.31 3.22 3.41 3.31 3.22 Change, % — 2.9 0 -2.9 2.9 0 -2.9 Feed/gain 6.64 6.45 6.64 6.83 6.45 6.64 6.83 Change, % — -2.8 0 3.0 -2.8 0 3.0 Cost of gain, $/day Subtotal (less bedding) 2.27 2.27 2.27 2.27 2.27 2.27 2.27 Bedding 0.00 0.01 0.06 0.08 0.07 0.20 0.23 Scraping and hauling, prorated 0.00 0.01 0.02 0.03 0.03 0.08 0.09 Total 2.27 2.29 2.35 2.38 2.37 2.55 2.59 Cost of gain/lb 0.68 0.67 0.71 0.74 0.70 0.77 0.80 Change, % 0 -2.1 3.7 7.4 1.5 12.3 17.31Bedding cost is $60/ton; scraping and hauling cost is $6/wet ton. Hauled weight is assumed to be four times original dry bedding weight.
non is enhanced as pen space declines.Although these mud depths may
not always be fully realized, the potential for mud depth (or a com-parable effect) increases under condi-tions in which precipitation comes as snow rather than as rain. Thus, snow remaining in pens will provide a constant source of moisture, keeping cattle wet and mixing with pen sur-face particles, with the same effect as increasing mud depth. Precipitation that comes as rain (warmer tempera-tures) can easily run off and contrib-ute less to muddy conditions or wet cattle. Costs of gain are greater under colder conditions due to the effects of increased mud depth, which contrib-utes to wetter and colder cattle and
directly impacts NEm.Table 2 displays the COG for vari-
ous simulated mud depth, with and without bedding. In all instances, benefits of bedding were observed. Under lower precipitation conditions, even a small amount of bedding was useful, although the amount required per head per day ranged from 0.4 to 2.5 lb under these conditions.
Even though simulations indicated a benefit for adding even a small amount of bedding, it is unlikely that bedding amounts less than 1 lb could be effectively distributed daily to absorb the moisture needed to pro-duce these results. Thus, for average mud depths of less than 1 to 2 inches, depending on pen design, bedding
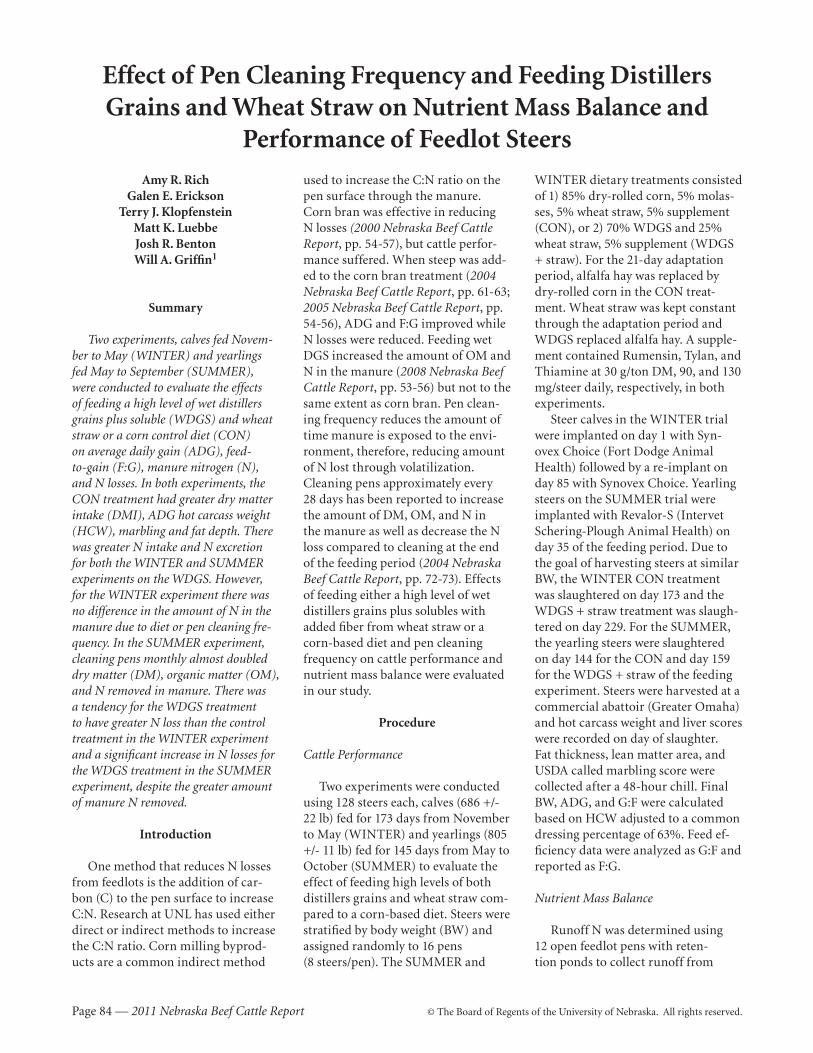
Page 84 — 2011 Nebraska Beef Cattle Report © The Board of Regents of the University of Nebraska. All rights reserved.
Effect of Pen Cleaning Frequency and Feeding Distillers Grains and Wheat Straw on Nutrient Mass Balance and
Performance of Feedlot Steers
used to increase the C:N ratio on the pen surface through the manure. Corn bran was effective in reducing N losses (2000 Nebraska Beef Cattle Report, pp. 54-57), but cattle perfor-mance suffered. When steep was add-ed to the corn bran treatment (2004 Nebraska Beef Cattle Report, pp. 61-63; 2005 Nebraska Beef Cattle Report, pp. 54-56), ADG and F:G improved while N losses were reduced. Feeding wet DGS increased the amount of OM and N in the manure (2008 Nebraska Beef Cattle Report, pp. 53-56) but not to the same extent as corn bran. Pen clean-ing frequency reduces the amount of time manure is exposed to the envi-ronment, therefore, reducing amount of N lost through volatilization. Cleaning pens approximately every 28 days has been reported to increase the amount of DM, OM, and N in the manure as well as decrease the N loss compared to cleaning at the end of the feeding period (2004 Nebraska Beef Cattle Report, pp. 72-73). Effects of feeding either a high level of wet distillers grains plus solubles with added fiber from wheat straw or a corn-based diet and pen cleaning frequency on cattle performance and nutrient mass balance were evaluated in our study.
Procedure
Cattle Performance
Two experiments were conducted using 128 steers each, calves (686 +/- 22 lb) fed for 173 days from November to May (WINTER) and yearlings (805 +/- 11 lb) fed for 145 days from May to October (SUMMER) to evaluate the effect of feeding high levels of both distillers grains and wheat straw com-pared to a corn-based diet. Steers were stratified by body weight (BW) and assigned randomly to 16 pens (8 steers/pen). The SUMMER and
WINTER dietary treatments consisted of 1) 85% dry-rolled corn, 5% molas-ses, 5% wheat straw, 5% supplement (CON), or 2) 70% WDGS and 25% wheat straw, 5% supplement (WDGS + straw). For the 21-day adaptation period, alfalfa hay was replaced by dry-rolled corn in the CON treat-ment . Wheat straw was kept constant through the adaptation period and WDGS replaced alfalfa hay. A supple-ment contained Rumensin, Tylan, and Thiamine at 30 g/ton DM, 90, and 130 mg/steer daily, respectively, in both experiments.
Steer calves in the WINTER trial were implanted on day 1 with Syn-ovex Choice (Fort Dodge Animal Health) followed by a re-implant on day 85 with Synovex Choice. Yearling steers on the SUMMER trial were implanted with Revalor-S (Intervet Schering-Plough Animal Health) on day 35 of the feeding period. Due to the goal of harvesting steers at similar BW, the WINTER CON treatment was slaughtered on day 173 and the WDGS + straw treatment was slaugh-tered on day 229. For the SUMMER, the yearling steers were slaughtered on day 144 for the CON and day 159 for the WDGS + straw of the feeding experiment. Steers were harvested at a commercial abattoir (Greater Omaha) and hot carcass weight and liver scores were recorded on day of slaughter. Fat thickness, lean matter area, and USDA called marbling score were collected after a 48-hour chill. Final BW, ADG, and G:F were calculated based on HCW adjusted to a common dressing percentage of 63%. Feed ef-ficiency data were analyzed as G:F and reported as F:G.
Nutrient Mass Balance
Runoff N was determined using 12 open feedlot pens with reten-tion ponds to collect runoff from
Amy R. RichGalen E. Erickson
Terry J. KlopfensteinMatt K. LuebbeJosh R. BentonWill A. Griffin1
Summary
Two experiments, calves fed Novem-ber to May (WINTER) and yearlings fed May to September (SUMMER), were conducted to evaluate the effects of feeding a high level of wet distillers grains plus soluble (WDGS) and wheat straw or a corn control diet (CON) on average daily gain (ADG), feed-to-gain (F:G), manure nitrogen (N), and N losses. In both experiments, the CON treatment had greater dry matter intake (DMI), ADG hot carcass weight (HCW), marbling and fat depth. There was greater N intake and N excretion for both the WINTER and SUMMER experiments on the WDGS. However, for the WINTER experiment there was no difference in the amount of N in the manure due to diet or pen cleaning fre-quency. In the SUMMER experiment, cleaning pens monthly almost doubled dry matter (DM), organic matter (OM), and N removed in manure. There was a tendency for the WDGS treatment to have greater N loss than the control treatment in the WINTER experiment and a significant increase in N losses for the WDGS treatment in the SUMMER experiment, despite the greater amount of manure N removed.
Introduction
One method that reduces N losses from feedlots is the addition of car-bon (C) to the pen surface to increase C:N. Research at UNL has used either direct or indirect methods to increase the C:N ratio. Corn milling byprod-ucts are a common indirect method
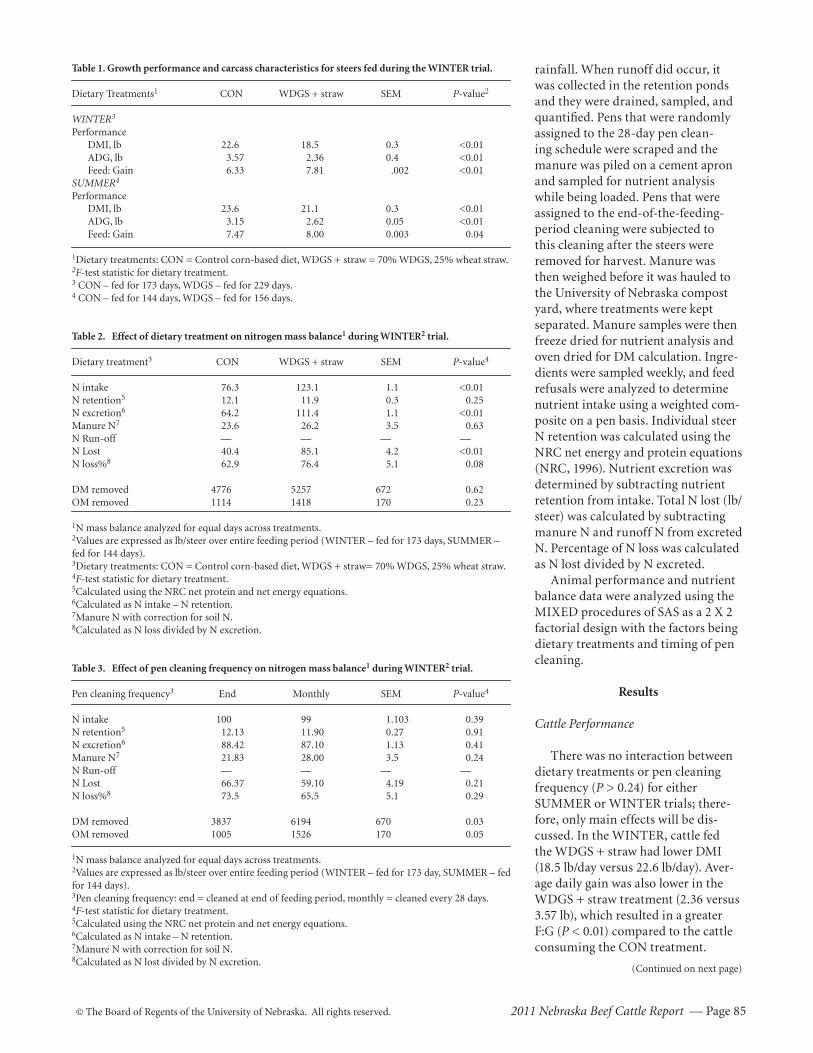
© The Board of Regents of the University of Nebraska. All rights reserved. 2011 Nebraska Beef Cattle Report — Page 85
(Continued on next page)
Table 1. Growth performance and carcass characteristics for steers fed during the WINTER trial.
Dietary Treatments1 CON WDGS + straw SEM P-value2
WINTER3 Performance DMI, lb 22.6 18.5 0.3 <0.01 ADG, lb 3.57 2.36 0.4 <0.01 Feed: Gain 6.33 7.81 .002 <0.01SUMMER4 Performance DMI, lb 23.6 21.1 0.3 <0.01 ADG, lb 3.15 2.62 0.05 <0.01 Feed: Gain 7.47 8.00 0.003 0.04
1Dietary treatments: CON = Control corn-based diet, WDGS + straw = 70% WDGS, 25% wheat straw.2F-test statistic for dietary treatment.3 CON – fed for 173 days, WDGS – fed for 229 days.4 CON – fed for 144 days, WDGS – fed for 156 days.
Table 2. Effect of dietary treatment on nitrogen mass balance1 during WINTER2 trial.
Dietary treatment3 CON WDGS + straw SEM P-value4
N intake 76.3 123.1 1.1 <0.01N retention5 12.1 11.9 0.3 0.25N excretion6 64.2 111.4 1.1 <0.01Manure N7 23.6 26.2 3.5 0.63N Run-off — — — —N Lost 40.4 85.1 4.2 <0.01N loss%8 62.9 76.4 5.1 0.08 DM removed 4776 5257 672 0.62OM removed 1114 1418 170 0.23
1N mass balance analyzed for equal days across treatments.2Values are expressed as lb/steer over entire feeding period (WINTER – fed for 173 days, SUMMER – fed for 144 days).3Dietary treatments: CON = Control corn-based diet, WDGS + straw= 70% WDGS, 25% wheat straw.4F-test statistic for dietary treatment.5Calculated using the NRC net protein and net energy equations.6Calculated as N intake – N retention.7Manure N with correction for soil N.8Calculated as N loss divided by N excretion.
Table 3. Effect of pen cleaning frequency on nitrogen mass balance1 during WINTER2 trial.
Pen cleaning frequency3 End Monthly SEM P-value4
N intake 100 99 1.103 0.39N retention5 12.13 11.90 0.27 0.91N excretion6 88.42 87.10 1.13 0.41Manure N7 21.83 28.00 3.5 0.24N Run-off — — — —N Lost 66.37 59.10 4.19 0.21N loss%8 73.5 65.5 5.1 0.29 DM removed 3837 6194 670 0.03OM removed 1005 1526 170 0.05
1N mass balance analyzed for equal days across treatments.2Values are expressed as lb/steer over entire feeding period (WINTER – fed for 173 day, SUMMER – fed for 144 days).3Pen cleaning frequency: end = cleaned at end of feeding period, monthly = cleaned every 28 days.4F-test statistic for dietary treatment.5Calculated using the NRC net protein and net energy equations.6Calculated as N intake – N retention.7Manure N with correction for soil N.8Calculated as N lost divided by N excretion.
rainfall. When runoff did occur, it was collected in the retention ponds and they were drained, sampled, and quantified. Pens that were randomly assigned to the 28-day pen clean-ing schedule were scraped and the manure was piled on a cement apron and sampled for nutrient analysis while being loaded. Pens that were assigned to the end-of-the-feeding-period cleaning were subjected to this cleaning after the steers were removed for harvest. Manure was then weighed before it was hauled to the University of Nebraska compost yard, where treatments were kept separated. Manure samples were then freeze dried for nutrient analysis and oven dried for DM calculation. Ingre-dients were sampled weekly, and feed refusals were analyzed to determine nutrient intake using a weighted com-posite on a pen basis. Individual steer N retention was calculated using the NRC net energy and protein equations (NRC, 1996). Nutrient excretion was determined by subtracting nutrient retention from intake. Total N lost (lb/steer) was calculated by subtracting manure N and runoff N from excreted N. Percentage of N loss was calculated as N lost divided by N excreted.
Animal performance and nutrient balance data were analyzed using the MIXED procedures of SAS as a 2 X 2 factorial design with the factors being dietary treatments and timing of pen cleaning.
Results
Cattle Performance
There was no interaction between dietary treatments or pen cleaning frequency (P > 0.24) for either SUMMER or WINTER trials; there-fore, only main effects will be dis-cussed. In the WINTER, cattle fed the WDGS + straw had lower DMI (18.5 lb/day versus 22.6 lb/day). Aver-age daily gain was also lower in the WDGS + straw treatment (2.36 versus 3.57 lb), which resulted in a greater F:G (P < 0.01) compared to the cattle consuming the CON treatment.

Page 86 — 2011 Nebraska Beef Cattle Report © The Board of Regents of the University of Nebraska. All rights reserved.
Cattle fed during the SUMMER trial had similar performance results as the WINTER calf-feds. Intake was lower for the WDGS + straw treatment (P < 0.01) as well as ADG (P < 0.01), which resulted in a higher F:G (8.00 lb versus 7.47 lb (P = 0.04)). This lower performance (Table 1) for the WDGS + straw treatment is most likely due to the high inclusion of wheat straw in the diet, which was added to help increase the amount of OM on the pen surface and prevent sulfur-related polio-encephalomalacia (2009 Nebraska Beef Cattle Report, pp. 79-80).
Nutrient Balance
There was no interaction between dietary treatments or pen cleaning frequency (P > 0.10) for either SUM-MER or WINTER trials; therefore, only main effects will be discussed.
Steers fed during the WINTER had greater N intake and N excretion when consuming the WDGS + straw treatment (P <0.01, Table 2). How-ever, manure N was similar for the CON and WDGS + straw treatments. Therefore, because WDGS + straw calves excreted more N with the same amount in manure as the CON calves, the calves consuming the WDGS + straw had greater N losses (P < 0.01). There was a tendency (P = 0.08) for the WDGS + straw steers to have a greater N loss (76.4% vs. 62.9%) when expressed as a percentage of N excreted. There was not enough pre-cipitation during the WINTER trial to generate runoff. The dry matter and OM removed were similar across dietary treatments (P > 0.10). Amount of DM removed was greater for pens cleaned monthly compared to those cleaned at the end of the feeding pe-riod (P = 0.03) (Table 3).
Steers on trial in the SUMMER consuming the WDGS + straw had greater (P<0.01) N intake and N excretion , due to excess CP with the WDGS + straw treatment compared to the CON treatment (24% versus 12%, Table 4). Runoff N was not impacted (P = 0.28) by either dietary treatments or pen cleaning frequency; however, there was almost double the
Table 4. Effect of dietary treatment on nitrogen mass balance1 during SUMMER2 trial.
Dietary treatment3 CON WDGS + straw SEM P-value4
N intake 63.8 115.1 1.1 <0.01N retention5 8.8 8.4 0.1 0.02N excretion6 55.0 106.7 1.1 <0.01Manure N7 17.4 31.7 1.7 <0.01N Runoff 1.9 2.3 0.63 0.64N Lost 33.5 69.9 2.2 <0.01N loss%8 60.9 65.5 2.5 <0.01DM removed 7784 12287 947 <0.01OM removed 1160 2317 98 <0.01
1N mass balance analyzed for equal days across treatments.2Values are expressed as lb/steer over entire feeding period (WINTER – fed for 173 days, SUMMER – fed for 144 days).3Dietary treatments: CON = Control corn-based diet, WDGS + straw= 70% WDGS, 25% wheat straw.4F-test statistic for dietary treatment.5Calculated using the NRC net protein and net energy equations.6Calculated as N intake – N retention.7Manure N with correction for soil N.8Calculated as N loss divided by N excretion.
Table 5. Effect of pen cleaning frequency on nitrogen mass balance1 during SUMMER1.
Pen cleaning frequency2 End Monthly SEM P-value3
N intake 90 89 0.68 0.68N retention4 8.56 8.60 0.79 0.91N excretion5 81.21 80.50 0.13 0.79Manure N6 16.82 32.26 1.70 <0.01N Run-off 3.51 5.76 1.39 0.28N Lost 60.92 42.47 2.21 <0.01N lost%7 164.6 114.06 5.53 <0.01DM removed 6090 13981 941 <0.01OM removed 1252 2225 98 <0.01
1Values are expressed as lb/steer over entire feeding period (WINTER – fed for 173 days, SUMMER – fed for 144 days).2Pen cleaning frequency: end = cleaned at end of feeding period, monthly = cleaned every 28 days.3F-test statistic for dietary treatment.4Calculated using the NRC net protein and net energy equations.5Calculated as N intake – N retention.6Manure N with correction for soil N.7Calculated as N lost divided by N excretion.
amount of manure N, DM, and OM removed for the steers consuming the WDGS + straw compared to the CON (P < 0.01). Table 5 reports the pen cleaning frequency results. Monthly pen cleaning also almost doubled (P < 0.01) the amount of N, DM, and OM removed in the manure. Despite increases in manure N, N losses were greater (P < 0.01) for the WDGS + straw compared to the CON treatment. Cleaning pens monthly decreased (P < 0.01) N losses by 8.4 lb or 50.5% compared to cleaning at the end of the feeding period. Runoff N did not constitute much of what was excreted, resulting in 3.5% of N excreted for the CON treatment and
2.2% for the WDGS + straw. These data indicate feeding 70%
WDGS with 25% wheat straw does decrease DMI, ADG, and F:G year around. Feeding WDGS at 70% diet DM increased N intake and N excretion due to the high concentration of CP in the byproduct. Cleaning feedlot pens monthly does increase total amount of manure removed, but there is also a greater amount of OM and N removed.
1Amy R. Rich, graduate student; Galen E. Erickson, professor; Terry J. Klopfenstein, professor; Matt K. Luebbe, research technician; Josh R. Benton, research technician; Will A. Griffin, research technician, University of Nebraska–Lincoln Department of Animal Science.

© The Board of Regents of the University of Nebraska. All rights reserved. 2011 Nebraska Beef Cattle Report — Page 87
Relationship Between Morbidity and Performancein Feedlot Cattle
Galen E. EricksonVirgil R. Bremer
Terry J. KlopfensteinDavid R. Smith
Kathy J. HanfordRobert E. Peterson
Luis O. Burciaga-RoblesDan B. Faulkner
Clint R. Krehbiel1
Summary
Five datasets from Canada, Okla-homa, Illinois, and Nebraska were used to determine the impact of bovine respi-ratory disease (BRD) on performance, with emphasis on dry matter intake (DMI) and feed to gain ratio (F:G). Data included pens and individually fed cattle. In general, cattle treated for BRD had lower DMI and average daily gain (ADG) with little to no effect on F:G. When BRD occured early in the feeding period (<30 days), little change in per-formance was observed.
Introduction
A common perception is that bovine respiratory disease (BRD) causes a depression in ADG and presumably feed efficiency. Pen level research supports the conclusion that cattle within pens treated for BRD have lower ADG compared to healthy pen mates and lighter carcasses when the pen is marketed at one time. These cattle also tend to be leaner and have less marbling. However, it is not clear when ADG is decreased whether DMI is impacted because individual DMI is not measured within feedlot pens. It is also unclear whether feeding those cattle treated for BRD longer would improve carcass weight and quality to match healthy pen mates. Likewise, whether the cause of decreased carcass quality is due to BRD or depressed ADG is unknown. It seems reason-able that cattle contracting BRD later in the feeding period would be more
negatively impacted compared to steers contracting BRD at receiving or early in the feeding period. Therefore, the objective of this compilation of research is to determine the impact of BRD on ADG, DMI, and F:G of finishing cattle using both pen and individual feeding trials.
Procedure
Data from two commercial feedlots in Alberta, Canada (Western Feedlots) were obtained to evaluate impact of BRD on performance. Incidence of BRD across these lots varied from 0 to 70% throughout the entire feeding pe-riod. The effect of percentage of cattle in a pen treated for BRD on lot close-out DMI, ADG, and F:G were evalu-ated with n = 978 lots (276, 116 cattle) finished at two Alberta, Canada feedlots in 2007 and 2008. Lots in the dataset had 0 to 70% pen incidence of BRD, and all lots contained greater than 100 cattle. Lots were categorized by < 5%, 5-10%, 10-15%, 15-20%, 20-25%, 25-30%, 30-35%, or > 35% of cattle in the lot treated for BRD and analyzed for linear and quadratic response in lot performance as BRD incidence increased. A subset of these cattle (n = 33,074 cattle) had individ-ual carcass data linked to individual steer within each lot so performance and BRD treatment could be matched with carcass data. The carcass data were used to evaluate effects of cattle being treated zero, one, or two or more times for BRD on linear and quadratic responses of cattle gain and carcass characteristics.
The effect of days on feed at BRD treatment on individual animal DMI, ADG, and F:G was evaluated with three datasets. Two datasets included individually fed growing (n = 900; 16% BRD treatment) and finishing (n = 987; 19% BRD treatment) cattle fed at the University of Nebraska–Lincoln ARDC Feedlot. Cattle were housed in confinement barns contain-
ing 30 cattle each with individual DMI collected using Calan gates. Each ani-mal had access to an individual bunk and a common water source within barn. Individual cattle performance was also analyzed with a third dataset of 1,940 individual finishing cattle with 10% average incidence of BRD fed over four years at the University of Illinois-Urbana GrowSafe facility. Steers were housed on indoor slatted pens of 8-40 steers each with common bunks and water sources within pen. Categories in all three datasets included no treat-ment, BRD treatment < 30 days on trial, and BRD treatment > 30 days on trial. An individual animal could only be classified in one of the categories. Category priority was given to the treatment closest to completion of the trial. Initial BW was used as a covari-ate, and the random effects of dietary treatment within trial and pen effects also were accounted for. The categori-cal data were analyzed with the Proc GLIMMIX procedures of SAS (SAS Inc., Cary, NC). Feed efficiency (G:F) was used for statistical analyses, but has been converted to F:G in data sum-maries. Because of unequal replica-tions within BRD categories, standard errors are reported by category instead of pooled errors. When appropriate (i.e., differences in significance are observed), initial BW was used as a covariate to correct for differences in performance due to lighter starting BW and isolate the impact of BRD on performance.
Results
When cattle were categorized for BRD incidence by lot in commercial feedlots, DMI and ADG of the lot were impacted (P < 0.001) by the percentage within the pen that had been treated for BRD (and presumably contracted BRD). This impact was independent of initial BW, which was used as a co-variate. Table 1 illustrates that as more
(Continued on next page)
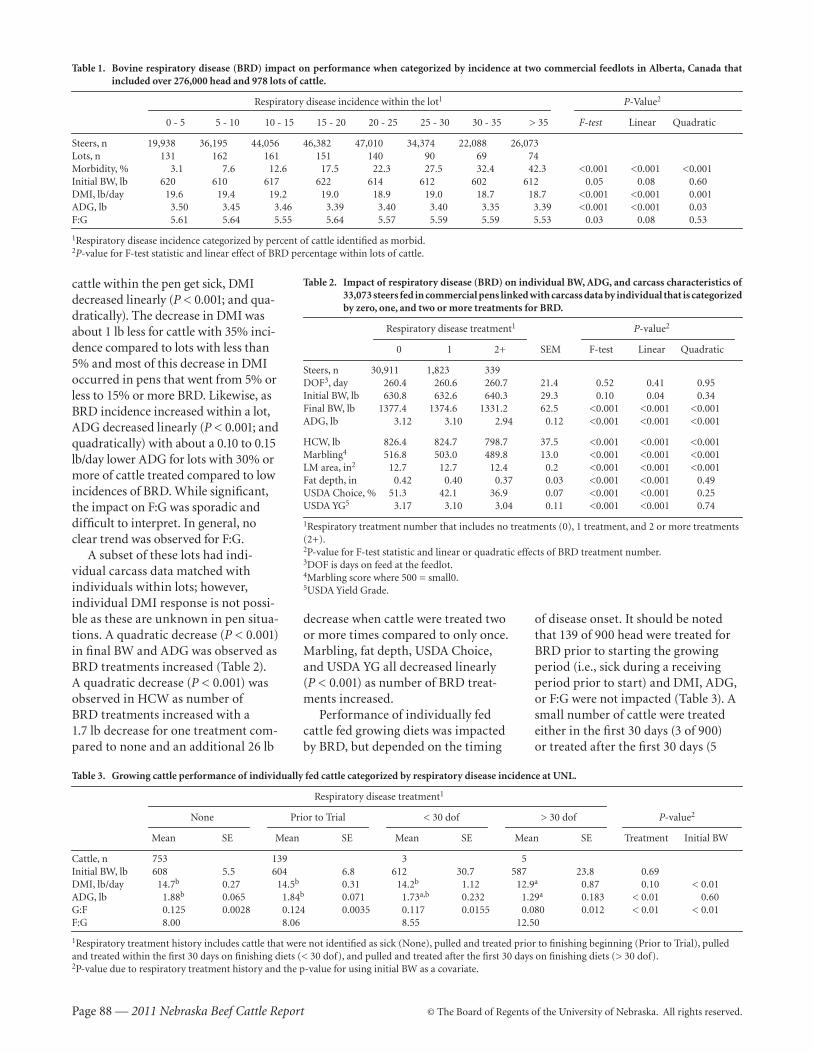
Page 88 — 2011 Nebraska Beef Cattle Report © The Board of Regents of the University of Nebraska. All rights reserved.
cattle within the pen get sick, DMI decreased linearly (P < 0.001; and qua-dratically). The decrease in DMI was about 1 lb less for cattle with 35% inci-dence compared to lots with less than 5% and most of this decrease in DMI occurred in pens that went from 5% or less to 15% or more BRD. Likewise, as BRD incidence increased within a lot, ADG decreased linearly (P < 0.001; and quadratically) with about a 0.10 to 0.15 lb/day lower ADG for lots with 30% or more of cattle treated compared to low incidences of BRD. While significant, the impact on F:G was sporadic and difficult to interpret. In general, no clear trend was observed for F:G.
A subset of these lots had indi-vidual carcass data matched with individuals within lots; however, individual DMI response is not possi-ble as these are unknown in pen situa-tions. A quadratic decrease (P < 0.001) in final BW and ADG was observed as BRD treatments increased (Table 2). A quadratic decrease (P < 0.001) was observed in HCW as number of BRD treatments increased with a 1.7 lb decrease for one treatment com-pared to none and an additional 26 lb
Table 1. Bovine respiratory disease (BRD) impact on performance when categorized by incidence at two commercial feedlots in Alberta, Canada that included over 276,000 head and 978 lots of cattle.
Respiratory disease incidence within the lot1 P-Value2
0 - 5 5 - 10 10 - 15 15 - 20 20 - 25 25 - 30 30 - 35 > 35 F-test Linear Quadratic Steers, n 19,938 36,195 44,056 46,382 47,010 34,374 22,088 26,073 Lots, n 131 162 161 151 140 90 69 74Morbidity, % 3.1 7.6 12.6 17.5 22.3 27.5 32.4 42.3 <0.001 <0.001 <0.001Initial BW, lb 620 610 617 622 614 612 602 612 0.05 0.08 0.60DMI, lb/day 19.6 19.4 19.2 19.0 18.9 19.0 18.7 18.7 <0.001 <0.001 0.001ADG, lb 3.50 3.45 3.46 3.39 3.40 3.40 3.35 3.39 <0.001 <0.001 0.03F:G 5.61 5.64 5.55 5.64 5.57 5.59 5.59 5.53 0.03 0.08 0.53
1Respiratory disease incidence categorized by percent of cattle identified as morbid.2P-value for F-test statistic and linear effect of BRD percentage within lots of cattle.
Table 2. Impact of respiratory disease (BRD) on individual BW, ADG, and carcass characteristics of 33,073 steers fed in commercial pens linked with carcass data by individual that is categorized by zero, one, and two or more treatments for BRD.
Respiratory disease treatment1 P-value2
0 1 2+ SEM F-test Linear Quadratic
Steers, n 30,911 1,823 339DOF3, day 260.4 260.6 260.7 21.4 0.52 0.41 0.95Initial BW, lb 630.8 632.6 640.3 29.3 0.10 0.04 0.34Final BW, lb 1377.4 1374.6 1331.2 62.5 <0.001 <0.001 <0.001ADG, lb 3.12 3.10 2.94 0.12 <0.001 <0.001 <0.001
HCW, lb 826.4 824.7 798.7 37.5 <0.001 <0.001 <0.001Marbling4 516.8 503.0 489.8 13.0 <0.001 <0.001 <0.001LM area, in2 12.7 12.7 12.4 0.2 <0.001 <0.001 <0.001Fat depth, in 0.42 0.40 0.37 0.03 <0.001 <0.001 0.49USDA Choice, % 51.3 42.1 36.9 0.07 <0.001 <0.001 0.25USDA YG5 3.17 3.10 3.04 0.11 <0.001 <0.001 0.74
1Respiratory treatment number that includes no treatments (0), 1 treatment, and 2 or more treatments (2+).2P-value for F-test statistic and linear or quadratic effects of BRD treatment number.3DOF is days on feed at the feedlot.4Marbling score where 500 = small0.5USDA Yield Grade.
Table 3. Growing cattle performance of individually fed cattle categorized by respiratory disease incidence at UNL.
Respiratory disease treatment1
None Prior to Trial < 30 dof > 30 dof P-value2
Mean SE Mean SE Mean SE Mean SE Treatment Initial BW
Cattle, n 753 139 3 5Initial BW, lb 608 5.5 604 6.8 612 30.7 587 23.8 0.69DMI, lb/day 14.7b 0.27 14.5b 0.31 14.2b 1.12 12.9a 0.87 0.10 < 0.01ADG, lb 1.88b 0.065 1.84b 0.071 1.73a,b 0.232 1.29a 0.183 < 0.01 0.60G:F 0.125 0.0028 0.124 0.0035 0.117 0.0155 0.080 0.012 < 0.01 < 0.01F:G 8.00 8.06 8.55 12.50
1Respiratory treatment history includes cattle that were not identified as sick (None), pulled and treated prior to finishing beginning (Prior to Trial), pulled and treated within the first 30 days on finishing diets (< 30 dof), and pulled and treated after the first 30 days on finishing diets (> 30 dof).2P-value due to respiratory treatment history and the p-value for using initial BW as a covariate.
decrease when cattle were treated two or more times compared to only once. Marbling, fat depth, USDA Choice, and USDA YG all decreased linearly (P < 0.001) as number of BRD treat-ments increased.
Performance of individually fed cattle fed growing diets was impacted by BRD, but depended on the timing
of disease onset. It should be noted that 139 of 900 head were treated for BRD prior to starting the growing period (i.e., sick during a receiving period prior to start) and DMI, ADG, or F:G were not impacted (Table 3). A small number of cattle were treated either in the first 30 days (3 of 900) or treated after the first 30 days (5
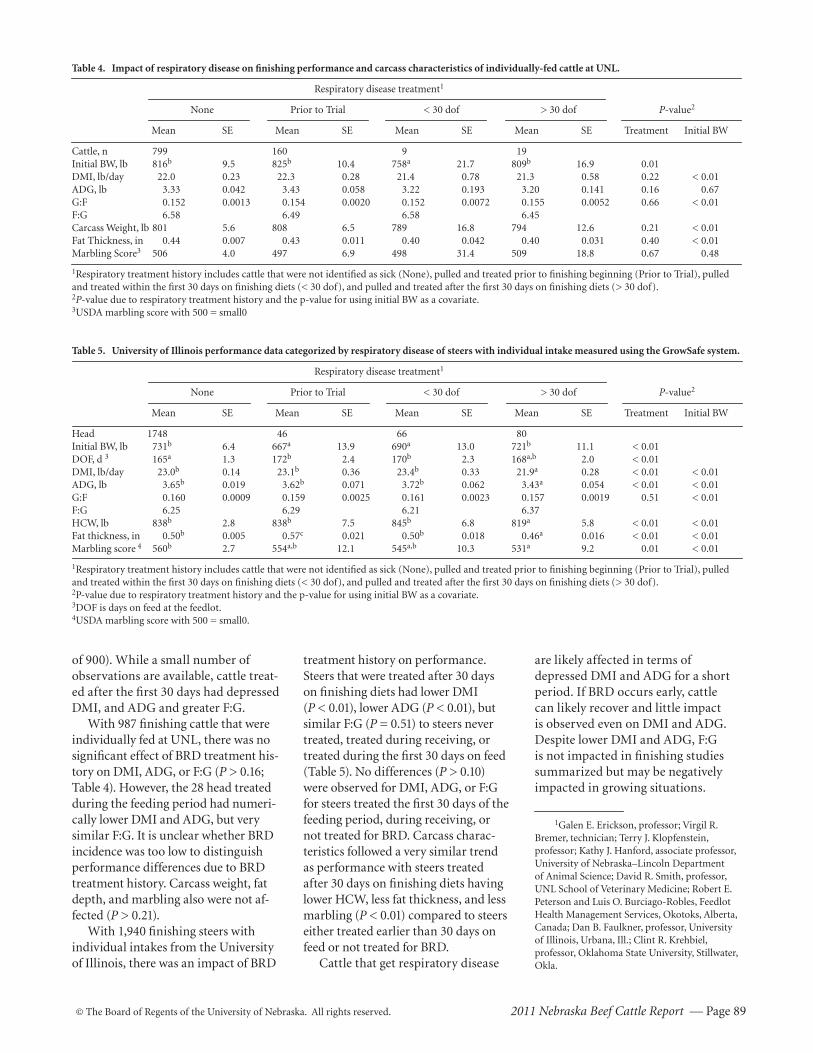
© The Board of Regents of the University of Nebraska. All rights reserved. 2011 Nebraska Beef Cattle Report — Page 89
of 900). While a small number of observations are available, cattle treat-ed after the first 30 days had depressed DMI, and ADG and greater F:G.
With 987 finishing cattle that were individually fed at UNL, there was no significant effect of BRD treatment his-tory on DMI, ADG, or F:G (P > 0.16; Table 4). However, the 28 head treated during the feeding period had numeri-cally lower DMI and ADG, but very similar F:G. It is unclear whether BRD incidence was too low to dis tinguish performance differences due to BRD treatment history . Carcass weight, fat depth, and marbling also were not af-fected (P > 0.21).
With 1,940 finishing steers with individual intakes from the University of Illinois, there was an impact of BRD
Table 4. Impact of respiratory disease on finishing performance and carcass characteristics of individually-fed cattle at UNL.
Respiratory disease treatment1
None Prior to Trial < 30 dof > 30 dof P-value2
Mean SE Mean SE Mean SE Mean SE Treatment Initial BW
Cattle, n 799 160 9 19Initial BW, lb 816b 9.5 825b 10.4 758a 21.7 809b 16.9 0.01DMI, lb/day 22.0 0.23 22.3 0.28 21.4 0.78 21.3 0.58 0.22 < 0.01ADG, lb 3.33 0.042 3.43 0.058 3.22 0.193 3.20 0.141 0.16 0.67G:F 0.152 0.0013 0.154 0.0020 0.152 0.0072 0.155 0.0052 0.66 < 0.01F:G 6.58 6.49 6.58 6.45Carcass Weight, lb 801 5.6 808 6.5 789 16.8 794 12.6 0.21 < 0.01Fat Thickness, in 0.44 0.007 0.43 0.011 0.40 0.042 0.40 0.031 0.40 < 0.01Marbling Score3 506 4.0 497 6.9 498 31.4 509 18.8 0.67 0.48
1Respiratory treatment history includes cattle that were not identified as sick (None), pulled and treated prior to finishing beginning (Prior to Trial), pulled and treated within the first 30 days on finishing diets (< 30 dof), and pulled and treated after the first 30 days on finishing diets (> 30 dof).2P-value due to respiratory treatment history and the p-value for using initial BW as a covariate.3USDA marbling score with 500 = small0
Table 5. University of Illinois performance data categorized by respiratory disease of steers with individual intake measured using the GrowSafe system.
Respiratory disease treatment1
None Prior to Trial < 30 dof > 30 dof P-value2
Mean SE Mean SE Mean SE Mean SE Treatment Initial BW
Head 1748 46 66 80Initial BW, lb 731b 6.4 667a 13.9 690a 13.0 721b 11.1 < 0.01DOF, d 3 165a 1.3 172b 2.4 170b 2.3 168a,b 2.0 < 0.01DMI, lb/day 23.0b 0.14 23.1b 0.36 23.4b 0.33 21.9a 0.28 < 0.01 < 0.01ADG, lb 3.65b 0.019 3.62b 0.071 3.72b 0.062 3.43a 0.054 < 0.01 < 0.01G:F 0.160 0.0009 0.159 0.0025 0.161 0.0023 0.157 0.0019 0.51 < 0.01F:G 6.25 6.29 6.21 6.37HCW, lb 838b 2.8 838b 7.5 845b 6.8 819a 5.8 < 0.01 < 0.01Fat thickness, in 0.50b 0.005 0.57c 0.021 0.50b 0.018 0.46a 0.016 < 0.01 < 0.01Marbling score 4 560b 2.7 554a,b 12.1 545a,b 10.3 531a 9.2 0.01 < 0.01
1Respiratory treatment history includes cattle that were not identified as sick (None), pulled and treated prior to finishing beginning (Prior to Trial), pulled and treated within the first 30 days on finishing diets (< 30 dof), and pulled and treated after the first 30 days on finishing diets (> 30 dof).2P-value due to respiratory treatment history and the p-value for using initial BW as a covariate.3DOF is days on feed at the feedlot.4USDA marbling score with 500 = small0.
treatment history on performance. Steers that were treated after 30 days on finishing diets had lower DMI (P < 0.01), lower ADG (P < 0.01), but similar F:G (P = 0.51) to steers never treated, treated during receiving, or treated during the first 30 days on feed (Table 5). No differences (P > 0.10) were observed for DMI, ADG, or F:G for steers treated the first 30 days of the feeding period, during receiving, or not treated for BRD. Carcass charac-teristics followed a very similar trend as performance with steers treated after 30 days on fin ishing diets having lower HCW, less fat thickness, and less marbling (P < 0.01) compared to steers either treated earlier than 30 days on feed or not treated for BRD.
Cattle that get respiratory disease
are likely affected in terms of depressed DMI and ADG for a short period. If BRD occurs early, cattle can likely recover and little impact is observed even on DMI and ADG. Despite lower DMI and ADG, F:G is not impacted in finishing studies summarized but may be negatively impacted in growing situations.
1Galen E. Erickson, professor; Virgil R. Bremer, technician; Terry J. Klopfenstein, professor; Kathy J. Hanford, associate professor, University of Nebraska–Lincoln Department of Animal Science; David R. Smith, professor, UNL School of Veterinary Medicine; Robert E. Peterson and Luis O. Burciago-Robles, Feedlot Health Management Services, Okotoks, Alberta, Canada; Dan B. Faulkner, professor, University of Illinois, Urbana, Ill.; Clint R. Krehbiel, professor, Oklahoma State University, Stillwater, Okla.
Page 90 — 2011 Nebraska Beef Cattle Report © The Board of Regents of the University of Nebraska. All rights reserved.
Effects of a Dietary Antioxidant on Performance and Carcass Characteristics of Feedlot Cattle With or Without WDGS
Justin P. MooreStephanie A. Furman
Galen E. EricksonKarla H. Jenkins
Judson T. VasconcelosMartin A. AndersenCasey N. Macken1
Summary
Effect of a dietary antioxidant in diets with or without wet distill-ers grains plus solubles (WDGS) was evaluated for performance and carcass characteristics. The 2 x 2 factorial design consisted of 1) an antioxidant at 0 or 150 ppm (Agrado Plus) and 2) WDGS at 0 or 30%, which replaced dry-rolled corn. Feeding the antioxidant did not affect performance (P > 0.31) or car-cass characteristics (P > 0.25). Feeding WDGS increased (P < 0.01) final body weight (BW), dry matter intake (DMI), and average daily gain (ADG) while decreasing the feed to gain (F:G) ratio (P < 0.01). Carcass characteristics were affected (P < 0.01) by feeding WDGS, which increased HCW and fatness.
Introduction
Feeding wet distillers grain plus solubles (WDGS) is becoming a common practice. However, WDGS contains high levels of unsaturated fatty acids that are prone to oxidation, which may increase oxidative stress (2007 Nebraska Beef Cattle Report, pp. 39-42; 2008 Nebraska Beef Cattle Report, pp. 108-109; 2009 Nebraska Beef Cattle Report, pp. 110-111; 2010 Nebraska Beef Cattle Report, pp. 97-98). Dietary antioxidants may control excessive lipid oxidation and decrease negative effects by reducing the perox-idation of fatty acids (2009 Nebraska Beef Cattle Report, pp. 113-115).
The objectives of our study were to evaluate live performance and car-cass characteristics of feedlot cattle
receiving finishing diets, with or with-out a dietary antioxidant (ethoxyquin and tertiary-butyl-hydroquinone), in dry-rolled, corn-based diets with or without WDGS.
Procedure
Four hundred eighty British x Con-tinental yearling steers (BW = 779 lb) were acclimated to the feedlot for five or six days, respectively, prior to ini-tial processing, which included: 1) ear tags; 2) vaccinations; 3) de-worming; 4) implanting with Component TE-IS with Tylan® (Vetlife/Elanco, Over-land Park, KS); and 5) individually weighing on two consecutive days for an average initial BW. Cattle were re-implanted with Component TE-S with Tylan® on day 71.
Cattle were stratified by BW, assigned to eight weight blocks and assigned randomly to 32 pens. Four treatment diets were assigned ran-domly to pens within each block, with eight pens per treatment and 15 steers per pen. A 21-day adaptation period consisted of three periods, each seven days, where roughage was replaced with an equal amount of concentrate. Two diets consisted of dry-rolled corn (DRC) (78%), soybean meal/urea pellet (1.86:1; 4%), corn silage (12%) and a liquid supplement (6%) with or without a dietary antioxidant (AOX) (0 or 150 ppm Agrado Plus, Novus International, Inc., St. Louis, MO) and two diets consisted of DRC (52%), WDGS (30%), corn silage (12%), and a liquid supplement (6%) with or without a dietary antioxidant (0 or 150 ppm Agrado Plus). The liquid supplement contained Rumen-sin (345 mg/hd/day) and Tylan (90 mg/hd/day). Diets containing WDGS had a CP level of 14.8%, com-pared to 13.4 % in the corn-based diets (Table 1). Fat level was greater for the WDGS compared to the corn-based diets.
When approximately 60% of steers within a block were expected to grade USDA Choice, the steers were sent to a commercial abattoir. Half of the weight blocks were fed 145 days and the other half for 160 days. On the day of slaughter, hot carcass weights (HCW) were recorded. Following a 24-hour chill, 12th rib fat thickness, lean muscle (LM) area, marbling score, USDA QG And USDA YG were recorded. To account for any gut-fill, the final live BW was adjusted using a common dressing percentage of 63% calculated from HCW. The carcass-adjusted final BW was used to calcu-late ADG and F:G.
Performance and carcass char-acteristics were analyzed as a 2 x 2 factorial using the PROC MIXED procedure of SAS (Version 9.1, SAS Inc., Cary, N.C.). Pen was used as the experimental unit. The factors includ-ed in the model were WDGS inclusion and dietary antioxidant inclusion, with weight block as a fixed variable and initial BW as a covariate. PROC FREQ was used in the Chi-square analyses of USDA QG distribution.
Results
No WDGS level x AOX level inter-action was observed for performance (P > 0.32) or carcass characteristics (P > 0.34); therefore, only main effects were evaluated. Main effects of dietary antioxidant are reported in Table 2 and were not significantly dif-ferent for performance (P > 0.30) or carcass characteristics (P > 0.24).
Performance and carcass charac-teristics for WDGS main effects have been summarized in Table 3. Initial BW was lighter (P < 0.01) for steers receiving the 30% WDGS; however, the difference was only 2 pounds. Final BW increased (P < 0.01) with WDGS inclusion (1387 lb to 1483 lb). Daily intake increased (P < 0.01) from 24.0 lb/day to 24.7 lb/day with
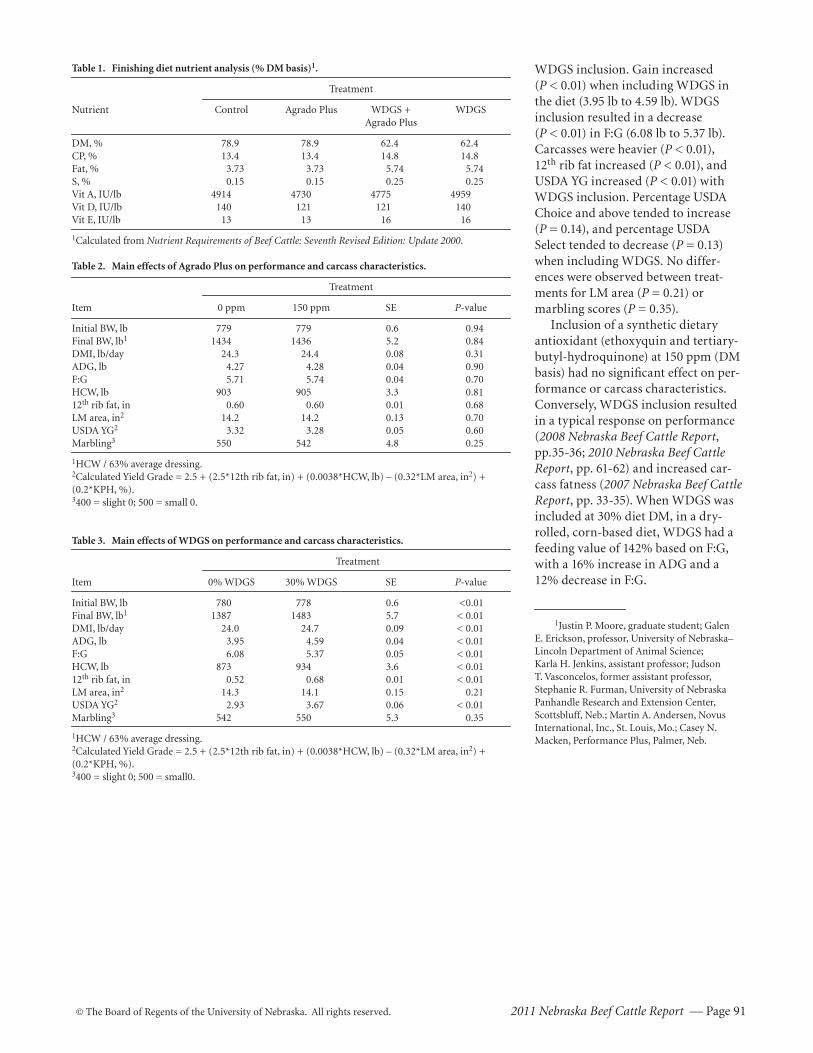
© The Board of Regents of the University of Nebraska. All rights reserved. 2011 Nebraska Beef Cattle Report — Page 91
WDGS inclusion. Gain increased (P < 0.01) when including WDGS in the diet (3.95 lb to 4.59 lb). WDGS inclusion resulted in a decrease (P < 0.01) in F:G (6.08 lb to 5.37 lb). Carcasses were heavier (P < 0.01), 12th rib fat increased (P < 0.01), and USDA YG increased (P < 0.01) with WDGS inclusion. Percentage USDA Choice and above tended to increase (P = 0.14), and percentage USDA Select tended to decrease (P = 0.13) when including WDGS. No differ-ences were observed between treat-ments for LM area (P = 0.21) or marbling scores (P = 0.35).
Inclusion of a synthetic dietary antioxidant (ethoxyquin and tertiary-butyl-hydroquinone) at 150 ppm (DM basis) had no significant effect on per-formance or carcass characteristics. Conversely, WDGS inclusion resulted in a typical response on performance (2008 Nebraska Beef Cattle Report, pp.35-36; 2010 Nebraska Beef Cattle Report, pp. 61-62) and increased car-cass fatness (2007 Nebraska Beef Cattle Report, pp. 33-35). When WDGS was included at 30% diet DM, in a dry-rolled, corn-based diet, WDGS had a feeding value of 142% based on F:G, with a 16% increase in ADG and a 12% decrease in F:G.
1Justin P. Moore, graduate student; Galen E. Erickson, professor, University of Nebraska–Lincoln Department of Animal Science; Karla H. Jenkins, assistant professor; Judson T. Vasconcelos, former assistant professor, Stephanie R. Furman, University of Nebraska Panhandle Research and Extension Center, Scottsbluff, Neb.; Martin A. Andersen, Novus International, Inc., St. Louis, Mo.; Casey N. Macken, Performance Plus, Palmer, Neb.
Table 1. Finishing diet nutrient analysis (% DM basis)1.
Treatment
Nutrient Control Agrado Plus WDGS + WDGS Agrado Plus
DM, % 78.9 78.9 62.4 62.4CP, % 13.4 13.4 14.8 14.8Fat, % 3.73 3.73 5.74 5.74S, % 0.15 0.15 0.25 0.25Vit A, IU/lb 4914 4730 4775 4959Vit D, IU/lb 140 121 121 140Vit E, IU/lb 13 13 16 16
1Calculated from Nutrient Requirements of Beef Cattle: Seventh Revised Edition: Update 2000.
Table 2. Main effects of Agrado Plus on performance and carcass characteristics.
Treatment
Item 0 ppm 150 ppm SE P-value
Initial BW, lb 779 779 0.6 0.94Final BW, lb1 1434 1436 5.2 0.84DMI, lb/day 24.3 24.4 0.08 0.31ADG, lb 4.27 4.28 0.04 0.90F:G 5.71 5.74 0.04 0.70HCW, lb 903 905 3.3 0.8112th rib fat, in 0.60 0.60 0.01 0.68LM area, in2 14.2 14.2 0.13 0.70
USDA YG2 3.32 3.28 0.05 0.60Marbling3 550 542 4.8 0.25
1HCW / 63% average dressing.2Calculated Yield Grade = 2.5 + (2.5*12th rib fat, in) + (0.0038*HCW, lb) – (0.32*LM area, in2) + (0.2*KPH, %).3400 = slight 0; 500 = small 0.
Table 3. Main effects of WDGS on performance and carcass characteristics.
Treatment
Item 0% WDGS 30% WDGS SE P-value
Initial BW, lb 780 778 0.6 <0.01Final BW, lb1 1387 1483 5.7 < 0.01DMI, lb/day 24.0 24.7 0.09 < 0.01ADG, lb 3.95 4.59 0.04 < 0.01F:G 6.08 5.37 0.05 < 0.01HCW, lb 873 934 3.6 < 0.0112th rib fat, in 0.52 0.68 0.01 < 0.01LM area, in2 14.3 14.1 0.15 0.21
USDA YG2 2.93 3.67 0.06 < 0.01Marbling3 542 550 5.3 0.35
1HCW / 63% average dressing.2Calculated Yield Grade = 2.5 + (2.5*12th rib fat, in) + (0.0038*HCW, lb) – (0.32*LM area, in2) + (0.2*KPH, %).3400 = slight 0; 500 = small0.
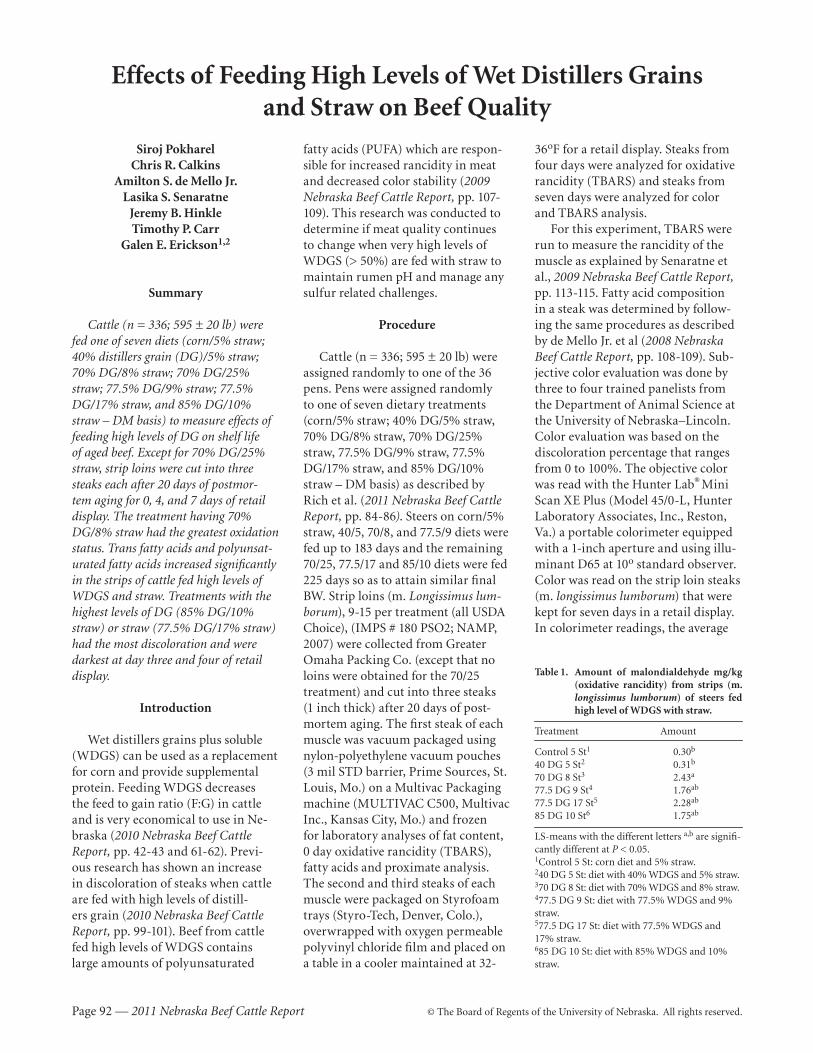
Page 92 — 2011 Nebraska Beef Cattle Report © The Board of Regents of the University of Nebraska. All rights reserved.
Effects of Feeding High Levels of Wet Distillers Grains and Straw on Beef Quality
Siroj PokharelChris R. Calkins
Amilton S. de Mello Jr.Lasika S. Senaratne
Jeremy B. HinkleTimothy P. Carr
Galen E. Erickson1,2
Summary
Cattle (n = 336; 595 ± 20 lb) were fed one of seven diets (corn/5% straw; 40% distillers grain (DG)/5% straw; 70% DG/8% straw; 70% DG/25% straw; 77.5% DG/9% straw; 77.5% DG/17% straw, and 85% DG/10% straw – DM basis) to measure effects of feeding high levels of DG on shelf life of aged beef. Except for 70% DG/25% straw, strip loins were cut into three steaks each after 20 days of postmor-tem aging for 0, 4, and 7 days of retail display. The treatment having 70% DG/8% straw had the greatest oxidation status. Trans fatty acids and polyunsat-urated fatty acids increased significantly in the strips of cattle fed high levels of WDGS and straw. Treatments with the highest levels of DG (85% DG/10% straw) or straw (77.5% DG/17% straw) had the most discoloration and were darkest at day three and four of retail display.
Introduction
Wet distillers grains plus soluble (WDGS) can be used as a replacement for corn and provide supplemental protein. Feeding WDGS decreases the feed to gain ratio (F:G) in cattle and is very economical to use in Ne-braska (2010 Nebraska Beef Cattle Report, pp. 42-43 and 61-62). Previ-ous research has shown an increase in discoloration of steaks when cattle are fed with high levels of distill-ers grain (2010 Nebraska Beef Cattle Report , pp. 99-101). Beef from cattle fed high levels of WDGS contains large amounts of polyunsaturated
fatty acids (PUFA) which are respon-sible for increased rancidity in meat and decreased color stability (2009 Nebraska Beef Cattle Report, pp. 107-109). This research was conducted to determine if meat quality continues to change when very high levels of WDGS (> 50%) are fed with straw to maintain rumen pH and manage any sulfur related challenges.
Procedure
Cattle (n = 336; 595 ± 20 lb) were assigned randomly to one of the 36 pens. Pens were assigned randomly to one of seven dietary treatments (corn/5% straw; 40% DG/5% straw, 70% DG/8% straw, 70% DG/25% straw, 77.5% DG/9% straw, 77.5% DG/17% straw, and 85% DG/10% straw – DM basis) as described by Rich et al. (2011 Nebraska Beef Cattle Report, pp. 84-86). Steers on corn/5% straw, 40/5, 70/8, and 77.5/9 diets were fed up to 183 days and the remaining 70/25, 77.5/17 and 85/10 diets were fed 225 days so as to attain similar final BW. Strip loins (m. Longissimus lum-borum), 9-15 per treatment (all USDA Choice), (IMPS # 180 PSO2; NAMP, 2007) were collected from Greater Omaha Packing Co. (except that no loins were obtained for the 70/25 treatment) and cut into three steaks (1 inch thick) after 20 days of post-mortem aging. The first steak of each muscle was vacuum packaged using nylon-polyethylene vacuum pouches (3 mil STD barrier, Prime Sources, St. Louis, Mo.) on a Multivac Packaging machine (MULTIVAC C500, Multivac Inc., Kansas City, Mo.) and frozen for laboratory analyses of fat content, 0 day oxidative rancidity (TBARS), fatty acids and proximate analysis. The second and third steaks of each muscle were packaged on Styrofoam trays (Styro-Tech, Denver, Colo.), overwrapped with oxygen permeable polyvinyl chloride film and placed on a table in a cooler maintained at 32-
36oF for a retail display. Steaks from four days were analyzed for oxidative rancidity (TBARS) and steaks from seven days were analyzed for color and TBARS analysis.
For this experiment, TBARS were run to measure the rancidity of the muscle as explained by Senaratne et al., 2009 Nebraska Beef Cattle Report, pp. 113-115. Fatty acid composition in a steak was determined by follow-ing the same procedures as described by de Mello Jr. et al (2008 Nebraska Beef Cattle Report, pp. 108-109). Sub-jective color evaluation was done by three to four trained panelists from the Department of Animal Science at the University of Nebraska–Lincoln. Color evaluation was based on the discoloration percentage that ranges from 0 to 100%. The objective color was read with the Hunter Lab®
Mini
Scan XE Plus (Model 45/0-L, Hunter Laboratory Associates, Inc., Reston, Va.) a portable colorimeter equipped with a 1-inch aperture and using illu-minant D65 at 10o standard observer. Color was read on the strip loin steaks (m. longissimus lumborum) that were kept for seven days in a retail display. In colorimeter readings, the average
Table 1. Amount of malondialdehyde mg/kg (oxidative rancidity) from strips (m. longissimus lumborum) of steers fed high level of WDGS with straw.
Treatment Amount
Control 5 St1 0.30b
40 DG 5 St2 0.31b
70 DG 8 St3 2.43a
77.5 DG 9 St4 1.76ab
77.5 DG 17 St5 2.28ab
85 DG 10 St6 1.75ab
LS-means with the different letters a,b are signifi-cantly different at P < 0.05.1Control 5 St: corn diet and 5% straw. 240 DG 5 St: diet with 40% WDGS and 5% straw.370 DG 8 St: diet with 70% WDGS and 8% straw.477.5 DG 9 St: diet with 77.5% WDGS and 9% straw.577.5 DG 17 St: diet with 77.5% WDGS and 17% straw.685 DG 10 St: diet with 85% WDGS and 10% straw.
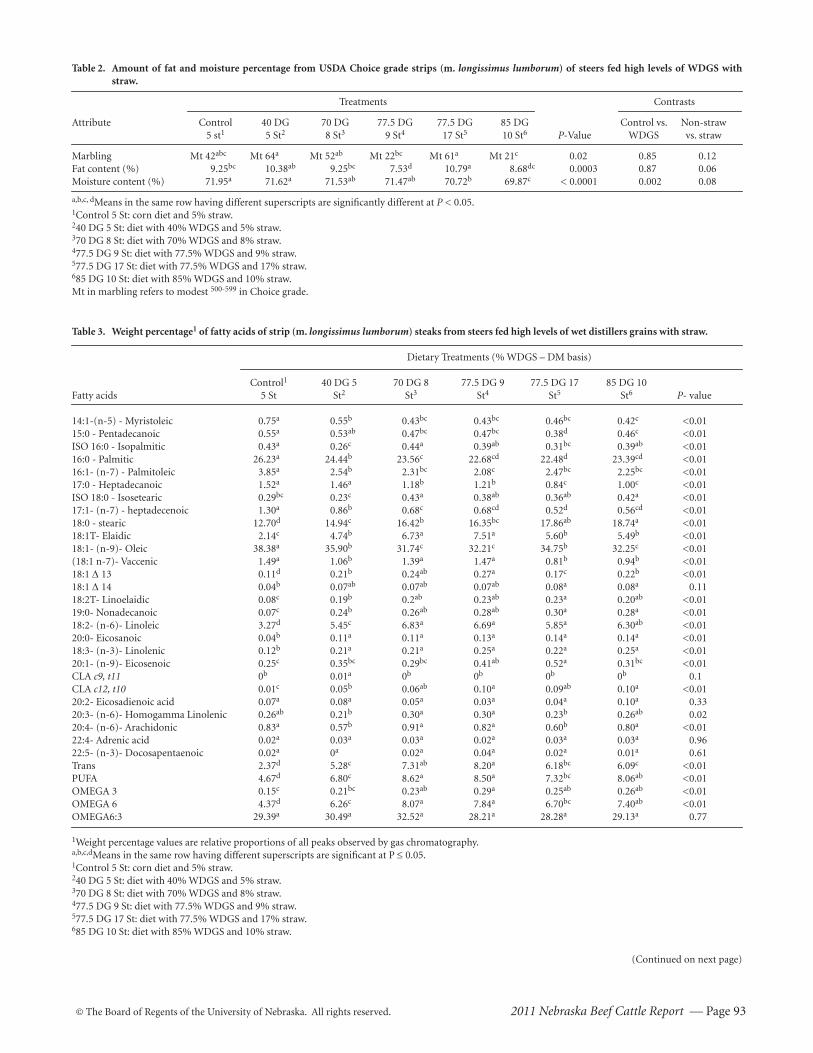
© The Board of Regents of the University of Nebraska. All rights reserved. 2011 Nebraska Beef Cattle Report — Page 93
Table 2. Amount of fat and moisture percentage from USDA Choice grade strips (m. longissimus lumborum) of steers fed high levels of WDGS with straw.
Treatments Contrasts
Attribute Control 40 DG 70 DG 77.5 DG 77.5 DG 85 DG Control vs. Non-straw 5 st1 5 St2 8 St3 9 St4 17 St5 10 St6 P-Value WDGS vs. straw
Marbling Mt 42abc Mt 64a Mt 52ab Mt 22bc Mt 61a Mt 21c 0.02 0.85 0.12Fat content (%) 9.25bc 10.38ab 9.25bc 7.53d 10.79a 8.68dc 0.0003 0.87 0.06Moisture content (%) 71.95a 71.62a 71.53ab 71.47ab 70.72b 69.87c < 0.0001 0.002 0.08
a,b,c, dMeans in the same row having different superscripts are significantly different at P < 0.05.1Control 5 St: corn diet and 5% straw.240 DG 5 St: diet with 40% WDGS and 5% straw.370 DG 8 St: diet with 70% WDGS and 8% straw.477.5 DG 9 St: diet with 77.5% WDGS and 9% straw.577.5 DG 17 St: diet with 77.5% WDGS and 17% straw.685 DG 10 St: diet with 85% WDGS and 10% straw.Mt in marbling refers to modest 500-599 in Choice grade.
Table 3. Weight percentage1 of fatty acids of strip (m. longissimus lumborum) steaks from steers fed high levels of wet distillers grains with straw.
Dietary Treatments (% WDGS – DM basis)
Control1 40 DG 5 70 DG 8 77.5 DG 9 77.5 DG 17 85 DG 10Fatty acids 5 St St2 St3 St4 St5 St6 P- value
14:1-(n-5) - Myristoleic 0.75a 0.55b 0.43bc 0.43bc 0.46bc 0.42c <0.0115:0 - Pentadecanoic 0.55a 0.53ab 0.47bc 0.47bc 0.38d 0.46c <0.01ISO 16:0 - Isopalmitic 0.43a 0.26c 0.44a 0.39ab 0.31bc 0.39ab <0.0116:0 - Palmitic 26.23a 24.44b 23.56c 22.68cd 22.48d 23.39cd <0.0116:1- (n-7) - Palmitoleic 3.85a 2.54b 2.31bc 2.08c 2.47bc 2.25bc <0.0117:0 - Heptadecanoic 1.52a 1.46a 1.18b 1.21b 0.84c 1.00c <0.01ISO 18:0 - Isosetearic 0.29bc 0.23c 0.43a 0.38ab 0.36ab 0.42a <0.0117:1- (n-7) - heptadecenoic 1.30a 0.86b 0.68c 0.68cd 0.52d 0.56cd <0.0118:0 - stearic 12.70d 14.94c 16.42b 16.35bc 17.86ab 18.74a <0.0118:1T- Elaidic 2.14c 4.74b 6.73a 7.51a 5.60b 5.49b <0.0118:1- (n-9)- Oleic 38.38a 35.90b 31.74c 32.21c 34.75b 32.25c <0.01(18:1 n-7)- Vaccenic 1.49a 1.06b 1.39a 1.47a 0.81b 0.94b <0.0118:1 Δ 13 0.11d 0.21b 0.24ab 0.27a 0.17c 0.22b <0.0118:1 Δ 14 0.04b 0.07ab 0.07ab 0.07ab 0.08a 0.08a 0.1118:2T- Linoelaidic 0.08c 0.19b 0.2ab 0.23ab 0.23a 0.20ab <0.0119:0- Nonadecanoic 0.07c 0.24b 0.26ab 0.28ab 0.30a 0.28a <0.0118:2- (n-6)- Linoleic 3.27d 5.45c 6.83a 6.69a 5.85a 6.30ab <0.0120:0- Eicosanoic 0.04b 0.11a 0.11a 0.13a 0.14a 0.14a <0.0118:3- (n-3)- Linolenic 0.12b 0.21a 0.21a 0.25a 0.22a 0.25a <0.0120:1- (n-9)- Eicosenoic 0.25c 0.35bc 0.29bc 0.41ab 0.52a 0.31bc <0.01CLA c9, t11 0b 0.01a 0b 0b 0b 0b 0.1CLA c12, t10 0.01c 0.05b 0.06ab 0.10a 0.09ab 0.10a <0.0120:2- Eicosadienoic acid 0.07a 0.08a 0.05a 0.03a 0.04a 0.10a 0.3320:3- (n-6)- Homogamma Linolenic 0.26ab 0.21b 0.30a 0.30a 0.23b 0.26ab 0.0220:4- (n-6)- Arachidonic 0.83a 0.57b 0.91a 0.82a 0.60b 0.80a <0.0122:4- Adrenic acid 0.02a 0.03a 0.03a 0.02a 0.03a 0.03a 0.9622:5- (n-3)- Docosapentaenoic 0.02a 0a 0.02a 0.04a 0.02a 0.01a 0.61Trans 2.37d 5.28c 7.31ab 8.20a 6.18bc 6.09c <0.01PUFA 4.67d 6.80c 8.62a 8.50a 7.32bc 8.06ab <0.01OMEGA 3 0.15c 0.21bc 0.23ab 0.29a 0.25ab 0.26ab <0.01OMEGA 6 4.37d 6.26c 8.07a 7.84a 6.70bc 7.40ab <0.01OMEGA6:3 29.39a 30.49a 32.52a 28.21a 28.28a 29.13a 0.77
1Weight percentage values are relative proportions of all peaks observed by gas chromatography.a,b,c,dMeans in the same row having different superscripts are significant at P ≤ 0.05.1Control 5 St: corn diet and 5% straw.240 DG 5 St: diet with 40% WDGS and 5% straw.370 DG 8 St: diet with 70% WDGS and 8% straw.477.5 DG 9 St: diet with 77.5% WDGS and 9% straw.577.5 DG 17 St: diet with 77.5% WDGS and 17% straw.685 DG 10 St: diet with 85% WDGS and 10% straw.
(Continued on next page)
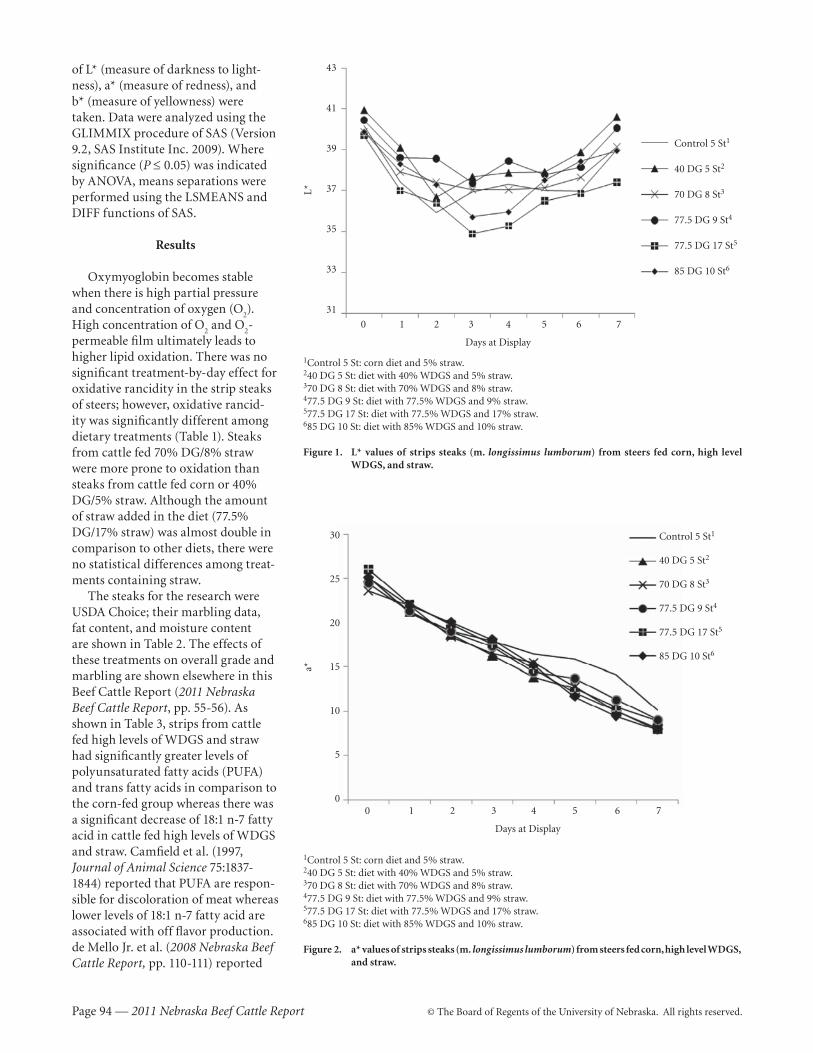
Page 94 — 2011 Nebraska Beef Cattle Report © The Board of Regents of the University of Nebraska. All rights reserved.
of L* (measure of darkness to light-ness), a* (measure of redness), and b* (measure of yellowness) were taken. Data were analyzed using the GLIMMIX procedure of SAS (Version 9.2, SAS Institute Inc. 2009). Where significance (P ≤ 0.05) was indicated by ANOVA, means separations were performed using the LSMEANS and DIFF functions of SAS.
Results
Oxymyoglobin becomes stable when there is high partial pressure and concentration of oxygen (O
2).
High concentration of O2 and O
2-
permeable film ultimately leads to higher lipid oxidation. There was no significant treatment-by-day effect for oxidative rancidity in the strip steaks of steers; however, oxidative rancid-ity was significantly different among dietary treatments (Table 1). Steaks from cattle fed 70% DG/8% straw were more prone to oxidation than steaks from cattle fed corn or 40% DG/5% straw. Although the amount of straw added in the diet (77.5% DG/17% straw) was almost double in comparison to other diets, there were no statistical differences among treat-ments containing straw.
The steaks for the research were USDA Choice; their marbling data, fat content, and moisture content are shown in Table 2. The effects of these treatments on overall grade and marbling are shown elsewhere in this Beef Cattle Report (2011 Nebraska Beef Cattle Report, pp. 55-56). As shown in Table 3, strips from cattle fed high levels of WDGS and straw had significantly greater levels of polyunsaturated fatty acids (PUFA) and trans fatty acids in comparison to the corn-fed group whereas there was a significant decrease of 18:1 n-7 fatty acid in cattle fed high levels of WDGS and straw. Camfield et al. (1997, Journal of Animal Science 75:1837-1844) reported that PUFA are respon-sible for discoloration of meat whereas lower levels of 18:1 n-7 fatty acid are associated with off flavor production. de Mello Jr. et al. (2008 Nebraska Beef Cattle Report, pp. 110-111) reported
1Control 5 St: corn diet and 5% straw. 240 DG 5 St: diet with 40% WDGS and 5% straw.370 DG 8 St: diet with 70% WDGS and 8% straw.477.5 DG 9 St: diet with 77.5% WDGS and 9% straw.577.5 DG 17 St: diet with 77.5% WDGS and 17% straw.685 DG 10 St: diet with 85% WDGS and 10% straw.
Figure 1. L* values of strips steaks (m. longissimus lumborum) from steers fed corn, high level WDGS, and straw.
43
41
39
37
35
33
31L*
0 1 2 3 4 5 6 7
Days at Display
Control 5 St1
40 DG 5 St2
70 DG 8 St3
77.5 DG 9 St4
77.5 DG 17 St5
85 DG 10 St6
1Control 5 St: corn diet and 5% straw.240 DG 5 St: diet with 40% WDGS and 5% straw.370 DG 8 St: diet with 70% WDGS and 8% straw.477.5 DG 9 St: diet with 77.5% WDGS and 9% straw.577.5 DG 17 St: diet with 77.5% WDGS and 17% straw.685 DG 10 St: diet with 85% WDGS and 10% straw.
Figure 2. a* values of strips steaks (m. longissimus lumborum) from steers fed corn, high level WDGS, and straw.
30
25
20
15
10
5
0
a*
0 1 2 3 4 5 6 7
Days at Display
Control 5 St1
40 DG 5 St2
70 DG 8 St3
77.5 DG 9 St4
77.5 DG 17 St5
85 DG 10 St6
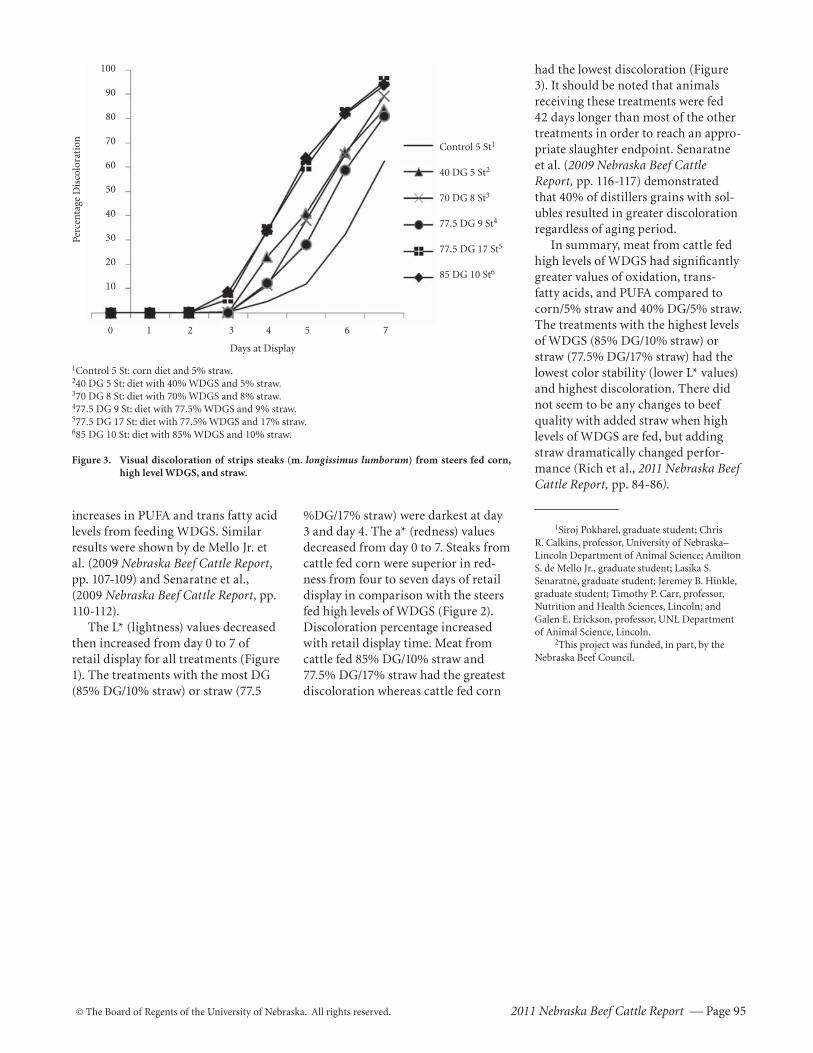
© The Board of Regents of the University of Nebraska. All rights reserved. 2011 Nebraska Beef Cattle Report — Page 95
increases in PUFA and trans fatty acid levels from feeding WDGS. Similar results were shown by de Mello Jr. et al. (2009 Nebraska Beef Cattle Report, pp. 107-109) and Senaratne et al., (2009 Nebraska Beef Cattle Report, pp. 110-112).
The L* (lightness) values decreased then increased from day 0 to 7 of retail display for all treatments (Figure 1). The treatments with the most DG (85% DG/10% straw) or straw (77.5
%DG/17% straw) were darkest at day 3 and day 4. The a* (redness) values decreased from day 0 to 7. Steaks from cattle fed corn were superior in red-ness from four to seven days of retail display in comparison with the steers fed high levels of WDGS (Figure 2). Discoloration percentage increased with retail display time. Meat from cattle fed 85% DG/10% straw and 77.5% DG/17% straw had the greatest discoloration whereas cattle fed corn
had the lowest discoloration (Figure 3). It should be noted that animals receiving these treatments were fed 42 days longer than most of the other treatments in order to reach an appro-priate slaughter endpoint. Senaratne et al. (2009 Nebraska Beef Cattle Report , pp. 116-117) demonstrated that 40% of distillers grains with sol-ubles resulted in greater discoloration regardless of aging period.
In summary, meat from cattle fed high levels of WDGS had significantly greater values of oxidation, trans-fatty acids, and PUFA compared to corn/5% straw and 40% DG/5% straw. The treatments with the highest levels of WDGS (85% DG/10% straw) or straw (77.5% DG/17% straw) had the lowest color stability (lower L* values) and highest discoloration. There did not seem to be any changes to beef quality with added straw when high levels of WDGS are fed, but adding straw dramatically changed perfor-mance (Rich et al., 2011 Nebraska Beef Cattle Report, pp. 84-86).
1Siroj Pokharel, graduate student; Chris R. Calkins, professor, University of Nebraska–Lincoln Department of Animal Science; Amilton S. de Mello Jr., graduate student; Lasika S. Senaratne, graduate student; Jeremey B. Hinkle, graduate student; Timothy P. Carr, professor, Nutrition and Health Sciences, Lincoln; and Galen E. Erickson, professor, UNL Department of Animal Science, Lincoln.
2This project was funded, in part, by the Nebraska Beef Council.
1Control 5 St: corn diet and 5% straw.240 DG 5 St: diet with 40% WDGS and 5% straw.370 DG 8 St: diet with 70% WDGS and 8% straw.477.5 DG 9 St: diet with 77.5% WDGS and 9% straw.577.5 DG 17 St: diet with 77.5% WDGS and 17% straw.685 DG 10 St: diet with 85% WDGS and 10% straw.
Figure 3. Visual discoloration of strips steaks (m. longissimus lumborum) from steers fed corn, high level WDGS, and straw.
100
90
80
70
60
50
40
30
20
10
Perc
enta
ge D
isco
lora
tion
0 1 2 3 4 5 6 7
Days at Display
Control 5 St1
40 DG 5 St2
70 DG 8 St3
77.5 DG 9 St4
77.5 DG 17 St5
85 DG 10 St6
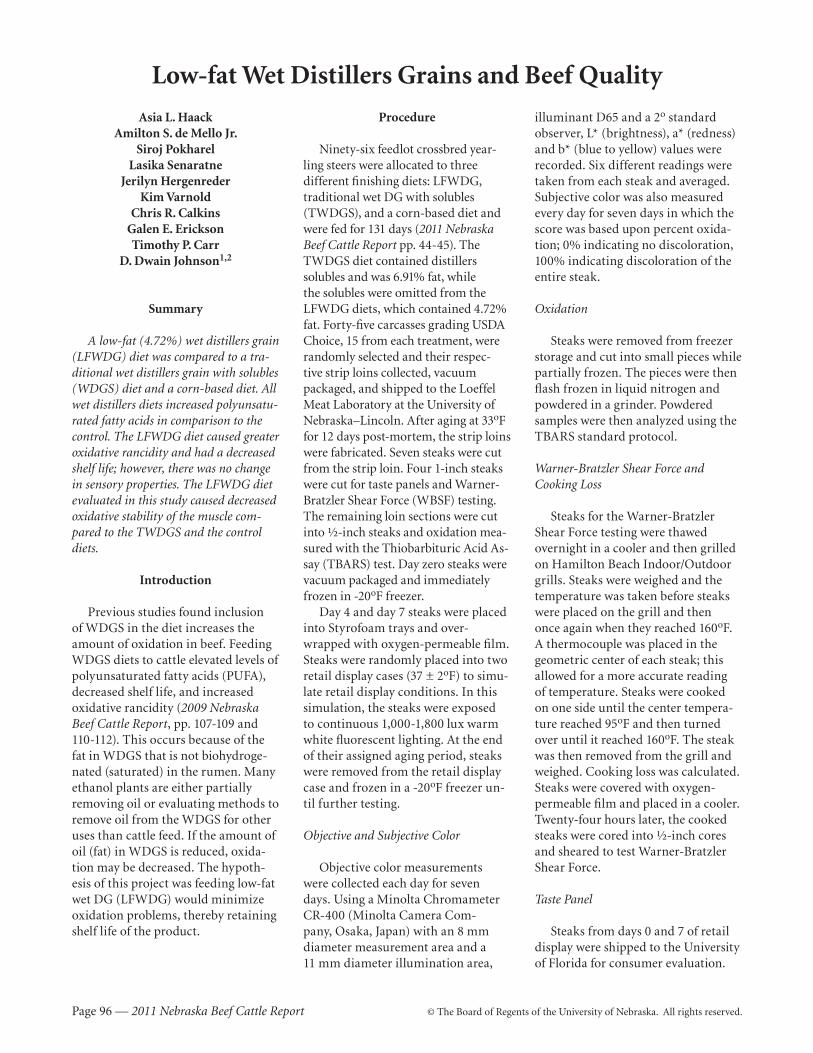
Page 96 — 2011 Nebraska Beef Cattle Report © The Board of Regents of the University of Nebraska. All rights reserved.
Low-fat Wet Distillers Grains and Beef Quality
Asia L. HaackAmilton S. de Mello Jr.
Siroj Pokharel Lasika Senaratne
Jerilyn HergenrederKim Varnold
Chris R. CalkinsGalen E. EricksonTimothy P. Carr
D. Dwain Johnson1,2
Summary
A low-fat (4.72%) wet distillers grain (LFWDG) diet was compared to a tra-ditional wet distillers grain with solubles (WDGS) diet and a corn-based diet. All wet distillers diets increased polyunsatu-rated fatty acids in comparison to the control. The LFWDG diet caused greater oxidative rancidity and had a decreased shelf life; however, there was no change in sensory properties. The LFWDG diet evaluated in this study caused decreased oxidative stability of the muscle com-pared to the TWDGS and the control diets.
Introduction
Previous studies found inclusion of WDGS in the diet increases the amount of oxidation in beef. Feeding WDGS diets to cattle elevated levels of polyunsaturated fatty acids (PUFA), decreased shelf life, and increased oxidative rancidity (2009 Nebraska Beef Cattle Report, pp. 107-109 and 110-112). This occurs because of the fat in WDGS that is not biohydroge-nated (saturated) in the rumen. Many ethanol plants are either partially removing oil or evaluating methods to remove oil from the WDGS for other uses than cattle feed. If the amount of oil (fat) in WDGS is reduced, oxida-tion may be decreased. The hypoth-esis of this project was feeding low-fat wet DG (LFWDG) would minimize oxidation problems, thereby retaining shelf life of the product.
illuminant D65 and a 2o standard observer, L* (brightness), a* (redness) and b* (blue to yellow) values were recorded. Six different readings were taken from each steak and averaged. Subjective color was also measured every day for seven days in which the score was based upon percent oxida-tion; 0% indicating no discoloration, 100% indicating discoloration of the entire steak.
Oxidation
Steaks were removed from freezer storage and cut into small pieces while partially frozen. The pieces were then flash frozen in liquid nitrogen and powdered in a grinder. Powdered samples were then analyzed using the TBARS standard protocol.
Warner-Bratzler Shear Force and Cooking Loss
Steaks for the Warner-Bratzler Shear Force testing were thawed overnight in a cooler and then grilled on Hamilton Beach Indoor/Outdoor grills. Steaks were weighed and the temperature was taken before steaks were placed on the grill and then once again when they reached 160oF. A thermocouple was placed in the geometric center of each steak; this allowed for a more accurate reading of temperature. Steaks were cooked on one side until the center tempera-ture reached 95oF and then turned over until it reached 160oF. The steak was then removed from the grill and weighed. Cooking loss was calculated. Steaks were covered with oxygen-permeable film and placed in a cooler. Twenty-four hours later, the cooked steaks were cored into ½-inch cores and sheared to test Warner-Bratzler Shear Force.
Taste Panel
Steaks from days 0 and 7 of retail display were shipped to the University of Florida for consumer evaluation.
Procedure
Ninety-six feedlot crossbred year-ling steers were allocated to three different finishing diets: LFWDG, traditional wet DG with solubles (TWDGS), and a corn-based diet and were fed for 131 days (2011 Nebraska Beef Cattle Report pp. 44-45). The TWDGS diet contained distillers solubles and was 6.91% fat, while the solubles were omitted from the LFWDG diets, which contained 4.72% fat. Forty-five carcasses grading USDA Choice, 15 from each treatment, were randomly selected and their respec-tive strip loins collected, vacuum packaged, and shipped to the Loeffel Meat Laboratory at the University of Nebraska–Lincoln. After aging at 33oF for 12 days post-mortem, the strip loins were fabricated. Seven steaks were cut from the strip loin. Four 1-inch steaks were cut for taste panels and Warner-Bratzler Shear Force (WBSF) testing. The remaining loin sections were cut into ½-inch steaks and oxidation mea-sured with the Thiobarbituric Acid As-say (TBARS) test. Day zero steaks were vacuum packaged and immediately frozen in -20oF freezer.
Day 4 and day 7 steaks were placed into Styrofoam trays and over-wrapped with oxygen-permeable film. Steaks were randomly placed into two retail display cases (37 ± 2oF) to simu-late retail display conditions. In this simulation, the steaks were exposed to continuous 1,000-1,800 lux warm white fluorescent lighting. At the end of their assigned aging period, steaks were removed from the retail display case and frozen in a -20oF freezer un-til further testing.
Objective and Subjective Color
Objective color measurements were collected each day for seven days. Using a Minolta Chromameter CR-400 (Minolta Camera Com-pany, Osaka, Japan) with an 8 mm diameter measurement area and a 11 mm diameter illumination area,
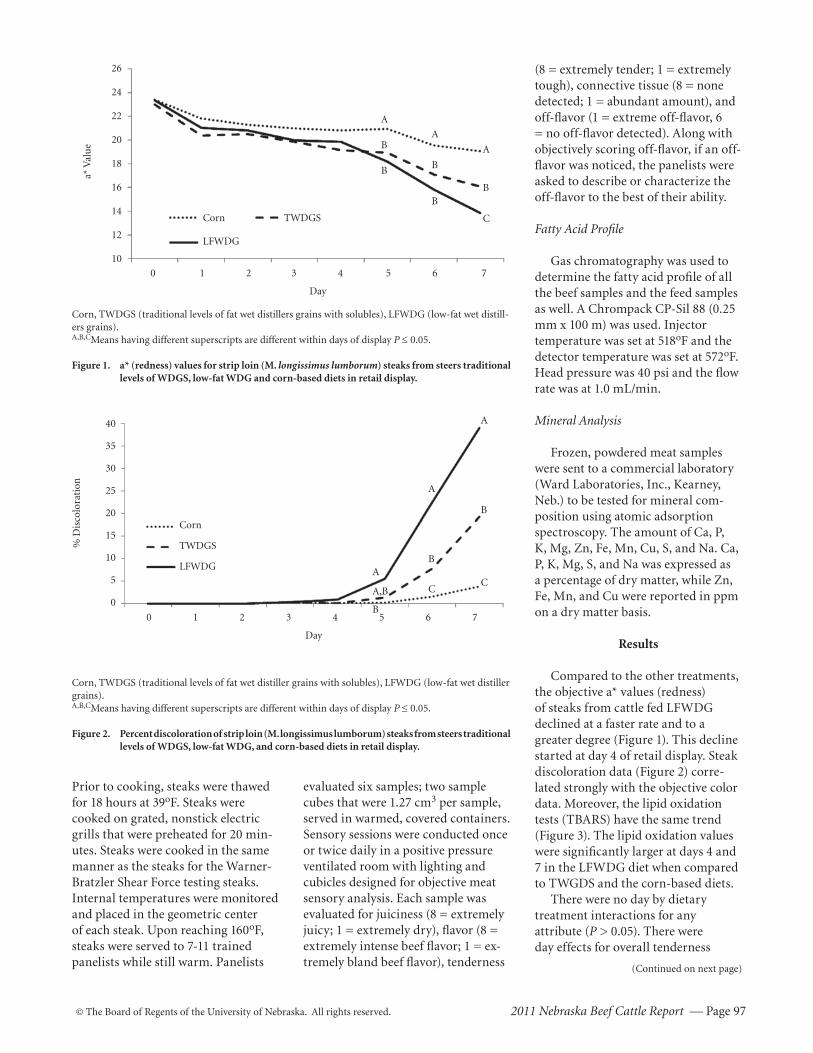
© The Board of Regents of the University of Nebraska. All rights reserved. 2011 Nebraska Beef Cattle Report — Page 97
Prior to cooking, steaks were thawed for 18 hours at 39oF. Steaks were cooked on grated, nonstick electric grills that were preheated for 20 min-utes. Steaks were cooked in the same manner as the steaks for the Warner-Bratzler Shear Force testing steaks. Internal temperatures were monitored and placed in the geometric center of each steak. Upon reaching 160oF, steaks were served to 7-11 trained panelists while still warm. Panelists
evaluated six samples; two sample cubes that were 1.27 cm3 per sample, served in warmed, covered containers. Sensory sessions were conducted once or twice daily in a positive pressure ventilated room with lighting and cubicles designed for objective meat sensory analysis. Each sample was evaluated for juiciness (8 = extremely juicy; 1 = extremely dry), flavor (8 = extremely intense beef flavor; 1 = ex-tremely bland beef flavor), tenderness
(8 = extremely tender; 1 = extremely tough), connective tissue (8 = none detected; 1 = abundant amount), and off-flavor (1 = extreme off-flavor, 6 = no off-flavor detected). Along with objectively scoring off-flavor, if an off-flavor was noticed, the panelists were asked to describe or characterize the off-flavor to the best of their ability.
Fatty Acid Profile
Gas chromatography was used to determine the fatty acid profile of all the beef samples and the feed samples as well. A Chrompack CP-Sil 88 (0.25 mm x 100 m) was used. Injector temperature was set at 518oF and the detector temperature was set at 572oF. Head pressure was 40 psi and the flow rate was at 1.0 mL/min.
Mineral Analysis
Frozen, powdered meat samples were sent to a commercial laboratory (Ward Laboratories, Inc., Kearney, Neb.) to be tested for mineral com-position using atomic adsorption spectroscopy. The amount of Ca, P, K, Mg, Zn, Fe, Mn, Cu, S, and Na. Ca, P, K, Mg, S, and Na was expressed as a percentage of dry matter, while Zn, Fe, Mn, and Cu were reported in ppm on a dry matter basis.
Results
Compared to the other treatments, the objective a* values (redness) of steaks from cattle fed LFWDG declined at a faster rate and to a greater degree (Figure 1). This decline started at day 4 of retail display. Steak discoloration data (Figure 2) corre-lated strongly with the objective color data. Moreover, the lipid oxidation tests (TBARS) have the same trend (Figure 3). The lipid oxidation values were significantly larger at days 4 and 7 in the LFWDG diet when compared to TWGDS and the corn-based diets.
There were no day by dietary treatment interactions for any attribute (P > 0.05). There were day effects for overall tenderness
Corn, TWDGS (traditional levels of fat wet distillers grains with solubles), LFWDG (low-fat wet distill-ers grains).A,B,CMeans having different superscripts are different within days of display P ≤ 0.05.
Figure 1. a* (redness) values for strip loin (M. longissimus lumborum) steaks from steers traditional levels of WDGS, low-fat WDG and corn-based diets in retail display.
26
24
22
20
18
16
14
12
10
a* V
alu
e
Corn TWDGS
LFWDG
A
B
B
A
B
B
A
B
C
0 1 2 3 4 5 6 7
Day
Corn, TWDGS (traditional levels of fat wet distiller grains with solubles), LFWDG (low-fat wet distiller grains).A,B,CMeans having different superscripts are different within days of display P ≤ 0.05.
Figure 2. Percent discoloration of strip loin (M. longissimus lumborum) steaks from steers traditional levels of WDGS, low-fat WDG, and corn-based diets in retail display.
% D
isco
lora
tion
40
35
30
25
20
15
10
5
0
A
A,B
B
A
B
C
A
B
C
0 1 2 3 4 5 6 7
Day
Corn
TWDGS
LFWDG
(Continued on next page)
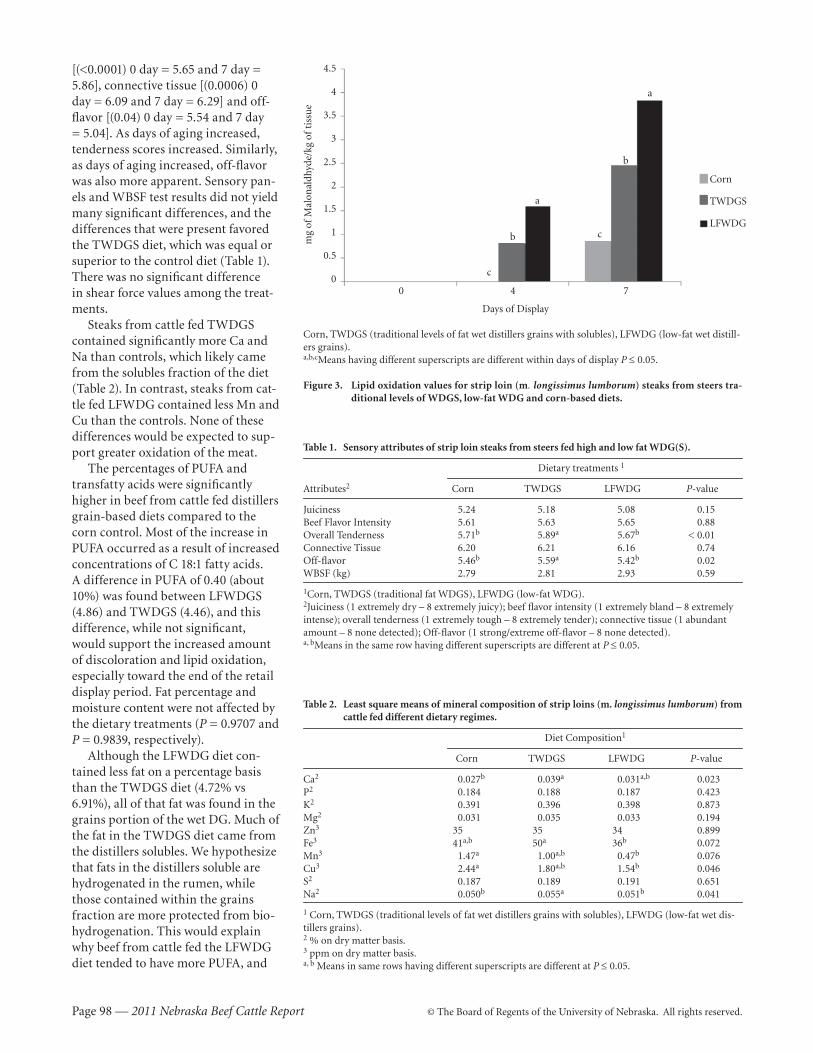
Page 98 — 2011 Nebraska Beef Cattle Report © The Board of Regents of the University of Nebraska. All rights reserved.
[(<0.0001) 0 day = 5.65 and 7 day = 5.86], connective tissue [(0.0006) 0 day = 6.09 and 7 day = 6.29] and off-flavor [(0.04) 0 day = 5.54 and 7 day = 5.04]. As days of aging increased, tenderness scores increased. Similarly, as days of aging increased, off-flavor was also more apparent. Sensory pan-els and WBSF test results did not yield many significant differences, and the differences that were present favored the TWDGS diet, which was equal or superior to the control diet (Table 1). There was no significant difference in shear force values among the treat-ments.
Steaks from cattle fed TWDGS contained significantly more Ca and Na than controls, which likely came from the solubles fraction of the diet (Table 2). In contrast, steaks from cat-tle fed LFWDG contained less Mn and Cu than the controls. None of these differences would be expected to sup-port greater oxidation of the meat.
The percentages of PUFA and transfatty acids were significantly higher in beef from cattle fed dis tillers grain-based diets compared to the corn control. Most of the increase in PUFA occurred as a result of increased concentrations of C 18:1 fatty acids. A difference in PUFA of 0.40 (about 10%) was found between LFWDGS (4.86) and TWDGS (4.46), and this difference, while not significant, would support the increased amount of discoloration and lipid oxidation, especially toward the end of the retail display period. Fat percentage and moisture content were not affected by the dietary treatments (P = 0.9707 and P = 0.9839, respectively).
Although the LFWDG diet con-tained less fat on a percentage basis than the TWDGS diet (4.72% vs 6.91%), all of that fat was found in the grains portion of the wet DG. Much of the fat in the TWDGS diet came from the distillers solubles. We hypothesize that fats in the distillers soluble are hydrogenated in the rumen, while those contained within the grains fraction are more protected from bio-hydrogenation. This would explain why beef from cattle fed the LFWDG diet tended to have more PUFA, and
Table 1. Sensory attributes of strip loin steaks from steers fed high and low fat WDG(S).
Dietary treatments 1
Attributes2 Corn TWDGS LFWDG P-value
Juiciness 5.24 5.18 5.08 0.15Beef Flavor Intensity 5.61 5.63 5.65 0.88Overall Tenderness 5.71b 5.89a 5.67b < 0.01Connective Tissue 6.20 6.21 6.16 0.74Off-flavor 5.46b 5.59a 5.42b 0.02WBSF (kg) 2.79 2.81 2.93 0.59
1Corn, TWDGS (traditional fat WDGS), LFWDG (low-fat WDG).2Juiciness (1 extremely dry – 8 extremely juicy); beef flavor intensity (1 extremely bland – 8 extremely intense); overall tenderness (1 extremely tough – 8 extremely tender); connective tissue (1 abundant amount – 8 none detected); Off-flavor (1 strong/extreme off-flavor – 8 none detected).a, bMeans in the same row having different superscripts are different at P ≤ 0.05.
Table 2. Least square means of mineral composition of strip loins (m. longissimus lumborum) from cattle fed different dietary regimes.
Diet Composition1
Corn TWDGS LFWDG P-value
Ca2 0.027b 0.039a 0.031a,b 0.023P2 0.184 0.188 0.187 0.423K2 0.391 0.396 0.398 0.873Mg2 0.031 0.035 0.033 0.194Zn3 35 35 34 0.899Fe3 41a,b 50a 36b 0.072Mn3 1.47a 1.00a,b 0.47b 0.076Cu3 2.44a 1.80a,b 1.54b 0.046S2 0.187 0.189 0.191 0.651Na2 0.050b 0.055a 0.051b 0.041
1 Corn, TWDGS (traditional levels of fat wet distillers grains with solubles), LFWDG (low-fat wet dis-tillers grains).2 % on dry matter basis.3 ppm on dry matter basis.a, b Means in same rows having different superscripts are different at P ≤ 0.05.
Corn
TWDGS
LFWDG
4.5
4
3.5
3
2.5
2
1.5
1
0.5
0
mg
of M
alon
aldh
yde/
kg o
f ti
ssu
e
0 4 7
Days of Display
Corn, TWDGS (traditional levels of fat wet distillers grains with solubles), LFWDG (low-fat wet distill-ers grains).a,b,cMeans having different superscripts are different within days of display P ≤ 0.05.
Figure 3. Lipid oxidation values for strip loin (m. longissimus lumborum) steaks from steers tra-ditional levels of WDGS, low-fat WDG and corn-based diets.
c
b c
a
a
b
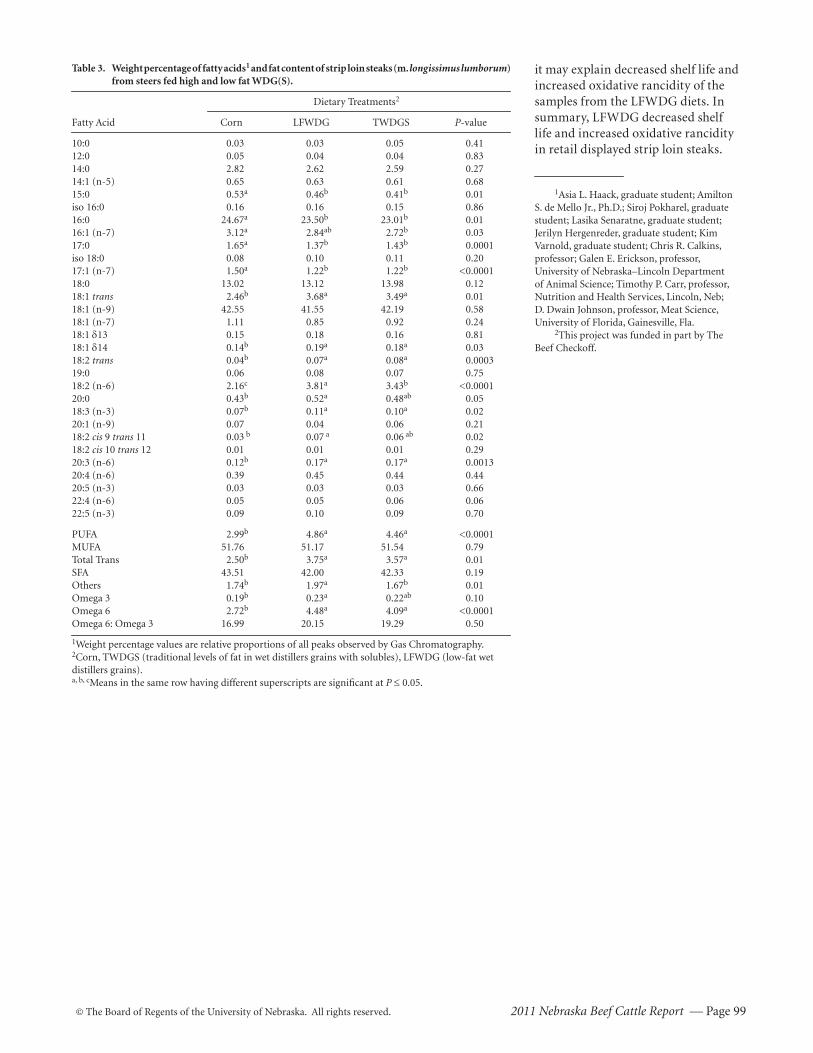
© The Board of Regents of the University of Nebraska. All rights reserved. 2011 Nebraska Beef Cattle Report — Page 99
it may explain decreased shelf life and increased oxidative rancidity of the samples from the LFWDG diets. In summary, LFWDG decreased shelf life and increased oxidative rancidity in retail displayed strip loin steaks.
1Asia L. Haack, graduate student; Amilton S. de Mello Jr., Ph.D.; Siroj Pokharel, graduate student; Lasika Senaratne, graduate student; Jerilyn Hergenreder, graduate student; Kim Varnold, graduate student; Chris R. Calkins, professor; Galen E. Erickson, professor, University of Nebraska–Lincoln Department of Animal Science; Timothy P. Carr, professor, Nutrition and Health Services, Lincoln, Neb; D. Dwain Johnson, professor, Meat Science, University of Florida, Gainesville, Fla.
2This project was funded in part by The Beef Checkoff.
Table 3. Weight percentage of fatty acids1 and fat content of strip loin steaks (m. longissimus lumborum) from steers fed high and low fat WDG(S).
Dietary Treatments2
Fatty Acid Corn LFWDG TWDGS P-value
10:0 0.03 0.03 0.05 0.4112:0 0.05 0.04 0.04 0.8314:0 2.82 2.62 2.59 0.2714:1 (n-5) 0.65 0.63 0.61 0.6815:0 0.53a 0.46b 0.41b 0.01iso 16:0 0.16 0.16 0.15 0.8616:0 24.67a 23.50b 23.01b 0.0116:1 (n-7) 3.12a 2.84ab 2.72b 0.0317:0 1.65a 1.37b 1.43b 0.0001iso 18:0 0.08 0.10 0.11 0.2017:1 (n-7) 1.50a 1.22b 1.22b <0.000118:0 13.02 13.12 13.98 0.1218:1 trans 2.46b 3.68a 3.49a 0.0118:1 (n-9) 42.55 41.55 42.19 0.5818:1 (n-7) 1.11 0.85 0.92 0.2418:1 d13 0.15 0.18 0.16 0.8118:1 d14 0.14b 0.19a 0.18a 0.0318:2 trans 0.04b 0.07a 0.08a 0.000319:0 0.06 0.08 0.07 0.7518:2 (n-6) 2.16c 3.81a 3.43b <0.000120:0 0.43b 0.52a 0.48ab 0.0518:3 (n-3) 0.07b 0.11a 0.10a 0.0220:1 (n-9) 0.07 0.04 0.06 0.2118:2 cis 9 trans 11 0.03 b 0.07 a 0.06 ab 0.0218:2 cis 10 trans 12 0.01 0.01 0.01 0.2920:3 (n-6) 0.12b 0.17a 0.17a 0.001320:4 (n-6) 0.39 0.45 0.44 0.4420:5 (n-3) 0.03 0.03 0.03 0.6622:4 (n-6) 0.05 0.05 0.06 0.0622:5 (n-3) 0.09 0.10 0.09 0.70
PUFA 2.99b 4.86a 4.46a <0.0001MUFA 51.76 51.17 51.54 0.79Total Trans 2.50b 3.75a 3.57a 0.01SFA 43.51 42.00 42.33 0.19Others 1.74b 1.97a 1.67b 0.01Omega 3 0.19b 0.23a 0.22ab 0.10Omega 6 2.72b 4.48a 4.09a <0.0001Omega 6: Omega 3 16.99 20.15 19.29 0.50
1Weight percentage values are relative proportions of all peaks observed by Gas Chromatography.2Corn, TWDGS (traditional levels of fat in wet distillers grains with solubles), LFWDG (low-fat wet distillers grains).a, b, cMeans in the same row having different superscripts are significant at P ≤ 0.05.
Page 100 — 2011 Nebraska Beef Cattle Report © The Board of Regents of the University of Nebraska. All rights reserved.
Shelf Life of m. longissimus lumborum from Beef FedAntioxidants and Wet Distillers Grains
Lasika S. SenaratneChris R. Calkins
Judson T. Vasconcelos Amilton S. de Mello, Jr.
M. A. AndersenStephanie A. Furman
Siroj Pokharel1,2
Summary
Crossbred steers (n = 483) were fed dry-rolled corn based finishing diets containing 0 or 30% wet distillers grains with the synthetic antioxidants, ethoxyquin and tertiary butyl hydro-quinone (AGRADO®PLUS). Synthetic antioxidants reduced lipid and color deterioration of strip steaks at the end of the retail display period under high or atmospheric oxygen packaging conditions .
Introduction
de Mello Jr. et al. (2008 Nebraska Beef Cattle Report, pp. 116-117) and Senaratne et al. (2009 Nebraska Beef Cattle Report, pp. 110-111) have shown that WDGS increase polyunsaturated fatty acids (PUFA) in beef. Elevated levels of PUFA in beef may affect color and flavor of beef, eventually affect-ing consumer appeal at retail. Feed-ing vitamin E, an antioxidant, with WDGS has shown to be a promising strategy to mitigate detrimental ef-fects on beef due to feeding WDGS (Senaratne et al. 2009 Nebraska Beef Cattle Report, pp. 113-115), but it may increase the feeding cost.
Feedlot studies with a mixture of synthetic antioxidant, ethoxyquin, and tertiary butyl hydroquinone (AG; AGRADO®PLUS) have shown improvement in average daily gain and a decrease in morbidity and mor-tality of cattle by improving the anti-oxidant capacity at the ruminal and postruminal stages of digestion (Han et al. 2002 Journal of Animal Science, 80, pp. 1117-1123). Others (Moore et
days retail display shear force analysis under OW and HiO
2-MAP packaging
systems, respectively. Surface discol-oration ratings were determined on steaks assigned for seven days retail display shear force analysis. All steaks assigned for OW retail display were packaged (oxidation as four pieces per tray, shear force as two steaks per tray) on Styrofoam trays and overwrapped with oxygen permeable polyvinyl chloride film. All steaks assigned for HiO
2-MAP retail display
were packaged (steaks arrangement was similar to OW packaging system) on high foam-barrier polypropylene trays with a gas mixture (80% O
2:
20% CO2) and mechanically sealed
with oxygen impermeable film. Over-wrapped and HiO
2-MAP packaged
8 and 29 days aged steaks, placed on a table in a cooler (at 0 ± 36oF) were exposed to continuous 1,000-1,800 lux warm white fluorescence lighting to provide simulated retail display conditions. Steaks (8 and 29 days aged) assigned for four and seven days of retail display were removed from tables accordingly for oxidation and shear force analysis, and immediately vacuum-packaged and stored at -4oF.
A six-person trained panel subjec-tively evaluated the percentage surface discoloration. Discoloration ratings were made on each steak from 0 to 7 days of retail display at 24-hour inter-vals.
The 2-thiobarbuteric acid reactive substance (TBARS) assay was used to measure the oxidation status of 8- and 29-day aged steaks in both packaging systems displayed for 0, 4 and 7 days in simulated retail display.
Tenderness evaluations were per-formed by Warner-Bratzler shear force testing (WBSF).
Data were analyzed by ANOVA in the GLIMMIX procedure of SAS (ver-sion 9.2, Cary, N.C., 2009) as a split-split-split-plot design with dietary treatments as the whole-plot treat-ment, aging period as the first split-
al. 2010 Proceedings 43rd Midwestern Sectional Animal Science Meetings, pp. 86) have reported AGRADO®PLUS supplementation affects neither performance nor carcass charac-teristics of feedlot cattle. Feeding AGRADO®PLUS may increase the antioxidant level of muscles. Our study evaluated the antioxidant effects of feeding AGRADO®PLUS with WDGS diets on color and lipid stabil-ity, and tenderness of beef m. longissi-mus lumborum during its shelf life.
Procedure
Crossbred (British × Continental) yearling steers (n = 483; initial BW = 942 kg ± 2.2 lb) were randomly assigned to one of four dry-rolled corn-based diets, contained 0%, or 30% (DM basis) wet distillers grains plus solubles (WDGS) with or with-out AGRADO®PLUS (AG; 150 ppm/steer/day) supplementation. Steers were fed a total of 145 (at first trial) or 160 days (at second trial) and slaugh-tered. Carcasses were chilled for 48 hours before grading. After grading, both sides of the beef loin, short loins (IMPS # 174; NAMP, 2007) from a total of 80 (40 from each trial) USDA Choice carcasses (10 from each dietary treatment) were vacuum-packaged and transported under refrigera-tion. After aging for either 8 or 29 days at 36oF, m. longissimus lumbo-rum muscles were removed from the beef loins. Each strip loin was cut into six 1-inch-thick steaks from the anterior to the posterior. The first (for oxidation; 0 day retail displayed) and fourth (for shear force; 0 day retail displayed) steaks were immediately vacuum-packaged and stored at -4oF. The second and third steaks were split into halves and assigned for four and seven days oxidation analysis either under overwrapped (OW) or high-oxygen modified atmospheric packag-ing (HiO
2-MAP) systems. Fifth and
sixth steaks were allotted for seven

© The Board of Regents of the University of Nebraska. All rights reserved. 2011 Nebraska Beef Cattle Report — Page 101
(Continued on next page)
plot treatment, packaging systems as the second split-plot treatment, and retail display time (repeated mea-sures) as the third split-plot treatment, with the animal as the experimental unit. Separation of means was con-ducted using LSMEANS procedure with PDIFF and SLICEDIFF options at P ≤ 0.05. In addition, the CON-TRAST statements in SAS were used to compare the effects of feeding Corn vs. WDGS, Corn vs. Corn+AG, WDGS vs. WDGS+AG, and No AG vs. AG.
Results
Four-way interaction effects of treatment × packaging × aging × day on steaks surface discoloration were significant (Table 1; P < 0.0001). Discoloration increased during retail display time in both packag-ing systems and both aging periods. However, steaks in the OW packag-ing system were significantly more discolored compared to steaks in HiO
2-MAP system (less than 20%
surface discoloration). Similar results have been reported by de Mello Jr. et al. (2010 Nebraska Beef Cattle Report, pp. 99-101). A possible reason for less discoloration when beef is exposed to higher levels of oxygen is conversion
of myoglobin into stable oxymyo-globin (cherry red color). Steaks (29 days aged in both packaging systems) from cattle fed corn plus AG had sig-nificantly (P < 0.05) less discoloration at the end of the retail display period (P < 0.05) than steaks from cattle fed any other diet/treatment. The effectiveness of AG supplementation in reducing discoloration was promi-nent when meat was aged longer. Although the trends were the same, anti-discoloration effect of AG supple-mentation was not statistically signifi-cant when cattle were fed WDGS. The reason for high discoloration even after adding AG into the diet is likely due to the increase of easily oxidiz-able, polyunsaturated fatty acids in beef from feeding WDGS. de Mello Jr. et al (2008 Nebraska Beef Cattle Report , pp. 116-117) and Senaratne et al. (2009 Nebraska Beef Cattle Report, pp. 110-111) reported that feeding WDGS increased PUFA level in beef compared to corn control diets.
There were significant (Table 2; P = 0.04) three-way interaction effects of treatment × aging × day on lipid oxidation. As aging and retail display time increased, lipid oxidation also increased. However, there were no sig-nificant differences among eight day
aged steaks from cattle fed different diets. The only significant (P < 0.05) difference in dietary treatments could be seen in 29-day aged steaks at the end of retail display. Similar to discol-oration results, steaks from corn plus AG diets had the lowest oxidation. Steaks from AG supplemented cattle had significantly (P < 0.05) lower lipid oxidation compared to steaks from cattle not on AG supplementation. Feeding AG helped reduce oxida-tion of increased PUFA content when cattle were fed WDGS. As expected, TBARS analysis did not show signifi-cantly higher lipid oxidation on steaks from HiO
2-MAP systems compared
to steaks from OW packaging systems (although, numerically higher). This might be due to the dilution effect of oxidized lipid on the surface of the thick steaks when preparation for TBARS analysis.
The WBSF values of steaks sig-nificantly (P = 0.03) decreased when aging and retail display time increased. Steaks from HiO
2-MAP
systems after seven days retail display had significantly (P < 0.0001) higher WBSF values (by 1.01 lbs) compared to steaks from OW packaging systems (data not shown). The main effect
Table 1. Means of percentage discoloration of overwrapped (OW) and high oxygen (HiO2-MAP) packaged strip loins (m. longissimus lumborum) aged for
8 and 29 days, during 7 days of simulated retail display conditions.
Retail display (days) Contrasts (P-value)
Corn vs. WDGS vs. No AG Corn vs. Corn + WDGS vs.Aging (days) Treatments 0 1 2 3 4 5 6 7 WDGS AG + AG AG
HiO2-MAP 8 Corn 0.00b 0.00b 0.00b 0.00b 0.00b 0.00b 0.47b 3.12a 0.68 0.20 0.18 0.06
30%WDGS 0.00 0.00 0.00 0.00 0.00 0.23 0.64 2.23 Corn+AG 0.00 0.00 0.00 0.00 0.00 0.04 0.21 0.76 30%WDGS+AG 0.00 0.00 0.00 0.00 0.00 0.00 0.07 0.28HiO
2-MAP 29 Corn 0.00c 0.00c 0.00c 0.00c 0.00c 0.93c 8.42b 17.07aA 0.73 0.43 0.89 0.64
30%WDGS 0.00c 0.00c 0.00c 0.00c 0.00c 0.30c 5.16b 18.12aA
Corn+AG 0.00c 0.00c 0.00c 0.00c 0.00c 0.49c 4.42b 11.42aB
30%WDGS+AG 0.00c 0.00c 0.00c 0.00c 0.04c 0.65c 6.65b 17.99aA
OW 8 Corn 0.00d 0.09d 0.09d 0.33d 1.65 d 5.20 c 12.12 b 24.06 aA 0.34 0.65 0.09 0.39 30%WDGS 0.00d 0.00d 0.00d 0.32 d 1.53 d 5.46 c 12.61 b 27.71 aA
Corn+AG 0.00d 0.00d 0.00d 0.32 d 1.94 d 6.63 c 13.52 b 26.24 aA
30%WDGS+AG 0.00d 0.00d 0.00d 0.01d 1.62 cd 3.79 c 8.44 b 15.72 aB
OW 29 Corn 0.00 f 0.00f 0.24f 2.53e 9.73dA 19.57cA 28.38bA 39.49aA 0.56 0.14 0.98 0.29 30%WDGS 0.00 e 0.00 e 0.06 e 1.18 e 5.73dAB 15.68cAB 27.30bA 42.86aA
Corn+AG 0.00 e 0.00e 0.03e 0.74e 4.80dB 11.69cB 19.33bB 29.13aB
30%WDGS+AG 0.00 e 0.00e 0.15e 1.25e 5.01dB 14.65cB 28.03bA 43.08aA
a-fComparison within a row, means lacking a common superscript were different at P < 0.05.A-BComparison within a column by aging, means lacking a common superscript were different at P < 0.05. WDGS – Wet distillers grains plus solubles, AG – AGRADO®PLUS.P-value for treatment×packaging×aging×day < 0.0001.
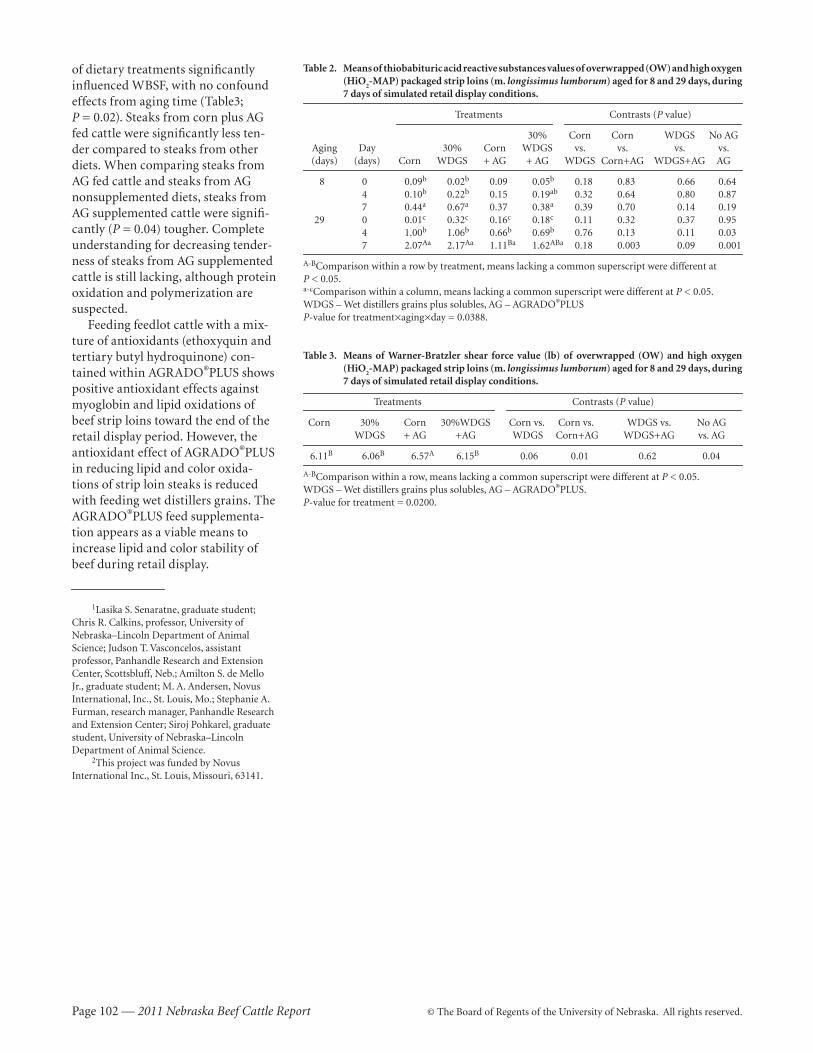
Page 102 — 2011 Nebraska Beef Cattle Report © The Board of Regents of the University of Nebraska. All rights reserved.
of dietary treatments significantly influenced WBSF, with no confound effects from aging time (Table3; P = 0.02). Steaks from corn plus AG fed cattle were significantly less ten-der compared to steaks from other diets. When comparing steaks from AG fed cattle and steaks from AG nonsupplemented diets, steaks from AG sup plemented cattle were signifi-cantly (P = 0.04) tougher. Complete understanding for decreasing tender-ness of steaks from AG supplemented cattle is still lacking, although protein oxidation and polymerization are suspected.
Feeding feedlot cattle with a mix-ture of antioxidants (ethoxyquin and tertiary butyl hydroquinone) con-tained within AGRADO®PLUS shows positive antioxidant effects against myoglobin and lipid oxidations of beef strip loins toward the end of the retail display period. However, the antioxidant effect of AGRADO®PLUS in reducing lipid and color oxida-tions of strip loin steaks is reduced with feeding wet distillers grains. The AGRADO®PLUS feed supplementa-tion appears as a viable means to increase lipid and color stability of beef during retail display.
1Lasika S. Senaratne, graduate student; Chris R. Calkins, professor, University of Nebraska–Lincoln Department of Animal Science; Judson T. Vasconcelos, assistant professor, Panhandle Research and Extension Center, Scottsbluff, Neb.; Amilton S. de Mello Jr., graduate student; M. A. Andersen, Novus International, Inc., St. Louis, Mo.; Stephanie A. Furman, research manager, Panhandle Research and Extension Center; Siroj Pohkarel, graduate student, University of Nebraska–Lincoln Department of Animal Science.
2This project was funded by Novus International Inc., St. Louis, Missouri, 63141.
Table 2. Means of thiobabituric acid reactive substances values of overwrapped (OW) and high oxygen (HiO
2-MAP) packaged strip loins (m. longissimus lumborum) aged for 8 and 29 days, during
7 days of simulated retail display conditions.
Treatments Contrasts (P value)
30% Corn Corn WDGS No AG Aging Day 30% Corn WDGS vs. vs. vs. vs. (days) (days) Corn WDGS + AG + AG WDGS Corn+AG WDGS+AG AG
8 0 0.09b 0.02b 0.09 0.05b 0.18 0.83 0.66 0.64 4 0.10b 0.22b 0.15 0.19ab 0.32 0.64 0.80 0.87 7 0.44a 0.67a 0.37 0.38a 0.39 0.70 0.14 0.19 29 0 0.01c 0.32c 0.16c 0.18c 0.11 0.32 0.37 0.95 4 1.00b 1.06b 0.66b 0.69b 0.76 0.13 0.11 0.03 7 2.07Aa 2.17Aa 1.11Ba 1.62ABa 0.18 0.003 0.09 0.001
A-BComparison within a row by treatment, means lacking a common superscript were different at P < 0.05.a-cComparison within a column, means lacking a common superscript were different at P < 0.05. WDGS – Wet distillers grains plus solubles, AG – AGRADO®PLUSP-value for treatment×aging×day = 0.0388.
Table 3. Means of Warner-Bratzler shear force value (lb) of overwrapped (OW) and high oxygen (HiO
2-MAP) packaged strip loins (m. longissimus lumborum) aged for 8 and 29 days, during
7 days of simulated retail display conditions.
Treatments Contrasts (P value)
Corn 30% Corn 30%WDGS Corn vs. Corn vs. WDGS vs. No AG WDGS + AG +AG WDGS Corn+AG WDGS+AG vs. AG
6.11B 6.06B 6.57A 6.15B 0.06 0.01 0.62 0.04
A-BComparison within a row, means lacking a common superscript were different at P < 0.05.WDGS – Wet distillers grains plus solubles, AG – AGRADO®PLUS.P-value for treatment = 0.0200.

© The Board of Regents of the University of Nebraska. All rights reserved. 2011 Nebraska Beef Cattle Report — Page 103
(Continued on next page)
Effects of the Synthetic Antioxidants on Shelf Life of m. psoas major and m. triceps brachii Muscles
from Beef Fed Wet Distillers Grains
part of a previous study conducted by Senaratne et al. (2011 Nebraska Beef Cattle Report, pp. 105-108). Since muscles are structurally and biochem-ically different from each other, this study aimed to investigate the effects of AG supplementation on shelf life of tenderloins (m. psoas major) and clod heart (m. triceps brachii) muscles from finishing beef steers fed WDGS.
Procedure
Crossbred steers were allotted to one of four dry-rolled corn-based diets containing 0% and 30% WDGS (DM basis) with or without AG supplemen-tation at 150 ppm/head/day. All condi-tions at feeding, slaughter, and grading were similar to procedures described by Senaratne et al. (2011 Nebraska Beef Cattle Report, pp. 105-108). In addition to beef loin, short loin, beef chuck, and shoulder clod (IMPS # 144; NAMP, 2007) were also collected and aged for either 8 or 29 days in a cooler. After each aging period, tenderloins (m. psoas major; IMPS # 1190A; NAMP, 2007) and clod hearts (m. triceps bra-chii; IMPS # 114E; NAMP, 2007) were fabricated. Tenderloins were cut into three 1-inch-thick steaks from the posterior end, whereas three 1-inch-thick steaks were removed from the middle of the clod hearts. The first anterior steaks of each muscle were vacuum packaged and stored at -4oF. Additional steaks were aerobically packaged on Styro foam trays and assigned for 4 or 7 days retail display. Lipid oxidation measurements (0, 4, and 7 days) and subjective surface discoloration ratings (1 to 7 days) were conducted. All conditions at packag-ing, retail display, discoloration evalu-ation, lipid oxidation measurements, and statistical analysis were similar to procedures mentioned by Senaratne et al. (2011 Nebraska Beef Cattle Report, pp. 105-108).
Results
There were significant (P <.0001) three-way interaction effects of treat-ment × aging × day on percentage discoloration of tenderloin and clod heart (Table 1) steaks. Discoloration of all muscle steaks increased during retail display time after each aging period. No significant discoloration differences (P > 0.05) were detected among dietary treatments for 8- and 29-day aged tenderloin and clod heart steaks until three days of retail display. After that, steaks (from both aging periods) from cattle fed corn with AG supplementation had the lowest discoloration (P < 0.05). Both steaks from WDGS-fed cattle (with or without AG) had significantly (P < 0.05) higher surface discolorations compared to steaks from corn-fed cattle (with or without AG). The ef-fectiveness of AG supplementation in reducing discoloration was prominent when meat was aged longer. However, the anti-discoloration effect of AG supplementation were not significant when cattle were fed WDGS. The rea-son for high discoloration even after adding AG into the diet is likely due to the increase of easily oxidizable, PUFA in beef from feeding WDGS. de Mello Jr., et al. (2008 Nebraska Beef Cattle Report, pp. 116-117) and Senaratne et al. (2009 Nebraska Beef Cattle Report, pp. 110-111) reported that feeding WDGS increased PUFA level in beef compared to corn control diets and compromised color.
There were significant two-way in-teraction effects of treatment × day on lipid oxidation of tenderloins (Table 2; P = 0.0279) and clod heart (Table 2; P = 0.0011) steaks. As aging and retail display time increased lipid oxidation also increased (P < 0.0001). Both steak types from cattle fed AG had signifi-cantly (P < 0.05) lower TBARS values
Lasika S. SenaratneChris R. Calkins
Judson T. Vasconcelos Amilton S. de Mello, Jr.
M. A. AndersenStephanie A. Furman
Siroj Pokharel1,2
Summary
Feedlot finishing steers (n = 483) were randomly allotted to four dry-rolled corn based diets containing 0 or 30% wet distillers grains with or without the synthetic antioxidants supplementation (ethoxyquin and tertiary butyl hydroqui-none in AGRADO®PLUS). This study intended to minimize detrimental effects of feeding wet distillers grains on color and lipid oxidation of beef tenderloin and clod heart muscles during retail dis-play by feeding a synthetic antioxidant mixture. Feeding AGRADO®PLUS sig-nificantly reduced meat discoloration and lipid oxidation.
Introduction
de Mello Jr., et al. (2008 Nebraska Beef Cattle Report, pp. 116-117) and Senaratne et al. (2009 Nebraska Beef Cattle Report, pp. 110-111) reported wet distillers grains (WDGS) diets increase polyunsaturated fatty acids (PUFA) in beef, and thereby it nega-tively affects beef color, lipid oxida-tion, and flavor during retail display. Senaratne et al. (2009 Nebraska Beef Cattle Report, pp. 113-115) reported vitamin E supplementation (500 IU/head/day for last 100 days) significant-ly reduced these detrimental effects of feeding WDGS on beef retail dis-played. A mixture of synthetic antiox-idants, ethoxyquin, and tertiary butyl hydroquinone in AGRADO®PLUS (AG) might be beneficial in reducing the negative effects of feeding WDGS on beef shelf life. This study was a
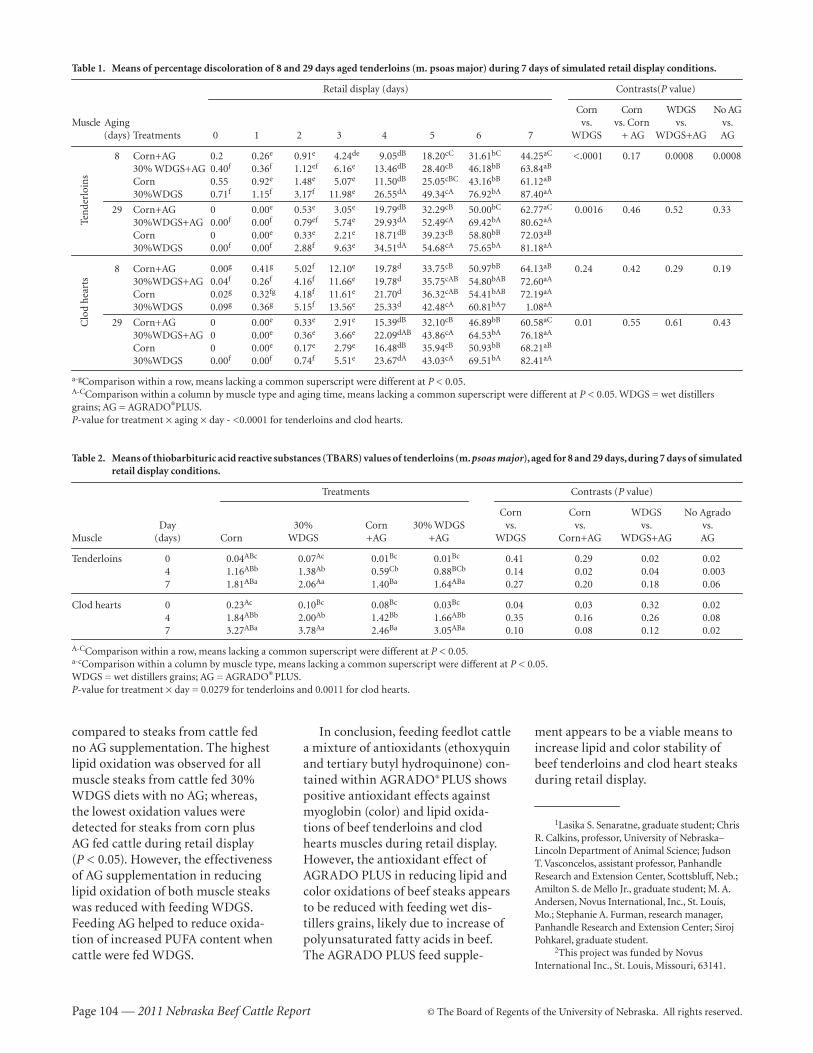
Page 104 — 2011 Nebraska Beef Cattle Report © The Board of Regents of the University of Nebraska. All rights reserved.
compared to steaks from cattle fed no AG supplementation. The highest lipid oxidation was observed for all muscle steaks from cattle fed 30% WDGS diets with no AG; whereas, the lowest oxidation values were detected for steaks from corn plus AG fed cattle during retail display (P < 0.05). However, the effectiveness of AG supplementation in reducing lipid oxidation of both muscle steaks was reduced with feeding WDGS. Feeding AG helped to reduce oxida-tion of increased PUFA content when cattle were fed WDGS.
Table 1. Means of percentage discoloration of 8 and 29 days aged tenderloins (m. psoas major) during 7 days of simulated retail display conditions.
Retail display (days) Contrasts(P value)
Corn Corn WDGS No AGMuscle Aging vs. vs. Corn vs. vs. (days) Treatments 0 1 2 3 4 5 6 7 WDGS + AG WDGS+AG AG
8 Corn+AG 0.2 0.26e 0.91e 4.24de 9.05dB 18.20cC 31.61bC 44.25aC <.0001 0.17 0.0008 0.0008 30% WDGS+AG 0.40f 0.36f 1.12ef 6.16e 13.46dB 28.40cB 46.18bB 63.84aB
Corn 0.55 0.92e 1.48e 5.07e 11.50dB 25.05cBC 43.16bB 61.12aB
30%WDGS 0.71f 1.15f 3.17f 11.98e 26.55dA 49.34cA 76.92bA 87.40aA
29 Corn+AG 0 0.00e 0.53e 3.05e 19.79dB 32.29cB 50.00bC 62.77aC 0.0016 0.46 0.52 0.33 30%WDGS+AG 0.00f 0.00f 0.79ef 5.74e 29.93dA 52.49cA 69.42bA 80.62aA
Corn 0 0.00e 0.33e 2.21e 18.71dB 39.23cB 58.80bB 72.03aB
30%WDGS 0.00f 0.00f 2.88f 9.63e 34.51dA 54.68cA 75.65bA 81.18aA
8 Corn+AG 0.00g 0.41g 5.02f 12.10e 19.78d 33.75cB 50.97bB 64.13aB 0.24 0.42 0.29 0.19 30%WDGS+AG 0.04f 0.26f 4.16f 11.66e 19.78d 35.75cAB 54.80bAB 72.60aA
Corn 0.02g 0.32fg 4.18f 11.61e 21.70d 36.32cAB 54.41bAB 72.19aA
30%WDGS 0.09g 0.36g 5.15f 13.56e 25.33d 42.48cA 60.81bA7 1.08aA
29 Corn+AG 0 0.00e 0.33e 2.91e 15.39dB 32.10cB 46.89bB 60.58aC 0.01 0.55 0.61 0.43 30%WDGS+AG 0 0.00e 0.36e 3.66e 22.09dAB 43.86cA 64.53bA 76.18aA
Corn 0 0.00e 0.17e 2.79e 16.48dB 35.94cB 50.93bB 68.21aB
30%WDGS 0.00f 0.00f 0.74f 5.51e 23.67dA 43.03cA 69.51bA 82.41aA
a-gComparison within a row, means lacking a common superscript were different at P < 0.05.A-CComparison within a column by muscle type and aging time, means lacking a common superscript were different at P < 0.05. WDGS = wet distillers grains; AG = AGRADO®PLUS.P-value for treatment × aging × day - <0.0001 for tenderloins and clod hearts.
Table 2. Means of thiobarbituric acid reactive substances (TBARS) values of tenderloins (m. psoas major), aged for 8 and 29 days, during 7 days of simulated retail display conditions.
Treatments Contrasts (P value)
Corn Corn WDGS No Agrado Day 30% Corn 30% WDGS vs. vs. vs. vs.Muscle (days) Corn WDGS +AG +AG WDGS Corn+AG WDGS+AG AG
Tenderloins 0 0.04ABc 0.07Ac 0.01Bc 0.01Bc 0.41 0.29 0.02 0.02 4 1.16ABb 1.38Ab 0.59Cb 0.88BCb 0.14 0.02 0.04 0.003 7 1.81ABa 2.06Aa 1.40Ba 1.64ABa 0.27 0.20 0.18 0.06
Clod hearts 0 0.23Ac 0.10Bc 0.08Bc 0.03Bc 0.04 0.03 0.32 0.02 4 1.84ABb 2.00Ab 1.42Bb 1.66ABb 0.35 0.16 0.26 0.08 7 3.27ABa 3.78Aa 2.46Ba 3.05ABa 0.10 0.08 0.12 0.02
A-CComparison within a row, means lacking a common superscript were different at P < 0.05.a-cComparison within a column by muscle type, means lacking a common superscript were different at P < 0.05. WDGS = wet distillers grains; AG = AGRADO® PLUS. P-value for treatment × day = 0.0279 for tenderloins and 0.0011 for clod hearts.
Clo
d h
eart
sTe
nde
rloi
ns
In conclusion, feeding feedlot cattle a mixture of antioxidants (ethoxyquin and tertiary butyl hydroquinone) con-tained within AGRADO® PLUS shows positive antioxidant effects against myoglobin (color) and lipid oxida-tions of beef tenderloins and clod hearts muscles during retail display. However, the antioxidant effect of AGRADO PLUS in reducing lipid and color oxidations of beef steaks appears to be reduced with feeding wet dis-tillers grains, likely due to increase of polyunsaturated fatty acids in beef. The AGRADO PLUS feed supple-
ment appears to be a viable means to increase lipid and color stability of beef tenderloins and clod heart steaks during retail display.
1Lasika S. Senaratne, graduate student; Chris R. Calkins, professor, University of Nebraska–Lincoln Department of Animal Science; Judson T. Vasconcelos, assistant professor, Panhandle Research and Extension Center, Scottsbluff, Neb.; Amilton S. de Mello Jr., graduate student; M. A. Andersen, Novus International, Inc., St. Louis, Mo.; Stephanie A. Furman, research manager, Panhandle Research and Extension Center; Siroj Pohkarel, graduate student.
2This project was funded by Novus International Inc., St. Louis, Missouri, 63141.
© The Board of Regents of the University of Nebraska. All rights reserved. 2011 Nebraska Beef Cattle Report — Page 105
Intramuscular Tenderness and Muscle Fiber Orientation of Beef Round Muscles
Lasika S. SenaratneChris R. Calkins
Amilton S. de Mello, Jr.Siroj Pokharel
Jeremey B. Hinkle1,2
Summary
Intramuscular tenderness and muscle fiber orientation variations of beef round m. adductor femoris (AF), m. biceps femoris (BF), m. semimembra-nosus (SM), and m. semitendinosus (ST) were investigated. The first two proximal steaks of long head of BF were more tender than the rest. The tender-ness decreased from the middle of the ST muscle to both ends. The anterior sides of the long head BF and ST were tough-er than their posterior sides. The first four steaks of the SM were more tender than rest of the muscle. There was a sig-nificant tenderness increment from the middle of the AF to its both ends. Based on tenderness values, the first two to four steaks of long head BF, SM, and AF and middle steaks of ST, could be marketed as premium quality steaks.
Introduction
Since most beef round muscles are large and long, the tenderness varies within the muscles from one end to the other. The knowledge of muscle fiber direction is important during meat fabrication so that muscles can be cut across the grain to improve the tenderness. Muscle fiber directions along the muscles of the beef round have not been documented. Charac-terization of all muscles in the beef round, based on their intramuscular tenderness and muscle fiber orienta-tion variations, therefore is necessary to apply value-added strategies for the beef round. This study, attempted first to identify tender portions of beef round muscles, m. adductor femoris (AF), m. biceps femoris (BF), semi-membranosus (SM), and m. semiten-dinosus (ST) that could be marketed
as “premium” round steaks or single muscle steaks based on tenderness, and second determined fabrication specifications for the beef round muscles based on their muscle fiber orientation.
Procedure
Ten of each beef round, top un-trimmed (IMPS #168; NAMP, 2007), beef round, outside round (IMPS #171B; NAMP, 2007), and beef round, eye of round (IMPS #171C; NAMP, 2007) were purchased as USDA Choice boxed beef subprimals and aged for 14 days from boxed date. The BF, ST, SM, and AF were fabricated from relevant subprimals. The anteri-or and distal directions of each muscle were tracked. Crust-frozen muscles were cut into 1-inch-thick steaks from the proximal to distal end, perpen-dicular to the long axis. Steaks were vacuum packaged and stored at -4oF.
Thawed steaks were grilled to an internal temperature of 160oF. Grilled steaks were cooled at 39oF for 24 hours. A 2 inch-wide region in the middle of grilled BF, SM, and AF was marked from posterior to anterior sides as posterior, middle, and anterior regions (Figure 1b, 3b, and 4b). Grilled ST steaks were hori-zontally divided into three regions from the medial to lateral as medial, middle, and lateral regions (Figure 2b). Each region of BF, SM, and AF were again subdivided into two sec-tions as medial and lateral (Figure 1b, 3b, and 4b). Medial, middle, and lateral regions of ST steaks were also subdivided into anterior and posterior sections. From each section of a steak, 0.5 inch-diameter cores were prepared parallel to the muscle fiber orientation and sheared on an Instron Universal Testing Machine with a triangular Warner-Bratzler shear attachment. An individual peak Warner-Bratzler shear force (WBSF) for each steak section was used for the statistical analysis.
The WBSF values of each section of steaks were calculated and used to construct intramuscular tenderness maps based on a color scheme (white – tender < 8.6 lb); gray – intermedi-ate tender 8.6 – 10.8 lb; and black – though >10.8 lb; Von Seggern et al. 2005 Journal of Animal Science, pp. 39-51).
Before removing cores, a digital image of muscle fiber orientation on the longitudinal section of the steak was captured using a digital camera (Model # DSC-S730 cyber-shot 7.2 megapixels, SONY Corp., China). The muscle fiber orientation on each digital picture was measured using a protractor, and expressed in degrees horizontally along the long axis of the muscle from the proximal to the distal at every inch. The fiber orienta-tion with the angle was illustrated on a longitudinal section of the muscle along the long axis from the proximal to the distal.
Warner-Bratzler shear force values were analyzed by using the ANOVA in GLIMMIX procedure of SAS (version 9.1), with a model including region or steak (from proximal to distal) of BF, ST, SM, and AF muscles. The side differences (anterior vs posterior or anterior/posterior vs middle, and medial vs lateral or medial/lateral vs middle) of each muscle steak were determined using the CONTRAST option in SAS. Least square means were calculated for each section using the LSMEANS and mean separation was performed using the DIFF and LINES options of SAS at P < 0.05.
Results
The most proximal two steaks of the BF, which were closest to the sir-loin/round separation, was the most tender region of the muscle (Figure 1a). The long head of BF had its high-est WBSF value in the middle region 4 to 8 inches from the sirloin/round
(Continued on next page)
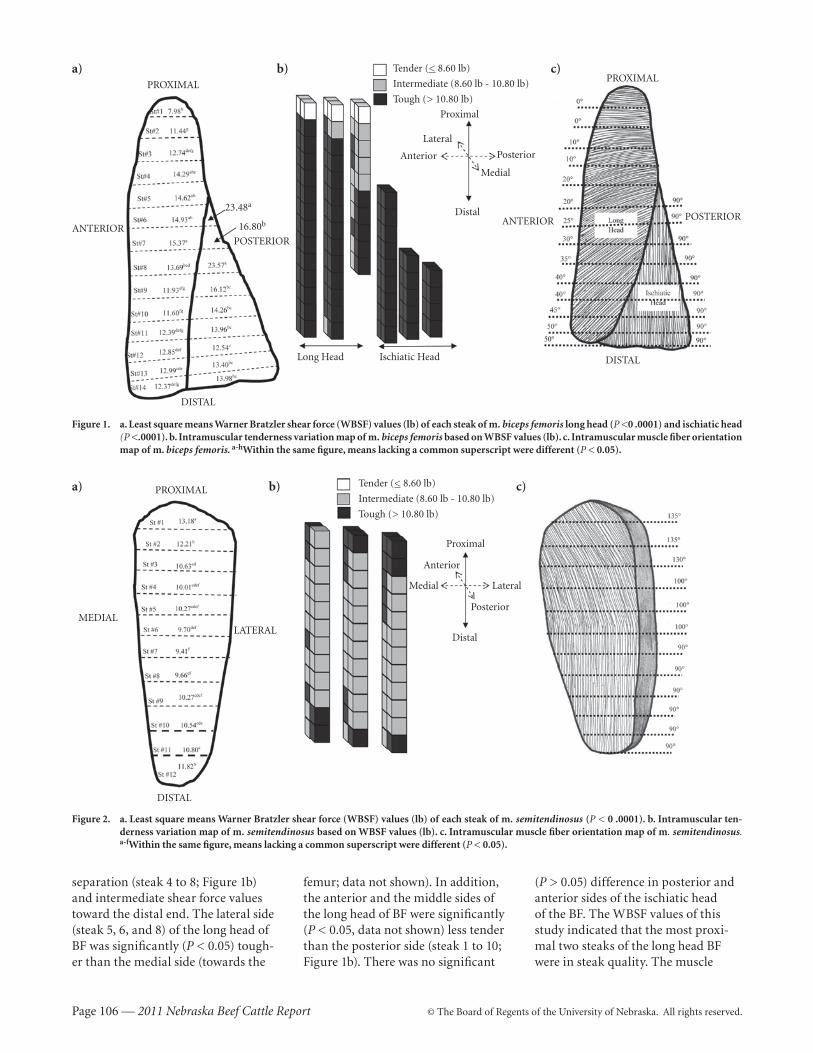
Page 106 — 2011 Nebraska Beef Cattle Report © The Board of Regents of the University of Nebraska. All rights reserved.
separation (steak 4 to 8; Figure 1b) and intermediate shear force values toward the distal end. The lateral side (steak 5, 6, and 8) of the long head of BF was significantly (P < 0.05) tough-er than the medial side (towards the
a) b) c)
23.48a
16.80b
Tender (< 8.60 lb)
Intermediate (8.60 lb - 10.80 lb)
Tough (> 10.80 lb)
PROXIMAL
ANTERIOR
Proximal
Lateral
Anterior Posterior
Medial
Long Head Ischiatic Head
PROXIMAL
POSTERIOR
POSTERIOR
ANTERIOR
DISTAL
DISTAL
Distal
Figure 1. a. Least square means Warner Bratzler shear force (WBSF) values (lb) of each steak of m. biceps femoris long head (P <0 .0001) and ischiatic head (P <.0001). b. Intramuscular tenderness variation map of m. biceps femoris based on WBSF values (lb). c. Intramuscular muscle fiber orientation map of m. biceps femoris. a-hWithin the same figure, means lacking a common superscript were different (P < 0.05).
femur; data not shown). In addition, the anterior and the middle sides of the long head of BF were significantly (P < 0.05, data not shown) less tender than the posterior side (steak 1 to 10; Figure 1b). There was no significant
(P > 0.05) difference in posterior and anterior sides of the ischiatic head of the BF. The WBSF values of this study indicated that the most proxi-mal two steaks of the long head BF were in steak quality. The muscle
Tender (< 8.60 lb)
Intermediate (8.60 lb - 10.80 lb)
Tough (> 10.80 lb)
MEDIAL
Proximal
Anterior
Medial
Posterior
Lateral
LATERAL
DISTAL
Distal
a) b) c)PROXIMAL
Figure 2. a. Least square means Warner Bratzler shear force (WBSF) values (lb) of each steak of m. semitendinosus (P < 0 .0001). b. Intramuscular ten-derness variation map of m. semitendinosus based on WBSF values (lb). c. Intramuscular muscle fiber orientation map of m. semitendinosus. a-fWithin the same figure, means lacking a common superscript were different (P < 0.05).

© The Board of Regents of the University of Nebraska. All rights reserved. 2011 Nebraska Beef Cattle Report — Page 107
fiber orientation of BF was bipennate (Figure 1c). At the sirloin/round sepa-ration region (steak 1 to 4) of the BF long head had more horizontal fiber orientation than the rest of the muscle (Figure 1c). Then, the degrees of inclination of muscle fibers of the long head BF were gradually more angular to the horizontal axis of the muscle. There was no variation of muscle fiber orientation in the ischiatic head of BF from the proximal to the distal. Muscle fibers of the ischiatic head of
BF were parallel to the long axis of the muscle.
There was significant (P < .0001) tenderness variation in the ST from the proximal to the distal (Figure 2a). The tenderness of the ST decreased from middle of the muscle to both ends (the proximal and the distal). The medial side (steak 2 to 4) of the ST was significantly (P < 0.05) more tender than the lateral side. The pos-terior side of the ST was significantly (P < 0.05; Figure 2b) more tender than
the anterior side of the muscle up to 9 inches from the proximal end. The middle side of the ST did not (P > 0.05) differ in tenderness from the medial or lateral side of the muscle, except for the first 2 inches from the proximal end. The muscle fiber orientation of the ST was fusi-form (Figure 2c). Tenderness mapping data suggests cutting the muscle into steaks perpendicular to the long axis of the muscle from the proximal to
Figure 3. a. Least square means Warner Bratzler shear force (WBSF) values (lb) of each steak of m. semimembranosus (P < 0 .0001). b. Intramuscular tenderness variation map of m. m. semimembranosus based on WBSF values (lb). c. Intramuscular muscle fiber orientation map of m. semimem-branosus. a-f Within the same figure, means lacking a common superscript were different (P < 0.05). The WBSF (lower values – tender; higher values – tough).
a) b) c)Tender (< 8.60 lb)
Intermediate (8.60 lb - 10.80 lb)
Tough (> 10.80 lb)
PROXIMAL
ANTERIOR
Proximal
Lateral
Anterior Posterior
Medial
PROXIMAL
POSTERIORPOSTERIOR ANTERIOR
DISTALDISTAL
Distal
(Continued on next page)
a) b) c)Tender (< 8.60 lb)
Intermediate (8.60 lb - 10.80 lb)
Tough (> 10.80 lb)
PROXIMAL
ANTERIOR
Proximal
Lateral
Anterior Posterior
Medial
PROXIMAL
POSTERIORPOSTERIOR ANTERIOR
DISTALDISTAL
Distal
Figure 4. a. Least square means Warner Bratzler shear force (WBSF) values (lb) of each steak of m. adductor femoris (P = 0.002). b. Intramuscular tender-ness variation map of m. m. adductor femoris based on WBSF values (lb). c. Intramuscular muscle fiber orientation map of m. adductor femoris. a-c Within the same figure, means lacking a common superscript were different (P < 0.05).
Page 108 — 2011 Nebraska Beef Cattle Report © The Board of Regents of the University of Nebraska. All rights reserved.
(Continued on next page)
the distal and selling middle tender steaks as “premium” to the rest.
The proximal end of the SM muscle up to 4 inches (steak 1 – 3) had significantly (P < 0.05) lower shear force values than the rest of the SM muscle (Figure 3a). The lateral side (steak 7 -8; Figure 3b) of the SM was less tender (P < 0.05) than the medial. There was no (P < 0.05) tenderness variation between the posterior and anterior sides of the muscle. The mus-cle fiber angle of the SM is 130o to the horizontal axis of the muscle along the muscle from proximal to distal making unipennate fiber orientation (Figure 3c). The most proximal steaks (steak 1 – 3 or 5) were in steak quality compared to the rest; therefore, the five proximal steaks could be market-ed as SM “premium” steaks and the
rest could be sold as regular SM steaks or as a roast.
The proximal and distal ends (steak 1, 6, and 7) of the AF were more tender than the center part of the muscle (Figure 4a). Overall tender-ness variations between medial and lateral sides or posterior and anterior sides were not significant (P > 0.05). The fiber arrangement of the AF was unipennate (Figure 4c). Tenderness and muscle fiber orientation maps of the study propose that the first two proximal and three distal steaks could be sold as “premium” AF steaks and the rest as regular steaks.
A clear intramuscular tenderness variation in the beef round muscles based on different anatomical orienta-tions is present. The first few steaks of large beef round muscles (BF, SM,
and AF and the middle steaks of ST) are more tender and could be sold at a premium compared to other steaks from the same muscles. Intramus-cular tenderness and muscle fiber orientation of the beef round muscle provide a complete guide for individ-ual muscle fabrication, which would be needed by the meat industry for development of innovative meat cuts for optimum eating quality, and by academia for research purposes.
1Lasika S. Senaratne, graduate student; Chris R. Calkins, professor; Amilton S. de Mello Jr., graduate student; Jeremey B. Hinkle, graduate student; Siroj Pokharel, graduate student, University of Nebraska–Lincoln Department of Animal Science.
2This project was funded, in part, by the Beef Checkoff and the Nebraska Beef Council.
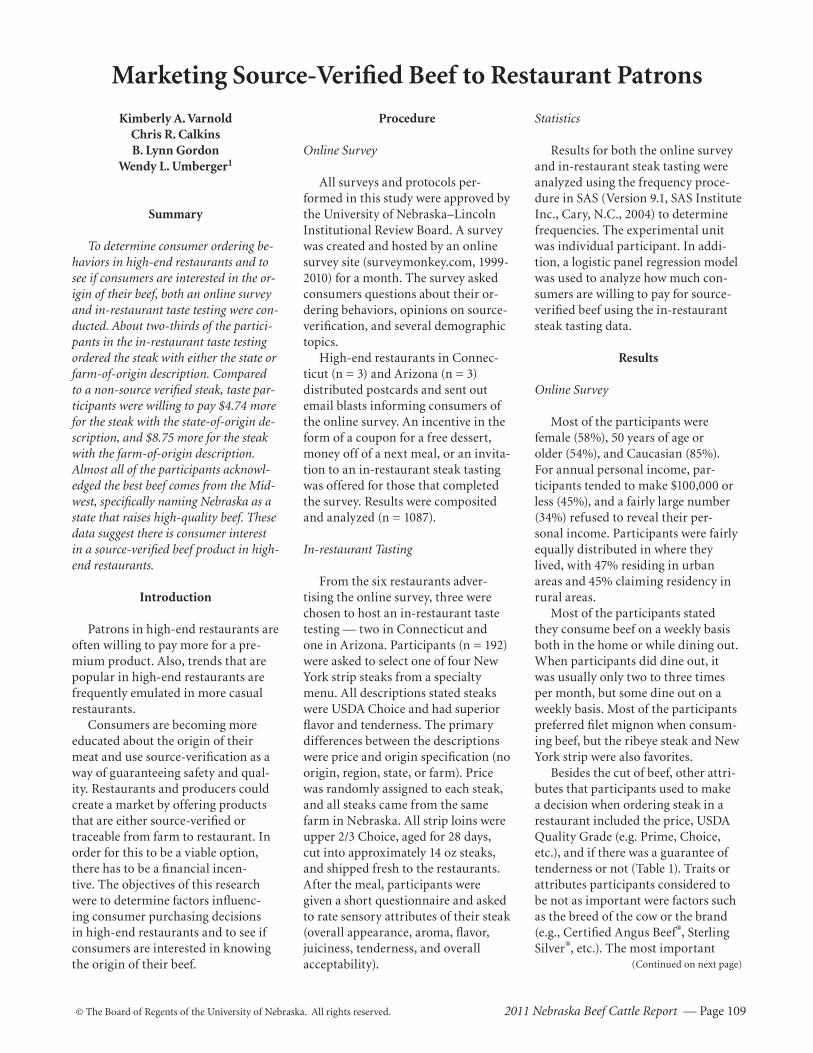
© The Board of Regents of the University of Nebraska. All rights reserved. 2011 Nebraska Beef Cattle Report — Page 109
(Continued on next page)
Marketing Source-Verified Beef to Restaurant Patrons
Kimberly A. VarnoldChris R. CalkinsB. Lynn Gordon
Wendy L. Umberger1
Summary
To determine consumer ordering be-haviors in high-end restaurants and to see if consumers are interested in the or-igin of their beef, both an online survey and in-restaurant taste testing were con-ducted. About two-thirds of the partici-pants in the in-restaurant taste testing ordered the steak with either the state or farm-of-origin description. Compared to a non-source verified steak, taste par-ticipants were willing to pay $4.74 more for the steak with the state-of-origin de-scription, and $8.75 more for the steak with the farm-of-origin description . Almost all of the participants acknowl-edged the best beef comes from the Mid-west, specifically naming Nebraska as a state that raises high-quality beef. These data suggest there is consumer interest in a source-verified beef product in high-end restaurants.
Introduction
Patrons in high-end restaurants are often willing to pay more for a pre-mium product. Also, trends that are popular in high-end restaurants are frequently emulated in more casual restaurants.
Consumers are becoming more educated about the origin of their meat and use source-verification as a way of guaranteeing safety and qual-ity. Restaurants and producers could create a market by offering products that are either source-verified or traceable from farm to restaurant. In order for this to be a viable option, there has to be a financial incen-tive. The objectives of this research were to determine factors influenc-ing consumer purchasing decisions in high-end restaurants and to see if consumers are interested in knowing the origin of their beef.
Procedure
Online Survey
All surveys and protocols per-formed in this study were approved by the University of Nebraska–Lincoln Insti tu tional Review Board. A survey was created and hosted by an online survey site (surveymonkey.com, 1999-2010) for a month. The survey asked consumers questions about their or-dering behaviors, opinions on source-verification, and several demographic topics.
High-end restaurants in Connec-ticut (n = 3) and Arizona (n = 3) distributed postcards and sent out email blasts informing consumers of the online survey. An incentive in the form of a coupon for a free dessert, money off of a next meal, or an invita-tion to an in-restaurant steak tasting was offered for those that completed the survey. Results were composited and analyzed (n = 1087).
In-restaurant Tasting
From the six restaurants adver-tising the online survey, three were chosen to host an in-restaurant taste testing — two in Connecticut and one in Arizona. Participants (n = 192) were asked to select one of four New York strip steaks from a specialty menu. All descriptions stated steaks were USDA Choice and had superior flavor and tenderness. The primary differences between the descriptions were price and origin specification (no origin, region, state, or farm). Price was randomly assigned to each steak, and all steaks came from the same farm in Nebraska. All strip loins were upper 2/3 Choice, aged for 28 days, cut into approximately 14 oz steaks, and shipped fresh to the restaurants. After the meal, participants were given a short questionnaire and asked to rate sensory attributes of their steak (overall appearance, aroma, flavor, juiciness, tenderness, and overall acceptability) .
Statistics
Results for both the online survey and in-restaurant steak tasting were analyzed using the frequency proce-dure in SAS (Version 9.1, SAS Institute Inc., Cary, N.C., 2004) to determine frequencies. The experimental unit was individual participant. In addi-tion, a logistic panel regression model was used to analyze how much con-sumers are willing to pay for source-verified beef using the in-restaurant steak tasting data.
Results
Online Survey
Most of the participants were female (58%), 50 years of age or older (54%), and Caucasian (85%). For annual personal income, par-ticipants tended to make $100,000 or less (45%), and a fairly large number (34%) refused to reveal their per-sonal income. Participants were fairly equally distributed in where they lived, with 47% residing in urban areas and 45% claiming residency in rural areas.
Most of the participants stated they consume beef on a weekly basis both in the home or while dining out. When participants did dine out, it was usually only two to three times per month, but some dine out on a weekly basis. Most of the participants preferred filet mignon when consum-ing beef, but the ribeye steak and New York strip were also favorites.
Besides the cut of beef, other attri-butes that participants used to make a decision when ordering steak in a restaurant included the price, USDA Quality Grade (e.g. Prime, Choice, etc.), and if there was a guarantee of tenderness or not (Table 1). Traits or attributes participants considered to be not as important were factors such as the breed of the cow or the brand (e.g., Certified Angus Beef®, Sterling Silver®, etc.). The most important
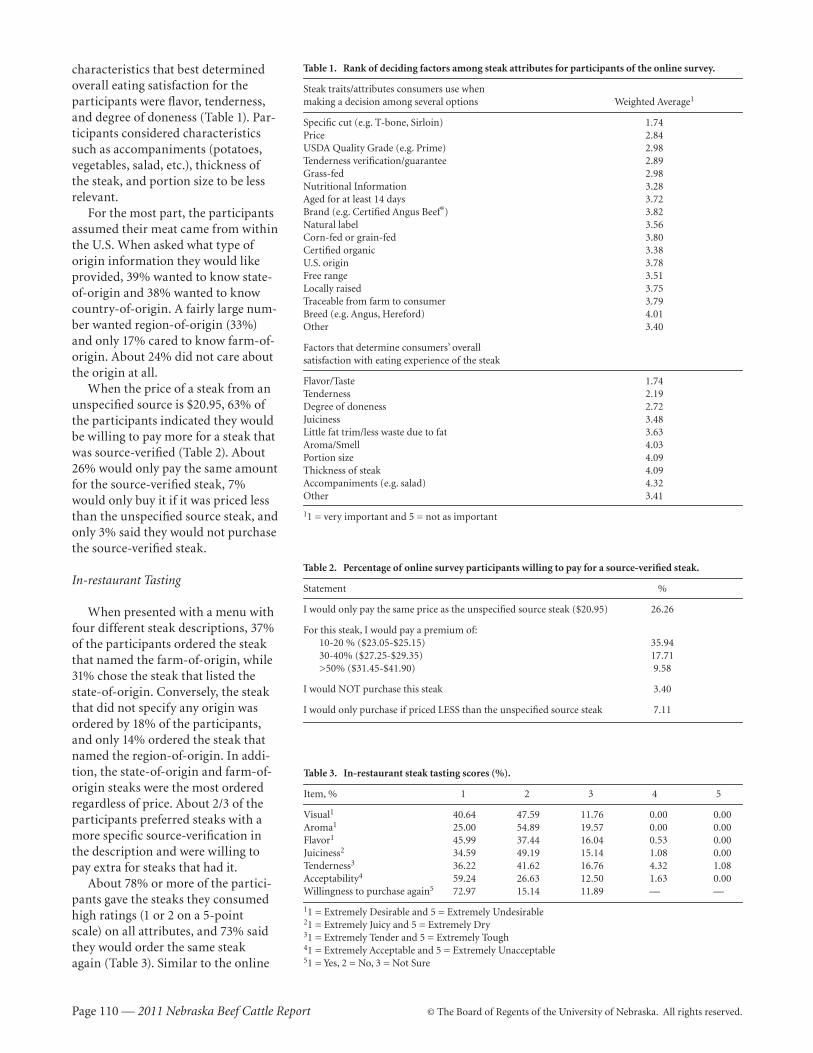
Page 110 — 2011 Nebraska Beef Cattle Report © The Board of Regents of the University of Nebraska. All rights reserved.
characteristics that best determined overall eating satisfaction for the participants were flavor, tenderness, and degree of doneness (Table 1). Par-ticipants considered characteristics such as accompaniments (potatoes, vegetables, salad, etc.), thickness of the steak, and portion size to be less relevant.
For the most part, the participants assumed their meat came from within the U.S. When asked what type of origin information they would like provided, 39% wanted to know state-of-origin and 38% wanted to know country-of-origin. A fairly large num-ber wanted region-of-origin (33%) and only 17% cared to know farm-of-origin. About 24% did not care about the origin at all.
When the price of a steak from an unspecified source is $20.95, 63% of the participants indicated they would be willing to pay more for a steak that was source-verified (Table 2). About 26% would only pay the same amount for the source-verified steak, 7% would only buy it if it was priced less than the unspecified source steak, and only 3% said they would not purchase the source-verified steak.
In-restaurant Tasting
When presented with a menu with four different steak descriptions, 37% of the participants ordered the steak that named the farm-of-origin, while 31% chose the steak that listed the state-of-origin. Conversely, the steak that did not specify any origin was ordered by 18% of the participants, and only 14% ordered the steak that named the region-of-origin. In addi-tion, the state-of-origin and farm-of-origin steaks were the most ordered regardless of price. About 2/3 of the participants preferred steaks with a more specific source-verification in the description and were willing to pay extra for steaks that had it.
About 78% or more of the partici-pants gave the steaks they consumed high ratings (1 or 2 on a 5-point scale) on all attributes, and 73% said they would order the same steak again (Table 3). Similar to the online
Table 1. Rank of deciding factors among steak attributes for participants of the online survey.
Steak traits/attributes consumers use when making a decision among several options Weighted Average1
Specific cut (e.g. T-bone, Sirloin) 1.74Price 2.84USDA Quality Grade (e.g. Prime) 2.98Tenderness verification/guarantee 2.89Grass-fed 2.98Nutritional Information 3.28Aged for at least 14 days 3.72 Brand (e.g. Certified Angus Beef®) 3.82Natural label 3.56Corn-fed or grain-fed 3.80Certified organic 3.38 U.S. origin 3.78Free range 3.51Locally raised 3.75Traceable from farm to consumer 3.79Breed (e.g. Angus, Hereford) 4.01Other 3.40
Factors that determine consumers’ overall satisfaction with eating experience of the steak
Flavor/Taste 1.74Tenderness 2.19Degree of doneness 2.72Juiciness 3.48Little fat trim/less waste due to fat 3.63Aroma/Smell 4.03Portion size 4.09Thickness of steak 4.09Accompaniments (e.g. salad) 4.32Other 3.41
11 = very important and 5 = not as important
Table 2. Percentage of online survey participants willing to pay for a source-verified steak.
Statement %
I would only pay the same price as the unspecified source steak ($20.95) 26.26
For this steak, I would pay a premium of: 10-20 % ($23.05-$25.15) 35.94 30-40% ($27.25-$29.35) 17.71 >50% ($31.45-$41.90) 9.58
I would NOT purchase this steak 3.40
I would only purchase if priced LESS than the unspecified source steak 7.11
Table 3. In-restaurant steak tasting scores (%).
Item, % 1 2 3 4 5
Visual1 40.64 47.59 11.76 0.00 0.00Aroma1 25.00 54.89 19.57 0.00 0.00Flavor1 45.99 37.44 16.04 0.53 0.00Juiciness2 34.59 49.19 15.14 1.08 0.00Tenderness3 36.22 41.62 16.76 4.32 1.08Acceptability4 59.24 26.63 12.50 1.63 0.00Willingness to purchase again5 72.97 15.14 11.89 — —
11 = Extremely Desirable and 5 = Extremely Undesirable21 = Extremely Juicy and 5 = Extremely Dry31 = Extremely Tender and 5 = Extremely Tough41 = Extremely Acceptable and 5 = Extremely Unacceptable51 = Yes, 2 = No, 3 = Not Sure
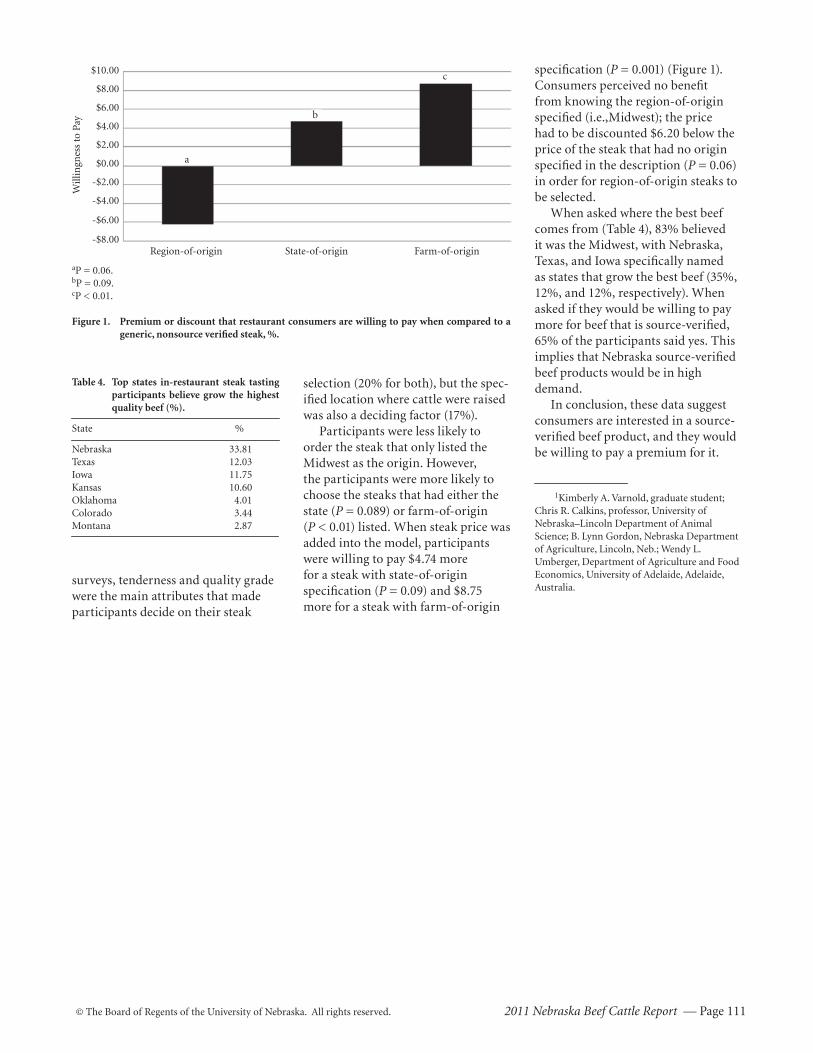
© The Board of Regents of the University of Nebraska. All rights reserved. 2011 Nebraska Beef Cattle Report — Page 111
specification (P = 0.001) (Figure 1). Consumers perceived no benefit from knowing the region-of-origin specified (i.e.,Midwest); the price had to be discounted $6.20 below the price of the steak that had no origin specified in the description (P = 0.06) in order for region-of-origin steaks to be selected.
When asked where the best beef comes from (Table 4), 83% believed it was the Midwest, with Nebraska, Texas, and Iowa specifically named as states that grow the best beef (35%, 12%, and 12%, respectively). When asked if they would be willing to pay more for beef that is source-verified, 65% of the participants said yes. This implies that Nebraska source-verified beef products would be in high demand .
In conclusion, these data suggest consumers are interested in a source-verified beef product, and they would be willing to pay a premium for it.
1Kimberly A. Varnold, graduate student; Chris R. Calkins, professor, University of Nebraska–Lincoln Department of Animal Science; B. Lynn Gordon, Nebraska Department of Agriculture, Lincoln, Neb.; Wendy L. Umberger, Department of Agriculture and Food Economics, University of Adelaide, Adelaide, Australia.
Table 4. Top states in-restaurant steak tasting participants believe grow the highest quality beef (%).
State %
Nebraska 33.81Texas 12.03Iowa 11.75Kansas 10.60Oklahoma 4.01Colorado 3.44Montana 2.87
aP = 0.06.bP = 0.09.cP < 0.01.
Figure 1. Premium or discount that restaurant consumers are willing to pay when compared to a generic, nonsource verified steak, %.
$10.00
$8.00
$6.00
$4.00
$2.00
$0.00
-$2.00
-$4.00
-$6.00
-$8.00
Will
ingn
ess
to P
ay
a
b
c
Region-of-origin State-of-origin Farm-of-origin
selection (20% for both), but the spec-ified location where cattle were raised was also a deciding factor (17%).
Participants were less likely to order the steak that only listed the Midwest as the origin. However, the participants were more likely to choose the steaks that had either the state (P = 0.089) or farm-of-origin (P < 0.01) listed. When steak price was added into the model, participants were willing to pay $4.74 more for a steak with state-of-origin specification (P = 0.09) and $8.75 more for a steak with farm-of-origin
surveys , tenderness and quality grade were the main attributes that made participants decide on their steak

Page 112 — 2011 Nebraska Beef Cattle Report © The Board of Regents of the University of Nebraska. All rights reserved.

© The Board of Regents of the University of Nebraska. All rights reserved. 2011 Nebraska Beef Cattle Report — Page 113
Statistics Used in the Nebraska Beef Reportand Their Purpose
The purpose of beef cattle and beef product research at UNL is to provide reference information that represents the various populations (cows, calves, heifers, feeders, carcasses, retail products, etc.) of beef production. Obviously, researchers cannot apply treatments to every member of a population; therefore, they must sample the population. The use of statistics allows researchers and readers of the Nebraska Beef Report the opportunity to evaluate separation of random (chance) occurrences and real biological effects of a treatment. Following is a brief description of the major statistics used in the beef report. For a more detailed description of the expectations of authors and parameters used in animal science, see Journal of Animal Science Style and Form (beginning pp. 339) at http://jas.fass.org/misc/ifora.shtml.
• Mean — Data for individual experimental units (cows, steers, steaks) exposed to the same treatment are generally averaged and reported in the text, tables and figures. The statistical term representing the average of a group of data points is mean.
• Variability — The inconsistency among the individual experimental units used to calculate a mean for the item measured is the variance. For example, if the ADG for all the steers used to calculate the mean for a treatment is 3.5 lb, then the variance is zero. But, this situation never happens! However, if ADG for individual steers used to calculate the mean for a treatment ranges from 1.0 lb to 5.0 lb, then the variance is large. The variance may be reported as standard deviation (square root of the variance) or as standard error of the mean. The standard error is the standard deviation of the mean as if we had done repeated samplings of data to calculate multiple means for a given treatment. In most cases treatment means and their measure of variability will be expressed as follows: 3.5 ± 0.15. This would be a mean of 3.5 followed by the standard error of the mean of 0.15. A helpful step combining both the mean and the variability from an experiment to conclude whether the treatment results in a real biological effect is to calculate a 95% confidence interval. This interval would be twice the standard error added to and subtracted from the mean. In the example above, this interval is 3.2-3.8 lb. If in an experiment, these intervals calculated for treatments of interest overlap, the experiment does not provide satisfactory evidence to conclude that treatment effects are different.
• P Value — Probability (P Value) refers to the likelihood the observed differences among treatment means are due to chance. For example, if the author reports P ≤ 0.05 as the significance level for a test of the differences between treatments as they affect ADG, the reader may conclude there is less than a 5% chance the differences observed between the means are a random occurrence and the treatments do not affect ADG. Hence we conclude that, because this probability of chance occurrence is small, there must be difference between the treatments in their effect on ADG. It is generally accepted among researchers when P values are less than or equal to 0.05, observed differences are deemed due to important treatment effects. Authors occasionally conclude that an effect is significant, hence real, if P values are between 0.05 and 0.10. Further, some authors may include a statement indicating there was a “tendency” or “trend” in the data. Authors often use these statements when P values are between 0.10 and 0.15, because they are not confident the differences among treatment means are real treatment effects. With P values of 0.10 and 0.15, the chance random sampling caused the observed differences is 1 in 10 and 1 in 6.7, respectively.
Page 114 — 2011 Nebraska Beef Cattle Report © The Board of Regents of the University of Nebraska. All rights reserved.
• Linear and Quadratic Contrasts — Some articles refer to linear (L) and quadratic (Q) responses to treatments. These parameters are used when the research involves increasing amounts of a factor as treatments. Examples are increasing amounts of a ration ingredient (corn, byproduct, or feed additive) or increasing amounts of a nutrient (protein, calcium, or vitamin E). The L and Q contrasts provide information regarding the shape of the response. Linear indicates a straight line response and quadratic indicates a curved response. P-values for these contrasts have the same interpretation as described above.
• Correlation (r) — Correlation indicates amount of linear relationship of two measurements. The correlation coefficient can range from –1 to 1. Values near zero indicate a weak relationship, values near 1 indicate a strong positive relationship, and a value of –1 indicates a strong negative relationship.

© The Board of Regents of the University of Nebraska. All rights reserved. 2011 Nebraska Beef Cattle Report — Page 115

Animal Sciencehttp://animalscience.unl.edu
Curriculum – The curriculum of the Department of Animal Science at the University of Nebraska–Lincoln is designed so that each student can select from a variety of options oriented to specific career goals in professions ranging from animal production to veterinary medicine. Animal Science majors can also easily double major in Grazing Livestock Systems (http://gls.unl.edu) or complete the Feedlot Management Internship Program (http://feedlot.unl.edu/intern). Another expanding educational experience is the Nebraska Beef Industry Scholars Program, a unique four year certification program for UNL students.
Careers:
Animal HealthAnimal Management Banking and FinanceConsultant
Scholarships – Thanks to the generous contributions of our supporters listed below, each year the Animal Science Department offers scholarships to incoming freshmen and transfer students, as well as students at the sophomore, junior, and senior level within the UNL Animal Science Program. For the 2010-2011 academic year, over $33,000 in scholarships were awarded to incoming freshmen and transfer students, and over $58,000 in scholarships were awarded to upperclass UNL Animal Science students.
EducationMarketing Meat ProcessingMeat Safety
Quality AssuranceResearch and Development Technical ServiceVeterinary Medicine
Elton D. & Carrie R. Aberle Animal Science ScholarshipABS Global ScholarshipDr. Charles H. & Beryle I. Adams ScholarshipMaurice E. Boeckenhauer Memorial ScholarshipRobert Boeckenhauer Memorial ScholarshipFrank and Mary Bruning ScholarshipFrank E. Card AwardMike Cull Block and Bridle Judging and Activities
ScholarshipDerrick Family ScholarshipDoane ScholarshipElanco Animal Health Livestock Judging ScholarshipFeedlot Management ScholarshipWill Forbes ScholarshipRichard & Joyce Frahm ScholarshipG. H. Francke Livestock Judging ScholarshipDon Geweke Memorial AwardWilliam J. Goldner ScholarshipDr. Robert Hatch ScholarshipDel Kopf Memorial ScholarshipDr. Tim & Florence Leon ScholarshipLincoln Coca-Cola Bottling Company ScholarshipWilliam J. and Hazel J. Loeffel Scholarship
Nebraska Cattlemen Livestock & Meat Judging Team Scholarship
Nebraska Cattlemen NCTA Transfer ScholarshipNebraska Cattlemen New Student ScholarshipNutrition Service Associates ScholarshipOxbow Pet Products Scholarship Parr Family Student Support FundParr Young Senior Merit Block and Bridle AwardEric Peterson Memorial AwardArt & Ruth Raun ScholarshipChris and Sarah Raun Memorial Scholarship Walter A. and Alice V. Rockwell Scholarship Frank & Shirley Sibert ScholarshipSirius Nutrition LLC ScholarshipPhilip Starck ScholarshipMax and Ora Mae Stark ScholarshipD.V. and Ernestine Stephens Memorial Scholarship Dwight F. Stephens Scholarship Arthur W. and Viola Thompson ScholarshipRichard C. and Larayne F. Wahlstrom ScholarshipThomas H. Wake, III ScholarshipR.B. & Doris Warren ScholarshipMemorial Winkler Livestock Judging ScholarshipWolf Scholarship