facilimange dynamics aka “facilies” cs 425 final presentation
DESCRIPTION
Facilimange Dynamics aka “Facilies” CS 425 Final Presentation. Curtis McKay Manneet Singh Brad Vonder Haar. Project Client: Facilities Management of Southern Illinois University Edwardsville. - PowerPoint PPT PresentationTRANSCRIPT

Facilimange DynamicsFacilimange Dynamicsaka “Facilies”aka “Facilies”
CS 425 Final PresentationCS 425 Final Presentation
Curtis McKayCurtis McKay
Manneet SinghManneet Singh
Brad Vonder HaarBrad Vonder Haar
Project Client: Facilities Management Project Client: Facilities Management of Southern Illinois University of Southern Illinois University Edwardsville.Edwardsville.
Project Summary: A customer Project Summary: A customer satisfaction survey system that will satisfaction survey system that will allow users to dynamically create, allow users to dynamically create, conduct, and compare surveys. conduct, and compare surveys.
Background InformationBackground Information
Facilities management is responsible Facilities management is responsible for all on-campus maintenance and for all on-campus maintenance and department custodial needs. These department custodial needs. These
needs can range from light bulb needs can range from light bulb replacement to road construction.replacement to road construction.

Customer’s ProblemCustomer’s Problem
Facilities Management would like to Facilities Management would like to track customer service satisfaction track customer service satisfaction
through the use of surveysthrough the use of surveys
There is currently no standardized There is currently no standardized system in place to create, conduct, system in place to create, conduct, and compare customer satisfaction and compare customer satisfaction
surveyssurveys

Customer’s Problem cont’d.Customer’s Problem cont’d.
The customer would like to be able to The customer would like to be able to compare historic survey responses.compare historic survey responses.
They want to show the strengths and They want to show the strengths and weaknesses of the department by weaknesses of the department by
examining the responses to individual examining the responses to individual questions.questions.

Problem AnalysisProblem Analysis
As a team we interviewed the Business As a team we interviewed the Business Manager, Customer Service Manager, Customer Service
Representative, and the Network Representative, and the Network Administrator of Facilities Administrator of Facilities
Management. Management.
We also examined previous attempts at We also examined previous attempts at a survey system application for a survey system application for
Facilities Management.Facilities Management.

Current SystemCurrent System
Two separate Access Databases and Two separate Access Databases and an RBase system have been an RBase system have been
created but only temporarily used.created but only temporarily used.
At the present time no surveys are At the present time no surveys are being conducted due to this lack of being conducted due to this lack of a useful all encompassing system.a useful all encompassing system.

Primary UsersPrimary Users
• Alicia Wainright – Departmental Business ManagerAlicia Wainright – Departmental Business Manager
• Lynda Pavia – Customer Service RepresentativeLynda Pavia – Customer Service Representative
• Kyle Stunkel – Network AdministratorKyle Stunkel – Network Administrator
Secondary UsersSecondary Users• Potential Student workersPotential Student workers

Functional RequirementsFunctional Requirements
• Ability to modify and create the individual Ability to modify and create the individual surveyssurveys
• Ability to add to the questions listAbility to add to the questions list• Ability to add to the categories listAbility to add to the categories list• Ability to add to the attributes listAbility to add to the attributes list• Ability to add to the space listAbility to add to the space list• Ability to add to the locale and service Ability to add to the locale and service
type listtype list• Each survey will have an ID and titleEach survey will have an ID and title• Answers will be recorded via a query Answers will be recorded via a query
based entry screenbased entry screen

Functional requirements Functional requirements cont’d.cont’d.
• Ability to import control number Ability to import control number information from existing Job Cost information from existing Job Cost databasedatabase
• Problem areas can be flagged for Problem areas can be flagged for further examinationfurther examination
• Follow-up dates can be posted for each Follow-up dates can be posted for each survey if a resolution has not been metsurvey if a resolution has not been met
• Comparative reports can be Comparative reports can be dynamically generated depending dynamically generated depending upon what information is wanted at upon what information is wanted at any given timeany given time

Non-Functional Non-Functional RequirementsRequirements
• Interface will be written using Visual Basic 6Interface will be written using Visual Basic 6
• Needs to interact with existing RBase Needs to interact with existing RBase DatabaseDatabase
• IBM compatible PC running Windows 95 or IBM compatible PC running Windows 95 or higher is requiredhigher is required
• Various ID’s will be auto-assigned by AccessVarious ID’s will be auto-assigned by Access

Proposed Work ModelProposed Work ModelFacilities Management Complete a Job
A survey is created in order to determine the customer’s satisfaction.
The survey is given a unique SurveyID and stored in the database.
The survey is conducted, usually over the phone.
Information about the job in question is imported, such as contact info, type of work performed, etc…
The responses are recorded along with the questions and the SurveyID.
If required, a flag is set on important or urgent responses to which attention needs to be drawn (usually this means low scores).
Follow Up date(s) are set up with the person over the phone, and recorded along with the survey information.
Urgent surveys are sent to Building Coordinators so that the problem can be addressed immediately.
When a call back day is reached, the customer is contacted to determine the current situation.
When the problem is solved, the resolution date is recorded along with the other survey information.
Surveys are compared (in a manner specified by the user), and reports are generated to determine problem areas in customer satisfaction.

Design DecisionsDesign Decisions
• We will be using VB v6 to create We will be using VB v6 to create the interface and computational the interface and computational backend of the projectbackend of the project
• Microsoft Access 2000 will be the Microsoft Access 2000 will be the database used to store and query database used to store and query all of our informationall of our information

Dual Pyramid StructureDual Pyramid Structure
Survey ID
Description, survey type, Stamped ID, Stamped Date &
Time
Question as a whole
Question / Service Department / Attribute / Space
Requestor Contact
Response ID
Survey ID
Control #, Date resolved, open/closed, e-mail, requestor,
locale, red flag, follow-up dates/audit history
User Response (1 – 5, y/n, comments)

THE DATABASETHE DATABASE

Visual Basic InterfaceVisual Basic Interface

Main Interface ScreenMain Interface Screen

Create InterfaceCreate Interface
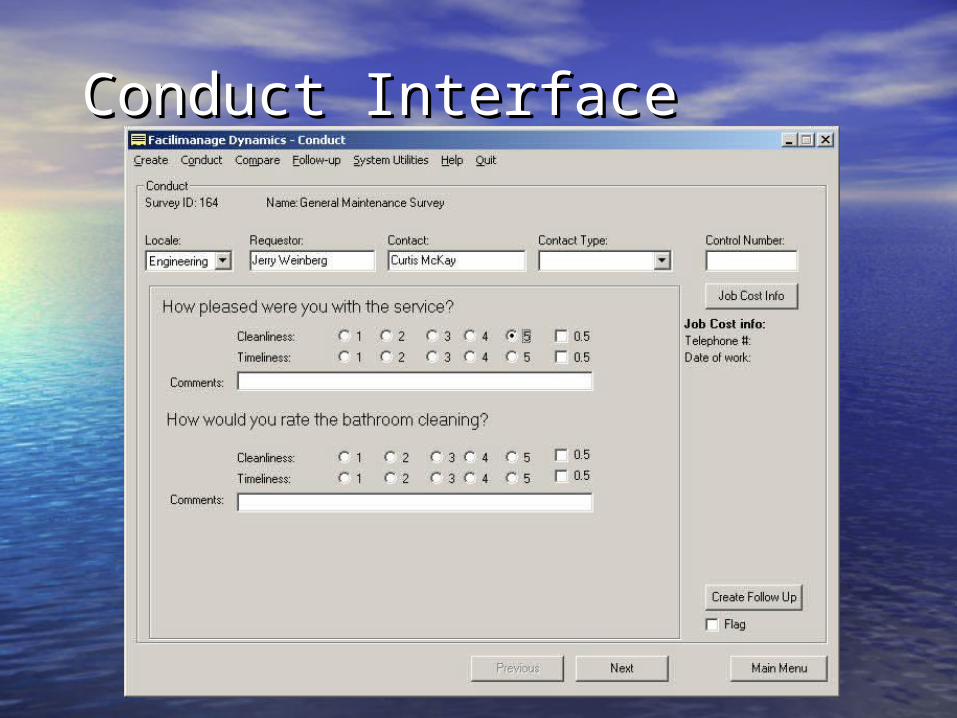
Conduct InterfaceConduct Interface
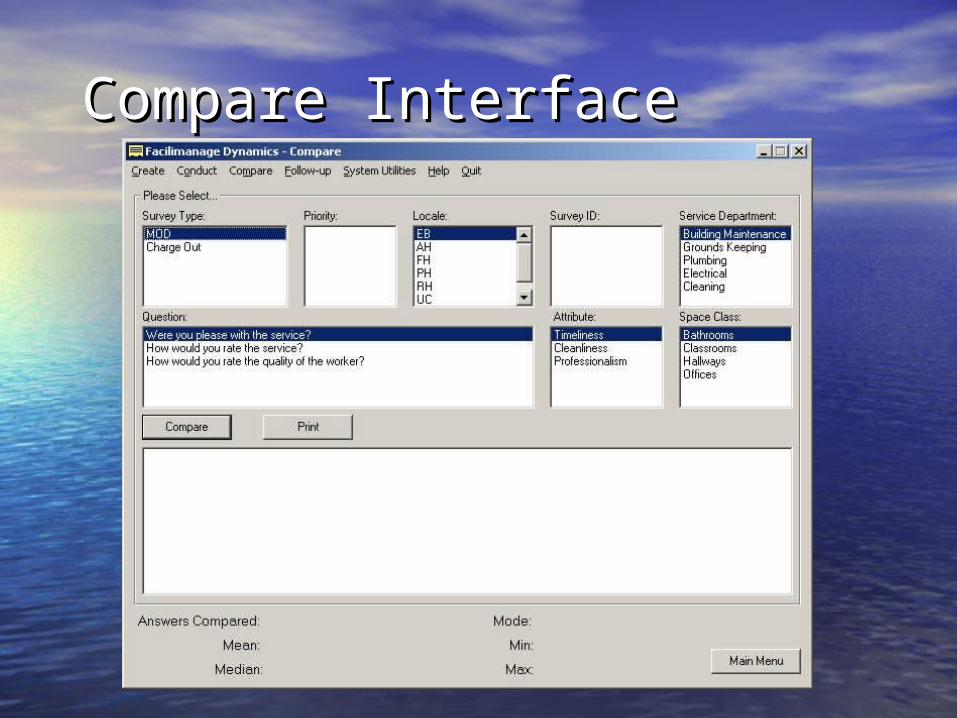
Compare InterfaceCompare Interface

Consistency Consistency

Follow UpsFollow Ups

System UtilitiesSystem Utilities

How the system interactsHow the system interactsAccess DatabaseVB Interface
CreateNew QuestionNew CategoryNew Attribute
New Space
ConductNew FollowUp
CompareUser Selectable Text File
System Utilities
New Service
New LocaleNew Taker Type
FollowUpsNew FollowUp
Login UsersSurvey
ServiceTypeSurvey Questions
QuestionCategoryAttribute
SpaceResponseAnswer
SurveyTakerLocale
Follow Up

Organizational PlanOrganizational Plan
Dr. Jerry Weinberg
Upper Management
Curtis McKay
Team Manager
Brad Vonder Haar
Lead Analyst
Manneet Singh
Lead Designer
Facilities Management
Client

Organization Organization ResponsibilitiesResponsibilities• Curtis Curtis - plans meeting times and places- plans meeting times and places
- assigns what tasks need to be done- assigns what tasks need to be done - sets forth standards for - sets forth standards for
documentation documentation and programming and programming
• Brad Brad - head contact with client- head contact with client - responsible for appearance of - responsible for appearance of
interfaceinterface - in charge of testing and review- in charge of testing and review
• Manneet - responsible for understanding the Manneet - responsible for understanding the project in terms of data flow project in terms of data flow
- keeps meeting minutes- keeps meeting minutes- web-page designer- web-page designer

Modified Waterfall with Sub-Modified Waterfall with Sub-Projects and Risk ReductionProjects and Risk Reduction

Design TimelineDesign Timeline
Software Concept:Software Concept: 5 days 5 daysRequirements Analysis:Requirements Analysis: 22 days 22 daysArchitectural Design: Architectural Design: 20 days20 days Create Detailed Design: Create Detailed Design: 9 days 9 days Conduct Detailed Design: Conduct Detailed Design: 11 days11 days Compare Detailed Design: Compare Detailed Design: 9 days 9 days

Coding TimelineCoding Timeline
Create coding & debugging:Create coding & debugging: 33 days 33 daysCreate sub-system testing: Create sub-system testing: 7 days 7 days
Conduct coding & debugging: Conduct coding & debugging: 48 days 48 days
Conduct sub-system testing: 10 daysConduct sub-system testing: 10 days
Compare coding & debugging: Compare coding & debugging: 30 days 30 days
Compare sub-system testing: 7 daysCompare sub-system testing: 7 days
System Testing:System Testing: 14 days 14 days

Coding Timeline Gantt ChartCoding Timeline Gantt Chart

Risk Exposure tableRisk Exposure table
Possible RiskPossible Risk Percentage of Percentage of time losstime loss
Size of lossSize of loss Risk ExposureRisk Exposure
Feature CreepFeature Creep 75%75% 10 days10 days 7.57.5
Learning CurveLearning Curve 50%50% 14 days14 days 77
Overly Overly Optimistic Optimistic ScheduleSchedule
25%25% 14 days14 days 3.53.5
Inadequate Inadequate DesignDesign
20%20% 14 days14 days 2.82.8
Error Prone Error Prone ModulesModules
25%25% 10 days10 days 2.52.5

Additional Project Plan Additional Project Plan PiecesPieces
Process PlanProcess PlanTest PlanTest Plan
Change Management Change Management PlanPlan
Training PlanTraining PlanReview PlanReview Plan
Installation PlanInstallation PlanDocumentation PlanDocumentation PlanCoding StandardsCoding Standards

Questions???Questions???