facilitating the interpretation of pedobarography: the ... · pdf fileresearch open access...
TRANSCRIPT

Arno et al. Journal of Foot and Ankle Research (2016) 9:47 DOI 10.1186/s13047-016-0177-y
RESEARCH Open Access
Facilitating the interpretation ofpedobarography: the relative midfoot indexas marker for pathologic gait in ankleosteoarthritic and contralateral feet
Frigg Arno1*, Frigg Roman2, Wiewiorski Martin1, Goldoni Jennifer1 and Horisberger Monika1Abstract
Background: Pedobarography offers dynamic information about the foot, but the interpretation of its large data ischallenging. In a prior study it was shown that attention can be restricted to pedobarographic midfoot load data.We aim to verify this observation in ankle osteoarthritic and contralateral feet.
Methods: We assessed both feet of 120 patients with end-stage ankle osteoarthritis (OA) and 35 healthy volunteerswith AOFAS-score and dynamic pedobarography in barefoot condition. We introduce a new parameter, the RelativeMidfoot Index (RMI), representing the depth of the midfoot weighted by the maximal force (MF) in the hindfootand forefoot. Main outcome measures were the RMI, MF and contact times in the hindfoot, midfoot and forefoot.Ankle OA, contralateral and healthy feet were compared with ANOVA.
Results: The RMI was significantly smaller in OA feet (0.65 ± 0.19) and contralateral feet (0.69 ± 0.15) than in healthyfeet (0.84 ± 0.08, p < 0.0001). There was no significant difference between OA and contralateral feet. The RMIshowed a correlation of 0.48 with the AOFAS score. Contralateral and OA feet were significantly different fromhealthy feet (p < 0.001) in all parameters except the hindfoot MF. An RMI <0.8 showed a positive predictive value of80% and sensitivity of 78% for being unhealthy.
Conclusion: The RMI assists the interpretation of pedobarographic parameters and provides a user-friendlyindicator for unhealthy foot conditions with a cut-off value of 0.8. The contralateral feet of ankle OA patientsdiffered significantly from healthy feet and are therefore not suitable as control group.Level of Evidence: 3 case control study
Keywords: Ankle osteoarthritis, Contralateral feet, Control group, Pedobarography, Gait
BackgroundPedobarography is an established method to evaluate thefunction of feet and has been used to investigate manydifferent kinds of pathologies as well as outcomes aftersurgeries [1–7]. Pedobarography offers dynamic infor-mation about the foot during the rollover process andtherefore adds in important ways to static radiographicimaging. It is easily performed in the research setting,requires little time, and has low costs compared to amore complex three dimensional gait analysis.
* Correspondence: [email protected] Department, University of Basel, Basel, SwitzerlandFull list of author information is available at the end of the article
© The Author(s). 2016 Open Access This articInternational License (http://creativecommonsreproduction in any medium, provided you gthe Creative Commons license, and indicate if(http://creativecommons.org/publicdomain/ze
These advantages contrast with the challenges posedby its data analysis. A standard pedobarography systemsuch as the Novel Emed m/E system measures 18 basicand a number of optional parameters in 3 to 10 areas ofinterest as well as the total foot [8]. Such a measurementprovides values of 72–198 (4 to 11 times 18) parametersfor each foot [9]. These raw data are hard to interpret,and left unprocessed they provide no useful information.For this reason different authors have chosen to focuson selected parameters: average pressure [10], peakpressure [11], pressure time integral and contact time[1, 12]. However, it remains unclear whether select-ively focussing on one of these is appropriate because
le is distributed under the terms of the Creative Commons Attribution 4.0.org/licenses/by/4.0/), which permits unrestricted use, distribution, andive appropriate credit to the original author(s) and the source, provide a link tochanges were made. The Creative Commons Public Domain Dedication waiverro/1.0/) applies to the data made available in this article, unless otherwise stated.
Arno et al. Journal of Foot and Ankle Research (2016) 9:47 Page 2 of 8
no clear arguments have been given to choose one param-eter over the other and there is worry the parameters havebeen picked to yield positive results. For this reason, theextraction of clinically useful information from pedobaro-graphic data remains a challenge.A solution to this problem has to meet a several con-
ditions: First, a clear prescription has to be given aboutwith which parameters to report. Second, the numberof parameters has to be reduced: Often groups are com-pared with each other and with the 72–198 parametersfrom the Novel software, this would involve carrying out72–198 t-tests for two groups, 216–594 for 3 groups (=3×72 to 3×198), and 432 to 1188 for 4 groups (=6× 72 to198). In practice this would be time consuming and wouldinclude the reporting of 5% of false positive test results asside effect (e.g. 22–59 false significant rest results in com-paring 4 groups). Third, load parameters need to be nor-malized to body weight as any load parameter is directlydependent on the body weight, which distorts comparisonbetween individuals.To make pedobarograhy more user-friendly in daily
clinical work, an easy-to-use parameter is needed. Thefirst aim of this work was to develop and introduce such aparameter, which facilitates interpretation of a pedobaro-graphic measurement. We call this parameter the RelativeMidfoot Index (RMI). We show that this index is useful inthe analysis of ankle osteoarthritis. To this end we exam-ine patients with ankle osteoarthritis and compare themto healthy participants.Another problem encountered with comparison and in-
terpretation of pedobarographic data is that there existtwo different ways for comparison of the affected feet:comparison with the unaffected contralateral foot [13–15]or the comparison with feet of healthy participants[16–18]. The first method assumes that contralateralfeet can be regarded as healthy and that the foot prob-lem on one side would not affect the other side. How-ever, concerns about this assumption can be raised
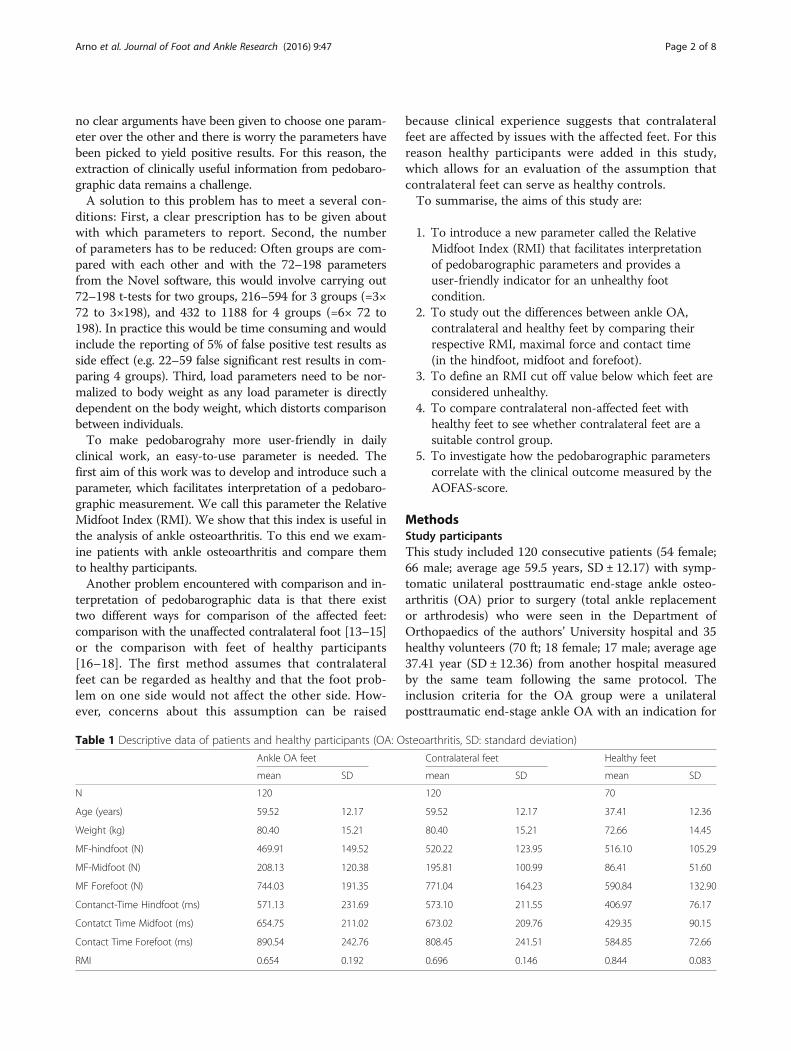
Table 1 Descriptive data of patients and healthy participants (OA: O
Ankle OA feet
mean SD
N 120
Age (years) 59.52 12.17
Weight (kg) 80.40 15.21
MF-hindfoot (N) 469.91 149.52
MF-Midfoot (N) 208.13 120.38
MF Forefoot (N) 744.03 191.35
Contanct-Time Hindfoot (ms) 571.13 231.69
Contatct Time Midfoot (ms) 654.75 211.02
Contact Time Forefoot (ms) 890.54 242.76
RMI 0.654 0.192
because clinical experience suggests that contralateralfeet are affected by issues with the affected feet. For thisreason healthy participants were added in this study,which allows for an evaluation of the assumption thatcontralateral feet can serve as healthy controls.To summarise, the aims of this study are:
1. To introduce a new parameter called the RelativeMidfoot Index (RMI) that facilitates interpretationof pedobarographic parameters and provides auser-friendly indicator for an unhealthy footcondition.
2. To study out the differences between ankle OA,contralateral and healthy feet by comparing theirrespective RMI, maximal force and contact time(in the hindfoot, midfoot and forefoot).
3. To define an RMI cut off value below which feet areconsidered unhealthy.
4. To compare contralateral non-affected feet withhealthy feet to see whether contralateral feet are asuitable control group.
5. To investigate how the pedobarographic parameterscorrelate with the clinical outcome measured by theAOFAS-score.
MethodsStudy participantsThis study included 120 consecutive patients (54 female;66 male; average age 59.5 years, SD ± 12.17) with symp-tomatic unilateral posttraumatic end-stage ankle osteo-arthritis (OA) prior to surgery (total ankle replacementor arthrodesis) who were seen in the Department ofOrthopaedics of the authors’ University hospital and 35healthy volunteers (70 ft; 18 female; 17 male; average age37.41 year (SD ± 12.36) from another hospital measuredby the same team following the same protocol. Theinclusion criteria for the OA group were a unilateralposttraumatic end-stage ankle OA with an indication for
steoarthritis, SD: standard deviation)
Contralateral feet Healthy feet
mean SD mean SD
120 70
59.52 12.17 37.41 12.36
80.40 15.21 72.66 14.45
520.22 123.95 516.10 105.29
195.81 100.99 86.41 51.60
771.04 164.23 590.84 132.90
573.10 211.55 406.97 76.17
673.02 209.76 429.35 90.15
808.45 241.51 584.85 72.66
0.696 0.146 0.844 0.083

Fig. 1 Four-area mask (hindfoot, midfoot, forefoot, toes) from theNovel scientific software (EMED, Novel GmbH, Munich, Germany).The heel-to-midfoot boundary was specified as 45% of length andthe midfoot-to-forefoot boundary was defined as 73% of length [8]
Arno et al. Journal of Foot and Ankle Research (2016) 9:47 Page 3 of 8
either ankle fusion or total ankle arthroplasty. Exclusioncriteria were bilateral ankle injuries, primary ankle OA,inflammatory secondary ankle OA, rheumatoid ankleOA, Charcot ankle neuroarthropathy and patients show-ing an abnormal gait resulting from other reasons. Vol-unteers were recruited from the patients’ companionsand included if they had no history of foot complaintsor disorders, an unlimited walking capability (AOFASscore 100 points, American Orthopedic Foot and AnkleSociety) [19] and no pathologies in clinical examinationof the foot. The baseline demographics of the twogroups are given in Table 1.All participants signed an approved informed consent
form. The Ethical Review Board of the authors’ universitygave approval to the study and the study was performedin accordance with the World Medical AssociationDeclaration of Helsinki.
PedobarographyGait analysis of all patients and healthy volunteers wasperformed using dynamic pedobarography (Novel emedm/E, St Paul, MN or EMED, Novel GmbH, Munich,Germany). The runway consisted of hard plastic and hada measuring plate with 2736 sensors (spatial resolutionof 4 sensors/cm2). The dynamic foot load was measuredwith a frequency of 50 Hz. Participants performed aminimum of five walks per foot to make sure that thesoftware had enough acceptable footprints.Participants walked barefoot with normal steps and at
their own chosen speed. They took five steps before andafter walking onto/off the measuring plate in order toavoid effects of acceleration and deceleration [20]. Datawere then analysed with the Novel scientific software usinga four-area mask (hindfoot, midfoot, forefoot, toes, Fig. 1).The heel to midfoot boundary was specified as 45% oflength and the midfoot to forefoot was defined as 73% oflength [8]. The toe mask was excluded for two reasons:single toes may show high pressures and toes are not asimportant as the rest of the foot for the rollover process.
Relative midfoot indexIn an earlier study, the large number of pedobarographicparameters was reduced to 27 parameters, 9 each forhindfoot, midfoot, and forefoot, and aggregated into twoclusters: One cluster of rollover parameters, describingthe temporal motion of the foot over the ground fromheel strike to toe off (containing the centre of pressurevelocity, contact time, instants of maximal force (MF)and peak pressure (PP)) and one cluster of load parame-ters (MF and PP, integral of MF and PP) [9]. This reduc-tion was crucial to make the data amenable to statisticalanalysis and to pave the ground for a clinical interpret-ation of results. The core result was that the cluster ofload for the midfoot was the most important predictor

Arno et al. Journal of Foot and Ankle Research (2016) 9:47 Page 4 of 8
to distinguish between healthy volunteers, ankle arthrod-esis (AA) or tibiotalocalcaneal arthrodesis (TTC) andthat the MF had the strongest correlation within thiscluster [9]. Furthermore, MF is generally the parameterthat provides most insight into gait mechanics because,unlike pressure, it is independent of local foot callositiesor deformities. We therefore created a new parameter,which we call the Relative Midfoot Index (RMI) repre-senting the depth of the midfoot valley of the force-timecurve in relation to the amount of maximal force (MF)in the hindfoot and forefoot (Fig. 2):RMI ¼ 1− 2MFm
MFfþMFh
MFm, MFf, and MFh are the MF for the midfoot, fore-foot, and hindfoot respectively. In effect the RMI is theMFm weighted by the average of MFf and MFh: in nor-mal triphasic gait the RMI is expected to be close to one(deep midfoot depression on force-time graphs) while inpathologic biphasic gait it is expected to be close to zero(flat midfoot depression on force-time graphs, Fig. 3)[16]. The RMI has the advantage that it is independentof body weight and walking speed, which both influencethe absolute values. The RMI therefore allows for simplecomparisons between individuals.
Other outcome parametersIn order to standardize the report of pedobarographicdata, we also report the MF (as representation of load)
Fig. 2 Relative midfoot index (RMI): The RMI is calculated by putting the dhindfoot and forefoot
and the contact times (as representation of rollover) inthe hindfoot, midfoot and forefoot. For the clinical as-sessment, the AOFAS hindfoot score [19] was recorded.
Statistical analysisData from pedobarography was extracted into ASCII-filesthat were then transformed into Excel files (MicrosoftCorp, Redmond, WA, USA) using a custom-made algo-rithm written in MATLAB ® (The MathworksInc, Natrick,MA, USA). STATISTICA ® Version 8.0 (StatSoftInc, Tulsa,OK, USA) was used for all analyses. For testing parametricdata an ANOVA-analysis was made. P values less than0.05 were considered significant and the level of signifi-cance P was corrected for multiple testing by dividingthe level of significance by the number of tests (0.05/21 = 0.0024, Table 2). Pearson correlation co-efficients(r) were calculated; r values of less than 0.4 wereconsidered poor, 0.4–0.6 as weak, 0.6–0.8 as moderate,and greater than 0.8 as good. To find out which valueof the relative midfoot index is the cut off value todifferentiate between healthy and unhealthy, the posi-tive predictive value (PPV), negative predictive value(NPV), sensitivity and specificity were calculated.
ResultsThe RMI for the ankle OA group was 0.654 (SD ± 0.192),for the contralateral group 0.696 (SD ± 0.146) and forhealthy participants 0.844 (SD ±0.083). The value for the
epth of the midfoot valley in relation to the average of the MF in the

Fig. 3 Maximal force curves of a foot with ankle osteoarthritis (a), of the contralateral unaffected foot of a patient with ankle osteoarthritis (b) anda healthy foot (c). These graphs show that the midfoot depression is small in the ankle-osteoarthritic foot (biphasic pattern) and deep in thehealthy foot (triphasic pattern). Figure b shows that the unaffected foot has a pathologic gait pattern and is therefore not suitable for comparison
Arno et al. Journal of Foot and Ankle Research (2016) 9:47 Page 5 of 8
RMI was significantly smaller in osteoarthritic feetcompared to healthy feet (p < 0.0001). Contralateralfeet also had a significantly lower RMI than healthyfeet (p < 0.0001). There was no difference in the RMIof affected and contralateral feet. For all other parame-ters see Tables 1 and 2, Fig. 3.
As regards the cut-off, results showed that a relativemidfoot index of 0.8 was the best compromise with apositive predictive value of 80% and sensitivity of 78%to determine whether a foot is healthy or not (Table 3).By way of comparison, for an RMI value of 0.7 thePPV was better (99%) but the sensitivity (60%) was too

Table 2 P values of the comparison of the three groups toeach other: OA-Contralateral, OA-Healthy, Contralateral-Healthy(OA: Osteoarthritis, MF: Maximal Force). Significant values aremarked in italic
Ankle OA -Contralateral
Ankle OA-Healthy
Contralateral -Healthy
Age (years) 1.0000 0.0000 0.0000
Weight (kg) 1.0000 0.0020 0.0020
MF-Hindfoot (N) 0.0081 0.0495 0.9762
MF-Midfoot (N) 0.6109 0.0000 0.0000
MF-Forefoot (N) 0.4314 0.0000 0.0000
Contact-TimeHindfoot (ms)
0.9968 0.0000 0.0000
Contact-TimeMidfoot (ms)
0.7371 0.0000 0.0000
Contact-TimeForefoot (ms)
0.7967 0.0000 0.0000
Relative MidfootIndex
0.0966 0.0000 0.0000
Table 4 Correlation of measured parameters with theAOFAS-Score of healthy participants and ankle OA patients(MF: Maximal Force)
Age (years) −0.6029
Weight (kg) −0.2972
MF-Hindfoot (N) 0.1172
Contact-Time Hindfoot (ms) −0.4177
MF-Midfoot (N) −0.4936
Contact-Time Midfoot (ms) −0.5196
MF-Forefoot (N) −0.3689
Contact-Time Forefoot (ms) −0.5814
Relative Midfoot Index 0.4786
Arno et al. Journal of Foot and Ankle Research (2016) 9:47 Page 6 of 8
weak, and therefore many unhealthy feet would remainundetected (Table 3).Looking at the MF and contact time in the hindfoot,
midfoot and forefoot, we find that the values of all pa-rameters except the hindfoot MF of both OA andcontralateral feet differed significantly from the values ofhealthy feet (p < 0.001, Table 2).The AOFAS score was 44.1 ± 16.84 points in ankle OA
and 100 points in healthy participants as defined by theinclusion criteria. There was a weak correlation of 0.48between the AOFAS score and the RMI. Furthermorethe AOFAS score correlated weakly with the MF in themidfoot (r = 0.49), while it anticorrelated weakly with thecontact time in the hindfoot (r = −0.42), the contact timein the midfoot (r = −0.52) and the contact time in theforefoot (r = −0.58, Table 4).
DiscussionThis study introduces a new parameter, the so-calledrelative midfoot index (RMI). The RMI facilitates theinterpretation of a large number of pedobarographic para-maters. 120 patients with end-stage ankle OA and theirnon affected contralateral feet as well as 35 healthy volun-teers (70 ft) were measured. The results showed that
Table 3 Test statistics of the relative Midfoot Index (RMI) to definea cut-off value to differentiate between healthy and diseased(PPV: Positive Predictive Value, NPV: Negative Predictive Value)
RMI <0.9 <0.8 <0.7 <0.6 <0.5
PPV 0.68 0.80 0.99 0.98 1
NPV 0.64 0.64 0.59 0.46 0.42
Sensitivity 0.91 0.78 0.60 0.33 0.2
Specifity 0.27 0.67 0.99 0.99 1
osteoarthritic feet and healthy participants had a signifi-cantly different RMI. A RMI <0.8 showed a positive pre-dictive value of 80% and sensitivity of 78% to detect anunhealthy foot condition. Furthermore there were signifi-cant differences between contralateral feet and healthyfeet. A correlation (r = 0.48) between AOFAS-score andRMI in healthy and ankle OA patients was found.This study has several limitations: First, no matching
for age and weight was made between the OA patientsand the healthy participants, which resulted in the factthat the control group was lighter, healthier and youn-ger. The same issue has been noticed also by otherauthors [21]. However as regards weight, the RMI en-sures independency from weight for means of compari-son, which successfully mitigates against this difficulty.As regards age, Bosch [11] observed a significant in-crease in the midfoot load in seniors compared to adults.One could therefore argue, that the measured differ-ences are due to age and not osteoarthritis. Calculatingthe RMI with Bosch’s published data, we find an RMIfor adults of 0.87, for 7-year olds 0.82 and for seniors of0.79 (adults 31.9 ± 2.1 years, 7-year olds 7 ± 0.4 years,seniors 68.7 ± 3.2 years). The RMI of seniors is marginalyhealthy, however aging is associated with degenerativechanges and this was not an exclusion criteria in Bosch’sstudy, which influences the gait. Second, this study hasbeen performed using pedobarography, which produces alarge amount of data. This study has identified the relevantvariable and so future studies can use simpler methodssuch as a force plate to gather data in a targeted manner.The RMI is a useful parameter as it is independent of
weight and walking speed, which both affect the absoluteforce values. Furthermore it was built on the observationof a prior study [9], which recognized the cluster of loadof the midfoot as the best parameter to distinguishbetween a healthy and a fused ankle. In this connectionit is interesting to note that other authors also focussedon the midfoot load: Piriou compared healthy and osteo-arthritic feet and recognised that the ground reaction

Arno et al. Journal of Foot and Ankle Research (2016) 9:47 Page 7 of 8
force was flattened in the OA feet [21]. Mitternachtnoticed a flattened ground reaction force after a calca-neus fracture and a resulting change in the rolloverprocess [16]. These findings are in line with our own. Tothe best of our knowledge there are no further publica-tions describing the flattened force-time graph in dis-eased feet. Further studies are needed to define whichfoot and ankle pathology leads to which pedobaro-graphic alterations in the affected foot.The other aim of the study was to figure out if there was
a difference between contralateral feet and healthy feet. Inthe literature both feet were used as a “healthy” standardagainst which diseased feet were judged. Some authorsworked with a healthy control group [16–18, 22], whileothers regarded the contralateral feet as the control group[12–15]. The latter assumes that collateral feet behave likehealthy feet. The current study found that there is asignificant difference between contralateral feet and trulyhealthy feet for all parameters analysed in this studyexcept the hindfoot maximal force. Therefore the choiceof contralateral feet as healthy controls is unwarranted.This study aimed to find an association between the
RMI and the clinical outcome measured by the AOFAS-score. We found a positive correlation between RMI andAOFAS-score (r = 0.48). In the past, other studies havealso tried to identify correlations between AOFAS scoreand pedobarographic parameters. In a study comparingankle- and tibiotalocalcaneal arthrodesis to healthy par-ticipants we also found a correlation between differentmidfoot load parameters (MF, PP, integrals of MF andPP) summarized as “midfoot index of load” and theAOFAS-score [9]. Schuh found a significant correlationbetween the AOFAS score and the loading parametersof the medial midfoot after surgery of posterior tibialtendon dysfunction [23]. However the reported correl-ation coefficients were between −0.29 and −0.36, whichare values that we consider not even weak. Rammeltrealised, that a higher AOFAS-score is associated with ahigher pressure time integral in the whole foot, but with-out reporting a correlation coefficient [12]. Burns no-ticed a correlation between the pressure time integraland foot pain (r = 0.49) in cavovarus feet [1], which iscomparable to our result. In rheumatoid feet, Schmiegeldetected an increase of the average pressure togetherwith the severity of the impairment in the HealthAssessment Questionnaire in three groups, but no cor-relation coefficient was calculated [10]. In summary,there were only very weak correlations between pedo-barographic parameters and clinical findings.
ConclusionA RMI < 0.8 is an easy-to-use indicator of an unhealthygait. This makes the RMI a helpful clinical tool to reacha quick first assessment of the condition of a foot. Since
the relative midfoot index is independent of body weightand walking speed it can also be used for interindividualcomparison. However, since the index has been testedon ankle osteoarthritis only, it remains an open questionwhether it also provides a useful indicator for otherpathologies. We also showed that the contralateral footdoesn’t act like a healthy foot. As a consequence, contra-lateral feet are not suitable for comparison and cannotbe used as healthy controls.
Clinical relevanceThis paper emphasises that pedobarographic resultsshould be reported in a standardised format. The MFserves as a representation of everything having to do withload, and the contact time represents everything inconnection with the rollover process. Second, to facilitateinterpretation of pedobarographic parameters in the clin-ical setting, the RMI has been introduced. The advantageof the RMI is its independence of walking speed and body-weight, which makes it suitable for inter-individual com-parison. The RMI helps to distinguish between healthytriphasic gait and unhealthy biphasic gait with a cut offvalue of 0.8. We also showed that the contralateral footdoesn’t act like a healthy foot. As a consequence, contra-lateral feet are not suitable for comparison and cannot beused as healthy controls.
AbreviationsAA: Ankle arthrodesis; AOFAS: American Orthopedic Foot and Ankle Society;MF: Maximal Force; NPV: Negative Predictive Value; OA: Osteoarthritis;PP: Peak pressure; PPV: Positive Predictive Value; RMI: Relative Midfoot Index;SD: Standard deviation; TTC: Tibio-Talo-Calcaneal arthrodesis
AcknowledgementsThanks to Dr. Dougall and Dr. Russel from University of Calgary for providingthe cases.
FundingNo funding was received.
Availability of data and materialsThe datasets analysed during the current study are available from thecorresponding author on reasonable request.
Authors’ contributionsAF has initiated the study, made pedobarographic measurements andwritten the manuscript. RF has made the statistics and written themanuscript. MW has made pedobarographic measurements, edited graphsand revised the manuscript. JG has collected all data and written themanuscript. HM has made pedobarographic measurements and revised themanuscript. All authors read and approved the final manuscript.
Competing interestsThe authors declare that they have no competing interest.
Consent for publicationNot applicable.
Ethics approval and consent to participateAll participants signed an approved informed consent form. The EthicalReview Board of the University of Calgary, Canada gave approval to thestudy (E-21586).
Arno et al. Journal of Foot and Ankle Research (2016) 9:47 Page 8 of 8
Author details1Orthopedic Department, University of Basel, Basel, Switzerland. 2Departmentof Philosophy, Logic and Scientific Method, London School of Economics,London, UK.
Received: 18 August 2016 Accepted: 22 November 2016
References1. Burns J, Crosbie J, Hunt A, Ouvrier R. The effect of pes cavus on foot pain
and plantar pressure. Clin Biomech. 2005;20(9):877–82.2. Cooper DM, Dietz FR. Treatment of idiopathic clubfoot: a thirty-year follow-
up note. J Bone Joint Surg Am. 1995;77(10):1477–89.3. Duckworth T, Boulton AJ, Betts RP, Franks CI, Ward JD. Plantar pressure
measurements and the prevention of ulceration in the diabetic foot. J BoneJoint Surg Br. 1985;67(1):79–85.
4. Hutton WC, Dhanendran M. The mechanism of normal and hallux valgusfeet: a quantitative study. Clin Orthop Relat Res. 1981;157:7–13.
5. Metaxiotis R, Accles W, Pappas A, Doederlin L. Dynamic pedobarography(DPB) in operative management of cavovarus foot deformity. Foot Ankle Int.2000;21(11):935–47.
6. Rosenbaum D, Schmiegel A, Meermeier M, Gaubitz M. Plantar sensitivity,foot loading and walking pain in rheumatoid arthritis. Rheumatology(Oxford). 2006;45(2):212–4.
7. Holmes Jr GB, Timmermann L. A quantitative assessment of the effect ofmetatarsal pads on plantar pressures. Foot Ankle. 1990;11(3):141–5.
8. Simoneau GG, Ulbrecht JS, Derr JA, Becker MB, Cavanagh PR. Posturalinstability in patients with diabetic sensory neuropathy. Diabetes Care. 1994;17(12):1411–21.
9. Frigg A, Schäfer J, Dougall H, Rosenthal R, Valderrabano V. The midfoot loadshows impaired function after ankle arthrodesis. Clin Biomech.2012;27(10):1064–71.
10. Schmiegel A, Rosenbaum D, Schorat A, Hilker A, Gaubitz M. Assesment offoot impairment in rheumatoid arthritis patients by dynamicpedobarography. Gait Posture. 2008;27(1):100–4.
11. Bosch K, Nagel A, Weigend L, Rosenbaum D. From “first” to “last” steps in life –pressure patterns of three generations. Clin Biomech. 2009;24(8):676–81.
12. Rammelt S, Grass R, Zawadski T, Biewener A, Zwipp H. Foot function aftersubtalar distraction bone-block arthrodesis: a prospective study. J BoneJoint Surg Br. 2004;86-B(5):659–68.
13. Schuh R, Hofstaetter J, Hofstaetter S, Adams S, Kristen K, Trnka H. Plantarpressure distribution after tibiotalar arthrodesis. Clin Biomech. 2011;26(6):620–5.
14. Leumann A, Pagenstert G, Fuhr P, Hintermann B, Valderrabano V.Intramedullary screw fixation in proximal fifth-metatarsal fractures in sports:clinical and biomechanical analysis. Arch Orthop Trauma Surg.2008;128(12):1425–30.
15. Geil MD, Lay A. Plantar foot pressure responses to changes during dynamictrans-tibial prosthetic alignment in a clinical setting. Prosthet Orthot Int.2004;28(2):105–14.
16. Mitternacht J, Lampe R. Ermittlungfunktionellerkinetischer Parameter aus derplantaren Druckverteilungsmessung. Z Orthop. 2006;144(4):410–8.
17. Sirveaux F, Beyaert C, Paysant J, Molé D, André J. Increasing shoe instepimproves gait dynamics in patients with a tibiotalar arthrodesis. Clin OrthopRelat Res. 2006;442:204–9.
18. Nüesch C, Valderrabano V, Huber C, von Tscharner V, Pagenstert G. Gait patternsof asymmetric ankle osteoarthritis patients. Clin Biomech. 2012;27(6):613–8.
19. Kitaoka HB, Alexander I, Adelaar RS. Clinical rating systems for the ankle-hindfoot, midfoot, hallux, and lesser toes. Foot Ankle Int. 1994;15(7):349–53.
20. MacWilliams BA, Armstrong PF. Clinical applications of plantar pressuremeasurement in pediatric orthopaedics. Pediatr Gait. 2000;40:143–50.
21. Piriou P, Culpan P, Mullins M, Cardon J, Pozzi D, Judet T. Ankle replacement versusarthrodesis: a comparative gait analysis study. Foot Ankle Int. 2008;29(1):3–9.
22. Becerro-de-Bengoa-Vallejo R, Losa-Iglesias ME, Rodriguez-Sanz D. Static anddynamic plantar pressures in children with and without sever disease: acase–control study. Phys Ther. 2014;94(6):818–26.
23. Schuh R, Gruber F, Wanivenhaus A, Hartig N, Windhager R, Trnka HJ. Flexordigitorumlongus transfer and medial displacement calcaneal osteotomy forthe treatment of stage II posterior tibial tendon dysfunction: kinematic andfunctional results of fifty one feet. Int Orthop. 2013;37(9):1815–20.
• We accept pre-submission inquiries
• Our selector tool helps you to find the most relevant journal
• We provide round the clock customer support
• Convenient online submission
• Thorough peer review
• Inclusion in PubMed and all major indexing services
• Maximum visibility for your research
Submit your manuscript atwww.biomedcentral.com/submit
Submit your next manuscript to BioMed Central and we will help you at every step: