farmland loss and livelihood outcomes: a microeconometric
TRANSCRIPT

Munich Personal RePEc Archive
Farmland loss and livelihood outcomes:
A microeconometric analysis of
household surveys in Vietnam
Tran, Tuyen and Lim, Steven and Cameron, Michael P. and
Vu, Huong
University of Economics and Business, Vietnam National University,
Hanoi, Department of Economics, Waikato University, New Zealand
1 August 2013
Online at https://mpra.ub.uni-muenchen.de/48795/
MPRA Paper No. 48795, posted 02 Aug 2013 09:24 UTC

1
Farmland loss and livelihood outcomes:
A microeconometric analysis of household surveys in Vietnam
Tuyen Tran1a
, Steven Limb, Michael P. Cameron
b and Huong Vu
b
a
University of Economics and Business, Vietnam National University, Hanoi
b Department of Economics, Waikato University, New Zealand
ABSTRACT
Although there has been much discussion in the literature about the impacts of farmland loss (due to
urbanization) on household livelihoods, no econometric evidence of these effects has been provided
thus far. This paper, hence, is the first to quantify the effects of farmland loss on household livelihood
outcomes in peri-urban areas of Hanoi, Vietnam. Our study found no econometric evidence for
negative effects of farmland loss on either income or expenditure per capita. In addition, the results
show that farmland loss has an indirect positive impact on household welfare, via its positive impact
on the choice of nonfarm based-livelihoods.
1Corresponding Author. Email: [email protected]
2
INTRODUCTION
The conversion of agricultural land to non-agricultural uses is a common way to provide
space for infrastructure development, urbanization and industrialization and is, therefore, an
almost unavoidable tendency during phases of economic development and population growth
(Tan, Beckmann, Van Den Berg, & Qu, 2009). In Vietnam over the past two decades,
escalated industrialization and urbanization have encroached on a huge area of agricultural
land. Le (2007) calculated that from 1990 to 2003, 697,417 hectares of land were
compulsorily acquired by the State for the construction of industrial zones, urban areas and
infrastructure and other national use purposes.2 In the period from 2000 to 2007, about half a
million hectares of farmland were converted for nonfarm use purposes, accounting for 5
percent of the country's farmland. Consequently, in the period 2003-2008, it was estimated
that the acquisition of agricultural land considerably affected the livelihood of 950,000
farmers in 627,000 farm households (VietNamNet/TN, 2009).
Increasing urban population and rapid economic growth, particularly in urban areas of
large cities, have resulted in a great demand for urban land. Taking Hanoi as an example,
according to its land use plan for 2000-2010, 11,000 hectares of land, mostly annual crop land
in Hanoi rural, was taken for 1,736 projects related to industrial and urban development, and
it was estimated that this farmland conversion caused the loss of agricultural jobs of 150,000
farmers (Nguyen, 2009a). Moreover, thousands of households have been anxious about a new
plan of massive farmland acquisition for the expansion of Hanoi to both banks of the Red
river by 2020. This plan will induce about 12,000 households to relocate and nearly 6,700
farms to be removed (Hoang, 2009).
In the setting of accelerating conversion of farmland for urbanization and
industrialization in the urban fringes of large cities, a number of studies in Vietnam have
addressed the question of how farmland loss has affected rural household livelihoods(Do,
2006; Le, 2007; Nguyen, Vu, & Philippe, 2011; Nguyen, Nguyen, & Ho, 2013; Nguyen,
2009b). In general, these studies indicate that while the loss of agricultural land causes the
loss of traditional agricultural livelihoods and threatens food security, it can also bring about a
wide range of new opportunities for households to diversify their livelihoods and sources of
2 According to the current Land Law of Vietnam, the compulsory acquisition of land by the State is applied to
projects that are served for national or public projects, for projects with 100 percent contributed by foreign funds
(including FDI (Foreign Direct Investment) and ODA (Official Development Assistance), for the
implementation of project with special economic investment such as building infrastructure for industrial and
services zones, hi-tech parks, urban and residential areas (the World Bank (WB), 2011).

3
wellbeing. In addition, similar impacts of farmland loss have been found elsewhere. Examples
include negative impacts in China (Chen, 2007) and India (Fazal, 2000). Nevertheless, other
studies show positive impacts of farmland loss on rural livelihoods in China (Parish, Zhe, &
Li, 1995) and Bangladesh (Toufique & Turton, 2002).
More importantly, when investigating the impacts of farmland loss on household
livelihoods, all above studies used qualitative methods or descriptive statistics, possibly due to
the unavailability of data. Using a dataset from a 2010 field survey involving 477 households
in Hanoi‟s peri-urban areas, this study, therefore, contributes to the literature by applying
microeconometric methods to answer the key research question: how, and to what extent, has
farmland loss affected household livelihood outcomes in Vietnam? Our study found no
econometric evidence for negative effects of farmland loss on either income or consumption
expenditure per capita. In addition, we found that farmland loss has an indirect positive
impact on household welfare, via its positive impact on the choice of nonfarm based-
livelihoods.
ANALYTICAL FRAMEWORK
Several studies have attempted to apply the sustainable livelihood framework, either
quantitatively or qualitatively (Jansen, Pender, Damon, Wielemaker, & Schipper, 2006).
Figure 1 displays an analytical framework that is adapted for the specific context of this study.
In this paper, we focus on Box C: household livelihood outcomes, as well as their
determinants. As presented in Figure 1, a household‟s livelihood choice to pursue a particular
activity or a diversification of activities is determined by its endowment of or access to
different types of assets (Box A). Moreover, other exogenous factors such as farmland loss
(Box D) or local customs and culture and local infrastructure development (Box E) may have
impacts on activity choice. The impacts may be direct, or indirect via their impact on
livelihood assets. Consequently, such factors should be taken into account in the model of
household activity choice. The resulting livelihood choices in turn generate livelihood
outcomes such as food, income or expenditure (Box C). Moreover, a household‟s livelihood
outcomes are also conditioned on its possession of or access to livelihood assets. Therefore, a
household's asset endowment has both indirect (through its impact on livelihood choice) and
direct impacts on livelihood outcomes. However, the exogenous factors affecting livelihood
choices that are mentioned above also influence livelihood outcomes. As a result, livelihood
outcomes are determined by a set of asset-related variables, livelihood choice and other
factors.

4
Figure 1: Conceptual framework for analysis of Hanoi peri-urban household livelihoods
Source: Adapted from DFID‟s sustainable livelihood framework (DFID, 1999), IDS‟s sustainable rural
livelihood framework (Scoones, 1998), and Babulo et al. (2008).
A household‟s livelihood outcomes in turn can affect its future livelihood capitals. For
instance, better-off households tend to invest more in education and will therefore have a
higher level of human capital in the future. Accordingly, livelihood capitals themselves are
endogenously determined by outcome influences. The sustainable livelihood framework
provides a conceptual description of dynamic and interdependent elements that together affect
household livelihoods over time. Given data limitations, our empirical study only investigates
the static impact of households‟ livelihood assets and strategy on their livelihood outcomes. In
fact, such static models have been often used for quantifying factors determining household
livelihood outcomes (Jansen, Pender, Damon, Wielemaker, et al., 2006; Pender &
Gebremedhin, 2007). Following this approach, our study only examines the static
C. Livelihood outcomes of households
Income and consumption expenditure
D. Livelihood context
Shock: farmland loss
Resource trend: peri-urban
residential land price booming
Population trend: Increasing and
lifestyle changes
E. Structures and processes
Institutions, policies, laws and local
custom, culture.
Policies: Industrial zone and transport
infrastructure development, land loss
compensation, job training, etc.
A. Household livelihood capitals (assets)
Human capital Social capital Natural capital Physical capital Financial
capital
Education, age,
household size,
dependency ratio,
etc.
Group
memberships
Farmland size
Residential land
Location of house
Households‟ productive
assets
Formal credit
Informal credit
B. Household livelihood strategies (activity choices)
Informal wage
work based
strategy
Formal wage
work based
strategy
Nonfarm self-
employment based
strategy
Farm work
based strategy
Non-labour income
based strategy
(1)
(2)
(3)
(4) (5)
(6)
(7)
(8) (9)
(11)
(10)
)

5
determinants of livelihood outcomes with a particular interest in the setting of farmland loss
due to escalated urbanization in Hanoi‟s peri-urban areas.
BACKGROUND OF THE CASE STUDY
The study site
Our research was conducted in Hoai Duc, a peri-urban district of Hanoi. Of the districts of
Hanoi, Hoai Duc has the largest number of farmland-acquisition projects and has been
experiencing a massive conversion of farmland for nonfarm uses (Huu Hoa, 2011). Hoai Duc
is located on the northwest side of Hanoi, 19 km from the Central Business District (CBD).
The district has an extremely favourable geographical position, surrounded by various
important roads namely Thang Long highway (the country‟s longest and most modern
highway), National Way 32, and in close proximity to industrial zones, new urban areas and
Bao Son Paradise Park (the biggest entertainment and tourism complex in North Vietnam).
Consequently, in the period 2006-2010, around 1,560 hectares of farmland were compulsorily
acquired by the State for 85 projects (Ha Noi moi, 2010).
Hoai Duc was merged into Hanoi City on 1 August 2008. The district occupies 8,247
hectares of land, of which agricultural land accounts for 4,272 hectares and 91 percent of this
area is used by households and individuals (Hoai Duc District People's Committee, 2010).
There are 20 administrative units under the district, including 19 communes and one town.
Hoai Duc has around 50,400 households with a population of 193,600 people. In the whole
district, employment in the agricultural sector dropped by around 23 percent over the past
decade. Nevertheless, a significant proportion of employment has remained in agriculture,
accounting for around 40 percent of the total employment in 2009. The corresponding figures
for industrial and services sectors are 33 and 27 percent, respectively (Statistics Department
of Hoai Duc District, 2010).
Compensation for land-losing households
As revealed by surveyed households, each household on average received a total
compensation of 98,412,000 VND. The minimum and maximum amounts were 4,000,000
VND and 326,000,000 VND, respectively. Also, Ha Tay Province People‟s Committee issued
the Decision 1098/2007/QĐ-UB and Decision 371/2008/QĐ-UB, which states that a plot of
commercial land (đất dịch vụ) will be granted to households who lose more than 30 percent of
their agricultural land. Each household receives an area of đất dịch vụ equivalent to 10
percent of the area of farmland that is taken for each project (Hop Nhan, 2008). Đất dịch vụ is

6
located close to industrial zones or residential land in urban areas (WB, 2009), thus it can be
used as a business premise for non-farm activities such as opening a shop or a workshop, or
for renting to other users. Thanks to this compensation with "land for land", households will
have not only an extremely valuable asset but also a potential new source of livelihood,
particularly for elderly land-losing farmers.3In the remainder of this paper, households whose
farmland was lost partly or totally by the State's compulsory land acquisition will be referred
to as "land-losing households".
DATA AND METHODS
Data
Adapted from the General Statistical Office (GSO) (2006) and Doan (2011), a household
questionnaire was designed to gather a set of quantitative data on livelihood assets (human,
social, financial, physical and natural capitals), economic activities (time allocation), and
livelihood outcomes (income and expenditure). A disproportionate stratified sampling method
was used with two steps as follows: First, 12 communes with farmland loss (due to the land
acquisition by the State) were partitioned into three groups based on their employment
structure. The first group included three agricultural communes; the second one was
characterised by five communes with a combination of both agricultural and non-agricultural
production while the third one represented four non-agricultural communes. From each group,
two communes were randomly selected. Second, from each of these communes, 80
households, including 40 households with farmland loss and 40 households without farmland
loss, were randomly selected, for a target sample size of 480.4The survey was carried out from
April to June 2010. 477 households were successfully interviewed, among which 237
households lost some or all of their farmland. Among them, 113 households lost their
farmland in early 2009 and 124 households had farmland loss in the first half of 2008.
3 The prices of đất dịch vụ in some communes of Hoai Duc District ranged from 17,000,000 to 35,000,000 VND
per m2 in 2011, depending on the location of đất dịch vụ(Minh Tuan, 2011) (1USD equated to about 20,000
VND in 2011). Note that farmers have already received the certificates which confirm that đất dịch vụ will be
granted to them but they have not yet received đất dịch vụ However, these certificates have been widely
purchased (Thuy Duong, 2011).
4 More details for sampling frame, questionnaire and study site, see Tuyen (2013).

7
Methods
Clustering livelihood strategies
We grouped households into distinct livelihood categories using partition cluster analysis.
Proportions of time allocated for different economic activities before farmland acquisition
were used as variables for clustering past livelihood strategies. Similarly, proportions of
income by various sources were used as variables for clustering current livelihood strategies
or livelihood strategies after farmland acquisition. A two-stage procedure suggested in Punj
and Stewart (1983) was applied for cluster analysis. First, we performed the hierarchical
method using Euclidean distance and Ward‟s method to identify the possible number of
clusters. At this stage, the values of coefficients from the agglomeration schedule were used
to seek the elbow criterion for defining the optimal number of clusters (Egloff, Schmukle,
Burns, Kohlmann, & Hock, 2003) (see more in Tuyen (2013)). Then, the cluster analysis was
rerun with the optimal number of clusters which had been identified using k-mean partition
clustering.
Model specification for determinants of livelihood strategy choice
Once the whole sample was clustered into various groups of livelihood strategies, we applied
econometric methods to quantify the impact of farmland loss on household activity choice and
household welfare. Because the choice of livelihood strategies is a polychotomous choice
variable, we used a multinomial logit model (MNLM) to quantify the determinants of
households' activity choice (Train, 2003). Following Van den Berg (2010) and Jansen, Pender,
Damon, Wielemaker, et al. (2006), we assumed that a household‟s livelihood choice is
determined by fixed and slowly changing factors, including the household‟s natural capital,
human capital, and location variables. In addition, other factors, in this case farmland loss and
past livelihood strategies were included as regressors in the model. Other types of livelihood
capitals such as social capital, financial capital and physical capital may be jointly determined
with, even determined by, the livelihood choice (Jansen, Pender, Damon, & Schipper, 2006).
Therefore, we minimised the potential endogeneity problem by excluding such types of
livelihood assets from the model. Natural capital consists of the owned farmsize per adult
(100 m2 per adult) or “land-labour ratio” (more owned farmsize per adult stimulates farming
activities), the size of residential land (10 m2) (can be used as a premise for household
business), and the location of houses or residential land plots (a prime location can be used for

8
opening a shop or a workshop).5 Human capital is represented by household size and
dependency ratio (this ratio is calculated by the number of household members aged under 15
and over 59, divided by the total members aged 15-59) (both reflect labour endowment), age
and gender of the household head, the number of male working members (those aged 15 and
over) (influences the engagement in wage work), average age of working members (younger
members are more likely to work as wage earners), and average years of formal schooling of
working members (requirements for formal wage work) were also included as explanatory
variables.
Farmland loss is the variable of interest that was expected to have a significant impact
on household livelihood choice. In this case study, the loss of farmland is an exogenous event
as it is caused by the State's farmland acquisition policy (Wooldridge, 2013). Since the
farmland acquisition took place at two different times, land-losing households were clustered
into two groups: (i) households with farmland loss in 2008 and (ii) those with farmland loss in
2009. The rationale for this division is that the length of time since farmland acquisition may
be related to the probability of livelihood change. Moreover, the level of farmland loss varies
among households. Some lost little, some lost part of their land while others lost all their land.
As a result, the levels of land loss in both years, as measured by the proportion of farmland
acquired by the State in 2008 and 2009, were expected to reflect the impact of farmland loss
on household activity choice.
In fact, a number of households did not change their livelihood choices after farmland
acquisition, which indicates that their current livelihood strategies had been determined prior
to the farmland acquisition. In such cases, current outcomes may be influenced by past
decisions; current behaviours may be explained by inertia or habit persistence (Cameron &
Trivedi, 2005). Therefore, we included past livelihood strategy variables as regressors in the
model of household livelihood choice. Finally, commune dummies were included to account
for commune fixed effects which capture differences in inter-commune fertility of farmland,
development of infrastructure, cultural, historical and geographic communal level factors that
may affect household livelihood strategies.
5 A prime location is defined as: the location of a house or of a plot of residential land is situated on the main
roads of a village or at the crossroads or very close to local markets or to industrial zones, and to a highway or
new urban areas. Such locations enable households to use their houses or residential land plots for opening a
shop, a workshop or for renting.

9
Model specification for determinants of livelihood outcomes
We used consumption expenditure and income as indicators of household livelihood
outcomes because they are both considered as the standard measures of household economic
welfare (Deaton, 1997). The total annual income is constituted by different income sources
(agriculture, animal husbandry, nonfarm self-employment, wage work and other income),
whereas household expenditure comprises of total living expenses (food and non food, health
care, education, housing, transportation, entertainment and other items).Note that both income
and expenditure were measured accounting for own consumption of products produced by
households. Figure 1 indicates that households‟ livelihood outcomes are dependent on their
households‟ livelihood strategy and assets. As compared to the explanatory variables in the
multinomial logit model, we added some more asset-related explanatory variables that
potentially affect livelihood outcomes. In the context of a simple conceptual framework,
social capital can be treated as one type of available assets of households which can generate
income or make consumption possible (Grootaet, Narayan, Jones, & Woolcock, 2004). Many
studies have used group memberships as a proxy for social capital and evaluate their
relationship with household wellbeing such as income or expenditure (Haddad & Maluccio,
2003). Therefore, we included social capital in the form of number of group memberships as
an exogenous capital like other capitals that can affect household income and expenditure. We
also included the value of productive assets per working member or “capital-labour ratio” as
a proxy for physical capital in the outcome models. Households with higher “capital-labour
ratio” were expected to obtain higher wellbeing. Finally, we included dummy variables for
financial capital in the form of access to formal and informal loan. Households who received
formal or informal loans could use this resource for generating income or making
consumption possible.
Since three dummy variables of current livelihood choice (informal wage work, formal
wage work and nonfarm self-employment, with farm work as base group) in the outcome
equations were suspected to be endogenous, ordinary least square (OLS) estimation of these
models would be biased and inconsistent if these explanatory variables were correlated with
the error term in the livelihood outcome models (Cameron & Trivedi, 2005). To control for
this endogeneity, we employed the instrumental variable method (IV) estimator.
First, following Pender and Gebremedhin (2007), we selected the livelihood strategy
choice that households pursued prior to farmland acquisition as a potentially instrumental
variable for the current livelihood strategy variables. Second, we included the location of a

10
house (or a residential land plot), and the average age of working members as additional
instruments. As previously mentioned, households owning a house or a residential land plot in
a prime location are more likely to open a shop as their livelihood strategy while households
with younger working members have greater opportunities to engage in wage work. However,
using the past livelihood strategy variables as an instrument may fail to meet the assumption
of instrument exogeneity because the lags from 1 to 2 years after farmland acquisition may be
less distant lags that will increase any correlation between these instruments and the error
term of the livelihood outcomes equations. In addition, the other instruments are likely to
violate this assumption because these instruments may directly affect household livelihood
outcomes. For instance, households that are endowed with a conveniently located house may
gain greater income from lucrative household businesses. Similarly, households with younger
workers may get higher income from their highly paid jobs. The above discussions imply that
several necessary IV tests must be conducted to determine whether both requirements of
instruments (relevance and exogeneity) are satisfied or at least using a set of invalid and weak
instruments that generates imprecise estimates and misleading conclusions can be avoided.
In order to form an econometric foundation for instrumental variables, a series of
specification tests were applied to the models. We used the formal weak instrument test
proposed by Stock and Yogo (2005) using the value of test statistic that is the F-statistic form
of the Cragg-Donald Wald F statistic (cited in Cameron & Trivedi, 2009). In both expenditure
and income models, the values of Cragg-Donald Wald F statistic are 28.615, which greatly
exceeds the reported critical value of 9.53, so we can say that our instruments are not weak
and satisfy the relevance requirement. On the other hand, the validity requirement of
instruments was checked using a test of overidentifying restriction with both two stage least
squares (2SLS) and limited information maximum likelihood (LIML) estimates and the
results came out similar. The Hansen J-statistics were not statistically significant in both
income and expenditure models and thus confirmed the validity of the instrumental variables.
Combined, the above specification tests indicated that the selected instruments are in fact
good instruments.
Since the livelihood choice variables in both expenditure and income models were
potentially endogenous, an endogeneity test of these variables was conducted. In both models,
the results showed that the null hypothesis of exogenous regressors was rejected at the
conventional level (5 percent), confirming that livelihood choice variables are endogenous.
This result, therefore, indicated that the IV model is preferred to the OLS model.

11
RESULTS AND DISCUSSION
Description of household livelihood strategies
Table 1 presents the four types of labour income-based strategies (strategies A-D) that
households pursued before and after farmland acquisition that were classified via cluster
analysis. Cluster analysis also identified 21 households that pursued a non-labour income-
based strategy (strategy E) after the farmland acquisition, as compared to 10 households
followed this strategy before the farmland acquisition. As shown in Table 1, the number of
households that followed a farm work-based strategy approximately halved. Concurrently, the
number of households who pursue nonfarm-based livelihood strategies (A-C) considerably
increased. A comparative look at two groups of households reveals that there is a more
profound transition from the farm work-based strategy to the nonfarm work-based strategies
among land-losing households than that among non-land-losing households. This suggests
that the loss of farmland may have a considerable effect on the choice of household livelihood
strategy.
Table 1: Households’ past and current livelihood strategies
Changes in livelihood strategies of households
Livelihood Strategy
Whole sample Land-losing
households
Non-land-losing
households
Past Current Past Current Past Current
Informal wage work 99 125 46 77 53 48
Formal wage work 84 100 26 42 58 58
Nonfarmself-employment
or nonfarm household business 73 128 27 62 46 67
Farm work 211 103 131 41 80 62
Non-labour income 10 21 7 15 3 6
Total 477 477 237 237 240 240
Note: 10 households that depend largely or totally on non-labour income were excluded from cluster analysis of
the past livelihood strategy because they had very little or no time allocation to labour activities.
Table 2 describes how much different income sources contributed to total household income
for all households as well as for each livelihood group. The results indicate that for the whole
sample, farming activities remained the largest contribution to total household income,
accounting for around 28 percent of total income. It is followed first by nonfarm self-
employment (about 26 percent), and then by informal wage work (around 23 percent). Income
from formal wage work accounted for approximately 17 percent of total income and non-
labour income constituted of around six percent of total income.

12
Table 2: Mean and composition of household income and consumption expenditure, by
livelihood strategy
Livelihood strategies
Variables
Whole
sample
Informal
wage
work
Formal
wage
work
Nonfarm
Self-
employment
Farm
work
Non-labour
income
Total annual household income
60,642 49,245 84,179 66,254 51,357 28,414
SD 33,034 17,088 37,934 36,783 23,509 18,542
Monthly per capita income
1,126 885 1,395 1,310 916 1,210
SD 591 345 681 676 400 606
Percentage household income
by source
Farm work 27.69 17.28 11.77 13.67 77.68 7.55
SD 30.37 15.10 13.43 14.31 18.80 12.28
Informal wage work 23.20 74.78 2.95 3.83 6.98 18.21
SD 33.18 16.40 8.40 10.78 13.21 18.84
Formal wage work 16.95 0.83 75.47 2.71 4.50 1.24
SD 31.02 5.66 16.29 9.28 11.33 5.57
Nonfarm self-employment 25.74 3.72 3.61 76.34 9.15 2.55
SD 34.70 8.57 8.91 16.10 15.20 7.92
Non-labour income 6.41 3.40 6.20 3.44 1.70 70.45
SD 16.25 8.13 11.90 7.56 5.66 18.46
Total annual household
expenditure 50,530 45,797 64,760 51,972 47,081 20,155
SD 22,097 16,156 21,597 23,427 19,417 10,488
Monthly per capita expenditure
938 823 1,073 1,028 840 858
SD 290 230 296 311 230 253
Monthly per capita food
expenditure 484 443 541 523 431 470
SD 152 117 155 182 104 175
Monthly per capita
non-food expenditure a 454 380 532 505 409 388
SD 187 151 208 181 167 140
Number of poor households
14 2 0 5 4 3
Number of households 477 125 100 128 103 21
Mean and SD (standard deviation) are adjusted for sampling weights.
Income, expenditure and their components in 1,000 Vietnam Dong (VND) (1 USD equated about to 18,000
VND in 2009). aThis includes daily and yearly non-food expenditure, health, education, electricity, water and
housing expenditure.
The main features of household livelihood strategies according to their livelihood assets
are presented in Table 3. Households pursuing livelihood A mainly derived income from
manual labour jobs. The common kinds of such jobs were carpenters, painters, construction
workers and other kinds of casual jobs. Such jobs typically offered low and unstable income,
without formal labour contracts. Those who undertook these jobs had below-average
education and were younger than those in livelihood D. The average farmland per adult in this
livelihood group was quite small compared to that in all other livelihood groups. Moreover,
households that followed this livelihood strategy also hold a smaller value of productive

13
assets than those in other livelihoods. Finally, the per capita income and expenditure in this
livelihood group were much lower than those in nonfarm-based livelihood groups.
Livelihood B consisted of households who on average derived around 75 percent of
their income from formal wage work. Formal wage earners were often employees who work
in enterprises and factories, state offices or other organisations. Such jobs often offered high
and stable income, with formal labour contracts. Working household members in this
livelihood group had a much higher than average education level and were younger than those
in all other livelihood groups. Households in this livelihood group also owned the second
largest farmland per adult but income from farm work accounted for only around 12 percent
of total income. Households adopting this strategy received the highest income, and had the
highest expenditure per capita.
Regarding households in livelihood C, although about 40 percent of the
householdsample reported engaging in nonfarm household businesses, 29 percent of them
depended on these activities as their main livelihood. Such businesses included small-scale
trade or production units, using family labour with an average size of 1.7 jobs. Households‟
business premises were mainly located at their homes or residential land plots, where had a
prime location for opening shop, a workshop or a small restaurant. Working household
members in this livelihood group were somewhat older than those in group A and B, and
attained the second highest level of education. Finally, those in this group had the second
highest income and expenditure per capita, just after those in livelihood B.
Interestingly, while 83 percent of surveyed households maintained farm work, only
about 21 percent among them pursued this work as the main livelihood strategy. Many
households continued rice cultivation as a source of food supply while others produced
vegetables and fruits to supply Hanoi‟s urban markets. The common types of crop plants
consisted of cabbages, tomatoes, water morning glory and various kinds of beans, oranges,
grapefruits and guavas, etc. Animal husbandry was mainly undertaken by pig or poultry
breeding small-size farms or cow grazing households. These activities, however, have
significantly declined due to the spread of cattle diseases in recent years. Households
following livelihood D were endowed with higher than average farmland per adult but their
working members were less well educated and older than those in other labour income-based
livelihoods. Finally, these households had a quite low level of income and expenditure, just
slightly higher than those in livelihood A.

14
Table 3: Summary statistics of household characteristics, livelihood assets and past livelihood
choice, by livelihood strategy
Variables
Current Livelihood Strategies
The whole
sample
Informal
wage wok
Formal wage
work
Nonfarm self-
employment
Farm work
M SD M SD M SD M SD M SD
Farmland loss
Land loss 2009 10.27 24.50 12.28 27.00 8.44 21.97 8.80 22.11 6.54 18.96
Land loss 2008 10.50 24.00 16.53 29.06 7.20 18.91 10.22 23.60 5.38 16.40
Human capital
Household size 4.49 1.61 4.64 1.60 5.03 1.28 4.21 1.40 4.67 1.80
Dependency ratio 0.61 0.67 0.58 0.56 0.63 0.79 0.60 0.64 0.60 0.72
Number of male
working members 1.25 0.69 1.38 0.71 1.50 0.77 1.10 0.52 1.24 0.66
Gender of household
head 0.77 0.48 0.75 0.43 0.76 0.43 0.77 0.42 0.90 0.30
Age of household head 51.21 13.24 51.54 13.24 52.94 12.56 47.44 10.65 51.45 11.36
Age of working
members 40.46 8.25 39.21 6.25 37.25 5.82 40.70 7.50 42.97 8.80
Education of working
members 8.37 2.90 7.70 2.17 11.05 2.24 8.07 2.84 6.98 2.36
Natural capital
Farmland per adult 3.37 2.70 2.48 1.80 3.16 2.71 3.01 2.10 5.11 3.30
Residential land size 21.88 14.62 20.88 13.64 26.18 18.27 19.53 13.65 22.32 12.88
House location 0.32 0.47 0.15 0.36 0.19 0.39 0.63 0.48 0.25 0.43
Physical capital 8.63 1.17 8.04 1.26 8.84 0.80 9.06 1.07 8.80 1.00
Social capital 3.43 2.09 2.95 1.75 5.43 2.43 2.88 1.73 3.04 1.42
Financial capital
Formal credit 0.27 0.44 0.28 0.45 0.15 0.36 0.36 0.48 0.25 0.44
Informal credit 0.19 0.39 0.19 0.39 0.15 0.36 0.18 0.38 0.24 0.43
Past livelihood choice
Informal wage work 0.22 0.42 0.64 0.48 0.13 0.34 0.06 0.24 0.06 0.25
Formal wage work 0.18 0.38 0.03 0.18 0.73 0.44 0.01 0.10 0.07 0.25
Nonfarm self-
employment 0.19 0.39 0.01 0.10 0.01 0.10 0.61 0.49 0.005 0.07
Total 477 125 100 128 103
Note: Means (M) and standard deviations (SD) are adjusted for sampling weights
The averages for dummy variables in all strategies as well as the whole sample serve as percentages; for example
in livelihood A, a mean of 0.75 for the variable “Gender of household head” means that 75 percent of the households in this category are male headed and only 25 percent are female headed.
Livelihood E was a small group of households that were dependent mainly or entirely
on non-labour income for their living. These households had a very small size and high

15
dependency ratio, consisting mainly of very old members with a very low education level.
The per capita income and expenditure in this group were quite high. Most of them were land-
losing elderly farmers, living separately from their children with income derived mainly from
remittances and interest earnings. Even though the number of households in this livelihood
group almost doubled after farmland acquisition, it accounted for just around four percent of
the total sample. These households were excluded from the econometric analysis because of
their small number. Such exclusion, nevertheless, is a limitation since changes in this group
may reveal some important policy recommendations. Hence some discussion on this issue
will be made in the conclusion section.
Determinants of livelihood strategies
Table 4 reports the estimation results from the Multinomial Logit Model. The results show
that many explanatory variables are statistically significant at the 10 percent or lower level.
Farmland loss
Farmland loss in both years was hypothesised to positively affect the likelihood of households
following strategies based on wage employment or nonfarm self-employment. However, only
the farmland loss in 2008 is positively associated with the choice of the nonfarm-based
strategies. Households who lost their farmland in 2008 may have had more time to respond to
the shock of losing land than those with farmland loss in 2009 and therefore they had a higher
chance of taking up an alternative livelihood based on nonfarm activities. As mentioned in
Nkonya et al. (2004), changes in livelihood strategies usually require time and investment,
such as time for learning new skills and attempts at developing market connections.
The results reveal some typical patterns of livelihood choices under the impact of
farmland loss. A first pattern shows that households with more farmland loss in 2008 are
much more likely to purse a strategy based on manual labour jobs. Under the impact of
farmland loss, the most common livelihood choice is informal wage work. This is in line with
the previous finding in a case study of Hanoi‟s peri-urban village by Do (2006), who found
that the majority of land-losing households engaged in informal wage work soon after losing
land. On the one hand, this is indicative of high availability of informal wage work in Hanoi‟s
urban and peri-urban areas. On the other hand, for a number of land-losing households, the
easy switch-over from farming to informal wage work reflects a very low entry barrier to the
paid jobs in the informal sector. According to Cling et al. (2010), the informal sector in Hanoi

16
offers the main job opportunity for most unskilled workers. Such job opportunities are also
often found in Hanoi‟s rural and peri-urban areas (Cling, Razafindrakoto, & Roubaud, 2011).
Table 4: Multinomial Logit estimation with relative risk ratio for households’ livelihood strategy choices
Explanatory variables Informal wage work
vs farm work
Formal wage work
vs farm work
Nonfarm farm self-
employment vs farm work
Coef SE Coef SE Coef SE
Farmland loss
Land loss 2009
6.98 (11.142) 4.12 (6.266) 3.49 (4.935)
Land loss 2008
147.58*** (203.876) 19.55** (27.415) 16.16** (21.981)
Human capital
Household size 0.69** (0.101) 0.77 (0.124) 0.73* (0.128)
Dependency ratio
1.05 (0.348) 0.89 (0.420) 1.25 (0.421)
Number of male
workingmembers
2.20** (0.787) 1.74 (0.725) 0.85 (0.296)
Household head‟sgender 0.53 (0.407) 0.36 (0.301) 0.34 (0.224)
Household head‟s age 1.02 (0.026) 1.03 (0.028) 0.99 (0.025)
Age of working members 0.91** (0.035) 0.93** (0.034) 0.97 (0.035)
Education of working members 0.97 (0.100) 1.36*** (0.139) 1.12 (0.113)
Natural capital
Owned farmsize per adult 0.79* (0.099) 0.78** (0.081) 0.74** (0.115)
Residential land size 1.00 (0.014) 1.03 (0.019) 1.01 (0.018)
Location of house 0.28** (0.167) 0.97 (0.556) 2.92** (1.454)
Past livelihood strategies
Informal wage work 32.42*** (27.440) 18.71*** (16.668) 1.67 (1.297)
Formal wage work 1.55 (1.709) 53.58*** (45.382) 0.44 (0.464)
Nonfarm self-employment 9.55* (12.254) 15.85** (22.178) 360.38*** (329.755)
Commune dummy (included)
Intercept 131.54** (311.206) 0.54 (1.412) 21.13 (47.160)
Wald chi2 355.93
Prob> chi2 0.0000
Pseudo R2 0.5695
Observations 451
Note: *, **, *** mean statistically significant at ten percent, five percent and one percent, respectively.
Estimates are adjusted for sampling weights and robust standard errors (SE) in parentheses.
A second pattern of activity choice is an income-earning strategy that is dependent on
self-employment in nonfarm activities. The probability of pursuing this strategy increases
with the farmland loss level in 2008. Unlike informal wage work, nonfarm self-employment
may require more capital, managerial skills and other conditions. Consequently, for land-
losing households, their probability of choosing this strategy is lower as compared to that of
pursuing the informal wage work-based strategy, with the corresponding relative risk ratios

17
being 1.32 and 1.65, given a 10 percentage point-increase in land loss 2008. Hence, this may
imply that land-losing households face a relatively high entry for this strategy.
With respect to the third pattern of livelihood choice, households with more farmland
loss in 2008 are more likely to undertake a strategy based on formal wage work. However, the
probability of adopting this strategy is less than that of pursuing the informal wage work-
based strategy. This phenomenon may stem from some main reasons. First, the farmland has
been largely converted for the projects of construction of highways, urban areas and housing
development rather than industrial zones and factories, which may generate few jobs for local
people. Secondly, it normally takes investors a few years or longer to complete the
construction of an industrial zone, a factory or an office. Hence, local people may only be
recruited after the completion of construction, which suggests that the impacts of farmland
acquisition on local labour may be insignificant in the short-term but more significant in the
long-term.
In general, the result indicates that the more farmland per adult a household owns the
less likely it is to engage in wage work or nonfarm self-employment as its livelihood strategy.
This result is in accordance with the previous findings in rural Vietnam by Van de Walle and
Cratty (2004), in some Asian countries by Winters et al. (2009). While the size of residential
land is not related to activity choice; the prime location of a house or a plot of residential land
is positively associated with the probability of a household pursuing the nonfarm self-
employment-based strategy. Households who own a house (or a plot of residential land) with
a prime location are more likely to take up household businesses such as opening a shop or a
workshop. This implies that many households have actively seized emerging market
opportunities in a rapidly urbanising area. Such a similar trend was also observed in a peri-
urban village of Hanoi by Nguyen (2009b) and in some urbanising communes in Hung Yen, a
neigbouring province of Hanoi by Nguyen et al. (2011) where houses or residential land plots
with a prime location were used as business premises for opening shops, restaurants, bars,
coffee shops or for rent.
Regarding the role of human capital in activity choice, the result reveals that, all else
being equal, households with older working members are less likely to undertake paid jobs as
the main income-generating strategy, which implies that there are some potential barriers had
prevented elderly farmers from taking up these jobs. Better education of working members
increases the probability of households pursuing a strategy based on formal wage work,
18
meaning that households with low education levels will be hindered from adopting this
strategy. Nonetheless, human capital is found not to be related to nonfarm self-employment
and informal wage work, suggesting that in terms of formal education, there has been relative
ease of entry into these activities.
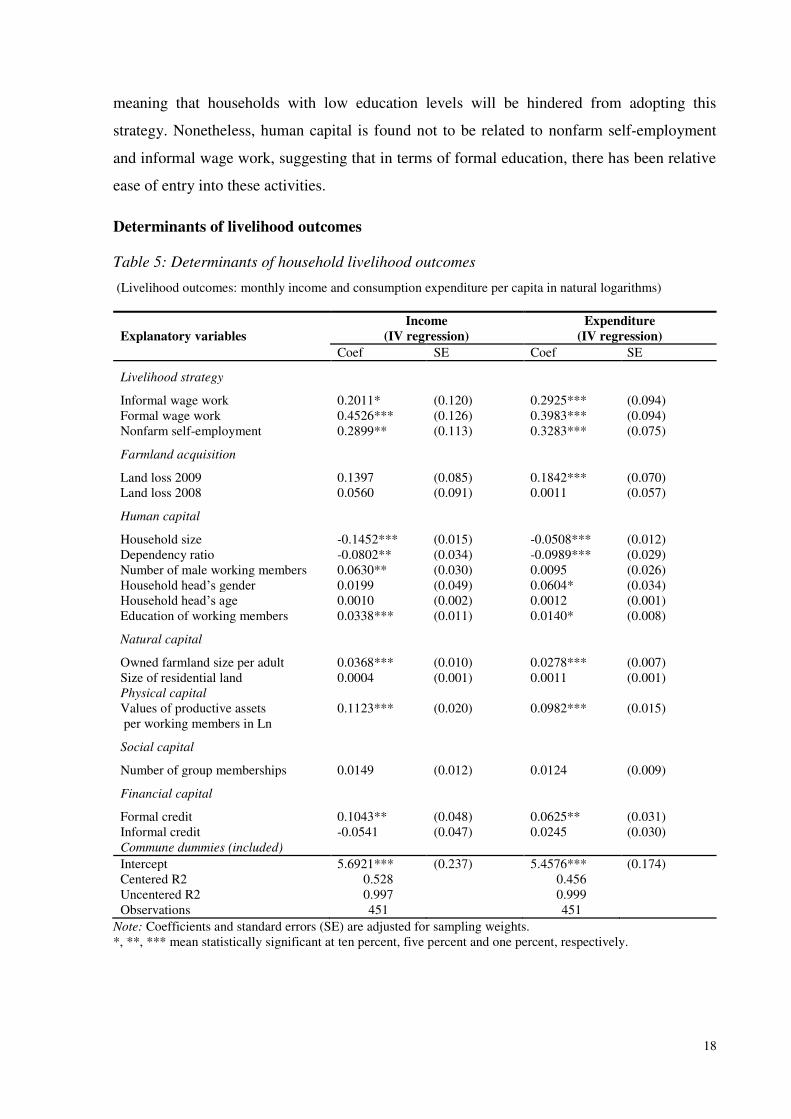
Determinants of livelihood outcomes
Table 5: Determinants of household livelihood outcomes
(Livelihood outcomes: monthly income and consumption expenditure per capita in natural logarithms)
Income Expenditure
Explanatory variables (IV regression) (IV regression)
Coef SE Coef SE
Livelihood strategy
Informal wage work 0.2011* (0.120) 0.2925*** (0.094)
Formal wage work 0.4526*** (0.126) 0.3983*** (0.094)
Nonfarm self-employment 0.2899** (0.113) 0.3283*** (0.075)
Farmland acquisition
Land loss 2009 0.1397 (0.085) 0.1842*** (0.070)
Land loss 2008 0.0560 (0.091) 0.0011 (0.057)
Human capital
Household size -0.1452*** (0.015) -0.0508*** (0.012)
Dependency ratio -0.0802** (0.034) -0.0989*** (0.029)
Number of male working members 0.0630** (0.030) 0.0095 (0.026)
Household head‟s gender 0.0199 (0.049) 0.0604* (0.034)
Household head‟s age 0.0010 (0.002) 0.0012 (0.001)
Education of working members 0.0338*** (0.011) 0.0140* (0.008)
Natural capital
Owned farmland size per adult 0.0368*** (0.010) 0.0278*** (0.007)
Size of residential land 0.0004 (0.001) 0.0011 (0.001)
Physical capital
Values of productive assets
per working members in Ln
0.1123*** (0.020) 0.0982*** (0.015)
Social capital
Number of group memberships 0.0149 (0.012) 0.0124 (0.009)
Financial capital
Formal credit 0.1043** (0.048) 0.0625** (0.031)
Informal credit -0.0541 (0.047) 0.0245 (0.030)
Commune dummies (included)
Intercept 5.6921*** (0.237) 5.4576*** (0.174)
Centered R2 0.528 0.456
Uncentered R2 0.997 0.999
Observations 451 451
Note: Coefficients and standard errors (SE) are adjusted for sampling weights.
*, **, *** mean statistically significant at ten percent, five percent and one percent, respectively.

19
Livelihood strategy
Table 5 reports the estimation results from the IV regression of the expenditure and income
models using 2SLS estimation. Both sets of results confirm that household wellbeing is
greatly affected by the choice of livelihood strategy. In general, households that follow
nonfarm-based livelihoods have higher wellbeing those pursuing a farm work-based strategy.
More specifically, households with „formal wage work‟ achieve the highest income level,
followed first by „nonfarm self-employment‟ and then by „informal wage work‟, and lastly by
„farm work‟. In addition, this ranking is also similar to the choice of expenditure per capita as
an indicator of household welfare. Such wellbeing disparities across various livelihood
strategies imply that the livelihood choice is a crucial factor affecting household livelihood
outcomes. Also, it suggests that moving out of agriculture may be a way to improve
household welfare. The result is partly consistent with previous findings in rural Vietnam. For
instance, Van de Walle and Cratty (2004) found that households who farm only are poorer
than all those who combine farming with some type of nonfarm employment. Moreover, as
estimated in Pham, Bui, and Dao (2010), on average and ceteris paribus, the shift of a
household from pure agriculture to pure non-agriculture raises expenditure per capita, and this
outcome tends to steadily increase over time.
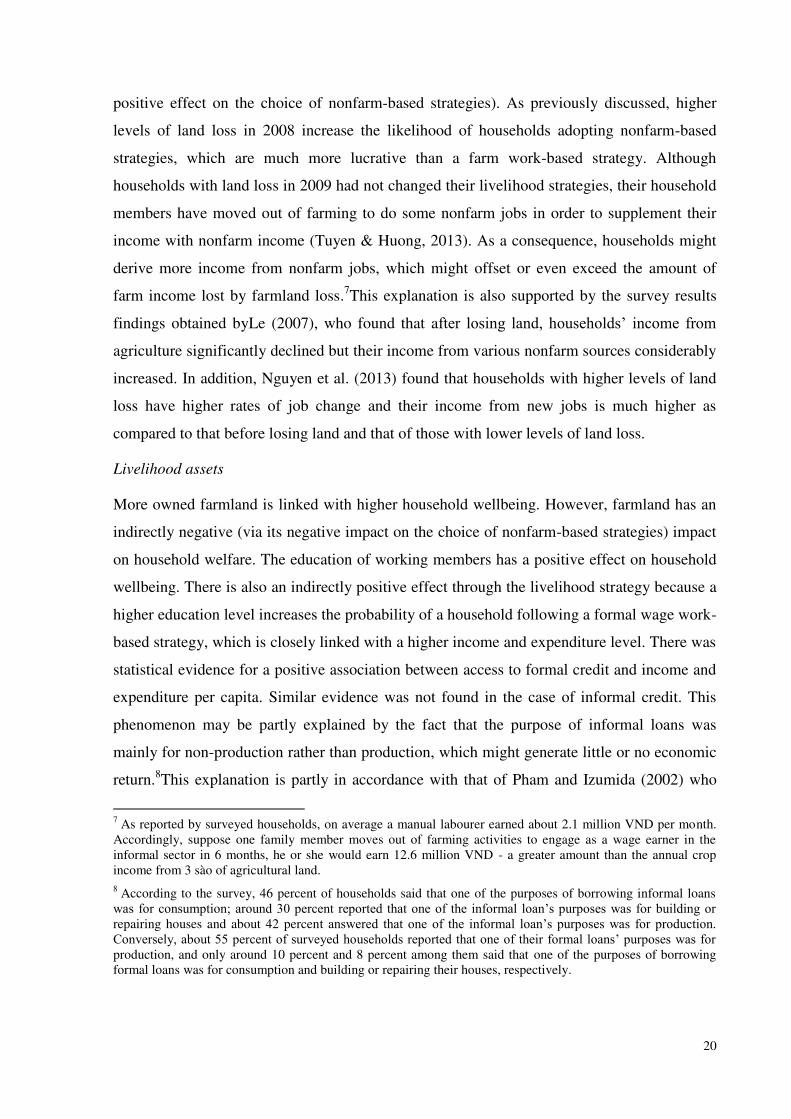
Farmland loss
Farmland loss in 2009 is positively associated with expenditure. Nevertheless, a similar
impact is not statistically significant for the case of farmland loss in 2008. This may be
because households with land loss in 2009 partly used their compensation money for
household expenses while those with land loss in 2008 might have used up their
compensation money in 2008. As shown by the survey, 61 percent of land-losing households
reported using part of their compensation money for daily expenses. For some households, the
compensation money for farmland loss might be used to deal with the shock of farmland loss
while other households might use this for additional expenditure to improve their wellbeing.
A surprising result was that farmland loss in both years has no impact on income.
Possibly, this implies that only a small amount of income that was contributed by agricultural
production was lost due to the area of acquired farmland.6 However, it should be noted that
there is also an indirectly positive effect of farmland loss on household welfare (through its
6 According to the survey data, on average, annual crop income per one sào (360 m
2) was estimated at around 3.7
million Vietnam Dong (VND) and 1USD equated to about 18,000 VND in 2009). The corresponding figures for
income from rice cultivation were extremely low; just around 1.5 million VND.
20
positive effect on the choice of nonfarm-based strategies). As previously discussed, higher
levels of land loss in 2008 increase the likelihood of households adopting nonfarm-based
strategies, which are much more lucrative than a farm work-based strategy. Although
households with land loss in 2009 had not changed their livelihood strategies, their household
members have moved out of farming to do some nonfarm jobs in order to supplement their
income with nonfarm income (Tuyen & Huong, 2013). As a consequence, households might
derive more income from nonfarm jobs, which might offset or even exceed the amount of
farm income lost by farmland loss.7This explanation is also supported by the survey results
findings obtained byLe (2007), who found that after losing land, households‟ income from
agriculture significantly declined but their income from various nonfarm sources considerably
increased. In addition, Nguyen et al. (2013) found that households with higher levels of land
loss have higher rates of job change and their income from new jobs is much higher as
compared to that before losing land and that of those with lower levels of land loss.
Livelihood assets
More owned farmland is linked with higher household wellbeing. However, farmland has an
indirectly negative (via its negative impact on the choice of nonfarm-based strategies) impact
on household welfare. The education of working members has a positive effect on household
wellbeing. There is also an indirectly positive effect through the livelihood strategy because a
higher education level increases the probability of a household following a formal wage work-
based strategy, which is closely linked with a higher income and expenditure level. There was
statistical evidence for a positive association between access to formal credit and income and
expenditure per capita. Similar evidence was not found in the case of informal credit. This
phenomenon may be partly explained by the fact that the purpose of informal loans was
mainly for non-production rather than production, which might generate little or no economic
return.8This explanation is partly in accordance with that of Pham and Izumida (2002) who
7 As reported by surveyed households, on average a manual labourer earned about 2.1 million VND per month.
Accordingly, suppose one family member moves out of farming activities to engage as a wage earner in the
informal sector in 6 months, he or she would earn 12.6 million VND - a greater amount than the annual crop
income from 3 sào of agricultural land.
8 According to the survey, 46 percent of households said that one of the purposes of borrowing informal loans
was for consumption; around 30 percent reported that one of the informal loan‟s purposes was for building or repairing houses and about 42 percent answered that one of the informal loan‟s purposes was for production. Conversely, about 55 percent of surveyed households reported that one of their formal loans‟ purposes was for production, and only around 10 percent and 8 percent among them said that one of the purposes of borrowing
formal loans was for consumption and building or repairing their houses, respectively.

21
found that in rural Vietnam, one of the purposes of borrowing informal loans was for
consumption (mainly for smoothing consumption at critical times). Finally, the "capital-
labour ratio" was positively associated with household wellbeing. The elasticity of per capita
income and expenditure to higher values of “capital-labour ratio” was around 0.11 and 0.10,
respectively.
CONCLUSION AND POLICY IMPLICATIONS
Given the loss of agricultural land due to urbanization and industrialization in Hanoi's peri-
urban areas, a number of land-losing households have actively adapted to the new context by
pursuing nonfarm-based livelihood strategies as ways to mitigate their dependence on
farmland. Among choices of activities, informal wage work appears to be the most popular
livelihood choice. The availability of job opportunities in the informal sector not only helps
farm households mitigate negative consequences of land loss but also open a new chance for
them to change and diversify their livelihoods. However, as previously discussed, farmland
loss in 2009 is not associated with any choice of nonfarm-based livelihood strategies. Possibly,
one year was not time enough for a number of land-losing households to switch to alternative
livelihoods. Consequently, the short-term effect of farmland acquisition may be detrimental to
land-losing households, especially to those whose main income was derived from farming.
However, this study found no econometric evidence for negative effects of farmland
loss on either expenditure or income per capita. For many land-losing households whose
living based on farm work, their compensation money was used to cover daily household
expenses, suggesting this financial resource enabled them to temporarily smooth consumption
when facing income shortfalls caused by the loss of farmland. In addition, higher levels of
farmland loss are closely associated with more participation in nonfarm activities. Some land-
losing households might be „pushed‟ into casual wage work or nonfarm self-employment in
response to income shortfalls. For other land-losing households, they might be „pulled‟ into
nonfarm activities because of attractive income sources from these activities. Thus, an
implication here is that having no farmland or farmland shortage should not be seen as an
absolutely negative factor because it can improve household welfare by motivating
households to participate in nonfarm activities.
As previously discussed, changes in livelihood choice towards nonfarm activities may
be a way to raise rural household welfare. Nevertheless, changes in livelihood strategies are
determined by asset-related variables and other exogenous conditions. In particular, land
(farmland and the location of houses or residential land plots), and education are crucial

22
factors that are closely associated with more participation in nonfarm activities. As a result,
state intervention in these factors can improve household wellbeing through providing
favourable conditions for livelihood transition and diversification. There are some policies
that may help land-losing households to intensively engage in nonfarm activities. For instance,
government policy can support the household livelihood transition by providing land-losing
households with a plot of land in a prime location for doing businesses. Encouraging parents'
investment in their children's education is likely to give the next generation a better chance to
get remunerative jobs. A better transportation and road system will result in a closer
connection between land-losing communes and urban centres, which in turn generates more
opportunities in nonfarm activities for local people.
Although the current number of households whose living based on non-labour income
sources accounted for a small proportion, this figure is projected to rapidly rise as a result of
the massive agricultural conversion for urban expansion in the near future. This suggests that
a large number of land-losing households will be forced to find alternative sources of
livelihoods. This, however, is not an easy task for elderly farmers. Fortunately, as previously
mentioned, households who lose more than 30 percent of their farmland will be compensated
with a non-agricultural land parcel (đất dịch vụ) that can be used as a premise for household
businesses such as opening a shop, a workshop, or for rental accommodation. Accordingly,
đất dịch vụ is a new source of livelihoods for land-losing households, particularly elderly
family members, to switch from agricultural production to lucrative nonfarm activities in
Hanoi‟s peri-urban areas. In this sense, đất dịch vụ also plays a role as insurance for
unemployed farmers and old-age landless farmers. However, this policy has been slowly
implemented in the study district (Ha Noi moi, 2010). Therefore, speeding up the
implementation of this policy is likely to be one of the prerequisites to facilitate the livelihood
transitions of land-losing households in Hanoi‟s peri-urban areas. Such a compensation policy
has been piloted in Vinh Phuc Province since 2004 where land loss households utilised đất
dịch vụ to open a shop or provide accommodation leases for workers in industrial zones (the
Asian Development Bank (ADB), 2007). As noted by ADB (2007), this initially successful
experience, therefore, should be worth considering by other localities. The above discussion
implies that the rising conversion of farmland for urbanization and industrialization, coupled
with the compensation with land as mentioned above, can be seen as a positive factor that
enables land-losing households to change their livelihoods and improve their welfare.

23
Acknowledgements
We thank the Vietnamese Government and University of Waikato, New Zealand for funding
this research.
REFERENCES
ADB. (2007). Agricultural land conversion for industrial and commercial use: Competing
interests of the poor. In ADB (eds), Markets and Development Bulletin, pp. 85-93.
Hanoi, Vietnam: Asian Developmen Bank.
Babulo, B., Muys, B., Nega, F., Tollens, E., Nyssen, J., Deckers, J., et al. (2008). „Household
livelihood strategies and forest dependence in the highlands of Tigray, Northern
Ethiopia‟, Agricultural Systems, 98(2): 147-155.
Cameron, A. C., and Trivedi, P. K. (2005). Microeconometrics: Methods and applications.
New York, NY: Cambridge University Press.
Cameron, A. C., and Trivedi, P. K. (2009). Microeconometrics using stata. College
Station,TX: Stata Press
Chen, J. (2007). „Rapid urbanization in China: A real challenge to soil protection and food
security‟, Catena, 69(1): 1-15.
Cling, J. P., Razafindrakoto, M., and Roubaud, F. (2011). The informal economy in Viet Nam.
Hanoi, Vietnam: International Labour Organisation.
Cling, J. P., Razafindrakoto, M., Rouubaud, F., Nguyen, H. T. T., Nguyen, C. H., and Phan, T.
T. N. (2010). The informal sector in Vietnam: A focus on Hanoi and Ho Chi Minh City.
Hanoi, Vietnam: The Gioi Editions.
Deaton, A. (1997). The analysis of household surveys: A microeconometric approach to
development policy. Baltimore, MD: The Johns Hopkins University Press.
DFID. (1999). Sustainable livelihood guidance sheets: Introduction London, UK: Department
for International Development. http://www.ennonline.net/pool/files/ife/dfid-
sustainable-livelihoods-guidance-sheet-section1.pdf (accessed 22 June 2013)
Do, T. N. (2006). „Loss of land and farmers' livelihood: A case study in Tho Da village, Kim
No commune, Dong Anh district, Hanoi, Vietnam‟. Master thesis), Swedish
University of Agricultural Sciences, Uppsala, Sweden.
Doan, T. T. (2011). „Impacts of household credit on the poor in peri-urban areas of Ho Chi
Minh City, Vietnam‟. PhD dissertation, The University of Waikato, Hamilton, New
Zealand.
Egloff, B., Schmukle, S. C., Burns, L. R., Kohlmann, C. W., and Hock, M. (2003). „Facets of
dynamic positive affect: differentiating joy, interest, and activation in the positive and
negative affect schedule (PANAS)‟, Journal of Personality and Social Psychology,
85(3): 528-540.
Fazal, S. (2000). „Urban expansion and loss of agricultural land-a GIS based study of
Saharanpur City, India‟, Environment and Urbanization, 12(2): 133-149.
Grootaet, C., Narayan, D., Jones, V. N., and Woolcock, M. (2004). Measuring social capital:
An integrated questionnaire. World Bank Working Papers No 18. Washington D.C:
The World Bank.
GSO. (2006). Questionnaire on Household Living Standard Survey 2006 (VHLSS-2006).
Hanoi, Vietnam: General Statistical Office of Vietnam.

24
Ha Noi moi. (2010). „Vướng nhất là giao đất dịch vụ cho dân‟ [„Granting land for services to
people is the biggest obstacle‟].Hanoimoi. http://www.baomoi.com/Vuong-nhat-o-
phan-giao-dat-dich-vu-cho-dan/148/5244280.epi ( accessed 22 June 2013).
Haddad, L., & Maluccio, J. A. (2003). „Trust, membership in groups, and household welfare:
Evidence from KwaZulu-Natal, South Africa‟. Economic Development and Cultural
Change, 51(3): 573-601.
Hoai Duc District People's Committee. (2010). „Báo cáo thuyết minh kiểm kê đất đai năm 2010’[‘2010 land inventory report’]. Ha Noi, Vietnam: Hoai Duc District People's
Committee
Hoang. (2009). „Thousands of Red River Farmer in Fear of Relocation‟. Vietnam Investment.
Retrieved. http://www.vietnaminvestment.net/news/thousands-of-red-river-farmers-in-
fear-of-relocation (accessed 22 June 2013).
Hop Nhan. (2008). „Giải phóng mặt bằng tại Hà Tây: Bao giờ hết "tắc"?‟[„Site clearance in
Ha Tay: When will it be
solved?‟].Monre.http://www.monre.gov.vn/v35/default.aspx?tabid=428&cateID=4&id
=43669&code=CKE7S43669 (accessed 22 June 2013)
Huu Hoa. (2011). „Mỏi mắt ngóng đất dịch vụ‟[„ Waiting for land for services for a weary
long time in vain‟]. Hanoimoi.http://hanoimoi.com.vn/Tin-tuc/Kinh-te/532088/moi-
mat-ngong-dat-dich-vu (accessed 22 June 2013)
Jansen, H., Pender, J., Damon, A., and Schipper, R. (2006). Rural development policies and
sustainable land use in the hillside areas of Honduras: A quantitative livelihoods
approach (147). Washington D.C: International Food Policy Research Institute.
Jansen, H., Pender, J., Damon, A., Wielemaker, W., and Schipper, R. (2006). „Policies for
sustainable development in the hillside areas of Honduras: A quantitative livelihoods
approach‟. Agricultural Economics, 34(2): 141-153.
Le, D. P. (2007). Thu nhập, đời sống, việc làm của người có đất bị thu hồi để xây dựng các
khu công nghiệp, khu đô thị, kết cấu hạ tầng kinh tế-xã hội, các công trình công cộng
phục vụ lợi ích quốc gia [Income, life and employment of those whose land was
acquired for the construction of industrial zones, urban areas, infrastructures and
public projects]. Hanoi, Vietnam: National Political Publisher.
Minh Tuan. (2011). „Hà Nội: Đất dịch vụ lại "sốt"‟[„Hanoi: Land for services reached a fever
pitch again‟].Hanoimoi.http://hanoimoi.com.vn/Tin-tuc/Bat-dong-san/471214/ha-noi-
dat-dich-vu-lai-sot (accessed 22 June 2013).
Nguyen, T. D., Vu, D. T., and Philippe, L. (2011, October). „Peasant responses to agricultural
land conversion and mechanism of rural social differentiation in Hung Yen province,
Northern Vietnam‟. Paper presented at the 7th ASAE International Conference, Hanoi,
Vietnam (13-15 October).
Nguyen, T. H. H., Nguyen, T. T., and Ho, T. L. T. (2013). „Effects of Recovery of
Agricultural Land to Life, the Jobs of Farmers in Van Lam Distric, Hung Yen
Province‟. Journal of Science and Development, 11(1): 59-67.
Nguyen, V. S. (2009a). „Agricultural land conversion and its effects on farmers in
contemporary Vietnam‟. Focaal, 2009(54): 106-113.
Nguyen, V. S. (2009b). „Industrialization and urbanization in Vietnam: How appropriation of
agricultural land use rights transformed farmers' Livelihoods in a Per-Urban Hanoi
Village?‟. EADN working paper No.38. Hanoi, Vietnam: East Asian Developmet
Network.
Nkonya, E. M., Pender, J., Jagger, P., Sserunkuuma, D., Kaizzi, C., and Ssali, H. (2004).
Strategies for sustainable land management and poverty reduction in Uganda.
Washington. DC: International Food Policy Research Institute.
25
Parish, W., Zhe, X., and Li, F. (1995). „Nonfarm work and marketization of the Chinese
countryside‟, The China Quarterly, 143(Sep.,1995): 697-730.
Pender, J., and Gebremedhin, B. (2007). „Determinants of agricultural and land management
practices and impacts on crop production and household income in the highlands of
Tigray, Ethiopia‟, Journal of African Economies, 17(3): 395-450.
Pham, B. D., and Izumida, Y. (2002). „Rural development finance in Vietnam: A
microeconometric analysis of household surveys‟. World Development, 30(2): 319-
335.
Pham, T. H., Bui, A. T., and Dao, L. T. (2010). „Is nonfarm diversification a way out of
poverty for rural households? Evidence from Vietnam in 1993-2006‟. PMMA
Working Paper 2010-17. Social Science Research Network website:
http://papers.ssrn.com/sol3/papers.cfm?abstract_id=1715603 (accessed 22 June 2013).
Punj, G., and Stewart, D. W. (1983). „Cluster analysis in marketing research: Review and
suggestions for application‟,Journal of Marketing Research, 20(2), 134-148.
Scoones, I. (1998). „Sustainable rural livelihoods: a framework for analysis‟. Working Paper
72. Brighton, UK: Institute of Development Studies.
Statistics Department of Hoai Duc District. (2010). Statistical Yearbook of Hoai Duc 2009.
Hanoi, Vietnam: Statistics Department of Hoai Duc District.
Stock, J. H., and Yogo, M. (2005). Chapter 5: Testing for weak instruments in linear IV
regression. In D. W. K. Andrews & J. H. Stock (eds.), Identification and inference for
dconometric Models: Essays in honor of Thomas Rothenberg, pp. 80–108.Cambridge,
UK: Cambridge University Press.
Tan, R., Beckmann, V., Van Den Berg, L., and Qu, F. (2009). „Governing farmland
conversion: Comparing China with the Netherlands and Germany‟. Land Use Policy,
26(4): 961-974.
Thuy Duong. (2011). „Đầu tư đất dịch vụ: Canh bạc với rủi ro!‟[„Investing in land for services:
A risky gamble‟]. Tamnhin. http://tamnhin.net/Batdongsan/11744/Dau-tu-dat-dich-vu-
Canh-bac-voi-rui-ro.html (accessed 22 June 2013).
Toufique, K. A., and Turton, C. (2002). Hand not land: How livelihoods are changing in
rural Banladesh. Dhaka, Bangladesh: Bangladesh Institute of Development Studies.
Train, K. (2003). Discrete choice methods with simulation. Cambridge, UK: Cambridge
University Press.
Tuyen, Q. T. (2013). „Farmland acquisition and household livelihoods in Hanoi's peri-urban
areas‟. PhD dissertation, The University of Waikato, Hamilton, New Zealand.
Tuyen, T., and Huong, V. (2013). „Farmland loss, nonfarm diversification and inequality: A
micro-econometric analysis of household surveys in Vietnam‟. MPRA working paper
47596.
Van de Walle, D., and Cratty, D. (2004). „Is the emerging non-farm market economy the route
out of poverty in Vietnam?‟,Economics of Transition, 12(2): 237-274.
Van den Berg, M. (2010). „Household income strategies and natural disasters: Dynamic
livelihoods in rural Nicaragua‟, Ecological Economics, 69(3): 592-602.
VietNamNet/TN. (2009). „Industrial boom hurts farmers, threatens food supply: seminar‟. VietnamNews.biz. http://www.vietnamnews.biz/Industrial-boom-hurts-farmers-
threatens-food-supply-seminar_470.html (accessed 22 June 2013).
WB. (2009). Improving Land Acquisition and Voluntary Land Conversion in Vietnam. Hanoi,
Vietnam: The World Bank.
WB. (2011). Compulsory land acquisition and voluntary land conversion in Vietnam : The
conceptual approach, land valuation and grievance redress mechanism. Washington,
D.C: The World Bank.

26
Winters, P., Davis, B., Carletto, G., Covarrubias, K., Quiñones, E. J., Zezza, A., et al. (2009).
„Assets, activities and rural income generation: evidence from a multicountry analysis‟. World Development, 37(9): 1435-1452.
Wooldridge, J. M. (2013). Introductory econometrics: a modern approach. Mason, OH:
South-Western Cengage Learning.