a microeconometric analysis of technology transfer
TRANSCRIPT
International Journal of Industrial Organization 12 (1994) 227-244. North-Holland
A microeconometric analysis of technology transfer The case of licensing agreements of Japanese firms
Jose G. Montalvo and Yishay Yafeh*
Department of Economics, Harvard University, Cambridge, MA 02138, USA
Final version received February 1993
This paper examines investment in foreign technology by Japanese tirms, using previously unexplored data on technology transfer to Japan. The relationship between the acquisition of foreign technology and firm size, liquidity and affiliation with a corporate group, or keiretsu, is analyzed. Our results indicate that the number of licensing agreements a firm signs is positively and strongly related to its size, although the relationship is concave. We also find that liquidity is an important consideration in the firm’s decision to invest in foreign technology. Keiretsu- affiliated firms acquire relatively more foreign technology than independent firms, suggesting that corporate groups have played an important role in Japan’s technological progress.
JEL classification: 032
1. Introduction
Japan’s economic growth in the postwar period has been characterized by a very rapid growth in productivity, achieved, to a great extent, through massive borrowing of technology from more advanced countries. Japan has been making a tremendous effort to absorb foreign knowledge, and even as late as 1980, Japanese royalty payments on imported foreign technology were far higher than those of the United States, the United Kingdom and Germany [Evanson (1984)]. Nevertheless, very little is known about the microeconomic details of this technology transfer process, and the role of Japanese corporate groups (keiretsu) in it. In this paper we examine, to our knowledge for the first time, Japan’s investment in foreign technology, using
Correspondence to: Yishay Yafeh, Department of Economics, Harvard University, Cambridge, MA 02138, USA.
*We wish to thank Josh Angrist, Eli Berman, Richard Caves, Paul Geroski, Dale Jorgenson, participants of the Econometrics and IO workshops at Harvard, participants of the ‘Summer in Jerusalem’ Workshop and an anonymous referee for helpful comments and suggestions. Fumio Hayashi and Robert Lawrence kindly provided some of the data on tape. We acknowledge financial support provided by the Spanish Ministry of Education and the Harvard Academy for International and Area Studies respectively. The usual caveat applies.
0167-7187/94/$07.00 0 1994 Elsevier Science B.V. All rights reserved SSDI 0167-7187(93)00412-H

228 J.G. Montalvo and Y. Yafeh, A microeconometric analysis of technology tranpr
3000
2500
2000
1500
1000
500
0 1950 1953 1956 1959 1962 1965 1968 1971 1974 1977 1980 1983 1986
+ Type A (Longer than One Year) _+_ Type B (Shorter than One Year)
+ Total
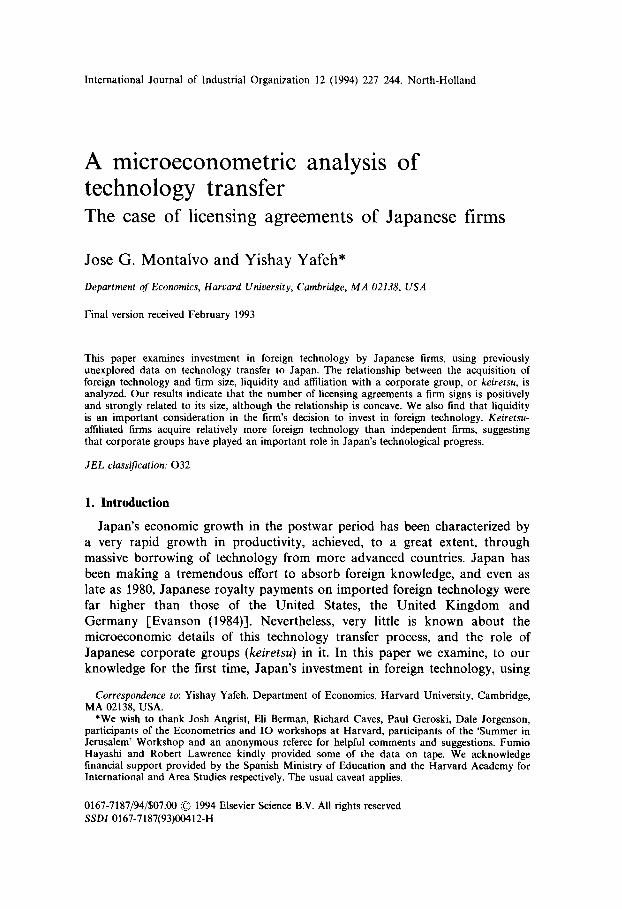
Fig. 1. Total number of licensing agreements. Source: Gijutsu Donyu Nenji Hokoku.
a large sample of manufacturing firms. We use previously unexplored Japanese microdata on technology transfer, in order to identify the relation- ship between investment in foreign technology and firm size and liquidity variables. We find that the number of licensing agreements a firm signs is positively and strongly related to its size, although the relationship is concave. We also find that liquidity is an important consideration in the firm’s decision to invest in foreign technology. For the first time, we provide statistical evidence suggesting that keiretsu-affiliated firms acquire signiti- cantly more foreign technology than independent firms of similar size, suggesting that business groups have had an important role in Japan’s technological progress.
Since 1950, the main form of technology transfer from advanced Western countries to Japan has been formal licensing agreements between Western and Japanese firms. While international technology transfer is often asso- ciated with multinational corporations [Bonin (1981), Contractor (1981)], foreign direct investment in Japan was restricted by the Foreign Investment Law of 1950, and thus relatively few multinationals were present prior to 1980 [Krasner (1988), Komiya and Itoh (1988)]. The number of licensing agreements increased steadily between the mid-1950s and 1973 (fig. l), and during the rapid growth of the 1960s and early 1970s hundreds of contracts for the purchase of technology were signed annually. Following the Oil Shock of 1973, the number of agreements sharply declined, although the trend was reversed in 1976. Investment in foreign technology surged again in
J.G. Montaloo and Y. Yafeh, A microeconometric analysis of technology transfer 229
Table 1
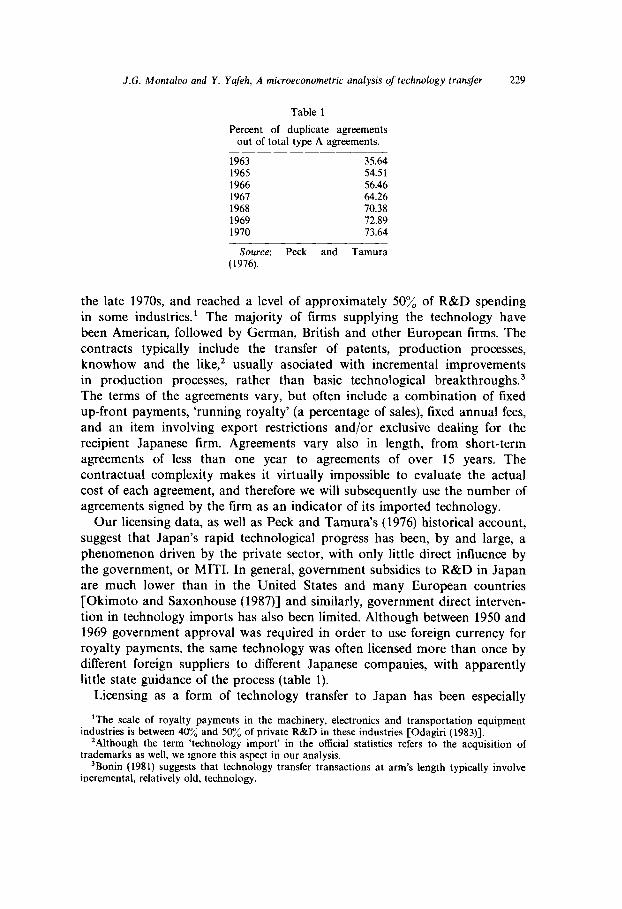
Percent of duplicate agreements out of total type A agreements.
1963 35.64 1965 54.51 1966 56.46 1961 64.26 1968 70.38 1969 72.89 1970 73.64
Source: Peck and Tamura (1976).
the late 1970s and reached a level of approximately 50% of R&D spending in some industries.’ The majority of firms supplying the technology have been American, followed by German, British and other European firms. The contracts typically include the transfer of patents, production processes, knowhow and the like,’ usually asociated with incremental improvements in production processes, rather than basic technological breakthroughs3 The terms of the agreements vary, but often include a combination of fixed up-front payments, ‘running royalty’ (a percentage of sales), fixed annual fees, and an item involving export restrictions and/or exclusive dealing for the recipient Japanese firm. Agreements vary also in length, from short-term agreements of less than one year to agreements of over 15 years. The contractual complexity makes it virtually impossible to evaluate the actual cost of each agreement, and therefore we will subsequently use the number of agreements signed by the firm as an indicator of its imported technology.
Our licensing data, as well as Peck and Tamura’s (1976) historical account, suggest that Japan’s rapid technological progress has been, by and large, a phenomenon driven by the private sector, with only little direct influence by the government, or MITI. In general, government subsidies to R&D in Japan are much lower than in the United States and many European countries [Okimoto and Saxonhouse (1987)] and similarly, government direct interven- tion in technology imports has also been limited. Although between 1950 and 1969 government approval was required in order to use foreign currency for royalty payments, the same technology was often licensed more than once by different foreign suppliers to different Japanese companies, with apparently little state guidance of the process (table 1).
Licensing as a form of technology transfer to Japan has been especially
‘The scale of royalty payments in the machinery, electronics and transportation equipment industries is between 40% and 50”/, of private R&D in these industries [Odagiri (1983)].
*Although the term ‘technology import’ in the official statistics refers to the acquisition of trademarks as well, we ignore this aspect in our analysis.
3Bonin (1981) suggests that technology transfer transactions at arm’s length typically involve incremental, relatively old, technology.

230 J.G. Montalvo and Y. Yafeh, A microeconometric analysis of technology transfer
important in the machinery (including transportation equipment), and electri- cal machinery industries, as well as in the chemical industries, and to a lesser extent, in the iron, steel and non-ferrous metals industries. These industries are among the sectors that have enjoyed the most rapid total factor productivity growth in the postwar era according to studies by Jorgenson et al. (1987) and Jorgenson (1988). A positive relation between licensing, productivity growth and Japan’s export structure is suggested also by Ozaki (1972) and Tsurumi (1980).
Japanese market structure before and after World War II has been characterized by the existence of large corporate groups, and yet little is known about the role of these groups in the process of technology transfer to Japan. In order to examine the importance of group affiliation in technology transfer, we define a horizontal group as a group of firms that operate in different industries, and are related to each other by one or more of the following mechanisms: (a) A main bank, or a group bank which is the principal lender to group members, and owns a significant number of shares in group firms. (b) Cross shareholding between group firms and occasionally some exchange of personnel. (c) Scheduled meetings of presidents or directors of group firms at a ‘Presidents Club’ (shacho-kai). In the present-day Japan, there are six major horizontal (or financial) groups of this type: three that evolved from the prewar zaibatsu groups (Mitsui, Mitsubishi and Sumitomo), and three bank-centered groups (Dai-Ichi Kangyo, Fuyo and Sanwa), each with hundreds of affiliated firms. We distinguish between a horizontal group and a vertical group, which we define as a group of firms associated with one major manufacturer in a particular industry. Such groups typically include a large manufacturer and ‘quasi-integrated’ subcontractors (upstream suppliers) and retailers who are partially controlled (in terms of stocks and board of directors) by the main manufacturing firm of the group. Groups of this type are common in the auto and electronics industries, and include Toyota, Hitachi and other familiar names.
In this paper we use firm&data on licensing agreements, firm performance and group affiliation in order to identify the determinants of investment in foreign technology. The paper is organized as follows. Section 2 presents a theoretical framework for the analysis of the decision to purchase foreign technology. In section 3 the data and variables are described and an appropriate econometric approach is suggested. Our main results are pre- sented and discussed in section 4. In section 5 we examine the robustness of our results by using two more general estimation techniques. Section 6 contains conclusions and directions for further research.
2. Theoretical framework
Japanese Industrial Organization literature has devoted little direct atten-

J.G. Montalvo and Y. Yafeh, A microeconometric analysis of technology transfer 231
tion to the data on Japan’s technological imports, and hardly any empirical analyses have ever been attempted at the microeconomic level. Among the few exceptions are Blumenthal (1976) and Peck and Tamura (1976), who discuss aggregate trends in the technology transfer process, and Okimoto and Saxonhouse (1987), who emphasize the relationship between imperfect tinan- cial markets, market structure and R&D. However, no data at the firm level are used in either one of these essays. In addition, many case-study analyses have been made, focusing on particular firms or industries. Examples include Cusumano’s (1985) study of the automobile industry, several studies of the shipbuilding industry, and many others. These studies often include interest- ing insights into particular industries, but do not attempt to analyze statistically data from an intertemporal cross-section of industries.
In this paper, unlike previous studies, we adopt a microeconomic frame- work, and focus on the individual firm’s decision to acquire foreign technology. In this section we present a general theoretical formulation of the firm’s decision to invest in foreign technology within a framework of an ‘adoption game’, inspired by the work of Katz and Shapiro (1987).
Assume firms compete in a repeated Cournot game and have constant marginal costs of production which are determined by the stock of techno- logy accumulated in the past. Notice that this assumption implies that current output is independent of technology acquired during the same period. Investment in additional technology is made at time intervals between quantity games, and reduces unit costs in the future. This descrip- tion tits the nature of the transferred incremental technology, and is in accordance with the treatment of technology in much of the Industrial Organization literature [Suzuki (1985), Tirole (1988)]. Following Katz and Shapiro (1987) firms are assumed to observe available innovations, and choose the optimal time of adoption. Once adopted, an innovation is no longer available to other firms, and no sub-licensing or imitation are possible.
The cost of any given innovation declines exponentially over time at a given rate p:
K(T) = K(0) eepT.
This formulation suggests the existence of a tradeoff between early adoption at a high cost, and later adoption at the risk of losing the technology, if one of the firm’s rivals adopts it.
Define ri as the discount rate of firm i, which equals its cost of capital. Japanese capital markets prior to the liberalization of the 1980s were highly regulated and immature, and firms could raise very limited amounts of external capital. Instead, firms had to rely mainly on internal and bank finance for investment funds [Hamada and Horiuchi (1987), Meerschwam

232 J.G. Montalvo and Y. Yafeh, A microeconometric analysis of technology transfer
(1990), Frankel (1991)]. We view external finance as a costly source of funds to the firm due to asymmetric information problems.4 Following Aoki (1988), Hoshi et al. (1990, 1991), and Frankel (1991), we regard the long-term relationship between a main bank and a group firm as a solution to these problems, and therefore treat loans from a main bank as less costly funds. The effective cost of capital to the firm, then, will be lower the more cash flow (internal funds) the firm has, and the more accessible are main bank loans:
li = r(Group Affiliation, Cashflow), rl < 0, r2 < 0. (2)
Define ZIo as firm i’s profits before any firm adopts the innovation; L’i as firm i’s profits if it is the first to adopt an innovation, and LJ{ as firm i’s profits if the innovation is adopted by firm j.
If firm i is the first to adopt a given innovation at time T, it will enjoy discounted future profits of 5
w(T)=j17peer’ dt+ jLrie-“dt-K(T), 0 T
which can be rewritten as
(3)
pfqr) = L-e-riT -Z7;+e -r,T
I -47;-K(T).
r i r i
If firm j is the first to adopt, firm i’s profits will be
The date T at which firm i is willing to ‘preempt’ if it believes firm j would otherwise adopt the innovation, satisfies W(T) = L( T), or
II: - lZj = rJC( T) erST. (5)
Eqs. (1) and (5) imply that firm i will be the first to adopt if its adoption time (ZJ is smaller than the adoption time of its rivals (TJ:
1 T=---
r.K, 1 rjK0 (~-ri)‘og~~~<(~-rj)lognj-nj
=Tj, ifj. (6)
Following Katz and Shapiro, we allow for a different effect of any given technology on the costs of different firms. The outcome of every race is
4For example, raising external capital may require the firm to reveal costly private information, as in Myers and Majluf (1984).
SThis section draws heavily on Katz and Shapiro (1987).

J.G. Montaloo and Y. Yafeh, A microeconometric analysis of technology transfer 233
stochastic and depends on firm characteristics as well as on hi, an unob- served random factor which determines the cost reduction to firm i relative to that of firm j. Define Pi as the probability that firm i will be the first to adopt a given innovation, and note that a firm is more likely to be the first to adopt the lower is its T. Hence, eq. (6) implies that Pi is negatively related to ri, firm i’s cost of capital, and, by (2), positively related to cash flow and to the availability of main bank loans (i.e. keiretsu affiliation). Pi is also related to firm size. To see this, note that Z7-lli will be higher for firm i if adoption by firm i raises industry profits by more than adoption by firm j. In a Cournot game, this implies that industry leaders, or bigger firms, will have a higher incentive to adopt any given innovation, and a higher probability of winning the adoption race.
Therefore, Pi can be written as
Pi = P(qi, ri(CFi, BANK,)), P, > 0, P,, > 0, PSANK > 0, (7)
where q is firm output, CF is cash flow, BANK is affiliation with a financial keiretsu with a main bank, and P,, P,, and P,,,, are partial derivatives.
If vertical integration affects investment in technology by solving problems of transaction-specific opportunistic behavior [Williamson (1985)], eq. (6) can be modified to allow the effective cost of technology to be negatively related to affiliation with a vertical keiretsu:
Ko=K,(VI); K,,<O. (8)
In this case, Pi will depend positively on 1/Z (affiliation with a vertical group) as well.
Assume firm i can participate in Ni adoption races in every period, where Ni depends on the firm’s ‘technological opportunity’ (TO), i.e. the number of innovations available for adoption in its sector. The expected number of innovations adopted, or licensing agreements signed by firm i in any given period, is then
LICi=P(qi, CF,, BANK,, VI,) * N(T0,) (9)
or
LICi= G(qi, CF,, BANK,, 1/1,, TO,), (10)
where the partial derivatives of the function G are positive with respect to all elements.
3. The data and estimation procedure
Our sample consists of 461 Japanese firms in the period 1977-1981, selected according to five criteria. First, all firms are listed in the Tokyo Stock Exchange (TSE). This fact allows us to use the information contained in firm reports to the TSE. Second, only manufacturing firms in the following
234 J.G. Montalvo and Y. Yafeh, A microeconometric analysis of technology transfer
major industries are included: chemicals, metals, machinery, elecronics and transportation equipment. None of the firms in the sample was subject to major ownership changes (merger or takeover), or fiscal year changes during the period of observation. Finally, no foreign-owned firms or subsidiaries are included for obvious reasons.
Two main data sources are used. The dependent variable, the number of licensing agreements in each fiscal year, is taken from the Annual Report on Technology Imports, published by the Science and Technology Agency,6 and is denoted by LIC. The explanatory financial variables are taken from firm reports to the TSE. We use the following measures of the explanatory variables in (10):
(1) Firm size: SALES (hundred billion yen), and market share (SHR). While the volume of SALES is an absolute measure of size, market share reflects a relative measure of firm size within a given (three digit) industry.
(2) S2: sales squared. This variable is designed to allow for a non-linear relationship between SALES (or SHR) and LIC.
(3) Cash flow (CF, billion yen). Notice that cash flow does not include royalty payments for licensed technology.
(4) Cash flow of non-group affiliated firms (REALCF) - CF times a dummy variable which equals one if the firm does not belong to a group.
(5) AfIiliation with a horizontal group, a group with a main bank (BANK). This variable is measured on a scale from 0 to 4, which is based on Dodwell Marketing Consultants (1984) with some modifications based on Nakatani’s (1984) classification.’ The scale is based on loans from the group’s main bank, ownership ties and participation in a ‘Presidents Club’.
(6) Affiliation with a vertical group (VI), measured on a scale from 0 to 4 [Dodwell Marketing Consultants (1984)].
(7) Technological opportunity (TO) is defined as the number of agree- ments signed by other firms within the same three-digit industry. A similar approach was used by Wakasugi (1988) and Bernstein and Nadiri (1989), where an unweighted sum of R&D spending within the same industry was treated as a measure of technological environment.’
(8) Industry dummies are used to capture industry-specilic characteristics. Industry dummies are defined at a two-digit level: Dl - Chemicals; 02 - Metals; 03 - Machinery; 04 - Electronics (and no dummy for Transpor- tation Equipment).
Some descriptive statistics are presented in table 2. Table 3 describes the distribution of group-affiliation variables in the sample. Approximately 38% of the firms have a main bank, and about 15% have ties with a vertically-
‘Giiutsu Donvu Nenii Hokoku . ” ‘Nakatani’s findings are based on Keizai Chosa Kyokai, Keiretsu no Kenkyu. sAn alternative approach is suggested by Suzuki (1985) and Jaffe (1986), who use a ‘Euclidean
distance’ measure to identify the distance between research activities of firms.

J.G. Moncalvo and Y. Yafeh, A microeconometric analysis of technology transfer 235
Table 2
Descriptive statistics I.
Var Mean Std Min Max
LIC 1.21 3.31 0.00 42.00 SALES ( Y 1OOb) 1.23 2.90 0.008 31.98 CF (Y lb) 5.61 17.13 - 33.89 261.82 TO 13.67 18.78 0.00 118.00
Table 3
Descriptive statistics II.
Value Bank VI
0 62.11 85.32 1 11.86 0.80 2 7.16 2.82 3 13.88 9.76 4 4.99 1.30
LIC
Table 4
Correlation matrix.
SALES CF BANK VI TO
LIC 1.00 SALES 0.60 1.00 CF 0.48 0.90 1.00 BANK 0.16 0.11 0.05 1.00 VI 0.17 0.28 0.27 -0.21 1.00 TO 0.33 0.19 0.14 0.13 0.10 1.00
Table 5
Means by firm size (1981).
SALES ( Y 1OOb) NUM LIC CF BANK VI TO
<0.25 155 0.10 0.59 0.63 0.26 12.6 0.25-0.50 112 0.32 1.51 0.80 0.25 10.7 0.5cL1.00 12 0.83 3.14 0.82 0.47 13.6 1.w2.00 46 1.13 6.30 1.19 0.37 9.1 2.00-4.00 34 2.35 9.56 1.17 0.85 16.9
> 4.00 42 1.35 46.82 1.47 0.92 22.6
integrated group. These figures resemble keiretsu affiliation figures in other, larger, samples [Weinstein and Yafeh (1992)]. Table 4 indicates that simple correlations between pairs of variables are generally low, except for the case of sales and cash flow. Table 5 presents sample means arranged by firm size in 1981.

236 J.G. Montalvo and Y. Yafeh, A microeconometric analysis of technology transfer
In order to estimate (lo), note that the dependent variable LIC, the number of licenses, is discrete and non-negative, and therefore the use of a method which takes these properties into consideration is necessary. In addition, the dependent variable very often takes a value of zero (67.5% of the observations). Poisson regression is a possible approach to deal with data of this type. It is designed explicitly to examine the relationship between a dependent variable representing the number of times an event occurs within a given period and the exogenous variables that determine its frequency [Hausman et al. (1984)]. The Poisson density function is
Pr ( l$ = yi,) = e”l’ll$‘/y,!, (11)
where yi, represents, in our case, the number of licenses. The average of this process is specified as an exponential function of the vector of explanatory variables X, defined in (10):
3, =eXi’S *If (12)
and the log-likelihood (for a sample of N firms over T periods) is
L(p)= $j c (YitXiffi-eXitp), t=l i=l
(13)
suppressing terms which do not depend on p.
4. Results and discussion
The determinants of investment in foreign technology are presented in table 6 (Poisson regressions using pooled data). The estimated relations seem stable over time, and are not sensitive to specification changes.
First, we observe that the number of agreements is strongly and positively
related with firm size (measured by either SALES or SHR). This finding is consistent with Schumpeterian theories that relate with firm size, and also with empirical findings on the role of large firms in Japanese R&D [Yoshikai (1986)]. Nevertheless, the negative coefficient of S2 may imply that there are some ‘diseconomies’ in the absorption of a large number of new technologies in a given year. The concavity of the relationship between licenses and firm size is quite significant: if, for example, average firm sales doubled, the total number of licenses would increase by about 18%, suggesting a rather low elasticity of licenses with respect to sales (evaluated at the means).9
‘Note that even though our sample is drawn from among firms listed on the TSE, it includes many small firms. Table 2 indicates that sales by the smallest firm were only 800 million yen (approximately 4 million dollars). It is therefore unlikely that our coefficients are biased due to sample selection by firm size. Moreover, since our results hold when firm size is measured by market share, it is fair to say that the results are not driven by the absolute size of firms in the sample.

J.G. Montalvo and Y. Yafeh, A microeconometric analysis of technology transfer 231
CONS
SALES
s2
SHR
SHR2
CF
Vl
BANK
TO
REALCF
Dl
D2
03
04
MLLb
Table 6
Poisson regressions.”
6.1 6.2 6.3 6.4
-0.531 -0.61 (0.049) (0.05)
0.48 1 0.45
(0.009) (0.01)
-0.015 -0.014 (0.0005) (0.0005)
-0.559 -0.60 -0.244 (0.059) (0.06) (0.067)
- 0.809 -0.82 -0.814 (0.073) (0.07) (0.094)
- 0.094 - 0.06 0.191 (0.070) (0.07) (0.076)
0.126 0.13 0.056 (0.05) (0.05) (0.051)
0.067 0.084 0.134
0.11 (0.01)
- 0.920 -0.909 (0.059) (0.059)
0.403 0.450 (0.011) (0.012)
-0.015 -0.017 (0.0005) (0.0006)
0.009 (0.001)
0.077 (0.013)
0.013 (0.0009)
0.004 (0.001)
0.014 (0.0009)
0.007 (0.001)
-0.200 (0.066)
- 0.742 (0.092)
0.194 (0.076)
0.01 (0.042)
0.135
6.5
-1.02 (0.06)
0.43 (0.01)
-0.014 (0.0005)
0.09 (0.018)
0.11 (0.016)
0.012
(0.0009)
-0.21 (0.068)
- 0.46 (0.078)
0.27 (0.076)
0.09 (0.05)
0.128
6.6
-0.89 (0.06)
52.45 (1.34)
- 234.33 (9.33)
0.006 (0.001)
0.076 (0.013)
0.012 (0.0008)
-0.18 (0.07)
-0.75 (0.08)
-0.32 (0.007)
0.05 (0.05)
0.165
“All the estimations are performed in Gatiss. Starting values are obtained from the associated log-linear model, and Newton’s algorithm is used in order to maximize the likelihood function. Often, this procedure is too demanding, and the initial two iterations are performed using the ‘steepest descent’ algorithm, and Newton’s algorithm afterwards. The analytical gradient and hessians are used when the model is simple. In general, numerical gradients and hessians are obtained. All tables include heteroscedastic-consistent standard errors of the parameters.
bA4LL is the mean log-likelihood value at the maximum.
Second, in view of Japanese imperfect capital markets discussed in section 2, liquidity matters in the firm’s decision to acquire technology. Cash flow has a positive impact, and REALCF (cash flow of firms with limited access to main bank loans) is always positive and significant. Furthermore, the coefficient of REALCF is much higher than that of cash flow, implying that non-keiretsu firms are more liquidity constrained than group-aff3iated firms (regression 6.4 in table 6). This result is consistent with the literature on

238 J.G. Montalvo and Y. Yafeh, A microeconometric analysis of technology transfer
Japanese financial markets discussed above, and especially with Hoshi et al’s (1991) results on liquidity constraints of Japanese firms. More specifically, affiliation with a horizontal group raises the probability of purchasing techno- logy: the coefficient of BANK is positive and significant in all specifications.’ O Again, keiretsu firms may be less liquidity-constrained (or have ‘longer horizons’ due to lower effective cost of capital); however group affiliation is important even when cash flow is controlled for. Hence, additional arguments relating the profitability of new technologies and group affiliation are needed. Aoki (1984, 1988) regards postwar horizontal groups as a mechanism of insurance, or risk-sharing. If importing technology involves some risk, then ‘insured’ firms may tend to import more of it. Alternatively, if main banks maximize their profits from loans, and group- affiliated firms are influenced by their main banks, it is possible to show that banks will have an incentive to induce affiliated firms to invest more in technology, since such investment would benefit the main bank through increased loans [Weinstein and Yafeh (1993)].
We attempt to distinguish between the ‘zaibatsu descendants’ (groups based on the prewar zaibatsu), and groups centered around a city bank, and allow for group-specilic differences. However, we find no evidence of different behavior (or different degrees of cohesiveness) between the ‘old’ and ‘new’ groups, although some groups seem to be more active in technology acquisitions than others.”
Affiliation with a vertical group has a positive impact on the amount of technology acquired. This result is consistent with theories of vertical integration as a solution to transaction-specific opportunism [Williamson (1985)], and with Goto’s (1982) view of opportunistic behavior as an acute problem during periods of rapid growth and massive technological imports. This result also tends to support Caves and Torii’s (1991) findings, according to which vertical subcontracting relations tend to raise productivity in Japan.
It is interesting to note that horizontal and vertical groups may also induce higher investment in technology because of their ability to internalize some pecuniary and network externalities. For example, consider two firms that belong to the same group, cross-sharehold and trade with each other. When deciding on investment in cost-reducing technology, each firm will take into consideration the expected change in its own profits, and, to some extent, will also consider the effect of its investment on the (costs and) profits
“‘This result is quite robust, and does not change even if the variable BANK is measured as a &l dummy (regardless of ‘degrees of affiliation’), or in the form of four dummy variables describing the aflinity of a firm to a group. In both cases, the coefficients of BANK variables are positive and significant.
“If a dummy for each group is included, the zaibatsu-descendant Mitsui group is the most active in technology transfer, while the other major prewar group, Mitsubishi, seems to be the least active.

J.G. Montalvo and Y. Yafeh, A microeconometric analysis of technology transfer 239
of the other. Alternatively, if the two firms operate in related markets with some network externalities, investment in some technologies may not be profitable for one firm alone, but may well be profitable if accompanied by investment in a compatible, complementary technology by another group firm. To the extent that groups can coordinate investment decisions in related markets, group-affiliated firms will tend to purchase more foreign technology.
The overall effect of group affiliation on technology imports is quite significant. For example, a hypothetical removal of all horizontal (main bank) ties would lead to a fall of about 10% in number of licensing agreements signed. Absent any vertical ties, the number of agreements would fall by 5% (evaluated at the means).
As for the technological environment, our findings suggest, as expected, that firms in an ‘innovative environment’, measured by the number of agreements purchased by ‘close competitors’, tend to purchase more foreign technology. Wakasugi (1988) obtains a similar result with respect to R&D in the semiconductor industry. We do not regard this environmental effect as a spillover, as in Jaffe (1986): if imported technology is less than fully appropriable, a positive correlation between a firm’s investment and its technological environment will not necessarily appear.
Generally, the effects of firm size, cost of capital and technological opportunity are in accordance with the prediction of the model. Group affiliation, however, may influence the decision to acquire technology in several ways in addition to the liquidity effect captured in the model.
One should be cautious about applicability of our results to the entire Japanese economy. Our sample is drawn from among industrial manufactur- ing firms and does not include firms in service or light industries such as textiles or food processing. Overall, firms in these industries are small, less often affiliated with a keiretsu and, in general, sign fewer licensing agree- ments, as our model predicts. We cannot, however, be certain about intra- industry differences between firms in non-sampled sectors.
5. More general specifications
The Poisson specification requires fairly strong assumptions, namely that events in any two disjoint intervals of time are independent of each other, that the conditional mean and variance of the dependent variable are equal, and that the probability of an occurrence during any particular time interval is proportional to its length. In our sample, however, the variance seems to be much higher than the mean (table 2). Since the assumption that the conditional mean and variance of the dependent variable are equal could produce spuriously small estimated standard errors of the parameters, we examine the robustness of our results by using more general functional forms

240 J.G. Montalvo and Y. Yafeh, A microeconometric analysis of technology transfer
which do not impose the equality of conditional variance and conditional mean.
One alternative is based on the negative binomial distribution. The relationship between the dependent variable and the explanatory variables in this model takes the form
2, =exi’S+” If >
where E is white noise.lZ
(14)
Following McCullagh and Nelder (1989), we examine two possible specifi- cations of the negative binomial model, one where the mean-to-variance ratio is constant but possibly different than one, and the other a linearly increasing ratio:i3
k= 1: I’(&)=(1 +cc)E(&),
(15) k = 2: V( &,) = E( &)( 1 + c&( q,)).
On the basis of (15), it is possible to construct a score test of the Poisson model against the negative binomial. Under the null hypothesis (Poisson) cc=O. By calculating the efficient scores under the null hypothesis, the following test statistics are obtained as a function of k:
which are asymptotically standard normal statistics. The formal score test rejects the Poisson specification in favor of the Negative Binomial,14 yet table 7 indicates that our results hold under this specification as we11.15
Another possible specification of a model which does not impose the equality of the mean and the variance is the Hurdle Poisson model. It is possible that the decision whether to buy foreign technology or not to buy at
“For a detailed derivation of this model, see Hausman et al. (1984) or Cameron and Trivedi (1986).
‘sNotice that these two assumptions have very different implications regarding the form of heteroscedasticity in the model and will lead, in general, to different parameter estimates.
141n table 7, for regression NEGBIN I P, = 47.5 and for NEGBIN II P, = 37.2. IsNote that the standard deviations of the coefficients in the negative binomial model are
larger than in the Poisson model, and the effect of technological opportunity (TO) on the number of licensing agreements is somewhat smaller. When the variance in the negative binomial model is allowed to depend on SALES, we find that the effect of SALES on the variance is positive and significantly different from zero.

J.G. Montalvo and Y. Yafeh, A microeconometric analysis of technology transfer
Table I
241
Comparison of the different models.
CONS
SALES
s2
BANK
VI
TO
Dl
02
03
04
- 1.02 (0.061)
0.43 (0.010)
-0.014 (0.0005)
0.11 (0.016)
(:::S)
0.012 (0.0009)
-0.21 (0.068)
- 0.46 (0.078)
0.21 (0.076)
0.09 (0.050)
a
SALES*
MLL 0.128
Poisson NEGBIN I NEGBIN II HUR I
0.96 (0.097)
0.421 (0.018)
-0.014 (0.001)
0.11 (0.026)
0.10 (0.030)
0.009 (0.001)
-0.12 (0.103)
- 0.47 (0.125)
0.15 (0.158)
0.14 (0.087)
0.81 (0.078)
0.364
- 1.02 (0.103)
0.45 (0.022)
-0.015 (0.001)
0.13 (0.026)
0.10 (0.03 1)
0.009 (0.001)
-0.12 (0.106)
-0.50 (0.130)
0.15 (0.122)
0.12 (0.092)
0.62 (0.100)
0.055 (0.018)
0.371
-1.74 (0.133)
0.43 (0.026)
-0.014 (0.001)
0.14 (0.031)
0.11 (0.043)
0.007 (0.002)
0.01 (0.142)
-0.33 (0.167)
0.22 (0.149)
0.25 (0.14)
HUR II
0.09 (0.072)
0.27 (0.010)
-0.008 (0.0005)
0.04 (0.017)
0.04 (0.020)
0.011 (0.001)
-0.21 (0.078)
-0.31 (0.088)
0.38 (0.086)
0.12 (0.053)
0.332 - Notes: a and SALES* define the relationship between the conditional mean
and the conditional variance. MLL is the mean log-likelihood value at the maximum.
all is related to the explanatory variables in a different way than the decision to acquire a certain number of licenses, once the decision to buy at least one has been made. This suggests that existence of some ‘threshold’ that can be analyzed using a model that separates these two decisions.
We specify a more general model as
fb(O,PJ+ c .L(Y?P2)=L (16) YER+/(O)
where fb is the density function describing the decision to buy technology at all, and f. determines how many of the licenses are purchased. Note that the Poisson specification is just a restricted form of the last equation where
(17)

242 J.G. Montalvo and Y. Yafeh, A microeconometric analysis of technology transfer
The advantage of this kind of model, apart from its intuitive appeal, is that it allows for estimation under conditions of over- and underdispersion. Estimation results using this specification are reported in regressions HUR I and HUR II of table 7. A formal Hausman-type test of the Hurdle Poisson against the restricted Poisson model takes the form:
where k is the number of coefficients and HUR and PO1 refer to the coefficients of the Hurdle and Poisson models, respectively.
Even though the value of h indicates that the Poisson model should be rejected when compared with the Hurdle Poisson (h= 527.35) the signs of the coefficients in HUR I and HUR II are still as predicted in the theoretical model. Notice, however, that while the negative binomial results are gener- ally very similar to the Poisson regression results, the coefficients are somewhat different in the Hurdle Poisson model. The effect of SALES in the first stage (the decision whether to buy one license or none at all) is very important. In the second stage (the number of licensing agreements to be signed), the coefficient on SALES is much smaller. A similar pattern is observed with respect to BANK, and vertical integration (VZ), which tend to be more important in the decision whether to buy technology at all. Note, however, that the importance of technological opportunity (TO) is bigger in the second stage (the number of licensing agreements) than in the first stage. We interpret this as evidence that large, less liquidity constrained firms are more likely to invest in technology, but the actual number of licenses purchased depends, to a great extent, on the firm’s technological environment.
7. Conclusions and suggestions for further research
This paper provides a first look at the characteristics of recipient firms in a process of technology transfer. For the first time, a microeconomic frame- work and a statistical analysis of a large sample of firms in several major industries are used. We find that much of the technological catch-up during the period examined is driven by large enterprises, although the relationship between licensing agreements and firm size is concave. We find evidence on the importance of liquidity for investment in foreign technology. We also find that both horizontal and vertical keiretsu groups play a large role in the process of technology transfer. These results seem robust, and hold under several different distributional assumptions.
In the future we intend to extend our sample and conduct further experiments using earlier Japanese data in order to understand better the process of technology transfer to Japan and the role of the keiretsu

J.G. Montalvo and Y. Yafeh, A microeconometric analysis of technology transfer 243
institution in it. Some extensions of our empirical analysis, using several novel panel data techniques, and allowing for simultaneous determination of both output and investment in technology are included in Montalvo’s (1992) companion paper.
References
Aoki, M., 1984, Shareholders non-unanimity on investment financing: Banks vs. individual investors, in: M. Aoki, ed., Economic analysis of the Japanese firm (North-Holland, New York).
Aoki, M., 1988, Information, incentives and bargaining in the Japanese economy (Cambridge University Press, Cambridge).
Bernstein, J. and 1. Nadiri, 1989, Research and development and intraindustry spillovers: An empirical application of dynamic duality, Review of Economic Studies 56, no. 2, 249-267.
Blumenthal, T., 1976, Japan’s technology strategy, Journal of Development Economics 3, no. 3, 245-255.
Bonin, B., 1981, Contractual agreements and international technological transfer: The empirical studies, in: A. Safarian and G. Bertin, eds., Multinationals, governments and international technology transfer (St. Martin’s Press, New York).
Cameron, A. and P. Trivedi, 1986, Econometric models based on count data: Comparisons and applications of some estimators and tests, Journal of Applied Econometrics 1, no. 1, 29-53.
Caves, R. and A. Torii, 1991, Technical efficiency in Japanese and US manufacturing industries, Mimeo. (Harvard University).
Contractor, F., 1981, International technology licensing: Compensation, costs and negotiation (Lexington Books, Lexington, MA).
Cusumano, M., 1985, The Japanese automobile industry: Technology and management at Nissan and Toyota (Harvard University Press, Cambridge, MA).
Dodwell Marketing Consultants, 1984, Industrial groupings in Japan (Dodwell, Tokyo). Evanson, R., 1984, International invention: Implications for technology market analysis, in: Z.
Griliches, ed., R&D, patents and productivity (University of Chicago Press, Chicago, IL). Frankel, J., 1991, The cost of capital in Japan: A survey, Mimeo. (UC Berkeley). Goto, A., 1982, Business groups in a market economy, European Economic Review 19, no. 1,
53-70. Hamada, K. and A. Horiuchi, 1987, The political economy of the financial markets, in: K.
Yamamura and Y. Yasuba, eds., The political economy of Japan, Vol. 1: The domestic transformation (Stanford University Press, Stanford, CA).
Hausman, J., B. Hall and Z. Griliches, 1984, Econometric models for count data with an application to the patents-R&D relationship, Econometrica 52, no. 4, 909-938.
Hoshi, T., A. Kashyap and D. Scharfstein, 1990, Evidence on 4 and investment for Japanese firms, Journal of the Japanese and International Economies 3, no. 4, 37l+WO.
Hoshi, T., A. Kashyap and D. Scharfstein, 1991, Corporate structure, liquidity and investment: Evidence from Japanese industrial groups, Quarterly Journal of Economics 106, no. 1, 33-60.
Jaffe, A., 1986, Technological opportunity and spillovers of R&D: Evidence from firms’ patents and market value, American Economic Review 76, no. 5,984-1001.
Jorgenson, D., M. Kuroda and M. Nishimizu, 1987, Japan-US industry level productivity comparison, 1960-1979, Journal of the Japanese and International Economies 1, no. 1, l-30.
Jorgenson, D., 1988, Productivity and economic growth in Japan and the US, American Economic Review 78, no. 2, 217-212.
Katz, M. and C. Shapiro, 1987, R&D rivalry with licensing or imitation, American Economic Review 77, no. 3, 402420.
Komiya, R. and M. Itoh, 1988, Japan’s international trade and trade policy, in: T. Inoguchi and D. Okimoto, eds., The political economy of Japan, Vol. 2: The changing international context (Stanford University Press, Stanford, CA).

244 J.G. Montalvo and Y. Yafeh, A microeconometric analysis of technology transjk
Kramer, S., 1988, Japan and the US: Prospects for stability, in: Y. Inoguchi and D. Okimoto, eds., The political economy of Japan, Vol. 2: The changing international context (Stanford University Press, Stanford, CA).
McCuIIagh, P. and J. Nelder, 1989, Generalized linear models (Chapman and Hall, New York). Meerschwam, D., 1990, The Japanese financial system and the cost of capital, Mimeo. (Harvard
University). Montalvo, J., 1992, Multiplicative panel data models: An application to technology transfer,
Mimeo. (Harvard University). Myers, S. and N. Majluf, 1984, Corporate financing and investment decisions when firms have
information that investors do not have, Journal of Financial Economics 13, no. 2, 187-221. Nakatani, I., 1984, The role of financial corporate grouping, in: M. Aoki, ed., Economic analysis
of the Japanese firm (North-Holland, New York). Odagiri, H., 1983, R&D expenditure, royalty payments and sales growth in Japanese manufac-
turing corporations, Journal of Industrial Economics 32, no. I, 61-71. Okimoto, D. and G. Saxonhouse, 1987, Technology and the future of the economy, in: K.
Yamamura and Y. Yasuba, eds., The political economy of Japan, Vol. I: The domestic transformation (Stanford University Press, Stanford, CA).
Ozaki, K., 1972, The control of money and foreign capita1 in Japan (Praeger Press, New York). Peck, M. and S. Tamura, 1976, Technology, in: H. Patrick and H. Rosovsky, eds., Asia’s new
giant: How the Japanese economy works (The Brookings Institution, Washington, DC). Suzuki, K., 1985, An empirical analysis of the interdependence of R&D investment and market
structure, Mimeo. (Japan Development Bank). Tirole, J., 1988, The theory of industrial organization (MIT Press, Cambridge, MA). Tsurumi, Y., 1980, Technology transfer and foreign trade: The case of Japan 1950-1966 (Arno
Press, New York). Wakasugi, R., 1988, Research and development and innovations: The case of the semiconductor
industry, Japanese Economic Studies 17, no. 1, 3-35. Weinstein, D. and Y. Yafeh, 1993, Japan’s corporate groups: Collusive or competitive? An
empirical investigation of keiretsu behavior, Harvard Institute of Economic Research, Discussion Paper no. 1623.
Williamson, O., 1985, The economic institutions of capitalism: Firms, markets, relational contracting (Collier Press, London).
Yoshikai, T., 1986, R&D and technological policy in Japan, Japanese Economic Studies 14, no. 4, 3-50.