farstad shipping asa annual farstad …€™s report03 income statement statement of comprehensive...
TRANSCRIPT
FARSTAD SHIPPING ASA
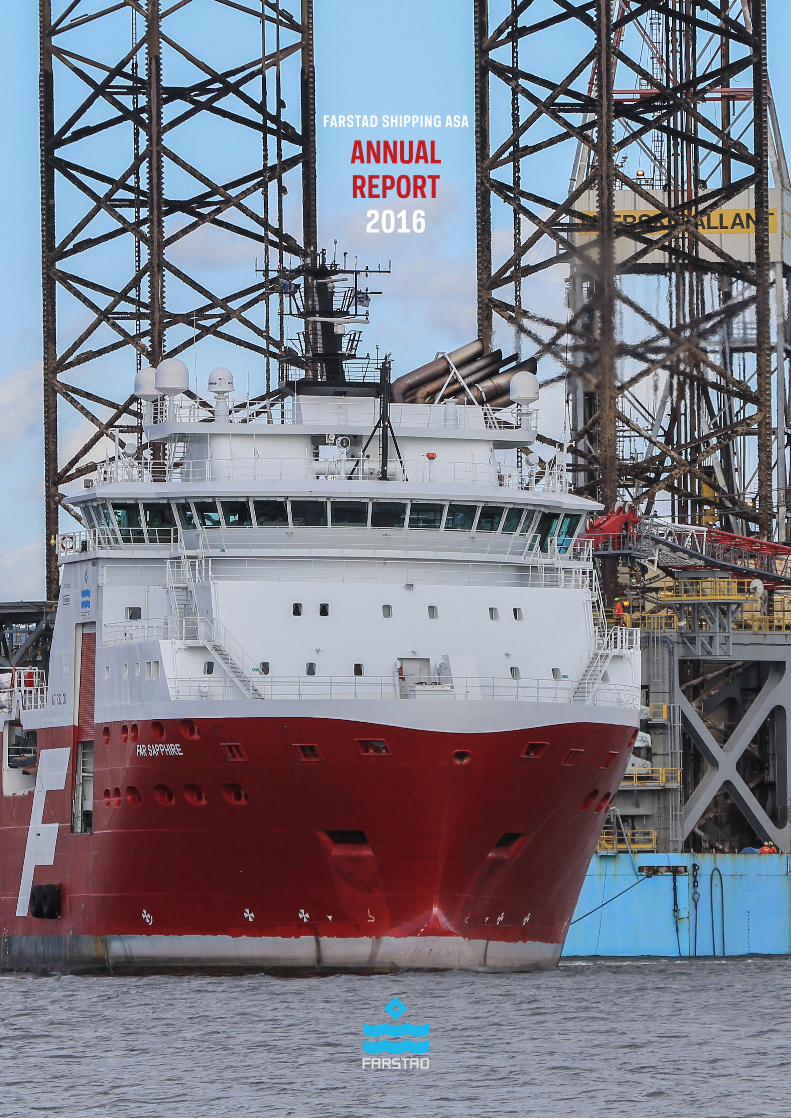
FARSTAD SHIPPING ASA
ANNUAL REPORT
2016
DIRECTOR’S REPORT
INCOME STATEMENT
STATEMENT OF COMPREHENSIVE INCOME
STATEMENT OF FINANCIAL POSITION
STATEMENT OF CASH FLOW
STATEMENT OF CHANGES IN EQUITY
NOTES TO THE ACCOUNTS
AUDITOR’S REPORT
GLOSSARY
CONTENT
FINANCIAL CALENDAR(Subject to change)
25 April Extraordinary General Meeting
25 April Annual General Meeting
31 May First quarter result
31 Aug. Second quarter result
30 Nov. Third quarter result
03
12
13
14
16
17
18
59
63
3
*) Source: IHS and Farstad Shipping
annual report 2016 - director’s report - farstad shipping asa
DIRECTOR’S REPORT
BUSINESS AREAS Farstad Shipping is a long-term, major supplier of large, modern offshore service vessels to the international oil and gas industry. As per 31 December 2016 the group’s fleet consisted of 56 vessels, 27 of these were anchor handling vessels (AHTS), 22 were platform supply vessels (PSV) and 7 were subsea vessels (SUBSEA). The Group’s operations are run from Ålesund, Aberdeen, Perth, Mel-bourne, Singapore, Rio de Janeiro and Macaé. The total number of employees onshore and offshore is approxi-mately 1,500. 11 vessels are presently in Brazil, 14 in North-Western Europe, five in the Mediterranean, 22 in Australia and Southeast Asia, one vessel is in the Gulf of Mexico, and three is in West Africa.
THE MARKET *)Market-wise, 2016 represented another challenging year for the offshore industry. The average price for Brent crude in 2016 was approximately USD 44 per barrel, USD 10 lower than the previous year. The oil price recovered some-what in the third quarter following Russia and Opec agree-ing on stabilising the supply of oil. Late November Opec members agreed to reduce production by 1.2 mmbbl per day starting January 2017. Consequently, the Brent price increased and traded slightly below USD 55 per barrel. For the past two years, US shale production has been in decline. However, efficiency improvements combined with cost reductions have picked-up, and the shale segment should benefit from investments and recover sooner than the offshore segment.
The volatile oil prices, which have led to reduced activity in our core markets, cost reduction programmes with our customers combined with oversupply of offshore service vessels have resulted in unsustainable economic conditions for our industry. All regions and markets have experienced pressure on rate levels, and this has resulted in an increas-ing number of offshore service vessels being laid up. Al-though the newbuilding contracting activity has come to
a halt, the order book at year-end is still high, correspond-ing to 15% of the existing fleet. Chinese shipyards hold orders of more than 166 vessels. Farstad Shipping has had 20 vessels wholly or partially laid up during the last quarter of the year.
Traditionally, Farstad Shipping has concentrated its activ-ity on the high end - large and medium sized - supply vessel segment. The world fleet of large and medium-sized supply vessels increased by 3.5% in 2016. The largest markets are North-West Europe (22.8%), APAC (Asia Pacific) (23.5%), Brazil (11.9%), the Gulf of Mexico (18.7%) and West-Africa (10.7%). Even though consolidation in the industry has started, there are still many small companies providing services in the market.
At the end of 2016, Farstad Shipping had six vessels op-erating in the subsea segment. These contributed with 25.5% of the operating income in 2016. The PSV fleet (22 vessels) contributed with 25.1%, while the AHTS fleet (27 vessels) contributed with 48.7%. Also in 2016, the most important markets for Farstad Shipping was North-West Europe, Brazil and APAC. In 2016, these markets represented 87.2% of the company’s operating income. Brazil was the largest with 38.5% of the income, corre-sponding to NOK 1,036.2 million. APAC represented 32.8% of the income (NOK 883.9 million), while North-West Europe represented 15.8% (corresponding to NOK 426.1 million) of the operating income. Other markets represented 12.2% of the revenue (NOK 327.2 million).
At the end of February 2017 the contract coverage for the Farstad fleet, including charter options, was approx. 43% for 2017 (38% excl. options) and approx. 36% for 2018 (19% excl. options).
During the last two years the market in North-West Europe has developed significantly worse, and demand measured in boat-years has dropped significantly combined with an
4 annual report 2016 - director’s report - farstad shipping asa
increasing supply side. This development has resulted in a substantial drop in term contracts and resulted in an increas-ing number of offshore service vessels being laid up. About 150 vessels were laid up in North-West Europe at the end of 2016. Seven of these belonged to Farstad Shipping.
The Brazilian market has been characterised by the over-all challenging political situation, which also has had a bearing on Petrobras. A relatively high inflation and cor-responding interest rate levels reflect some of the difficul-ties, which the Brazilian economy facing.
Due to the financial situation, Petrobras has made consid-erable adjustments in its fleet throughout 2016. Along with a reduction in demand from international oil compa-nies, this has led to a reduction in the number of offshore service vessels on the Brazilian shelf from 333 vessels to 232 high-end vessels at the end of 2016. The preference for vessels with Brazilian flag implies that the reduction has affected the international fleet in particular. Through-out the year, this fleet was reduced by 42%, from 165 vessels to 95 vessels. Of the remaining fleet, there are 33% PSV, 30% AHTS, and 37% SUBSEA vessels. About 93% of the international fleet is on contract to Petrobras. At year-end, Farstad Shipping had seven of its 11 vessels in the region on contract with Petrobras, three of these are carrying Brazilian flag.
In Australia we have seen reduced demand for large and medium-sized supply vessels. Despite this, Farstad Ship-ping has managed to maintain its relative market position (about 40%) as the company has secured contracts with leading oil companies during 2016.
Farstad Shipping’s simulation centre in Perth is a knowledge centre offering certification and training of seafarers in the offshore industry. The centre is an important part of our profiling in the Australian market, and plays a key part in training and competence building for our own crew.
FLEET AND CONTRACT ACTIVITYADDITION/DISPOSAL• Far Scandia (PSV 1991, UT 705, 3,100 DWT) was sold 15 January. The sale gave a book loss of NOK 8 million recognised as impairment of the vessel’s book value in the 4th quarter 2015.
• Lady Grace (PSV 2001, UT 755, 2,936 DWT) was sold 21 January. The sale resulted in a book loss of NOK 49 million in the 4th quarter 2015 recognised as impairment of the vessel’s book value.
• Lady Grete (PSV 2002, UT 755 L, 3,264 DWT) was sold 29 February. The sale gave a book loss of NOK 63 million, whereof NOK 60 million was booked as impairment in the 4th quarter 2015.
• Far Sea (AHTS 1991, ME303 II, 13,219 BHP) was sold 3 March. The sale gave a book loss of NOK 32 million, whereof NOK 30 million was booked as impairment in the 4th quarter 2015.
• Lady Sandra (AHTS 1998, KMAR 404, 15,014 BHP) was sold 26 September. The sale gave a book loss of NOK 11 million recognised as impairment of the vessel’s book value in 2nd quarter 2016.
• Far Fosna (AHTS 1993, UT 722, 14,389 BHP) was sold 8 November. The sale resulted in an immaterial accounting effect in 4th quarter 2016.
CONTRACT ACTIVITYThe most important charter contracts made during the year were:
• Petrobras awarded the PSV Far Strider a four year con-tract.
• Petrobras also awarded the AHTS BOS Turquesa a one year contract with a further one year option.
• Woodside Energy Ltd. awarded the AHTS Far Senator a 17 month contract plus options.
• An international oil company extended the contract for the PSV Far Spica until 1 March 2017 with additional seven months of options. In addition, the PSV Far Scotsman was awarded a firm contract up to 1 March 2017 by the same client.
• BG Tanzania awarded the PSV’s Far Sitella, Far Starling and Far Skimmer contracts to support their drilling opera-tions off the coast of Tanzania. Commencement was in October. The duration of the contracts was one well (approx. 45 days), with options to extend. The contracts may be extended by up to four wells for each vessel. BG Tanzania has declared the first of these options.
• Chevron terminated the contracts for the AHTS Far Sho-gun and the AHTS Far Saracen in July.
• Total E&P Congo awarded the CSV Far Sleipner a contract of 18 months duration to support their subsea activity in Congo. Commencement was in September, and Total has
5annual report 2016 - director’s report - farstad shipping asa
options to extend the contract by 6 x 2 months.
• Petrobras extended the contract for the MPSV Far Swift with another year in direct continuation with present con-tract. Thus, the vessel is on firm contract until October 2017.
• Petrobras terminated the contract for the PSV Far Star from 10 October. Shell Brasil Petroleo Ltda. awarded the PSV Far Star a two-year contract to support their produc-tion activities offshore Brazil. Commencement will take place in 1st quarter 2017, and Shell has the option to extend the contract with two additional years.
• Saipem SA awarded the PSV’s Far Service and Far Sup-porter contracts of six months duration (including mobilisa-tion), to support their activity offshore Egypt. Commence-ment was in December 2016, and Saipem has options to extend the contracts with another 30 days.
• ConocoPhillips Australia Exploration has issued a LOI to the AHTS Far Sirius and the AHTS Far Saracen to support their upcoming Barossa drilling campaign. This campaign is due to commence in January 2017.
• The INPEX-led Ichthys LNG Project has extended the AHTS Far Sword contract with additional 17 months in direct continuation of the existing contract.
• McDermott’s Australia awarded the PSV Far Seeker a contract for a period of 40 days firm plus 40 days options. The contract commenced in December 2016.
• McDermott’s Australia awarded two AHTS vessels con-tracts to assist with the mooring operations of the INPEX-led Ichthys LNG Project’s Central Processing Facility and FPSO. This is due to commence within Q2 2017.
FLEET AND CONTRACT ACTIVITY AFTER YEAR-END • Saipem SA awarded the PSV’s Far Serenade and Far Server contracts of 3.5 months duration (including mobi-lisation), to support their activity offshore Egypt. Com-mencement took place in February 2017, and Saipem has options to extend the contracts with another 30days.
• Fairfield Betula Limited awarded the PSV Far Symphony a 12 months contract with a six months option to support their operation on the UK shelf. Commencement will take place during April 2017. •The subsea/construction vessel Far Superior, VARD 3 17 design, was delivered from VARD Vung Tau, Vietnam on
16 January 2017. The vessel was on a bareboat contract to Farstad Construction AS, prior to Far Superior AS tak-ing delivery of the vessel 8 March 2017. Financing of the vessel consist of NOK 300 million in senior debt, NOK 100 million in sellers credit from the yard with the balance set-tled with equity.
•Far Shogun is sold and will be handed over in June 2017. The vessel is presented as held for sale as of 31.12.2016.
CHANGES TO THE BOARD OF DIRECTORSOn 16 January 2017 Leif-Arne Langøy retired from the board of the company. Langøy has been excused from the board’s work with Farstad Shipping ASA’s refinancing pro-cess since summer 2016.
At the extraordinary general meeting 3 March 2017 new board members were elected. The new board consists of Chairman Sverre A. Farstad, Audun Stensvold and Merete Haugli. Previous board members Per Norvald Sperre, Gro Bakstad, Mads Andersen, Janne-Grethe Strand Aasnæs and Astrid Koppernæs retired from the board of the company.
GOING CONCERNThe Board confirms that the 2016 financial statements, pursuant to section 3-3a of the Norwegian accounting act, have been prepared based on the assumption of a going concern. Founded on the financial restructuring of the group that was completed during Q1 2017, the board confirms that this assumption is appropriate.
IFRS ACCOUNTING STANDARDSThe consolidated accounts and the accounts of the parent company, Farstad Shipping ASA, are prepared in accord-ance with the International Financial Reporting Standard (IFRS) and interpretations adopted by the EU. RESULT AS PER 31 DECEMBER 2016Operating income for 2016 was NOK 2,687.6 million in-cluding loss from the sale of vessels NOK 4,4 million (NOK 4,011.1 million including loss from sale of vessels NOK 4.6 million). The reduction in operating income reflects the challenging market situation.
Operating costs were NOK 2,177.4 million (NOK 2,648.1 million). The last few years the group has launched several initiatives aiming at both reducing as well as obtaining scal-ability in the cost base to improve profitability. Operating profit before depreciation and impairments (EBITDA) was NOK 510.1 million (NOK 1,363.1 million).
Depreciation and impairments were NOK 3,616.0 million
6 annual report 2016 - director’s report - farstad shipping asa
(NOK 2,176.8 million). Of this, NOK 2,678.5 million were impairments of vessels, goodwill and other fixed assets (NOK 1,279.6 million). Short term, the OSV industry is continuing to face substantially reduced earnings capac-ity, and the impairment figures are mirroring a challenging and highly competitive environment.
Due to the current market conditions, as well as uncer-tainty related to vessels future earnings, the Group has performed individual impairment tests of all vessels. Where the recoverable amount is lower than the recognised value for the vessels/assets, impairments have been charged to the profit and loss statement. The recoverable amount for each vessel is determined based on a value in use calcula-tion derived from cash flow before financial items and tax. The cash flow calculations have been discounted with an average cost of capital after tax. The cash flow per vessel is normally based on a 30 year life span for the vessels. Market values provided by three reputable and independ-ent shipbrokers are used to support the evaluation and impairment testing.
Operating profit (EBIT) was negative by NOK 3,105.9 mil-lion (negative NOK 813.8 million). Net financial items were negative by NOK 414.5 million (negative NOK 1,272.6 million). Of this amount, unrealised currency gain consti-tuted NOK 287.2 million (loss NOK 548.6 million). The unrealised currency gain was mainly caused by the de-crease in the company’s long-term liabilities in foreign cur-rency due to a stronger NOK and BRL throughout the year. Further, currency losses were realised by a total of NOK 86.4 million (loss NOK 86.4 million). Loss after taxes was NOK 3,600.3 million (loss NOK 2,170.0 million).
The change in market value of currency- and interest hedg-ing instruments was positive by NOK 264.4 million (negative NOK 33.1 million), and was recorded over the statement of other comprehensive income and charged to equity.
CASH FLOWHoldings of cash and cash equivalents were reduced from NOK 1,578.6 million at the end of 2015 to NOK 758.7 million as per 31 December 2016. The reduction in cash and cash equivalents is due to the fact that cash flow from operational activities is insufficient to cover interest and instalments related to long-term liabilities. Cash flow from operational activities was NOK 300.3 million in 2016 (NOK 1,260.0 million). Net cash flow from investments was negative by NOK 19.0 million (negative NOK 1,693.1 mil-lion). Payments made in 2016 in relation to the newbuild Far Superior were partially offset by sale of older vessels. Net cash flow from financing activities is negative NOK
1,052.9 million (negative NOK 126.7 million), reflecting payment of interest and instalments to the lenders.
RESULT FOR THE PARENT COMPANY AND DIVIDENDProfit and loss for the parent company Farstad Shipping ASA shows a negative result of NOK 1,186.7 million (negative NOK 856.7 million in 2015). The board suggests that NOK 1,173.3 million is booked as a reduction of re-tained earnings and NOK 13.4 million as a reduction of share premium. The negative result of the parent company is due to impairment of shares in and loans to subsidiaries of NOK 1,246.5 million. The Board proposes to the com-pany’s General Meeting on 25 April 2017 that no dividend is paid for the fiscal year 2016 (NOK 0.00 per share for 2015). FINANCING AND CAPITAL STRUCTUREIn the statement of financial position at 31.12.2016 the interest-bearing liabilities constituted NOK 11,551.1 mil-lion (NOK 12,323.9 million as per 31 December 2015). The company’s interest-bearing liabilities were distributed with 68.1% in NOK, 24.6% in USD, 1.6% in GBP, 5.2% in AUD and 0.5% in EUR. Interest-bearing current assets were NOK 800.1 million (NOK 1,693.9 million) as per 31 December 2016.
The group’s equity was recognised at NOK 986.6 million as per 31 December 2016 (NOK 4,344.1 million), corre-sponding to NOK 25.30 (NOK 111.39 per share. Book equity ratio is 7.3% (24.0%).
EVENT AFTER YEAR END - FINANCIAL RESTRUCTURING OF THE GROUP On 6 February 2017, Farstad Shipping announced that Aker Capital AS, a wholly owned subsidiary of Aker ASA, Hemen Holding Limited (“Hemen”) (a company indirectly controlled by trusts established by Mr. John Fredriksen for the benefit of his immediate family), as well as Farstad Shipping’s senior lenders, bondholders, and F-Shiplease AS (a subsidiary of Ocean Yield ASA), had entered into an agreement (the “Restructuring Agreement”) for a fully-funded financial restructuring of Farstad Shipping (the “Farstad Restructuring”). On 2 March 2017 the Farstad Restructuring was approved by the majority of the bond-holders in both bonds and on 3 March 2017 the Farstad Restructuring was approved by the general meeting.
The Farstad Restructuring consists of the following ele-ments:
(i) Farstad Shipping’s creditors converted debt claims to equity (the “Conversion of debt”) Farstad Shipping’s
7annual report 2016 - director’s report - farstad shipping asa
senior lenders, bondholders and F-Shiplease AS have com-pleted a capital increase for conversion of debt as follows:
a) Farstad Shipping ASA assumed debt owing by its subsidiaries to certain senior lenders in the amount of NOK 940 million and the senior lenders have converted NOK 940 million into 752 million new shares in Farstad Shipping at a price of NOK 1.25 per share.
b) The senior lenders released Farstad Shipping’s sub-sidiaries of their obligation to pay NOK 332 million in future interest in exchange for a NOK 271 million claim against Farstad Shipping (equalling the net present value of such future interest payments), and the NOK 271 million claim was converted into 774,285,714 new shares of Farstad at a share price of NOK 0.35.
c) The outstanding bond debt in FAR03 and FAR04 with a total outstanding amount of NOK 1,407 million, representing a principal of NOK 1,400 million plus interest in the amount of NOK 7 million, was converted into 1,125,516,355 new shares of Farstad at share price NOK 1.25.
d) F-Shiplease AS have released Farstad Supply AS of its obligation to pay NOK 70 million of the “amortisation” element and NOK 109 million of the “interest” element of its two bare-boat leasing agreements with F-Shiplease, in exchange for a NOK 161 million claim against Farstad Shipping (equalling the sum of the NOK 70 million “amor-tisation” element and the net present value of the “interest” element being NOK 91 million). The NOK 70 million “am-ortisation” element of the claim was converted into 56 million new shares of Farstad at a price of NOK 1.25 per share, whereas the NOK 91 million “interest” element of the claim was converted into 259,595,760 new shares of Farstad Shipping at a share price of NOK 0.35.
(ii) Farstad Shipping have issued NOK 650 million of new equity fully underwritten by Aker and Hemen (the “Eq-uity Issue”).
The Equity Issue, which was fully underwritten by Aker and Hemen on a 50:50 basis, consists of a NOK 400 million in share issue to Hemen and Aker and NOK 50 million in share issue to Tyrholm & Farstad Invest AS (an affiliate of Farstad Shipping’s main shareholder) (“Private Placement 1”), a NOK 150 million in share issue to Farstad Shipping’s bondhold-ers (“Private Placement 2”) and a NOK 50 million repair issue to existing Farstad Shipping shareholders and Bond-holders who were not allocated shares in Private Placement 2 (the “Repair Issue”). The Repair Issue was subscribed for
NOK 29 million by Farstad Shipping’s shareholders and bondholders, the remaining was subscribed by Aker and Hemen on a 50:50 basis. The subscription price in the Equity Issues were NOK 0.35 per share.
Share capital as per 31 December 2016 had a value of NOK 39 million, at a nominal price of NOK 1.00 per share. In 1Q 2017 the company’s share capital was reduced with NOK 37 million from NOK 39 million to NOK 2 million by reducing the nominal value of the shares with NOK 0.95 per share from NOK 1.00 to NOK 0.05. The reduced share capital of NOK 37 million has been allocated to retained earnings. Following the equity issues that was completed by 23 March, the nominal share capital has been increased to approxi-mately NOK 243 million.
(iii) The existing financing agreements of Farstad Ship-ping was amended (the “Farstad Amended Financing Terms”).
The terms and conditions of the existing financing agree-ments for Farstad Shipping (except for financing agree-ments with Westpac and BNDES) were amended and har-monised, including by adding the following features:
a) The amortisation profile of the loans (after adjustment for the amounts converted to equity) was reduced to 10% of the original profile from 1 January 2017 until 31 De-cember 2021. Commencing in Q1 2022 the balance of amortising senior debt will become amortising in linear instalments of 20% per year, whereas senior loans with a bullet repayment profile will receive an extraordinary repay-ment of 4% in Q2 2019. The final maturity date for all loans (with maturity date prior to the new maturity date) will be extended to Q4 2023;
b) A cash sweep mechanism has been introduced;
c) In addition to certain financial covenants, restrictions have been introduced with respect to Farstad’s ability to pay dividends, incur new debt, carry out equity issues and make capital expenditures;
d) Minimum value clause at 100% across the group’s fleet (but suspended throughout 2019);
e) Removal of current ownership covenants;
f) Pre-approval of sale of older vessels at prices below secured debt using agreed mechanisms.
The Farstad Amended Financing Terms ensures that the
8 annual report 2016 - director’s report - farstad shipping asa
Company is no longer in breach with its financial covenants and long term debt classified as current liabilities has been reclassified as non-current liabilities. Total NOK 8,174 million are reclassified from current to Non-current liabili-ties following the Farstad Restructuring.
Business combinationFurthermore to the announcement 6 February 2017, the parties to the Restructuring Agreement, together with Soff Invest AS and Ivan II AS (jointly the “Solstad Family Compa-nies”) and Tyrholm & Farstad AS, have agreed to work for a combination of Solstad Offshore ASA (“Solstad Offshore”), Farstad Shipping ASA (“Farstad Shipping”) and Deep Sea Supply Plc (“Deep Sea Supply”) following completion of the Farstad Restructuring, creating a world class OSV com-pany (the “Combination”).
The combination is proposed to be structured as follows:
(i) Deep Sea Supply and Farstad Shipping will merge into and be established as individual subsidiaries under Solstad Offshore, with shareholders of Deep Sea Supply and Farstad Shipping receiving shares in Solstad Offshore as consideration (the “Mergers”).
Under the Mergers, Farstad will merge with a newly incor-porated subsidiary of Solstad Offshore and Farstad’s for-mer shareholders will receive shares in Solstad Offshore as merger consideration. The exchange ratio in the Solstad Offshore / Farstad merger will be 0.35:12.50 Farstad shares per Solstad Offshore share.
Contemporaneously with the Solstad Offshore / Farstad merger, Deep Sea Supply will combine with Solstad Off-shore in a merger or merger-like transaction whereby all of Deep Sea Supply’s assets, rights and obligations will ultimately be transferred to a subsidiary of Solstad Off-shore against consideration in the form of Solstad Offshore shares. The amount of Solstad Offshore consideration shares issued will be based on an agreed exchange ratio of 1.32:12.50 Deep Sea Supply shares per Solstad Off-shore share.
(ii) The existing financing agreements of Solstad Off-shore and Deep Sea Supply will be sought amended and harmonised with the Farstad Amended Financing Terms.
(iii) In connection with the Combination, Solstad Offshore will complete a NOK 200 million private placement di-rected towards Hemen at a subscription price of NOK 12.50 per share. The proceeds from the private placement will passed on by Solstad Offshore to the part of the new
group comprising the former Deep Sea Supply operations. (iv) Aker will convert its NOK 250 million convertible loan to Solstad Offshore in exchange for shares, such convert-ible loan having originally been granted to Solstad Offshore in 2016 together with a NOK 250 million equity investment by Aker in Solstad Offshore.
(v) Solstad Offshore’s dual share class structure will be collapsed, and all Class A and Class B shares will be con-verted to common shares on a 1:1 basis.
The transaction elements listed above are interdependent and will become effective simultaneously upon completion of the Combination. A merger plan between Farstad Ship-ping ASA (acquired) and Solship Invest II AS (acquiring), with shares in Solstad Offshore ASA, was approved by the boards of directors in the respective companies 24 of March.
However, the Combination is not completed and it is subject to, among other things, agreement on final transaction documentation, competition authority approvals and rel-evant corporate resolutions.
The senior lenders in Farstad Shipping have undertaken to vote in favour of and otherwise support the Combination. Further, the senior lenders have undertaken a lockup obli-gation preventing them from selling their shares in Farstad Shipping until such time as the Combination is finally ap-proved or until 30 September 2017, unless otherwise agreed with Aker and Hemen.
Based on the financial restructuring of Farstad Shipping, as well as the proposed business combination with Solstad Offshore and Deep Sea Supply, the board believes that the embedded financial risk in Farstad, has been reduced substantially. Longer term, both the company and the OSV industry as a whole is dependent upon improving market terms to return to sustainable earnings and debt servicing capacity.
FINANCIAL RISKInterest rate riskThe volatility in market interest rate levels is bridged by en-tering into loan agreements with fixed interest and interest rate hedging agreements. At the end of 2016, approxi-mately 67% of the group’s debt was hedged with fixed inter-est loans and interest rate hedging agreements. Interest hedged debt is not exposed to changes in the market rates, but a decline in interest rates implies that the negative mar-ket value of the hedging instruments must be recorded.
9annual report 2016 - director’s report - farstad shipping asa
Currency riskThe group is largely exposed to currency risk, as a consid-erable percentage of its income is in foreign currency. Foreign currency loans and forward contracts/options are used to reduce the currency risk associated with cash flows in foreign currencies. However, a change in the relevant exchange rate implies that the change in the market value of the hedging contracts must be charged to equity.
Credit riskThe group is exposed towards accounts receivable losses, but had only incurred insignificant losses for 2016.
Market riskFarstad Shipping has chosen to concentrate its activity mainly in three markets; APAC, Brazil and North-Western Europe. The activity in all the group’s main markets has been characterised by the low oil price and the oil companies’ re-duction in activities and costs. The market risk in our industry is thus higher than it has been for years, and no early improve-ment is expected in any of the company’s main markets.
HEALTH, SAFETY AND ENVIRONMENTFarstad Shipping’s goal is to operate without damages to people, environment and materials. The group works ac-tively to make the employees aware of this goal.
All employees of the group are at all times obliged to follow our procedures and instructions based on our governing documents. This is vital in order to obtain safe, efficient and environmentally friendly operation of our vessels in accordance with national and international requirements and regulations.
The group is focused on learning and exchanging experi-ences across the fleet, based on all types of incidents both with and without damage. The company works continu-ously to improve safety in connection with vessel opera-tions. This is done in collaboration with our customers and suppliers. Close monitoring of the vessels’ technical condi-tion and backup systems (redundancy), ongoing mainte-nance is key for Farstad.
Lost time injuries and unwanted eventsAn important part of HSE management is registration, reporting and assessment of various HSE data. A number of measurement indicators have been established to help us in this work. The purpose is to document quantitative development over time as well as to strengthen the decision indicators for a systematic and targeted improvement work. The corporate management presents HSE results with as-sessments at every Board meeting. Two of the measuring
indicators used by the group are the «lost time injury fre-quency» (LTIF) and «total recordable case frequency» (TRCF). Both frequencies are measured as the number of injuries per one million working hours, measured 24 hours a day so that recreational injuries are also included. At the end of 2016, the frequency of lost time injuries was 0.16. This is an improvement compared to 2015 (0.50). With regard to TRCF, the frequency was 1.63 at year-end, com-pared to 2.50 in 2015. Both measures are at historical encouraging low levels. In a time where the industry is fac-ing multiple challenges, our crew and employees continue to deliver safe and environmentally friendly operations.
Safety and Emergency PreparednessThe group’s emergency preparedness system has been further upgraded in recent years. The group now has a com-mon system for handling emergency situations regardless of region and area of operation. In collaboration with pro-fessional external parties the emergency preparedness competence of employees has been strengthened through training and drills.
The outer environmentThe group’s goal of zero damages to people, environment and material is the basis for a conscious effort to reduce our impact on the outer environment.
In close collaboration with designers, shipyards and equip-ment suppliers we make use of available technological solutions in order to build and operate vessels with minimal risk of releasing environmentally hazardous substances into air and water. The newbuild that was delivered in January 2017, has environmentally friendly implementa-tions beyond the requirements of the class and authorities. This includes measures to reduce fuel consumption through the use of hybrid propulsion systems, installation of cata-lysts, the use of environmentally friendly antifouling and CleanDesign. Systems for measuring and registration of fuel consumption in various operations are also installed.
In recent years, several of the company’s vessels have been equipped to use shore power in frequent port calls during normal operation. The equipment has proven to work well; however, the access to shore power is still limited. For the fleet, currently five vessels, being in layup in Ålesund we have installed shore power facilities to reduce the consump-tion of bunkers. This has had both a positive impact on the environment and resulted in reduced layup costs.
Due to the continuing development of new technological solutions, better control and maintenance as well as the option to choose more environmentally friendly products,
10 annual report 2016 - director’s report - farstad shipping asa
the emission of pollutants to water and air have been con-siderably reduced in recent years.
Absence due to illness Absence due to illness for employees on board our vessels has had a slight negative development compared to last year. In 2016 absence due to illness was 3.61% (3.32% in 2015). Absence due to illness among our office employ-ees has also shown a negative development from 1.49% in 2015 to 1.87% in 2016.
Gender equality and discriminationThe company and the management work continuously to promote gender equality in all areas in order to create a diverse organisation. At the end of the year the group had 1,500 employees representing 18 nationalities.
The group is conscious of preventing gender-based dis-crimination. The principle of equal pay for equal work ap-plies in wage determination. Only relevant qualifications like education, experience, results and other professional criteria are to form the basis with regard to hiring, training, compensation and promotion. At the end of the year there were 68 women of the Group’s 107 office staff.
Our industry has a challenge with regard to motivating women to choose a maritime education. At the end of the year the total number of crew employees was 1,325, how-ever, only 40 of these were women. The company continued the efforts to recruit women to maritime related jobs in 2016. In addition to focusing on gender equality, there are efforts to include people from groups which are under-represented in the labour market, including people with disabilities.
Based on the company’s recognition of the value of a diverse organisation, Farstad Shipping was awarded the «Gold Stamp» by the Australian Women in Resources Alliance in 2014.
CORPORATE RESPONSIBILITYOur business shall be conducted in accordance with current laws and regulations as well as good business practice. The Group’s guidelines for ethics and social responsibility govern our employees and anyone representing the com-pany. All employees have been given an introduction to the contents and practical approach to these guidelines.
The group is associated with United Nations Global Com-pact, and submits annual reports according to UNGC’s ten principles regarding human rights, labour rights, environ-ment and anti-corruption. The ten principles are the basis
for developing and implementing responsible and sustain-able guidelines and procedures for the company. The report for 2015 was released end April 2016 and can be found on the company website: https://www.farstad.com/busi-ness/sustainability/social-responsibility/UN-global-com-pact.
In Australia, the Group has supported various projects in connection with education and social initiatives for children and youth. An example of this is the education programme that was established for representatives of the aboriginal population in the Kimberley region of Australia in collabo-ration with Woodside and Inpex. Through this programme, participants get the chance to obtain a «Rating Certificate of Proficiency». Farstad are in the process of re-establish-ing their commitment to not only Indigenous training but also Indigenous Community engagement as part of our corporate social responsibilities. Indigenous engagement and employment for seafarers will be established through a partnership with Aboriginal Maritime Pty Ltd. Commu-nity engagement will occur via numerous initiatives for example Farstad’s support of the Broome Science and Engineering Challenge 2017.
The group also supports the Karanba project in Brazil. Through a mutual commitment program and by means of football, Karanba gives less fortunate children and youth from the slum areas an opportunity for education. In addi-tion to the sponsorship, we have also made an agreement to hire a certain number of apprentices. This is a training program where selected young people are offered six months of intensive training under the auspices of the Bra-zilian navy. Then most of the participants are offered work on board our vessels. By supporting Karanba the company helps give these young people a chance of education and work while ensuring maritime recruitment.
INNOVATION, RESEARCH AND DEVELOPMENTClose collaboration between shipyards, shipping compa-nies, and equipment supplier characterises the maritime cluster on the North-West coast of Norway. Farstad Ship-ping aims to be a considerable contributor in this maritime environment.
Together with one of our main suppliers Farstad Shipping has participated in the development of a new system for measuring fuel consumption («Energy Management Level 1»). The system is developed in order to measure consump-tion during various operations, and the information is to be used to reduce fuel consumption and thus contribute to reduced emissions.
11annual report 2016 - director’s report - farstad shipping asa
One of the company’s main suppliers of winches has de-veloped a new control valve for anchor handling winches. A pilot of this valve has been installed on board one of the Group’s vessels. The experiences have been positive so far, and this system is expected to improve safety, reduce energy consumption as well as extend the use of anchor handling winches to areas other than anchor handling.
FUTURE PROSPECTSThe combination of the current oil price levels and corre-sponding reduced activity offshore suggests that the activ-ity for our industry will remain low in 2017. Even though there are some positive signs of increased activities, due to the unbalanced supply and demand of tonnage, it will take time before the overcapacity in the market is absorbed. Consequently, short term we expect that the fierce com-petition will result in continuous low rate levels and a high portion of the global offshore services fleet being in layup.
Longer term, the Group’s strategy is based on oil and gas being important energy carriers for decades ahead, with the demand for energy increasing in line with population growth and higher standard of living. Development of new oil and gas fields offshore will still be important in order to meet future demand.
The proposed business combination with Farstad Shipping, Solstad Offshore and Deep Sea Supply will release cost synergies and improve earnings capabilities of the com-bined group. Combined with the standalone refinancing of Farstad Shipping, this provides further comfort that the activities performed by Farstad Shipping have good pros-pects to be taken through the current weak markets.
CORPORATE GOVERNANCEFarstad Shipping’s principles for good corporate govern-ance shall lay the foundation for long-term value creation in the best interest of shareholders, employees and soci-ety in general. The company’s goal is to create values for
the owners through profitable operations and business development, and in this work there is great emphasis on performing good corporate governance. «Norwegian code of practice for corporate governance» (last revised on 30 October 2014) forms the basis for the group’s reporting in this area. Every year the Board and management of Farstad Shipping evaluate the principles for corporate governance and how these are addressed in the Group.
The purpose of the guidelines for corporate governance in Farstad Shipping is to clarify the distribution of roles be-tween shareholders, General Meeting, Board and com-pany management beyond what is evident in legislation.
The group’s report on corporate governance follows the recommendation systematically, and gives a description of compliance for every item in the recommendation. Any deviations from the recommendation are explained. Infor-mation which the Group is obligated to give according to the Accounting Act §3-3b on the annual corporate govern-ance statement in the annual report, has been considered as far as possible.
A more detailed description of the principles for corporate governance can be found on the company website.https://www.farstad.com/business/our-company/corporate-governance
DECLARATION FROM THE BOARD AND THE CEOWe declare to the best of our knowledge that the accounts for the period 01 January to 31 December 2016 are pre-pared in accordance with applicable accounting standards, and that the information in the accounts gives a true picture of the company’s and the Group’s assets, liabilities, finan-cial position and overall performance. We also declare that the annual report gives a true overview of the development, result and position of the company and the Group, as well as a description of the most central risk and uncertainty factors the company and the Group are facing.
Aalesund, 31 March 2017
karl-johan bakkenceo
sverre a. farstadchairman
Audun Stensvolddirector
Merete Hauglidirector
12
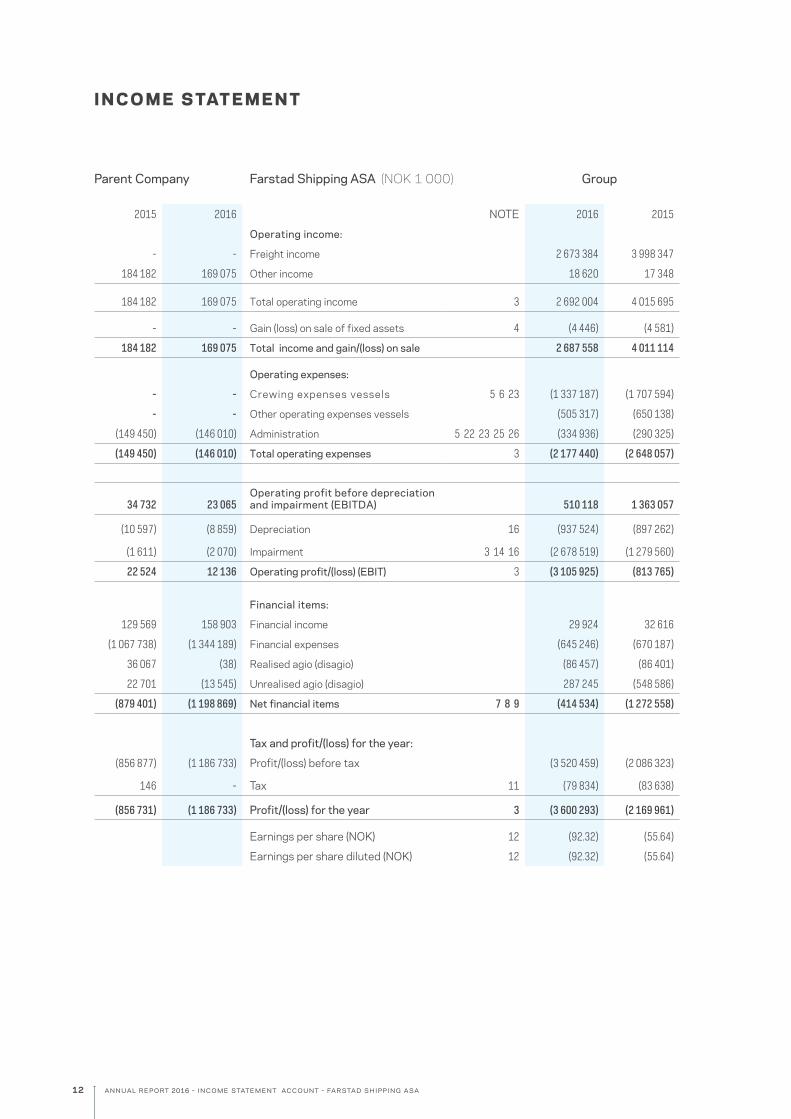
I N C O M E S TAT E M E N T
annual report 2016 - income statement account - farstad shipping asa
Parent Company Farstad Shipping ASA (NOK 1 000) Group
2015 2016 NOTE 2016 2015
Operating income:
- - Freight income 2 673 384 3 998 347
184 182 169 075 Other income 18 620 17 348
184 182 169 075 Total operating income 3 2 692 004 4 015 695
- - Gain (loss) on sale of fixed assets 4 (4 446) (4 581)
184 182 169 075 Total income and gain/(loss) on sale 2 687 558 4 011 114
Operating expenses:
- - Crewing expenses vessels 5 6 23 (1 337 187) (1 707 594)
- - Other operating expenses vessels (505 317) (650 138)
(149 450) (146 010) Administration 5 22 23 25 26 (334 936) (290 325)
(149 450) (146 010) Total operating expenses 3 (2 177 440) (2 648 057)
34 732 23 065 Operating profit before depreciation and impairment (EBITDA) 510 118 1 363 057
(10 597) (8 859) Depreciation 16 (937 524) (897 262)
(1 611) (2 070) Impairment 3 14 16 (2 678 519) (1 279 560)
22 524 12 136 Operating profit/(loss) (EBIT) 3 (3 105 925) (813 765)
Financial items:
129 569 158 903 Financial income 29 924 32 616
(1 067 738) (1 344 189) Financial expenses (645 246) (670 187)
36 067 (38) Realised agio (disagio) (86 457) (86 401)
22 701 (13 545) Unrealised agio (disagio) 287 245 (548 586)
(879 401) (1 198 869) Net financial items 7 8 9 (414 534) (1 272 558)
Tax and profit/(loss) for the year:
(856 877) (1 186 733) Profit/(loss) before tax (3 520 459) (2 086 323)
146 - Tax 11 (79 834) (83 638)
(856 731) (1 186 733) Profit/(loss) for the year 3 (3 600 293) (2 169 961)
Earnings per share (NOK) 12 (92.32) (55.64)
Earnings per share diluted (NOK) 12 (92.32) (55.64)
13
S TAT E M E N T O F C O M P R E H E N S I V E I N C O M E
annual report 2016 - statement of comprehensive income - farstad shipping asa
Parent Company Farstad Shipping ASA (NOK 1 000) Group
2015 2016 NOTE 2016 2015
(856 731) (1 186 733) Profit/(loss) for the year (3 600 293) (2 169 961)
Items not to be reclassified to income statement in subsequent periods
2 695 (615) Actuarial gains and losses pensions 23 (8 947) 27 180
- - Change in deferred tax 11 - (1 455)
Items to be reclassified to income statement in subsequent periods
3 812 19 060 Gain/(loss) on hedging instruments in cash flow hedges 8 264 428 (33 067)
- - Change in deferred tax 8 11 (3 342) 2 507
- - Translation effects foreign operations 2 (9 318) 11 115
6 507 18 445 Total other comprehensive income 242 821 6 280
(850 224) (1 168 288) Total comprehensive income for the year (3 357 472) (2 163 681)
14 annual report 2016 - statement of financial position - farstad shipping asa
S TAT E M E N T O F F I N A N C I A L P O S I T I O N
Parent Company Farstad Shipping ASA (NOK 1 000) Group
31.12.15 31.12.16 ASSETS NOTE 31.12.16 31.12.15
Non-current assets:
- - Goodwill 14 - 57 793
20 261 25 507 Vessels etc. 3 16 11 734 441 15 383 886
- - Contracts newbuild 15 16 70 677 18 336
- - Deferred tax asset 11 - 55 106
2 400 Other long-term receivables 23 540 2 716
702 632 600 005 Receivables from Group companies 24 - -
2 039 430 994 121 Shares 17 2 803 4 936
2 764 723 1 619 633 Total non-current assets 11 808 461 15 522 773
Current assets:
147 598 Account receivables, freight income 18 337 645 517 627
- - Bunkers and other inventories 62 656 75 540
131 314 208 330 Other short-term receivables 19 199 632 221 655
24 294 173 Other current financial assets 17 173 58 318
123 668 35 108 Cash and cash equivalents 17 758 737 1 578 619
279 423 244 209 Total current assets 1 358 843 2 451 759
- - Assets classified as held for sale 16 370 426 151 438
3 044 146 1 863 842 Total assets 13 537 730 18 125 970
15annual report 2016 - statement of financial position - farstad shipping asa
Parent Company Farstad Shipping ASA (NOK 1 000) Group
31.12.15 31.12.16 EQUITY AND LIABILITIES NOTE 31.12.16 31.12.15
Paid-in capital:
39 000 39 000 Share capital 39 000 39 000
198 396 185 001 Share premium 198 396 198 396
237 396 224 001 Total paid-in capital 237 396 237 396
Retained earnings:
1 154 893 - Other equity 749 209 4 106 681
1 154 893 - Total retained earnings 749 209 4 106 681
1 392 289 224 001 Total equity 986 605 4 344 077
Non-current liabilities:
42 713 49 375 Pension liabilities 23 59 424 55 324
65 000 65 000 Liabilities to Group companies 24 - -
- - Deferred tax liabilities 11 40 407 43 140
7 700 1 153 Currency and interest swap contracts 8 148 991 290 618
1 393 878 - Interest-bearing debt, bond and leasing obligations 9 10 1 446 900 11 287 530
1 509 291 115 528 Total non-current liabilities 1 695 722 11 676 612
Current liabilities:
35 840 57 587 Accounts payables 237 476 199 127
- - Taxes payable 11 21 747 38 271
106 726 70 028 Other current liabilities 20 21 491 961 831 550
- 1 396 698 Current portion of interest-bearing debt, bond and leasing obligations 9 10 10 104 219 1 036 333
142 566 1 524 313 Total current liabilities 10 855 403 2 105 281
1 651 857 1 639 841 Total liabilities 12 551 125 13 781 893
3 044 146 1 863 842 Total equity and liabilities 13 537 730 18 125 970
Aalesund, 31 March 2017
karl-johan bakkenceo
sverre a. farstadchairman
Audun Stensvolddirector
Merete Hauglidirector
16 annual report 2016 - statement of cash flow - farstad shipping asa
S TAT E M E N T O F C A S H F LO W
Parent Company Farstad Shipping ASA (NOK 1 000) Group
2015 2016 NOTE 2016 2015
Cash flow from operating activity: (856 877) (1 186 733) Profit/(loss) before tax (3 520 459) (2 086 323)
(129 569) (152 251) Interest income/dividend received (29 924) (32 616)
80 787 97 005 Interest costs 517 709 560 935
- Paid taxes (38 271) (42 665)
- (6 011) Loss/(gain) on sales of fixed assets and shares 4 4 446 4 581
10 597 8 859 Ordinary depreciations 16 937 524 897 262
977 333 1 248 613 Impairments 16 2 678 519 1 279 560
1 236 (451) Trade debtors (increase)/decrease 18 179 982 105 014
(47 777) 21 747 Trade creditors increase / (decrease) 38 349 (82 822)
(22 633) 6 047 Difference in pension cost and pension premium paid 4 678 (28 210)
(22 701) 13 545 Unrealised foreign exchange loss / (gain) (287 245) 548 066
50 662 (129 041) Changes in prepayment and accruals (185 003) 137 210
41 059 (78 671) Net cash flow from operating activity A 300 305 1 259 992
Cash flow from investment activity:
- 49 647 Sale of fixed assets (sales price) and shares 16 161 396 93 437
(8 201) (16 175)Investment in fixed assets and contracts newbuildings 15 16 (272 796) (1 834 882)
305 998 7 102 Payment received on share capital reduction - -
(755 299) (173 068) New long-term receivables - -
9 582 67 359 Payments on long-term receivables - -
69 381 70 358 Interest income 28 358 28 506
60 188 81 893 Dividend received/group contribution 1 566 4 110
- - Other investments 62 454 15 700
(318 351) 87 116 Net cash flow from investment activity B (19 022) (1 693 129)
Cash flow from finance activity:
- - New long-term debt 9 19 583 2 181 100
- - Repayment of debt 9 (554 814) (1 629 885)
(117 000) - Dividend paid 13 27 - (117 000)
(80 787) (97 005) Interest costs (517 709) (560 935)
(197 787) (97 005) Net cash flow from finance activity C (1 052 940) (126 720)
(475 079) (88 560)Net changes in cash and cash equivalents over the year A+B+C (771 657) (559 857)
- - Net currency exchange differences subsidiaries (48 225) 17 400
598 748 123 668 Cash and cash equivalents at 01.01 1 578 619 2 121 076
123 668 35 108 Cash and cash equivalents at 31.12 17 758 737 1 578 619
17annual report 2016 - statement of changes in equity - farstad shipping asa
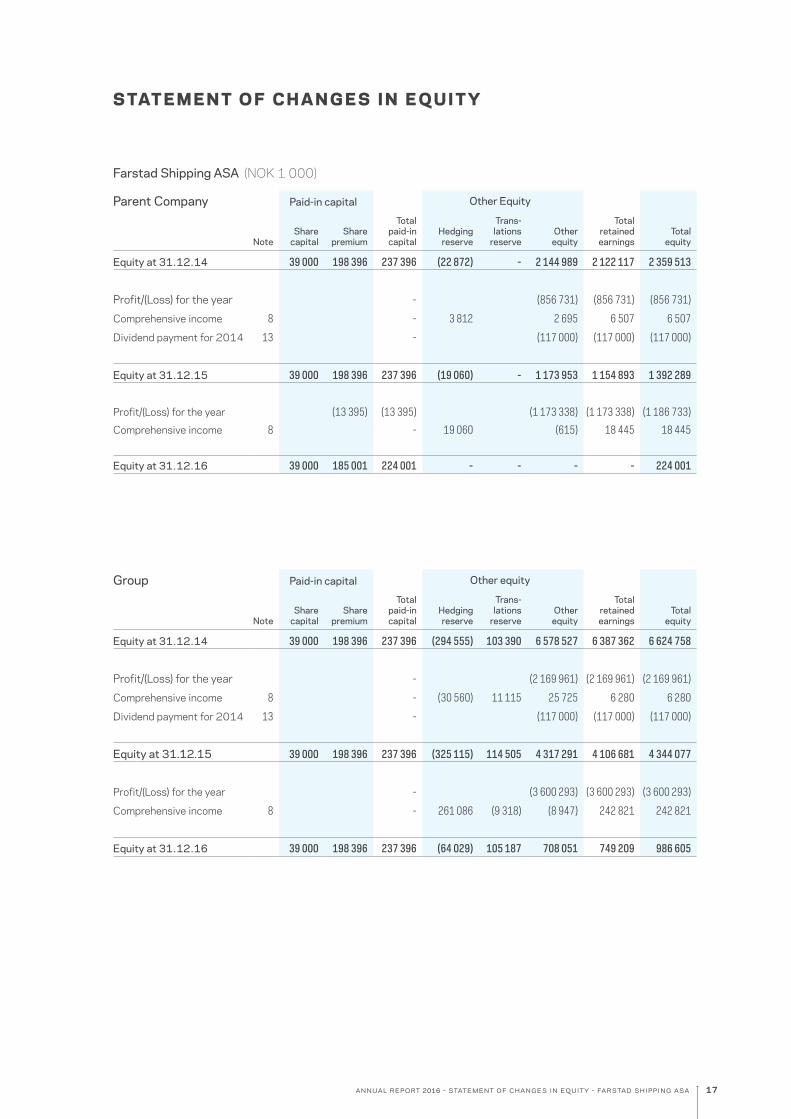
S TAT E M E N T O F C H A N G E S I N E Q U I T Y
Farstad Shipping ASA (NOK 1 000)
Parent Company Paid-in capital Other Equity
NoteShare
capitalShare
premium
Total paid-in capital
Hedging reserve
Trans-lations
reserveOther
equity
Total retained earnings
Total equity
Equity at 31.12.14 39 000 198 396 237 396 (22 872) - 2 144 989 2 122 117 2 359 513
Profit/(Loss) for the year - (856 731) (856 731) (856 731)
Comprehensive income 8 - 3 812 2 695 6 507 6 507
Dividend payment for 2014 13 - (117 000) (117 000) (117 000)
Equity at 31.12.15 39 000 198 396 237 396 (19 060) - 1 173 953 1 154 893 1 392 289
Profit/(Loss) for the year (13 395) (13 395) (1 173 338) (1 173 338) (1 186 733)
Comprehensive income 8 - 19 060 (615) 18 445 18 445
Equity at 31.12.16 39 000 185 001 224 001 - - - - 224 001
Group Paid-in capital Other equity
NoteShare
capitalShare
premium
Total paid-in capital
Hedging reserve
Trans- lations
reserveOther
equity
Total retained earnings
Total equity
Equity at 31.12.14 39 000 198 396 237 396 (294 555) 103 390 6 578 527 6 387 362 6 624 758
Profit/(Loss) for the year - (2 169 961) (2 169 961) (2 169 961)
Comprehensive income 8 - (30 560) 11 115 25 725 6 280 6 280
Dividend payment for 2014 13 - (117 000) (117 000) (117 000)
Equity at 31.12.15 39 000 198 396 237 396 (325 115) 114 505 4 317 291 4 106 681 4 344 077
Profit/(Loss) for the year - (3 600 293) (3 600 293) (3 600 293)
Comprehensive income 8 - 261 086 (9 318) (8 947) 242 821 242 821
Equity at 31.12.16 39 000 198 396 237 396 (64 029) 105 187 708 051 749 209 986 605
18 annual report 2016 - notes - farstad shipping asa
NOTE 1 – ACCOUNTING PRINCIPLES
Farstad Shipping ASA is a public limited company with its head office located at Skansekaia 4A, 6002, Aalesund, Nor-way. The Group operates a shipping business primarily focus-ing on the operation of offshore vessels for the oil industry. The company’s shares are listed on the Oslo Stock Exchange. The annual accounts were approved by the Board of Directors on 31 March 2017. The final annual accounts are approved by the Annual General Meeting. All amounts in the notes are in NOK ‘000s, unless otherwise stated.
The most important accounting principles used in the prepa-ration of the consolidated accounts and parent company ac-counts, Farstad Shipping ASA, are described below:
Basis of preparation of the annual accountsThe consolidated accounts of Farstad Shipping ASA have been prepared in accordance with International Financial Reporting Standards (IFRS) issued by the International Ac-counting Standards Board (IASB) and endorsed by the EU as per 31 December 2016, as well as Norwegian disclosure requirements under the Accounting Act as per 31 December 2016.
The consolidated accounts are based on the principles of historical cost accounting, except for the following account-ing items:- Derivatives (forward exchange contracts and interest rate swaps), marketable securities and bonds are recognised at fair value.- Fixed assets held for sale are measured at fair value.
Changes in accounting policies The accounting policies adopted are consistent with those of the previous financial year. No changes to IFRS effective for 2016 financial statements have been relevant for the Group this year.
Use of estimates – allocations – judgmentManagement has used estimates, judgments and assump-tions that have affected assets, debts, revenues, expenses and information on potential liabilities. Future events may cause the estimates to change. Estimates and underlying assumptions are reviewed on an ongoing basis and are based on best estimates and historical experience. Revisions to ac-counting estimates are recognised in the period the change occurs. If the changes also apply to future periods, the effect is distributed over current and future periods.
Areas where management has used assumptions and esti-
mates that are significant to the consolidated financial state-ments are summarised below:
Vessels – The book values of the Group’s vessels represent approx. 87% of total assets. Judgment and estimates linked to the vessels have a significant impact on the Group’s finan-cial statements. As a result of the significant weakening of the Group’s markets, there are impairment indicators as per 31 December 2016, and thus value estimates from three independent shipbrokers have been obtained and value in use calculations for all of the company’s vessels have been per-formed. Due to reduced liquidity in the market for vessels, there is an increased uncertainty about the estimated ship values in today’s market and greater emphasis has been placed on the value in use calculation than on the broker es-timates when assessing the impairment.
Useful life of vessels – Estimated useful life for vessels is based on strategy, market experience and knowledge of the types of vessel the company owns. The useful life of a vessel is estimated to 20 years. For further information, see note 16.
Residual value by end of useful life - The level of depreciation depends on an estimate of expected residual value of the vessel after 20 years. Assumptions concerning residual value are made based on experience and knowledge of the market for used vessels, where value estimates at the state-ment of financial position day obtained from shipbrokers is one of the criteria.
Capitalisation and depreciation of deferred maintenance - Periodic maintenance is related to major inspections and overhaul costs. Ordinary maintenance cost will not be in-cluded in the capitalisation. Investments made in connection with periodical maintenance are depreciated until the vessel enters into next periodical maintenance. Intervals are calcu-lated on the basis of past experience and best estimates for when next periodical maintenance will be carried out.
Pension liabilities - Determination of the liabilities under de-fined benefit plans is a complex area because it requires estimates for both actuarial and financial assumptions. The commitments are also measured on the basis of current value because the benefit is being paid many years into the future. The Group’s assumptions are based on recommended assumptions from the Norwegian Accounting Foundation for the Norwegian schemes and corresponding recommendations for the scheme in the UK. Calculation of the pension liabilities
N OT E S TO T H E A C C O U N TS ( N O K 1 , 0 0 0 )
19annual report 2016 - notes - farstad shipping asa
are mainly influenced by the prerequisites of discount rate and future wage adjustments. Note 23 presents a sensitiv-ity analysis for changes in assumptions and the impact on pension liability and net pension expenses.
Principles of consolidationThe Group’s consolidated financial statements comprise the parent company Farstad Shipping ASA and entities over which Farstad Shipping ASA has control. An entity has been assessed as being controlled by the Group when the Group is exposed to or have the rights to variable returns from its involvement with the entity, and has the ability to use its power over the entity to affect the amount of the Group’s returns. Thus, the Group controls an entity if and only if the Group has all the following:• power over the entity;• exposure, or rights, to variable returns from its involvement with the entity; and• the ability to use its power over the entity to affect the amount of the Group’s returns.
The subsidiaries are specified in note 17. Different account-ing principles that apply in subsidiaries are adjusted prior to consolidation, such that the consolidated accounts are pre-sented pursuant to uniform principles for all Group compa-nies. Intercompany transactions and balances as well as gains and losses arising from intercompany transactions have been eliminated. The acquisition method is used in accounting for business combinations. New subsidiaries are consolidated from the date control is obtained.
Functional and presentation currencyFunctional currency is determined for each company in the Group, based on the currency of the primary economic envi-ronment in which each company operates. Transactions in foreign currencies are translated into functional currency at the exchange rate at the transaction date. Monetary items denominated in foreign currencies are translated to the func-tional currency at the end of each accounting period. Non-monetary items in foreign currencies that are measured at historical cost are translated into functional currency using the exchange rate at the transaction date. Exchange differ-ences are recognised in profit and loss in the period in which they arise.
The Group’s presentation currency is NOK. This is also the parent company’s and Norwegian subsidiaries’ functional cur-rency. Subsidiaries with other functional currencies are trans-lated at the rate as per 31 December for the statement of financial position items, including goodwill, and at the trans-action exchange rate for income statement items. Average monthly exchange rates are used as an approximation of the transaction exchange rates. The subsidiaries that operate in the UK (GBP), Brazil (BRL), Australia (AUD) and Singapore (AUD) use a functional currency other than NOK.
Exchange differences associated with translation of net in-vestment in foreign operations are classified as translation difference in total comprehensive income. If investments in foreign subsidiaries are sold, the accumulated translation
differences relating to the subsidiary attributable to the eq-uity holders of the parent are recognised in the statement of comprehensive income. If vessels are sold internally in the Group translation difference related to the vessels is trans-ferred to the acquiring company and recognized through the income statement when the vessel is sold to an external party outside the Group.
Operating SegmentSegments are reported in the same manner as internal report-ing to the Group’s highest decision-maker. The Board of Direc-tors are defined as the Group’s highest decision-maker and is responsible for allocation of resources to and consider profitability in the different segments. The Group’s activities are divided based on regions into four different operating segments; North-West Europe, Brazil, Asia Pacific and Other regions. Shared costs are allocated based on vessels opera-tional location throughout the year in relation to the segment’s relative vessel share. In addition to monitoring of the operat-ing segments, the chief operating decision maker also re-ceives reporting at the product level by type of vessel; PSV, AHTS and Subsea. Financial information regarding operating segments and products are presented in Note 3.
Costs and revenue recognitionThe Group’s operational vessels are mainly leased on time charter (T/C) parties and are therefore considered lease agreements. T/C contracts also includes compensation for such as crew hire. Rental incomes for the chartering of ves-sels is accounted for as operating leases and are recognized over the lease term unless the contract regulates different rates for different types of missions. The rental period starts from the time the vessel is made available to the leaser, and terminates on the agreed return of the vessel. Income and costs associated with charter parties are recognised on the basis of the number of days the contract lasts before and after the end of the accounting period. Gain or loss from the sale of vessels are recognised in the profit and loss once de-livery to the new owner has taken place. Interest income is recorded as interest incur. The parent company income con-sists of management fees from other companies in the Group and is recognised as income earned as per agreements be-tween the companies. Cash and cash equivalentsCash includes cash in hand and in bank. Cash equivalents are short-term liquid investments that can be immediately con-verted into a known amount of cash and have a maximum term of maturity of three months.
Sale of vessels Gain or loss from the sale of vessels is presented as a sepa-rate in total operating income as gain/loss on sale of fixed assets, due to the perception that these transactions are part of the regular business operations.
Government grants Government grants from the authorities are not recorded until it is reasonably certain that the Group will meet the con-ditions stipulated in connection with the receipt of the grants
20 annual report 2016 - notes - farstad shipping asa
and that the grants will be received. Government grants are recorded as deductions to the cost that the grants are meant to cover.
GoodwillGoodwill is the difference between the payment transferred at the purchase of a business and net value of the identifiable acquired assets and liabilities at the time of the acquisition. Goodwill is not amortised but is tested annually for impair-ment. Goodwill established in a functional currency different from NOK is converted using the exchange rate at year end. Generally, an impairment will first be allocated to goodwill, then pro-rata to the other assets related to the cash-gener-ating unit. Impairment of goodwill is not reversed.
When assessing the need to impair goodwill, goodwill at the acquisition date is allocated to the actual cash generating unit that benefits from the acquisition. The Group has defined the operating segments of note 3 as cash generating units and has allocated goodwill towards these.
See note 14 for specification of goodwill and impairment tests.
Depreciation of vessels and other fixed assetsThe vessels are decomposed in vessel and deferred mainte-nance. Vessels are included in the consolidated statement of financial position at their acquisition cost with deductions of the year’s and previous years’ ordinary depreciation and im-pairment.
The vessels are depreciated linearly over the defined period of useful life of 20 years, taking into account an estimated residual value of the vessels upon expiry of their useful life period. Residual values are reviewed on an annual basis. These residual values represent the Groups best estimate of net selling price for the vessels at 20 years of age. The de-preciation of vessels in the fleet older than 20 years old are reassessed based on the estimated residual value.
Depreciation for other fixed assets is calculated on a straight-line basis over estimated useful life.
Impairment of fixed assetsThe book values of vessels and other fixed assets are re-viewed for impairment when events or changes in circum-stances indicate the book value may not be recoverable. If any such indicators exist and the book value exceeds the estimated recoverable amount, the assets are impaired to their recoverable amount, which for fixed assets is the great-er of the net selling price and value in use. As an approach to net selling price for the vessels the value estimates obtained from three independent Norwegian shipbrokers are used. The broker’s estimates assume the vessels are without any char-ter contracts, available for immediate sale on the market and there being a willing seller and a willing buyer. Value in use is calculated by discounting future cash flows to the present value at 31 December. Due to increased uncertainty about the value of the vessels in the current market, as per 31 De-cember 2016 greater emphasis has been placed on the
value in use calculation than on the broker estimates as the estimates are not considered reliable to reflect market values in current market situation.
Vessels held for saleVessels are classified as held for sale if their carrying value will be recovered principally through a sale transaction rath-er than through continuing use. This is considered fulfilled only when the sale is highly probable and the vessel is avail-able for immediate sale in its present form. Management must have committed itself to a sale and the sale must be expect-ed within one year from the date of classification.
Vessels held for sale are measured at the lower of their car-rying value and fair value less selling costs.
Maintenance costsOrdinary repairs and maintenance are recognised in the in-come statement as they occur. The cost of dockings, peri-odic maintenance and larger modifications of vessels are capitalised and recognised as expenses on a straight-line basis over the period up to the next planned periodic main-tenance/docking, normally every 30 months. Upon delivery of new vessels, a portion of the cost of the vessel is seper-ated as deferred maintenance. If a vessel is sold, the capital-ised deferred maintenance is included in the gain or loss calculation.
Contracts new buildsPaid instalments for new builds are capitalised as fixed assets as each payment take place. Investments regarding the new vessel that are not included in the contract, such as inspec-tion costs and other related costs during construction are capitalised. Vessels under construction are not depreciated until the asset is taken into use. Paid instalments, inspection costs and a minor portion of the construction contract are financed using own equity. Borrowing costs is capitalized together with the vessel to the extent that they are directly related to the acquisition of the asset.
Pension costs and obligations Group companies have various retirement plans. The Group has both defined benefit and defined contribution plans.
Defined benefit plansDefined benefit plans are valued at the present value of ac-crued future pension benefits at the end of the reporting period. Pension plan assets are valued at their fair value.
As a result of applying IAS 19R, the net interest costs for the period is calculated by using the discount rate for the liabil-ity at the beginning of the period on the net liability. As such the net interest cost consists of interest on the liability and the return on the plan assets, whereas both have been cal-culated by using the discount rate. Changes in net pension liabilities as a result of payments of premiums and pension payments have been taken into consideration. The difference between the actual return and the accounted return is rec-ognised continuously through other comprehensive income.
21annual report 2016 - notes - farstad shipping asa
The current service cost and net interest income/costs are recognised immediately. The service cost for sailors is rec-ognised in the vessel’s crew cost and for office employees in administration cost in the income statement. Net interest income (cost) is classified as financial income (cost). Actu-arial gains and losses, including value changes, both in assets and liabilities are recognised through other comprehensive income. Actuarial gains and losses are not reclassified over the income statement.
The defined benefit obligation is calculated annually by inde-pendent actuaries.
Defined contributions plansThe Group’s defined contribution plan is a retirement plan in which the Group pays fixed contributions to a separate legal entity. For defined contribution plans, the Group contributes to a public or privately managed insurance plan for retirement payment, on a compulsory agreed-upon, or voluntary basis. The Group has no further payment obligations once these contributions have been paid. Contributions are booked as costs on an ongoing basis taking into account up-to-date ac-cruals.
Multi-employer plan (AFP-scheme)The Group companies in Norway participates in the LO/NHO multi-employer defined benefit plan, which means all office employees in Norway can choose to take early retirement from and including the age of 62. The scheme’s retirement benefit obligation and plan asset cannot be reliably measured and allocated at present. For accounting purposes, the scheme is treated as a defined contribution plan, in which premium payments are recognized as incurred and no pension liability is recognised in the financial statements.
For further details see note 23.
Financial instrumentsThe Group classifies its financial assets in the following cat-egories: Financial assets at fair value through income state-ment and loans. The Group classifies its financial liabilities in the following categories: Financial liabilities at fair value through income statement and financial liabilities at amor-tised cost. Classification depends on the purpose of the as-sets or liabilities.
Financial assets stated at amortised cost are impaired when on the basis of objective evidence it is likely the instrument’s cash flows have been negatively affected by one or more events that have occurred after the initial recognition of the instrument. The impairment amount is recognised in the in-come statement.
Hedge accountingThe company to some extent utilises hedge accounting. Hedge accounting is used when a vessel’s income in foreign currency is hedged with foreign exchange contracts adapted to the cash flow. Hedge accounting is also used when interest rate swap agreements are used to hedge interest rates on long-term interest-bearing debt.
Both types of hedging represent cash flow hedging. Hedging instruments that are considered effective are recognised in the statement of financial position at fair value, and changes in fair value are posted to other comprehensive income (OCI). Amounts that are posted to OCI are posted in the period in which the hedged transaction affects the income statement. The ineffective part of the hedging instrument is recognised directly in the income statement.
The Group’s criteria for classifying a derivative or other fi-nancial instrument as a hedging instrument are as follows:1. The hedge is expected to be very effective in that it counteracts changes in the fair value of or cash flows to an identified asset - a hedging efficiency of 80-125% is expected,2. The effectiveness of the hedge can be reliably measured,3. There is adequate documentation when the hedge is entered into that the hedge is effective, among other things,4. For cash-flow hedges, the forthcoming transaction must be highly probable, and the hedge is evaluated regularly and determined actually to have been highly effective throughout the financial reporting periods for which the hedge was designated.
When the hedging transaction is signed the connection be-tween the hedging instruments and the hedged objects, the purpose of the risk management, and the strategy on which the various hedging transactions are based is documented. See also note 8.
Equity and liabilitiesFinancial instruments are classified as liabilities or equity in accordance with the underlying economic realities. Interest, dividend, gains and losses relating to a financial instrument classified as a liability will be presented as an expense or income. Amounts distributed to holders of financial instru-ments that are classified as equity will be recorded directly in statement of changes in equity.
TaxThe Group has tax increasing temporary differences posted in the statement of financial position as a deferred tax liabil-ity. Deferred tax assets are recognised when it is probable that the Group will have a sufficient profit for tax purposes in subsequent periods to utilise the tax asset. Deferred tax and deferred tax assets in various countries is presented as a gross amount in the statement of financial position where they cannot be offset. Deferred tax and deferred tax assets are recognised at their nominal value and classified as long-term liabilities or non-current asset investments in the state-ment of financial position.
Taxes in the income statement represent the payable and withholding tax for the period and changes in deferred tax. Tax on gross income or tax which relates directly to gross income is presented as reduction in income, while other taxes are presented as tax expense. Tonnage tax within the regime is classified as an operating cost and because of the tonnage of Farstad Shipping’s vessels it is insignificant.

22 annual report 2016 - notes - farstad shipping asa
Deferred tax is recognised in the accounts directly against statement of comprehensive income to the extent that it re-lates to items recognised in the statement of comprehensive income.
Some of the vessel owning companies are organised in com-pliance with the tonnage tax regime for shipping companies in Norway, Singapore and United Kingdom.
Please also refer to note 11.
Earnings per shareThe calculation of the earnings per share is based on the ma-jority’s share of the profit of the year with the use of the time weighted average number of outstanding shares throughout the year.
Dividend/distributions from investments in securitiesDividends are recognised when the right to receive the pay-ment is established (Annual General Meeting resolution).
Cash flow statementThe Group uses the indirect method when presenting its cash flow statement. Bank deposits and shares included in current assets evaluate at market value are included in cash and cash equivalents. Received and paid interest are presented respec-tively as investment activity and financing activity.
Group as a lessee - Operating leasesLeases where most of the risk and returns associated with the ownership of the asset have not been transferred to the Group, are classified as operating leases. Lease payments are classified as operating costs and recognised in the income statement in a straight-line during the contract period.
Group as a lessee - Finance leasesFinance leases are leases under which the Group assumes most of the risk and return associated with the ownership of the asset. At the inception of the lease, finance leases are recognised at the lower of their fair value and the present value of the minimum lease payments less accumulated de-preciation and impairment losses. When calculating the pre-sent value of the lease, the implicit interest cost in the lease is used if it is possible to calculate this. If this cannot be calculated, the company’s marginal borrowing rate is used. Direct costs linked to establishing the lease are included in the asset’s acquisition cost.
The same depreciation period as for the company’s other depreciable assets is used. If it is not reasonably certain that the company will assume ownership when the term of the lease expires, the asset is depreciated over the term of the lease or the asset’s economic life, whichever is the shorter.
Contingent liabilities and assetsContingent liabilities are not recognised in the annual ac-counts. Significant contingent liabilities are disclosed, with the exception of contingent liabilities that are unlikely to incur.
Contingent assets are not recognised in the annual accounts but are disclosed if there is a certain probability that a ben-efit will be added to the Group.
Changes in standards and interpretations with future effective dateThe standards and interpretations adopted up to the date these consolidated financial statements were prepared, but where the effective date is in the future, are specified below. The Group’s intention is to implement the relevant changes on the effective date, provided that the EU approves the changes before the preparation of these consolidated finan-cial statements.
IFRS 9 Financial Instruments - In July 2014, the IASB issued the final version of IFRS 9 Financial Instruments. IFRS 9 in-volves changes relating to classification and measurement, hedge accounting and impairment. IFRS 9 will replace IAS 39 Financial Instruments - Recognition and Measurement. IFRS 9 is effective for annual periods beginning on or after 1 January 2018, with early application permitted. Except for hedge accounting, retrospective application is required but providing comparative information is not compulsory. For hedge accounting, the requirements are generally applied pro-spectively, with some limited exceptions.The Group has no plans for early implementation of the standard. No assessment has been carried out of the effects IFRS 9 will have on the consolidated financial statements in the implementation, but the work on this evaluation is scheduled for 2017.
IFRS 15 Revenue from contracts with customers - IFRS 15 was issued in May 2014 and establishes a five-step model to account for revenue arising from contracts with customers. Under IFRS 15, revenue is recognised at an amount that re-flects the consideration to which an entity expects to be entitled in exchange for transferring goods or services to a customer. The new revenue standard will supersede all cur-rent revenue recognition requirements under IFRS. Either afull retrospective application or a modified retrospective ap-plication is required for annual periods beginning on or after 1 January 2018. The Group mainly has revenues from time charters or T/C contracts. Such contracts initially contain both a lease and a service agreement. Both of these items are recorded normally during the contract period, so it has less impact on the service element separated and accounted for separately. IFRS 15 will only regulate the service element, since the lease is regulated by IAS 17 Leases (IFRS 16 Leas-ing when the new standard comes). Limited effects are ex-pected from the introduction of IFRS 15 for the Group.
IFRS 16 Leasing – IFRS 16 was issued in January 2016 and it replaces IAS 17 Leases, IFRIC 4 Determining whether an Arrangement contains a Lease, SIC-15 Operating Leases-Incentives and SIC-27 Evaluating the Substance of Transac-tions Involving the Legal Form of a Lease. IFRS 16 sets out the principles for the recognition, measurement, presentation and disclosure of leases and requires lessees to account for all leases under a single on-balance sheet model similar to
23annual report 2016 - notes - farstad shipping asa
Cont. next page
NOTE 3 – SEGMENT INFORMATION
Exchange rates used in the annual report:
Exchange rates 01.01.2016
Average exchange 2016
Exchange rates 31.12.2016
USD - American dollar 8,8090 8,3995 8,6200 GBP - British pound 13,0720 11,2971 10,6130 AUD - Australian dollar 6,4471 6,2376 6,2252 BRL - Brazilian real 2,2559 2,4476 2,6449 EUR - European euro 9,6190 9,2626 9,0863
Investments in foreign subsidiaries are translated using the exchange rate as of 31 December for the statement of finan-cial positition while monthly average exchange rates are used for the income statement. Exchange rate differences that arise as a result of this amounted to an disagio of NOK 9,318 (agio NOK 11,115 in 2015).
NOTE 2 - CONVERSION TO PRESENTATION CURRENCY
OPERATING SEGMENT The Group’s activities are divided in four segments based on region; North-West Europe, Brazil, Asia Pacific and Other regions. In addition to regions, the Group has internal reporting based on the fol-lowing products: Platform Supply Vessel services (PSV), Anchor-Handling Tug Supply vessel services (AHTS) and Sub-sea services (Subsea). Both segment based on region and product are used by management to allocate resources and to assess the performance of the opera-ting segments. The parent company has one segment consisting of fee from companies within the group and administration costs. A detailed accounting overview is provi-ded below for the various segments.
Income and costs are allocated to the sector where the vessel has been opera-ting. The distribution of costs, revenues and statement of financial position values across the various sectors involves a cer-tain degree of judgment and do not re-present a good enough basis for compre-hensively assessing the profitability of each area. Other factors that have to be taken into account are the markets’ vary-ing needs and requirements vis-à-vis tonnage, the vessels’ varying financial lifetimes in the various markets, the age of tonnage, time of investment, future contract coverage, operating risk, tax regulations, need for local partners and varying administrative/market related follow-up of the individual vessels.
Income is from external customers only. There are no internal transactions posted between areas of operations. In 2016 freight income from the compa-ny’s largest customer, Petrobras in Brazil, amounted to NOK 881.9 million (NOK 1,169.6 million in 2015). This is appro-ximately 32.8% (29.1% in 2015) of total freight income. Income from the second largest customer, Inpex Operati-ons Australia Pty Ltd, was NOK 382.8 million (NOK 583.7 million in 2015). This is approximately 14.2% of total freight income.
the accounting for finance leases under IAS 17. At the com-mencement date of a lease, a lessee will recognise a liability to make lease payments (i.e., the lease liability) and an asset representing the right to use the underlying asset during the lease term (i.e., the right-of-use asset). Lessees will be re-quired to separately recognise the interest expense on the lease liability and the depreciation expense on the right-of-use asset. Lessees will also be required to re-measure the lease liability upon the occurrence of certain events (e.g., a change in the lease term, a change in future lease payments resulting from a change in an index or rate used to determine those payments). The lessee will generally recognise the amount of the remeasurement of the lease liability as an ad-justment to the right-of-use asset. IFRS 16 is effective for annual periods beginning on or after 1 January 2019. Early application is permitted, but not before an entity applies IFRS 15. A lessee can choose to apply the standard using either a full retrospective or a modified retrospective approach. The standard’s transition provisions permit certain reliefs. The Group has no plans for early implementation of the standard.
No assessment has been carried out of the effects IFRS 16 will have on the consolidated financial statements in the im-plementation, but the work on this evaluation is scheduled for 2017.
Other changes in standards and interpretations with future effective date are not considered to have any significant effect on the Group.
Events after the reporting periodNew information on the company’s positions at the statement of financial position sheet date is taken into account in the annual financial statements. Events after the statement of financial position sheet date that do not affect the company’s position at the statement of financial position sheet date, but which will affect the company’s position in the future, are stated if significant.
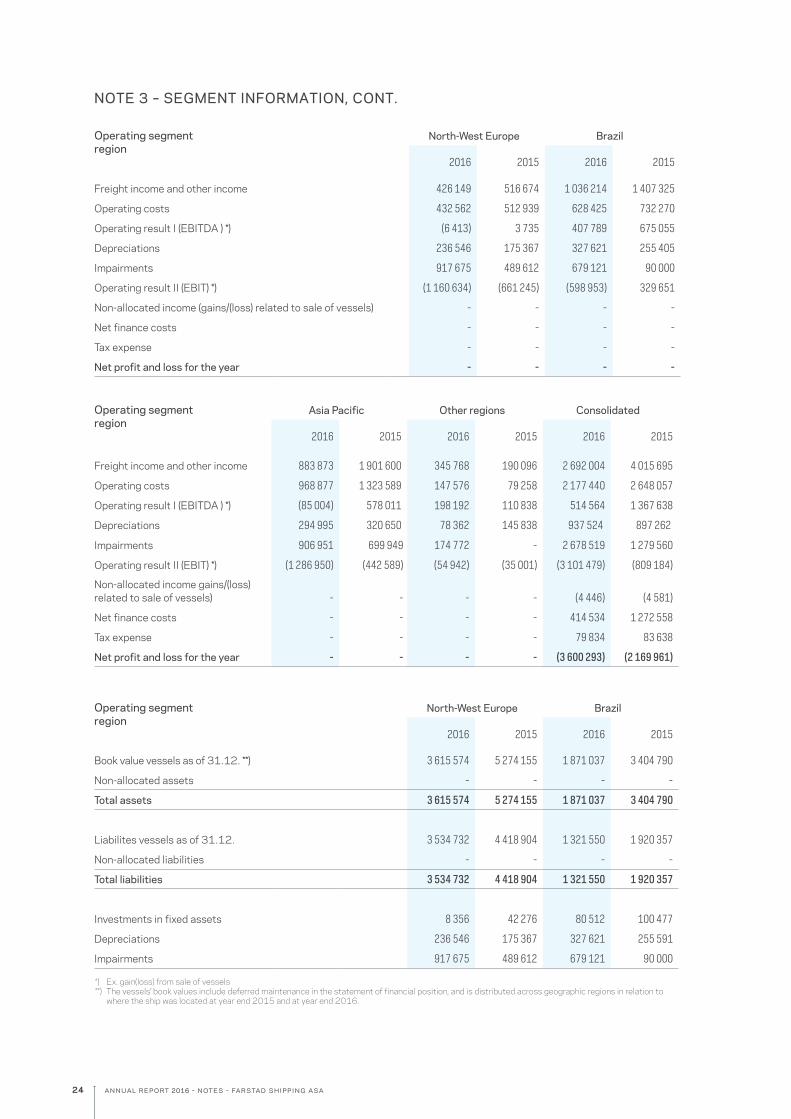
24 annual report 2016 - notes - farstad shipping asa
NOTE 3 – SEGMENT INFORMATION, CONT.
Operating segment region
North-West Europe Brazil
2016 2015 2016 2015
Book value vessels as of 31.12. **) 3 615 574 5 274 155 1 871 037 3 404 790
Non-allocated assets - - - -
Total assets 3 615 574 5 274 155 1 871 037 3 404 790
Liabilites vessels as of 31.12. 3 534 732 4 418 904 1 321 550 1 920 357
Non-allocated liabilities - - - -
Total liabilities 3 534 732 4 418 904 1 321 550 1 920 357
Investments in fixed assets 8 356 42 276 80 512 100 477
Depreciations 236 546 175 367 327 621 255 591
Impairments 917 675 489 612 679 121 90 000
Operating segment region
North-West Europe Brazil
2016 2015 2016 2015
Freight income and other income 426 149 516 674 1 036 214 1 407 325
Operating costs 432 562 512 939 628 425 732 270
Operating result I (EBITDA ) *) (6 413) 3 735 407 789 675 055
Depreciations 236 546 175 367 327 621 255 405
Impairments 917 675 489 612 679 121 90 000
Operating result II (EBIT) *) (1 160 634) (661 245) (598 953) 329 651
Non-allocated income (gains/(loss) related to sale of vessels) - - - -
Net finance costs - - - -
Tax expense - - - -
Net profit and loss for the year - - - -
Operating segment region
Asia Pacific Other regions Consolidated
2016 2015 2016 2015 2016 2015
Freight income and other income 883 873 1 901 600 345 768 190 096 2 692 004 4 015 695
Operating costs 968 877 1 323 589 147 576 79 258 2 177 440 2 648 057
Operating result I (EBITDA ) *) (85 004) 578 011 198 192 110 838 514 564 1 367 638
Depreciations 294 995 320 650 78 362 145 838 937 524 897 262
Impairments 906 951 699 949 174 772 - 2 678 519 1 279 560
Operating result II (EBIT) *) (1 286 950) (442 589) (54 942) (35 001) (3 101 479) (809 184)
Non-allocated income gains/(loss) related to sale of vessels) - - - - (4 446) (4 581)
Net finance costs - - - - 414 534 1 272 558
Tax expense - - - - 79 834 83 638
Net profit and loss for the year - - - - (3 600 293) (2 169 961)
*) Ex. gain(loss) from sale of vessels**) The vessels’ book values include deferred maintenance in the statement of financial position, and is distributed across geographic regions in relation to
where the ship was located at year end 2015 and at year end 2016.
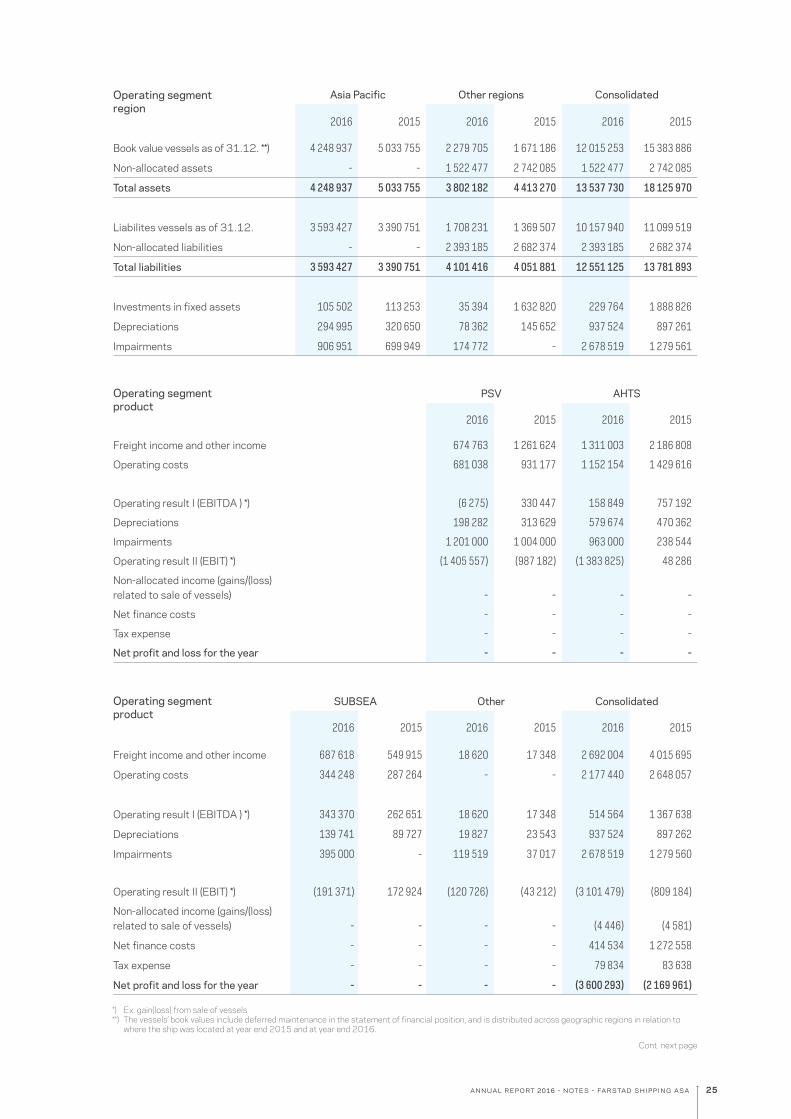
25annual report 2016 - notes - farstad shipping asa
Cont. next page
Operating segment product
PSV AHTS
2016 2015 2016 2015
Freight income and other income 674 763 1 261 624 1 311 003 2 186 808
Operating costs 681 038 931 177 1 152 154 1 429 616
Operating result I (EBITDA ) *) (6 275) 330 447 158 849 757 192
Depreciations 198 282 313 629 579 674 470 362
Impairments 1 201 000 1 004 000 963 000 238 544
Operating result II (EBIT) *) (1 405 557) (987 182) (1 383 825) 48 286
Non-allocated income (gains/(loss) related to sale of vessels) - - - -
Net finance costs - - - -
Tax expense - - - -
Net profit and loss for the year - - - -
Operating segment region
Asia Pacific Other regions Consolidated
2016 2015 2016 2015 2016 2015
Book value vessels as of 31.12. **) 4 248 937 5 033 755 2 279 705 1 671 186 12 015 253 15 383 886
Non-allocated assets - - 1 522 477 2 742 085 1 522 477 2 742 085
Total assets 4 248 937 5 033 755 3 802 182 4 413 270 13 537 730 18 125 970
Liabilites vessels as of 31.12. 3 593 427 3 390 751 1 708 231 1 369 507 10 157 940 11 099 519
Non-allocated liabilities - - 2 393 185 2 682 374 2 393 185 2 682 374
Total liabilities 3 593 427 3 390 751 4 101 416 4 051 881 12 551 125 13 781 893
Investments in fixed assets 105 502 113 253 35 394 1 632 820 229 764 1 888 826
Depreciations 294 995 320 650 78 362 145 652 937 524 897 261
Impairments 906 951 699 949 174 772 - 2 678 519 1 279 561
Operating segment product
SUBSEA Other Consolidated
2016 2015 2016 2015 2016 2015
Freight income and other income 687 618 549 915 18 620 17 348 2 692 004 4 015 695
Operating costs 344 248 287 264 - - 2 177 440 2 648 057
Operating result I (EBITDA ) *) 343 370 262 651 18 620 17 348 514 564 1 367 638
Depreciations 139 741 89 727 19 827 23 543 937 524 897 262
Impairments 395 000 - 119 519 37 017 2 678 519 1 279 560
Operating result II (EBIT) *) (191 371) 172 924 (120 726) (43 212) (3 101 479) (809 184)
Non-allocated income (gains/(loss) related to sale of vessels) - - - - (4 446) (4 581)
Net finance costs - - - - 414 534 1 272 558
Tax expense - - - - 79 834 83 638
Net profit and loss for the year - - - - (3 600 293) (2 169 961)
*) Ex. gain(loss) from sale of vessels**) The vessels’ book values include deferred maintenance in the statement of financial position, and is distributed across geographic regions in relation to
where the ship was located at year end 2015 and at year end 2016.
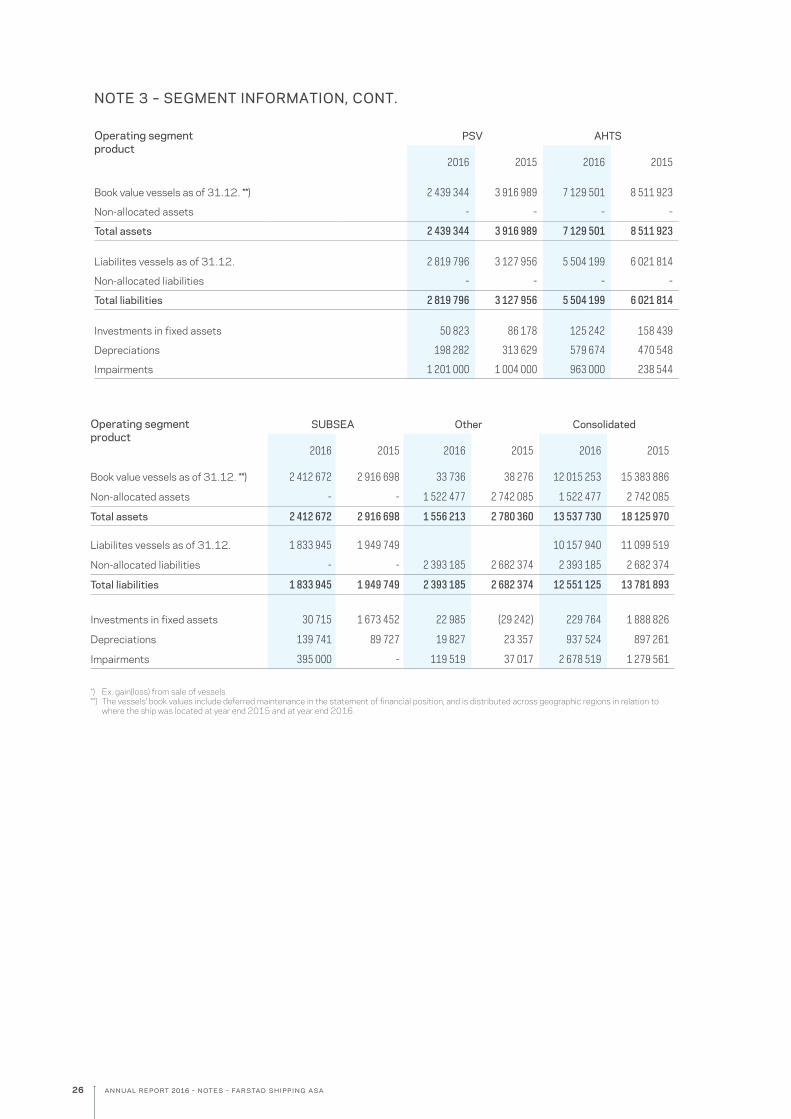
26 annual report 2016 - notes - farstad shipping asa
Operating segmentproduct
PSV AHTS
2016 2015 2016 2015
Book value vessels as of 31.12. **) 2 439 344 3 916 989 7 129 501 8 511 923
Non-allocated assets - - - -
Total assets 2 439 344 3 916 989 7 129 501 8 511 923
Liabilites vessels as of 31.12. 2 819 796 3 127 956 5 504 199 6 021 814
Non-allocated liabilities - - - -
Total liabilities 2 819 796 3 127 956 5 504 199 6 021 814
Investments in fixed assets 50 823 86 178 125 242 158 439
Depreciations 198 282 313 629 579 674 470 548
Impairments 1 201 000 1 004 000 963 000 238 544
Operating segmentproduct
SUBSEA Other Consolidated
2016 2015 2016 2015 2016 2015
Book value vessels as of 31.12. **) 2 412 672 2 916 698 33 736 38 276 12 015 253 15 383 886
Non-allocated assets - - 1 522 477 2 742 085 1 522 477 2 742 085
Total assets 2 412 672 2 916 698 1 556 213 2 780 360 13 537 730 18 125 970
Liabilites vessels as of 31.12. 1 833 945 1 949 749 10 157 940 11 099 519
Non-allocated liabilities - - 2 393 185 2 682 374 2 393 185 2 682 374
Total liabilities 1 833 945 1 949 749 2 393 185 2 682 374 12 551 125 13 781 893
Investments in fixed assets 30 715 1 673 452 22 985 (29 242) 229 764 1 888 826
Depreciations 139 741 89 727 19 827 23 357 937 524 897 261
Impairments 395 000 - 119 519 37 017 2 678 519 1 279 561
*) Ex. gain(loss) from sale of vessels**) The vessels’ book values include deferred maintenance in the statement of financial position, and is distributed across geographic regions in relation to
where the ship was located at year end 2015 and at year end 2016.
NOTE 3 – SEGMENT INFORMATION, CONT.
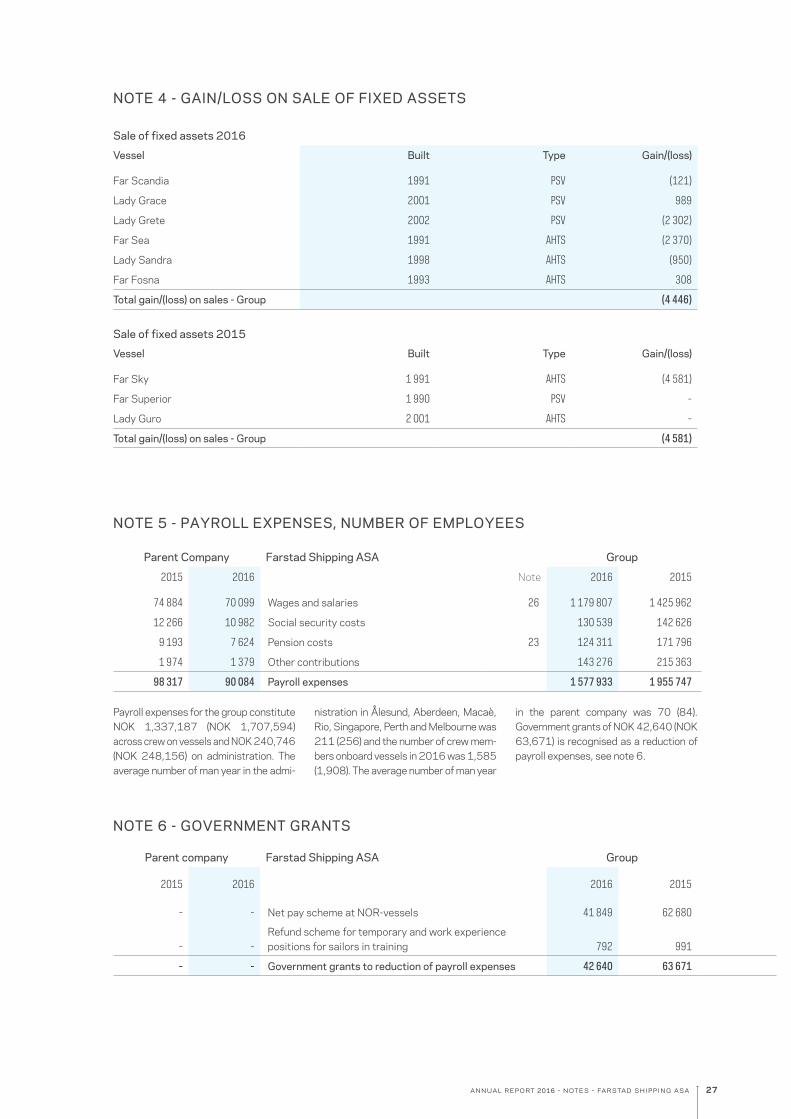
27annual report 2016 - notes - farstad shipping asa
NOTE 4 - GAIN/LOSS ON SALE OF FIXED ASSETS Sale of fixed assets 2016
Vessel Built Type Gain/(loss)
Far Scandia 1991 PSV (121)
Lady Grace 2001 PSV 989
Lady Grete 2002 PSV (2 302)
Far Sea 1991 AHTS (2 370)
Lady Sandra 1998 AHTS (950)
Far Fosna 1993 AHTS 308
Total gain/(loss) on sales - Group (4 446)
Sale of fixed assets 2015
Vessel Built Type Gain/(loss)
Far Sky 1 991 AHTS (4 581)
Far Superior 1 990 PSV -
Lady Guro 2 001 AHTS -
Total gain/(loss) on sales - Group (4 581)
NOTE 5 - PAYROLL EXPENSES, NUMBER OF EMPLOYEES
Parent Company Farstad Shipping ASA Group
2015 2016 Note 2016 2015
74 884 70 099 Wages and salaries 26 1 179 807 1 425 962
12 266 10 982 Social security costs 130 539 142 626
9 193 7 624 Pension costs 23 124 311 171 796
1 974 1 379 Other contributions 143 276 215 363
98 317 90 084 Payroll expenses 1 577 933 1 955 747
Payroll expenses for the group constitute NOK 1,337,187 (NOK 1,707,594) across crew on vessels and NOK 240,746 (NOK 248,156) on administration. The average number of man year in the admi-
nistration in Ålesund, Aberdeen, Macaè, Rio, Singapore, Perth and Melbourne was 211 (256) and the number of crew mem-bers onboard vessels in 2016 was 1,585 (1,908). The average number of man year
in the parent company was 70 (84). Government grants of NOK 42,640 (NOK 63,671) is recognised as a reduction of payroll expenses, see note 6.
NOTE 6 - GOVERNMENT GRANTS
Parent company Farstad Shipping ASA Group
2015 2016 2016 2015
- - Net pay scheme at NOR-vessels 41 849 62 680
- - Refund scheme for temporary and work experience positions for sailors in training 792 991
- - Government grants to reduction of payroll expenses 42 640 63 671
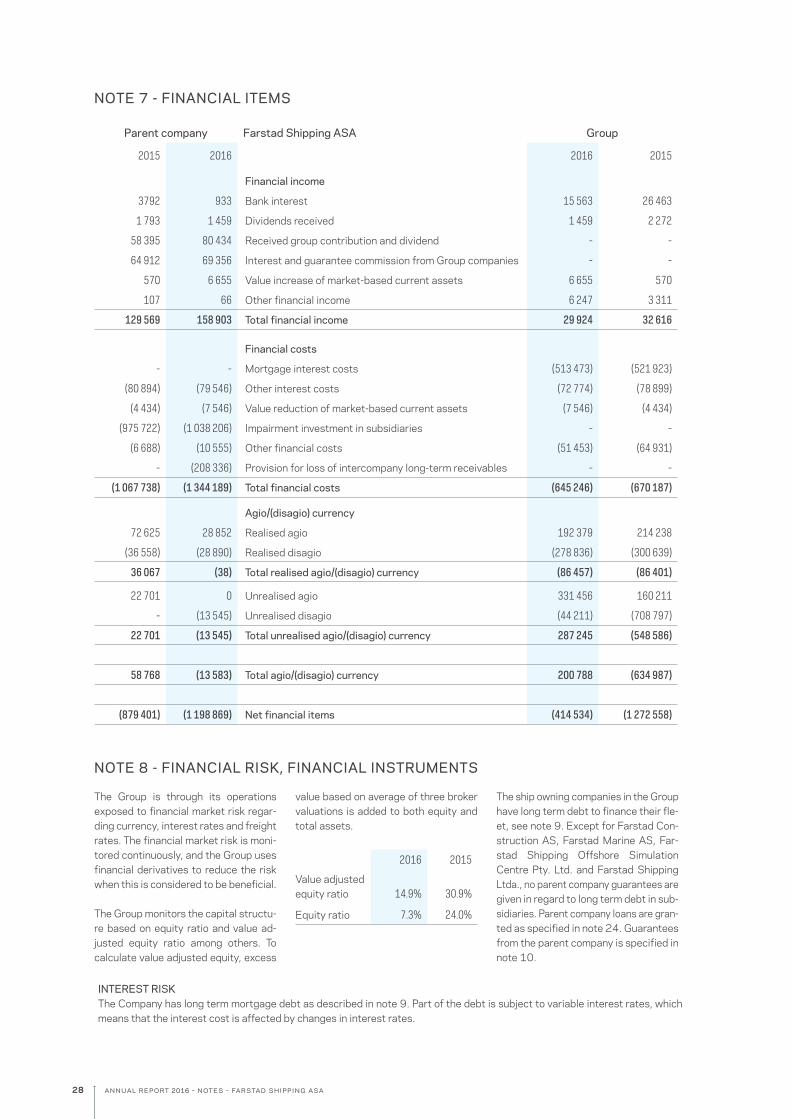
28 annual report 2016 - notes - farstad shipping asa
NOTE 7 - FINANCIAL ITEMS
Parent company Farstad Shipping ASA Group
2015 2016 2016 2015
Financial income
3792 933 Bank interest 15 563 26 463
1 793 1 459 Dividends received 1 459 2 272
58 395 80 434 Received group contribution and dividend - -
64 912 69 356 Interest and guarantee commission from Group companies - -
570 6 655 Value increase of market-based current assets 6 655 570
107 66 Other financial income 6 247 3 311
129 569 158 903 Total financial income 29 924 32 616
Financial costs
- - Mortgage interest costs (513 473) (521 923)
(80 894) (79 546) Other interest costs (72 774) (78 899)
(4 434) (7 546) Value reduction of market-based current assets (7 546) (4 434)
(975 722) (1 038 206) Impairment investment in subsidiaries - -
(6 688) (10 555) Other financial costs (51 453) (64 931)
- (208 336) Provision for loss of intercompany long-term receivables - -
(1 067 738) (1 344 189) Total financial costs (645 246) (670 187)
Agio/(disagio) currency
72 625 28 852 Realised agio 192 379 214 238
(36 558) (28 890) Realised disagio (278 836) (300 639)
36 067 (38) Total realised agio/(disagio) currency (86 457) (86 401)
22 701 0 Unrealised agio 331 456 160 211
- (13 545) Unrealised disagio (44 211) (708 797)
22 701 (13 545) Total unrealised agio/(disagio) currency 287 245 (548 586)
58 768 (13 583) Total agio/(disagio) currency 200 788 (634 987)
(879 401) (1 198 869) Net financial items (414 534) (1 272 558)
NOTE 8 - FINANCIAL RISK, FINANCIAL INSTRUMENTS
The Group is through its operations exposed to financial market risk regar-ding currency, interest rates and freight rates. The financial market risk is moni-tored continuously, and the Group uses financial derivatives to reduce the risk when this is considered to be beneficial.
The Group monitors the capital structu-re based on equity ratio and value ad-justed equity ratio among others. To calculate value adjusted equity, excess
value based on average of three broker valuations is added to both equity and total assets.
2016 2015
Value adjusted equity ratio 14.9% 30.9%
Equity ratio 7.3% 24.0%
The ship owning companies in the Group have long term debt to finance their fle-et, see note 9. Except for Farstad Con-struction AS, Farstad Marine AS, Far-stad Shipping Offshore Simulation Centre Pty. Ltd. and Farstad Shipping Ltda., no parent company guarantees are given in regard to long term debt in sub-sidiaries. Parent company loans are gran-ted as specified in note 24. Guarantees from the parent company is specified in note 10.
INTEREST RISKThe Company has long term mortgage debt as described in note 9. Part of the debt is subject to variable interest rates, which means that the interest cost is affected by changes in interest rates.
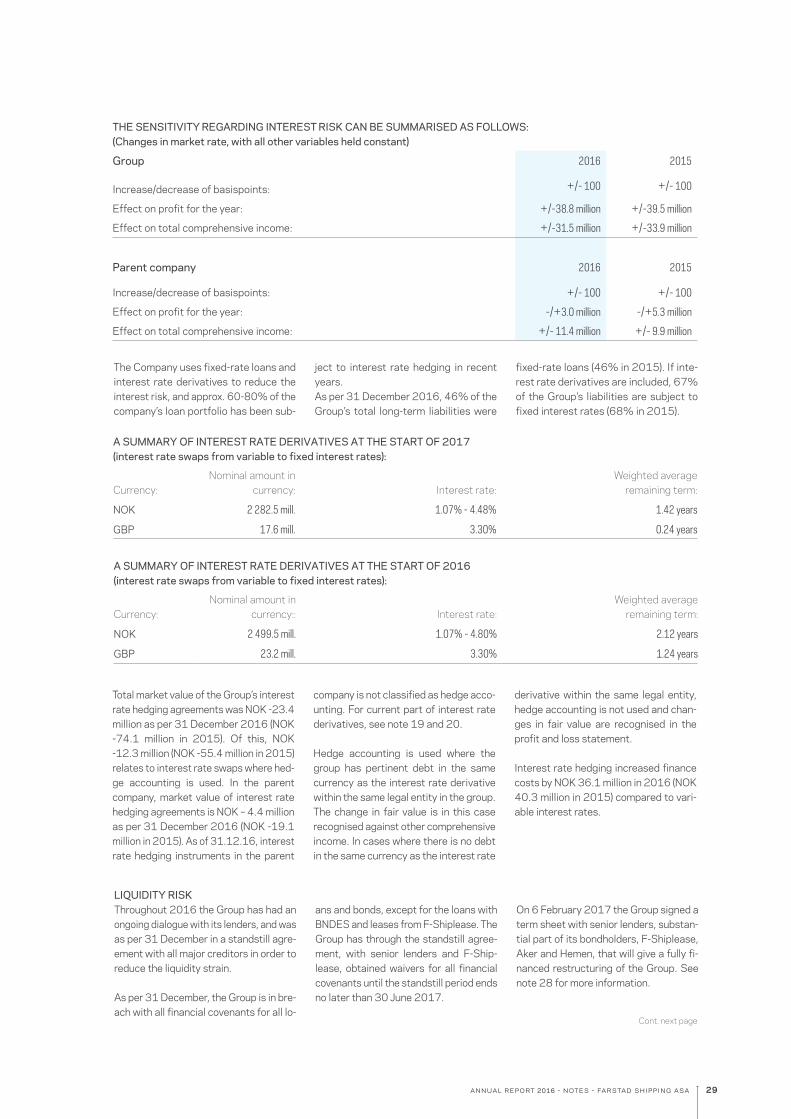
29annual report 2016 - notes - farstad shipping asa
Cont. next page
The Company uses fixed-rate loans and interest rate derivatives to reduce the interest risk, and approx. 60-80% of the company’s loan portfolio has been sub-
ject to interest rate hedging in recent years. As per 31 December 2016, 46% of the Group’s total long-term liabilities were
fixed-rate loans (46% in 2015). If inte-rest rate derivatives are included, 67% of the Group’s liabilities are subject to fixed interest rates (68% in 2015).
THE SENSITIVITY REGARDING INTEREST RISK CAN BE SUMMARISED AS FOLLOWS: (Changes in market rate, with all other variables held constant)
Group 2016 2015
Increase/decrease of basispoints: +/- 100 +/- 100
Effect on profit for the year: +/-38.8 million +/-39.5 million
Effect on total comprehensive income: +/-31.5 million +/-33.9 million
Parent company 2016 2015
Increase/decrease of basispoints: +/- 100 +/- 100
Effect on profit for the year: -/+3.0 million -/+5.3 million
Effect on total comprehensive income: +/- 11.4 million +/- 9.9 million
A SUMMARY OF INTEREST RATE DERIVATIVES AT THE START OF 2017 (interest rate swaps from variable to fixed interest rates):
Currency:Nominal amount in
currency: Interest rate:Weighted average
remaining term:
NOK 2 282.5 mill. 1.07% - 4.48% 1.42 years
GBP 17.6 mill. 3.30% 0.24 years
A SUMMARY OF INTEREST RATE DERIVATIVES AT THE START OF 2016 (interest rate swaps from variable to fixed interest rates):
Currency:Nominal amount in
currency:: Interest rate:Weighted average
remaining term:
NOK 2 499.5 mill. 1.07% - 4.80% 2.12 years
GBP 23.2 mill. 3.30% 1.24 years
LIQUIDITY RISKThroughout 2016 the Group has had an ongoing dialogue with its lenders, and was as per 31 December in a standstill agre-ement with all major creditors in order to reduce the liquidity strain.
As per 31 December, the Group is in bre-ach with all financial covenants for all lo-
ans and bonds, except for the loans with BNDES and leases from F-Shiplease. The Group has through the standstill agree-ment, with senior lenders and F-Ship- lease, obtained waivers for all financial covenants until the standstill period ends no later than 30 June 2017.
On 6 February 2017 the Group signed a term sheet with senior lenders, substan-tial part of its bondholders, F-Shiplease, Aker and Hemen, that will give a fully fi-nanced restructuring of the Group. See note 28 for more information.
Total market value of the Group’s interest rate hedging agreements was NOK -23.4 million as per 31 December 2016 (NOK -74.1 million in 2015). Of this, NOK -12.3 million (NOK -55.4 million in 2015) relates to interest rate swaps where hed-ge accounting is used. In the parent company, market value of interest rate hedging agreements is NOK – 4.4 million as per 31 December 2016 (NOK -19.1 million in 2015). As of 31.12.16, interest rate hedging instruments in the parent
company is not classified as hedge acco-unting. For current part of interest rate derivatives, see note 19 and 20.
Hedge accounting is used where the group has pertinent debt in the same currency as the interest rate derivative within the same legal entity in the group. The change in fair value is in this case recognised against other comprehensive income. In cases where there is no debt in the same currency as the interest rate
derivative within the same legal entity, hedge accounting is not used and chan-ges in fair value are recognised in the profit and loss statement.
Interest rate hedging increased finance costs by NOK 36.1 million in 2016 (NOK 40.3 million in 2015) compared to vari-able interest rates.
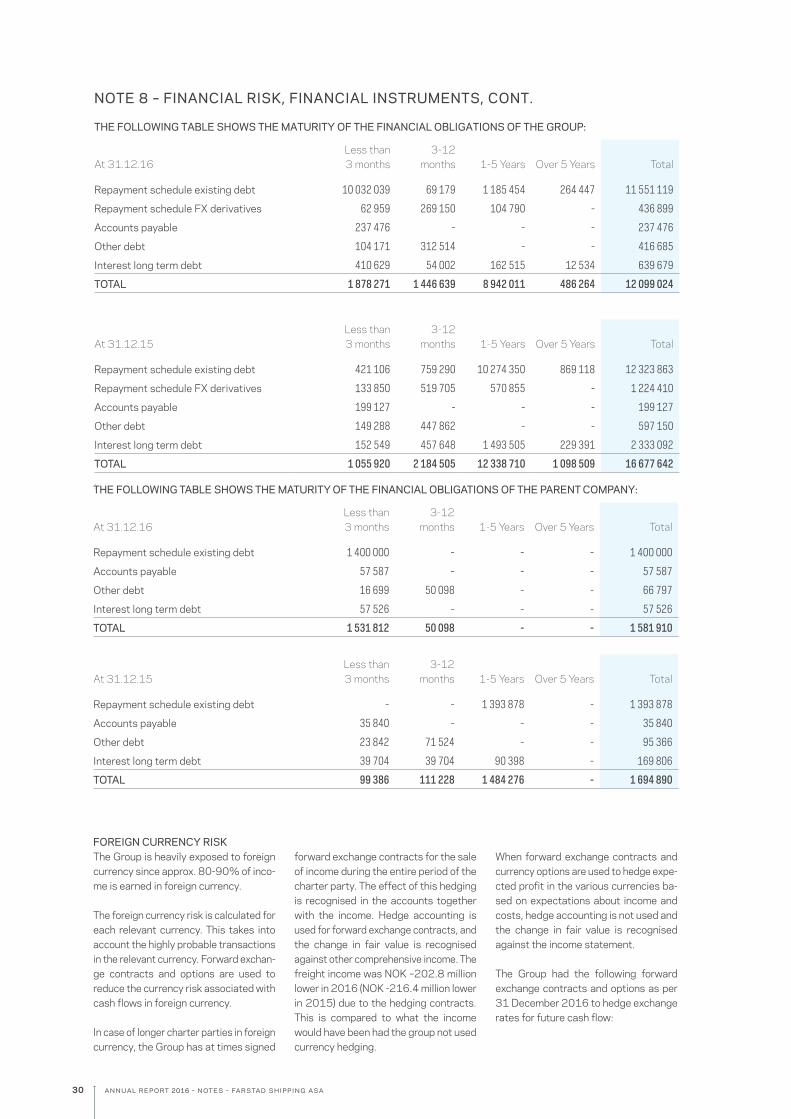
30 annual report 2016 - notes - farstad shipping asa
NOTE 8 – FINANCIAL RISK, FINANCIAL INSTRUMENTS, CONT.
THE FOLLOWING TABLE SHOWS THE MATURITY OF THE FINANCIAL OBLIGATIONS OF THE GROUP:
At 31.12.16Less than 3 months
3-12 months 1-5 Years Over 5 Years Total
Repayment schedule existing debt 10 032 039 69 179 1 185 454 264 447 11 551 119
Repayment schedule FX derivatives 62 959 269 150 104 790 - 436 899
Accounts payable 237 476 - - - 237 476
Other debt 104 171 312 514 - - 416 685
Interest long term debt 410 629 54 002 162 515 12 534 639 679
TOTAL 1 878 271 1 446 639 8 942 011 486 264 12 099 024
THE FOLLOWING TABLE SHOWS THE MATURITY OF THE FINANCIAL OBLIGATIONS OF THE PARENT COMPANY:
At 31.12.16Less than 3 months
3-12 months 1-5 Years Over 5 Years Total
Repayment schedule existing debt 1 400 000 - - - 1 400 000
Accounts payable 57 587 - - - 57 587
Other debt 16 699 50 098 - - 66 797
Interest long term debt 57 526 - - - 57 526
TOTAL 1 531 812 50 098 - - 1 581 910
At 31.12.15Less than 3 months
3-12 months 1-5 Years Over 5 Years Total
Repayment schedule existing debt 421 106 759 290 10 274 350 869 118 12 323 863
Repayment schedule FX derivatives 133 850 519 705 570 855 - 1 224 410
Accounts payable 199 127 - - - 199 127
Other debt 149 288 447 862 - - 597 150
Interest long term debt 152 549 457 648 1 493 505 229 391 2 333 092
TOTAL 1 055 920 2 184 505 12 338 710 1 098 509 16 677 642
:
At 31.12.15Less than 3 months
3-12 months 1-5 Years Over 5 Years Total
Repayment schedule existing debt - - 1 393 878 - 1 393 878
Accounts payable 35 840 - - - 35 840
Other debt 23 842 71 524 - - 95 366
Interest long term debt 39 704 39 704 90 398 - 169 806
TOTAL 99 386 111 228 1 484 276 - 1 694 890
FOREIGN CURRENCY RISKThe Group is heavily exposed to foreign currency since approx. 80-90% of inco-me is earned in foreign currency.
The foreign currency risk is calculated for each relevant currency. This takes into account the highly probable transactions in the relevant currency. Forward exchan-ge contracts and options are used to reduce the currency risk associated with cash flows in foreign currency.
In case of longer charter parties in foreign currency, the Group has at times signed
forward exchange contracts for the sale of income during the entire period of the charter party. The effect of this hedging is recognised in the accounts together with the income. Hedge accounting is used for forward exchange contracts, and the change in fair value is recognised against other comprehensive income. The freight income was NOK –202.8 million lower in 2016 (NOK -216.4 million lower in 2015) due to the hedging contracts. This is compared to what the income would have been had the group not used currency hedging.
When forward exchange contracts and currency options are used to hedge expe-cted profit in the various currencies ba-sed on expectations about income and costs, hedge accounting is not used and the change in fair value is recognised against the income statement.
The Group had the following forward exchange contracts and options as per 31 December 2016 to hedge exchange rates for future cash flow:
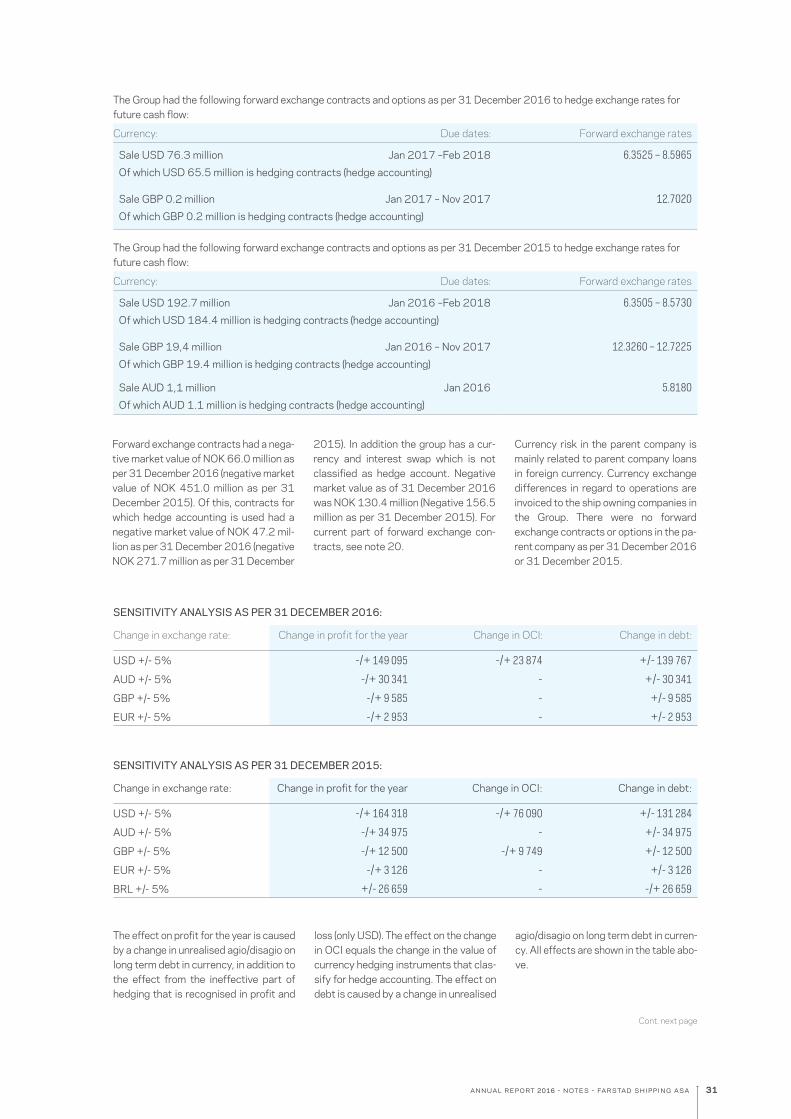
31annual report 2016 - notes - farstad shipping asa
Cont. next page
Forward exchange contracts had a nega-tive market value of NOK 66.0 million as per 31 December 2016 (negative market value of NOK 451.0 million as per 31 December 2015). Of this, contracts for which hedge accounting is used had a negative market value of NOK 47.2 mil-lion as per 31 December 2016 (negative NOK 271.7 million as per 31 December
2015). In addition the group has a cur-rency and interest swap which is not classified as hedge account. Negative market value as of 31 December 2016 was NOK 130.4 million (Negative 156.5 million as per 31 December 2015). For current part of forward exchange con-tracts, see note 20.
Currency risk in the parent company is mainly related to parent company loans in foreign currency. Currency exchange differences in regard to operations are invoiced to the ship owning companies in the Group. There were no forward exchange contracts or options in the pa-rent company as per 31 December 2016 or 31 December 2015.
SENSITIVITY ANALYSIS AS PER 31 DECEMBER 2016:
Change in exchange rate: Change in profit for the year Change in OCI: Change in debt:
USD +/- 5% -/+ 149 095 -/+ 23 874 +/- 139 767
AUD +/- 5% -/+ 30 341 - +/- 30 341
GBP +/- 5% -/+ 9 585 - +/- 9 585
EUR +/- 5% -/+ 2 953 - +/- 2 953
The Group had the following forward exchange contracts and options as per 31 December 2016 to hedge exchange rates for future cash flow:
Currency: Due dates: Forward exchange rates
Sale USD 76.3 million Jan 2017 –Feb 2018 6.3525 – 8.5965
Of which USD 65.5 million is hedging contracts (hedge accounting)
Sale GBP 0.2 million Jan 2017 – Nov 2017 12.7020
Of which GBP 0.2 million is hedging contracts (hedge accounting)
The Group had the following forward exchange contracts and options as per 31 December 2015 to hedge exchange rates for future cash flow:
Currency: Due dates: Forward exchange rates
Sale USD 192.7 million Jan 2016 –Feb 2018 6.3505 – 8.5730
Of which USD 184.4 million is hedging contracts (hedge accounting)
Sale GBP 19,4 million Jan 2016 – Nov 2017 12.3260 – 12.7225
Of which GBP 19.4 million is hedging contracts (hedge accounting)
Sale AUD 1,1 million Jan 2016 5.8180
Of which AUD 1.1 million is hedging contracts (hedge accounting)
The effect on profit for the year is caused by a change in unrealised agio/disagio on long term debt in currency, in addition to the effect from the ineffective part of hedging that is recognised in profit and
loss (only USD). The effect on the change in OCI equals the change in the value of currency hedging instruments that clas-sify for hedge accounting. The effect on debt is caused by a change in unrealised
agio/disagio on long term debt in curren-cy. All effects are shown in the table abo-ve.
SENSITIVITY ANALYSIS AS PER 31 DECEMBER 2015:
Change in exchange rate: Change in profit for the year Change in OCI: Change in debt:
USD +/- 5% -/+ 164 318 -/+ 76 090 +/- 131 284
AUD +/- 5% -/+ 34 975 - +/- 34 975
GBP +/- 5% -/+ 12 500 -/+ 9 749 +/- 12 500
EUR +/- 5% -/+ 3 126 - +/- 3 126
BRL +/- 5% +/- 26 659 - -/+ 26 659

32 annual report 2016 - notes - farstad shipping asa
NOTE 8 – FINANCIAL RISK, FINANCIAL INSTRUMENTS, CONT.
OUTSTANDING RECEIVABLES – BY AGE - GROUP
Total 31.12.16 Not overdue: 0 – 30 days 31 – 60 days More than 60 days
537 277 438 600 86 721 4 110 7 855
100% 81.6% 16.1% 0.8% 1.5%
OUTSTANDING RECEIVABLES – BY AGE – PARENT COMPANY:
Total 31.12.16 Not overdue: 0 – 30 days 31 – 60 days More than 60 days
208 928 208 759 129 - 40
100% 99.9% 0.1% - 0.0%
OUTSTANDING RECEIVABLES – BY AGE - GROUP
Total 31.12.15 Not overdue: 0 – 30 days 31 – 60 days More than 60 days
739 282 558 291 145 888 33 242 1 860
100% 75.5% 19.7% 4.5% 0.3%
OUTSTANDING RECEIVABLES – BY AGE – PARENT COMPANY:
Total 31.12.15 Not overdue: 0 – 30 days 31 – 60 days More than 60 days
131 461 131 423 38 0 0
100% 100% 0% 0% 0%
CREDIT RISKThe Group is exposed to possible losses on accounts receivable, and has made total provisions of NOK 3.0 million as per 31 December 2016 (0 per 31 De-cember 2015). See note 18 for details. For the Group, the maximum credit exposure is regarded as equal to the size of the accounts receivable and ot-her short term receivables, i.e. NOK
537.2 million (NOK 739.3 million in 2015). Corresponding figure for the parent company is NOK 208.9 million (NOK 131.4 million in 2015).
The Group is also exposed to possible losses if the agreement counterpart in a derivative contract should fail to fulfil its payment obligations on the settle-
ment date. However, the Group does not expect any of the counterparties to fail to fulfil their obligations.
No particular hedging against credit risk was undertaken in 2016. Ongoing provisions are made, and historically the loss percentage has been very low.
Hegde accounting posted to equity during the year 2016:The following changes have taken place in regard to cash flow hedging over the year (interest rate and currency hedging):
2016 2015
Hedging instruments in Equity as per 1 January (325 115) (294 555)
Freight income 202 809 216 392
Interest rate cost (36 115) (40 294)
New cash flow hedging instruments - (59 189)
Change in value of remaining cash flow hedging 94 392 (149 976)
Tax effects - 2 507
Hedging instruments in Equity as per 31 December (64 029) (325 115)
HEDGING ACTIVITIESThe Group has both currency hedging and interest hedging as described in the paragraphs above.
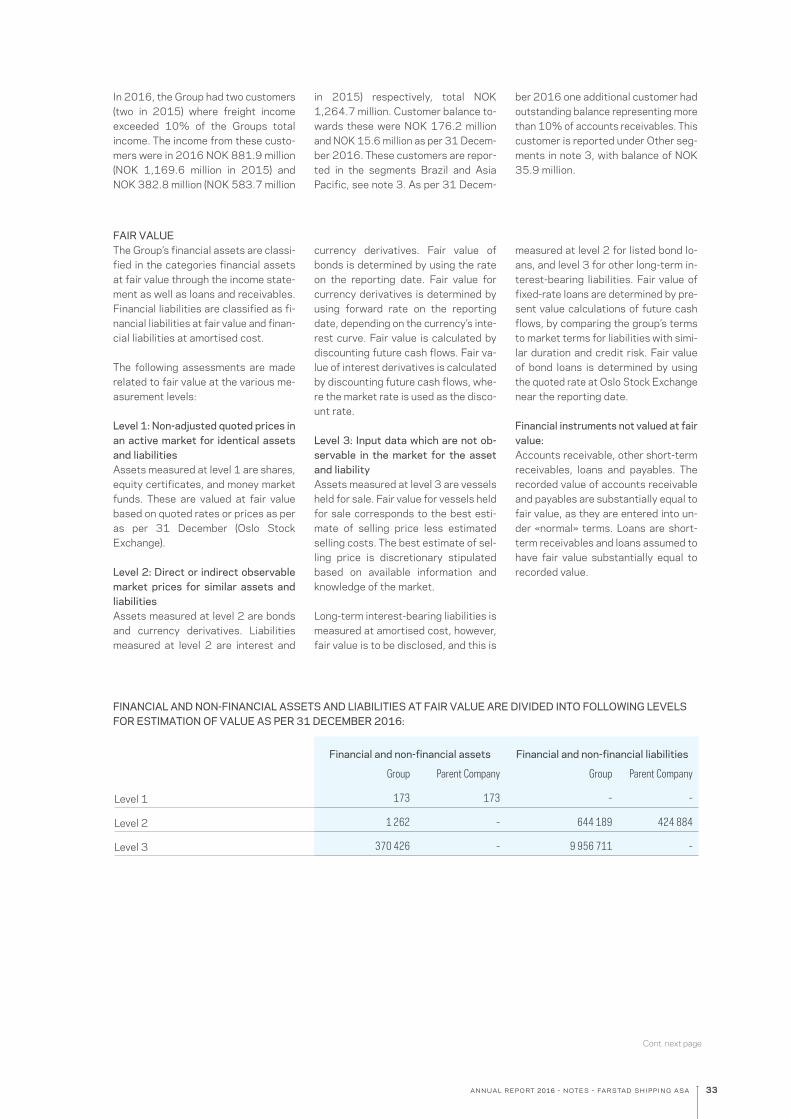
33annual report 2016 - notes - farstad shipping asa
FAIR VALUEThe Group’s financial assets are classi-fied in the categories financial assets at fair value through the income state-ment as well as loans and receivables. Financial liabilities are classified as fi-nancial liabilities at fair value and finan-cial liabilities at amortised cost.
The following assessments are made related to fair value at the various me-asurement levels:
Level 1: Non-adjusted quoted prices in an active market for identical assets and liabilitiesAssets measured at level 1 are shares, equity certificates, and money market funds. These are valued at fair value based on quoted rates or prices as per as per 31 December (Oslo Stock Exchange).
Level 2: Direct or indirect observable market prices for similar assets and liabilitiesAssets measured at level 2 are bonds and currency derivatives. Liabilities measured at level 2 are interest and
currency derivatives. Fair value of bonds is determined by using the rate on the reporting date. Fair value for currency derivatives is determined by using forward rate on the reporting date, depending on the currency’s inte-rest curve. Fair value is calculated by discounting future cash flows. Fair va-lue of interest derivatives is calculated by discounting future cash flows, whe-re the market rate is used as the disco-unt rate.
Level 3: Input data which are not ob-servable in the market for the asset and liabilityAssets measured at level 3 are vessels held for sale. Fair value for vessels held for sale corresponds to the best esti-mate of selling price less estimated selling costs. The best estimate of sel-ling price is discretionary stipulated based on available information and knowledge of the market.
Long-term interest-bearing liabilities is measured at amortised cost, however, fair value is to be disclosed, and this is
measured at level 2 for listed bond lo-ans, and level 3 for other long-term in-terest-bearing liabilities. Fair value of fixed-rate loans are determined by pre-sent value calculations of future cash flows, by comparing the group’s terms to market terms for liabilities with simi-lar duration and credit risk. Fair value of bond loans is determined by using the quoted rate at Oslo Stock Exchange near the reporting date.
Financial instruments not valued at fair value:Accounts receivable, other short-term receivables, loans and payables. The recorded value of accounts receivable and payables are substantially equal to fair value, as they are entered into un-der «normal» terms. Loans are short-term receivables and loans assumed to have fair value substantially equal to recorded value.
In 2016, the Group had two customers (two in 2015) where freight income exceeded 10% of the Groups total income. The income from these custo-mers were in 2016 NOK 881.9 million (NOK 1,169.6 million in 2015) and NOK 382.8 million (NOK 583.7 million
in 2015) respectively, total NOK 1,264.7 million. Customer balance to-wards these were NOK 176.2 million and NOK 15.6 million as per 31 Decem-ber 2016. These customers are repor-ted in the segments Brazil and Asia Pacific, see note 3. As per 31 Decem-
ber 2016 one additional customer had outstanding balance representing more than 10% of accounts receivables. This customer is reported under Other seg-ments in note 3, with balance of NOK 35.9 million.
Cont. next page
Financial and non-financial assets Financial and non-financial liabilities
Group Parent Company Group Parent Company
Level 1 173 173 - -
Level 2 1 262 - 644 189 424 884
Level 3 370 426 - 9 956 711 -
FINANCIAL AND NON-FINANCIAL ASSETS AND LIABILITIES AT FAIR VALUE ARE DIVIDED INTO FOLLOWING LEVELS FOR ESTIMATION OF VALUE AS PER 31 DECEMBER 2016:
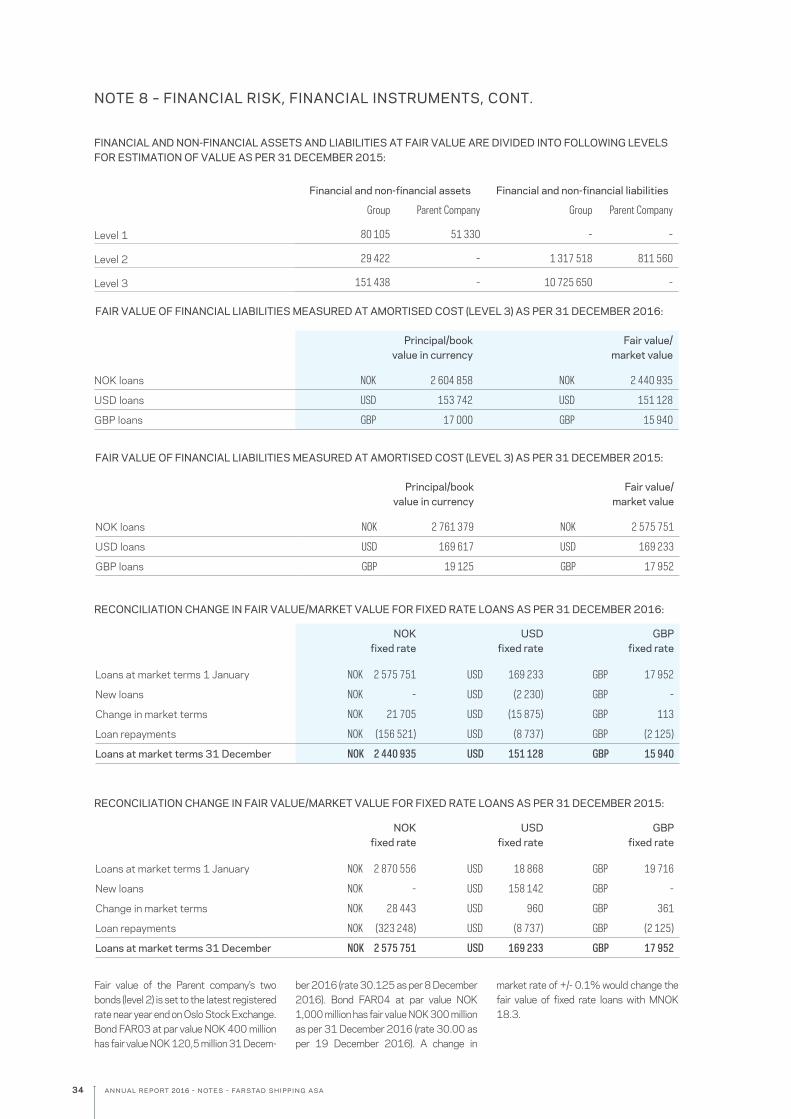
34 annual report 2016 - notes - farstad shipping asa
NOTE 8 – FINANCIAL RISK, FINANCIAL INSTRUMENTS, CONT.
Fair value of the Parent company’s two bonds (level 2) is set to the latest registered rate near year end on Oslo Stock Exchange. Bond FAR03 at par value NOK 400 million has fair value NOK 120,5 million 31 Decem-
ber 2016 (rate 30.125 as per 8 December 2016). Bond FAR04 at par value NOK 1,000 million has fair value NOK 300 million as per 31 December 2016 (rate 30.00 as per 19 December 2016). A change in
market rate of +/- 0.1% would change the fair value of fixed rate loans with MNOK 18.3.
Principal/book
value in currency Fair value/
market value
NOK loans NOK 2 604 858 NOK 2 440 935
USD loans USD 153 742 USD 151 128
GBP loans GBP 17 000 GBP 15 940
Principal/book value in currency
Fair value/ market value
NOK loans NOK 2 761 379 NOK 2 575 751
USD loans USD 169 617 USD 169 233
GBP loans GBP 19 125 GBP 17 952
NOK fixed rate
USD fixed rate
GBP fixed rate
Loans at market terms 1 January NOK 2 575 751 USD 169 233 GBP 17 952
New loans NOK - USD (2 230) GBP -
Change in market terms NOK 21 705 USD (15 875) GBP 113
Loan repayments NOK (156 521) USD (8 737) GBP (2 125)
Loans at market terms 31 December NOK 2 440 935 USD 151 128 GBP 15 940
NOK fixed rate
USD fixed rate
GBP fixed rate
Loans at market terms 1 January NOK 2 870 556 USD 18 868 GBP 19 716
New loans NOK - USD 158 142 GBP -
Change in market terms NOK 28 443 USD 960 GBP 361
Loan repayments NOK (323 248) USD (8 737) GBP (2 125)
Loans at market terms 31 December NOK 2 575 751 USD 169 233 GBP 17 952
FAIR VALUE OF FINANCIAL LIABILITIES MEASURED AT AMORTISED COST (LEVEL 3) AS PER 31 DECEMBER 2016:
FAIR VALUE OF FINANCIAL LIABILITIES MEASURED AT AMORTISED COST (LEVEL 3) AS PER 31 DECEMBER 2015:
RECONCILIATION CHANGE IN FAIR VALUE/MARKET VALUE FOR FIXED RATE LOANS AS PER 31 DECEMBER 2016:
RECONCILIATION CHANGE IN FAIR VALUE/MARKET VALUE FOR FIXED RATE LOANS AS PER 31 DECEMBER 2015:
Financial and non-financial assets Financial and non-financial liabilities
Group Parent Company Group Parent Company
Level 1 80 105 51 330 - -
Level 2 29 422 - 1 317 518 811 560
Level 3 151 438 - 10 725 650 -
FINANCIAL AND NON-FINANCIAL ASSETS AND LIABILITIES AT FAIR VALUE ARE DIVIDED INTO FOLLOWING LEVELS FOR ESTIMATION OF VALUE AS PER 31 DECEMBER 2015:
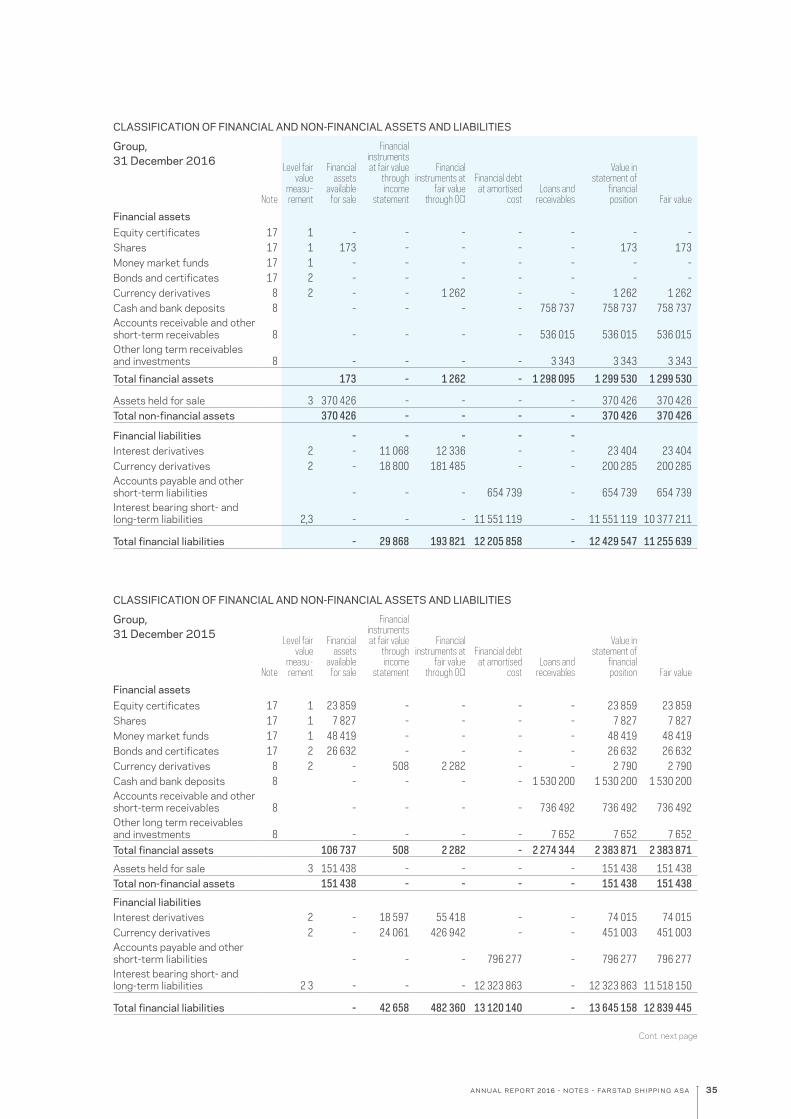
35annual report 2016 - notes - farstad shipping asa
Cont. next page
CLASSIFICATION OF FINANCIAL AND NON-FINANCIAL ASSETS AND LIABILITIES
Group, 31 December 2016
Note
Level fair value
measu-rement
Financial assets
available for sale
Financial instruments at fair value
through income
statement
Financial instruments at
fair value through OCI
Financial debt at amortised
costLoans and
receivables
Value in statement of
financial position Fair value
Financial assetsEquity certificates 17 1 - - - - - - - Shares 17 1 173 - - - - 173 173 Money market funds 17 1 - - - - - - - Bonds and certificates 17 2 - - - - - - - Currency derivatives 8 2 - - 1 262 - - 1 262 1 262 Cash and bank deposits 8 - - - - 758 737 758 737 758 737 Accounts receivable and other short-term receivables 8 - - - - 536 015 536 015 536 015 Other long term receivables and investments 8 - - - - 3 343 3 343 3 343
Total financial assets 173 - 1 262 - 1 298 095 1 299 530 1 299 530
Assets held for sale 3 370 426 - - - - 370 426 370 426 Total non-financial assets 370 426 - - - - 370 426 370 426
Financial liabilities - - - - - Interest derivatives 2 - 11 068 12 336 - - 23 404 23 404 Currency derivatives 2 - 18 800 181 485 - - 200 285 200 285 Accounts payable and other short-term liabilities - - - 654 739 - 654 739 654 739 Interest bearing short- and long-term liabilities 2,3 - - - 11 551 119 - 11 551 119 10 377 211
Total financial liabilities - 29 868 193 821 12 205 858 - 12 429 547 11 255 639
CLASSIFICATION OF FINANCIAL AND NON-FINANCIAL ASSETS AND LIABILITIES
Group, 31 December 2015
Note
Level fair value
measu-rement
Financial assets
available for sale
Financial instruments at fair value
through income
statement
Financial instruments at
fair value through OCI
Financial debt at amortised
costLoans and
receivables
Value in statement of
financial position Fair value
Financial assetsEquity certificates 17 1 23 859 - - - - 23 859 23 859 Shares 17 1 7 827 - - - - 7 827 7 827 Money market funds 17 1 48 419 - - - - 48 419 48 419 Bonds and certificates 17 2 26 632 - - - - 26 632 26 632 Currency derivatives 8 2 - 508 2 282 - - 2 790 2 790 Cash and bank deposits 8 - - - - 1 530 200 1 530 200 1 530 200 Accounts receivable and other short-term receivables 8 - - - - 736 492 736 492 736 492 Other long term receivables and investments 8 - - - - 7 652 7 652 7 652 Total financial assets 106 737 508 2 282 - 2 274 344 2 383 871 2 383 871
Assets held for sale 3 151 438 - - - - 151 438 151 438 Total non-financial assets 151 438 - - - - 151 438 151 438
Financial liabilities Interest derivatives 2 - 18 597 55 418 - - 74 015 74 015 Currency derivatives 2 - 24 061 426 942 - - 451 003 451 003 Accounts payable and other short-term liabilities - - - 796 277 - 796 277 796 277 Interest bearing short- and long-term liabilities 2 3 - - - 12 323 863 - 12 323 863 11 518 150
Total financial liabilities - 42 658 482 360 13 120 140 - 13 645 158 12 839 445
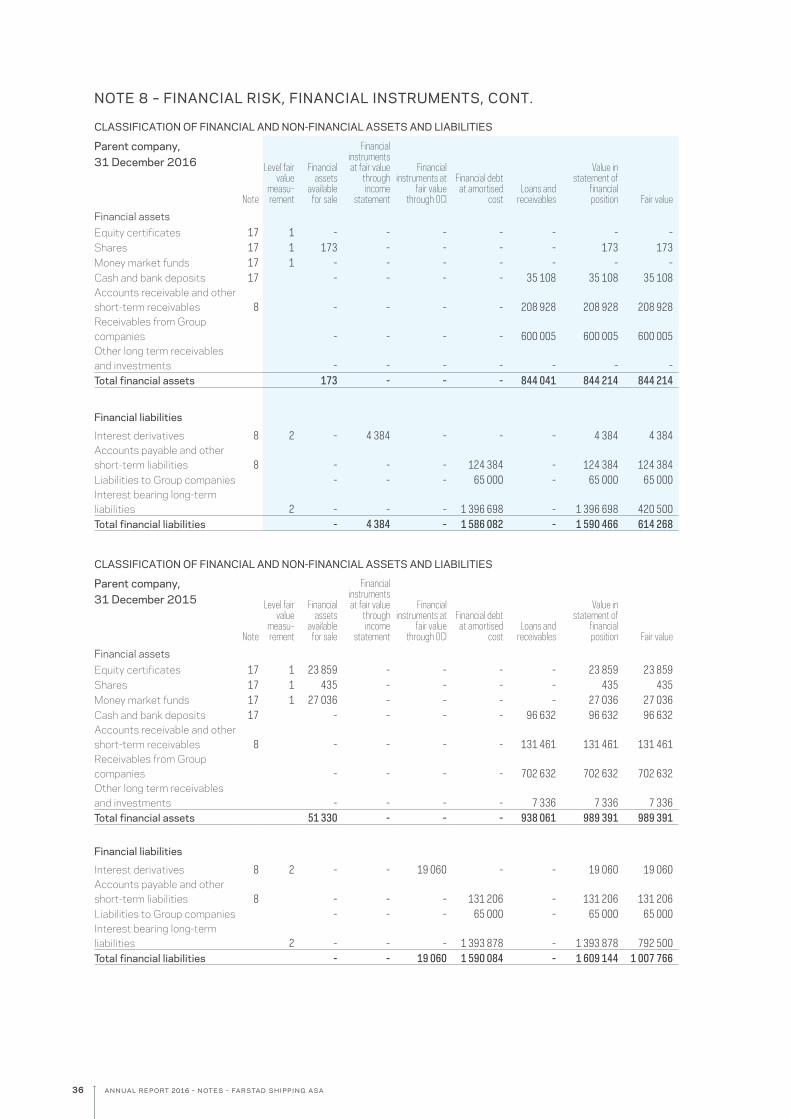
36 annual report 2016 - notes - farstad shipping asa
NOTE 8 – FINANCIAL RISK, FINANCIAL INSTRUMENTS, CONT.
CLASSIFICATION OF FINANCIAL AND NON-FINANCIAL ASSETS AND LIABILITIES
Parent company, 31 December 2016
Note
Level fair value
measu-rement
Financial assets
available for sale
Financial instruments at fair value
through income
statement
Financial instruments at
fair value through OCI
Financial debt at amortised
costLoans and
receivables
Value in statement of
financial position Fair value
Financial assetsEquity certificates 17 1 - - - - - - - Shares 17 1 173 - - - - 173 173 Money market funds 17 1 - - - - - - - Cash and bank deposits 17 - - - - 35 108 35 108 35 108 Accounts receivable and other short-term receivables 8 - - - - 208 928 208 928 208 928 Receivables from Group companies - - - - 600 005 600 005 600 005 Other long term receivables and investments - - - - - - - Total financial assets 173 - - - 844 041 844 214 844 214
Financial liabilities
Interest derivatives 8 2 - 4 384 - - - 4 384 4 384 Accounts payable and other short-term liabilities 8 - - - 124 384 - 124 384 124 384 Liabilities to Group companies - - - 65 000 - 65 000 65 000 Interest bearing long-term liabilities 2 - - - 1 396 698 - 1 396 698 420 500 Total financial liabilities - 4 384 - 1 586 082 - 1 590 466 614 268
CLASSIFICATION OF FINANCIAL AND NON-FINANCIAL ASSETS AND LIABILITIES
Parent company, 31 December 2015
Note
Level fair value
measu-rement
Financial assets
available for sale
Financial instruments at fair value
through income
statement
Financial instruments at
fair value through OCI
Financial debt at amortised
costLoans and
receivables
Value in statement of
financial position Fair value
Financial assetsEquity certificates 17 1 23 859 - - - - 23 859 23 859 Shares 17 1 435 - - - - 435 435 Money market funds 17 1 27 036 - - - - 27 036 27 036 Cash and bank deposits 17 - - - - 96 632 96 632 96 632 Accounts receivable and other short-term receivables 8 - - - - 131 461 131 461 131 461 Receivables from Group companies - - - - 702 632 702 632 702 632 Other long term receivables and investments - - - - 7 336 7 336 7 336 Total financial assets 51 330 - - - 938 061 989 391 989 391
Financial liabilities
Interest derivatives 8 2 - - 19 060 - - 19 060 19 060 Accounts payable and other short-term liabilities 8 - - - 131 206 - 131 206 131 206 Liabilities to Group companies - - - 65 000 - 65 000 65 000 Interest bearing long-term liabilities 2 - - - 1 393 878 - 1 393 878 792 500 Total financial liabilities - - 19 060 1 590 084 - 1 609 144 1 007 766
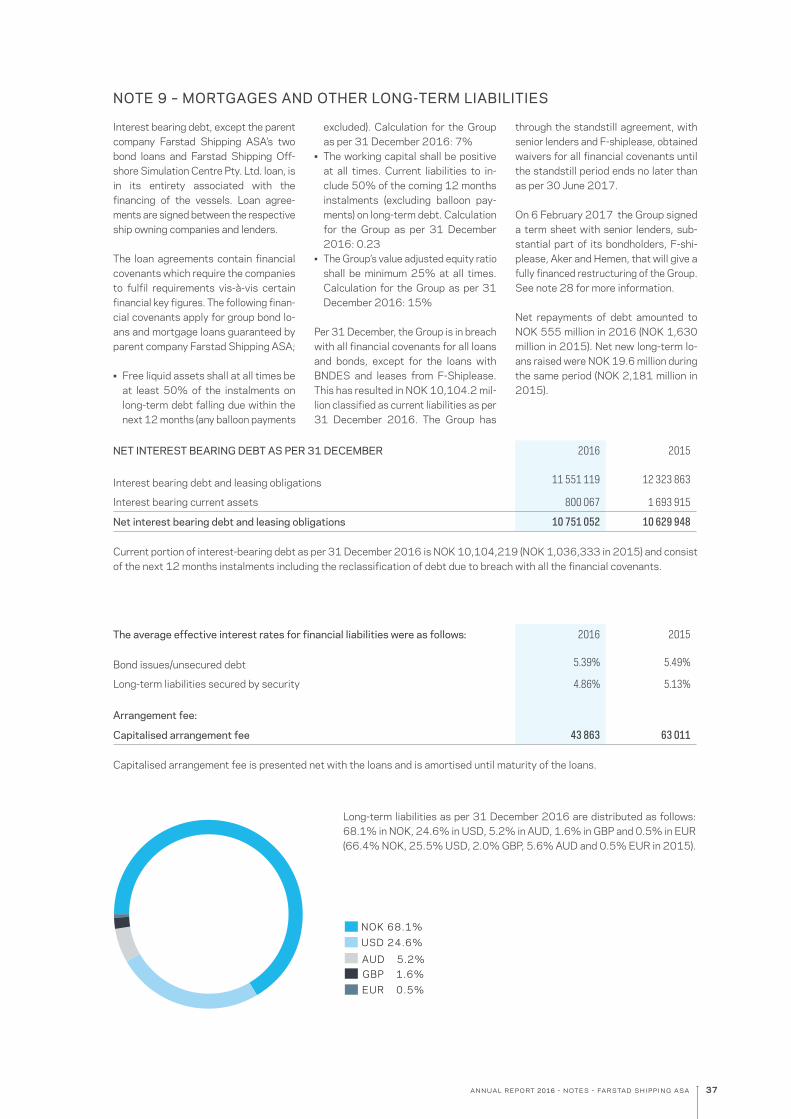
37annual report 2016 - notes - farstad shipping asa
NOTE 9 – MORTGAGES AND OTHER LONG-TERM LIABILITIES
Interest bearing debt, except the parent company Farstad Shipping ASA’s two bond loans and Farstad Shipping Off- shore Simulation Centre Pty. Ltd. loan, is in its entirety associated with the financing of the vessels. Loan agree-ments are signed between the respective ship owning companies and lenders.
The loan agreements contain financial covenants which require the companies to fulfil requirements vis-à-vis certain financial key figures. The following finan-cial covenants apply for group bond lo-ans and mortgage loans guaranteed by parent company Farstad Shipping ASA;
• Free liquid assets shall at all times be at least 50% of the instalments on long-term debt falling due within the next 12 months (any balloon payments
excluded). Calculation for the Group as per 31 December 2016: 7%• The working capital shall be positive at all times. Current liabilities to in- clude 50% of the coming 12 months instalments (excluding balloon pay- ments) on long-term debt. Calculation for the Group as per 31 December 2016: 0.23• The Group’s value adjusted equity ratio shall be minimum 25% at all times. Calculation for the Group as per 31 December 2016: 15%
Per 31 December, the Group is in breach with all financial covenants for all loans and bonds, except for the loans with BNDES and leases from F-Shiplease. This has resulted in NOK 10,104.2 mil-lion classified as current liabilities as per 31 December 2016. The Group has
through the standstill agreement, with senior lenders and F-shiplease, obtained waivers for all financial covenants until the standstill period ends no later than as per 30 June 2017.
On 6 February 2017 the Group signed a term sheet with senior lenders, sub-stantial part of its bondholders, F-shi-please, Aker and Hemen, that will give a fully financed restructuring of the Group. See note 28 for more information.
Net repayments of debt amounted to NOK 555 million in 2016 (NOK 1,630 million in 2015). Net new long-term lo-ans raised were NOK 19.6 million during the same period (NOK 2,181 million in 2015).
NET INTEREST BEARING DEBT AS PER 31 DECEMBER 2016 2015
Interest bearing debt and leasing obligations 11 551 119 12 323 863
Interest bearing current assets 800 067 1 693 915
Net interest bearing debt and leasing obligations 10 751 052 10 629 948
Current portion of interest-bearing debt as per 31 December 2016 is NOK 10,104,219 (NOK 1,036,333 in 2015) and consist of the next 12 months instalments including the reclassification of debt due to breach with all the financial covenants.
The average effective interest rates for financial liabilities were as follows: 2016 2015
Bond issues/unsecured debt 5.39% 5.49%
Long-term liabilities secured by security 4.86% 5.13%
Arrangement fee:
Capitalised arrangement fee 43 863 63 011
Capitalised arrangement fee is presented net with the loans and is amortised until maturity of the loans.
Long-term liabilities as per 31 December 2016 are distributed as follows: 68.1% in NOK, 24.6% in USD, 5.2% in AUD, 1.6% in GBP and 0.5% in EUR (66.4% NOK, 25.5% USD, 2.0% GBP, 5.6% AUD and 0.5% EUR in 2015).
EUR 0.5%GBP 1.6%AUD 5.2%
USD 24.6%NOK 68.1%
Mortgage sorted by currency
EUR 0.5%GBP 1.6%AUD 5.2%
USD 24.6%NOK 68.1%
Mortgage sorted by currency
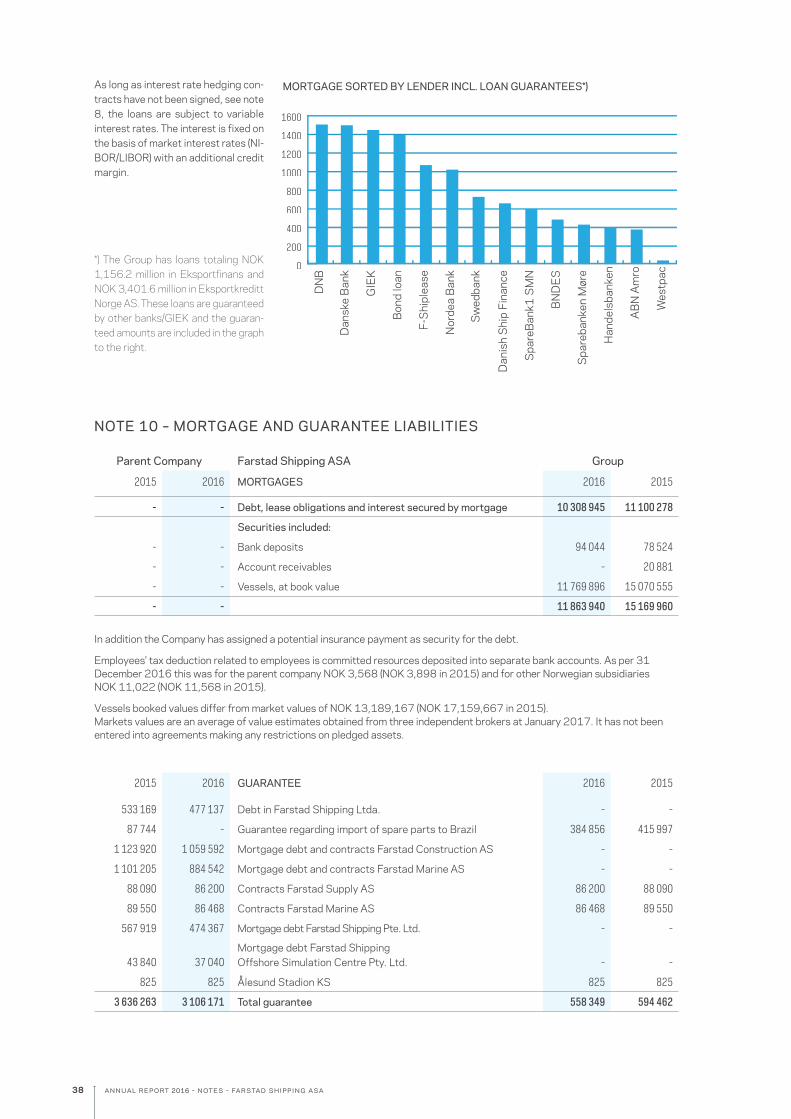
38 annual report 2016 - notes - farstad shipping asa
NOTE 10 – MORTGAGE AND GUARANTEE LIABILITIES
Parent Company Farstad Shipping ASA Group
2015 2016 MORTGAGES 2016 2015
- - Debt, lease obligations and interest secured by mortgage 10 308 945 11 100 278
Securities included:
- - Bank deposits 94 044 78 524
- - Account receivables - 20 881
- - Vessels, at book value 11 769 896 15 070 555
- - 11 863 940 15 169 960
In addition the Company has assigned a potential insurance payment as security for the debt.
Employees' tax deduction related to employees is committed resources deposited into separate bank accounts. As per 31 December 2016 this was for the parent company NOK 3,568 (NOK 3,898 in 2015) and for other Norwegian subsidiaries NOK 11,022 (NOK 11,568 in 2015).
Vessels booked values differ from market values of NOK 13,189,167 (NOK 17,159,667 in 2015). Markets values are an average of value estimates obtained from three independent brokers at January 2017. It has not been entered into agreements making any restrictions on pledged assets.
2015 2016 GUARANTEE 2016 2015
533 169 477 137 Debt in Farstad Shipping Ltda. - -
87 744 - Guarantee regarding import of spare parts to Brazil 384 856 415 997
1 123 920 1 059 592 Mortgage debt and contracts Farstad Construction AS - -
1 101 205 884 542 Mortgage debt and contracts Farstad Marine AS - -
88 090 86 200 Contracts Farstad Supply AS 86 200 88 090
89 550 86 468 Contracts Farstad Marine AS 86 468 89 550
567 919 474 367 Mortgage debt Farstad Shipping Pte. Ltd. - -
43 840 37 040Mortgage debt Farstad Shipping Offshore Simulation Centre Pty. Ltd. - -
825 825 Ålesund Stadion KS 825 825
3 636 263 3 106 171 Total guarantee 558 349 594 462
As long as interest rate hedging con-tracts have not been signed, see note 8, the loans are subject to variable interest rates. The interest is fixed on the basis of market interest rates (NI-BOR/LIBOR) with an additional credit margin.
*) The Group has loans totaling NOK 1,156.2 million in Eksportfinans and NOK 3,401.6 million in Eksportkreditt Norge AS. These loans are guaranteed by other banks/GIEK and the guaran-teed amounts are included in the graph to the right.
0
200
400
600
800
1000
1200
1400
1600
DN
B
Dan
ske
Bank
GIE
K
Bond
loan
F-S
hipl
ease
Nor
dea
Bank
Swed
bank
Dan
ish
Shi
p Fi
nanc
e
Spa
reBa
nk1
SM
N
BND
ES
Spa
reba
nken
Mør
e
Han
dels
bank
en
ABN
Am
ro
Wes
tpac
MORTGAGE SORTED BY LENDER INCL. LOAN GUARANTEES*)
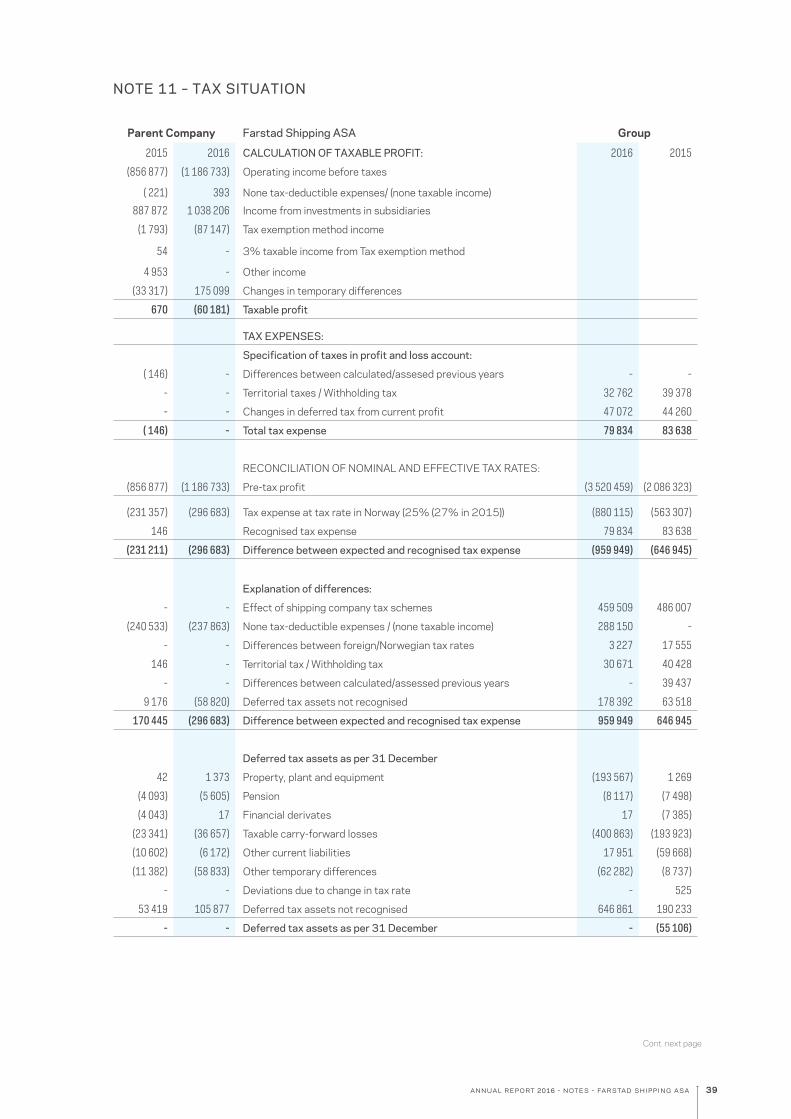
39annual report 2016 - notes - farstad shipping asa
Parent Company Farstad Shipping ASA Group
2015 2016 CALCULATION OF TAXABLE PROFIT: 2016 2015
(856 877) (1 186 733) Operating income before taxes
( 221) 393 None tax-deductible expenses/ (none taxable income)
887 872 1 038 206 Income from investments in subsidiaries
(1 793) (87 147) Tax exemption method income
54 - 3% taxable income from Tax exemption method
4 953 - Other income
(33 317) 175 099 Changes in temporary differences
670 (60 181) Taxable profit
TAX EXPENSES:
Specification of taxes in profit and loss account:
( 146) - Differences between calculated/assesed previous years - -
- - Territorial taxes / Withholding tax 32 762 39 378
- - Changes in deferred tax from current profit 47 072 44 260
( 146) - Total tax expense 79 834 83 638
RECONCILIATION OF NOMINAL AND EFFECTIVE TAX RATES:
(856 877) (1 186 733) Pre-tax profit (3 520 459) (2 086 323)
(231 357) (296 683) Tax expense at tax rate in Norway (25% (27% in 2015)) (880 115) (563 307)
146 Recognised tax expense 79 834 83 638
(231 211) (296 683) Difference between expected and recognised tax expense (959 949) (646 945)
Explanation of differences:
- - Effect of shipping company tax schemes 459 509 486 007
(240 533) (237 863) None tax-deductible expenses / (none taxable income) 288 150 -
- - Differences between foreign/Norwegian tax rates 3 227 17 555
146 - Territorial tax / Withholding tax 30 671 40 428
- - Differences between calculated/assessed previous years - 39 437
9 176 (58 820) Deferred tax assets not recognised 178 392 63 518
170 445 (296 683) Difference between expected and recognised tax expense 959 949 646 945
Deferred tax assets as per 31 December
42 1 373 Property, plant and equipment (193 567) 1 269
(4 093) (5 605) Pension (8 117) (7 498)
(4 043) 17 Financial derivates 17 (7 385)
(23 341) (36 657) Taxable carry-forward losses (400 863) (193 923)
(10 602) (6 172) Other current liabilities 17 951 (59 668)
(11 382) (58 833) Other temporary differences (62 282) (8 737)
- - Deviations due to change in tax rate - 525
53 419 105 877 Deferred tax assets not recognised 646 861 190 233
- - Deferred tax assets as per 31 December - (55 106)
NOTE 11 – TAX SITUATION
Cont. next page
MORTGAGE SORTED BY LENDER INCL. LOAN GUARANTEES*)

40 annual report 2016 - notes - farstad shipping asa
NOTE 12 – EARNINGS PER SHARE
NOTE 13 - PAID AND PROPOSED DIVIDEND
2016 2015
Group results (3 600 293) (2 169 961)
Average number of shares 39 000 000 39 000 000
Results/diluted earnings per share (NOK) (92.32) (55.64)
2016 2015
Decided and paid out through the year:
Ordinary dividend - 117 000
- 117 000
Share Capital:The company’s share capital is NOK 39.0 mill., distributed across 39 000 000 shares with a nominal value of NOK 1.00 in one share class. At the annual general meeting one share has one vote.
Deferred tax asset is only recognised when it is expected that the parent company and/or Group can utilise it in the future, due to current market situation no deferred tax asset is recognised in the financial statement.
The parent company has NOK 146,629 (NOK 86,448 in 2015) in unrecognised tax losses carried forward in 2016, whe-
re deferred tax assets are not recognised. The Group has NOK 1,483,894 in unre-cognised tax losses carried forward in 2016 (NOK 971,198 in 2015). All tax losses carried forward in the Group and parent company are unlimited.
Farstad Shipping’s main vessel owning company Farstad Supply AS, left the basic tonnage tax scheme in Norway as per 31
August 2016 and moved tax residency to UK tonnage tax as per 1 September 2016. As a consequence the untaxed settlement amount from the basic tonna-ge tax scheme as per 31 December 2015 was settled against a tax loss at the exit in 2016. The exit did not result in any tax payable in Norway.
Parent Company Farstad Shipping ASA Group
2015 2016 Deferred tax liability as per 31 December 2016 2015
- - Property, plant and equipment 39 942 43 140
- - Other current liabilities 465 -
- - Deferred tax liability as per 31 December 40 407 43 140
Specification of change in deferred tax:
- - Deferred tax liability/ (Deferred tax assets) at 1st January (11 966) (41 208)
- - Changes in deferred tax from current profit 47 072 44 260
- - Changes in tax rate - ( 525)
- - Exchange differences 1 959 (13 441)
Changes in deferred tax against comprehensive income:
- - Change in deferred tax posted against comprehensive income related to foreign companies - 1 455
- - Change in deferred tax posted against comprehensive income related to Norwegian companies 3 342 (2 507)
- - Changes in deferred tax against comprehensive income, total 3 342 (1 052)
- - Deferred tax liability/ (Deferred tax assets) as per 31 December 40 407 (11 966)
NOTE 11 - TAX SITUATION CONT.
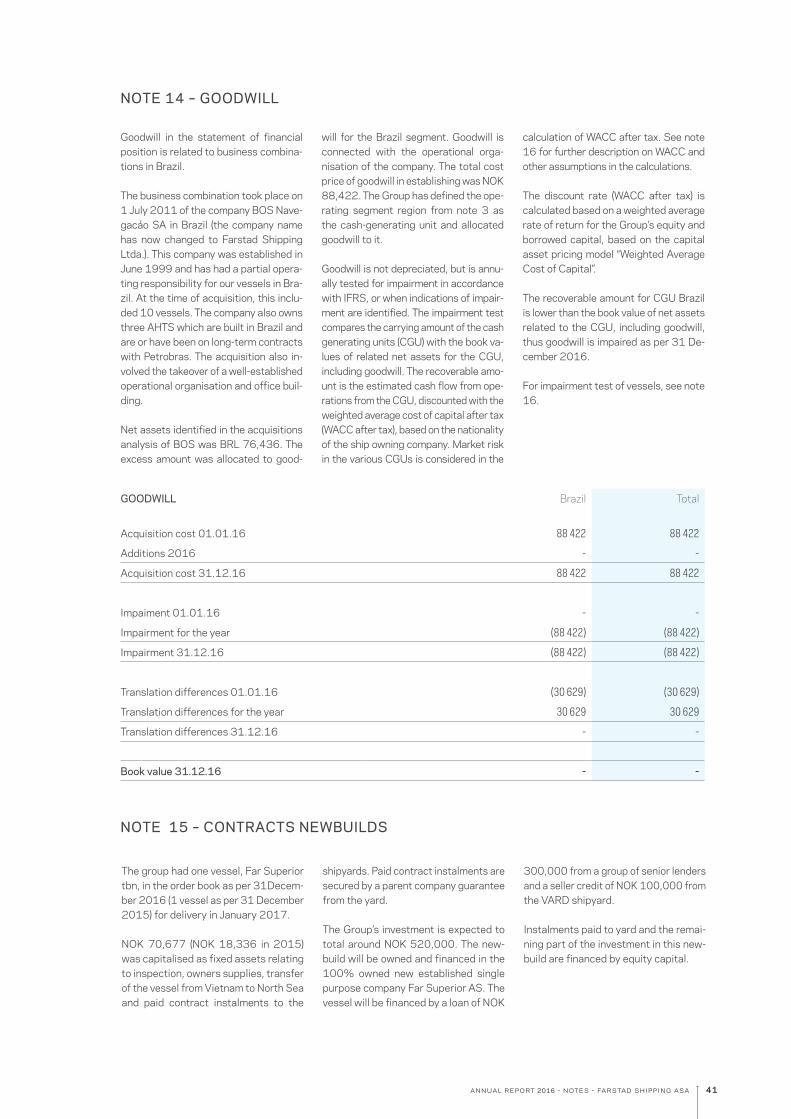
41annual report 2016 - notes - farstad shipping asa
GOODWILL Brazil Total
Acquisition cost 01.01.16 88 422 88 422
Additions 2016 - -
Acquisition cost 31.12.16 88 422 88 422
Impaiment 01.01.16 - -
Impairment for the year (88 422) (88 422)
Impairment 31.12.16 (88 422) (88 422)
Translation differences 01.01.16 (30 629) (30 629)
Translation differences for the year 30 629 30 629
Translation differences 31.12.16 - -
Book value 31.12.16 - -
NOTE 15 – CONTRACTS NEWBUILDS
The group had one vessel, Far Superior tbn, in the order book as per 31Decem-ber 2016 (1 vessel as per 31 December 2015) for delivery in January 2017.
NOK 70,677 (NOK 18,336 in 2015) was capitalised as fixed assets relating to inspection, owners supplies, transfer of the vessel from Vietnam to North Sea and paid contract instalments to the
shipyards. Paid contract instalments are secured by a parent company guarantee from the yard.
The Group’s investment is expected to total around NOK 520,000. The new-build will be owned and financed in the 100% owned new established single purpose company Far Superior AS. The vessel will be financed by a loan of NOK
300,000 from a group of senior lenders and a seller credit of NOK 100,000 from the VARD shipyard.
Instalments paid to yard and the remai-ning part of the investment in this new-build are financed by equity capital.
NOTE 14 – GOODWILL
Goodwill in the statement of financial position is related to business combina-tions in Brazil.
The business combination took place on 1 July 2011 of the company BOS Nave-gacáo SA in Brazil (the company name has now changed to Farstad Shipping Ltda.). This company was established in June 1999 and has had a partial opera-ting responsibility for our vessels in Bra-zil. At the time of acquisition, this inclu-ded 10 vessels. The company also owns three AHTS which are built in Brazil and are or have been on long-term contracts with Petrobras. The acquisition also in-volved the takeover of a well-established operational organisation and office buil-ding.
Net assets identified in the acquisitions analysis of BOS was BRL 76,436. The excess amount was allocated to good-
will for the Brazil segment. Goodwill is connected with the operational orga-nisation of the company. The total cost price of goodwill in establishing was NOK 88,422. The Group has defined the ope-rating segment region from note 3 as the cash-generating unit and allocated goodwill to it.
Goodwill is not depreciated, but is annu-ally tested for impairment in accordance with IFRS, or when indications of impair-ment are identified. The impairment test compares the carrying amount of the cash generating units (CGU) with the book va-lues of related net assets for the CGU, including goodwill. The recoverable amo-unt is the estimated cash flow from ope-rations from the CGU, discounted with the weighted average cost of capital after tax (WACC after tax), based on the nationality of the ship owning company. Market risk in the various CGUs is considered in the
calculation of WACC after tax. See note 16 for further description on WACC and other assumptions in the calculations.
The discount rate (WACC after tax) is calculated based on a weighted average rate of return for the Group’s equity and borrowed capital, based on the capital asset pricing model “Weighted Average Cost of Capital”.
The recoverable amount for CGU Brazil is lower than the book value of net assets related to the CGU, including goodwill, thus goodwill is impaired as per 31 De-cember 2016.
For impairment test of vessels, see note 16.

42 annual report 2016 - notes - farstad shipping asa
NOTE 16 - VESSELS AND OTHER FIXED ASSETS
2016 - GroupOther
fixed assets VesselsTotal Vessels
etcContracts newbuilds
Total fixed assets
Acquisition cost
1 January 266 604 19 701 244 19 967 848 18 336 19 986 184
Additions 22 112 61 586 83 698 52 341 136 039
Disposals (13 335) (343 813) (357 149) - (357 149)
Assets classified as held for sale (452 315) (452 315) - (452 315)
Translation differences (2 367) 69 928 67 562 - 67 562
31 December 273 014 19 036 630 19 309 643 70 677 19 380 320
Accumulated depreciation and impairment
Balance as per 1 January 135 664 4 689 816 4 825 480 - 4 825 480
Depreciation for the year 21 620 724 173 745 793 - 745 793
Impairment for the year 36 317 2 574 444 2 610 761 - 2 610 761
Disposals (10 202) (276 871) (287 073) - (287 073)
Assets classified as held for sale (113 235) (113 235) - (113 235)
31 December 183 400 7 598 327 7 781 726 - 7 781 726
Carrying value deferred maintenance - 206 524 206 524 - 206 524
Carrying value 89 614 11 644 827 11 734 441 70 677 11 805 118
Of which financial lease (see note 22) - 1 095 146 1 095 146 - 1 095 146
As per 31 December 2016 the AHTS Far Shogun was classified as asset held for sale. Net book value including deferred main-tenance NOK 5.1 million) for assets classified as held for sale was NOK 370.4 million.
2015 - GroupOther
fixed assets VesselsTotal Vessels
etcContracts newbuilds
Total fixed assets
Acquisition cost
1 January 254 906 19 195 853 19 450 759 33 715 19 484 474
Additions 11 964 1 678 919 1 690 883 1 646 122 3 337 005
Disposals (2 252) (389 609) (391 861) (1 661 501) (2 053 362)
Assets classified as held for sale - (694 599) (694 599) - (694 599)
Translation differences 1 986 (89 320) (87 334) - (87 334)
31 December 266 604 19 701 244 19 967 848 18 336 19 986 184
Accumulated depreciation and impairment
Balance as per 1 January 107 754 3 717 499 3 825 253 - 3 825 253
Depreciation for the year 23 362 614 386 637 748 - 637 748
Impairment for the year 6 769 1 242 544 1 249 313 - 1 249 313
Disposals (2 221) (307 915) (310 136) - (310 136)
Assets classified as held for sale - (576 698) (576 698) - (576 698)
31 December 135 664 4 689 816 4 825 480 - 4 825 480
Carrying value deferred maintenance - 241 518 241 518 - 241 518
Carrying value 130 940 15 252 946 15 383 886 18 336 15 402 222
Of which financial lease (see note 22) - 1 127 050 1 127 050 - 1 127 050

43annual report 2016 - notes - farstad shipping asa
DEPRECIATION SCHEDULE:Vessels are decomposed in vessel and deferred maintenance. The vessels are depreciated over defined period of use on a best estimate of what we believe the vessels can be sold for when they are 20 years old. Changes in depreciation on the basis of the annual reviewing of residual values are spread over the remaining pe-riod of use. The Group has made an as-sessment of the residual value as per 1 January 2016 and 1 July 2016.
This has resulted in increased depreci-ation by approximately NOK 194 mill. in 2016. Deferred maintenance is capitalised and depreciated normally on a straight-line basis over the period up to next planned deferred maintenance/docking, normal-ly over 30 months.
Fixture and fittings, vehicles and office
machinery etc. are depreciated linearly over 3-5 years.
Buildings are depreciated over a period of up to 50 years.
IMPAIRMENT:
Parent Company
FIXTURE AND FITTINGS, VEHICLES, OFFICE MACHINERY, ICT ETC. 2016 2015
Acquisition cost
1 January 84 572 77 012
Additions 19 071 8 201
Disposals (12 700) (641)
31 December 90 943 84 572
Accumulated depreciation and impairment
Balance as per 1 January 64 311 52 743
Depreciation for the year 8 859 10 596
Impairment for the year 2 070 1 611
Disposals (9 804) (639)
31 December 65 436 64 311
Carrying value 25 507 20 261
Group
CHANGE IN CARRYING VALUE DEFERRED MAINTENANCE 2016 2015
Balance as per 1 January 241 518 359 318
Additions 146 068 197 943
Disposals from sale (1 436) (17 877)
Assets classified as held for sale 9 337 (33 537)
Translation differences 2 768 (4 815)
The year's depreciations (191 731) (259 514)
Balance as per 31 December 206 524 241 518
Cont. next page
2016 2015
AHTS 963 000 238 544
PSV 1 201 000 1 004 000
SUBSEA 395 000 -
Goodwill 67 758 30 247
Other assets 51 761 6 769
Total impairments 2 678 519 1 279 560

44 annual report 2016 - notes - farstad shipping asa
IMPAIRMENT Due to the current market conditions, as well as uncertainty relating to vessels future earnings, the Group has perfor-med individual impairment tests of all vessels in accordance with IAS 36. Im-pairments have been performed where the recoverable amount is lower than the recognised value for the vessels/assets.The recoverable amount for each vessel is based on a value in use calculation from cash flow before financial items and tax. The cash flow calculations have been discounted with an average cost of capital after tax (WACC) in the range between 8.24% and 16.08%, depen-ding on vessel owners’ nationality. The cash flow per vessel is calculated until vessels reaches an age of 30 years.
For vessels on firm contracts it is assu- med that the vessels are employed on
charter parties up until expiry of the firm contracts, and that rate and utilisation levels thereafter are changed to expec-ted market leves. Options have not been assigned any added value in the value in use calculations. The estimated cash flows per vessel is based on two five year forecast scena-rios, where one scenario expects the market to start recovering in 2019 and be fully recovered in 2021. The second scenario start to recover in 2018 to be fully recovered in 2020, at rates levels as it was in 2013-14. The first scenario is weighted 25% and the second scena-rio is weighted 75% based on the management expectations of outcome for each scenario.
Impairments on other assets are related
to the simulator center in Perth, spare parts and office equipment. The reco-verable amount for the simulator center is based on value in use calculations. Recoverable amounts for spare parts and office equipment is based on esti-mated fair value deducted for sale cost.
The Group has recognised one goodwill item related to the business combination in Brazil in the financial statement. The impairment test of goodwill is based on the same assumptions as for impairment testing of vessels. The operating seg-ment Brazil is defined as the cash gene-rating unit for impairment test of the goodwill item. The recoverable amount was lower than the recognised value of goodwill and thus goodwill has been im-paired in full. See note 14.
SENSITIVITY OF IMPAIRMENTThe company has mainly based impair-ment on value in use. Value in use is ba-sed on the above assumptions, and sensitivity of impairment has been done
by amending these. The reason why the same change in size of an assumption up or down does not lead to the same impairment interval, is that a weaker
assumption will cause more vessels to be impaired and when an assumption is improved, only the impaired amount will be reversed.
SALE OF VESSELSThe group sold six vessels in 2016: Far Scandia (PSV), Lady Grace (PSV), Lady Grete (PSV), Far Sea (AHTS), Lady Sandra (AHTS) and Far Fosna (AHTS).
The sales gave an accounting loss of NOK 4.4 million recorded in 2016. In 2015 the group sold three vessels; Far Sky (AHTS), Far Superior (PSV) and Lady
Guro (AHTS) with an accounting loss of NOK 4.6 million.
VESSELS CLASSIFIED AS HELD FOR SALEAs per 31 December 2016 the vessel Far Shogun (AHTS) is classified as assets held for sale. Net realisable value for as-sets held for sale is NOK 370.4 million.
The vessel will be sold during 2017 after the lender has acceded to its pledge in this vessel. The vessel was impaired by NOK 112 million before reclassification
and this is attributable to the Australia/Asia segment.
NOTE 16 - VESSELS AND OTHER FIXED ASSETS CONT.
+ increase / - decrease impairment
Change in assumption Change Lower interval Upper interval
EBITDA +10% -975 MNOK -1 125 MNOK
EBITDA -10% +1 600 MNOK +1 800 MNOK
WACC +1% +300 MNOK +360 MNOK
WACC -1% -275 MNOK -325 MNOK

45annual report 2016 - notes - farstad shipping asa
Company Sharecapital
Number ofshares
Owner-ship in%
Parvalue
Historicalcost
Bookvalue
Equity investment shares:
Farstad Shipping Ltd., Aberdeen £539 539 339 100 4 830 6 472 6 472
Farstad Supply AS, Ålesund 382 524 1 471 245 100 382 524 382 524 382 524
Farstad Brasil AS, Ålesund *) 617 100 100 100 617 100 640 107 -0
Farstad Australia AS, Ålesund *) 100 100 100 100 100 -
Farstad Africa AS, Ålesund 100 100 100 100 1 410 100
Farstad Shipping Aalesund AS, Ålesund *) 100 1 000 100 27 447 27 447 2 447
Farstad Shipping Pte Ltd, Singapore *) $59 418 58 470 002 100 392 695 392 695 159 695
Farstad Contruction AS, Ålesund *) 53 701 1 000 100 53 701 539 306 400 306
Farstad Offshore AS, Ålesund 177 100 1 000 100 177 100 209 200 38 478
Farstad Marine AS, Ålesund 669 000 1 000 000 100 669 000 805 000 -
Far Superior AS, Ålesund 30 30 000 100 30 30 30
Farstad do Brasil Navegacao Ltda., Macaé BRL 8 049 8 048 870 10 2 266 2 266 1 266
Shares in subsidiaries, total 2 326 893 3 006 557 991 318
Other shares 4 701 5 617 2 803
Shares and equity investment shares, total parent company 2 331 594 3 012 174 994 121
Group eliminations (2 326 893) (3 006 557) (991 318)
Total Group long-term shareholdings 4 701 5 617 2 803
Shares owned by subsidiaries:
Shares owned by Farstad Supply AS:Farstad International AS 100 100 100 100 100 100
Shares owned by Farstad Australia AS:Farstad Shipping (Indian Pacific) Pty.Ltd. AUD 11 220 9 997 528 100 68 454 68 454 -
Shares owned by Farstad Shipping (Indian Pacific) Pty.Ltd.:Farstad Shipping Offshore Simulator Centre Pty.Ltd. AUD 22.300 22 300 000 100 145 047 145 047 4 047
Shares owned by Farstad Africa AS:Quimbriz Farstad Shipping Lda. USD 25 500 49 69 69 69
Shares owned by Farstad Brasil AS:Farstad Shipping Ltda. BRL 143 417 143 416 720 100 578 641 578 641 -Farstad do Brasil Navegacao Ltda. BRL 8 049 8 048 870 90 20 392 20 392 11 192
Shares owned by Farstad Shipping Pte Ltd,:
Farstad Shipping Crewing Services Pte. Ltd. AUD 197 200 000 100 1 223 1 223 1 223
Current assets in the form of shares and equity certificates are included in current assets and entered at market value (from Oslo Stock exchange and Oslo Axess 30.12.16). Changes in the actual value are entered in the profit and loss account.
2016 Group Parent Company GroupHistorical cost Market-/Book value Market-/Book value
Cash and bank deposits 35 108 758 737
Money market funds - -
Total cash and cash equivalents 35 108 758 737
Shares outstanding and equity certificates (EC) 1 688 173 173
Shares and primary capital certificates, total - -
Other current financial assets 173 173
Total liquid assets 35 281 758 910
NOTE 17 – LIQUID ASSETS, SHARES IN SUBSIDIARIES AND OTHER SHARES
*) The Parent company has made an impairment of NOK 1,038,206 of investments in subsidiaries in 2016. (NOK 975,722 in 2015)

46 annual report 2016 - notes - farstad shipping asa
NOTE 18 – ACCOUNTS RECEIVABLE
Parent Company Farstad Shipping ASA Group
2015 2016 2016 2015
147 598 Accounts receivable 337 645 517 627
MOVEMENT IN PROVISION FOR LOSSES:
Parent Company Farstad Shipping ASA Group
2015 2016 2016 2015
- - Provision for losses as per 1 January - -
- - This year's provisions 3 039 -
- - Impairment during the year - -
- - Reversed provisions - -
- - Provision for losses at 31 December 3 039 -
Parent Company Farstad Shipping ASA Group
2015 2016 Note 2016 2015
4 009 2 081 Loans to employees 26 3 682 6 085
6 321 8 177 Prepaid costs 71 418 77 397
120 984 198 072 Other short-term receivables 123 270 135 383
- - Currency and interest swap derivatives 8 1 262 2 790
131 314 208 330 199 632 221 655
Parent Company Farstad Shipping ASA Group
2015 2016 Note 2016 2015
16 743 14 990 Tax deduction, holiday pay, days of grace, VAT, etc. 176 604 255 345
7 626 7 826 Accrued interest on mortgage debt and bonds 121 790 121 032
70 997 43 981 Other current liabilities 118 869 220 773
11 360 3 231 Currency and interest swap derivatives 8 74 698 234 400
106 726 70 028 491 961 831 550
Of total provisions for losses, NOK 2.3 million relates to earned freight income for vessels that worked for the Norwegian company EMAS-AMC AS that went into administration as per 28 February 2017. The credit risk and foreign currency risk associated with accounts receivables are discussed in more detail in note 8, financial risks.
NOTE 19 – OTHER SHORT-TERM RECEIVABLES
NOTE 20 – OTHER CURRENT LIABILITIES
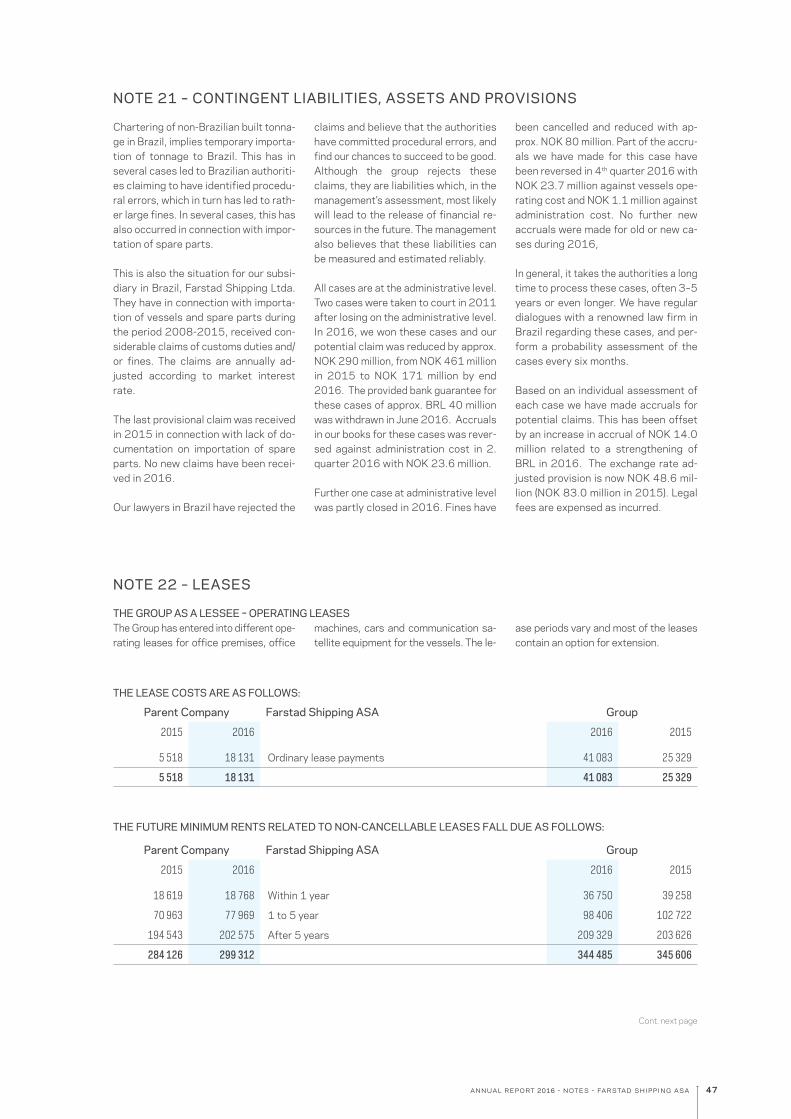
47annual report 2016 - notes - farstad shipping asa
NOTE 21 – CONTINGENT LIABILITIES, ASSETS AND PROVISIONS
Chartering of non-Brazilian built tonna-ge in Brazil, implies temporary importa-tion of tonnage to Brazil. This has in several cases led to Brazilian authoriti-es claiming to have identified procedu-ral errors, which in turn has led to rath-er large fines. In several cases, this has also occurred in connection with impor-tation of spare parts.
This is also the situation for our subsi-diary in Brazil, Farstad Shipping Ltda. They have in connection with importa-tion of vessels and spare parts during the period 2008-2015, received con-siderable claims of customs duties and/or fines. The claims are annually ad-justed according to market interest rate.
The last provisional claim was received in 2015 in connection with lack of do-cumentation on importation of spare parts. No new claims have been recei-ved in 2016.
Our lawyers in Brazil have rejected the
claims and believe that the authorities have committed procedural errors, and find our chances to succeed to be good. Although the group rejects these claims, they are liabilities which, in the management’s assessment, most likely will lead to the release of financial re-sources in the future. The management also believes that these liabilities can be measured and estimated reliably.
All cases are at the administrative level. Two cases were taken to court in 2011 after losing on the administrative level. In 2016, we won these cases and our potential claim was reduced by approx. NOK 290 million, from NOK 461 million in 2015 to NOK 171 million by end 2016. The provided bank guarantee for these cases of approx. BRL 40 million was withdrawn in June 2016. Accruals in our books for these cases was rever-sed against administration cost in 2. quarter 2016 with NOK 23.6 million.
Further one case at administrative level was partly closed in 2016. Fines have
been cancelled and reduced with ap-prox. NOK 80 million. Part of the accru-als we have made for this case have been reversed in 4th quarter 2016 with NOK 23.7 million against vessels ope-rating cost and NOK 1.1 million against administration cost. No further new accruals were made for old or new ca-ses during 2016,
In general, it takes the authorities a long time to process these cases, often 3–5 years or even longer. We have regular dialogues with a renowned law firm in Brazil regarding these cases, and per-form a probability assessment of the cases every six months.
Based on an individual assessment of each case we have made accruals for potential claims. This has been offset by an increase in accrual of NOK 14.0 million related to a strengthening of BRL in 2016. The exchange rate ad-justed provision is now NOK 48.6 mil-lion (NOK 83.0 million in 2015). Legal fees are expensed as incurred.
THE GROUP AS A LESSEE – OPERATING LEASES The Group has entered into different ope-rating leases for office premises, office
machines, cars and communication sa-tellite equipment for the vessels. The le-
ase periods vary and most of the leases contain an option for extension.
THE LEASE COSTS ARE AS FOLLOWS:
Parent Company Farstad Shipping ASA Group
2015 2016 2016 2015
5 518 18 131 Ordinary lease payments 41 083 25 329
5 518 18 131 41 083 25 329
THE FUTURE MINIMUM RENTS RELATED TO NON-CANCELLABLE LEASES FALL DUE AS FOLLOWS:
Parent Company Farstad Shipping ASA Group
2015 2016 2016 2015
18 619 18 768 Within 1 year 36 750 39 258
70 963 77 969 1 to 5 year 98 406 102 722
194 543 202 575 After 5 years 209 329 203 626
284 126 299 312 344 485 345 606
NOTE 22 – LEASES
Cont. next page

48 annual report 2016 - notes - farstad shipping asa
THE GROUP AS A LESSOR OF VESSELS – OPERATING LEASES The table below shows future minimum receivable lease payments under opera-ting leases (Time Charter contracts). The figures are nominal and include lea-
se of vessels. Future receivable pay-ments are revised upwards according to an expected average escalation of 2% (annual) in the operating leases. Table
below includes sublease of office pre-mises from the parent company.
THE ASSETS UNDER FINANCIAL LEASE AGREEMENTS ARE AS FOLLOWS:
Parent Company Farstad Shipping ASA Group
2015 2016 2016 2015
- - Acquistion cost vessels January 1st 1 208 352 1 208 149
- Increase in acquisition cost 7 286 203
- - Government grants, environmental investment - -
Acquistion cost vessels December 31st 1 215 638 1 208 352
- - Accumulated depreciation (120 492) (81 302)
- - Net book value 1 095 146 1 127 050
Book value of vessels leased is included in note 16.
Parent Company Farstad Shipping ASA Group
2015 2016 2016 2015
- 4 154 Within 1 year 1 824 620 2 709 722
- 19 408 1 to 5 year 1 848 423 3 696 242
- 690 After 5 years 690 79 149
- 24 252 3 673 733 6 485 113
OVERVIEW OF FUTURE PAYMENTS:
Parent Company Farstad Shipping ASA Group
2015 2016 2 016 2 015
- - Within 1 year 48 961 46 206
- - 1 to 5 year 1 015 302 1 064 263
- - After 5 years - -
- - 1 064 263 1 110 469
OVERVIEW OF FUTURE MINIMUM LEASE PAYMENTS:
Parent Company Farstad Shipping ASA Group
2015 2016 2016 2015
- - Within 1 year 138 700 140 255
- - 1 to 5 year 1 206 745 1 345 445
- - After 5 years - -
- - 1 345 445 1 485 700
- - Interest costs (281 182) (375 231)
- - Future payments 1 064 263 1 110 469
THE GROUP AS A LESSEE – FINANCIAL LEASESThe Group has an agreement with Ocean Yield ASA to lease two AHTS of
UT731 CD design on a 12 years bare-boat charter. The Group has, at given
time, options to buy back the vessels.
NOTE 22 – LEASES CONT.
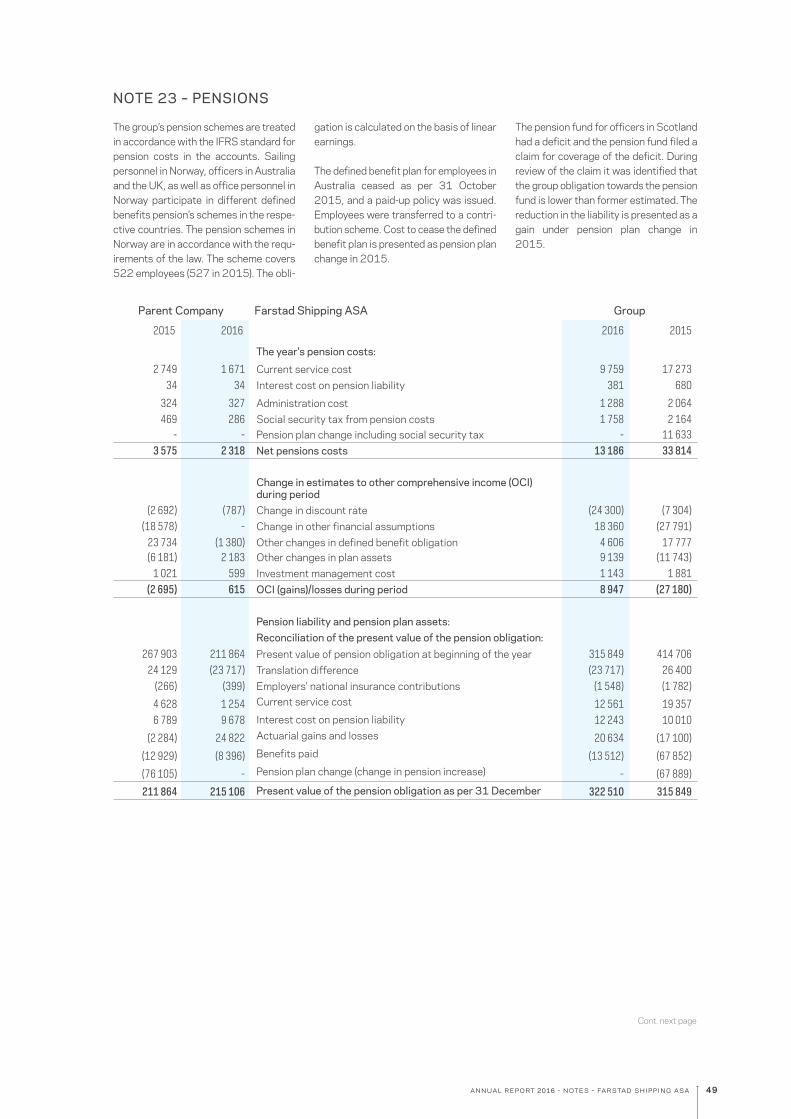
49annual report 2016 - notes - farstad shipping asa
NOTE 23 – PENSIONS
The group’s pension schemes are treated in accordance with the IFRS standard for pension costs in the accounts. Sailing personnel in Norway, officers in Australia and the UK, as well as office personnel in Norway participate in different defined benefits pension’s schemes in the respe-ctive countries. The pension schemes in Norway are in accordance with the requ-irements of the law. The scheme covers 522 employees (527 in 2015). The obli-
gation is calculated on the basis of linear earnings.
The defined benefit plan for employees in Australia ceased as per 31 October 2015, and a paid-up policy was issued. Employees were transferred to a contri-bution scheme. Cost to cease the defined benefit plan is presented as pension plan change in 2015.
The pension fund for officers in Scotland had a deficit and the pension fund filed a claim for coverage of the deficit. During review of the claim it was identified that the group obligation towards the pension fund is lower than former estimated. The reduction in the liability is presented as a gain under pension plan change in 2015.
Cont. next page
Parent Company Farstad Shipping ASA Group
2015 2016 2016 2015
The year's pension costs:
2 749 1 671 Current service cost 9 759 17 273 34 34 Interest cost on pension liability 381 680
324 327 Administration cost 1 288 2 064 469 286 Social security tax from pension costs 1 758 2 164
- - Pension plan change including social security tax - 11 633 3 575 2 318 Net pensions costs 13 186 33 814
Change in estimates to other comprehensive income (OCI) during period
(2 692) (787) Change in discount rate (24 300) (7 304) (18 578) - Change in other financial assumptions 18 360 (27 791)
23 734 (1 380) Other changes in defined benefit obligation 4 606 17 777 (6 181) 2 183 Other changes in plan assets 9 139 (11 743)
1 021 599 Investment management cost 1 143 1 881 (2 695) 615 OCI (gains)/losses during period 8 947 (27 180)
Pension liability and pension plan assets:Reconciliation of the present value of the pension obligation:
267 903 211 864 Present value of pension obligation at beginning of the year 315 849 414 706 24 129 (23 717) Translation difference (23 717) 26 400
(266) (399) Employers' national insurance contributions (1 548) (1 782)
4 628 1 254 Current service cost 12 561 19 357 6 789 9 678 Interest cost on pension liability 12 243 10 010
(2 284) 24 822 Actuarial gains and losses 20 634 (17 100)
(12 929) (8 396) Benefits paid (13 512) (67 852)
(76 105) - Pension plan change (change in pension increase) - (67 889)
211 864 215 106 Present value of the pension obligation as per 31 December 322 510 315 849
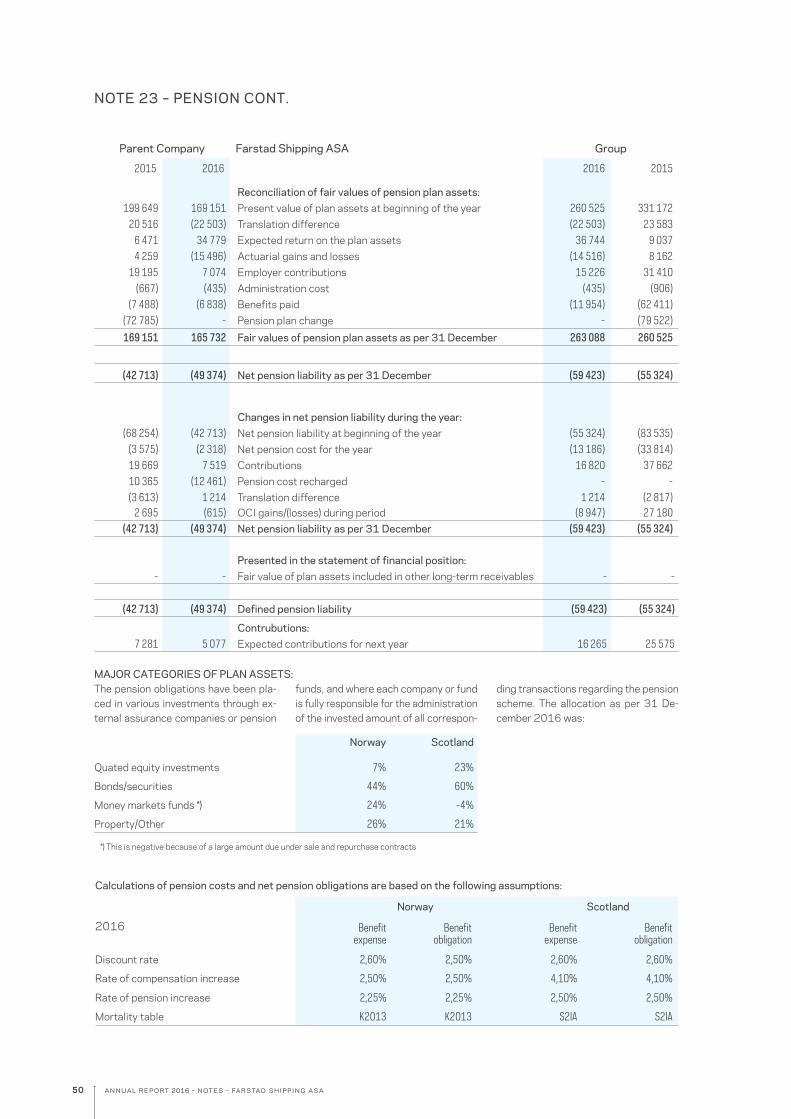
50 annual report 2016 - notes - farstad shipping asa
NOTE 23 – PENSION CONT.
Calculations of pension costs and net pension obligations are based on the following assumptions:
Norway Scotland
2016 Benefitexpense
Benefitobligation
Benefitexpense
Benefitobligation
Discount rate 2,60% 2,50% 2,60% 2,60%
Rate of compensation increase 2,50% 2,50% 4,10% 4,10%
Rate of pension increase 2,25% 2,25% 2,50% 2,50%
Mortality table K2013 K2013 S2IA S2IA
Norway Scotland
Quated equity investments 7% 23%
Bonds/securities 44% 60%
Money markets funds *) 24% -4%
Property/Other 26% 21%
MAJOR CATEGORIES OF PLAN ASSETS:The pension obligations have been pla-ced in various investments through ex-ternal assurance companies or pension
funds, and where each company or fund is fully responsible for the administration of the invested amount of all correspon-
ding transactions regarding the pension scheme. The allocation as per 31 De-cember 2016 was:
Parent Company Farstad Shipping ASA Group
2015 2016 2016 2015
Reconciliation of fair values of pension plan assets: 199 649 169 151 Present value of plan assets at beginning of the year 260 525 331 172
20 516 (22 503) Translation difference (22 503) 23 583 6 471 34 779 Expected return on the plan assets 36 744 9 037 4 259 (15 496) Actuarial gains and losses (14 516) 8 162
19 195 7 074 Employer contributions 15 226 31 410 (667) (435) Administration cost (435) (906)
(7 488) (6 838) Benefits paid (11 954) (62 411) (72 785) - Pension plan change - (79 522) 169 151 165 732 Fair values of pension plan assets as per 31 December 263 088 260 525
(42 713) (49 374) Net pension liability as per 31 December (59 423) (55 324)
Changes in net pension liability during the year: (68 254) (42 713) Net pension liability at beginning of the year (55 324) (83 535)
(3 575) (2 318) Net pension cost for the year (13 186) (33 814) 19 669 7 519 Contributions 16 820 37 662 10 365 (12 461) Pension cost recharged - - (3 613) 1 214 Translation difference 1 214 (2 817)
2 695 (615) OCI gains/(losses) during period (8 947) 27 180 (42 713) (49 374) Net pension liability as per 31 December (59 423) (55 324)
Presented in the statement of financial position: - - Fair value of plan assets included in other long-term receivables - -
(42 713) (49 374) Defined pension liability (59 423) (55 324)
Contrubutions: 7 281 5 077 Expected contributions for next year 16 265 25 575
*) This is negative because of a large amount due under sale and repurchase contracts
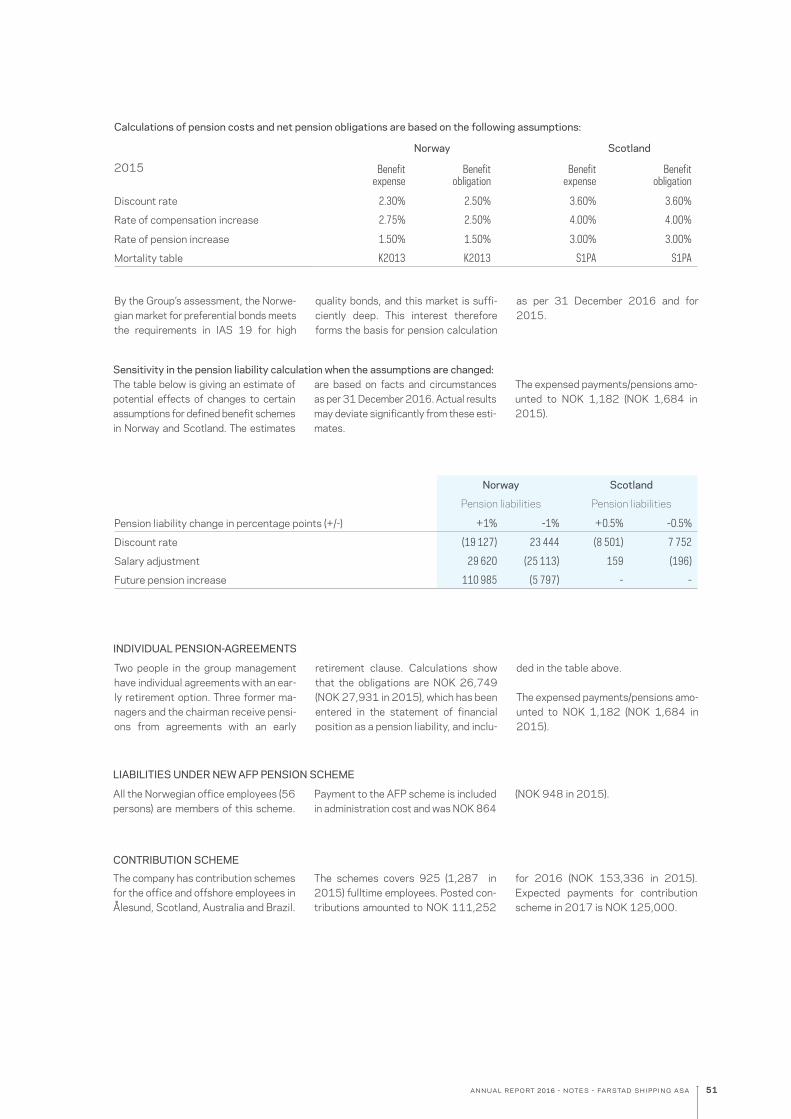
51annual report 2016 - notes - farstad shipping asa
By the Group’s assessment, the Norwe-gian market for preferential bonds meets the requirements in IAS 19 for high
quality bonds, and this market is suffi- ciently deep. This interest therefore forms the basis for pension calculation
as per 31 December 2016 and for 2015.
Sensitivity in the pension liability calculation when the assumptions are changed:The table below is giving an estimate of potential effects of changes to certain assumptions for defined benefit schemes in Norway and Scotland. The estimates
are based on facts and circumstances as per 31 December 2016. Actual results may deviate significantly from these esti- mates.
The expensed payments/pensions amo-unted to NOK 1,182 (NOK 1,684 in 2015).
All the Norwegian office employees (56 persons) are members of this scheme.
Payment to the AFP scheme is included in administration cost and was NOK 864
(NOK 948 in 2015).
The company has contribution schemes for the office and offshore employees in Ålesund, Scotland, Australia and Brazil.
The schemes covers 925 (1,287 in 2015) fulltime employees. Posted con-tributions amounted to NOK 111,252
for 2016 (NOK 153,336 in 2015). Expected payments for contribution scheme in 2017 is NOK 125,000.
CONTRIBUTION SCHEME
LIABILITIES UNDER NEW AFP PENSION SCHEME
INDIVIDUAL PENSION-AGREEMENTS
Norway Scotland
Pension liabilities Pension liabilities
Pension liability change in percentage points (+/-) +1% -1% +0.5% -0.5%
Discount rate (19 127) 23 444 (8 501) 7 752
Salary adjustment 29 620 (25 113) 159 (196)
Future pension increase 110 985 (5 797) - -
Two people in the group management have individual agreements with an ear-ly retirement option. Three former ma-nagers and the chairman receive pensi-ons from agreements with an early
retirement clause. Calculations show that the obligations are NOK 26,749 (NOK 27,931 in 2015), which has been entered in the statement of financial position as a pension liability, and inclu-
ded in the table above.
The expensed payments/pensions amo-unted to NOK 1,182 (NOK 1,684 in 2015).
Calculations of pension costs and net pension obligations are based on the following assumptions:
Norway Scotland
2015 Benefitexpense
Benefitobligation
Benefitexpense
Benefitobligation
Discount rate 2.30% 2.50% 3.60% 3.60%
Rate of compensation increase 2.75% 2.50% 4.00% 4.00%
Rate of pension increase 1.50% 1.50% 3.00% 3.00%
Mortality table K2013 K2013 S1PA S1PA

52 annual report 2016 - notes - farstad shipping asa
NOTE 25 – RELATED PARTIES
Farstad Shipping ASA is the Group’s parent company, and all subsidiaries listed in note 17 are considered related parties. The Group has several transa-ctions towards related parties, this con-cerns crew hire, management services for vessel operations, as well as mana-gement, accounting and group services. For the parent company, the income from these services was NOK 168,834 (NOK 183,381 in 2015). The parent company has also given loans and gua-rantees to subsidiaries, see note 7 and 24. All transactions are based on the arm’s length principle.
Other associations with related parties:The company`s largest shareholder is Tyrholm & Farstad AS in Ålesund with a
holding of 40.5% and is defined as a related party. Farstad Shipping ASA had a lease agreement for the old main office premises in Aalesund with Tyrholm & Farstad AS, covering the period from 1 January 2013 to 29.02.16. Pursuant to this agreement the Group has paid NOK 744 in 2016 up to and including 29 February 2016. (NOK 4,543 in 2015.) The company’s head office was relocated 08.02.16 to new office pre-mises at Skansekaia 4A. The lessor is Skansekaia Utvikling AS, where Tyrholm & Farstad AS holds 33.3%. Annual cost for the new premises is NOK 15,347, of which NOK 1,277 is subleased from 1
April 2016 and NOK 1,063 is subleased from 1 September 2016.
In addition, Farstad Shipping ASA has purchased cargo freight and customs clearance services from Tyrholm & Far-stad AS at a total of NOK 10,550 (NOK 8,889 in 2015). As per 31 December 2016 the company had a debt of NOK 119 (NOK 238 in 2015) payable to Tyr-holm & Farstad AS.
The Deputy Chairman of the Board as per 31 December 2016, Per Norvald Sperre, was earlier a partner in the law firm Schjødt DA. The company has ser-ved the Group with services of NOK 0 in 2016 (NOK 370 in 2015.) The group has been served with services of NOK 55 in 2016 from his law practice Advo-kat Per Sperre. The transactions are made on market terms as between inde-
* The parent company has made a provision for loss of NOK 208,337 relating to long-term receivables.
NOTE 24 – RECEIVABLE AND LIABILITIES - GROUP COMPANIES
LONG-TERM INTERCOMPANY BALANCES WITH CONDITIONS
Parent Company - Farstad Shipping ASA 31.12.16 31.12.15 Interest conditions
Long-term receivables
Farstad Brasil AS* 20 898 19 897 3 months NIBOR + 3,75% margin
Farstad Shipping Ltda* 124 990 145 349 6 months USD LIBOR +3,75% margin
Farstad Shipping Ltda 62 000 62 000 6 months NIBOR + 3,75% margin
Farstad Australia AS* 55 854 16 787 3 months NIBOR + 3,75% margin
Farstad Construction AS 338 100 311 600 3 months NIBOR + 3,75% margin
Farstad Offshore AS 100 000 120 000 3 months NIBOR + 3,75% margin
Farstad Marine AS* 106 500 - 3 months NIBOR + 3,75% margin
FarInvest AS - 27 000 3 months NIBOR + 1,00% margin
808 342 702 632
Non-current liabilities
Farstad International AS 65 000 65 000 3 months NIBOR + 3.00% margin
65 000 65 000
INTERCOMPANY BALANCES
Parent Company - Farstad Shipping ASA 31.12.16 31.12.15
Long-term receivables* 600 005 702 632
Other short-term receivables 187 298 106 605
Non-current liabilities (65 000) (65 000)
Accounts payables (17 435) (24 607)
704 868 719 630
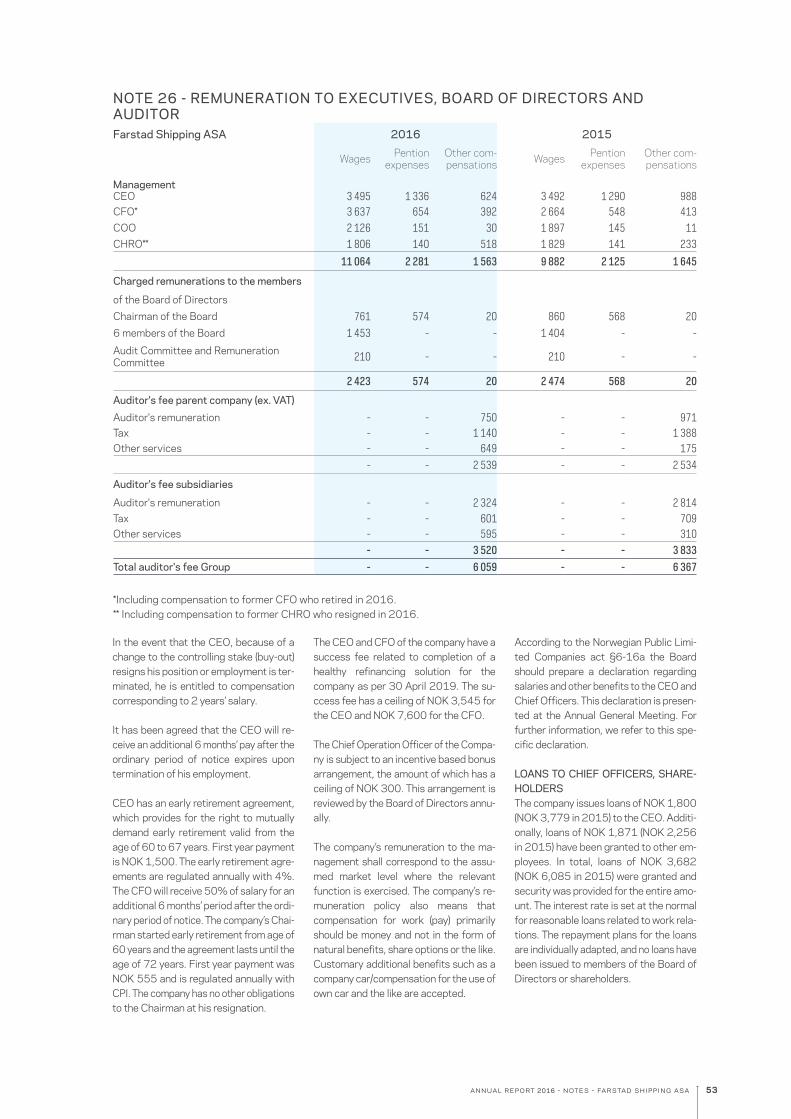
53annual report 2016 - notes - farstad shipping asa
NOTE 26 - REMUNERATION TO EXECUTIVES, BOARD OF DIRECTORS AND AUDITORFarstad Shipping ASA 2016 2015
Wages Pention expenses
Other com- pensations Wages Pention
expensesOther com- pensations
ManagementCEO 3 495 1 336 624 3 492 1 290 988CFO* 3 637 654 392 2 664 548 413COO 2 126 151 30 1 897 145 11CHRO** 1 806 140 518 1 829 141 233
11 064 2 281 1 563 9 882 2 125 1 645
Charged remunerations to the members
of the Board of DirectorsChairman of the Board 761 574 20 860 568 206 members of the Board 1 453 - - 1 404 - - Audit Committee and Remuneration Committee 210 - - 210 - -
2 423 574 20 2 474 568 20
Auditor's fee parent company (ex. VAT)Auditor's remuneration - - 750 - - 971Tax - - 1 140 - - 1 388Other services - - 649 - - 175
- - 2 539 - - 2 534
Auditor's fee subsidiaries
Auditor's remuneration - - 2 324 - - 2 814Tax - - 601 - - 709Other services - - 595 - - 310
- - 3 520 - - 3 833Total auditor's fee Group - - 6 059 - - 6 367
In the event that the CEO, because of a change to the controlling stake (buy-out) resigns his position or employment is ter-minated, he is entitled to compensation corresponding to 2 years’ salary.
It has been agreed that the CEO will re-ceive an additional 6 months’ pay after the ordinary period of notice expires upon termination of his employment.
CEO has an early retirement agreement, which provides for the right to mutually demand early retirement valid from the age of 60 to 67 years. First year payment is NOK 1,500. The early retirement agre-ements are regulated annually with 4%. The CFO will receive 50% of salary for an additional 6 months’ period after the ordi-nary period of notice. The company’s Chai-rman started early retirement from age of 60 years and the agreement lasts until the age of 72 years. First year payment was NOK 555 and is regulated annually with CPI. The company has no other obligations to the Chairman at his resignation.
The CEO and CFO of the company have a success fee related to completion of a healthy refinancing solution for the company as per 30 April 2019. The su-ccess fee has a ceiling of NOK 3,545 for the CEO and NOK 7,600 for the CFO.
The Chief Operation Officer of the Compa-ny is subject to an incentive based bonus arrangement, the amount of which has a ceiling of NOK 300. This arrangement is reviewed by the Board of Directors annu-ally.
The company’s remuneration to the ma-nagement shall correspond to the assu-med market level where the relevant function is exercised. The company’s re-muneration policy also means that compensation for work (pay) primarily should be money and not in the form of natural benefits, share options or the like. Customary additional benefits such as a company car/compensation for the use of own car and the like are accepted.
According to the Norwegian Public Limi-ted Companies act §6-16a the Board should prepare a declaration regarding salaries and other benefits to the CEO and Chief Officers. This declaration is presen-ted at the Annual General Meeting. For further information, we refer to this spe-cific declaration.
LOANS TO CHIEF OFFICERS, SHARE-HOLDERSThe company issues loans of NOK 1,800 (NOK 3,779 in 2015) to the CEO. Additi-onally, loans of NOK 1,871 (NOK 2,256 in 2015) have been granted to other em-ployees. In total, loans of NOK 3,682 (NOK 6,085 in 2015) were granted and security was provided for the entire amo-unt. The interest rate is set at the normal for reasonable loans related to work rela-tions. The repayment plans for the loans are individually adapted, and no loans have been issued to members of the Board of Directors or shareholders.
*Including compensation to former CFO who retired in 2016.** Including compensation to former CHRO who resigned in 2016.
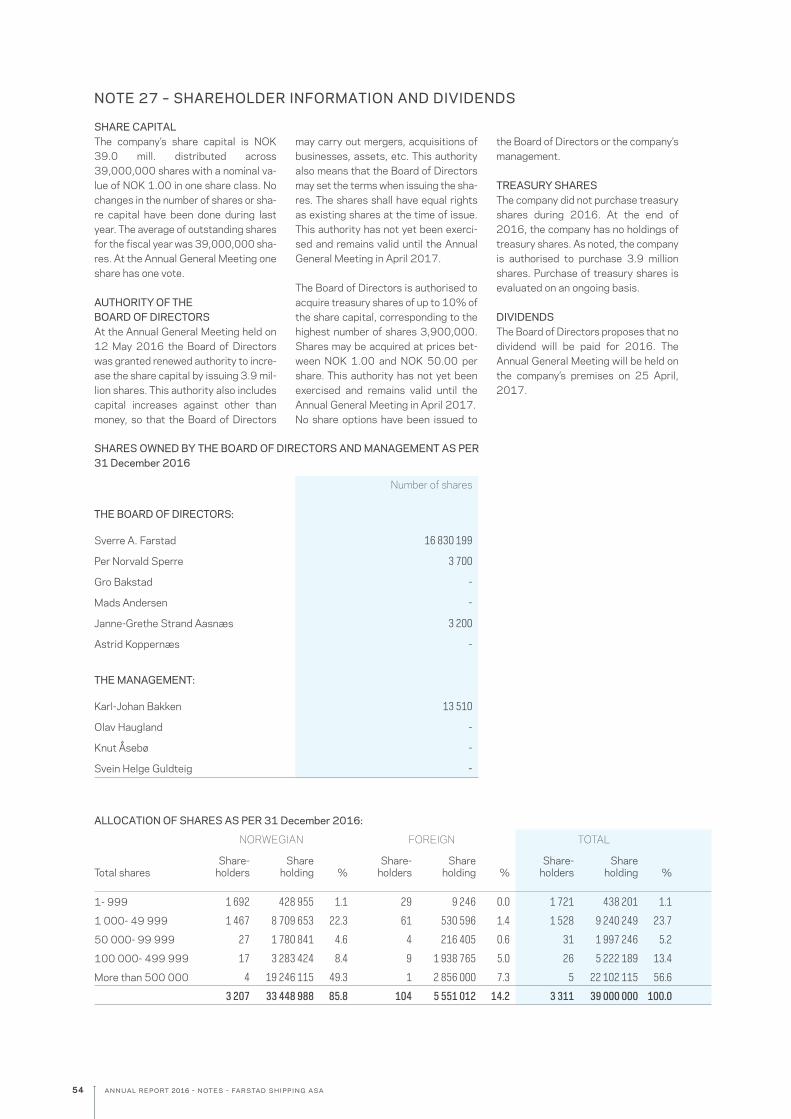
54 annual report 2016 - notes - farstad shipping asa
ALLOCATION OF SHARES AS PER 31 December 2016:
NORWEGIAN FOREIGN TOTAL
Total sharesShare-
holdersShare
holding %Share-
holdersShare
holding %Share-
holdersShare
holding %
1- 999 1 692 428 955 1.1 29 9 246 0.0 1 721 438 201 1.1
1 000- 49 999 1 467 8 709 653 22.3 61 530 596 1.4 1 528 9 240 249 23.7
50 000- 99 999 27 1 780 841 4.6 4 216 405 0.6 31 1 997 246 5.2
100 000- 499 999 17 3 283 424 8.4 9 1 938 765 5.0 26 5 222 189 13.4
More than 500 000 4 19 246 115 49.3 1 2 856 000 7.3 5 22 102 115 56.6
3 207 33 448 988 85.8 104 5 551 012 14.2 3 311 39 000 000 100.0
SHARES OWNED BY THE BOARD OF DIRECTORS AND MANAGEMENT AS PER 31 December 2016
Number of shares
THE BOARD OF DIRECTORS:
Sverre A. Farstad 16 830 199
Per Norvald Sperre 3 700
Gro Bakstad -
Mads Andersen -
Janne-Grethe Strand Aasnæs 3 200
Astrid Koppernæs -
THE MANAGEMENT:
Karl-Johan Bakken 13 510
Olav Haugland -
Knut Åsebø -
Svein Helge Guldteig -
NOTE 27 – SHAREHOLDER INFORMATION AND DIVIDENDS
SHARE CAPITALThe company’s share capital is NOK 39.0 mill. distributed across 39,000,000 shares with a nominal va-lue of NOK 1.00 in one share class. No changes in the number of shares or sha-re capital have been done during last year. The average of outstanding shares for the fiscal year was 39,000,000 sha-res. At the Annual General Meeting one share has one vote.
AUTHORITY OF THE BOARD OF DIRECTORSAt the Annual General Meeting held on 12 May 2016 the Board of Directors was granted renewed authority to incre-ase the share capital by issuing 3.9 mil-lion shares. This authority also includes capital increases against other than money, so that the Board of Directors
may carry out mergers, acquisitions of businesses, assets, etc. This authority also means that the Board of Directors may set the terms when issuing the sha-res. The shares shall have equal rights as existing shares at the time of issue. This authority has not yet been exerci-sed and remains valid until the Annual General Meeting in April 2017.
The Board of Directors is authorised to acquire treasury shares of up to 10% of the share capital, corresponding to the highest number of shares 3,900,000. Shares may be acquired at prices bet-ween NOK 1.00 and NOK 50.00 per share. This authority has not yet been exercised and remains valid until the Annual General Meeting in April 2017.No share options have been issued to
the Board of Directors or the company’s management.
TREASURY SHARESThe company did not purchase treasury shares during 2016. At the end of 2016, the company has no holdings of treasury shares. As noted, the company is authorised to purchase 3.9 million shares. Purchase of treasury shares is evaluated on an ongoing basis.
DIVIDENDSThe Board of Directors proposes that no dividend will be paid for 2016. The Annual General Meeting will be held on the company’s premises on 25 April, 2017.
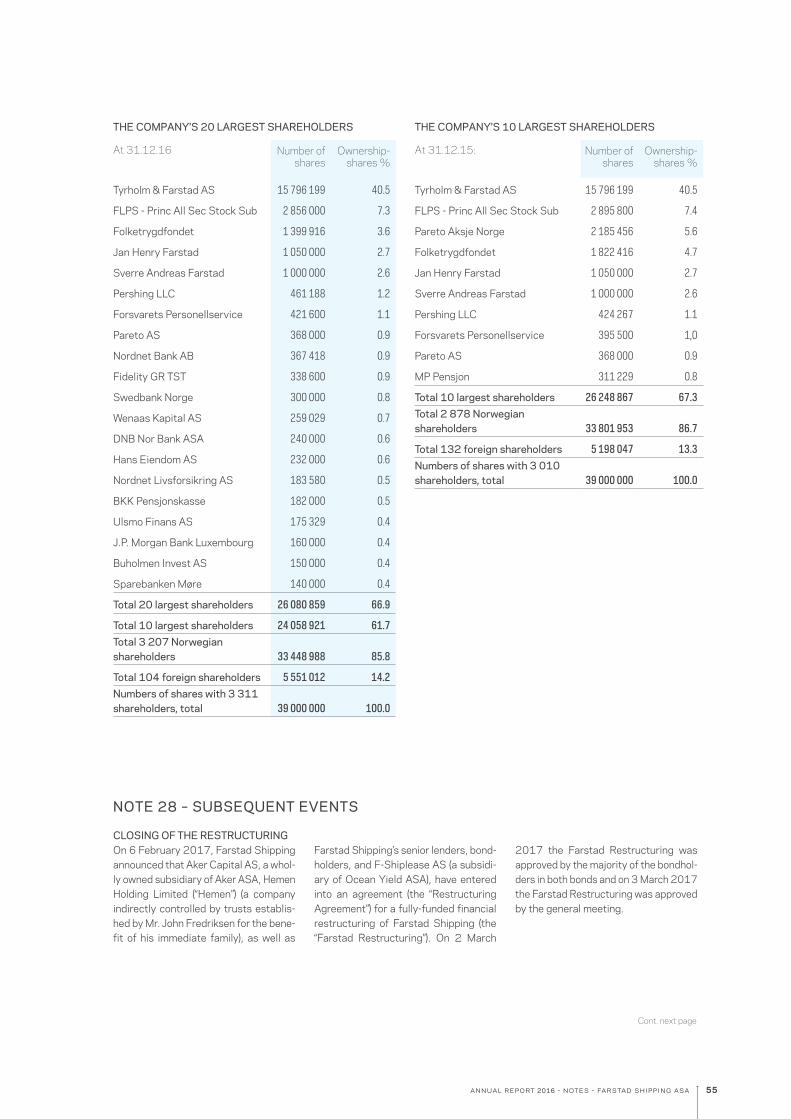
55annual report 2016 - notes - farstad shipping asa
THE COMPANY'S 10 LARGEST SHAREHOLDERS
At 31.12.15: Number of shares
Ownership- shares %
Tyrholm & Farstad AS 15 796 199 40.5
FLPS - Princ All Sec Stock Sub 2 895 800 7.4
Pareto Aksje Norge 2 185 456 5.6
Folketrygdfondet 1 822 416 4.7
Jan Henry Farstad 1 050 000 2.7
Sverre Andreas Farstad 1 000 000 2.6
Pershing LLC 424 267 1.1
Forsvarets Personellservice 395 500 1,0
Pareto AS 368 000 0.9
MP Pensjon 311 229 0.8
Total 10 largest shareholders 26 248 867 67.3Total 2 878 Norwegianshareholders 33 801 953 86.7
Total 132 foreign shareholders 5 198 047 13.3Numbers of shares with 3 010 shareholders, total 39 000 000 100.0
THE COMPANY'S 20 LARGEST SHAREHOLDERS
At 31.12.16 Number of shares
Ownership- shares %
Tyrholm & Farstad AS 15 796 199 40.5
FLPS - Princ All Sec Stock Sub 2 856 000 7.3
Folketrygdfondet 1 399 916 3.6
Jan Henry Farstad 1 050 000 2.7
Sverre Andreas Farstad 1 000 000 2.6
Pershing LLC 461 188 1.2
Forsvarets Personellservice 421 600 1.1
Pareto AS 368 000 0.9
Nordnet Bank AB 367 418 0.9
Fidelity GR TST 338 600 0.9
Swedbank Norge 300 000 0.8
Wenaas Kapital AS 259 029 0.7
DNB Nor Bank ASA 240 000 0.6
Hans Eiendom AS 232 000 0.6
Nordnet Livsforsikring AS 183 580 0.5
BKK Pensjonskasse 182 000 0.5
Ulsmo Finans AS 175 329 0.4
J.P. Morgan Bank Luxembourg 160 000 0.4
Buholmen Invest AS 150 000 0.4
Sparebanken Møre 140 000 0.4
Total 20 largest shareholders 26 080 859 66.9
Total 10 largest shareholders 24 058 921 61.7Total 3 207 Norwegian shareholders 33 448 988 85.8
Total 104 foreign shareholders 5 551 012 14.2Numbers of shares with 3 311 shareholders, total 39 000 000 100.0
NOTE 28 – SUBSEQUENT EVENTS
CLOSING OF THE RESTRUCTURINGOn 6 February 2017, Farstad Shipping announced that Aker Capital AS, a whol-ly owned subsidiary of Aker ASA, Hemen Holding Limited (“Hemen”) (a company indirectly controlled by trusts establis-hed by Mr. John Fredriksen for the bene- fit of his immediate family), as well as
Farstad Shipping’s senior lenders, bond-holders, and F-Shiplease AS (a subsidi-ary of Ocean Yield ASA), have entered into an agreement (the “Restructuring Agreement”) for a fully-funded financial restructuring of Farstad Shipping (the “Farstad Restructuring”). On 2 March
2017 the Farstad Restructuring was approved by the majority of the bondhol-ders in both bonds and on 3 March 2017 the Farstad Restructuring was approved by the general meeting.
Cont. next page
56 annual report 2016 - notes - farstad shipping asa
NOTE 28 – SUBSEQUENT EVENTS CONT.
Farstad Restructuring consist of the following elements:
(i) Farstad Shipping’s creditors converted existing and future debt claims to equity (the “Debt Conversion”) Under the Debt Conversion, Farstad Shipping’s senior lenders, bondholders and F-Shiplease AS have completed a debt to equity conversion as follows:
a) Farstad Shipping ASA assumed debt owing by its subsidiaries to certain senior lenders in the amount of NOK 940 million and the senior lenders have converted NOK 940 million into 752,000,000 new shares in Farstad Shipping at a price of NOK 1.25 per share.
b) The senior lenders released Farstad Shipping’s subsidiaries of their obligation to pay NOK 332 million in future interest in exchange for a NOK 271 million claim against Farstad Shipping (equaling the net present value of such future interest payments), and the NOK 271 million claim is converted into 774,285,714 new shares of Farstad at a share price of NOK 0.35.
c) The outstanding bond debt in FAR03 and FAR04 with a total outstanding amount of NOK 1,407 million, repre- senting a principal of NOK 1,400 million plus interest in the amount of NOK 7 million is converted into 1,125,516,355 new shares of Farstad at share price NOK 1.25.
d) F-Shiplease AS have released Farstad Supply AS of its obligation to pay NOK 70 million of the ”amortisation” element and NOK 109 million of the ”interest” element of its two bare-boat leasing agreements with F-Shiplease, in exchange for a NOK 161 million claim against Farstad Shipping (equaling the sum of the NOK 70 million “amortisation” element and the net present value of the “interest” element being NOK 91 million). The NOK 70 million “amortisa- tion” element of the claim is converted into 56,000,000 new shares of Farstad at a price of NOK 1.25 per share, whereas the NOK 91 million “interest” element of the claim is converted into 259,595,760 new shares of Farstad Shipping at a share price of NOK 0.35.
(ii) Farstad Shipping have issued NOK 650 million of new equity fully underwritten by Aker and Hemen (the “Equity Issue”)
The Equity Issue, which was fully underwritten by Aker and Hemen on a 50:50 basis, consists of a NOK 400 million in share issue to Hemen and Aker and NOK 50 million in share issue to Tyrholm & Farstad Invest AS (an affiliate of Farstad Shipping’s main shareholder) (“Private Placement 1”), a NOK 150 million in share issue to Farstad Shipping’s bondholders (“Private Placement 2”) and a NOK 50 million repair issue to existing Farstad Shipping shareholders and bondholders who were not allocated shares in Private Placement 2 (the “Repair Issue”). The Repair Issue was only subscribed for NOK 29 million by Farstad Shipping’s shareholders and bondholders, the remaining was subscribed by Aker and Hemen on a 50:50 basis.The subscription price in the Equity Issue was NOK 0.35 per share.
(iii) The existing financing agreements of Farstad Shipping is amended (the “Farstad Amended Financing Terms”)
The terms and conditions of the existing financing agreements for Farstad Shipping (except for financing agreements with Westpac and BNDES) is amended and harmonised, including by adding the following features:
a) The amortisation profile of the loans (after adjustment for the amounts converted to equity) is reduced to 10% of the original profile from 01 January 2017 until 31 December 2021. Commencing in Q1 2022 the balance of amortising senior debt will become amortising in linear instalments of 20% per year, whereas senior loans with a bullet repayment profile will receive an extraordinary repayment of 4% in Q2 2019. The final maturity date for all loans (with maturity date prior to the new maturity date) will be extended to Q4 2023;
b) A cash sweep mechanism will be introduced;
c) In addition to certain financial covenants, restrictions will be introduced with respect to Farstad’s ability to pay dividends, incur new debt, carry out equity issues and make capital expenditures;
d) Minimum value clause at 100% across the group’s fleet (but suspended throughout 2019);
e) Removal of current ownership covenants;
f) Pre-approval of sale of older vessels at prices below secure debt using agreed mechanisms.
The Farstad Amended Financing Terms ensures that the Company is no longer in breach with its financial covenants and long term debt classified as current liabilities is reclassified as non-current liabilities. Total NOK 8,174 million is reclassified from current to Non-current liabilities after the Farstad Restructuring.
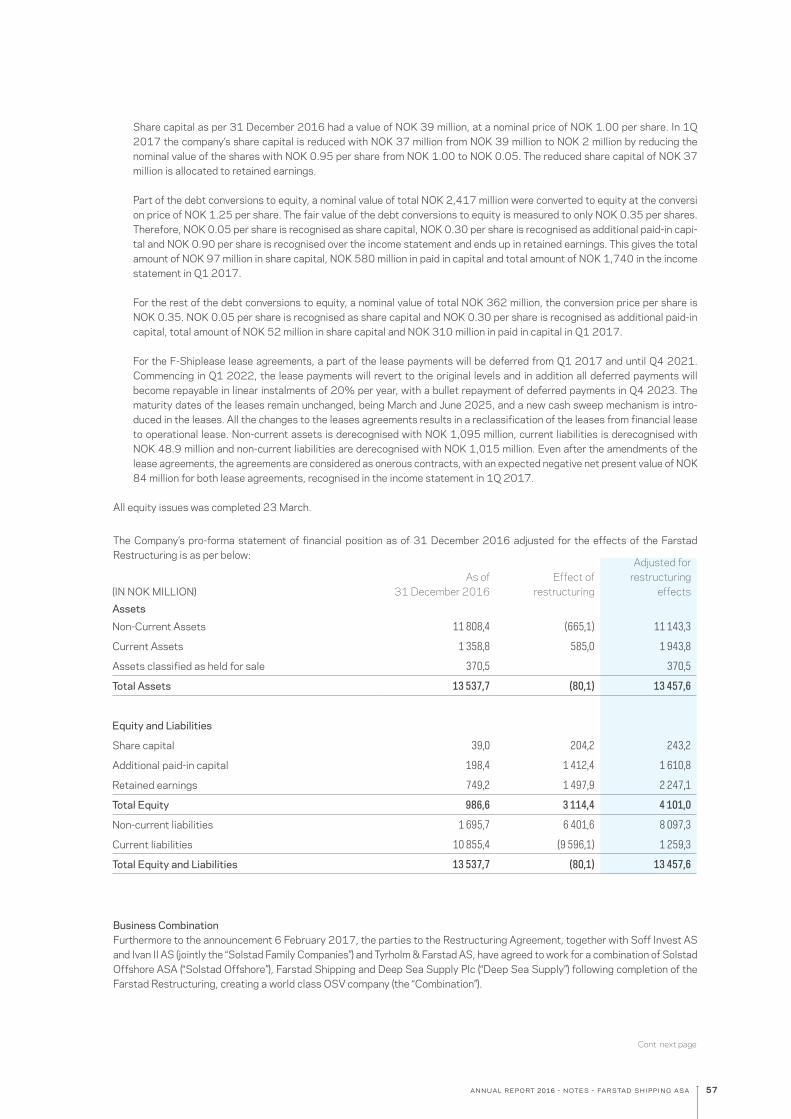
57annual report 2016 - notes - farstad shipping asa
Share capital as per 31 December 2016 had a value of NOK 39 million, at a nominal price of NOK 1.00 per share. In 1Q 2017 the company’s share capital is reduced with NOK 37 million from NOK 39 million to NOK 2 million by reducing the nominal value of the shares with NOK 0.95 per share from NOK 1.00 to NOK 0.05. The reduced share capital of NOK 37 million is allocated to retained earnings.
Part of the debt conversions to equity, a nominal value of total NOK 2,417 million were converted to equity at the conversi on price of NOK 1.25 per share. The fair value of the debt conversions to equity is measured to only NOK 0.35 per shares. Therefore, NOK 0.05 per share is recognised as share capital, NOK 0.30 per share is recognised as additional paid-in capi- tal and NOK 0.90 per share is recognised over the income statement and ends up in retained earnings. This gives the total amount of NOK 97 million in share capital, NOK 580 million in paid in capital and total amount of NOK 1,740 in the income statement in Q1 2017.
For the rest of the debt conversions to equity, a nominal value of total NOK 362 million, the conversion price per share is NOK 0.35. NOK 0.05 per share is recognised as share capital and NOK 0.30 per share is recognised as additional paid-in capital, total amount of NOK 52 million in share capital and NOK 310 million in paid in capital in Q1 2017.
For the F-Shiplease lease agreements, a part of the lease payments will be deferred from Q1 2017 and until Q4 2021. Commencing in Q1 2022, the lease payments will revert to the original levels and in addition all deferred payments will become repayable in linear instalments of 20% per year, with a bullet repayment of deferred payments in Q4 2023. The maturity dates of the leases remain unchanged, being March and June 2025, and a new cash sweep mechanism is intro- duced in the leases. All the changes to the leases agreements results in a reclassification of the leases from financial lease to operational lease. Non-current assets is derecognised with NOK 1,095 million, current liabilities is derecognised with NOK 48.9 million and non-current liabilities are derecognised with NOK 1,015 million. Even after the amendments of the lease agreements, the agreements are considered as onerous contracts, with an expected negative net present value of NOK 84 million for both lease agreements, recognised in the income statement in 1Q 2017.
All equity issues was completed 23 March.
Business CombinationFurthermore to the announcement 6 February 2017, the parties to the Restructuring Agreement, together with Soff Invest AS and Ivan II AS (jointly the “Solstad Family Companies”) and Tyrholm & Farstad AS, have agreed to work for a combination of Solstad Offshore ASA (“Solstad Offshore”), Farstad Shipping and Deep Sea Supply Plc (“Deep Sea Supply”) following completion of the Farstad Restructuring, creating a world class OSV company (the “Combination”).
Cont. next page
The Company’s pro-forma statement of financial position as of 31 December 2016 adjusted for the effects of the Farstad Restructuring is as per below:
(IN NOK MILLION)As of
31 December 2016Effect of
restructuring
Adjusted for restructuring
effectsAssets
Non-Current Assets 11 808,4 (665,1) 11 143,3
Current Assets 1 358,8 585,0 1 943,8
Assets classified as held for sale 370,5 370,5
Total Assets 13 537,7 (80,1) 13 457,6
Equity and Liabilities
Share capital 39,0 204,2 243,2
Additional paid-in capital 198,4 1 412,4 1 610,8
Retained earnings 749,2 1 497,9 2 247,1
Total Equity 986,6 3 114,4 4 101,0
Non-current liabilities 1 695,7 6 401,6 8 097,3
Current liabilities 10 855,4 (9 596,1) 1 259,3
Total Equity and Liabilities 13 537,7 (80,1) 13 457,6
58 annual report 2016 - farstad shipping asa
NOTE 28 – SUBSEQUENT EVENTS CONT.
The combination is proposed to be structured as follows:
(i) Deep Sea Supply and Farstad Shipping will merge into and be established as individual subsidiaries under Solstad Offshore, with shareholders of Deep Sea Supply and Farstad Shipping receiving shares in Solstad Offshore as consideration (the “Mergers”).
Under the Mergers, Farstad will merge with a newly incorporated subsidiary of Solstad Offshore and Farstad’s former shareholders will receive shares in Solstad Offshore as merger consideration. The exchange ratio in the Solstad Offshore / Farstad merger will be 0.35:12.50 Farstad shares per Solstad Offshore share.
Contemporaneously with the Solstad Offshore / Farstad merger, Deep Sea Supply will combine with Solstad Offshore in a merger or merger-like transaction whereby all of Deep Sea Supply’s assets, rights and obligations will ultimately be trans- ferred to a subsidiary of Solstad Offshore against consideration in the form of Solstad Offshore shares. The amount of Solstad Offshore consideration shares issued will be based on an agreed exchange ratio of 1.32:12.50 Deep Sea Supply shares per Solstad Offshore share.
(ii) The existing financing agreements of Solstad Offshore and Deep Sea Supply will be sought amended and harmonised with the Farstad Amended Financing Terms.
(iii) In connection with the Combination, Solstad Offshore will complete a NOK 200 million private placement directed towards Hemen at a subscription price of NOK 12.50 per share. The proceeds from the private placement will passed on by Solstad Offshore to the part of the new group comprising the former Deep Sea Supply operations.
(iv) Aker will convert its NOK 250 million convertible loan to Solstad Offshore in exchange for shares, such convertible loan having originally been granted to Solstad Offshore in 2016 together with a NOK 250 million equity investment by Aker in Solstad Offshore.
(v) Solstad Offshore’s dual share class structure will be collapsed, and all Class A and Class B shares will be converted to common shares on a 1:1 basis.
The transaction elements listed above are interdependent and will become effective simultaneously upon completion of the Combination. A merger plan between Farstad Shipping ASA (acquired) and Solship Invest 2 AS (acquiring), with shares in Solstad Offshore ASA, was approved by the boards of directors in the respective companies 24 of March. However, the Combination is not completed and it is subject to, among other things, agreement on final transaction documentation, competition authority approvals and relevant corporate resolutions.
The senior lenders in Farstad Shipping have undertaken to vote in favour of and otherwise support the Combination. Further, the senior lenders have undertaken a lockup obligation preventing them from selling their shares in Farstad Shipping until such time
FLEETThe subsea/construction vessel Far Superior, VARD 3 17 design, was de-livered from VARD Vung Tau, Vietnam 16 January 2017. The vessel went first on a bareboat contract to Farstad Con- struction AS, and thereafter Far Superior AS took delivery of the vessel 8 March 2017. Financing of the vessel consist of NOK 300 million in senior debt, NOK 100 million in sellers credit from VARD and NOK 30 million in equity.
Far Shogun is sold and will be handed over in June 2017. The vessel is presen-
ted as held for sale as of 31.12.2016.
CHANGES TO THE BOARD OF DIRECTORSOn the 16 January 2017 Leif-Arne Langøy retired from the board of the company. Langøy has been excused from the board’s work with Farstad Shipping ASA’s refinancing process since summer 2016.
At the extraordinary general meeting 3 March 2017 new board members were elected. New board consists of Chairman
Sverre A. Farstad, Audun Stensvold and Merete Haugli. Previous board members Per Norvald Sperre, Gro Bakstad, Mads Andersen, Janne-Grethe Strand-Aasnæs and Astrid Koppernæs retired from the board of the company.
OTHERThere have been no other material events subsequent to the reporting period re- quiring adjustment of or disclosure in the financial statements or notes thereto.
Independent auditor’s report - Farstad Shipping ASA
State Authorised Public AccountantsErnst & Young AS
DaaeGården, NO-6010 ÅlesundLangelandsvegen 1, NO-6010 Ålesund
Foretaksregisteret: NO 976 389 387 MVATlf: +47 70 11 82 82Fax: +47 70 14 34 86www.ey.noMember of the Norwegian Institute of Public Accountants
INDEPENDENT AUDITOR’S REPORT
To the Annual General Meeting of Farstad Shipping ASA
Report on the audit of the financial statements
Opinion
We have audited the financial statements of Farstad Shipping ASA, which comprise the financial statements for the parent company and the Group. The financial statements for the parent company and the Group comprise the statement of financial position as at 31 December 2016, income statement, statement of comprehensive income, the statements of cash flow and statement of changes in equity for the year then ended and notes to the financial statements, including a summary of significant accounting principles.
In our opinion, the financial statements of Farstad Shipping ASA have been prepared in accordance with laws and regulations and present fairly, in all material respects, the financial position of the Company and the Group as at 31 December 2016 and their financial performance for the year then ended in accordance with International Financial Reporting Standards (IFRS) as adopted by the EU.
Basis for opinion
We conducted our audit in accordance with laws, regulations, and auditing standards and practices generally accepted in Norway, including International Standards on Auditing (ISAs). Our responsibilities under those standards are further described in the Auditor’s responsibilities for the audit of the financial statements section of our report. We are independent of the Company in accordance with the ethical requirements that are relevant to our audit of the financial statements in Norway, and we have fulfilled our ethical responsibilities as required by law and regulations. We have also complied with our other ethical obligations in accordance with these requirements. We believe that the audit evidence we have obtained is sufficient and appropriate to provide a basis for our opinion.
Key audit matters
Key audit matters are those matters that, in our professional judgment, were of most significance in our audit of the financial statements of the current period. These matters were addressed in the context of our audit of the financial statements as a whole, and in forming our opinion thereon, and we do not provide a separate opinion on these matters. For each matter below, our description of how our audit addressed the matter is provided in that context.
We have fulfilled the responsibilities described in the Auditor’s responsibilities for the audit of the financial statements section of our report, including in relation to these matters. Accordingly, our audit included the performance of procedures designed to respond to our assessment of the risks of material misstatement of the financial statements. The results of our audit procedures, including the procedures performed to address the matters below, provide the basis for our audit opinion on the financial statements.
Independent auditor’s report - Farstad Shipping ASA
Restructuring agreement
Interest bearing liabilities amounting to NOK 11 551 million represents 85% of the consolidated balance sheet total as of 31 December 2016. Interest bearing liabilities amounted to NOK 1 397 million in the Parent Company financial statement. The Group and Parent Company were in breach with all debt covenants as of 31 December 2016 and all debt with breaches in covenants was presented as short-term liabilities. The Company signed on 6 February 2017 a restructuring agreement for a fully-funded financial restructuring of the Parent Company and the Group which will impact the financial statements for 2017. Considering the complexity and financial impact the restructuring was a key audit matter.
We assessed the Parent Company’s and the Group’s classification of the interest bearing liabilities as of 31 December 2016. Furthermore, we evaluated the disclosures and the accounting treatment of the restructuring against the underlying agreement and the criteria’s in IFRS. We recomputed the calculations.
We refer to disclosures in note 9 and 28 of the financial statements.
Impairment of vessels
As of 31 December 2016 the book value of vessels amounted to NOK 11 645 million representing 86% of total assets, after an impairment loss of NOK 2 559 million. There were impairment indicators based on the deteriorated market conditions and recent market transactions and management was therefore required to calculate the recoverable amounts which is the higher of fair value less costs to sell and value in use. The value in use calculation was based on estimated future cash flows. We consider management’s impairment assessment to be a key audit matter due to the complex process and valuation model and the significant judgment involved in estimating future cash flows.
We evaluated management’s assessment of value in use. We involved our valuation expert to assist us in evaluating the discount rates and testing the clerical accuracy of the model used to calculate the value in use. We tested the key assumptions and underlying data by comparing them to external market information and historical data, and by analyzing sensitivities. We also assessed the historical accuracy of management's estimates.
We refer to disclosures in note 16 of the consolidated financial statements.
Other informationOther information consists of the information included in the Company’s annual report other than the financial statements and our auditor’s report thereon. The Board of Directors and CEO (management) is responsible for the other information. Our opinion on the financial statements does not cover the other information, and we do not express any form of assurance conclusion thereon.
In connection with our audit of the financial statements, our responsibility is to read the other information, and, in doing so, consider whether the other information is materially inconsistent with the financial statements or our knowledge obtained in the audit, or otherwise appears to be materially misstated. If, based on the work we have performed, we conclude that there is a material misstatement of this other information, we are required to report that fact. We have nothing to report in this regard.Responsibilities of management for the financial statements
Management is responsible for the preparation and fair presentation of the financial
Independent auditor’s report - Farstad Shipping ASA
statements in accordance with International Financial Reporting Standards as adopted by the EU, and for such internal control as management determines is necessary to enable the preparation of financial statements that are free from material misstatement, whether due to fraud or error.
In preparing the financial statements, management is responsible for assessing the Company’s ability to continue as a going concern, disclosing, as applicable, matters related to going concern and using the going concern basis of accounting, unless management either intends to liquidate the Company or to cease operations, or has no realistic alternative but to do so.
Auditor’s responsibilities for the audit of the financial statements
Our objectives are to obtain reasonable assurance about whether the financial statements as a whole are free from material misstatement, whether due to fraud or error, and to issue an auditor’s report that includes our opinion. Reasonable assurance is a high level of assurance, but is not a guarantee that an audit conducted in accordance with ISAs will always detect a material misstatement when it exists. Misstatements can arise from fraud or error and are considered material if, individually or in the aggregate, they could reasonably be expected to influence the economic decisions of users taken on the basis of these financial statements.
As part of an audit in accordance with law, regulations and generally accepted auditing principles in Norway, including ISAs, we exercise professional judgment and maintain professional scepticism throughout the audit. We also:
► identify and assess the risks of material misstatement of the financial statements, whether due to fraud or error, design and perform audit procedures responsive to those risks, and obtain audit evidence that is sufficient and appropriate to provide a basis for our opinion. The risk of not detecting a material misstatement resulting from fraud is higher than for one resulting from error, as fraud may involve collusion, forgery, intentional omissions, misrepresentations, or the override of internal control;
► obtain an understanding of internal control relevant to the audit in order to design audit procedures that are appropriate in the circumstances, but not for the purpose of expressing an opinion on the effectiveness of the Company’s internal control;
► evaluate the appropriateness of accounting policies used and the reasonableness of accounting estimates and related disclosures made by management;
► conclude on the appropriateness of management’s use of the going concern basis of accounting and, based on the audit evidence obtained, whether a material uncertainty exists related to events or conditions that may cast significant doubt on the Company’s ability to continue as a going concern. If we conclude that a material uncertainty exists, we are required to draw attention in our auditor’s report to the related disclosures in the financial statements or, if such disclosures are inadequate, to modify our opinion. Our conclusions are based on the audit evidence obtained up to the date of our auditor’s report. However, future events or conditions may cause the Company to cease to continue as a going concern;
► evaluate the overall presentation, structure and content of the financial statements, including the disclosures, and whether the financial statements represent the underlying transactions and events in a manner that achieves fair presentation.
► obtain sufficient appropriate audit evidence regarding the financial information of the entities or business activities within the Group to express an opinion on the consolidated financial statements. We are responsible for the direction, supervision and performance of the group audit. We remain solely responsible for our audit opinion
We communicate with those charged with governance regarding, among other matters, the planned scope and timing of the audit and significant audit findings, including any significant deficiencies in internal control that we identify during our audit.
We also provide those charged with governance with a statement that we have complied with relevant ethical requirements regarding independence, and communicate with them all relationships and other matters that may reasonably be thought to bear on our independence, and where applicable, related safeguards.From the matters communicated with those charged with governance, we determine those matters that were of most significance in the audit of the financial statements of the current period and are therefore the key audit matters. We describe these matters in our auditor’s report unless law or regulation precludes public disclosure about the matter or when, in extremely rare circumstances, we determine that a matter should not be communicated in our report because the adverse consequences of doing so would reasonably be expected to outweigh the public interest benefits of such communication.
Report on other legal and regulatory requirements
Opinion on the Board of Directors’ report and in the statements on corporate governance and corporate social responsibility
Based on our audit of the financial statements as described above, it is our opinion that the information presented in the Board of Directors’ report concerning the financial statements and in the statements on corporate governance and corporate social responsibility, the going concern assumption and proposal for the allocation of the result is consistent with the financial statements and complies with the law and regulations.
Opinion on registration and documentation
Based on our audit of the financial statements as described above, and control procedures we have considered necessary in accordance with the International Standard on Assurance Engagements (ISAE) 3000, Assurance Engagements Other than Audits or Reviews of Historical Financial Information, it is our opinion that management has fulfilled its duty to ensure that the Company's accounting information is properly recorded and documented as required by law and bookkeeping standards and practices accepted in Norway.
Aalesund, 31 March 2017 ERNST & YOUNG AS
Ivar-André NorvikState Authorised Public Accountant (Norway)
Independent auditor’s report - Farstad Shipping ASA
63
APACASA
Asian PacificPublic limited company in Norway.
Charterer The company paying for the assignment.CP (Charter Party) Contract for hiring a shipCD Clean Design. DNV notificationCEO Chief Executive OfficerCFO Chief Financial OfficerCHRO Chief Human Resources OfficerCOO Chief Operating Officer
CGU Cash generating unit CO2 Carbon dioxideCIRR Commercial Interest Reference Rate CSV Construction Subsea VesselDWT Dead weight tonEBITDA Operating profit before depreciationEBIT Operating profitFAR The company code (ticker) at the Oslo Stock ExchangeGDP Gross Domestic ProductGIEK The Norwegian Export Credit Guarantee Agency's HSE Health, safety and environmentIAS International Accounting StandardIFRS International Financial Reporting StandardsIMR Inspection, Maintenance and RepairKPI Consumer price indexLIBOR London Interbank Offered RateLTIF Lost Time Injury FrequencyMMBBL Million barrelsNIBOR Norwegian Inter Bank Offered RateNIS Norwegian International Ship RegisterNOx Nitrogen oxidesNOR Norwegian Ordinary Ship RegisterOCI Other comprehensive incomeOSCV Offshore Subsea Construction VesselROV Remote Operation VehiclesSOx Sulphur oxidesTC Time charterTRCF Total Recordable Case FrequencyUNGC United Nations Global CompactVAE Value Adjusted EquityWACC Weighted Average Cost of Capital
GLOSSARY
annual report 2016 - farstad shipping asa
www.farstad.com
FARSTAD SHIPPING ASAPO. Box 1301 Sentrum, 6001 Aalesund, NorwayTel: +47 70 11 75 00, e-mail: [email protected]
FARSTAD SUPPLY ASFarstad House, Badentoy Avenue, Badentoy Park, Portlethen, Aberdeen AB12 4YB, ScotlandTel: +44 1 224 784 000, e-mail: [email protected] FARSTAD SHIPPING (INDIAN PACIFIC) PTY. LTD.Perth:16 St Georges Terrace, level 9, Perth WA 6000, AustraliaTel: +61 8 9421 9300, e-mail: [email protected]
Melbourne:GPO Box 5111, Melbourne Victoria 3001, AustraliaTel: +61 3 9685 1500, e-mail: [email protected]
FARSTAD SHIPPING OFFSHORE SIMULATION CENTRE PTY. LTD.PO Box 1375, Bibra Lake DC, Bibra Lake WA 6965, Perth, AustraliaTel: +61 8 9494 5600, e-mail: [email protected] FARSTAD SHIPPING PTE. LTD.78 Shenton Way, #19-02, Singapore 079120Tel: +65 6240 4500, e-mail: [email protected] FARSTAD SHIPPING LTDA.Rio de Janeiro:Av. Rio Branco, 01 - Sala 1509 - Centro CEP 20.090-003, Rio de Janeiro - RJ, Brazil Tel: +55 21 2138 2000, e-mail: [email protected]
Macaé:Rua Abilio Moreira de Miranda, No. 606, Imbetiba, CEP 27915-250, Macaé - RJ, BrazilTel: +55 22 2105 1900, e-mail: [email protected]