fast frequency response concepts and bulk power system ... resource...fundamentals of frequency...
TRANSCRIPT

RELIABILITY | RESILIENCE | SECURITY
NERC | Report Title | Report Date I
Fast Frequency Response Concepts and Bulk Power System Reliability Needs NERC Inverter-Based Resource Performance Task Force (IRPTF) White Paper
March 2020

NERC | White Paper: Fast Frequency Response | March 2020 ii
Table of Contents
Preface ........................................................................................................................................................................... iii
Executive Summary ........................................................................................................................................................ iv
Background ..................................................................................................................................................................... v
Fundamentals of Frequency Response ...................................................................................................................... vi
Chapter 1: Factors Determining Rate of Change of Frequency ...................................................................................... 1
Summary of Factors Affecting ROCOF ......................................................................................................................... 2
System Inertia .......................................................................................................................................................... 3
Size of Largest Credible Contingency ....................................................................................................................... 4
Speed of Frequency Response ................................................................................................................................. 5
Generator Dispatch Considerations ......................................................................................................................... 6
Chapter 2: Fast Frequency Response Concepts .............................................................................................................. 7
Types of FFR Controls .................................................................................................................................................. 9
Illustration of System Impacts of FFR .......................................................................................................................... 9
Chapter 3: Concept of Critical Inertia ........................................................................................................................... 12
Appendix A: References ................................................................................................................................................ 14
Appendix B: Technology-Specific FFR Capabilities ........................................................................................................ 15
Appendix C: Example Calculation of ROCOF ................................................................................................................. 21
Contributors .................................................................................................................................................................. 23
NERC | White Paper: Fast Frequency Response | March 2020 iii
Preface Electricity is a key component of the fabric of modern society and the Electric Reliability Organization (ERO) Enterprise serves to strengthen that fabric. The vision for the ERO Enterprise, which is comprised of the North American Electric Reliability Corporation (NERC) and the six Regional Entities (REs), is a highly reliable and secure North American bulk power system (BPS). Our mission is to assure the effective and efficient reduction of risks to the reliability and security of the grid.
Reliability | Resilience | Security Because nearly 400 million citizens in North America are counting on us
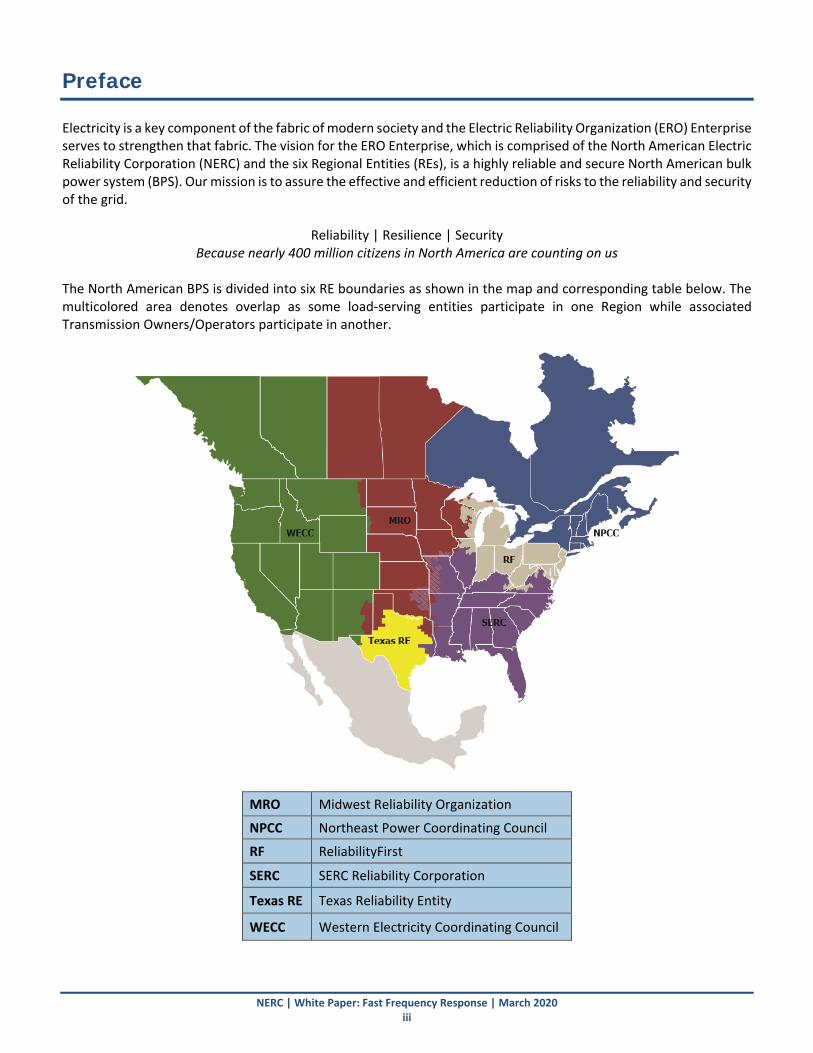
The North American BPS is divided into six RE boundaries as shown in the map and corresponding table below. The multicolored area denotes overlap as some load-serving entities participate in one Region while associated Transmission Owners/Operators participate in another.
MRO Midwest Reliability Organization
NPCC Northeast Power Coordinating Council
RF ReliabilityFirst
SERC SERC Reliability Corporation
Texas RE Texas Reliability Entity
WECC Western Electricity Coordinating Council
NERC | White Paper: Fast Frequency Response | March 2020 iv
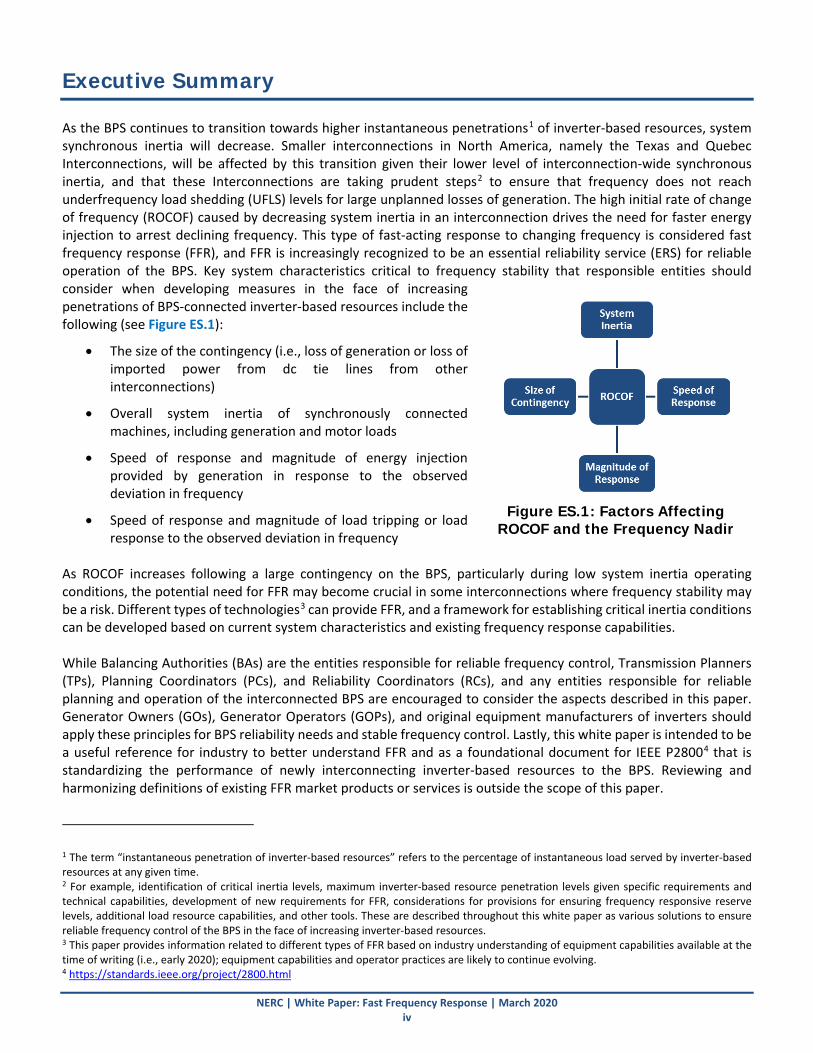
Executive Summary As the BPS continues to transition towards higher instantaneous penetrations1 of inverter-based resources, system synchronous inertia will decrease. Smaller interconnections in North America, namely the Texas and Quebec Interconnections, will be affected by this transition given their lower level of interconnection-wide synchronous inertia, and that these Interconnections are taking prudent steps2 to ensure that frequency does not reach underfrequency load shedding (UFLS) levels for large unplanned losses of generation. The high initial rate of change of frequency (ROCOF) caused by decreasing system inertia in an interconnection drives the need for faster energy injection to arrest declining frequency. This type of fast-acting response to changing frequency is considered fast frequency response (FFR), and FFR is increasingly recognized to be an essential reliability service (ERS) for reliable operation of the BPS. Key system characteristics critical to frequency stability that responsible entities should consider when developing measures in the face of increasing penetrations of BPS-connected inverter-based resources include the following (see Figure ES.1):
• The size of the contingency (i.e., loss of generation or loss of imported power from dc tie lines from other interconnections)
• Overall system inertia of synchronously connected machines, including generation and motor loads
• Speed of response and magnitude of energy injection provided by generation in response to the observed deviation in frequency
• Speed of response and magnitude of load tripping or load response to the observed deviation in frequency
As ROCOF increases following a large contingency on the BPS, particularly during low system inertia operating conditions, the potential need for FFR may become crucial in some interconnections where frequency stability may be a risk. Different types of technologies3 can provide FFR, and a framework for establishing critical inertia conditions can be developed based on current system characteristics and existing frequency response capabilities. While Balancing Authorities (BAs) are the entities responsible for reliable frequency control, Transmission Planners (TPs), Planning Coordinators (PCs), and Reliability Coordinators (RCs), and any entities responsible for reliable planning and operation of the interconnected BPS are encouraged to consider the aspects described in this paper. Generator Owners (GOs), Generator Operators (GOPs), and original equipment manufacturers of inverters should apply these principles for BPS reliability needs and stable frequency control. Lastly, this white paper is intended to be a useful reference for industry to better understand FFR and as a foundational document for IEEE P28004 that is standardizing the performance of newly interconnecting inverter-based resources to the BPS. Reviewing and harmonizing definitions of existing FFR market products or services is outside the scope of this paper.
1 The term “instantaneous penetration of inverter-based resources” refers to the percentage of instantaneous load served by inverter-based resources at any given time. 2 For example, identification of critical inertia levels, maximum inverter-based resource penetration levels given specific requirements and technical capabilities, development of new requirements for FFR, considerations for provisions for ensuring frequency responsive reserve levels, additional load resource capabilities, and other tools. These are described throughout this white paper as various solutions to ensure reliable frequency control of the BPS in the face of increasing inverter-based resources. 3 This paper provides information related to different types of FFR based on industry understanding of equipment capabilities available at the time of writing (i.e., early 2020); equipment capabilities and operator practices are likely to continue evolving. 4 https://standards.ieee.org/project/2800.html
Figure ES.1: Factors Affecting
ROCOF and the Frequency Nadir

NERC | White Paper: Fast Frequency Response | March 2020 v
Background As the penetration of inverter-based resources increases across the BPS in North America, industry needs to be kept informed concerning key aspects of the changing resource mix and its impact on BPS reliability. Starting in 2012 and through ongoing studies,5 NERC has been evaluating BPS ERSs. One such ERS is the ability to maintain system frequency during normal operation and immediately following contingency events, referred to as frequency control. The 2012 NERC Frequency Response Initiative Report6 laid a foundation for frequency control in North America and provides much of the background information leading to this white paper. Subsequent to that report, NERC issued a reliability guideline on primary frequency control7 that further elaborated on these concepts and provided clear directions on how to address possible deficiencies in primary frequency control from some generating resources. In February 2018, the Lawrence Berkeley National Laboratory issued a report8 detailing fundamental aspects of frequency control requirements for reliable operation of the BPS. This work was funded by the Federal Energy Regulatory Commission (FERC); around this same time, FERC issued Order No. 842,9 revising its regulations for the provision of primary frequency response for newly interconnecting generating resources. The final rule amended the pro forma Large Generator Interconnection Agreement and Small Generator Interconnection Agreement to “require that all new generating facilities install, maintain, and operate a functioning governor or equivalent controls as a precondition of interconnection.” In particular, FERC Order No. 842 requires newly interconnecting resources to perform the following:10
• Install, maintain, and operate equipment capable of providing primary frequency response
• Respond to frequency excursion events measured at the plant point of measurement11 with a maximum deadband of ± 0.036 Hz
• Adjust its output with a droop characteristic of no more than 5% based on nameplate capacity
• Provide sustained frequency response to frequency deviations rather than inject active power for a short period and then withdraw it12
Defining FFR was not included in FERC Order No. 842; however, the need for FFR is growing as grid dynamics get faster with increasing penetrations of inverter-based resources. At the time of writing, various FFR services have been introduced in power systems around the world that are already experiencing high instantaneous penetrations of inverter-based resources. There are system characteristics and operational considerations critical to maintaining frequency control and frequency stability that responsible entities should adopt as the penetration of inverter-based resources continues to grow. This includes the interaction between system inertia, ROCOF, and the speed and magnitude of active power response to arrest and stabilize system frequency. Different technologies can provide this
5 https://www.nerc.com/comm/Other/essntlrlbltysrvcstskfrcDL/ERSWG_Sufficiency_Guideline_Report.pdf https://static1.squarespace.com/static/5b1032e545776e01e7058845/t/5ca541769b747a55f8444c03/1554334072121/EIPC_FRTF_2018_Final_Report_Public_Version_EC_Approved_2019-02-27.pdf 6 https://www.nerc.com/pa/Stand/Project%20200712%20Frequency%20Response%20DL/FRI_Report_10-30-12_Master_w-appendices.pdf 7 https://www.nerc.com/comm/OC/Reliability%20Guideline%20DL/Primary_Frequency_Control_final.pdf 8 http://eta-publications.lbl.gov/sites/default/files/frequency_control_requirements_lbnl-2001103.pdf 9 https://www.ferc.gov/media/news-releases/2018/2018-1/02-15-18-E-2.asp#.XRUCrs-osnU 10 Reserving primary frequency responsive reserve (i.e., “headroom”) is not required per FERC Order No. 842. TPs and PCs may require more responsive droop settings; however, those should be based on engineering studies demonstrating that more responsive frequency control is needed. 11 This is the “high-side of the generator substation” transformer, according to FERC Order No. 827. This white paper aligns with FERC on the use of “Point of Measurement” rather than “Point of Interconnection” unless referencing a specific NERC Reliability Standard that uses “Point of Interconnection.” 12 Primary frequency control relies on a sufficient amount of responsive resources that are able to arrest the changing frequency and then maintain a new balance of generation and load. Without sufficient sustained primary frequency response, frequency will continue to decline. While some resources can provide sustained fast frequency response, others cannot provide this service. Therefore, the different types of fast frequency response need to be separated and uniquely integrated to ensure a sufficient balance of sustained and non-sustained response.
Background
NERC | White Paper: Fast Frequency Response | March 2020 vi
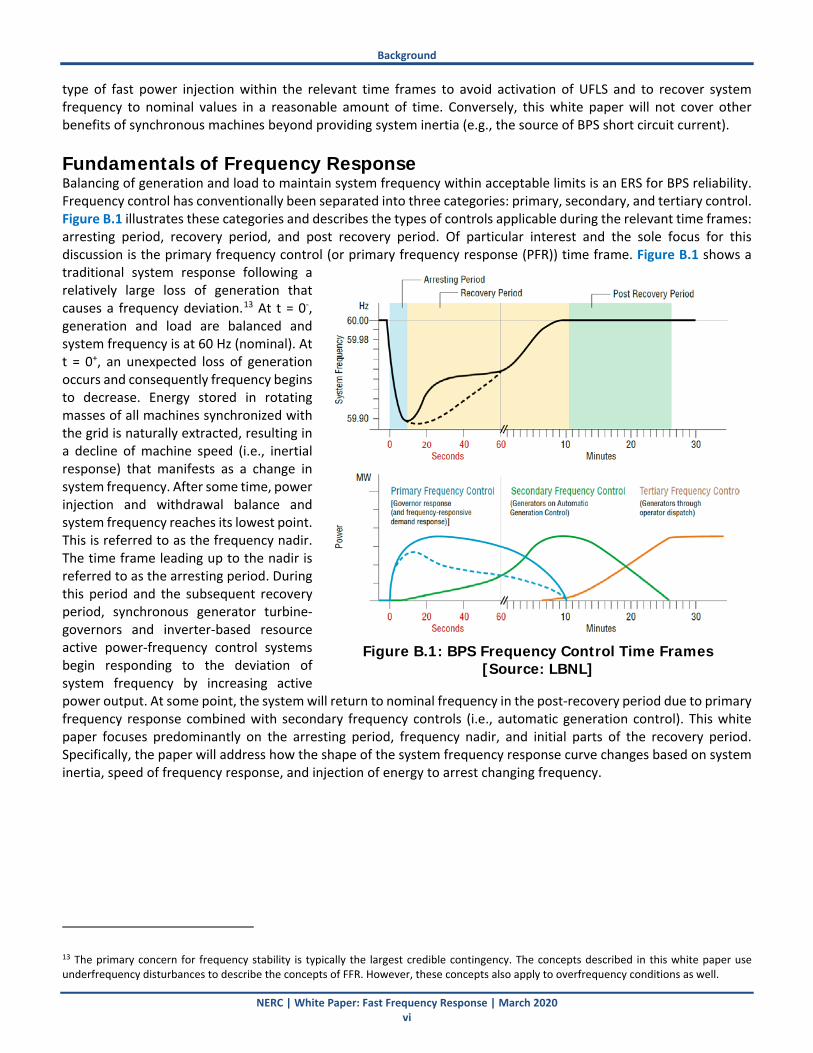
type of fast power injection within the relevant time frames to avoid activation of UFLS and to recover system frequency to nominal values in a reasonable amount of time. Conversely, this white paper will not cover other benefits of synchronous machines beyond providing system inertia (e.g., the source of BPS short circuit current). Fundamentals of Frequency Response Balancing of generation and load to maintain system frequency within acceptable limits is an ERS for BPS reliability. Frequency control has conventionally been separated into three categories: primary, secondary, and tertiary control. Figure B.1 illustrates these categories and describes the types of controls applicable during the relevant time frames: arresting period, recovery period, and post recovery period. Of particular interest and the sole focus for this discussion is the primary frequency control (or primary frequency response (PFR)) time frame. Figure B.1 shows a traditional system response following a relatively large loss of generation that causes a frequency deviation.13 At t = 0-, generation and load are balanced and system frequency is at 60 Hz (nominal). At t = 0+, an unexpected loss of generation occurs and consequently frequency begins to decrease. Energy stored in rotating masses of all machines synchronized with the grid is naturally extracted, resulting in a decline of machine speed (i.e., inertial response) that manifests as a change in system frequency. After some time, power injection and withdrawal balance and system frequency reaches its lowest point. This is referred to as the frequency nadir. The time frame leading up to the nadir is referred to as the arresting period. During this period and the subsequent recovery period, synchronous generator turbine-governors and inverter-based resource active power-frequency control systems begin responding to the deviation of system frequency by increasing active power output. At some point, the system will return to nominal frequency in the post-recovery period due to primary frequency response combined with secondary frequency controls (i.e., automatic generation control). This white paper focuses predominantly on the arresting period, frequency nadir, and initial parts of the recovery period. Specifically, the paper will address how the shape of the system frequency response curve changes based on system inertia, speed of frequency response, and injection of energy to arrest changing frequency.
13 The primary concern for frequency stability is typically the largest credible contingency. The concepts described in this white paper use underfrequency disturbances to describe the concepts of FFR. However, these concepts also apply to overfrequency conditions as well.
Figure B.1: BPS Frequency Control Time Frames
[Source: LBNL]

NERC | White Paper: Fast Frequency Response | March 2020 1
Chapter 1: Factors Determining Rate of Change of Frequency ROCOF can be defined as follows:
Rate-of-Change-of-Frequency (ROCOF): a measure of how quickly frequency changes following a sudden imbalance between generation and load.14
ROCOF is most commonly expressed in Hertz per second (Hz/second). ROCOF is fundamentally the tangential line15 for any given point on a frequency response curve; however, this is typically estimated by using two frequency measurements16 within a short period of time (i.e., 0.1–0.5 seconds). The initial ROCOF is most commonly calculated as the change in frequency over a 0.5 second time period immediately following a sudden generation loss.17 This time period is selected since the BPS response during this time is dominated by the size of the contingency and the system inertial response18 prior to the majority of turbine-governors responding to the change in perceived frequency.
𝑅𝑅𝑅𝑅𝑅𝑅𝑅𝑅𝑅𝑅0.5 =𝑓𝑓0.5 − 𝑓𝑓00.5 𝑠𝑠𝑠𝑠𝑠𝑠
If the initial ROCOF is high, frequency may fall to UFLS thresholds before frequency response actions can be effectively deployed.19 Thus, initial ROCOF can be also used as a rough estimate of the amount of time before frequency reaches UFLS20 if no responsive action is initiated. This then dictates the time in which adequate amounts of frequency response must be deployed to mitigate UFLS operation. Figure 1.1 illustrates how these parameters are calculated; these are used in subsequent discussions of the factors that determine overall system frequency response. Refer to Appendix C for further explanation. Similarly, transient stability simulation results can be used to determine the time frame for the arresting phase and the time to reach the frequency nadir. Understanding the initial ROCOF following a sudden loss of generation informs both planning and operations time horizons. Any ROCOF-based protection that could be triggered, whether additional generation tripping could occur, or if any distributed energy resource (DER) tripping could occur are all factors that also need to be considered. For example, high ROCOF caused approximately 350 MW of DERs to trip on ROCOF protection in the United Kingdom during a large disturbance on August 9, 2019.21 This document does not specifically address the impacts that DER tripping could have on BPS primary frequency response; however, the NERC System Planning Impacts of Distributed Energy Resources Working Group is developing guidance material specifically on this subject.
14 This is defined in the 2018 LBNL Frequency Control Requirements for Reliable Interconnection Frequency Response Report: https://certs.lbl.gov/project/interconnection-frequency-response. 15 This is the instantaneous derivative of the frequency. 16 Note that for inverter-based resources with no rotational components, frequency is often derived using grid measurements at the terminal of the inverter (or at the plant-level point of measurement). Those measurements are actually mathematical calculations and filtering of grid phase and its rate of change. This white paper uses the term “measurement” rather than “calculation” for simplicity. 17 http://www.soni.ltd.uk/media/documents/Archive/RoCoF%20Modification%20Proposal%20TSOs%20Opinion.pdf 18 In a system dominated by rotating machines 19 Furthermore, a high ROCOF may have potential impacts on existing generator protection and operations. For example, some nuclear plants and natural gas turbines may trip on various turbine controls related to rapid changes or rates of change of speed (e.g., due to fuel flow or auxiliary cooling). 20 Or other relevant frequency-related protection thresholds, such as generator underfrequency protection 21 https://www.ofgem.gov.uk/publications-and-updates/ofgem-has-published-national-grid-electricity-system-operator-s-technical-report.

Chapter 1: Factors Determining Rate of Change of Frequency
NERC | White Paper: Fast Frequency Response | March 2020 2
Figure 1.1: Impacts of System Inertia on ROCOF and Frequency Nadir
Summary of Factors Affecting ROCOF A number of factors determine the ROCOF following a sudden imbalance between generation and load, and these factors cannot be considered in isolation without accounting for the others. Immediately following a large imbalance in generation and load, the initial ROCOF is driven by the following factors:
• The size of the contingency (i.e., loss of generation or loss of imported power from dc tie lines from other interconnections)
• Overall system inertia of synchronously connected machines, including generation and motor loads
• Speed of response and magnitude of energy injection provided by generation in response to the observed deviation in frequency
• Speed of response and magnitude of load tripping or load response to the observed deviation in frequency
• The sensitivity of loads to changes in system frequency
• Incremental losses on the BPS due to changes in system flows caused by the loss of generation
Time to UFLS Estimation using Initial ROCOF Using the initial ROCOF to estimate time to UFLS is an approximation. Inertial response, load response, and other non-linear actions that occur as frequency declines results in arresting and recovering from the frequency excursion. These responses cause a deviation between the time to the frequency nadir and the time to reaching UFLS that must be taken into account. In systems with a relatively high ROCOF, this approximation is more relevant since most rotating machine mechanical governor response does not have sufficient time to respond. Conversely, systems with a relatively low ROCOF (i.e., a large amount of synchronous inertia) have sufficient time for active power-frequency controls from generators to respond to the slowly changing frequency; therefore, this approximation tends to not be accurate (see Appendix C) and frequency ROCOF is not a significant concern.
Figure 1.2: Factors Affecting
ROCOF and the Frequency Nadir
Chapter 1: Factors Determining Rate of Change of Frequency
NERC | White Paper: Fast Frequency Response | March 2020 3
While load sensitivity and incremental losses play a role in overall frequency response, the initial ROCOF is dominated by the size of the contingency event, the amount of on-line system inertia, and the speed and magnitude of frequency response (illustrated in Figure 1.2). Each of the factors mentioned above are described in the following sub-sections. System Inertia Power system synchronous inertia is often defined as “the ability of a power system to oppose changes in system frequency due to resistance provided by rotating masses.”22 System inertia at any given time is the summation of kinetic energy stored in rotating masses of synchronously connected machines, including synchronous generators, synchronous condensers, and synchronous motor loads.23 Synchronous generators and motors have energy stored in their rotating mass. When a sudden change in generation or load occurs, synchronous machine rotors and the electric system inherently exchange kinetic energy, causing synchronous machines to change speed (i.e., “inertial response”). For the loss of generation, ΔPloss, with inertia KEloss, initial ROCOF can be estimated as follows:
𝑅𝑅𝑅𝑅𝑅𝑅𝑅𝑅𝑅𝑅 =∆𝑃𝑃𝑙𝑙𝑙𝑙𝑙𝑙𝑙𝑙
2 ∗ �𝐾𝐾𝐾𝐾𝑙𝑙𝑠𝑠𝑙𝑙 − 𝐾𝐾𝐾𝐾𝑙𝑙𝑙𝑙𝑙𝑙𝑙𝑙�∗ 60
where KEsys is the total system kinetic energy from on-line synchronous generators. KEsys can be calculated as follows:
𝐾𝐾𝐾𝐾𝑙𝑙𝑠𝑠𝑙𝑙 = � 𝐻𝐻𝑖𝑖 ∗ 𝑀𝑀𝑀𝑀𝑀𝑀𝑖𝑖𝑖𝑖𝑖𝑖𝑖𝑖
where I is the set of on-line synchronous generators, synchronous motors,24 and synchronous condensers; and MVAi and Hi are the MVA base and inertia constant25 of generator or synchronous condenser i. As the instantaneous penetration of non-synchronous, inverter-based generating resources (e.g., wind, solar photovoltaic (PV), battery energy storage) continues to increase across North America, the on-line synchronous inertia will decline due to displacement of synchronous generation with nonsynchronous, inverter-based resources. The initial ROCOF after a sudden imbalance in generation and load will continue to steepen, assuming all other factors are fixed.
22 This is defined in the 2018 LBNL Frequency Control Requirements for Reliable Interconnection Frequency Response Report: https://certs.lbl.gov/project/interconnection-frequency-response. 23 The amount of on-line system inertia depends on the number, type, and size of generators and motor loads synchronously connected to the power system. Accounting for motor loads is challenging due to lack of data; therefore, the contribution of motor loads to inertial response is combined with the load damping factor constant. 24 Note that motor load inertia data is usually not available and, therefore, is either neglected (as a worst case assumption) or approximated. 25 This is in seconds, on each individual machine MVA base.
Chapter 1: Factors Determining Rate of Change of Frequency
NERC | White Paper: Fast Frequency Response | March 2020 4
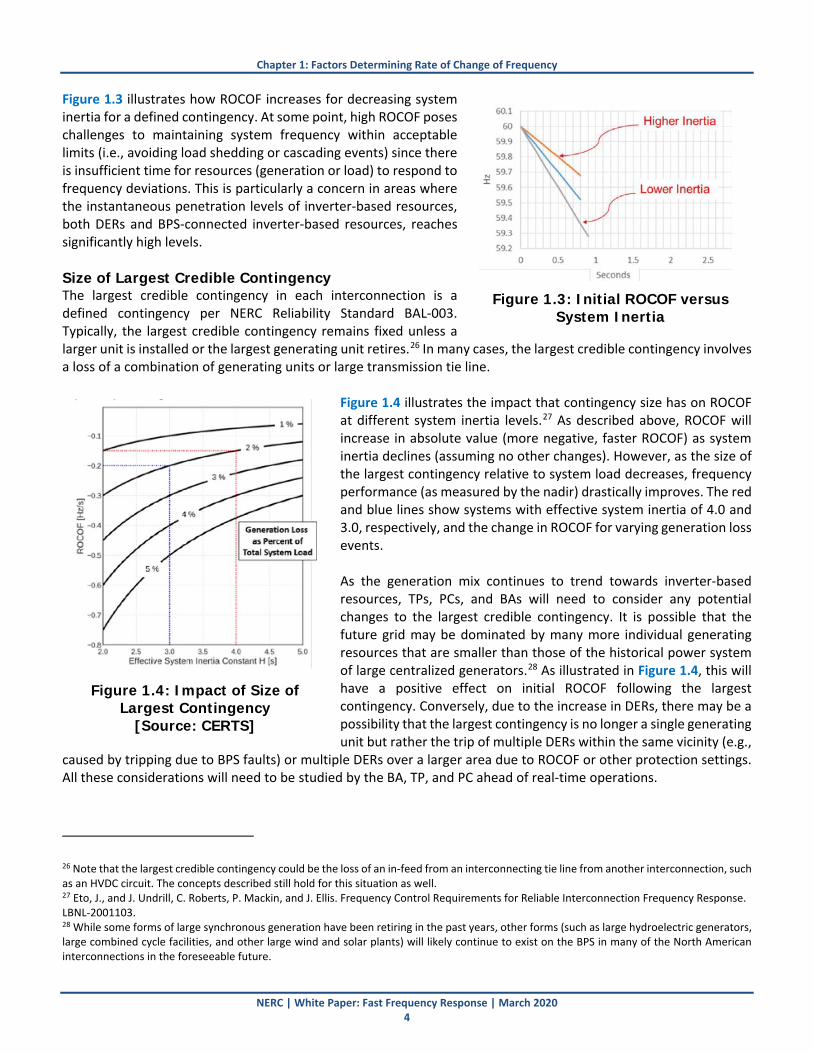
Figure 1.3 illustrates how ROCOF increases for decreasing system inertia for a defined contingency. At some point, high ROCOF poses challenges to maintaining system frequency within acceptable limits (i.e., avoiding load shedding or cascading events) since there is insufficient time for resources (generation or load) to respond to frequency deviations. This is particularly a concern in areas where the instantaneous penetration levels of inverter-based resources, both DERs and BPS-connected inverter-based resources, reaches significantly high levels. Size of Largest Credible Contingency The largest credible contingency in each interconnection is a defined contingency per NERC Reliability Standard BAL-003. Typically, the largest credible contingency remains fixed unless a larger unit is installed or the largest generating unit retires.26 In many cases, the largest credible contingency involves a loss of a combination of generating units or large transmission tie line.
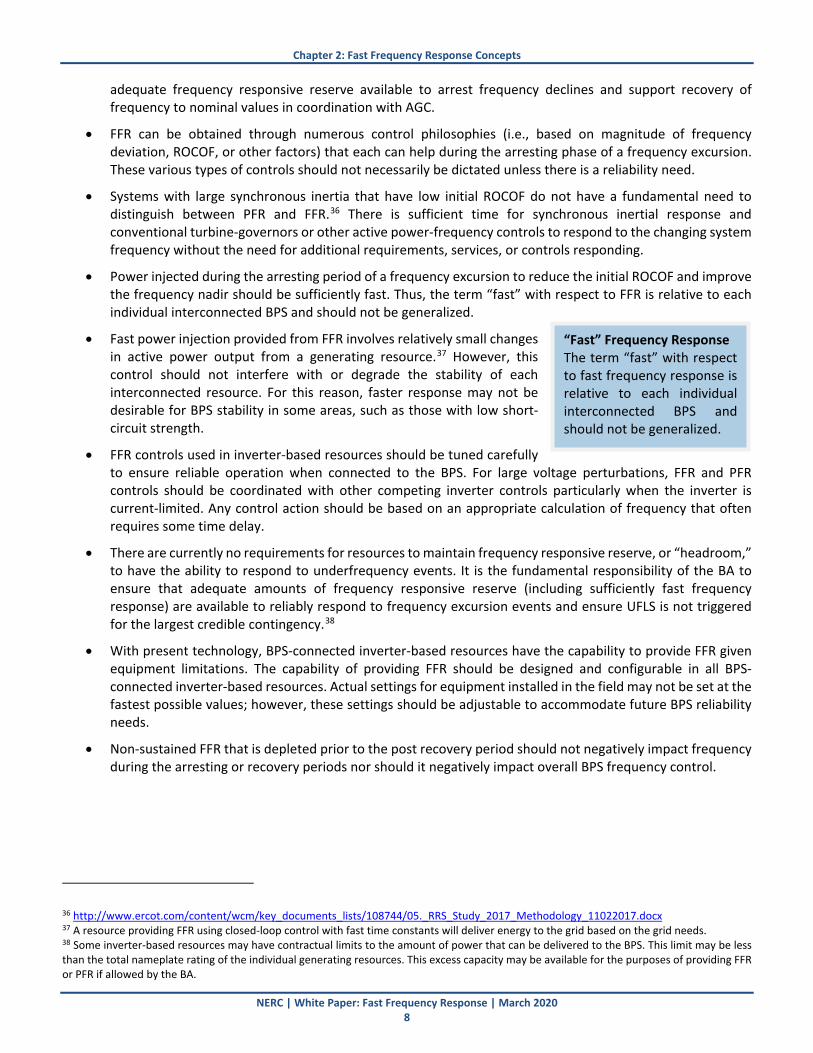
Figure 1.4 illustrates the impact that contingency size has on ROCOF at different system inertia levels.27 As described above, ROCOF will increase in absolute value (more negative, faster ROCOF) as system inertia declines (assuming no other changes). However, as the size of the largest contingency relative to system load decreases, frequency performance (as measured by the nadir) drastically improves. The red and blue lines show systems with effective system inertia of 4.0 and 3.0, respectively, and the change in ROCOF for varying generation loss events. As the generation mix continues to trend towards inverter-based resources, TPs, PCs, and BAs will need to consider any potential changes to the largest credible contingency. It is possible that the future grid may be dominated by many more individual generating resources that are smaller than those of the historical power system of large centralized generators.28 As illustrated in Figure 1.4, this will have a positive effect on initial ROCOF following the largest contingency. Conversely, due to the increase in DERs, there may be a possibility that the largest contingency is no longer a single generating unit but rather the trip of multiple DERs within the same vicinity (e.g.,
caused by tripping due to BPS faults) or multiple DERs over a larger area due to ROCOF or other protection settings. All these considerations will need to be studied by the BA, TP, and PC ahead of real-time operations. 26 Note that the largest credible contingency could be the loss of an in-feed from an interconnecting tie line from another interconnection, such as an HVDC circuit. The concepts described still hold for this situation as well. 27 Eto, J., and J. Undrill, C. Roberts, P. Mackin, and J. Ellis. Frequency Control Requirements for Reliable Interconnection Frequency Response. LBNL-2001103. 28 While some forms of large synchronous generation have been retiring in the past years, other forms (such as large hydroelectric generators, large combined cycle facilities, and other large wind and solar plants) will likely continue to exist on the BPS in many of the North American interconnections in the foreseeable future.
Figure 1.4: Impact of Size of
Largest Contingency [Source: CERTS]
Figure 1.3: Initial ROCOF versus
System Inertia

Chapter 1: Factors Determining Rate of Change of Frequency
NERC | White Paper: Fast Frequency Response | March 2020 5
Speed of Frequency Response Any energy injected prior to reaching the frequency nadir will reduce the size of the frequency deviation and improve the frequency nadir. This concept drives the need for power injection to aid in arresting the frequency decline. An ideal frequency response shape, assuming resources could respond nearly instantaneously following a disturbance, would be an “L” shaped response (where frequency would fall to a frequency level determined by the effective droop response of the system). The proportional active power-frequency response, combined with the system inertia and size of the disturbance, would dictate the settling frequency. However, many types of resources29 often take much longer to deliver active power in response to changing frequency, and their turbine-governor actions continue after the frequency nadir has been reached. This is what drives the rebounding30 of frequency in some Interconnections, such as in the Texas Interconnection and Western Interconnection. On the other hand, the Eastern Interconnection, due to its large system inertia, takes significantly longer for frequency to decline and therefore has more of an “L” shaped response since resources have much more time to arrest the declining frequency. As the instantaneous penetration of inverter-based resources with little or no inertia continues to increase, system ROCOF after a loss of generation will increase and the time available to deliver frequency responsive reserves will shorten. This is due to the reduction of synchronous resources that were previously providing inertia and drives the need for faster-acting frequency responsive resources to inject (or in the case of load resources, to withdraw) energy to the grid during a shorter arresting period. Figure 1.5 shows a typical frequency response shape and how decreasing system inertia (blue versus red plot) causes a steeper initial ROCOF, lower frequency nadir, and a frequency nadir that occurs sooner. This illustrates the importance of speed of response; however, the speed of a resource delivering FFR may be limited by its technology.31
Figure 1.5: Impacts of System Inertia on ROCOF and Frequency Nadir
[Source: CERTS]32 29 This can include any resource type but is often observed in some hydroelectric generating facilities and some steam turbine generators. 30 Rebounding here refers to the quick recovery of frequency following the frequency nadir prior to a settled frequency being reached. 31 https://www.aemo.com.au/-/media/Files/Electricity/NEM/Security_and_Reliability/Reports/2017/2017-03-10-GE-FFR-Advisory-Report-Final---2017-3-9.pdf 32 Eto, J., and J. Undrill, C. Roberts, P. Mackin, and J. Ellis. Frequency Control Requirements for Reliable Interconnection Frequency Response. LBNL-2001103.

Chapter 1: Factors Determining Rate of Change of Frequency
NERC | White Paper: Fast Frequency Response | March 2020 6
Generator Dispatch Considerations Another factor that implicitly impacts frequency response is generator dispatch. Different unit types have different dispatch considerations (e.g., start-up and shut-down times and costs, ramp rates, outage schedules, energy certainty) that affect the total amount of committed generating resources to meet system demand and carry a sufficient amount of ERSs (including frequency responsive reserves). Subsequently, the amount and type of on-line generating resources have an impact on total system inertia, largest contingency size, BPS flows, frequency responsive reserve, and incremental losses.33 These factors should be accounted for when studying the potential need for FFR. For example, high inverter-based resource dispatch conditions may be assumed to be a “low inertia” condition. However, it is possible that during these conditions a significant amount of on-line synchronous generation providing ERSs and scheduled to provide higher power output in subsequent hours will increase the system inertia at that time. On the other hand, the lowest system inertia conditions may occur on days with moderate but constant inverter-based resource penetration levels where forecast certainty is high and subsequently less on-line synchronous generation is needed throughout the day. Load Frequency Sensitivity Traditionally, many BAs have assumed some amount of frequency sensitivity of the load that supports frequency response (i.e., change in load consumption due to change in frequency). Further, the area control error equation includes a bias term (beta) specifically intended to reflect the load frequency sensitivity within a BA footprint. Demand reduction occurs during the arresting phase since there is no inherent delay in the response of motor loads. The frequency sensitivity value has historically been assumed to be somewhere between 1–1.5%. For example, if system demand is 50,000 MW, a 1% change in system frequency would result in a reduction of demand to 49,500 MW. However, as more directly-connected motor loads are being replaced with power electronic interfaces (e.g., variable speed drives and electronically commutated motors), frequency sensitivity of loads will likely decrease. BAs should generally understand the load composition within their footprint to determine an appropriate approximation for frequency sensitivity of loads and should perform simulations with varying degrees of frequency sensitivity of loads to understand its impact to system primary frequency response.
33 Power flow directionality based on system dispatch has an impact on the incremental losses across the BPS. For example, historically in the Western Interconnection, the loss of the largest contingency during north-south power transfer increased the incremental losses (due to increased tie line flow) fairly substantially due to the location of frequency responsive reserves. On the other hand, if flows are south-north on these interties, then the contingency may actually reduce incremental losses and support frequency response.

NERC | White Paper: Fast Frequency Response | March 2020 7
Chapter 2: Fast Frequency Response Concepts For the purposes of this paper, FFR is defined as follows:
Fast Frequency Response: power injected to (or absorbed from) the grid in response to changes in measured or observed frequency34 during the arresting phase of a frequency excursion event to improve the frequency nadir or initial rate-of-change of frequency
FFR can be provided by many different forms of controls that inject additional power prior to the frequency nadir being reached during a frequency excursion event. Synchronous machine inertial response, a portion of traditional turbine-governor response, wind turbine generator (WTG) controls to extract additional power from the rotational energy of the turbine, and other fast-responding controls from batteries and solar PV all can be classified as FFR since they provide replacement power to the BPS during the arresting phase. A strong conceptual understanding of what FFR is and how it helps arrest frequency excursions is necessary to utilize FFR in future BPS operations and planning. To better describe FFR, consider the following fundamental aspects of FFR and how it supports a reliable BPS and stable frequency performance:
• Overall system frequency response should fundamentally be sustained35 such that sufficient amounts of energy are injected to arrest frequency excursions, maintain frequency stability, and adequately allow frequency recovery back to nominal following a sudden loss of generation or load. However, there are different types of frequency response, including both PFR and FFR, that can work in coordination to support frequency control (see Figure 2.1).
Figure 2.1: Simultaneous Contributions of Inertia Response, PFR, and FFR
• Different technologies have the capability to provide forms of FFR in different ways, and should be coordinated with PFR. Some forms may be sustained while other forms may be non-sustained. Each can help arrest frequency and improve the frequency nadir. Sustained frequency response (both FFR and PFR) refers to the ability to maintain the change in power injection until secondary frequency controls return the system to nominal frequency. However, the different forms must be studied and coordinated to ensure that there is
34 In many cases, this is a response to locally measured frequency (or other local signal). In some cases, where speed of response is critical, other types of signals may be used to initiate FFR. For example, RAS actions triggered by specific contingencies may activate FFR. 35 This is a characteristic of frequency response in the requirements set forth in FERC Order No. 842.
Chapter 2: Fast Frequency Response Concepts
NERC | White Paper: Fast Frequency Response | March 2020 8
adequate frequency responsive reserve available to arrest frequency declines and support recovery of frequency to nominal values in coordination with AGC.
• FFR can be obtained through numerous control philosophies (i.e., based on magnitude of frequency deviation, ROCOF, or other factors) that each can help during the arresting phase of a frequency excursion. These various types of controls should not necessarily be dictated unless there is a reliability need.
• Systems with large synchronous inertia that have low initial ROCOF do not have a fundamental need to distinguish between PFR and FFR.36 There is sufficient time for synchronous inertial response and conventional turbine-governors or other active power-frequency controls to respond to the changing system frequency without the need for additional requirements, services, or controls responding.
• Power injected during the arresting period of a frequency excursion to reduce the initial ROCOF and improve the frequency nadir should be sufficiently fast. Thus, the term “fast” with respect to FFR is relative to each individual interconnected BPS and should not be generalized.
• Fast power injection provided from FFR involves relatively small changes in active power output from a generating resource.37 However, this control should not interfere with or degrade the stability of each interconnected resource. For this reason, faster response may not be desirable for BPS stability in some areas, such as those with low short-circuit strength.
• FFR controls used in inverter-based resources should be tuned carefully to ensure reliable operation when connected to the BPS. For large voltage perturbations, FFR and PFR controls should be coordinated with other competing inverter controls particularly when the inverter is current-limited. Any control action should be based on an appropriate calculation of frequency that often requires some time delay.
• There are currently no requirements for resources to maintain frequency responsive reserve, or “headroom,” to have the ability to respond to underfrequency events. It is the fundamental responsibility of the BA to ensure that adequate amounts of frequency responsive reserve (including sufficiently fast frequency response) are available to reliably respond to frequency excursion events and ensure UFLS is not triggered for the largest credible contingency.38
• With present technology, BPS-connected inverter-based resources have the capability to provide FFR given equipment limitations. The capability of providing FFR should be designed and configurable in all BPS-connected inverter-based resources. Actual settings for equipment installed in the field may not be set at the fastest possible values; however, these settings should be adjustable to accommodate future BPS reliability needs.
• Non-sustained FFR that is depleted prior to the post recovery period should not negatively impact frequency during the arresting or recovery periods nor should it negatively impact overall BPS frequency control.
36 http://www.ercot.com/content/wcm/key_documents_lists/108744/05._RRS_Study_2017_Methodology_11022017.docx 37 A resource providing FFR using closed-loop control with fast time constants will deliver energy to the grid based on the grid needs. 38 Some inverter-based resources may have contractual limits to the amount of power that can be delivered to the BPS. This limit may be less than the total nameplate rating of the individual generating resources. This excess capacity may be available for the purposes of providing FFR or PFR if allowed by the BA.
“Fast” Frequency Response The term “fast” with respect to fast frequency response is relative to each individual interconnected BPS and should not be generalized.

Chapter 2: Fast Frequency Response Concepts
NERC | White Paper: Fast Frequency Response | March 2020 9
Types of FFR Controls The activation of FFR can take different forms, including non-controlled response provided by synchronous generation as well as other forms of FFR that use a frequency measurement at the generating or load facility to take fast action to provide active power (or disconnect load) to the grid based on measured system frequency. These different methods include, but may not be limited to, any one or combination of the following:
• Active power injection in proportion to measured frequency deviation (proportional response)
• Injection of constant amount of active power once frequency reaches a preset trigger point (step response)39
• Active power injection in proportion to calculated ROCOF (derivative response)
• Injection of constant amount of active power once a preset ROCOF is reached (step response)
• Controlled load reduction in proportion to measured frequency deviation or ROCOF (proportional or derivative response)
• Controlled reduction of constant amount of load on a preset frequency or ROCOF is reached (step response)40
Each of these methods and the technologies providing FFR are described in detail in various industry reports.41 Figure 2.2 provides a high-level illustration of the injection of FFR from different resource types. Note that this illustration is intended to be educational and does not necessarily reflect every specific generating resource installed in the field. Some of these responses are sustained throughout the entire frequency excursion event while others are non-sustained42 and only provide support during the arresting the phase. Studies are needed to coordinate requirements for FFR that may include the following considerations:
• Magnitude of response
• Speed of response (i.e., response time)
• Type of control
• Sustaining time
• Availability and repeatability of response Illustration of System Impacts of FFR To illustrate the impact that FFR has on the BPS, consider a system with increasing instantaneous penetration of inverter-based resources. Figure 2.3 shows simulations of an interconnected power system with high inverter-based resource penetration with different response times. The blue line shows the baseline system with all synchronous generators that have a relatively standard delay, providing turbine-governor control of around 100 ms. This time delay is in addition to a 50 ms time delay used in the measurement of frequency. If the time delay to respond to changing frequency were delayed further, to about 1 second (purple line), then the frequency nadir would deepen by about 50 mHz in this case. The initial ROCOF at the time of the disturbance would remain relatively unchanged since system inertia has not changed, and frequency settles back to the same setting point since the turbine-governor droop characteristics are also unchanged. Now consider the same system with 80% of the synchronous resources
39 Care must be taken when using step response as a form of FFR to ensure that no stability issues are introduced (i.e., transient stability issues or subsequent overfrequency). This requires careful analysis using stability studies to ensure reliable operation. Each frequency excursion events will require a different amount of energy injection to optimally arrest the frequency and return it to nominal. 40 Triggered by relay or break operation. 41 https://www.aemo.com.au/-/media/Files/Electricity/NEM/Security_and_Reliability/Reports/2017/2017-03-10-GE-FFR-Advisory-Report-Final---2017-3-9.pdf 42 Note that the wind-based FFR does not assume there is additional energy headroom to sustain the response (i.e., operating pre-disturbance at maximum available power). The solar response inherently is not able to provide additional energy when operating at maximum available power, and therefore assumes there is some additional energy headroom.

Chapter 2: Fast Frequency Response Concepts
NERC | White Paper: Fast Frequency Response | March 2020 10
offset with inverter-based resources that all provide primary frequency response. The assumption made here is that the inverter-based resources are of the same MVA rating as the replaced synchronous machines while also maintaining the same amount of headroom.
Figure 2.2: Illustration of Frequency Response from Different Resource Types

Chapter 2: Fast Frequency Response Concepts
NERC | White Paper: Fast Frequency Response | March 2020 11
Figure 2.3: Example Simulation of FFR with Varying Controls and IBR Penetrations
[Source: EPRI] The red, green, and orange lines show simulations with this configuration with 1 second, 500 ms, and 10 ms time delays of response, respectively. Note that the initial ROCOF is significantly higher since the system inertia has decreased drastically. In terms of the depth of the frequency nadir, the simulation with inverter-based resources with 500 ms delay is similar to the all-synchronous system with resources having a 100 ms delay. This is because the inverter-based resources are technically capable of responding quickly thereafter and are not constrained by mechanical limitations that the synchronous fleet may have. Again, note that performance will degrade when inverter-based resources delay response to 1 second, causing frequency to fall much further than the all-synchronous system. This is expected since the speed of response is the same, but the system inertia is much lower. Lastly, observe that the 80% inverter-based resource case with 10 ms delay provides significantly improved frequency response in terms of frequency nadir depth. While the system is acting much faster to the rapidly changing ROCOF, and the frequency nadir is reached much quicker, frequency control is simultaneously improved by the ability to provide fast power injection during the arresting period. This simulation is intended as an illustrative example of how frequency stability can be improved by using fast energy injection, particularly from inverter-based resources, when faced with a decreasing system inertia. However, as stated, this requires that the inverter-based resources have the capability to respond to underfrequency events and that the frequency responsive reserve is available to do so.43 In grids with high instantaneous penetration of inverter-based resources, these capabilities are necessary for reliable operation.
43 Note that in this case the system had about 17% frequency responsive reserves available; however, only 2.8% were used following the contingency.

NERC | White Paper: Fast Frequency Response | March 2020 12
Chapter 3: Concept of Critical Inertia Critical inertia can be defined as follows:
Critical Inertia: the minimum level of system inertia necessary to ensure that frequency responsive reserves44 have sufficient time to be deployed and prevent the operation of the first stage of UFLS after the largest credible contingency45
Critical inertia is broadly considered as a threshold for synchronous inertia where BPS performance requirements are no longer met given the speed of response and the amount of FFR and PFR available to support system frequency control. As the instantaneous penetration of inverter-based resources continues to increase, the risk of reaching critical inertia levels increases. Operating close to critical inertia means that the ROCOF after a large generation contingency is high. This is because, presently, inverter-based resources operating at maximum available power are not providing FFR or PFR and are displacing synchronous generators in the unit commitment that are able to provide frequency response.46 The critical inertia of a system is closely related to the initial ROCOF following the largest credible contingency. It is not a static value and is dependent on multiple factors: the amount of available FFR and PFR, the speed of response, the size of contingency, the UFLS threshold, and other factors described in Chapter 1. Figure 3.1 shows an example from ERCOT studies where the critical inertia can be lowered if frequency response from load resources or other types of FFR can be delivered faster.47 Similarly, the figure illustrates that if UFLS thresholds are lowered, the critical inertia value can also lowered. Lastly, although not illustrated in the figure, the critical inertia threshold also decreases if the size of the largest contingency decreases.
Figure 3.1: Critical Inertia Based on Time of Response [Source: ERCOT]
[Source: ERCOT] 44 Both FFR and PFR. 45 Generally, the largest credible contingency is referred to as the Resource Loss Protection Criteria in BAL-003. 46 This has been observed in ERCOT studies. ERCOT now determines critical inertia levels and monitors system inertia against these levels in real-time. Refer to the ERCOT white paper on inertia basics for more details on their implementation: http://www.ercot.com/content/wcm/lists/144927/Inertia_Basic_Concepts_Impacts_On_ERCOT_v0.pdf. 47 In this case, the y-axis is showing the time for frequency to decline from the load resource frequency trigger to the UFLS threshold following the largest credible contingency. If it is longer than 0.5 seconds, then at inertia levels below 94 GW*s, load resources providing FFR are not able to prevent the frequency from reaching UFLS levels after the largest credible contingency. This same concept would also apply for resources providing other forms of FRR as described in Chapter 2.
Chapter 3: Concept of Critical Inertia
NERC | White Paper: Fast Frequency Response | March 2020 13
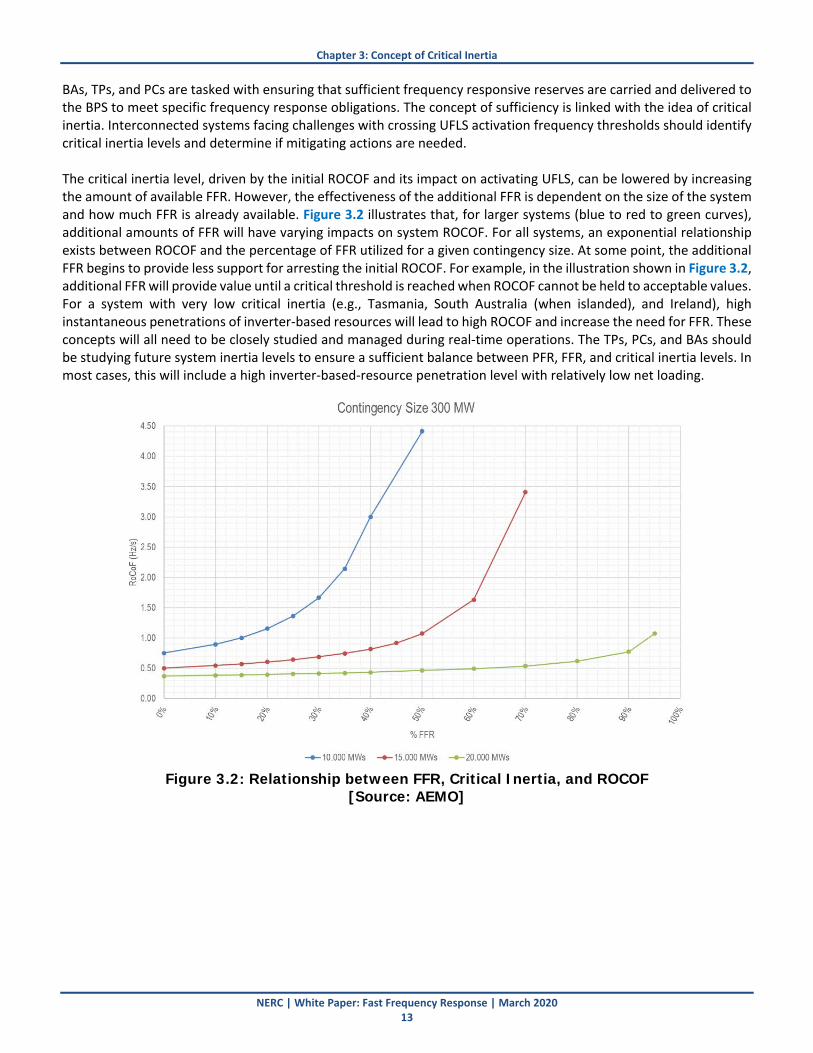
BAs, TPs, and PCs are tasked with ensuring that sufficient frequency responsive reserves are carried and delivered to the BPS to meet specific frequency response obligations. The concept of sufficiency is linked with the idea of critical inertia. Interconnected systems facing challenges with crossing UFLS activation frequency thresholds should identify critical inertia levels and determine if mitigating actions are needed. The critical inertia level, driven by the initial ROCOF and its impact on activating UFLS, can be lowered by increasing the amount of available FFR. However, the effectiveness of the additional FFR is dependent on the size of the system and how much FFR is already available. Figure 3.2 illustrates that, for larger systems (blue to red to green curves), additional amounts of FFR will have varying impacts on system ROCOF. For all systems, an exponential relationship exists between ROCOF and the percentage of FFR utilized for a given contingency size. At some point, the additional FFR begins to provide less support for arresting the initial ROCOF. For example, in the illustration shown in Figure 3.2, additional FFR will provide value until a critical threshold is reached when ROCOF cannot be held to acceptable values. For a system with very low critical inertia (e.g., Tasmania, South Australia (when islanded), and Ireland), high instantaneous penetrations of inverter-based resources will lead to high ROCOF and increase the need for FFR. These concepts will all need to be closely studied and managed during real-time operations. The TPs, PCs, and BAs should be studying future system inertia levels to ensure a sufficient balance between PFR, FFR, and critical inertia levels. In most cases, this will include a high inverter-based-resource penetration level with relatively low net loading.
Figure 3.2: Relationship between FFR, Critical Inertia, and ROCOF
[Source: AEMO]
NERC | White Paper: Fast Frequency Response | March 2020 14
Appendix A: References NERC References
• https://www.nerc.com/pa/Stand/Frequency%20Response%20Project%20200712%20Related%20Files%20DL/FRI_Report_091112_Draft.pdf
• https://www.nerc.com/pa/rrm/Webinars%20DL/Generator_Governor_Frequency_Response_Webinar_April_2015.pdf
• https://www.nerc.com/comm/Pages/Reliability-and-Security-Guidelines.aspx
• https://www.nerc.com/comm/OC_Reliability_Guidelines_DL/Primary_Frequency_Control_final.pdf
• https://www.nerc.com/comm/PC_Reliability_Guidelines_DL/Inverter-Based_Resource_Performance_Guideline.pdf
• https://www.nerc.com/comm/PC_Reliability_Guidelines_DL/Reliability_Guideline_IBR_Interconnection_Requirements_Improvements.pdf
Industry References
• https://www.aemo.com.au/-/media/Files/Electricity/NEM/Security_and_Reliability/Reports/2017/2017-03-10-GE-FFR-Advisory-Report-Final---2017-3-9.pdf
• http://www.eirgridgroup.com/site-files/library/EirGrid/DS3-System-Services-Protocol-Regulated-Arrangements-and-Fixed-Contracts.pdf
• http://www.ercot.com/content/wcm/lists/144927/Inertia_Basic_Concepts_Impacts_On_ERCOT_v0.pdf
• http://www.soni.ltd.uk/media/documents/Archive/RoCoF%20Modification%20Proposal%20TSOs%20Opinion.pdf
• http://www.hydroquebec.com/transenergie/fr/commerce/pdf/2_Requirements_generating_stations_D-2018-145_2018-11-15.pdf
• https://www.nationalgrideso.com/sites/eso/files/documents/Enhanced%20Frequency%20Response%20ITT%20v2_2%20clean.pdf
• http://web.mit.edu/windenergy/windweek/Presentations/GE%20Impact%20of%20Frequency%20Responsive%20Wind%20Plant%20Controls%20Pres%20and%20Paper.pdf
• https://www.ofgem.gov.uk/system/files/docs/2019/09/eso_technical_report_-_appendices_-_final.pdf National Laboratory References
• https://certs.lbl.gov/project/interconnection-frequency-response
• http://eta-publications.lbl.gov/sites/default/files/frequency_control_requirements_lbnl-2001103.pdf
• http://eta-publications.lbl.gov/sites/default/files/primary_frequency_response_lbnl-2001105.pdf
• https://certs.lbl.gov/publications/use-frequency-response-metrics-assess
• http://eta-publications.lbl.gov/sites/default/files/lbnl-4142e.pdf
NERC | White Paper: Fast Frequency Response | March 2020 15
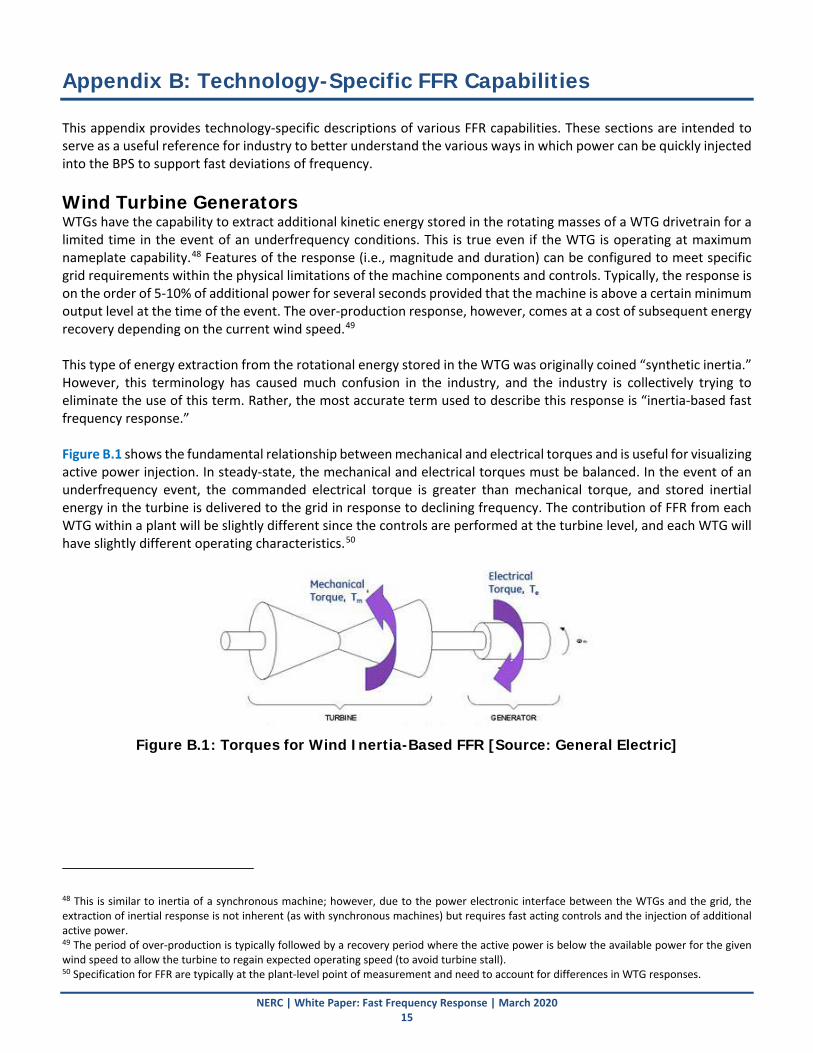
Appendix B: Technology-Specific FFR Capabilities This appendix provides technology-specific descriptions of various FFR capabilities. These sections are intended to serve as a useful reference for industry to better understand the various ways in which power can be quickly injected into the BPS to support fast deviations of frequency. Wind Turbine Generators WTGs have the capability to extract additional kinetic energy stored in the rotating masses of a WTG drivetrain for a limited time in the event of an underfrequency conditions. This is true even if the WTG is operating at maximum nameplate capability.48 Features of the response (i.e., magnitude and duration) can be configured to meet specific grid requirements within the physical limitations of the machine components and controls. Typically, the response is on the order of 5-10% of additional power for several seconds provided that the machine is above a certain minimum output level at the time of the event. The over-production response, however, comes at a cost of subsequent energy recovery depending on the current wind speed.49 This type of energy extraction from the rotational energy stored in the WTG was originally coined “synthetic inertia.” However, this terminology has caused much confusion in the industry, and the industry is collectively trying to eliminate the use of this term. Rather, the most accurate term used to describe this response is “inertia-based fast frequency response.” Figure B.1 shows the fundamental relationship between mechanical and electrical torques and is useful for visualizing active power injection. In steady-state, the mechanical and electrical torques must be balanced. In the event of an underfrequency event, the commanded electrical torque is greater than mechanical torque, and stored inertial energy in the turbine is delivered to the grid in response to declining frequency. The contribution of FFR from each WTG within a plant will be slightly different since the controls are performed at the turbine level, and each WTG will have slightly different operating characteristics.50
Figure B.1: Torques for Wind Inertia-Based FFR [Source: General Electric]
48 This is similar to inertia of a synchronous machine; however, due to the power electronic interface between the WTGs and the grid, the extraction of inertial response is not inherent (as with synchronous machines) but requires fast acting controls and the injection of additional active power. 49 The period of over-production is typically followed by a recovery period where the active power is below the available power for the given wind speed to allow the turbine to regain expected operating speed (to avoid turbine stall). 50 Specification for FFR are typically at the plant-level point of measurement and need to account for differences in WTG responses.
Appendix B: Technology-Specific FFR Capabilities
NERC | White Paper: Fast Frequency Response | March 2020 16
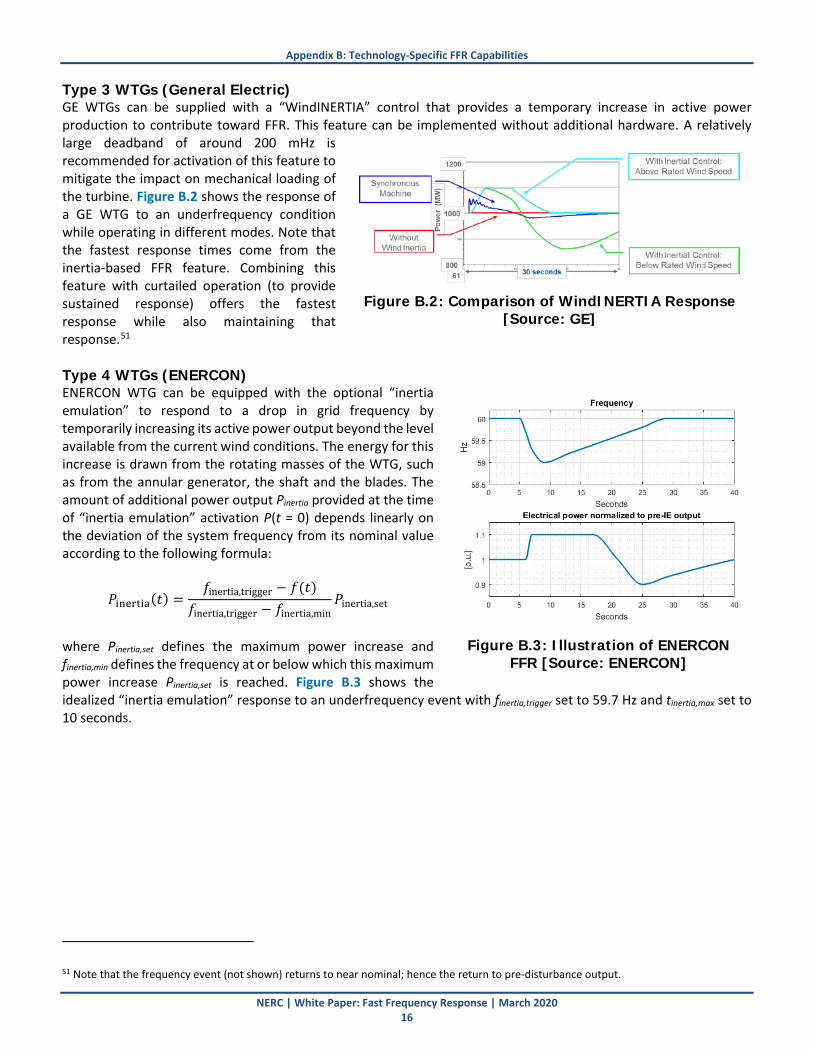
Type 3 WTGs (General Electric) GE WTGs can be supplied with a “WindINERTIA” control that provides a temporary increase in active power production to contribute toward FFR. This feature can be implemented without additional hardware. A relatively large deadband of around 200 mHz is recommended for activation of this feature to mitigate the impact on mechanical loading of the turbine. Figure B.2 shows the response of a GE WTG to an underfrequency condition while operating in different modes. Note that the fastest response times come from the inertia-based FFR feature. Combining this feature with curtailed operation (to provide sustained response) offers the fastest response while also maintaining that response.51 Type 4 WTGs (ENERCON) ENERCON WTG can be equipped with the optional “inertia emulation” to respond to a drop in grid frequency by temporarily increasing its active power output beyond the level available from the current wind conditions. The energy for this increase is drawn from the rotating masses of the WTG, such as from the annular generator, the shaft and the blades. The amount of additional power output Pinertia provided at the time of “inertia emulation” activation P(t = 0) depends linearly on the deviation of the system frequency from its nominal value according to the following formula:
𝑃𝑃inertia(𝑡𝑡) =𝑓𝑓inertia,trigger − 𝑓𝑓(𝑡𝑡)
𝑓𝑓inertia,trigger − 𝑓𝑓inertia,min𝑃𝑃inertia,set
where Pinertia,set defines the maximum power increase and finertia,min defines the frequency at or below which this maximum power increase Pinertia,set is reached. Figure B.3 shows the idealized “inertia emulation” response to an underfrequency event with finertia,trigger set to 59.7 Hz and tinertia,max set to 10 seconds.
51 Note that the frequency event (not shown) returns to near nominal; hence the return to pre-disturbance output.
Figure B.3: Illustration of ENERCON
FFR [Source: ENERCON]
Figure B.2: Comparison of WindINERTIA Response
[Source: GE]

Appendix B: Technology-Specific FFR Capabilities
NERC | White Paper: Fast Frequency Response | March 2020 17
Type 4 WTGs (Siemens Gamesa) Siemens Gamesa Renewable Energy WTGs use a feed-forward control52 (i.e., boost produced active power by a pre-determined, fixed amount) typically on the order of 6% of nameplate capability. This control occurs as soon as the frequency deviation falls outside a specified deadband. As described above, recovery after providing FFR depends on the incident wind speed, pre-disturbance operating condition, and other aspects of WTG operation. Figure B.4 shows the activation of FFR during a field test of five Type 4 WTGs each rated at 3.2 MW measured at the point of interconnection (top) and at each turbine (bottom). Plant output increases by 6% (1 MW) and the response is sustained for 9 seconds.53 This was done according to Hydro-Quebec’s technical requirements about frequency response. Solar Photovoltaic Solar PV inverters do not have any rotating components and therefore do not provide inertial or inertia-based response in the same manner as synchronous resources or wind turbines. The ability to provide fast-acting energy injection to the grid is solely based on the controls programmed into the inverters or plant-level controller. There is no standardized way for providing FFR, and therefore different manufacturers have implemented different types54 of controls that can provide FFR. Solar Photovoltaic (ABB) ABB solar inverters offer the possibility to implement frequency-watt characteristics either in the inverter controls or at the plant-level controller. When operating without energy storage, frequency-watt behavior is only possible for the overfrequency region (active power reduction). By using an energy storage system, this behavior can be expanded to the underfrequency region (active power increase). Solar Photovoltaic (General Electric) Frequency response controls can be implemented either at the inverter level or at the plant controller level. At the inverter level, many of the GE solar PV inverters have the capability of providing fast-acting frequency response using an active power-frequency droop characteristic. The plant controller can also be used to produce a frequency response from the complete plant. In this case, frequency response in the individual inverters is disabled and the curtailment or power limit signal from the plant controller (sent to each inverter and also working on a droop curve) is used to provide frequency response. Typically, plant controller based frequency responses have not been set up to be very fast.
52 This is in contrast to the active power-frequency control (“primary frequency response”) from the WTG, which will be a feedback control proportional to the frequency deviation that acts on a slower time scale. 53 This control includes monitoring of wind speed, power delivered, and generator speed, which dictate the ability of each WTG to provide FFR. The plant-level controller distributes FFR contributions to each WTG based on their FFR availability. Therefore, each WTG contributes a slightly different amount of FFR and has its own unique recovery characteristic. 54 Note that some inverter manufacturers have implemented controls that they have coined “inertial”; however, this white paper clarifies that these are not truly “inertial” response, and rather are a form of FFR.
Figure B.4: FFR Measured at POI and
WTGs [Source: SGRE]

Appendix B: Technology-Specific FFR Capabilities
NERC | White Paper: Fast Frequency Response | March 2020 18
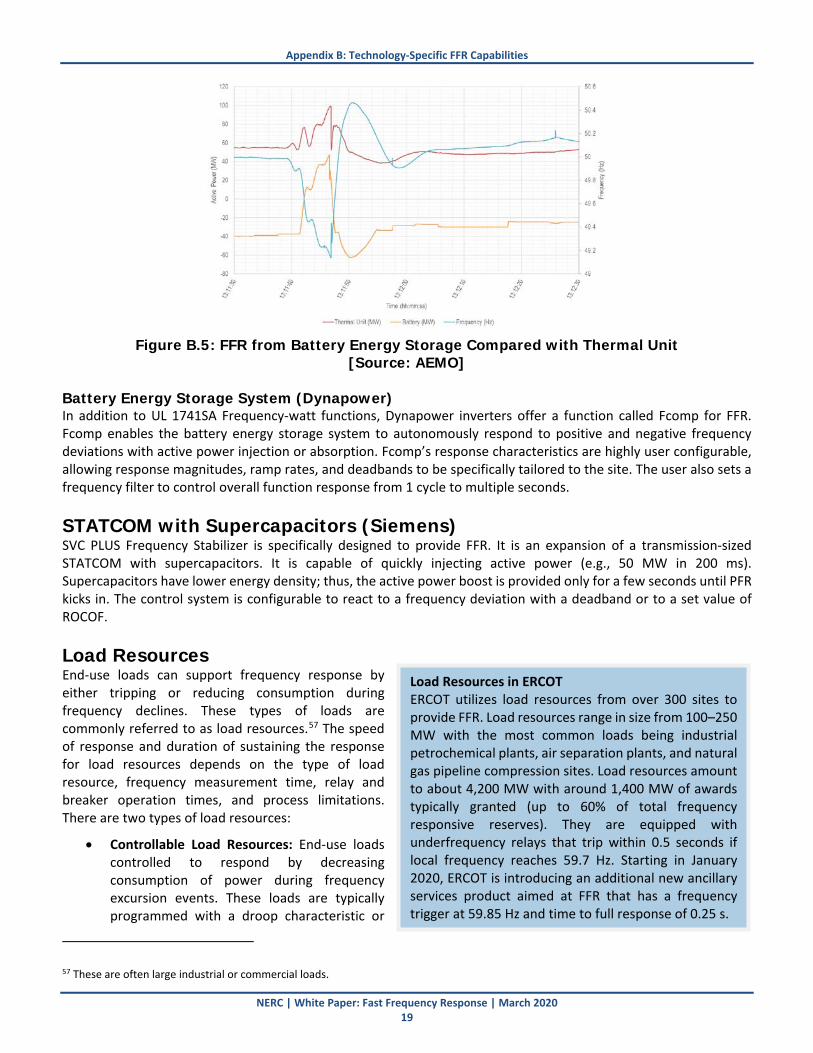
Solar Photovoltaic (SMA) SMA solar PV inverters can provide FFR when coupled with energy storage. The inverter reacts nearly instantaneously to a ROCOF event. The inverter “inertia response” (i.e., FFR) can be adapted to reflect different inertia (H) constants ranging from 2 seconds to 8 seconds. This control is parameterized via the speed of the nominal frequency droop characteristic. The energy storage must be sized carefully to provide the desired inertial response. SMA inverters also have active power-frequency functionality (referred to by SMA as “frequency/watt”) built in to the inverter functions. If the active power-frequency exceeds a defined threshold, the inverter reduces the active power feed-in. It can be selected whether the active power should be reduced by a gradient or a set power. Solar Photovoltaic (TMEIC) TMEIC currently has the capability to enable active power-frequency controls (also referred to by TMEIC as “frequency/watt”) upon request, which follows UL 1741SA.55 For IEC versions of equipment, TMEIC also follow the BDEW German frequency response curve requirements. Battery Energy Storage Systems Battery energy storage systems, similar to solar PV inverters have the ability to provide FFR based on the controls programmed into the inverters. These systems have the flexibility to rapidly change the injection or consumption of active power depending on state of charge at the time. Battery Energy Storage System (Tesla) Tesla inverters can provide both FFR and PFR for on-grid and off-grid applications. The key distinction is that the FFR is a sub-cycle response reacting to instantaneous changes and is tunable by an “inertia constant.” On the other hand, PFR is a response to filtered frequency changes and is tunable by changing the filter time constants down to the cycles time frame. Tesla uses the term “inertial response” when referring to FFR capability and “power-frequency droop response” when referring to active power-frequency controls. FFR response from BESS is highly tunable and also relatively quicker than a response from a thermal unit, particularly when the frequency suddenly changes direction (i.e. from under-frequency to over-frequency). Figure B.5 shows the comparison between a response from BESS and a thermal unit when the system experience frequency excursion in both directions. It is apparent that FFR provided from BESS can quickly change the direction to support frequency control.56
55 Note that UL 1741SA is a test certification standard required on most inverters being installed at both distribution- and BPS-connected facilities. However, UL 1741 has been misapplied in the past for BPS-connected facilities, using default IEEE 1547 settings for BPS plants. Refer to NERC Reliability Guideline: BPS-Connected Inverter-Based Resource Performance for more details: https://www.nerc.com/comm/PC_Reliability_Guidelines_DL/Inverter-Based_Resource_Performance_Guideline.pdf. 56 The Use of Battery Energy Storage Systems for System Integrity Protection Schemes in South Australian Power System”, N. Modi, B. Badrzadeh, S. Grogan, C. Noronha, CIGRE Science and Engineering Journal, June 2019.
Appendix B: Technology-Specific FFR Capabilities
NERC | White Paper: Fast Frequency Response | March 2020 19
Figure B.5: FFR from Battery Energy Storage Compared with Thermal Unit
[Source: AEMO] Battery Energy Storage System (Dynapower) In addition to UL 1741SA Frequency-watt functions, Dynapower inverters offer a function called Fcomp for FFR. Fcomp enables the battery energy storage system to autonomously respond to positive and negative frequency deviations with active power injection or absorption. Fcomp’s response characteristics are highly user configurable, allowing response magnitudes, ramp rates, and deadbands to be specifically tailored to the site. The user also sets a frequency filter to control overall function response from 1 cycle to multiple seconds. STATCOM with Supercapacitors (Siemens) SVC PLUS Frequency Stabilizer is specifically designed to provide FFR. It is an expansion of a transmission-sized STATCOM with supercapacitors. It is capable of quickly injecting active power (e.g., 50 MW in 200 ms). Supercapacitors have lower energy density; thus, the active power boost is provided only for a few seconds until PFR kicks in. The control system is configurable to react to a frequency deviation with a deadband or to a set value of ROCOF. Load Resources End-use loads can support frequency response by either tripping or reducing consumption during frequency declines. These types of loads are commonly referred to as load resources.57 The speed of response and duration of sustaining the response for load resources depends on the type of load resource, frequency measurement time, relay and breaker operation times, and process limitations. There are two types of load resources:
• Controllable Load Resources: End-use loads controlled to respond by decreasing consumption of power during frequency excursion events. These loads are typically programmed with a droop characteristic or
57 These are often large industrial or commercial loads.
Load Resources in ERCOT ERCOT utilizes load resources from over 300 sites to provide FFR. Load resources range in size from 100–250 MW with the most common loads being industrial petrochemical plants, air separation plants, and natural gas pipeline compression sites. Load resources amount to about 4,200 MW with around 1,400 MW of awards typically granted (up to 60% of total frequency responsive reserves). They are equipped with underfrequency relays that trip within 0.5 seconds if local frequency reaches 59.7 Hz. Starting in January 2020, ERCOT is introducing an additional new ancillary services product aimed at FFR that has a frequency trigger at 59.85 Hz and time to full response of 0.25 s.

Appendix B: Technology-Specific FFR Capabilities
NERC | White Paper: Fast Frequency Response | March 2020 20
responsive to ROCOF. Commercial and industrial loads often have electronically controlled motors and processes allowing more sophisticated response than traditional breaker-switched load shedding.
• Load Tripping: End-use loads that trip when a specific frequency or ROCOF threshold is reached. The frequency is measured locally, and then the loads are tripped quickly to help arrest the decline.
In regions where fast response is critical (e.g., South Australia), remedial action schemes may be used to detect a contingency event (e.g., loss of interconnecting tie line or large generator loss) and trip large load resources.58 Although use of such SPS requires time for event detection and communication to the load resources, it still takes less time than to measure and identify a frequency or ROCOF trigger. Many types of end-use loads have a small active power-frequency sensitivity that helps overall frequency response. This response is not relied upon to arrest frequency declines. Rather, it is represented in dynamic load models and accounted for in stability studies. Synchronous Machines Synchronous machines provide inertial support to the grid immediately following a sudden imbalance in generation and load, which deters a change in grid frequency. Additionally, some synchronous generating resources have turbine-governors that respond relatively quickly and can provide a noticeable amount of additional power prior to frequency reaching its nadir. Figure B.6 illustrates both these concepts. A frequency excursion occurs and frequency reaches its nadir about 6.5 seconds after the loss of generation. The red plot shows the inertial response from a machine with no turbine-governor. Power is injected to the grid as frequency falls and the resource settles back to its pre-disturbance output prior to reaching the nadir. The green plot shows the response of a machine with a fast-acting turbine-governor. This unit also experiences an inertial response as well as a sustained increase of power due to the turbine-governor. The additional power provided by both the inertial response and the fast-acting turbine-governor response help support arresting the frequency decline and reducing the magnitude of the initial ROCOF.
Figure B.6: Synchronous Inertia Response to Change in Grid Frequency
58 https://www.aemo.com.au/-/media/Files/Electricity/NEM/Security_and_Reliability/Reports/2017/2017-03-10-GE-FFR-Advisory-Report-Final---2017-3-9.pdf
Load Resources in Hydro Quebec Hydro Quebec implemented a pilot project for frequency-sensitive controls on residential electric water heaters. Proportional response with a frequency droop of 1% is achieved in less than 250 ms. Load reduction starts at 59.8 Hz and completes at 59.2 Hz. The measurement is realized every half cycle with an accuracy of approximately 2–5 mHz. The algorithm filters local events and faults on the system to prevent erroneous operation. Sustained response is provided for 15 minutes, after which time the load gradually returns to predisturbance levels.

NERC | White Paper: Fast Frequency Response | March 2020 21
Appendix C: Example Calculation of ROCOF This appendix provides illustrative examples of applying the ROCOF estimation technique to two different systems. Texas Interconnection Example Consider the frequency characteristic shown in Figure C.1. Pre-disturbance frequency at 19:47:13.15 is 60.014 Hz. Approximately 0.5 seconds after the disturbance, at 19:47:13.65, frequency has fallen to 59.98 Hz. ROCOF is calculated as
𝑅𝑅𝑅𝑅𝑅𝑅𝑅𝑅𝑅𝑅0.5 =𝑓𝑓0.5 − 𝑓𝑓00.5 𝑠𝑠𝑠𝑠𝑠𝑠
=60.014 − 59.98
0.5= 0.068 𝐻𝐻𝐻𝐻/𝑠𝑠𝑠𝑠𝑠𝑠
Estimating the time to the first stage of UFLS (assumed to be 59.3 Hz in this case), one can simply extrapolate this ROCOF further
𝑓𝑓𝑈𝑈𝑈𝑈𝑈𝑈𝑈𝑈 =∆𝑓𝑓𝑈𝑈𝑈𝑈𝑈𝑈𝑈𝑈
𝑅𝑅𝑅𝑅𝑅𝑅𝑅𝑅𝑅𝑅0.5=
60 − 59.30.068
= 10.3 𝑠𝑠𝑠𝑠𝑠𝑠
Using this relatively crude approximation, one could assume that frequency would hit UFLS levels in 10.3 seconds for a larger event, and that resources would need to respond quicker than this time frame providing FFR to mitigate operation of UFLS. Again, this is an approximation; more detailed engineering studies can be performed using transient simulation tools under critical inertia periods.
Figure C.1: Texas Interconnection ROCOF Estimation Example
Western Interconnection Example Larger interconnections often have a time lag before the system begins responding to imbalance between generation and load (i.e., following a generator tripping event) due to the large system inertia resisting change in speed (frequency). Consider Figure C.2 showing a large simulated generator tripping event in the Western Interconnection. Frequency starts at nominal 60 Hz and a large generator is tripped around 2.6 seconds. Frequency begins to rapidly fall, but note the slower roll-off of frequency at the onset of the event. Within the first 0.5 seconds, frequency has not yet begun to rapidly decline. Therefore, the estimation of the ROCOF (using the solid blue line) reports a ROCOF estimation that is actually lower in magnitude than the ROCOF reaches a few seconds later (denoted by the dotted blue line). This example illustrates that ROCOF estimation should be used with caution and is not well suited for systems with higher inertia (for the reasons mentioned above).

Appendix C: Example Calculation of ROCOF
NERC | White Paper: Fast Frequency Response | March 2020 22
Figure C.2: Western Interconnection ROCOF Estimation Example
NERC | White Paper: Fast Frequency Response | March 2020 23
Contributors NERC gratefully acknowledges the contributions and assistance of the following individuals in the preparation of this report. NERC also would like to acknowledge the technical discussions and contributions of the NERC Inverter-Based Resource Performance Task Force (IRPTF).
Name Entity Andrew Arana Florida Power and Light Jeff Billo (IRPTF Vice Chair) Electric Reliability Council of Texas Gary Chmiel GE Renewable Energy Kevin Collins First Solar Nicolas Compas Hydro Quebec Gary Custer SMA America Joe Eto Lawrence Berkeley National Laboratory Markus Fischer Enercon Venkat Konala First Solar Sergey Kynev Siemens Rajat Majumder Siemens Gamesa Renewable Energy Julia Matevosjana Electric Reliability Council of Texas Chris Milan First Solar Nick Miller HickoryLedge, LLC Sid Pant GE Renewable Energy Greg Park Northwest Power Pool Deepak Ramasubramanian Electric Power Research Institute Jeff Roesch TMEIC Allen Schriver (IRPTF Chair) NextEra Energy William Shultz Southern Company John Undrill John Undrill, LLC Nath Venkit GE Renewable Energy Rich Bauer (IRPTF Coordinator) North American Electric Reliability Corporation Elsa Prince North American Electric Reliability Corporation Ryan Quint (IRPTF Coordinator) North American Electric Reliability Corporation John Skeath North American Electric Reliability Corporation