fatigue assessment of crack growth based on …
TRANSCRIPT
Brodogradnja/Shipbuilding/Open access Volume 70 Number 1, 2019
11
Shilun Zhao
Chaohe Chen
Tianhui Fan*
Yong Jiang
Yijun Shen
http://dx.doi.org/10.21278/brod70102 ISSN 0007-215X
eISSN 1845-5859
FATIGUE ASSESSMENT OF CRACK GROWTH BASED ON FAILURE
ASSESSMENT DIAGRAMS FOR A SEMI-SUBMERSIBLE PLATFORM
UDC 629.563.21:629.5.015.4
Original scientific paper
Summary
This paper deals with the assessment of fatigue crack propagation on the connection
between column and brace for a semi-submersible. The analysis of global and local structural
responses under different sea states are performed to acquire the transfer functions of stresses.
Based on an existing crack the Failure Assessment Diagrams (FAD) are applied as criterion of
acceptance for the safety of crack and structure during the crack growth calculation cycle. The
crack growth rate considering threshold stress intensity factor and stress ratio is used. During
safety assessment the stress response from ultimate sea state is outlined. A comparison of
fatigue crack growth using ultimate stress and normal stress data with different crack growth
rate is presented. The results show the reliability of fatigue assessment using FAD as a
measurement of acceptability of crack propagation.
Key words: Crack propagation; Semi-submersible; FAD; Fracture mechanics;
Structural safety; Offshore platform
1. Introduction
Currently the S-N curve is still effective in engineering field for the fatigue life
estimation subjected to the initial state of crack failure. For ship structure that is exposed to
fatigue damage reliability-based method [1] is also used in the inspection planning or other
aspects corresponding to marine structures. Even aging effects on marine structure integrity
[2] are also considered in recent study. In general, the fatigue life is deemed on the occurrence
of crack or other types of severe structural defect. Fracture mechanics is introduced in the
fatigue assessment and becoming more popular in the aspect of crack propagation which is
specifically acknowledged as the second stage of the entire fatigue process. Due to the
complexity of the interaction between aggressive marine environment and fatigue wave load,
methods for fatigue crack assessment varies from many situations. Nevertheless, all the
practices are based on Paris Law [3] and Palmgren-Miner’s rule of cumulative damage ratio.
Throughout recent years several types of crack growth rate have been developed for the crack
growth calculation. McEvily [4] and his co-workers developed the modified constitutive
Shilun Zhao, Chaohe Chen Fatigue Assessment of Crack Growth Based on
Tianhui Fan, Yong Jiang, Yijun Shen Failure Assessment Diagrams for Semi-Submersible
12
relation which considered the initial defect and effects of load sequence. Huang and Moan
[5][6][7] presented the unique crack growth rate model which determined the material
constants for fatigue life prediction of structures subjected to various amplitude loading
history. Cui [8] applied this unique crack growth model into the crack growth calculation for
several key parts of a deep water semi-submersible.
As a long-term interaction between offshore structure and marine environment fatigue
assessment depends on various factors such as wave loading history, corrosion, wind and
other environmental attacks. A basic safety requirement during the crack growth process
should not be ignored and thus the Failure Assessment Diagrams (FAD) [9] is introduced in
each load cycle during the cracking process. In the field of subsea pipeline, the FAD have
been a useful tool for assessing the acceptability of flawed pipelines and also in the fatigue
assessment for tubular joints [11] even for non-metallic materials safety assessment [12].
However only constant amplitude loading is used in the normal FAD process and irregular
random wave loads are dominant in fatigue assessment. This paper provides a method for
using irregular wave load with FAD and performs fatigue assessment of an existing crack.
After the global and local structural response analysis, the crack growth calculation will
consider the ultimate stress for safety assessment in FAD process. To use random loads, the
fatigue wave load history is applied by combining the stress transfer function and wave scatter
diagram. It is necessary to split the fatigue wave load into separate cycle for creating single
load case for every step of crack growth. Then a comparison is presented for discussion of
using ultimate stress response and stress generated by wave loading history in the crack
growth calculation. The results show the feasibility and reliability of the method in fatigue
crack growth calculation and assessment.
2. Analysis Approach
2.1 Separate Fatigue load cycles
For better understanding a comparison of S-N curve and FAD is listed below in Table 1.
Table 1 Methods Comparison of S-N Curve and FAD
Description S-N curve FAD
Considering crack growth No Yes
Stage of fatigue development Until occurrence of crack Until failure of crack
Criterion of structure failure Crack(s) found FAD outreached
Fatigue load Long term load distribution Regular constant amplitude load
Considering sequence of loads No No
Considering stress components No Yes
Using crack growth rate No Yes
Crack safety evaluation No Yes
Considering random wave load Yes No
From Table 1 the advantages of introducing FAD into offshore structure fatigue
assessment are clearly demonstrated. The only problem is implementing irregular wave load
into Separate assessment cycle. According to BS 7910 for the situation of using variable
amplitude loading, the stress spectrum should be represented as a distribution of stress ranges
versus numbers of occurrences [9]. Based on the P-M rules of linear damage accumulation,
the wave scatter diagram can be introduced for dividing the consecutive long-term load
distribution into Separate cycles. In this paper wave scatter diagrams in respect to 8
Fatigue Assessment of Crack Growth Based on Shilun Zhao, Chaohe Chen
Failure Assessment Diagrams for Semi-Submersible Tianhui Fan, Yong Jiang, Yijun Shen
13
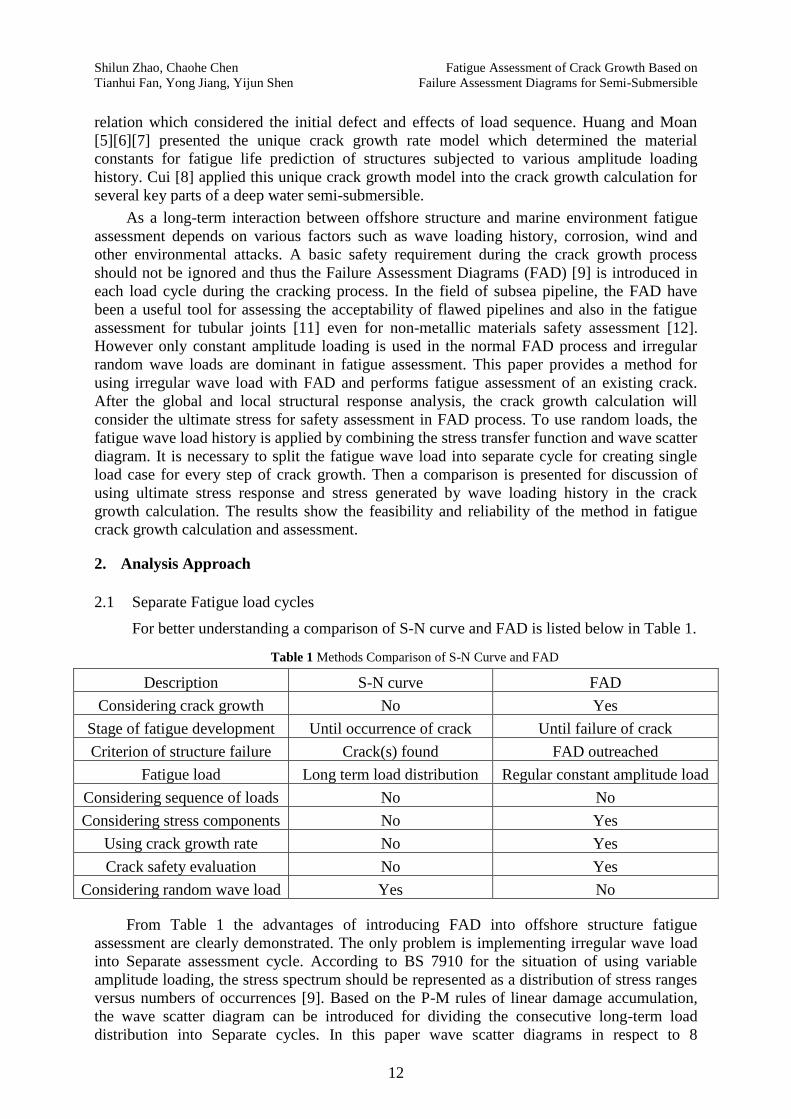
directional sea states are provided by CNOOC Energy Technology & Services Limited. A
diagram of North direction to the semisubmersible is listed below in Table 2.
Table 2 Wave Scatter Data in North Direction (%)
(m) (m) Total
<2 2~3 3~4 4~6 6~8 8~10 >10
0 - - 0 0 0 - - 0
0~0.5 - - 0.05 0.17 0.01 - - 0.22
0.5~1 - - 0 0.57 0.05 0 - 0.61
1~1.5 - - - 0.19 0.04 0.01 - 0.23
1.5~2 - - - 0.03 0.11 0.02 - 0.16
2~2.5 - - - 0.01 0.1 0.01 - 0.12
2.5~3 - - - - 0.23 0.05 0 0.28
3~3.5 - - - - 0.01 0.11 0.01 0.14
3.5~4 - - - - 0.01 0.03 0 0.04
4~4.5 - - - - 0 0 - 0
4.5~5 - - - - - - - 0
>5 - - - - - - - -
Total 0 0 0.05 0.96 0.56 0.23 0.01 1.8
In Table 2 and are presenting significant wave height and average cross zero
period respectively. For a specific significant wave height the fatigue stress range can
be described as
(1)
where is stress range under unit wave height by picking maximum stress and
minimum stress from stress transfer functions at different phase positions under the same
period.
Supposed the annual cycle number of under is then
(2)
where is the cross zero period of and is the probabilistic occurrence rate of and
.
Based on above separation process of irregular wave loads the fatigue assessment of
crack growth can be represented as a series of versus . This is a method for assessing
the acceptability of crack growth in each fatigue cycle using FAD under irregular amplitude
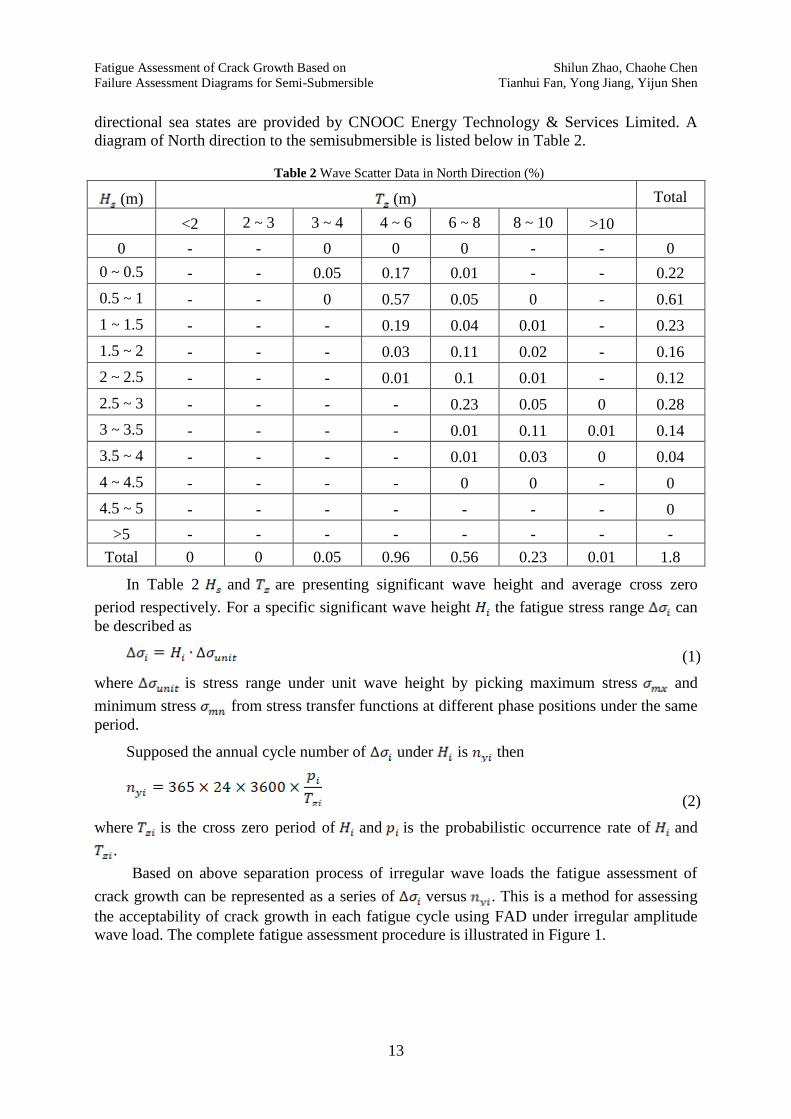
wave load. The complete fatigue assessment procedure is illustrated in Figure 1.
Shilun Zhao, Chaohe Chen Fatigue Assessment of Crack Growth Based on
Tianhui Fan, Yong Jiang, Yijun Shen Failure Assessment Diagrams for Semi-Submersible
14
Fig.1 Fatigue Assessment Flowchart
Crack growth cycle starts from the 1st wave direction which is followed by picking up
the periods. Under the specific period all the wave heights in the wave scatter data will be
applied with the stress range in the calculation of SIF. The crack growth cycle number under a
specific aligns with . Namely the propagation process proceeds with different
under corresponding . A new crack growth generation under a new starts with the
end of previous number of . A year is counted when all the wave directions and periods are
used in the crack propagation process.
The overall procedure relies on FEM analysis of the semisubmersible. The structural
stress responses are obtained from the FEM analysis under various sea states. The stress
transfer functions are extracted from previous step under unit wave amplitude. For the weld
geometry of the cracked component, the hot spot stress is calculated via extrapolation
from stresses and at readout points 0.5t and 1.5t [12],
(3)
When the stress ranges are all prepared then stress intensity factor (SIF) can be
calculated for the fatigue assessment with other parameters determined by the weld profile
and the crack, such as initial crack size in depth , crack size in width , angle from to
, etc. The fatigue assessment processes with the crack growth rate under a single load cycle
to obtain an increment on the crack growth size up to the critical crack size . Before
generating a new crack size the FAD is used to analyze the acceptability of
the . For conservatism the stress responses under potential critical wave load used in the
FAD assessment to evaluate the crack growth status while the wave scatter data is used in
calculating the crack propagation increments. This procedure continues until the assessment
point of outreaches the assessment line which presents the acceptable limit. At this stage
the crack is deemed as failure and the fatigue life of the welded structure is set due. The
Fatigue Assessment of Crack Growth Based on Shilun Zhao, Chaohe Chen
Failure Assessment Diagrams for Semi-Submersible Tianhui Fan, Yong Jiang, Yijun Shen
15
sequence of 8 diagrams applied in crack growth cycles is in clockwise from North to North
West. A reversed sequence of diagrams is also performed in the crack growth process using
Paris law for comparison. Since it is based on the Palmgren-Miner’s rule of a linear crack
growth accumulation, the effect of loading sequence of stress range within each diagram is
ignored.
2.2 Failure Assessment Diagrams (FAD)
These diagrams are one of the main engineering tools for assessing the fracture-plastic
collapse in the cracked components. Simultaneously the fracture and plastic collapse are
assessed by normalized parameters fracture ratio and load ratio defined as following,
(4)
(5)
The fracture ratio of to , corresponding to stress intensity factor and material
fracture toughness respectively, evaluates the current cracked component against fracture. The
load ratio of to , representing the reference stress and yield strength, is to evaluate the
component against plastic collapse. The reference stress varies from different types of
crack. Nevertheless, it is defined by primary membrane and bending stress components ,
also by crack depth , crack width , plate thickness and width in plane of flaw . For the
case of surface flaw under normal bending strain considered in this paper, is defined as
following,
(6)
where
(7)
(8)
Corresponding to various types of crack which is denoted as flaw in the BS 7910:2013
[9], the specifications of can be referred in Annex M and P of the document.
Generally, the failure assessment line is defined as following,
(9)
It will be modified due to different situations such as requirement of stress-strain data or
ductile tearing. According to BS 7910 Option 1 approach is selected because of lacking
uniaxial tensile stress-strain data and not considering ductile crack growth. For these two
situations Option 2 and Option 3 approaches are introduced in BS 7910. The assessment line
of Option 1 is defined as below,
(10)
Shilun Zhao, Chaohe Chen Fatigue Assessment of Crack Growth Based on
Tianhui Fan, Yong Jiang, Yijun Shen Failure Assessment Diagrams for Semi-Submersible
16
where , are defined as
(11)
(12)
In the equation represents tensile strength of material and is elastic modulus.
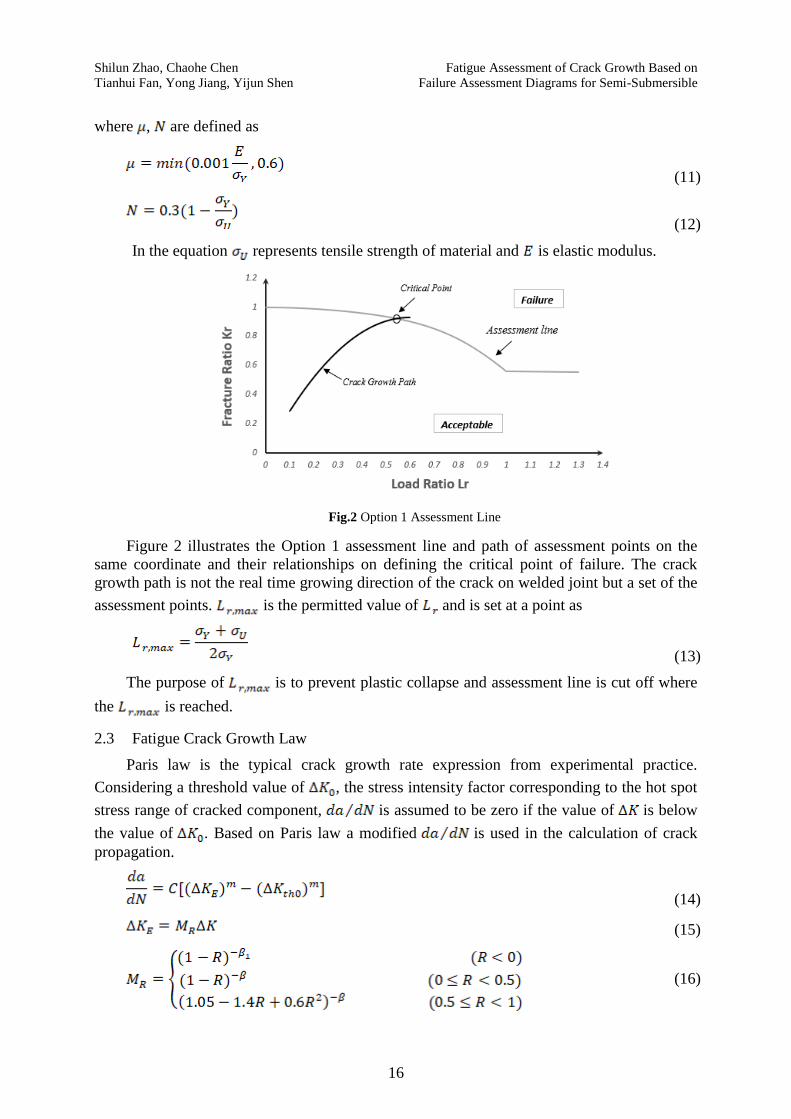
Fig.2 Option 1 Assessment Line
Figure 2 illustrates the Option 1 assessment line and path of assessment points on the
same coordinate and their relationships on defining the critical point of failure. The crack
growth path is not the real time growing direction of the crack on welded joint but a set of the
assessment points. is the permitted value of and is set at a point as
(13)
The purpose of is to prevent plastic collapse and assessment line is cut off where
the is reached.
2.3 Fatigue Crack Growth Law
Paris law is the typical crack growth rate expression from experimental practice.
Considering a threshold value of , the stress intensity factor corresponding to the hot spot
stress range of cracked component, is assumed to be zero if the value of is below
the value of . Based on Paris law a modified is used in the calculation of crack
propagation.
(14)
(15)
(16)
Fatigue Assessment of Crack Growth Based on Shilun Zhao, Chaohe Chen
Failure Assessment Diagrams for Semi-Submersible Tianhui Fan, Yong Jiang, Yijun Shen
17
This is the unique crack growth rate developed by Huang [5] for the fatigue life
prediction of marine steel structures. Since crack growth rates of welded joint under different
applied loading ratios behaves independently, the purpose of bringing up this modified crack
growth rate is to establish a concise model for crack growth data under different stress ratios
to the curve corresponding to . and are stress intensity factor and
threshold value on the level of . is the modifying factor for stress ratio . According
to Huang [5,6,7], most of the crack growth rate data gathers around the curve on the level of
after transferring the data into data.
In equation and are parameters depending on material property and environment.
Material constants are these corresponding to . For offshore structures Huang [5]
recommends
(17)
(18)
Huang [5] also recommends the mean value crack growth rate under insufficient data for
material if the unique crack growth rate is applied
(19)
Besides Huang’s recommendation the crack growth rate based on Paris law
(20)
is assumed to be a reference compared to the mean value crack growth rate. Constants
that depend on material and the applied conditions differ in two situations. Both values
of and for Paris law are defined in BS 7910:2013 [9].
For the simplified fatigue crack growth rate and under the
marine environment at temperatures up to 20℃, with or without cathodic protection, both
values above are recommended for steels (excluding austenitic stainless steels). Due to
situation of overtaken design fatigue life and the cathodic protection has lost effect, the
fatigue crack growth threshold for welded joint is set to .
2.4 Stress Intensity Factor for Fatigue Assessment
The stress intensity factor is determined by following equation
(18)
where is the stress intensity correction factor. It contains the primary stress and
secondary stress components specifically defined in BS 7910:2013 and for the fatigue
assessment only primary stress components offer contribution on the crack growth.
Nevertheless, for the fracture assessment both stress components are necessarily considered
[9].
Shilun Zhao, Chaohe Chen Fatigue Assessment of Crack Growth Based on
Tianhui Fan, Yong Jiang, Yijun Shen Failure Assessment Diagrams for Semi-Submersible
18
3. Analysis Approach
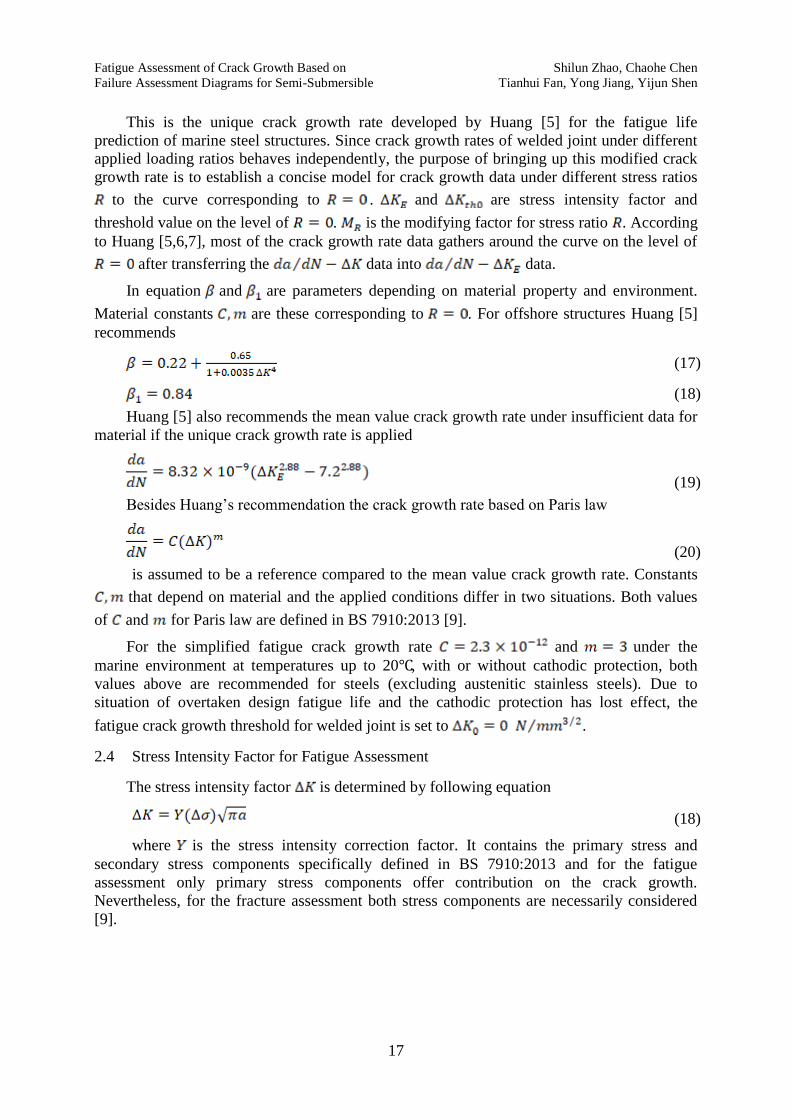
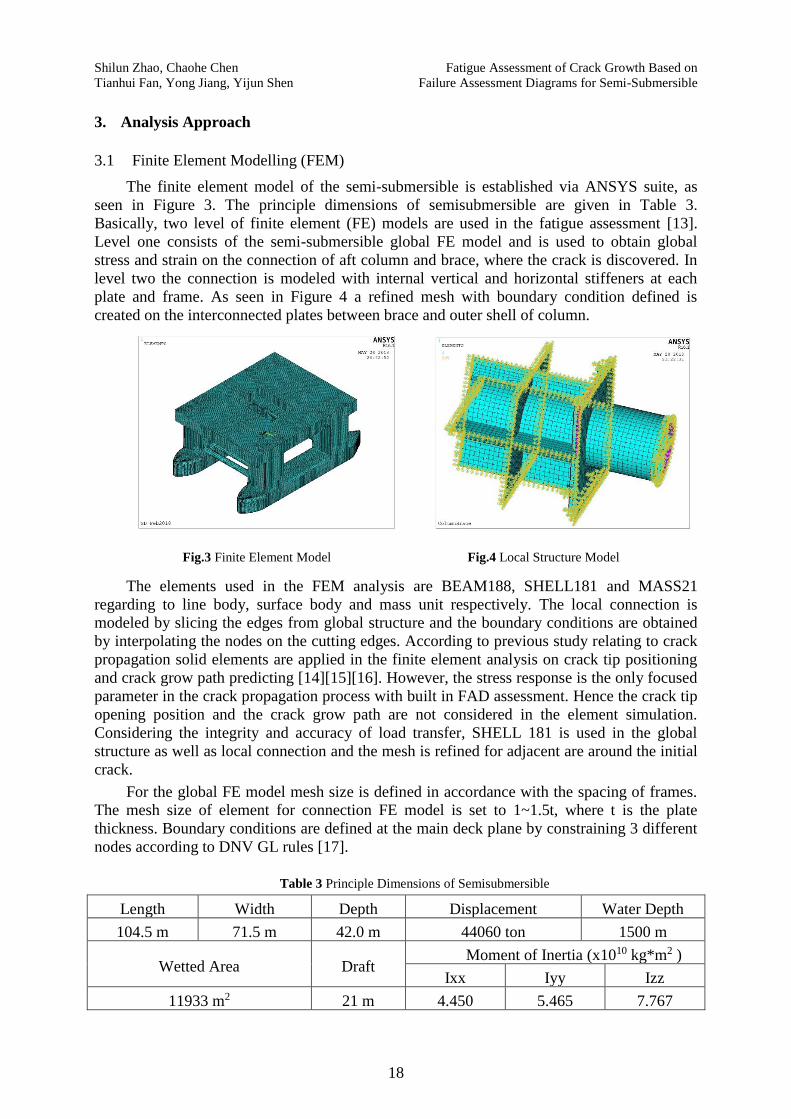
3.1 Finite Element Modelling (FEM)
The finite element model of the semi-submersible is established via ANSYS suite, as
seen in Figure 3. The principle dimensions of semisubmersible are given in Table 3.
Basically, two level of finite element (FE) models are used in the fatigue assessment [13].
Level one consists of the semi-submersible global FE model and is used to obtain global
stress and strain on the connection of aft column and brace, where the crack is discovered. In
level two the connection is modeled with internal vertical and horizontal stiffeners at each
plate and frame. As seen in Figure 4 a refined mesh with boundary condition defined is
created on the interconnected plates between brace and outer shell of column.
Fig.3 Finite Element Model Fig.4 Local Structure Model
The elements used in the FEM analysis are BEAM188, SHELL181 and MASS21
regarding to line body, surface body and mass unit respectively. The local connection is
modeled by slicing the edges from global structure and the boundary conditions are obtained
by interpolating the nodes on the cutting edges. According to previous study relating to crack
propagation solid elements are applied in the finite element analysis on crack tip positioning
and crack grow path predicting [14][15][16]. However, the stress response is the only focused
parameter in the crack propagation process with built in FAD assessment. Hence the crack tip
opening position and the crack grow path are not considered in the element simulation.
Considering the integrity and accuracy of load transfer, SHELL 181 is used in the global
structure as well as local connection and the mesh is refined for adjacent are around the initial
crack.
For the global FE model mesh size is defined in accordance with the spacing of frames.
The mesh size of element for connection FE model is set to 1~1.5t, where t is the plate
thickness. Boundary conditions are defined at the main deck plane by constraining 3 different
nodes according to DNV GL rules [17].
Table 3 Principle Dimensions of Semisubmersible
Length Width Depth Displacement Water Depth
104.5 m 71.5 m 42.0 m 44060 ton 1500 m
Wetted Area Draft Moment of Inertia (x1010 kg*m2 )
Ixx Iyy Izz
11933 m2 21 m 4.450 5.465 7.767
Fatigue Assessment of Crack Growth Based on Shilun Zhao, Chaohe Chen
Failure Assessment Diagrams for Semi-Submersible Tianhui Fan, Yong Jiang, Yijun Shen
19
8 different sea states headings aligned with 8 directional wave scatter diagrams are
considered during the hydrodynamic pressure analysis from to with interval of
and 18 periods from to with interval of . According to DNV GL codes [18] each
load case corresponding to one period and one wave heading should be calculated at two-time
instances, namely corresponding to a wave crest amidships and a wave zero crossing at the
same point. Thus, two phase positions of and are applied in each period and a total
number of load case is while the number of stress range is .
These pressures applied on the subsea part of structure under different sea state are transferred
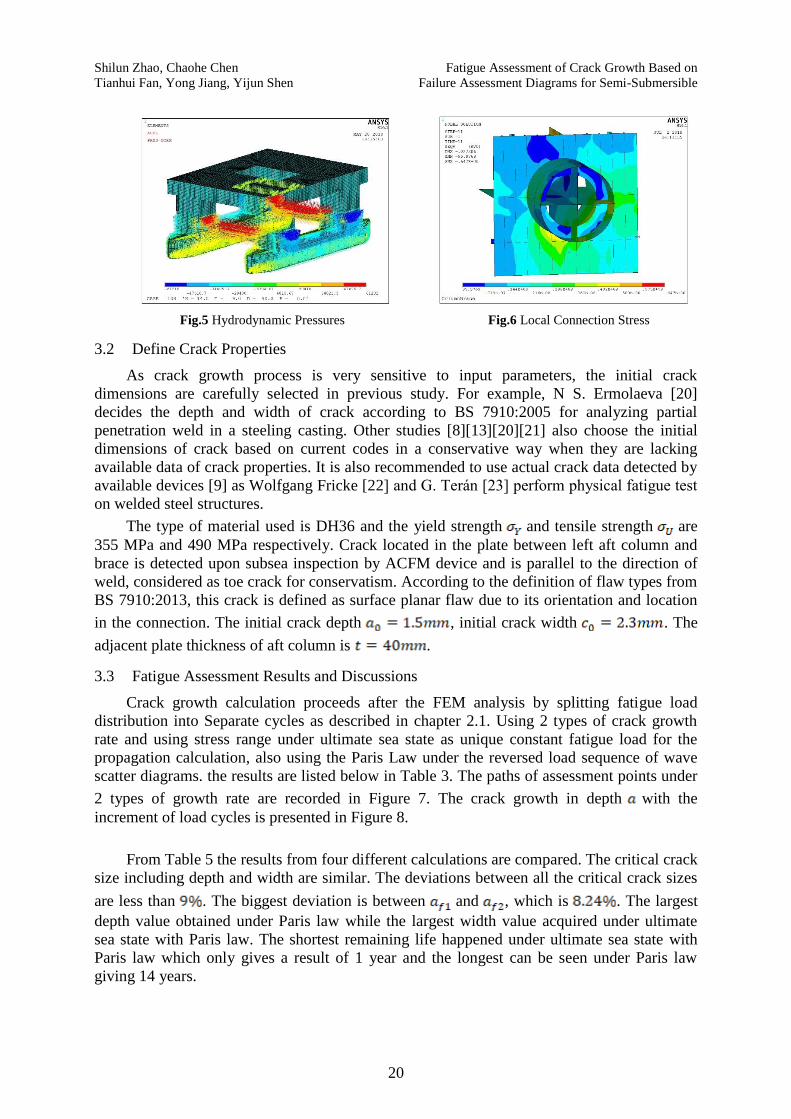
by AQWA WAVE as Figure 5 shows. During the FE analysis of global structure several
characteristic hydrodynamic responses are considered for potential strength failure, such as
split force between pontoons , torsion moment about a transverse horizontal axis ,
longitudinal shear force between the pontoons , longitudinal acceleration of deck mass ,
transverse acceleration of deck mass , vertical acceleration of deck mass . Definitions for
these kinds of responses are given in DNV GL codes [18] and these types of responses
correlate to various potential critical load cases of the structure. A design wave approach [18]
is applied for the semi-submersible platform to define design wave loads and to evaluate the
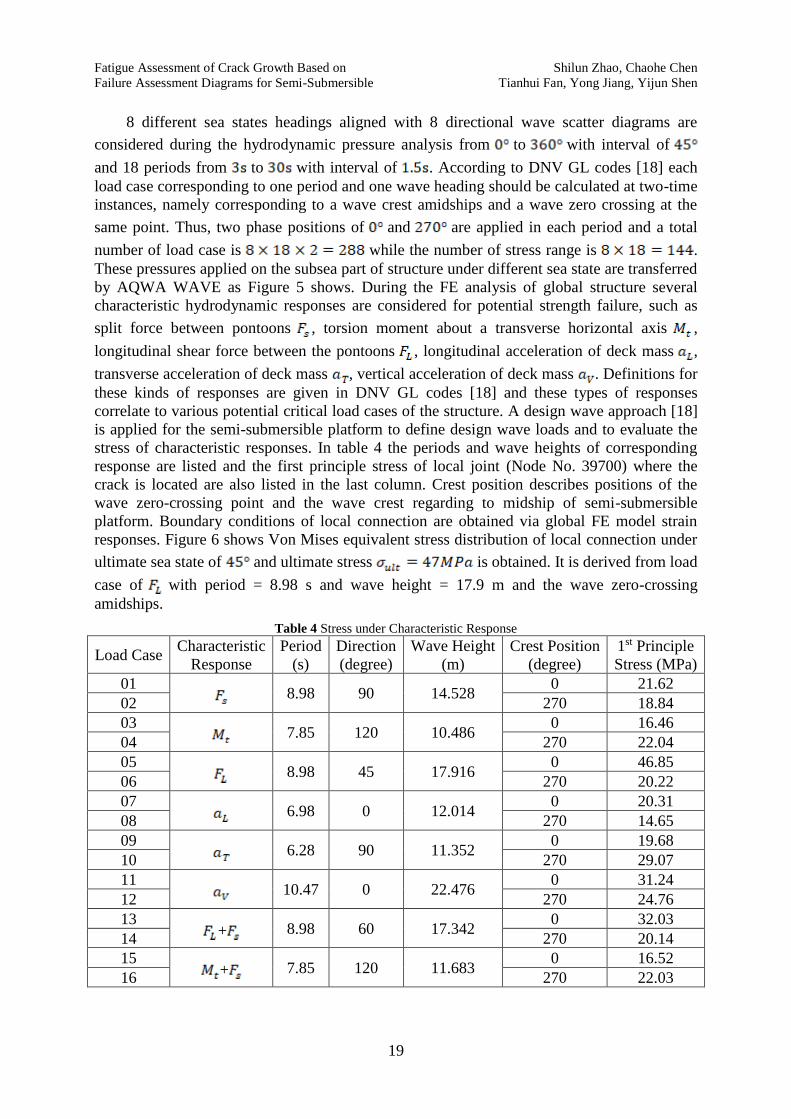
stress of characteristic responses. In table 4 the periods and wave heights of corresponding
response are listed and the first principle stress of local joint (Node No. 39700) where the
crack is located are also listed in the last column. Crest position describes positions of the
wave zero-crossing point and the wave crest regarding to midship of semi-submersible
platform. Boundary conditions of local connection are obtained via global FE model strain
responses. Figure 6 shows Von Mises equivalent stress distribution of local connection under
ultimate sea state of and ultimate stress is obtained. It is derived from load
case of with period = 8.98 s and wave height = 17.9 m and the wave zero-crossing
amidships.
Table 4 Stress under Characteristic Response
Load Case Characteristic
Response
Period
(s)
Direction
(degree)
Wave Height
(m)
Crest Position
(degree)
1st Principle
Stress (MPa)
01 8.98 90 14.528
0 21.62
02 270 18.84
03 7.85 120 10.486
0 16.46
04 270 22.04
05 8.98 45 17.916
0 46.85
06 270 20.22
07 6.98 0 12.014
0 20.31
08 270 14.65
09 6.28 90 11.352
0 19.68
10 270 29.07
11 10.47 0 22.476
0 31.24
12 270 24.76
13 + 8.98 60 17.342
0 32.03
14 270 20.14
15 + 7.85 120 11.683
0 16.52
16 270 22.03
Shilun Zhao, Chaohe Chen Fatigue Assessment of Crack Growth Based on
Tianhui Fan, Yong Jiang, Yijun Shen Failure Assessment Diagrams for Semi-Submersible
20
Fig.5 Hydrodynamic Pressures Fig.6 Local Connection Stress
3.2 Define Crack Properties
As crack growth process is very sensitive to input parameters, the initial crack
dimensions are carefully selected in previous study. For example, N S. Ermolaeva [20]
decides the depth and width of crack according to BS 7910:2005 for analyzing partial
penetration weld in a steeling casting. Other studies [8][13][20][21] also choose the initial
dimensions of crack based on current codes in a conservative way when they are lacking
available data of crack properties. It is also recommended to use actual crack data detected by
available devices [9] as Wolfgang Fricke [22] and G. Terán [23] perform physical fatigue test
on welded steel structures.
The type of material used is DH36 and the yield strength and tensile strength are
355 MPa and 490 MPa respectively. Crack located in the plate between left aft column and
brace is detected upon subsea inspection by ACFM device and is parallel to the direction of
weld, considered as toe crack for conservatism. According to the definition of flaw types from
BS 7910:2013, this crack is defined as surface planar flaw due to its orientation and location
in the connection. The initial crack depth , initial crack width . The
adjacent plate thickness of aft column is .
3.3 Fatigue Assessment Results and Discussions
Crack growth calculation proceeds after the FEM analysis by splitting fatigue load
distribution into Separate cycles as described in chapter 2.1. Using 2 types of crack growth
rate and using stress range under ultimate sea state as unique constant fatigue load for the
propagation calculation, also using the Paris Law under the reversed load sequence of wave
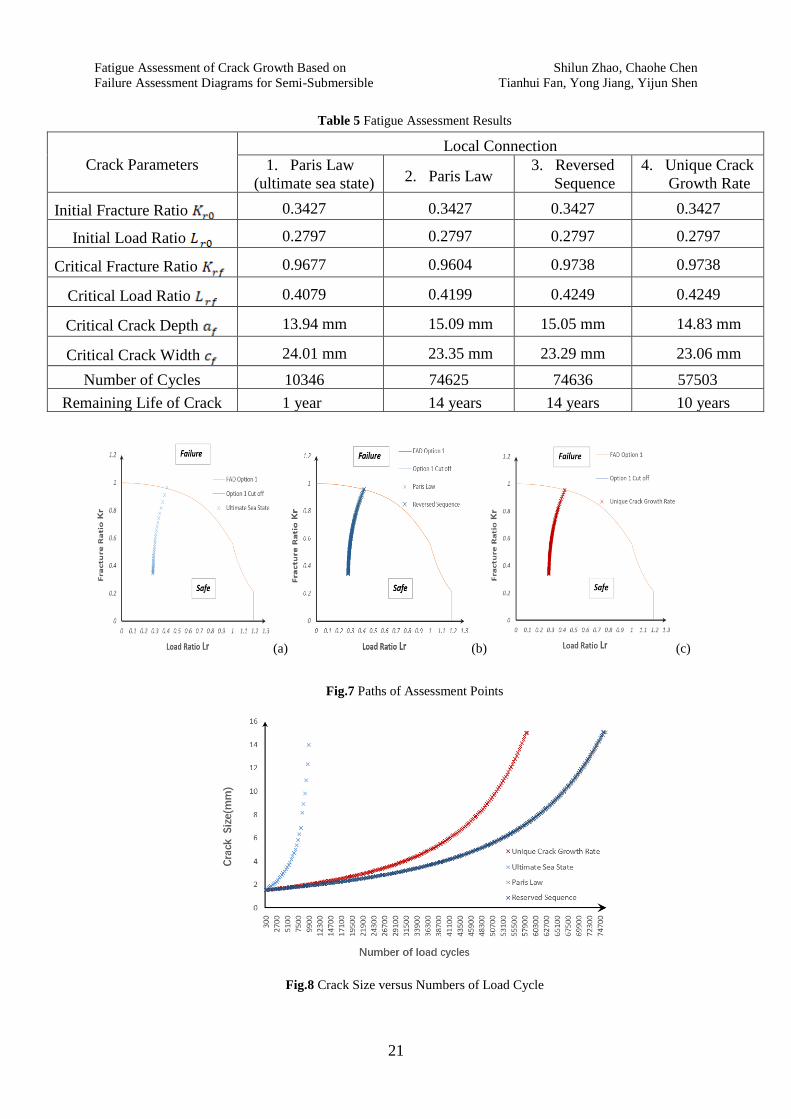
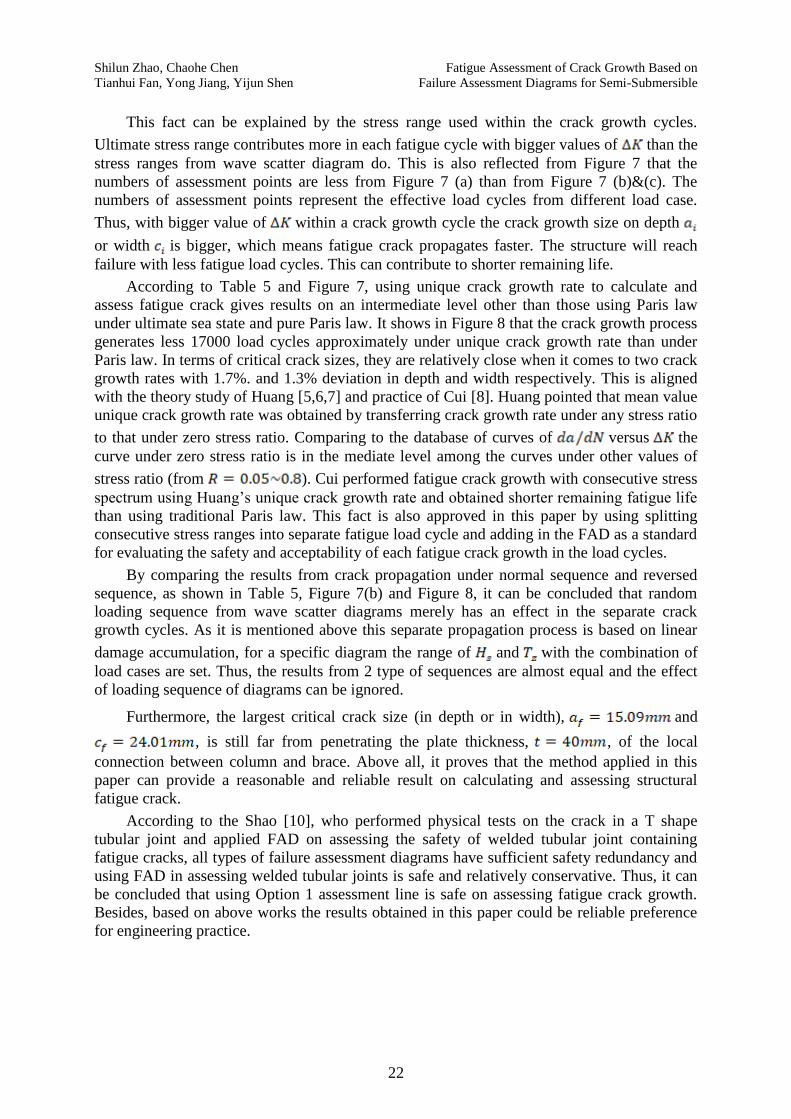
scatter diagrams. the results are listed below in Table 3. The paths of assessment points under
2 types of growth rate are recorded in Figure 7. The crack growth in depth with the
increment of load cycles is presented in Figure 8.
From Table 5 the results from four different calculations are compared. The critical crack
size including depth and width are similar. The deviations between all the critical crack sizes
are less than . The biggest deviation is between and , which is . The largest
depth value obtained under Paris law while the largest width value acquired under ultimate
sea state with Paris law. The shortest remaining life happened under ultimate sea state with
Paris law which only gives a result of 1 year and the longest can be seen under Paris law
giving 14 years.
Fatigue Assessment of Crack Growth Based on Shilun Zhao, Chaohe Chen
Failure Assessment Diagrams for Semi-Submersible Tianhui Fan, Yong Jiang, Yijun Shen
21
Table 5 Fatigue Assessment Results
Crack Parameters
Local Connection
1. Paris Law
(ultimate sea state) 2. Paris Law 3. Reversed
Sequence
4. Unique Crack
Growth Rate
Initial Fracture Ratio 0.3427 0.3427 0.3427 0.3427
Initial Load Ratio 0.2797 0.2797 0.2797 0.2797
Critical Fracture Ratio 0.9677 0.9604 0.9738 0.9738
Critical Load Ratio 0.4079 0.4199 0.4249 0.4249
Critical Crack Depth 13.94 mm 15.09 mm 15.05 mm 14.83 mm
Critical Crack Width 24.01 mm 23.35 mm 23.29 mm 23.06 mm
Number of Cycles 10346 74625 74636 57503
Remaining Life of Crack 1 year 14 years 14 years 10 years
(a) (b) (c)
Fig.7 Paths of Assessment Points
Fig.8 Crack Size versus Numbers of Load Cycle
Shilun Zhao, Chaohe Chen Fatigue Assessment of Crack Growth Based on
Tianhui Fan, Yong Jiang, Yijun Shen Failure Assessment Diagrams for Semi-Submersible
22
This fact can be explained by the stress range used within the crack growth cycles.
Ultimate stress range contributes more in each fatigue cycle with bigger values of than the
stress ranges from wave scatter diagram do. This is also reflected from Figure 7 that the
numbers of assessment points are less from Figure 7 (a) than from Figure 7 (b)&(c). The
numbers of assessment points represent the effective load cycles from different load case.
Thus, with bigger value of within a crack growth cycle the crack growth size on depth
or width is bigger, which means fatigue crack propagates faster. The structure will reach
failure with less fatigue load cycles. This can contribute to shorter remaining life.
According to Table 5 and Figure 7, using unique crack growth rate to calculate and
assess fatigue crack gives results on an intermediate level other than those using Paris law
under ultimate sea state and pure Paris law. It shows in Figure 8 that the crack growth process
generates less 17000 load cycles approximately under unique crack growth rate than under
Paris law. In terms of critical crack sizes, they are relatively close when it comes to two crack
growth rates with 1.7%. and 1.3% deviation in depth and width respectively. This is aligned
with the theory study of Huang [5,6,7] and practice of Cui [8]. Huang pointed that mean value
unique crack growth rate was obtained by transferring crack growth rate under any stress ratio
to that under zero stress ratio. Comparing to the database of curves of versus the
curve under zero stress ratio is in the mediate level among the curves under other values of
stress ratio (from ). Cui performed fatigue crack growth with consecutive stress
spectrum using Huang’s unique crack growth rate and obtained shorter remaining fatigue life
than using traditional Paris law. This fact is also approved in this paper by using splitting
consecutive stress ranges into separate fatigue load cycle and adding in the FAD as a standard
for evaluating the safety and acceptability of each fatigue crack growth in the load cycles.
By comparing the results from crack propagation under normal sequence and reversed
sequence, as shown in Table 5, Figure 7(b) and Figure 8, it can be concluded that random
loading sequence from wave scatter diagrams merely has an effect in the separate crack
growth cycles. As it is mentioned above this separate propagation process is based on linear
damage accumulation, for a specific diagram the range of and with the combination of
load cases are set. Thus, the results from 2 type of sequences are almost equal and the effect
of loading sequence of diagrams can be ignored.
Furthermore, the largest critical crack size (in depth or in width), and
, is still far from penetrating the plate thickness, , of the local
connection between column and brace. Above all, it proves that the method applied in this
paper can provide a reasonable and reliable result on calculating and assessing structural
fatigue crack.
According to the Shao [10], who performed physical tests on the crack in a T shape
tubular joint and applied FAD on assessing the safety of welded tubular joint containing
fatigue cracks, all types of failure assessment diagrams have sufficient safety redundancy and
using FAD in assessing welded tubular joints is safe and relatively conservative. Thus, it can
be concluded that using Option 1 assessment line is safe on assessing fatigue crack growth.
Besides, based on above works the results obtained in this paper could be reliable preference
for engineering practice.
Fatigue Assessment of Crack Growth Based on Shilun Zhao, Chaohe Chen
Failure Assessment Diagrams for Semi-Submersible Tianhui Fan, Yong Jiang, Yijun Shen
23
4. Conclusions
In this paper a new method for calculating and assessing fatigue crack growth in column
and brace connection of semisubmersible is introduced. By splitting consecutive stress
spectrum or stress ranges into the distribution of stress ranges versus their occurrences using
scatter diagram, the Option 1 assessment line is added into the separate crack growth cycles as
a tool for assessing the propagation safety of fatigue crack. Using unique crack growth rate on
predicting critical crack size and remaining life is more reliable than using traditional Paris
law. Option 1 assessment line is optional on choosing FAD according to previous study since
all kinds of current FAD are relatively conservative.
This method is based on P-M rules of linear accumulative damage, which is widely
acknowledged suitable in engineering practices. By comparing crack growth process under
normal and reversed sequences of loading using wave scatter diagrams, it is approved that the
effect of loading sequence of diagrams can be ignored. Through the assessment of FAD it can
be assured that each crack growth size or is considered as acceptable in fatigue load
cycles. Due to lack of physical tests data the accuracy of the calculation is still under
investigation. However, by comparing to existent study the practice in this paper still provides
reasonable results on the critical values of fatigue crack and is proved to be aligned with
previous work. The method presented in this paper extends the use of FAD to the randomly
loaded offshore structure by applying wave scatter diagrams and separating crack growth
cycles. According to Table 1 it considers the stress components which include the primary
and secondary stress components in the stress intensity factor and via applying wave scatter
diagrams and by splitting crack growth process into separate cycles, the accuracy of crack
propagation calculation is improved and more reliable with the safety evaluation of FAD.
Therefore, it is concluded the method presented in this paper is practical in fatigue assessment
of semisubmersible and reliable on providing critical values of fatigue crack.
Acknowledgment
This paper was financially supported by National Natural Science Foundation of China (Grant
No. 51709118); China Postdoctoral Science Foundation (Grant No. 2017M612669); Science
and Technology Program of Guangzhou (Grant No. 201804010482); the Fundamental
Research Funds for the Central Universities (Grant No.2017BQ089); the Funds for Marine
Economic Development of Guangdong, China (Grant no. GDME-2018B003); by State Key
Laboratory of Ocean Engineering (Shanghai Jiao Tong University)(Grant No. 1708); and by
State Key Laboratory of Coastal and Offshore Engineering (Dalian University of
Technology)( Grant No. LP1805).
REFERENCES
[1] Zareei, Mohammad Reza; Iranmanesh, Mehdi. Reliability-based inspection planning of the ship structure
exposed to fatigue damages[J]. BRODOGRADNJA, Vol: 69, Issue: 2, p119-134, JUN 2018.
[2] Jurisic, Paul; Parunov, Josko; Garbatov, Yordan. Aging effects on ship structural integrity[J].
BRODOGRADNJA, Vol: 68, Issue: 2, p15-28, JUN 2017.
[3] Paris P C, Erdogan F. A critical analysis of crack propagation laws[J]. Journal of Basic Engineering,
1963, 85(4): 528 -534. https://doi.org/10.1115/1.3656900
[4] McEvily A J, EiFler D, MaCherauch E. Ananalysis of the growth of short fatigue cracks[J]. Engineering
Fracture Mechanics, 1991, 40(3): 571-584. https://doi.org/10.1016/0013-7944(91)90151-P
[5] Huang X P, Moan T, Cui W C. A unique crack growth rate curve method for fatigue life prediction of
steel structures[J]. Ships and Offshore Structures, 2009, 4(2): 165-173.
https://doi.org/10.1080/17445300902732370
Shilun Zhao, Chaohe Chen Fatigue Assessment of Crack Growth Based on
Tianhui Fan, Yong Jiang, Yijun Shen Failure Assessment Diagrams for Semi-Submersible
24
[6] Huang X P, Moan T, Cui W C. An engineering model of fatigue crack growth under variable amplitude
loading[J]. International Journal of Fatigue, 2008, 30(1): 2-10.
https://doi.org/10.1016/j.ijfatigue.2007.03.004
[7] Huang X P, Moan T. Improved modeling of the effect of R-ratio on crack growth rate[J]. International
Journal of Fatigue, 2007, 29(4): 591-602. https://doi.org/10.1016/j.ijfatigue.2006.07.014
[8] CUI Lei, HE Yong, MAO Jiang-hong, JIN Wei-liang. Crack propagation-based fatigue life analysis for
deep water semi-submersible platform[A]. Journal of Ship Mechanics, 2013, 17(11): 1318-1327.
[9] BS 7910, Guide to methods for assessing the acceptability of flaws in metallic structures[S]. London:
British Standards, 2013.
[10] SHAO Yong-bo, SONG Sheng-zhi, LI Tao. Study on safety of circular tubular t-joints containing fatigue
crack based on failure assessment diagram(FAD)[J]. Gongcheng Lixue/Engineering Mechanics, 2013
Vol.30 No.9, p184-193.
[11] Fuentes J.D. On the use of British standard 7910 option 1 failure assessment diagram to non‐metallic
materials[J] Fatigue and Fracture of Engineering Materials and Structures, v41, n1, p146-158, 2018.
[12] DNVGL-RP-0005: Fatigue design of offshore steel structures [S]. Norway: Det Norske Veritas, 2014-06.
[13] Sudhakar Tallavajhula, Jim Wang, Inge Solberg. Strength and Fatigue Analysis of Vim Suppression
Strakes for Large Diameter Spars[C]. Proceedings of the 26th International Conference on Offshore
Mechanics and Arctic Engineering 2007. OMAE2007-29078. https://doi.org/10.1115/OMAE2007-29078
[14] Mir Ali Ghaffari, Hossein Hosseini Toudeshky. Fatigue Crack Propagation Analysis of Repaired Pipes
with Composite Patch Under Cyclic Pressure[J]. Journal of Pressure Vessel Technology, Vol. 135 /
031402-1, 2013.
[15] T. Okawaa, Y. Sumia, M. Mohri. Simulation-based fatigue crack management of ship structural details
applied to longitudinal and transverse connections[J]. Marine Structures, 19 (2006) 217–240, 2007.
[16] Haitao Wu, Guoqiang Zhou, Zemin Wu, Jiancheng Leng. Simulation of Crack Propagation on The Weld
Line of Offshore Platform Leg[J]. Oil Field Equipment, 2015, 44(8): 6-10.
[17] DNVGL-RP-C103: Fatigue design of offshore steel structures[S]. Norway: Det Norske Veritas, 2015-07.
[18] DNVGL-OS-C103: Structural design of column stabilized units - LRFD method[S]. DNV, 2015-07.
[19] N S. Ermolaeva, T. Ward, W. Bateman, V. Parsoya. Fracture mechanics in fatigue calculations as the
assistance in structural design. Case study[J]. Engineering Failure Analysis, 35 (2013) 652–664, 2013.
[20] Wentao He, Jingxi Liu, De Xie. Numerical study on fatigue crack growth at a web-stiffener of ship
structural details by an objected-oriented approach in conjunction with ABAQUS[J]. Marine Structures,
35 (2014) 45–69, 2014.
[21] R. Jones, B. Chen, S. Pitt. Similitude: Fatigue cracking in steels[J]. Theoretical and Applied Fracture
Mechanics, 48 (2007) 161–168. https://doi.org/10.1016/j.tafmec.2007.05.007
[22] Wolfgang Fricke, Nils Friedrich, Luciano Musumeci, Hans Paetzold. Low-cycle fatigue analysis of a web
frame corner in ship structures[J]. Welding in the World, 2014, 58 (3) :319-327.
https://doi.org/10.1007/s40194-014-0117-z
[23] G. Terán, R.C. Meléndez, A. Albiter, C. Maldonado, A.Q. Bracarense. Characterization of the mechanical
properties and structural integrity of T-welded connections repaired by grinding and wet welding[J].
Materials Science & Engineering A 599 (2014) 105–115. https://doi.org/10.1016/j.msea.2014.01.078
[24] Vasudeven A K, Sadananda K, Louat N.A review of crack closure, fatigue crack threshold and related
phenomena[J]. Materials Science and Engineering, 1994, 188(1-2): 1-22. https://doi.org/10.1016/0921-
5093(94)90351-4
[25] Sadananda K, Vasudevan A K. Short crack growth and internal stresses[J]. International Journal of
Fatigue, 1997, 19(93):99-108. https://doi.org/10.1016/S0142-1123(97)00057-1
[26] Fuentes J.D. On the use of British standard 7910 option 1 failure assessment diagram to non‐metallic
materials[J] Fatigue and Fracture of Engineering Materials and Structures, v41, n1, p146-158, 2018.
Submitted: 21.07.2018.
Accepted: 28.11.2018.
Shilun Zhao, Chaohe Chen, Tianhui Fan, [email protected]
School of Civil Engineering and Transportation, South China University of
Technology
Jiaotong Building 402B, South China University of Technology, Guangzhou,
Guangdong 510640, China