fatigue system reliability analysis of riveted railway ...epubs.surrey.ac.uk/795962/3/fatigue system...
TRANSCRIPT
Fatigue system reliability analysis of riveted railway bridge connections Boulent M. Imam a*; Marios K. Chryssanthopoulos a; Dan M. Frangopol b
a Faculty of Engineering and Physical Sciences, University of Surrey, Guildford,
Surrey GU2 7XH, UK b Department of Civil and Environmental Engineering, Engineering Research Center
for Advanced Technology for Large Structural Systems (ATLSS), Lehigh University, Bethlehem, PA 18015-4729, USA
*Corresponding author. Email: [email protected]
A system-based model for fatigue assessment of riveted railway bridge connections, comprising a number of basic components, is presented in this paper. Probabilistic fatigue load spectra are developed through Monte Carlo simulation of train passages over a finite element model of a typical, short-span bridge. Uncertainties arising from loading, resistance and modelling sources are taken into account. The riveted connection is treated through a set of generic sub-systems that capture potential damage in identifiable hot-spots, such as rivets, holes and angle fillets. The fatigue reliability over time is evaluated through system reliability methods by treating these hot-spots as the elements of a structural system. The results show that the probability of failure of the connection depends significantly on the form of the system adopted for the analysis and the rivet clamping force. Damage scenarios accounting for the potential loss of rivet clamping force are investigated and it is shown that, in some cases, they can affect connection reliability considerably.
Keywords: structural systems; bridges; reliability; fatigue; time; damage
1. Introduction Fatigue assessment of riveted bridges has received considerable attention during the
past few decades. This is attributed to the fact that such bridges, which were not
designed explicitly for fatigue, are believed to be approaching the end of their service
life. Considering their large number, both in Europe and North America, replacement
of all such bridges is extremely challenging from an economic point of view and
would create severe network problems. In order to maintain these old bridges and plan
repairs effectively, assessment of their remaining fatigue life is a vital requirement.
Riveted bridges were constructed using built-up sections which comprise
several typically flat plated elements riveted together. The primary bridge members,
such as girders, stringers and floor-beams are joined through riveted connections

consisting of a number of rivets and angle clips. The redundancy of these structures is
generally high, since failure of an individual component does not usually lead to
progressive collapse. This is because in a typical riveted member, a fatigue crack will
propagate only within the component that has cracked and will not immediately
transfer to other adjoining components since the interfaces between components act as
crack stoppers (Sweeney 1979). However, following failure of the first component
and redistribution of the loads to the remaining components, a progressive type of
failure may be initiated, depending on geometric configuration, acting load levels and
component utilisation. It is, hence, both rational and desirable to extend methods to
estimate the reliability of riveted bridges and connections beyond the level of
individual component failure towards a systems reliability framework, which captures
the relationships between individual component and overall system performance.
One of the appealing features of using a system approach to reliability is that it
considers both the reliability of components and their relationship and importance to
the entire system, thus allowing quantification of redundancy. In some cases, when a
system is highly redundant, the reliability of individual components may be quite low
while the system reliability remains high. In other cases, for weakest-link systems,
although the reliability of every component may be satisfactory, the reliability of the
system might be considered low. A system analysis is capable of capturing and
quantifying such effects. On the other hand, considering individual components alone,
which is still a common practice, may underestimate or overestimate the overall
reliability of a structure. A number of recent studies have investigated the redundancy
of structural systems from a system reliability point of view (Ghosn et al. 2010,
Okasha and Frangopol 2010).

System reliability approaches have been commonly used in the past to
estimate the service life of bridge structures (Hendawi and Frangopol 1994, Micic et
al. 1995, Estes and Frangopol 1999, Nowak and Cho 2007). The deck, superstructure
and substructure can be broken down to a varying degree and modelled as
components of a higher level system representing the bridge. The reliability of
different component failure modes can be estimated using methods such as FORM
(First Order Reliability Method), SORM (Second Order Reliability Method) or
through Monte Carlo simulations. A system representing the bridge is then assembled
as a series-parallel combination of its components and a system approach is employed
to estimate the overall system reliability (Melchers, 1999).
System reliability analysis of riveted bridges and connections has received
limited attention, with only a few recent studies in that area. Wang et al. (2006, 2007)
developed a system fatigue damage reliability model based on fracture mechanics
principles investigating the behaviour of a riveted built-up girder. Probabilistic crack
growth analysis of cracks initiating from the holes of angle clips were carried out and
combined through systems analysis to estimate the reliability of the riveted girder. As
a case study, their model was used to determine safe inspection intervals and
maintenance strategies for an existing riveted bridge in China.
The objective of this paper is to present a system-based model for fatigue
assessment of riveted bridge connections building on previous work which has
quantified a number of important features exhibited by riveted grillage-type structures
(Imam et al. 2006, Imam et al. 2008, Righiniotis et al. 2008). A finite element (FE)
model of a short span, wrought iron bridge is used in order to convert train loading
into fatigue load effects. Fatigue assessment is carried out using the recently
developed theory of critical distances (TCD) which considers the entire distribution
ahead of any given stress concentration. This theory (Taylor 2007), allows the
criticality of different parts of a fatigue sensitive detail to be independently assessed,
and lends itself to a system-based treatment of fatigue failure. A system approach is
presented by treating each riveted connection through generic sub-systems which
capture potential damage in identifiable hot-spots, such as rivets, holes and angle
fillets. By treating these hot spots as the elements of a structural system susceptible to
fatigue failure, its reliability over time is evaluated using system reliability methods.
The relative importance of various connection components, given their individual
failure probability and their contribution to the system reliability, is discussed. The
effect of different damage scenarios, in the form of loss of rivet clamping force, on
the overall system reliability of the connection is also investigated through parametric
studies. The results are compared with their S-N counterparts, which were obtained by
the authors in earlier studies (Imam et al. 2008) by employing the traditional nominal
stress approach, commonly adopted in bridge codes (BS5400 1980, AREA 1996), and
modelling the connection as a single component.
2. Fatigue Assessment using the Theory of Critical Distances The most popular method of fatigue analysis of structural components and
connections is the well-known S-N method which is employed by the majority of
bridge codes (AASHTO 1998, AREA 1996, BS5400 1980, EC3 2005). The S-N
method requires the classification of a detail into a fatigue class among typical
standardised “basic details” and its fatigue damage is estimated using the relevant S-N
curve combined with remotely applied nominal stresses. Despite the fact that existing
standards and recommendations cover a wide range of structural details and loading
situations, there are a number of complex details that cannot be clearly classified or

even if they can, the definition of nominal stresses for these is far from
straightforward. One such example is deformation-induced fatigue which is caused by
secondary stresses. In riveted bridges, such type of fatigue damage may take place at
riveted connections such as, for example, stringer-to-cross-girder connections (Al
Emrani 2002). Conventional methods for fatigue analysis such as the S-N nominal
stress method have in many cases proven themselves to be inappropriate for
deformation-induced fatigue (Imam 2006). Assessment of existing bridges with such
details using the conventional methods may render unrealistic results which can make
a correct condition assessment and planning of maintenance strategies more difficult.
During the last decade or so, alternative fatigue design and assessment
methods have been developed such as the geometric (or hot spot) stress approach
(DNV 2005), the structural stress approach (Dong 2001), and the Theory of Critical
Distances (TCD) (Taylor 2007). The hot spot stress approach has been widely used in
the offshore industry and the TCD has been commonly employed in fatigue
assessment of mechanical and automotive components. All of these methods are
based on linear elastic finite element (FE) analysis and can be used for fatigue
assessment of complex details for which the S-N method is difficult to utilise.
However, these approaches have so far rarely been used by bridge engineers and need
to be developed and adapted for bridge assessment applications.
The hot spot (or geometric) stress approach is based on extrapolation of
stresses obtained at a distance from the stress concentration (notch) of the fatigue
detail being investigated. On the other hand, the structural stress method is based on
defining an equivalent stress state at some distance from the stress concentration and
considered for fatigue calculations. Both of these methods have been found to give
reasonable results for two-dimensional (2D) welded details but have been shown to

have certain limitations for three-dimensional (3D) details and are difficult to apply in
cases of complex 3D loadings (Doerk et al. 2003). In additional, their suitability for
the fatigue assessment of non-welded details, such as riveted connections, has not
been established so far.
The TCD is a recently developed methodology for fatigue assessment of
notched components (Taylor 2007), in which the entire stress distribution ahead of the
notch is considered for fatigue calculations. In other words, TCD does not rely on a
single, remotely applied stress, as postulated by the S-N approach, which may be
difficult to define, or on a stress at a single stress concentration point. This theory,
which can be applied to any type of stress concentration, was developed so as to be
used in conjunction with linear elastic FE analyses. These have advanced extensively
during recent years and allow analyses of complex, 3D geometries and reasonably
accurate predictions of stress fields in the vicinity of stress concentrations.
One of the main advantages of the TCD is that it requires physical
characterisation of the plain material only, rather than the extensive, but often lacking,
physical testing on specific detail geometries. A fundamental aspect of the TCD is to
determine a location or region within which all physical processes leading to fatigue
crack initiation are assumed to take place. This size/location (or region) depends on
fatigue material properties and more specifically on the fatigue limit of the plain
material and its crack propagation threshold (threshold stress intensity factor). All
stress calculations required for fatigue assessment are carried out within this region,
the size/location of which can be characterised through a “critical distance”, L,
defined as (Taylor 1999)
2
0
1⎟⎟⎠
⎞⎜⎜⎝
⎛ΔΔ
=σπ
thKL (1)
where ΔKth is the threshold stress intensity (crack propagation threshold) and Δσ0 is
the fatigue limit of the plain (un-notched) material.
Following the definition of the critical distance L, there are different methods
that may be employed for fatigue assessment based on this parameter. The point
method suggests considering the maximum principal stress σp(max) at a distance of L/2
from the tip of the notch (Taylor 1999). The line method suggests averaging the
maximum principal stress along a line of length 2L starting from the notch tip (Taylor
1999). In the area method, the maximum principal stress is averaged over a semi-
circular area, which is centred at the notch tip, having a radius of 1.32L (Bellett et al.
2005). For 3D applications, the volume method, which relies on averaging principal
stresses over a hemisphere centred at the tip of the notch with a radius of 1.54L has
been proposed (Bellett et al. 2005). After determining the “characteristic stress” by
one of these methods, this is then used for fatigue damage calculations.
Although the point and line methods may appear less complicated, analysis
using the area and volume methods is not difficult to implement as part of post-
processing after an FE analysis. The volume method lends itself to the analysis of 3D
geometries where there are 3D stress fields around the investigated stress
concentration since the method can capture stress gradients in all directions.
The reliability of the TCD for fatigue assessment has been verified through
comparisons of analytical and experimental results on a wide range of stress
concentrations and materials where it was shown that it can predict accurately both
fatigue strength and fatigue life (Taylor 1999, 2005, Taylor and Wang 2000, Susmel
and Taylor 2003).
A further appealing feature of the TCD is that it overcomes the mesh
sensitivity problem that exists in FE analysis of stress concentrations where, in
general, the maximum stress at notches does not converge with increasing mesh
density since these points are usually associated with numerical singularities. As a
result, the fatigue damage becomes unbounded. Since the TCD relies on the entire
stress distribution ahead of the stress concentration and not on a single maximum
stress value, it can overcome this problem. Previous studies carried out on a typical
riveted bridge connection model have demonstrated the convergence characteristics of
the TCD volume method (Righiniotis et al. 2008).
3. Reliability Analysis Framework
3.1. Finite element analysis A probabilistic methodology has been employed in earlier studies by the authors for
the fatigue assessment of a typical wrought iron riveted railway bridge (Imam et al.
2008). It is based on the S-N nominal stress method and accounts for uncertainties in
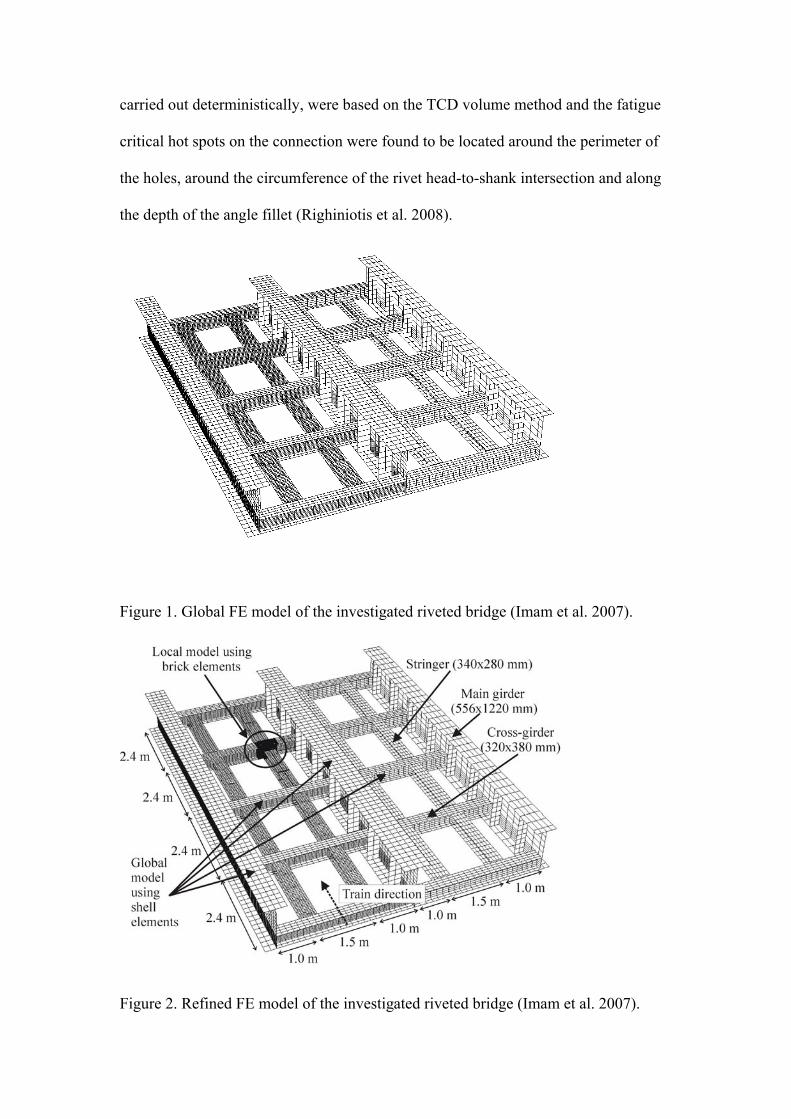
loading, resistance and modelling. A global FE model of the bridge (shown in Figure
1) was used to convert present-day and historical rail traffic into fatigue load effects.
Annual fatigue response spectra were developed for different periods of the traffic
models, spanning over 100 years, and were used for the estimation of the fatigue
reliability of a stringer-to-cross-girder connection over time.
As the global model of the bridge treated the connection as a single entity and
was unable to capture the fatigue behaviour of its individual elements, a detailed sub-
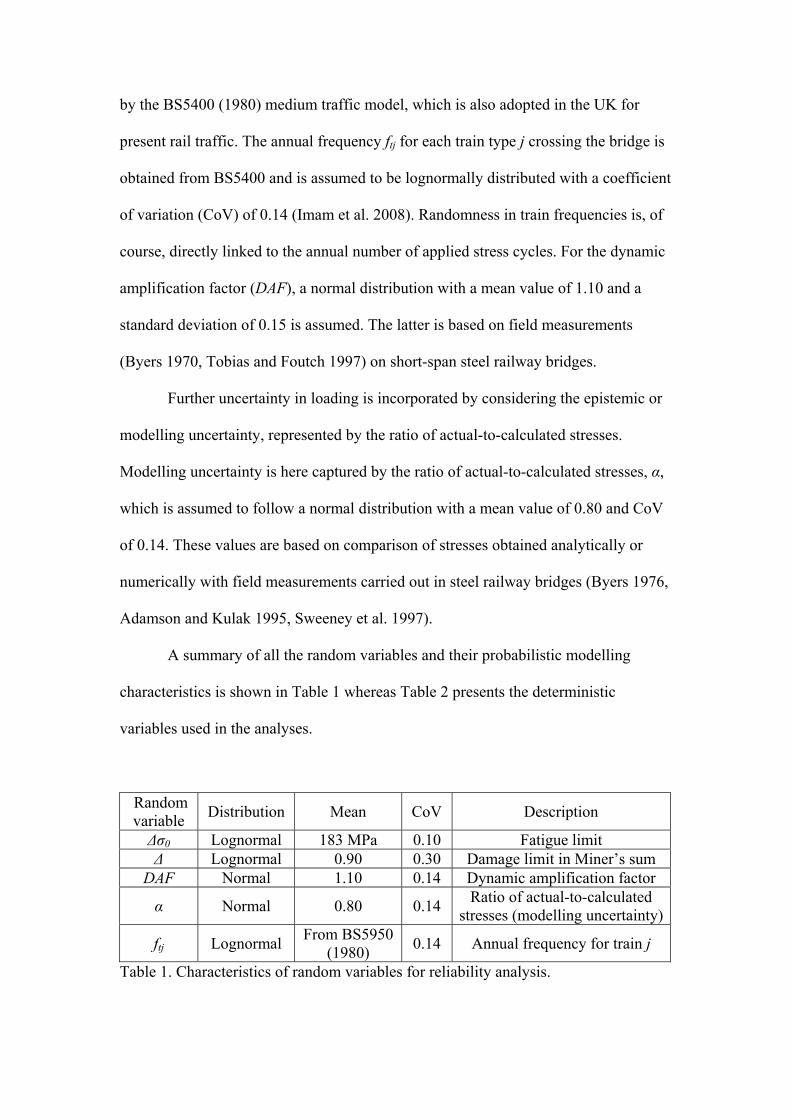
model of the connection was later developed within the global model. This model,
which has been fully described and validated in previous studies (Imam et al. 2007), is
shown in Figures 2 and 3. As can be seen, all the individual elements of the
connection such as angle clips and rivets and parts of the connected members in the
vicinity of the connection were modelled explicitly to investigate their fatigue
behaviour and assess their fatigue criticality. Fatigue damage calculations, which were
carried out deterministically, were based on the TCD volume method and the fatigue
critical hot spots on the connection were found to be located around the perimeter of
the holes, around the circumference of the rivet head-to-shank intersection and along
the depth of the angle fillet (Righiniotis et al. 2008).
Figure 1. Global FE model of the investigated riveted bridge (Imam et al. 2007).
Figure 2. Refined FE model of the investigated riveted bridge (Imam et al. 2007).
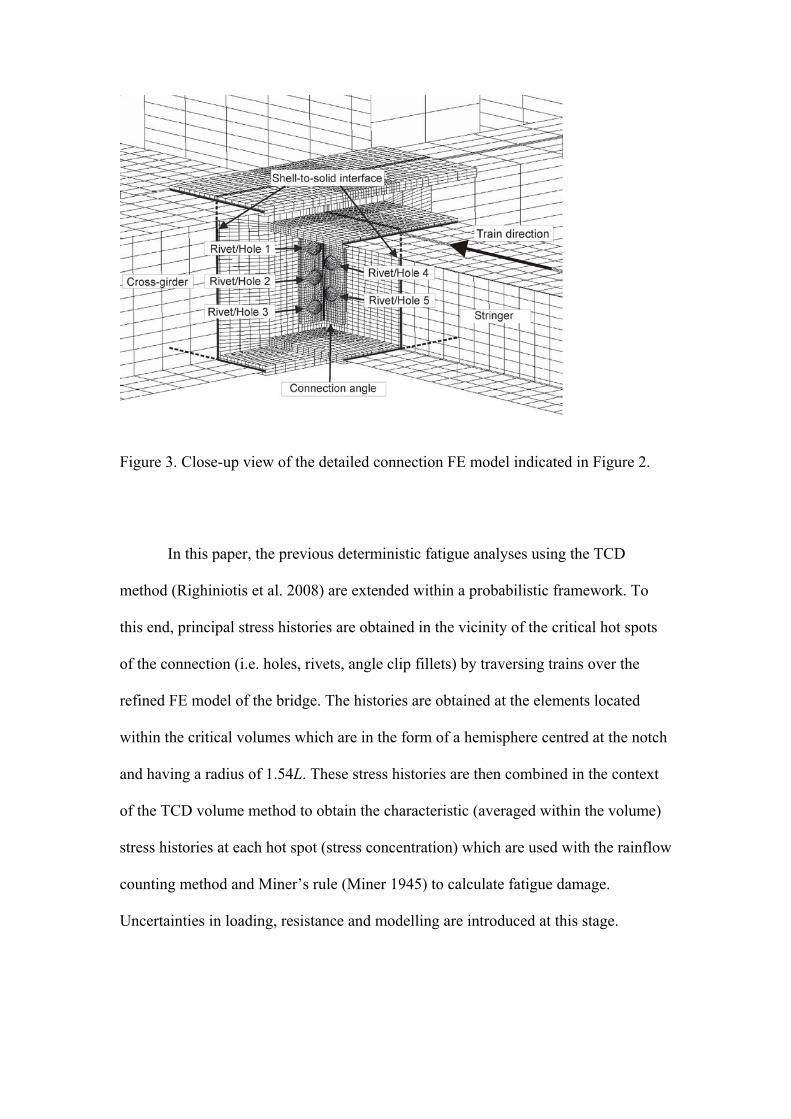
Figure 3. Close-up view of the detailed connection FE model indicated in Figure 2.
In this paper, the previous deterministic fatigue analyses using the TCD
method (Righiniotis et al. 2008) are extended within a probabilistic framework. To
this end, principal stress histories are obtained in the vicinity of the critical hot spots
of the connection (i.e. holes, rivets, angle clip fillets) by traversing trains over the
refined FE model of the bridge. The histories are obtained at the elements located
within the critical volumes which are in the form of a hemisphere centred at the notch
and having a radius of 1.54L. These stress histories are then combined in the context
of the TCD volume method to obtain the characteristic (averaged within the volume)
stress histories at each hot spot (stress concentration) which are used with the rainflow
counting method and Miner’s rule (Miner 1945) to calculate fatigue damage.
Uncertainties in loading, resistance and modelling are introduced at this stage.

3.2. Random variables
3.2.1. Resistance random variables On the resistance side, uncertainties in the S-N curves and the cumulative damage
model (Miner’s rule) are incorporated within the methodology. For fatigue damage
calculations, the S-N curve is treated probabilistically by assuming a fixed slope and a
random fatigue limit. For wrought iron, a lognormal distribution with a mean value of
183 MPa defined at NFL=2×10⁶ cycles and a CoV of 0.1 is assumed for the fatigue
limit Δσ0 (Righiniotis et al. 2008) together with a slope of 1/5 (Cullimore 1967). In
graphical terms, the effect of random variability of the fatigue limit is to produce a
parallel shifting of the S-N curve with the fatigue limit always defined at 2×10⁶
cycles.
The damage limit Δ in Miner’s sum is also assumed to be a random variable.
In deterministic analysis, this damage limit, which indicates fatigue failure, is
assumed equal to one. Herein, a lognormal distribution with a mean value of 0.90 and
a CoV of 0.30 is considered in accordance with earlier studies (Wirsching 1995).
The critical distance L, which is used to define the critical volume for carrying
out the stress calculations for fatigue assessment, has been taken as deterministic due
to the large amount of FE post-processing required by the TCD method. By using the
mean value for the fatigue limit of wrought iron (Δσ0 = 183 MPa) and a threshold
stress intensity value of ΔKth = 13.5 MPa·m1/2, the critical distance value is obtained as
L = 1.73mm. The value of the threshold stress intensity (crack propagation threshold)
has been determined through crack growth experiments on wrought iron specimens
reported by Helmerich et al. (2007).
3.2.2. Loading random variables On the loading side, the problem is randomised by introducing uncertainties in train
traffic volume and dynamic amplification. Live loading on the bridge is represented
by the BS5400 (1980) medium traffic model, which is also adopted in the UK for
present rail traffic. The annual frequency ftj for each train type j crossing the bridge is
obtained from BS5400 and is assumed to be lognormally distributed with a coefficient
of variation (CoV) of 0.14 (Imam et al. 2008). Randomness in train frequencies is, of
course, directly linked to the annual number of applied stress cycles. For the dynamic
amplification factor (DAF), a normal distribution with a mean value of 1.10 and a
standard deviation of 0.15 is assumed. The latter is based on field measurements
(Byers 1970, Tobias and Foutch 1997) on short-span steel railway bridges.
Further uncertainty in loading is incorporated by considering the epistemic or
modelling uncertainty, represented by the ratio of actual-to-calculated stresses.
Modelling uncertainty is here captured by the ratio of actual-to-calculated stresses, α,
which is assumed to follow a normal distribution with a mean value of 0.80 and CoV
of 0.14. These values are based on comparison of stresses obtained analytically or
numerically with field measurements carried out in steel railway bridges (Byers 1976,
Adamson and Kulak 1995, Sweeney et al. 1997).
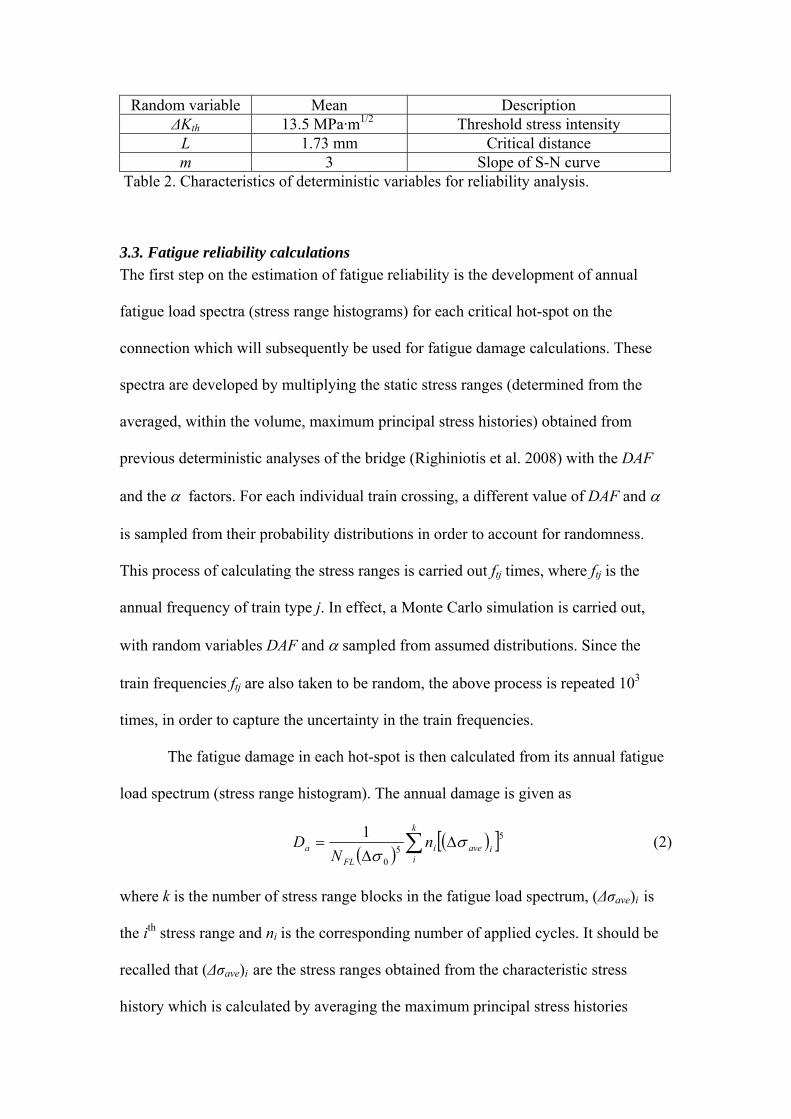
A summary of all the random variables and their probabilistic modelling
characteristics is shown in Table 1 whereas Table 2 presents the deterministic
variables used in the analyses.
Random variable Distribution Mean CoV Description
Δσ0 Lognormal 183 MPa 0.10 Fatigue limit Δ Lognormal 0.90 0.30 Damage limit in Miner’s sum
DAF Normal 1.10 0.14 Dynamic amplification factor
α Normal 0.80 0.14 Ratio of actual-to-calculated stresses (modelling uncertainty)
ftj Lognormal From BS5950 (1980) 0.14 Annual frequency for train j
Table 1. Characteristics of random variables for reliability analysis.
Random variable Mean Description ΔKth 13.5 MPa·m1/2 Threshold stress intensity
L 1.73 mm Critical distance m 3 Slope of S-N curve
Table 2. Characteristics of deterministic variables for reliability analysis.
3.3. Fatigue reliability calculations The first step on the estimation of fatigue reliability is the development of annual
fatigue load spectra (stress range histograms) for each critical hot-spot on the
connection which will subsequently be used for fatigue damage calculations. These
spectra are developed by multiplying the static stress ranges (determined from the
averaged, within the volume, maximum principal stress histories) obtained from
previous deterministic analyses of the bridge (Righiniotis et al. 2008) with the DAF
and the α factors. For each individual train crossing, a different value of DAF and α
is sampled from their probability distributions in order to account for randomness.
This process of calculating the stress ranges is carried out ftj times, where ftj is the
annual frequency of train type j. In effect, a Monte Carlo simulation is carried out,
with random variables DAF and α sampled from assumed distributions. Since the
train frequencies ftj are also taken to be random, the above process is repeated 103
times, in order to capture the uncertainty in the train frequencies.
The fatigue damage in each hot-spot is then calculated from its annual fatigue
load spectrum (stress range histogram). The annual damage is given as
( )( )[ ]55
0
1iave
k
ii
FLa n
ND σ
σΔ
Δ= ∑ (2)
where k is the number of stress range blocks in the fatigue load spectrum, (Δσave)i is
the ith stress range and ni is the corresponding number of applied cycles. It should be
recalled that (Δσave)i are the stress ranges obtained from the characteristic stress
history which is calculated by averaging the maximum principal stress histories
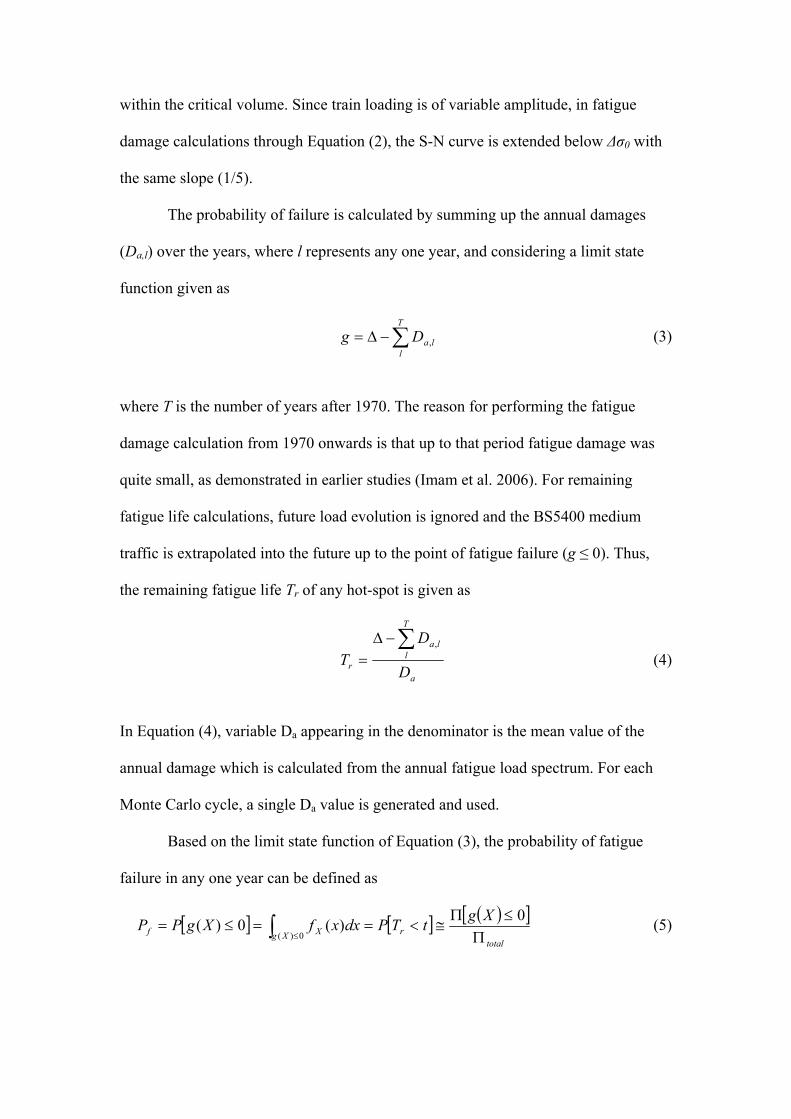
within the critical volume. Since train loading is of variable amplitude, in fatigue
damage calculations through Equation (2), the S-N curve is extended below Δσ0 with
the same slope (1/5).
The probability of failure is calculated by summing up the annual damages
(Da,l) over the years, where l represents any one year, and considering a limit state
function given as
∑−Δ=T
llaDg , (3)
where T is the number of years after 1970. The reason for performing the fatigue
damage calculation from 1970 onwards is that up to that period fatigue damage was
quite small, as demonstrated in earlier studies (Imam et al. 2006). For remaining
fatigue life calculations, future load evolution is ignored and the BS5400 medium
traffic is extrapolated into the future up to the point of fatigue failure (g ≤ 0). Thus,
the remaining fatigue life Tr of any hot-spot is given as
a
T
lla
r D
DT
∑−Δ=
,
(4)
In Equation (4), variable Da appearing in the denominator is the mean value of the
annual damage which is calculated from the annual fatigue load spectrum. For each
Monte Carlo cycle, a single Da value is generated and used.
Based on the limit state function of Equation (3), the probability of fatigue
failure in any one year can be defined as
[ ] [ ] ( )[ ]total
rXg XfXgtTPdxxfXgPP
Π≤Π
≅<==≤= ∫ ≤
0)(0)(0)(
(5)

where g≤0 represents the ‘failure’ domain and fX (x) is the (unknown) joint
distribution of the random variables entering the problem and the integral is evaluated
over the failure domain. In Monte Carlo simulation, the failure probability can be
approximately evaluated as the ratio of Π[g(X) ≤ 0], which is the number of samples
satisfying the event in brackets, over Πtotal, which is the total number of samples
generated in the simulations. In this paper, the time-varying fatigue failure probability
is estimated using Monte Carlo simulation with 106 samples, in accordance with a
convergence study (Imam 2006).
3.4. System modelling The connections in riveted bridges consist of a number of components; failure of an
individual component may not lead to total connection failure. For example, a typical
stringer-to-cross-girder connection, which is the focus of this investigation, consists of
4 angle clips and 10 rivets as shown in Figure 4. The approach described in Section
3.3 can be used to estimate the probability of fatigue failure of individual hot-spots on
various connection components, e.g. of a single rivet or of a single hole etc. These
individual probabilities of failure can then be combined using a system reliability
approach to estimate the overall reliability of the connection.
The connection can be considered as a system consisting of 4 sub-systems,
each representing a single angle clip. Each angle clip, in turn, consists of various hot-
spots as its individual elements (e.g. holes, rivets, fillets). For example, it can be seen
in Figure 4(a) that there are three holes and three rivets on the leg of each angle clip
that is connected to the cross-girder web (rivets/holes 1-3), whereas there are two
holes and two rivets on its leg connected to the stringer web (rivets/holes 4-5).
Furthermore, two hot-spots are considered along the fillet depth (fillets 1-2)
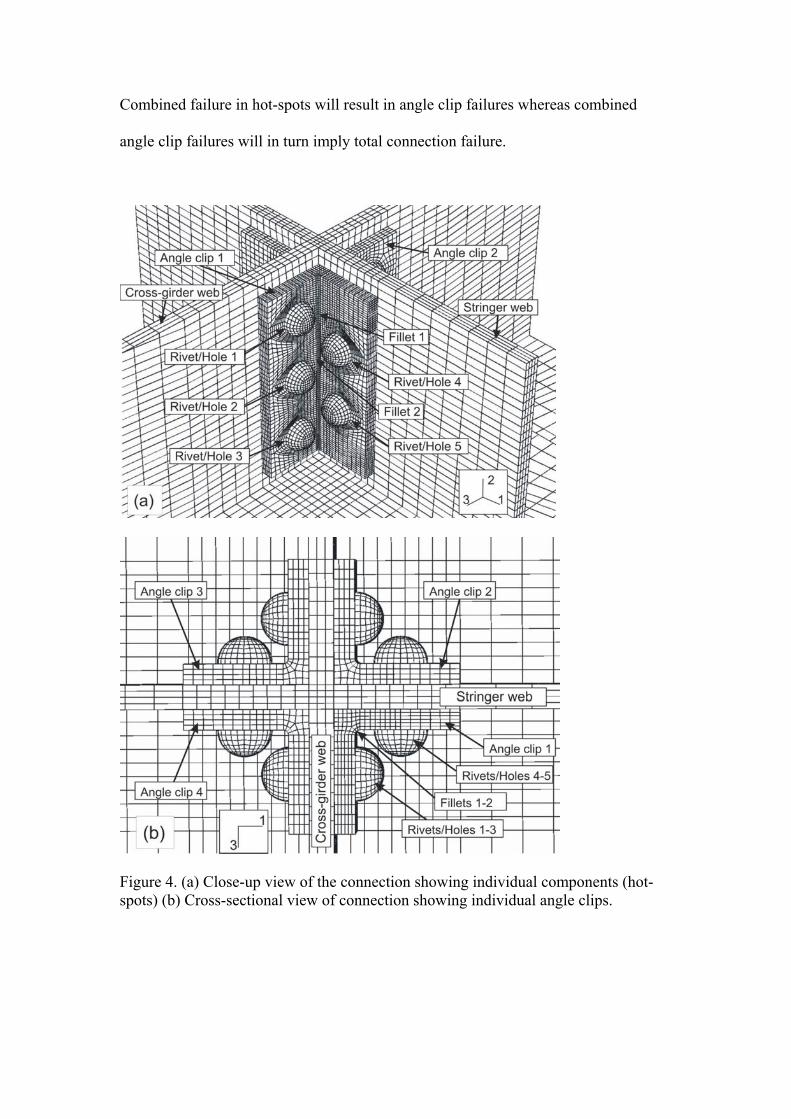
Combined failure in hot-spots will result in angle clip failures whereas combined
angle clip failures will in turn imply total connection failure.
Figure 4. (a) Close-up view of the connection showing individual components (hot-spots) (b) Cross-sectional view of connection showing individual angle clips.
It is assumed that an individual angle clip can fail by one of the following five
potential failure modes:
• Mode 1: failure of all three holes (holes 1-3) on the cross-girder leg of the angle
clip
• Mode 2: failure of both holes (holes 4-5) on the stringer leg of the angle clip
• Mode 3: failure of all three rivets (rivets 1-3) on the cross-girder leg of the angle
clip
• Mode 4: failure of both rivets (rivets 4-5) on the stringer leg of the angle clip
• Mode 5: failure of both hot-spots along the depth of the angle fillet (fillets 1-2)
The probability of failure of each of these five modes can be estimated from
the probabilities of failure of the individual hot-spots that contribute towards its
failure (i.e. holes, rivets, fillets). For instance, since failure in mode 1 is assumed to
take place when all three holes 1-3 have failed, this can be considered as a parallel
sub-system with the holes 1-3 being its individual elements. Thus,
[ ] [ ]3211 HoleHoleHolePModeP II= (6) where the events in brackets imply failure at the named hot-spots. Assuming that hot-
spot failures are statistically independent, the probability of mode 1 failure can be
estimated as
)3()2()1()1( HolefHolefHolefModef PPPP ⋅⋅= (7) The failure probability in any one of the remaining modes can be estimated in a
similar fashion. It is important to note that correlation between failure modes should
be expected. Assuming statistical independence herein is a conservative assumption,
i.e. it increases the probability associated with each mode of failure.
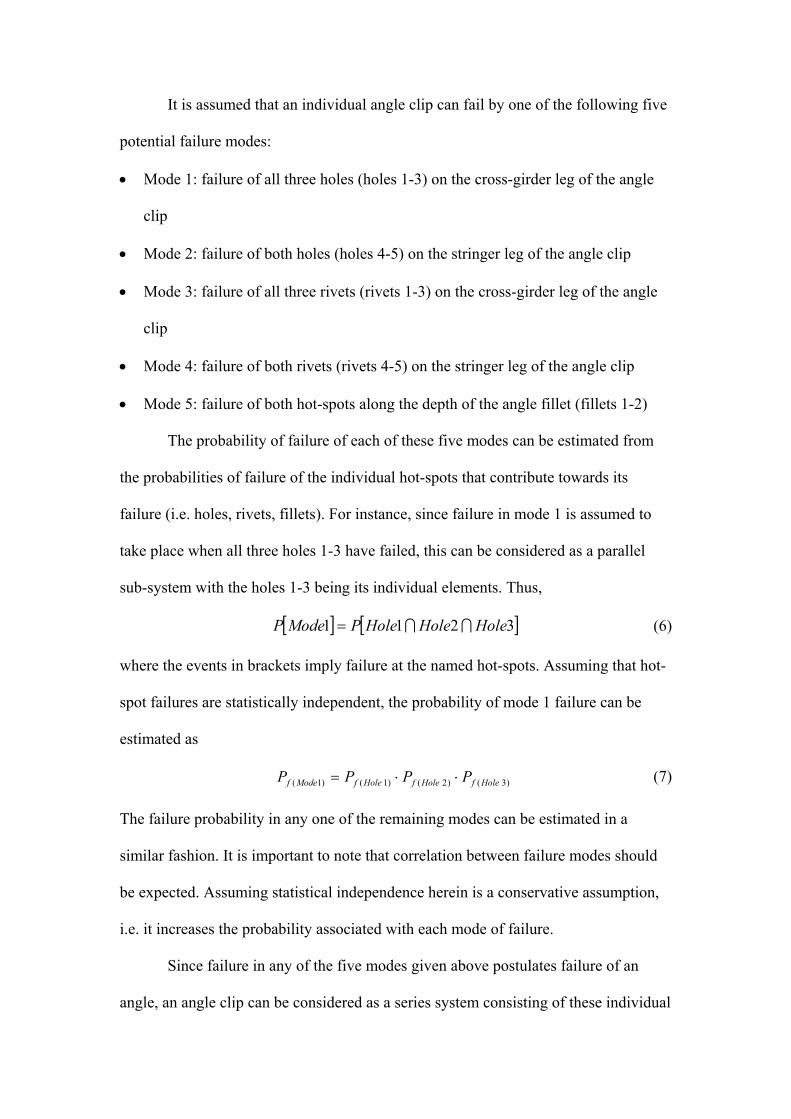
Since failure in any of the five modes given above postulates failure of an
angle, an angle clip can be considered as a series system consisting of these individual
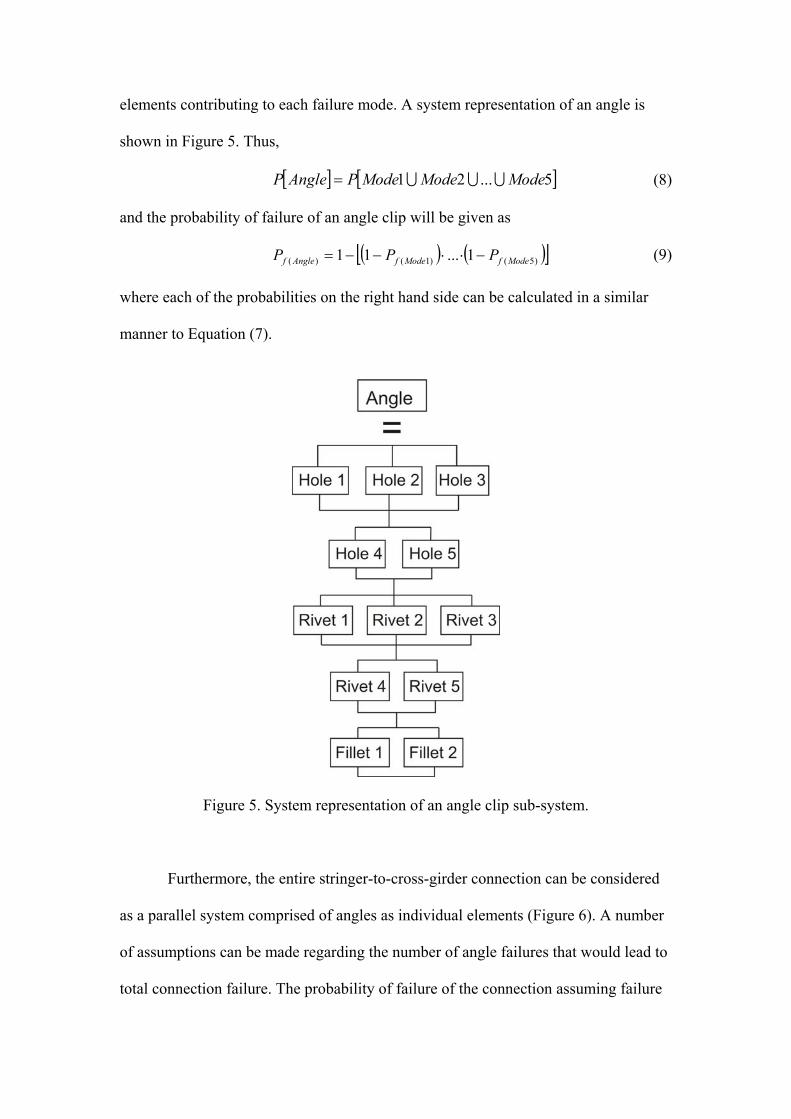
elements contributing to each failure mode. A system representation of an angle is
shown in Figure 5. Thus,
[ ] [ ]5...21 ModeModeModePAngleP UUU= (8) and the probability of failure of an angle clip will be given as
( )[ ( )])5()1()( 1...11 ModefModefAnglef PPP −⋅⋅−−= (9) where each of the probabilities on the right hand side can be calculated in a similar
manner to Equation (7).
Figure 5. System representation of an angle clip sub-system.
Furthermore, the entire stringer-to-cross-girder connection can be considered
as a parallel system comprised of angles as individual elements (Figure 6). A number
of assumptions can be made regarding the number of angle failures that would lead to
total connection failure. The probability of failure of the connection assuming failure
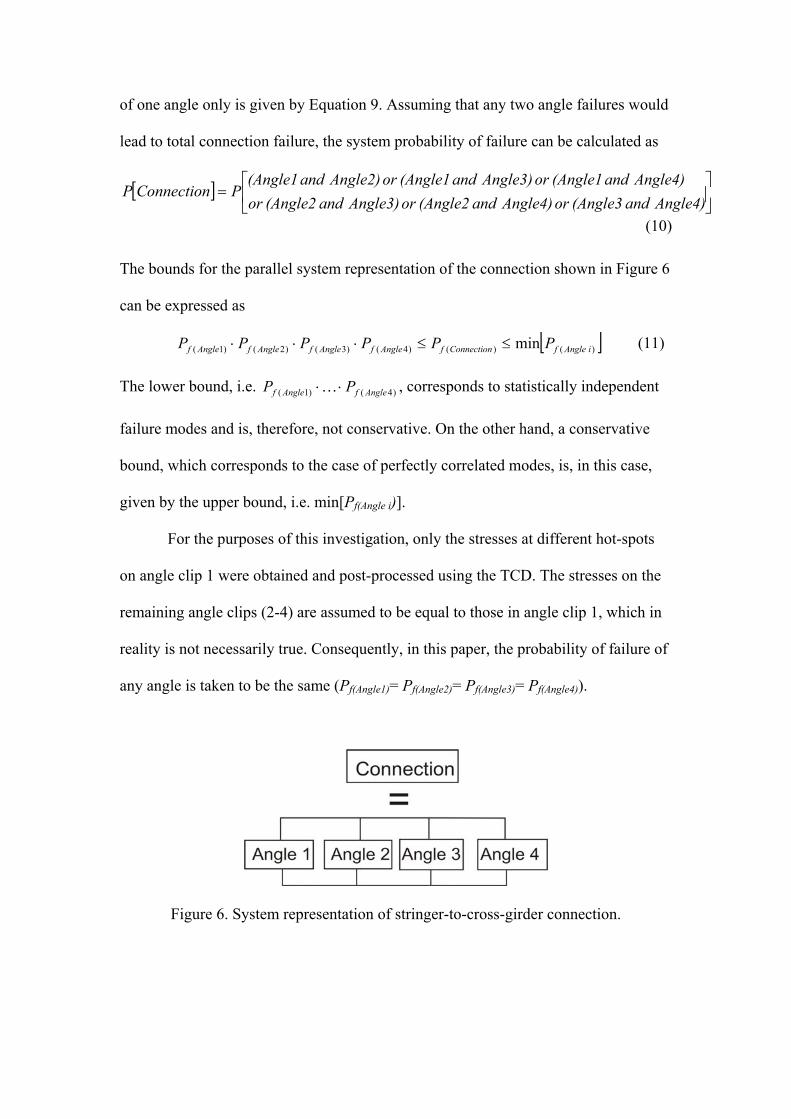
of one angle only is given by Equation 9. Assuming that any two angle failures would
lead to total connection failure, the system probability of failure can be calculated as
[ ] Angle4) and (Angle3 or Angle4) and (Angle2 or Angle3) and (Angle2 or
Angle4) and (Angle1 or Angle3) and (Angle1 or Angle2) and (Angle1PConnectionP ⎥
⎦
⎤⎢⎣
⎡=
(10)
The bounds for the parallel system representation of the connection shown in Figure 6
can be expressed as
[ ])()()4()3()2()1( min iAnglefConnectionfAnglefAnglefAnglefAnglef PPPPPP ≤≤⋅⋅⋅ (11) The lower bound, i.e. )4()1( AnglefAnglef PP ⋅⋅K , corresponds to statistically independent
failure modes and is, therefore, not conservative. On the other hand, a conservative
bound, which corresponds to the case of perfectly correlated modes, is, in this case,
given by the upper bound, i.e. min[Pf(Angle i)].
For the purposes of this investigation, only the stresses at different hot-spots
on angle clip 1 were obtained and post-processed using the TCD. The stresses on the
remaining angle clips (2-4) are assumed to be equal to those in angle clip 1, which in
reality is not necessarily true. Consequently, in this paper, the probability of failure of
any angle is taken to be the same (Pf(Angle1)= Pf(Angle2)= Pf(Angle3)= Pf(Angle4)).
Figure 6. System representation of stringer-to-cross-girder connection.
3.5. Damage scenarios The clamping force developed in a rivet is difficult to control, as it is affected by a
number of factors such as the stiffness of the rivet and the connected plates, the
driving and finishing temperatures, the method employed for riveting (Al-Emrani
2002), as well as the skill of individual workers. Field measurements have shown that
there is a wide variation in the magnitude of the clamping stress developed with
values ranging between 30 MPa and 280 MPa, lower values being observed in rivets
driven in the field. This variation is observed not only for connections with different
geometric properties and driving conditions but also in rivets taken from the same
riveted connections. In order to quantify the effect of rivet clamping force on the
fatigue reliability of the investigated stringer-to-cross-girder connection, the analyses
are carried out by assuming two levels of clamping for all rivets, i.e. a low to
moderate clamping stress of 100 MPa and a high clamping stress of 200 MPa.
Rivet defects may also affect the fatigue performance of a riveted connection,
as shown in an earlier deterministic study (Imam et al. 2007). In this paper, in addition
to different rivet clamping stresses, the effect of a complete loss of rivet clamping
force in each rivet is also investigated. Loss of clamping stress in a rivet may be
gradual over a number of years through relaxation of the rivet due to vibrations and
fretting between the connection components (Al-Emrani 1999). Moreover, tensile
overloads in the rivets may also cause local yielding in the rivet head-to-shank
junction leading to a partial or even complete loss of clamping force.
4. Results and Discussion
4.1. Critical volumes for TCD As presented earlier, the TCD method is based on determining a critical distance
which defines the region within which stress averaging is to be performed for fatigue
damage calculations. The critical volumes at the different hot-spots of the connection
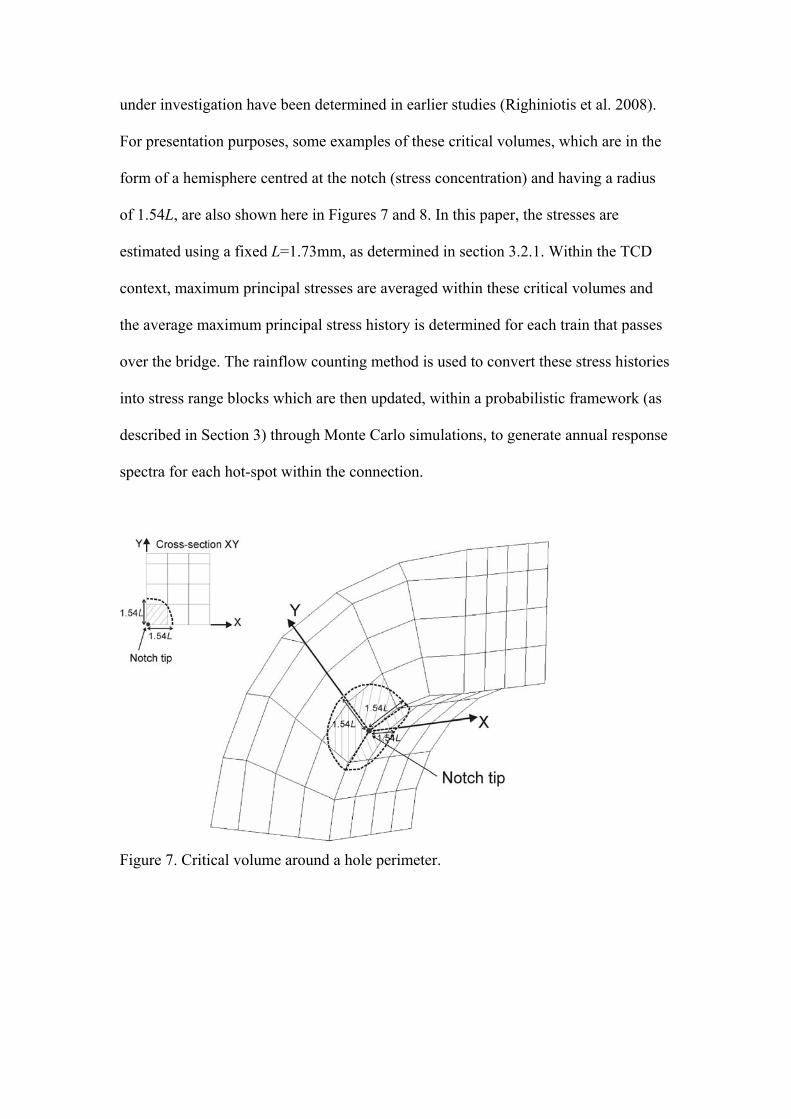
under investigation have been determined in earlier studies (Righiniotis et al. 2008).
For presentation purposes, some examples of these critical volumes, which are in the
form of a hemisphere centred at the notch (stress concentration) and having a radius
of 1.54L, are also shown here in Figures 7 and 8. In this paper, the stresses are
estimated using a fixed L=1.73mm, as determined in section 3.2.1. Within the TCD
context, maximum principal stresses are averaged within these critical volumes and
the average maximum principal stress history is determined for each train that passes
over the bridge. The rainflow counting method is used to convert these stress histories
into stress range blocks which are then updated, within a probabilistic framework (as
described in Section 3) through Monte Carlo simulations, to generate annual response
spectra for each hot-spot within the connection.
Figure 7. Critical volume around a hole perimeter.
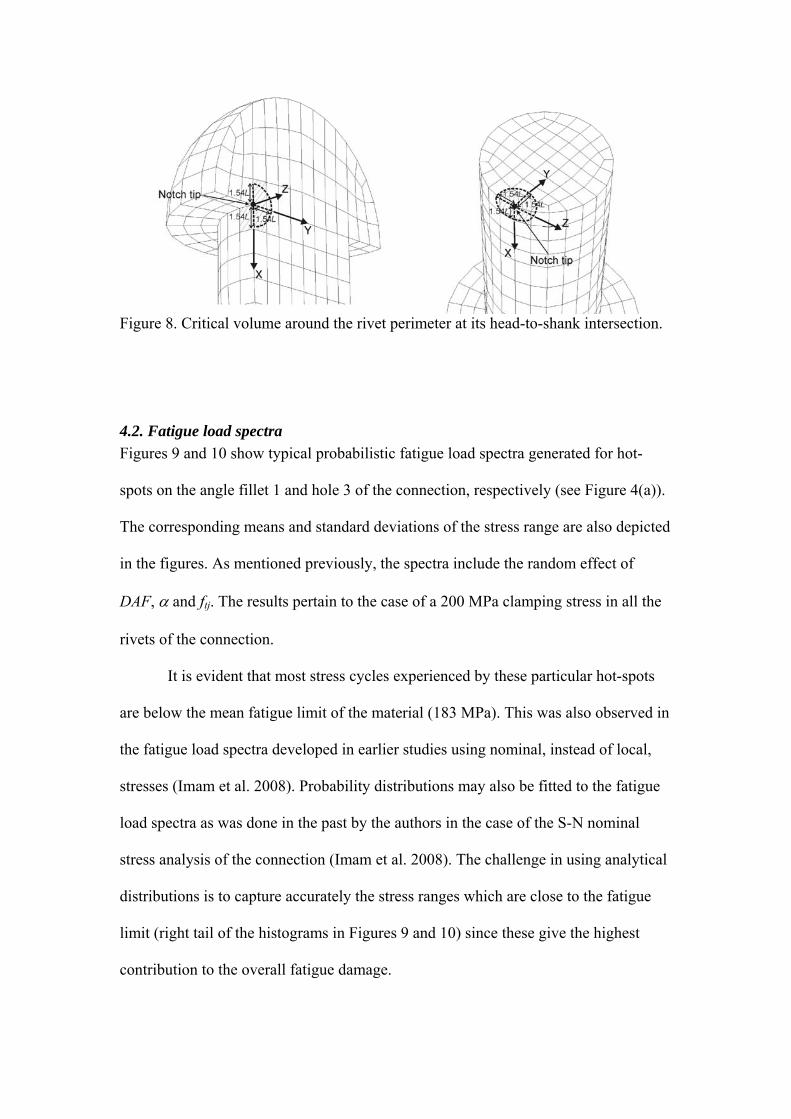
Figure 8. Critical volume around the rivet perimeter at its head-to-shank intersection.
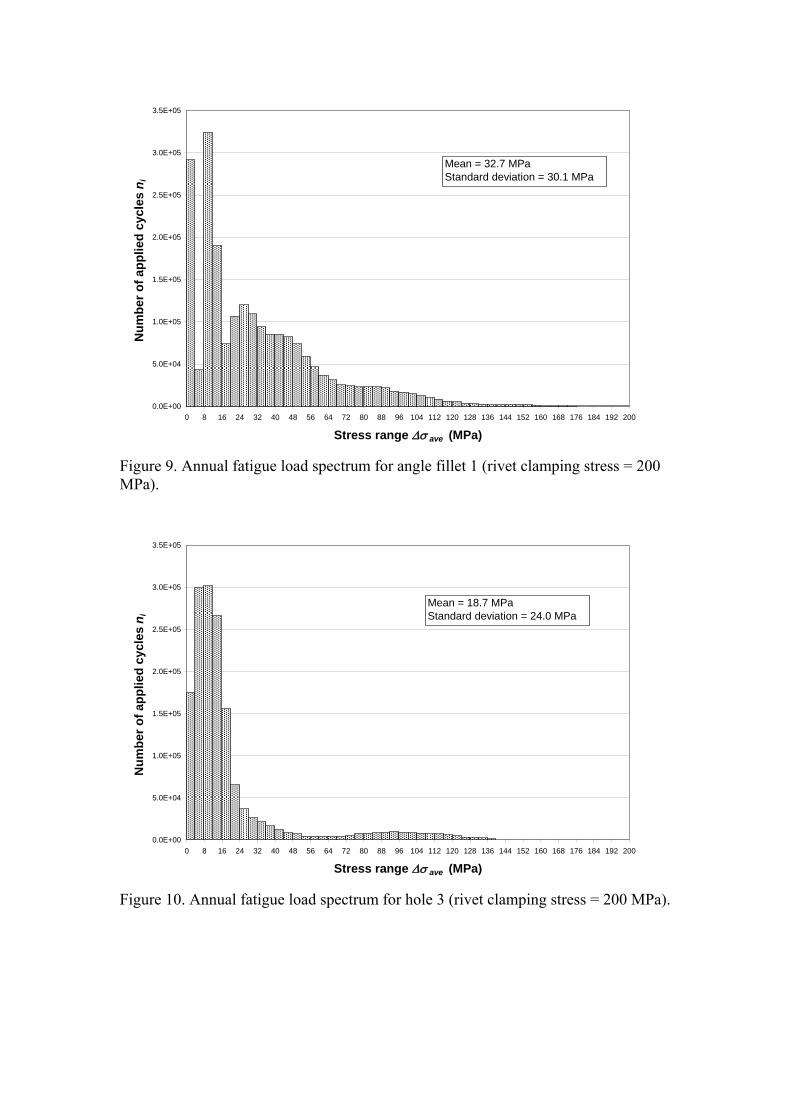
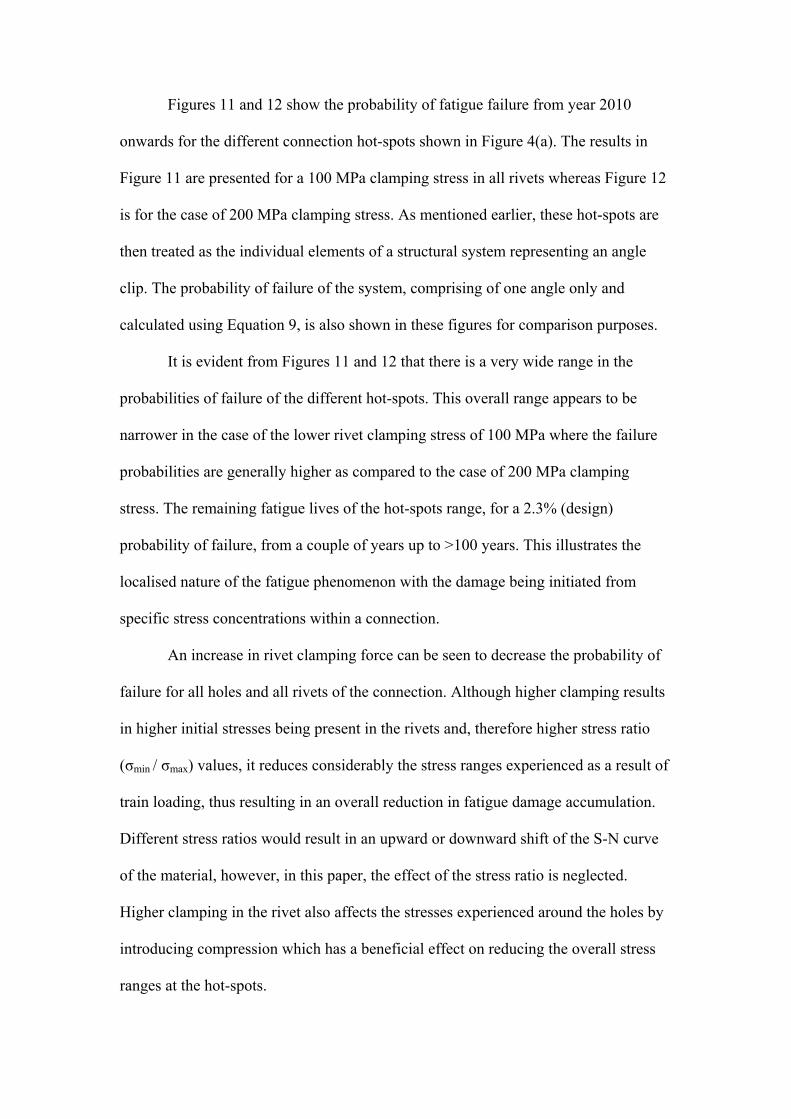
4.2. Fatigue load spectra Figures 9 and 10 show typical probabilistic fatigue load spectra generated for hot-
spots on the angle fillet 1 and hole 3 of the connection, respectively (see Figure 4(a)).
The corresponding means and standard deviations of the stress range are also depicted
in the figures. As mentioned previously, the spectra include the random effect of
DAF, α and ftj. The results pertain to the case of a 200 MPa clamping stress in all the
rivets of the connection.
It is evident that most stress cycles experienced by these particular hot-spots
are below the mean fatigue limit of the material (183 MPa). This was also observed in
the fatigue load spectra developed in earlier studies using nominal, instead of local,
stresses (Imam et al. 2008). Probability distributions may also be fitted to the fatigue
load spectra as was done in the past by the authors in the case of the S-N nominal
stress analysis of the connection (Imam et al. 2008). The challenge in using analytical
distributions is to capture accurately the stress ranges which are close to the fatigue
limit (right tail of the histograms in Figures 9 and 10) since these give the highest
contribution to the overall fatigue damage.
0.0E+00
5.0E+04
1.0E+05
1.5E+05
2.0E+05
2.5E+05
3.0E+05
3.5E+05
0 8 16 24 32 40 48 56 64 72 80 88 96 104 112 120 128 136 144 152 160 168 176 184 192 200
Stress range Δσ ave (MPa)
Num
ber o
f app
lied
cycl
es n
i
Mean = 32.7 MPa Standard deviation = 30.1 MPa
Figure 9. Annual fatigue load spectrum for angle fillet 1 (rivet clamping stress = 200 MPa).
0.0E+00
5.0E+04
1.0E+05
1.5E+05
2.0E+05
2.5E+05
3.0E+05
3.5E+05
0 8 16 24 32 40 48 56 64 72 80 88 96 104 112 120 128 136 144 152 160 168 176 184 192 200
Stress range Δσ ave (MPa)
Num
ber o
f app
lied
cycl
es n
i
Mean = 18.7 MPa Standard deviation = 24.0 MPa
Figure 10. Annual fatigue load spectrum for hole 3 (rivet clamping stress = 200 MPa).

Table 3 summarises the first and second order moment statistics for the annual
fatigue load spectra of each connection hot-spot and for the two values of rivet
clamping stress (100 and 200 MPa). The mean stress range at a detail can be
considered as an important parameter in terms of fatigue reliability estimation and
fatigue assessment. It can be seen that a higher clamping force in the rivets is
beneficial in terms of reducing the mean stress range experienced by the majority of
the hot spots in the connection. The exception is at the angle fillets where it can be
seen that an increase in rivet clamping force results in increase in their mean stress
range which can be attributed to the higher restraint experienced by the angle clip.
Clamping stress = 100 MPa Clamping stress = 200 MPa Connection hot-spot Mean (MPa) Standard
deviation (MPa) Mean (MPa) Standard deviation (MPa)
Hole 1 30.0 24.3 17.2 18.3 Hole 2 32.4 21.9 25.2 18.1 Hole 3 22.0 25.8 18.7 24.0 Hole 4 38.4 27.4 27.9 24.0 Hole 5 43.9 34.6 35.1 31.8 Rivet 1 36.8 28.2 32.1 20.2 Rivet 2 35.2 28.1 28.6 22.4 Rivet 3 40.8 32.6 31.8 27.2 Rivet 4 31.6 24.3 26.4 21.5 Rivet 5 28.7 23.3 27.8 19.5 Fillet 1 30.2 28.3 32.7 30.1 Fillet 2 28.3 26.5 29.8 26.9
Table 3. First and second order statistics for stress range spectra at hot-spots
4.3. Fatigue reliability The fatigue damage in each hot-spot is calculated from its annual fatigue load
spectrum, similar to Figures 9 and 10. The probability of failure and the remaining
fatigue life are, then, estimated through Monte Carlo simulations using Equations 5
and 4, respectively.
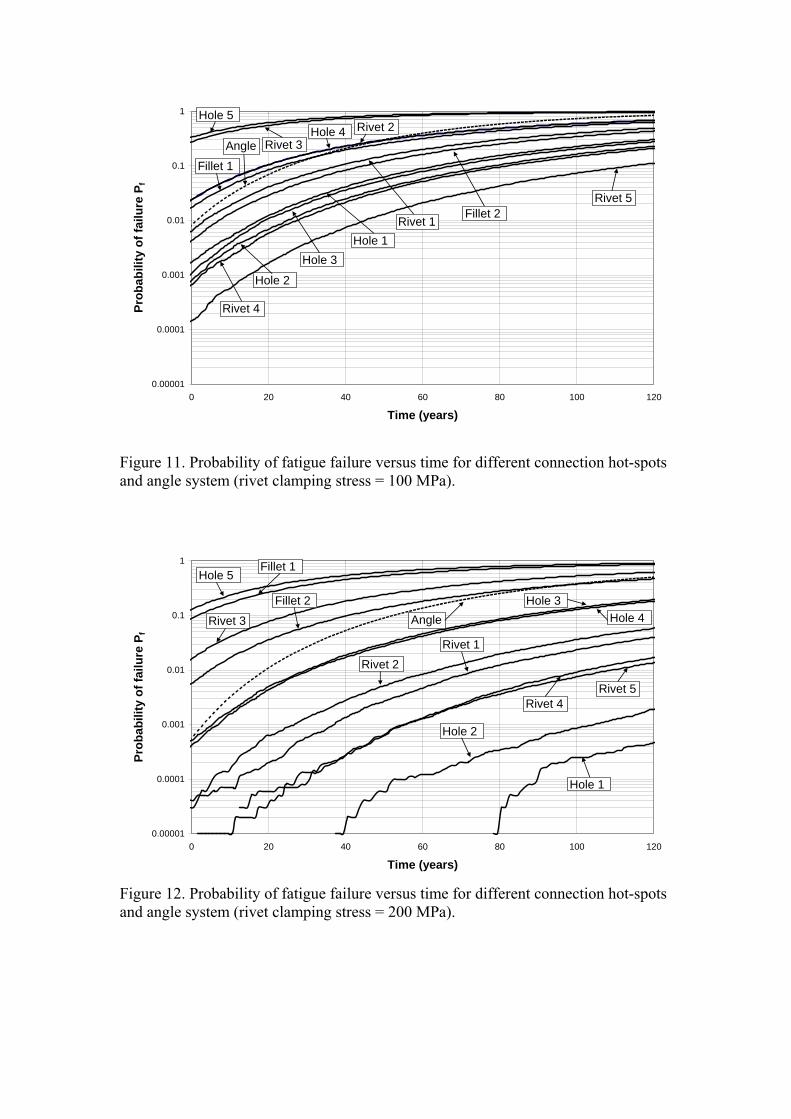
Figures 11 and 12 show the probability of fatigue failure from year 2010
onwards for the different connection hot-spots shown in Figure 4(a). The results in
Figure 11 are presented for a 100 MPa clamping stress in all rivets whereas Figure 12
is for the case of 200 MPa clamping stress. As mentioned earlier, these hot-spots are
then treated as the individual elements of a structural system representing an angle
clip. The probability of failure of the system, comprising of one angle only and
calculated using Equation 9, is also shown in these figures for comparison purposes.
It is evident from Figures 11 and 12 that there is a very wide range in the
probabilities of failure of the different hot-spots. This overall range appears to be
narrower in the case of the lower rivet clamping stress of 100 MPa where the failure
probabilities are generally higher as compared to the case of 200 MPa clamping
stress. The remaining fatigue lives of the hot-spots range, for a 2.3% (design)
probability of failure, from a couple of years up to >100 years. This illustrates the
localised nature of the fatigue phenomenon with the damage being initiated from
specific stress concentrations within a connection.
An increase in rivet clamping force can be seen to decrease the probability of
failure for all holes and all rivets of the connection. Although higher clamping results
in higher initial stresses being present in the rivets and, therefore higher stress ratio
(σmin / σmax) values, it reduces considerably the stress ranges experienced as a result of
train loading, thus resulting in an overall reduction in fatigue damage accumulation.
Different stress ratios would result in an upward or downward shift of the S-N curve
of the material, however, in this paper, the effect of the stress ratio is neglected.
Higher clamping in the rivet also affects the stresses experienced around the holes by
introducing compression which has a beneficial effect on reducing the overall stress
ranges at the hot-spots.
0.00001
0.0001
0.001
0.01
0.1
1
0 20 40 60 80 100 120
Time (years)
Prob
abili
ty o
f fai
lure
Pf
Rivet 5
Rivet 4
Hole 2
Hole 3Hole 1
Fillet 2Rivet 1
Fillet 1
Hole 4Rivet 3
Hole 5
AngleRivet 2
Figure 11. Probability of fatigue failure versus time for different connection hot-spots and angle system (rivet clamping stress = 100 MPa).
0.00001
0.0001
0.001
0.01
0.1
1
0 20 40 60 80 100 120
Time (years)
Prob
abili
ty o
f fai
lure
Pf
Hole 5Fillet 1
Rivet 3
Fillet 2 Hole 3Hole 4
Rivet 2Rivet 1
Rivet 4Rivet 5
Hole 2
Hole 1
Angle
Figure 12. Probability of fatigue failure versus time for different connection hot-spots and angle system (rivet clamping stress = 200 MPa).
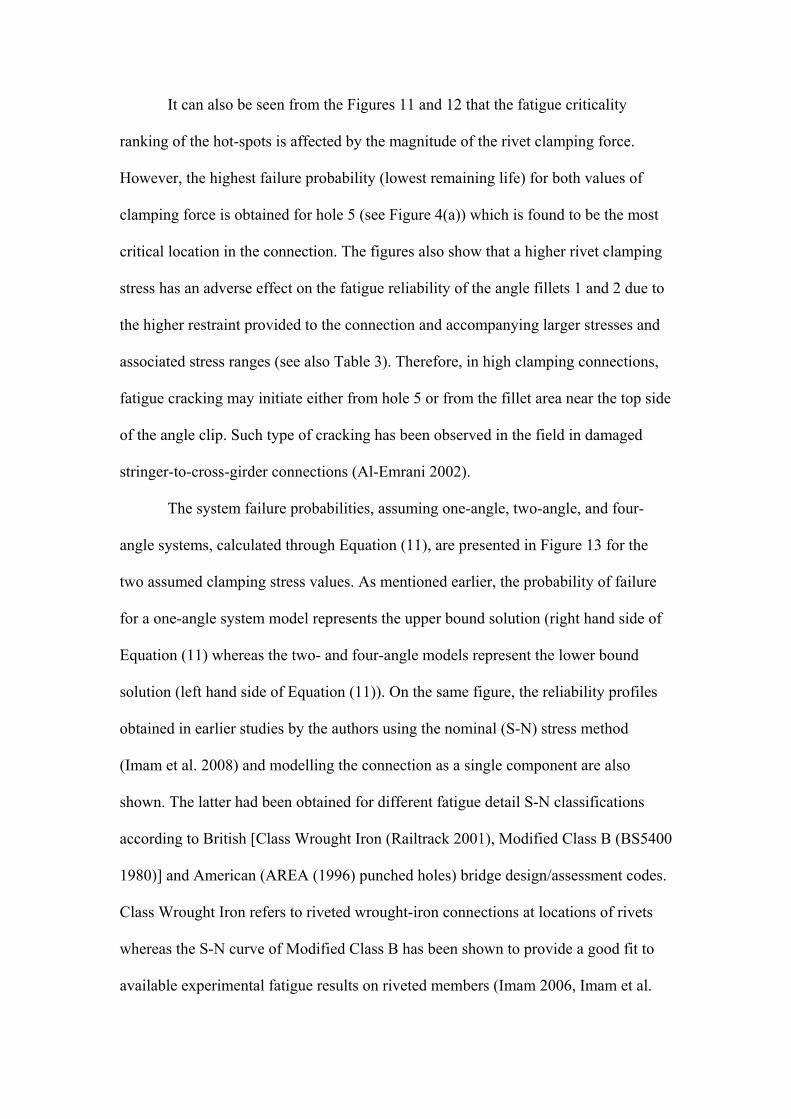
It can also be seen from the Figures 11 and 12 that the fatigue criticality
ranking of the hot-spots is affected by the magnitude of the rivet clamping force.
However, the highest failure probability (lowest remaining life) for both values of
clamping force is obtained for hole 5 (see Figure 4(a)) which is found to be the most
critical location in the connection. The figures also show that a higher rivet clamping
stress has an adverse effect on the fatigue reliability of the angle fillets 1 and 2 due to
the higher restraint provided to the connection and accompanying larger stresses and
associated stress ranges (see also Table 3). Therefore, in high clamping connections,
fatigue cracking may initiate either from hole 5 or from the fillet area near the top side
of the angle clip. Such type of cracking has been observed in the field in damaged
stringer-to-cross-girder connections (Al-Emrani 2002).
The system failure probabilities, assuming one-angle, two-angle, and four-
angle systems, calculated through Equation (11), are presented in Figure 13 for the
two assumed clamping stress values. As mentioned earlier, the probability of failure
for a one-angle system model represents the upper bound solution (right hand side of
Equation (11) whereas the two- and four-angle models represent the lower bound
solution (left hand side of Equation (11)). On the same figure, the reliability profiles
obtained in earlier studies by the authors using the nominal (S-N) stress method
(Imam et al. 2008) and modelling the connection as a single component are also
shown. The latter had been obtained for different fatigue detail S-N classifications
according to British [Class Wrought Iron (Railtrack 2001), Modified Class B (BS5400
1980)] and American (AREA (1996) punched holes) bridge design/assessment codes.
Class Wrought Iron refers to riveted wrought-iron connections at locations of rivets
whereas the S-N curve of Modified Class B has been shown to provide a good fit to
available experimental fatigue results on riveted members (Imam 2006, Imam et al.
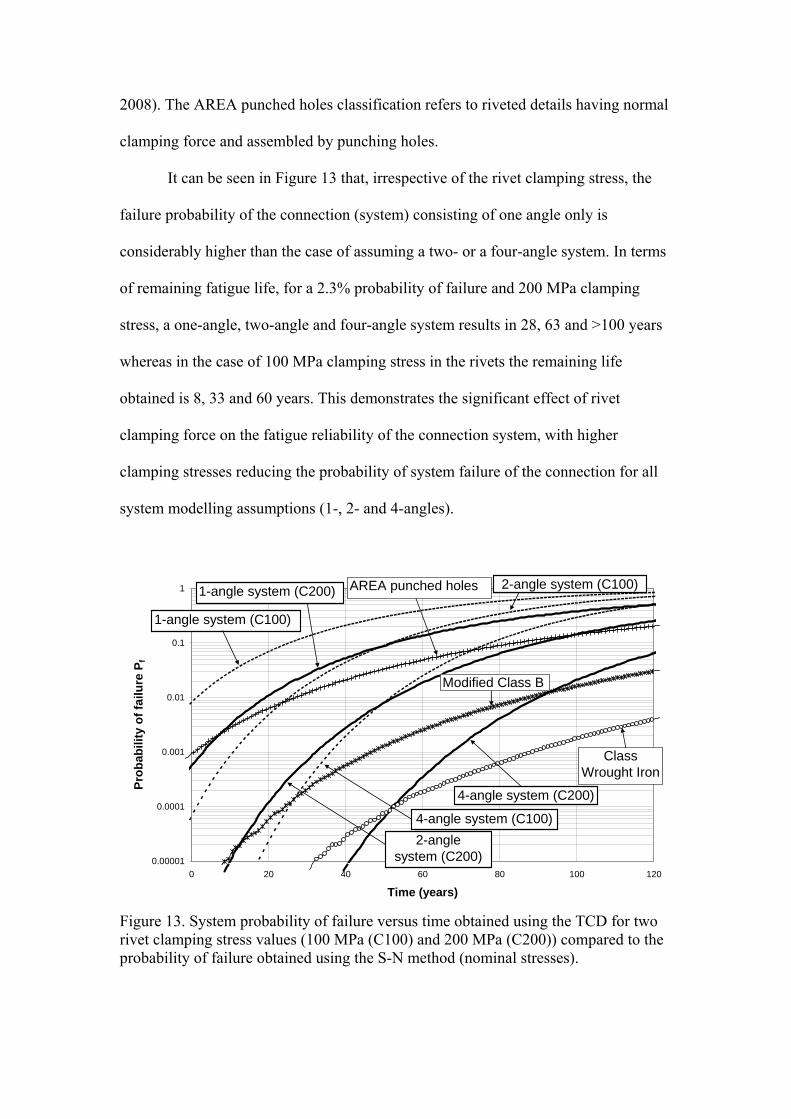
2008). The AREA punched holes classification refers to riveted details having normal
clamping force and assembled by punching holes.
It can be seen in Figure 13 that, irrespective of the rivet clamping stress, the
failure probability of the connection (system) consisting of one angle only is
considerably higher than the case of assuming a two- or a four-angle system. In terms
of remaining fatigue life, for a 2.3% probability of failure and 200 MPa clamping
stress, a one-angle, two-angle and four-angle system results in 28, 63 and >100 years
whereas in the case of 100 MPa clamping stress in the rivets the remaining life
obtained is 8, 33 and 60 years. This demonstrates the significant effect of rivet
clamping force on the fatigue reliability of the connection system, with higher
clamping stresses reducing the probability of system failure of the connection for all
system modelling assumptions (1-, 2- and 4-angles).
0.00001
0.0001
0.001
0.01
0.1
1
0 20 40 60 80 100 120
Time (years)
Prob
abili
ty o
f fai
lure
Pf
1-angle system (C200)
2-angle system (C200)
4-angle system (C100)
Class Wrought Iron
Modified Class B
AREA punched holes
1-angle system (C100)
2-angle system (C100)
4-angle system (C200)
Figure 13. System probability of failure versus time obtained using the TCD for two rivet clamping stress values (100 MPa (C100) and 200 MPa (C200)) compared to the probability of failure obtained using the S-N method (nominal stresses).
By comparing the system reliability profiles with those obtained in previous
studies through the traditional nominal stress (S-N) approach, it can be seen that a
one-angle system assumption gives more conservative remaining life estimates than
its nominal stress counterparts for both rivet clamping stress values. On the other
hand, the remaining life estimates obtained from the four-angle system (for both
clamping stress values) and the two-angle system (200 MPa clamping stress) can be
seen to lie between its AREA (1996) punched holes and Class Wrought Iron
(Railtrack 2001) counterparts. The TCD method employed in this paper appears to
result in a more rapid increase in the probability of failure of the connection with time
as compared to the nominal stress method.
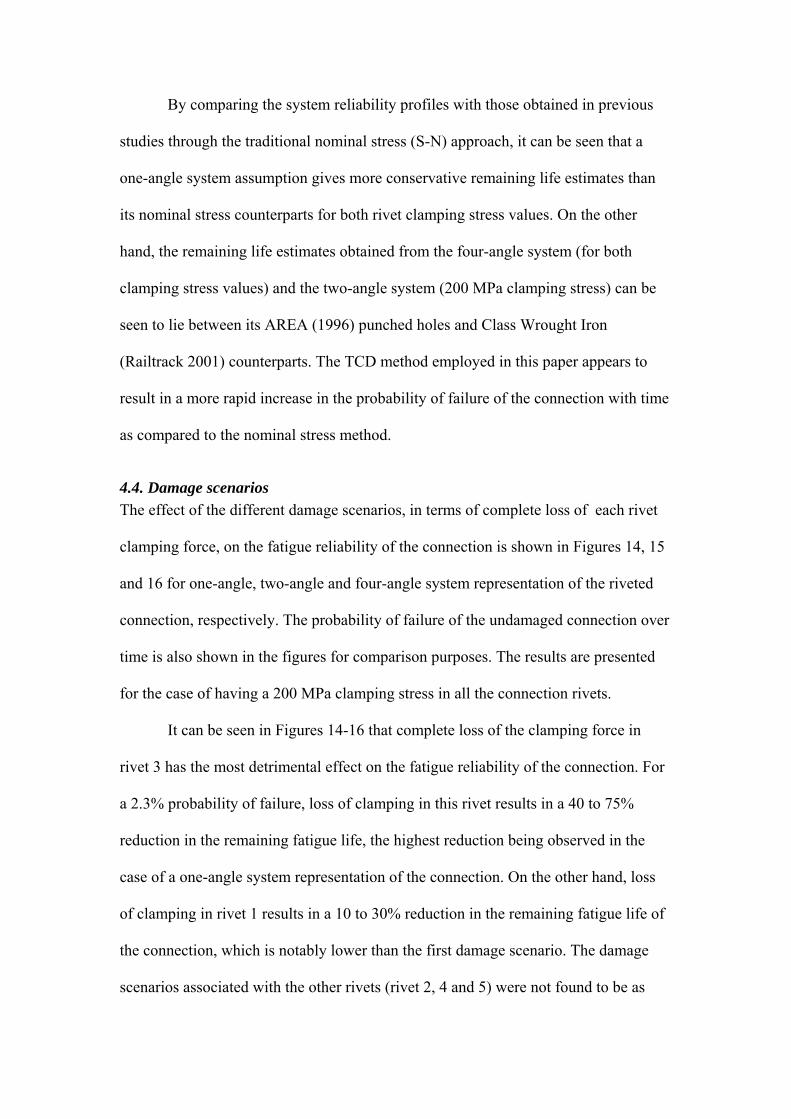
4.4. Damage scenarios The effect of the different damage scenarios, in terms of complete loss of each rivet
clamping force, on the fatigue reliability of the connection is shown in Figures 14, 15
and 16 for one-angle, two-angle and four-angle system representation of the riveted
connection, respectively. The probability of failure of the undamaged connection over
time is also shown in the figures for comparison purposes. The results are presented
for the case of having a 200 MPa clamping stress in all the connection rivets.
It can be seen in Figures 14-16 that complete loss of the clamping force in
rivet 3 has the most detrimental effect on the fatigue reliability of the connection. For
a 2.3% probability of failure, loss of clamping in this rivet results in a 40 to 75%
reduction in the remaining fatigue life, the highest reduction being observed in the
case of a one-angle system representation of the connection. On the other hand, loss
of clamping in rivet 1 results in a 10 to 30% reduction in the remaining fatigue life of
the connection, which is notably lower than the first damage scenario. The damage
scenarios associated with the other rivets (rivet 2, 4 and 5) were not found to be as
highly critical as the previous cases resulting in only a small reduction in the fatigue
reliability of the connection in the case of rivet 4; for rivets 2 and 5, an increase in the
overall connection reliability can be observed.
The results obtained in Figures 14-16 reveal that loss of clamping force in a
connection rivet does not necessarily result in a detrimental effect on the fatigue
reliability of the connection. For the particular stringer-to-cross-girder connection
considered in this paper, loss of clamping force in the top and bottom rivets
connecting the leg of the angle to the cross-girder web was found to affect the fatigue
performance of the connection adversely. It is not, therefore, surprising that the
majority of the fatigue damage cases observed in the field in similar riveted
connections were concentrated in either the top or bottom rivets (Al-Emrani 1999,
2002).
0.00001
0.0001
0.001
0.01
0.1
1
0 20 40 60 80 100 120
Time (years)
Prob
abili
ty o
f fai
lure
Pf
Rivet3-CLoss
Rivet1-CLoss
Rivet4-CLoss
Rivet5-CLoss
Rivet2-CLoss
No damage
Figure 14. Probability of fatigue failure versus time for different rivet clamping force damage scenarios assuming a one-angle system (rivet clamping stress = 200 MPa).

0.00001
0.0001
0.001
0.01
0.1
1
0 20 40 60 80 100 120
Time (years)
Prob
abili
ty o
f fai
lure
Pf
Rivet3-CLoss
Rivet1-CLoss
Rivet4-CLoss
Rivet5-CLoss
Rivet2-CLoss
No damage
Figure 15. Probability of fatigue failure versus time for different rivet clamping force damage scenarios assuming a two-angle system (rivet clamping stress = 200 MPa).
0.00001
0.0001
0.001
0.01
0.1
1
0 20 40 60 80 100 120
Time (years)
Prob
abili
ty o
f fai
lure
Pf
Rivet3-CLoss
Rivet1-CLoss
Rivet4-CLoss
Rivet5-CLoss
Rivet2-CLoss
No damage
Figure 16. Probability of fatigue failure versus time for different rivet clamping force damage scenarios assuming a four-angle system (rivet clamping stress = 200 MPa).

It should be noted that, for the purposes of the investigation, redistribution of
stresses following a hot-spot (component) failure is not taken into account. The
stresses on the remaining hot-spots are assumed to remain the same as in the
undamaged state of the connection. In reality, the stresses will certainly change when
a component has failed (e.g. a hole or a rivet) and the remaining hot-spots will carry
the loads, which may lead to progressive failure of the connection. The current study
has also adopted non-evolving loads from present day onwards, which is likely to be a
non-conservative assumption given the current outlook on the development of rail
freight in the UK and other countries. On the other hand, the assumption of
independent failure modes in a weakest-link system, similar to the one investigated in
this paper, leads to conservative results for the failure probability.
5. Conclusions This paper presented a system-based model for fatigue assessment of riveted railway
bridge connections building on previous work carried out by the authors which
considered the connection as a single component. A finite element model of a typical,
short-span, riveted railway bridge encompassing a detailed sub-model of a stringer-to-
cross-girder connection was used to convert the train loads to fatigue load effects. The
criticality of the fatigue sensitive details (hot-spots) was assessed through the Theory
of Critical Distances, a recently developed theory which considers the entire
distribution ahead of any given stress concentration. Through Monte Carlo
simulations, probabilistic fatigue load spectra for critical hot-spots on different
components of the connection, such as holes, rivets, angle fillets were developed.
These spectra showed that the majority of the stress cycles experienced by the hot-
spots are below the fatigue limit of the material.
By using the fatigue load spectra developed, reliability profiles and
probabilistic remaining fatigue life estimates for the connection were determined.
Loading, resistance and modelling uncertainties were taken into account. On the
loading side, the problem was randomised through dynamic amplification and the
annual train frequencies. On the response side, the S-N curve and the cumulative
damage model were treated as random. Finally, on the modelling side, the ratio
between actual and calculated stresses was represented as a random variable. The
riveted connection was treated through generic sub-systems capturing potential
damage in identifiable hot-spots, such as rivets, holes and angle fillets. These hot-
spots were treated as the elements of a structural system susceptible to fatigue failure.
The reliability profiles showed that the remaining life of the connection is sensitive to
the assumptions made regarding the form of the system considered for the analysis.
Low remaining lives were obtained for a number of the connection’s hot-spots
indicating that fatigue cracking may be imminent or may have already initiated in a
number of similar existing bridge connections. Reliability profiles obtained from the
TCD method and the system representation have shown a more rapid increase in
failure probability of the connection compared to similar results obtained using the
traditional S-N approach. The rivet clamping force was found to have a considerable
effect on the reliability of the connection for all system representations. Loss of
clamping force in the top or bottom rivets connecting the angle leg to the cross-girder
web was found to result in a considerable reduction in the remaining fatigue life of the
connection. Loss of clamping in the remaining rivets was found not to have a
significant adverse effect on the connection’s reliability.
It is unwise to generalise the results and conclusions presented in this paper to
all types of riveted bridge connections with different configurations and geometries.
For example, field observations from fatigue damage cases have shown that fatigue
cracking occur more commonly at the top and bottom part of connections. This paper
is a first attempt at presenting a general system-based representation appropriate for
fatigue assessment of complex connections made up of a number of components. As
discussed, further work is required so that it can serve as a useful tool in planning
inspections and/or repair actions in similar riveted bridge connections.
References Adamson, D.E., and Kulak, G.L., 1995. Fatigue tests of riveted bridge girders.
Structural Engineering Report No 210. Department of Civil Engineering, University of Alberta, Edmonton, Canada.
Al-Emrani, M., 1999. Stringer-to-floor-beam connections in riveted railway bridges – an introductory study of fatigue performance, Publ. S99:4. Chalmers University of Technology, Sweden.
Al-Emrani, M., 2002. Fatigue in riveted railway bridges – A study of the fatigue performance of riveted stringers and stringer-to-floor-beam connections. PhD Thesis. Chalmers University of Technology, Sweden.
American Association of State Highway Transportation Officials (AASHTO), 1998. LRFD bridge design specifications. 2nd ed., Washington, DC, USA.
American Railway Engineering Association (AREA), 1996. Manual for railway engineering, Chapter 15: Steel Structures. Washington, DC, USA.
Bellett, D., Taylor, D., Marco, S., Mazzeo, E., Guillois, J., and Pircher, T., 2005. The fatigue behaviour of three-dimensional stress concentrations. International Journal of Fatigue, Vol 27 (3), 207-21.
BS5400, 1980. Steel, Concrete and Composite Bridges: Part 10: Code of Practice for Fatigue. London: British Standards Institute.
Byers, W.G., 1970. Impact from railway loading on steel girder spans. Journal of Structural Division (ASCE), Vol 96 (ST6), 1093-1103.
Byers, W.G., 1976. Rating and reliability of railway bridges. In: Proceedings of the National Structural Engineering Conference (ASCE), Vol. 1, Madison, 153-170.
Cullimore, M.S.G., 1967. The fatigue strength of wrought iron after weathering in service. The Structural Engineer, Vol 45 (5), 193-199.
DNV, 2005. Fatigue design of offshore steel structures. Recommended Practice, DNV-RP-C203. Norway: Det Norske Veritas.
Doerk, O., Fricke, W., and Weissenborn, C., 2003. Comparison of different calculation methods for structural stresses at welded joints. International Journal of Fatigue, Vol 25 (5),359-369.
Dong, P., 2001. A structural stress definition and numerical implementation for fatigue analysis of welded joints. International Journal of Fatigue, Vol 23 (10), 865-876.
EC3, 2005. EN 1993-1-9: Eurocode 3: Design of steel structures – Part 1.9: Fatigue. CEN.

Estes, A.C., and Frangopol, D.M., 1999. Repair optimization of highway bridges using system reliability approach. Journal of Structural Engineering (ASCE), Vol 125 (7), 766-775.
Ghosn, M., Moses, F., and Frangopol, D.M., 2010. Redundancy and robustness of highway bridge superstructures and substructures. Structure and Infrastructure Engineering, Vol 6 (1 & 2), 257-278.
Helmerich, R., Kühn, B., and Nussbaumer, A., 2007. Assessment of existing steel structures. A guideline for estimation of the remaining fatigue life. Structure and Infrastructure Engineering, Vol 3 (3), 245-255.
Hendawi, S., and Frangopol, D.M., 1994. System reliability and redundancy in structural design and evaluation. Structural Safety, Vol 16 (1-2), 47-71.
Imam, B. 2006. Fatigue analysis of riveted railway bridges. PhD Thesis. University of Surrey, UK.
Imam, B., Righiniotis, T.D., Chryssanthopoulos, M.K., and Bell, B., 2006. Analytical fatigue assessment of a typical riveted UK rail bridge. Proceedings of the Institution of Civil Engineers (ICE) – Bridge Engineering, Vol 159 (3), 105-116.
Imam, B.M., Righiniotis, T.D., and Chryssanthopoulos, M.K., 2007. Numerical modelling of riveted railway bridge connections for fatigue evaluation. Engineering Structures, Vol 29 (11), 3071-3081.
Imam, B.M., Righiniotis, T.D., and Chryssanthopoulos, M.K., 2008. Probabilistic fatigue evaluation of riveted railway bridges. Journal of Bridge Engineering (ASCE), Vol 13 (3), 237-244.
Melchers, R.E., 1999. Structural reliability analysis and prediction. Chichester: John Wiley & Sons.
Micic, T., Chryssanthopoulos, M.K., and Baker M.J., 1995. Reliability analysis for highway bridge deck assessment, Structural Safety, Vol. 17, 135-150.
Miner, M.A., 1945. Cumulative damage in fatigue. Journal of Applied Mechanics, Vol 12 (3), 159-164.
Nowak, A.S., and Cho, T., 2007. Prediction of the combination of failure modes for an arch bridge system. Journal of Constructional Steel Research, Vol 63 (12), 1561-1569.
Okasha, N.M., and Frangopol, D.M., 2010. Time-variant redundancy of structural systems. Structural and Infrastructure Engineering, Vol 6 (1-2), 279-301.
Railtrack. 2001. RT/CE/C/025. Railtrack Line Code of Practice: The Structural Assessment of Underbridges. Railtrack, UK.
Righiniotis, T.D., Imam, B.M., and Chryssanthopoulos, M.K., 2008. Fatigue analysis of riveted railway bridge connections using the theory of critical distances. Engineering Structures, Vol 30 (10), 2707-2715.
Susmel, L., and Taylor, D., 2003. Fatigue design in the presence of stress concentrations. Journal of Strain Analysis for Engineering Design, Vol 38 (5), 443-452.
Sweeney, R.A.P., 1979. Importance of redundancy in bridge-fracture control. Transportation Research Record 711, Transportation Research Board, National Research Council, Washington DC, 23-30.
Sweeney, R.A.P., Oommen, G., and Le, H., 1997. Impact of site measurements on the evaluation of steel railway bridges. In: Report of IABSE Workshop, Lausanne: Evaluation of Existing Steel and Composite Bridges, Zurich, 139-147.
Taylor, D., 1999. Geometrical effects in fatigue: a unifying theoretical model. International Journal of Fatigue, Vol 21 (5), 413-420.
Taylor, D., 2005. Analysis of fatigue failures in components using the theory of critical distances. Engineering Failure Analysis, Vol 12 (6), 906-914.
Taylor, D., 2007. The theory of critical distances: A new perspective in fracture mechanics. London: Elsevier.
Taylor, D., and Wang, G., 2000. The validation of some methods of notch fatigue analysis. Fatigue and Fracture of Engineering Materials and Structures, Vol 23 (5), 387-394.
Tobias, D.H., and Foutch, D.A., 1997. Reliability-based method for fatigue evaluation of railway bridges. Journal of Bridge Engineering (ASCE), Vol 2 (2), 53-60.
Wang, C.S., Chen, A.R., Chen, W.Z., and Xu, Y., 2006. Application of probabilistic fracture mechanics in evaluation of existing riveted bridges. Bridge Structures: Assessment, Design and Construction, Vol 2 (4), 223-232.
Wang C.S., Xu, Y., Chen, A.R., and Chen W.Z., 2007. System fatigue damage reliability assessment of railway riveted bridges. Key Engineering Materials, Vol 347, 173-178.
Wirsching, P.H., 1995. Probabilistic fatigue analysis. In: C. Sundararajan, ed. Probabilistic Structural Mechanics Handbook. New York: Chapman & Hall.