feasibility study of on-car regenerative braking system (rbs) for
TRANSCRIPT

Feasibility Study of On-Car Regenerative Braking System (RBS) for Electric Rail Applications
Final Report
Prepared for
The New York State Energy Research and Development Authority
Albany, NY
Mr. Jason Doling
Prepared by
Dayton T. Brown, Inc. Engineering and Test Division
Bohemia, NY
Keith Cummings Director, Lab Operations
Contract No.: 17734
DTB Report: 305100-01-R12-0754 11 January 2013
Page 1

Table of Contents
1. Overview.................................................................................................................... 51.1 Related Works .....................................................................................................71.2 Concept of This Study..........................................................................................8
2. Methodology .............................................................................................................. 92.1 Approach..............................................................................................................92.2 Design Assumptions ..........................................................................................10
2.2.1 Energy Storage System Assumptions.........................................................102.2.2 Vehicle Assumptions ...................................................................................102.2.3 Utilization Assumptions ...............................................................................10
3. Cell Characterization ............................................................................................... 113.1 Cell Model ..........................................................................................................113.2 Cells to Be Evaluated.........................................................................................123.3 Characterization Techniques .............................................................................13
3.3.1 Model Fitting Results ...................................................................................133.4 Cell Model Data .................................................................................................17
4. Performance Evaluation .......................................................................................... 184.1 Subway Car/Energy Storage Model...................................................................18
4.1.1 System Model Details..................................................................................184.1.2 Motion Simulations ......................................................................................214.1.3 Energy Storage System Simulations...........................................................244.1.4 Assessment of Simulation Data ..................................................................29
4.2 Conditions Evaluated .........................................................................................295. Results of Analysis .................................................................................................. 29
5.1 Single Cell Performance ....................................................................................295.2 System Performance .........................................................................................34
5.2.1 Individual Energy Storage Device Performance..........................................34
Page 2

5.2.2 Comparative Performance Assessment ......................................................416. System Considerations............................................................................................ 44
6.1 Thermal Design..................................................................................................446.2 Battery Electrical Management ..........................................................................456.3 Cycle Life ...........................................................................................................466.4 Propulsion Integration ........................................................................................47
7. Market Analysis ....................................................................................................... 488. Conclusions and Next Steps ................................................................................... 50
Page 3
TABLE OF FIGURES
Figure No. Figure Caption Page
No. 3.2-1 Cell Characteristics 12
3.3.1-1 Lithium Ion Cell Model 14 3.3.1-2 EDLC Ultracapacitor Model 15 3.3.1-3 Nickel Capacitor Model 16 3.4-1 Results of Cell Characterization Testing 17
4.1.1-1 Overall System Model 19 4.1.1-2 Vehicle Motion Model 19 4.1.1-3 Energy Storage Device Model 20 4.1.2-1 Full Stop Motion Model Data 21 4.1.2-2 Partial Deceleration Motion Model Data 23 4.1.3-1 Model of Energy Storage with Lithium Ion Cells 25
4.1.3-2 Model of Energy Storage with EDLC Ultracapacitor Cells 27
5.1-1 Peak Charging Capability of Energy Storage Devices 30
5.1-2 Energy Lost to Terminal Resistance 31
5.1-3 Ultracapacitor Performance Versus Lithium Ion Cell Performance 32
5.1-4 Power Lost for Limited Charge Rate Simulations 33 5.2.1.1-1 Full Stop Performance of Lithium Ion Cells 35
5.2.1.1-2 Partial Deceleration Performance of Lithium Ion Cells 36
5.2.1.2-1 Full Stop Performance of Ultracapacitor Cells 37
5.2.1.2-2 Partial Deceleration Performance of Ultracapacitor Cells 38
5.2.1.3-1 Full Stop Performance of Nickel Capacitor Cells 39
5.2.1.3-1 Partial Deceleration Performance of Nickel Capacitor Cells 40
5.2.2.1-1 Full Stop Comparison of all Tested Cells 41
5.2.2.2-1 Partial Deceleration Comparisons between Lithium Ion Cells and Ultracapacitor Cells 43
5.2.2.2-2 Energy Loss Comparisons between Lithium Ion Cells and Ultracapacitor Cells 43
7-1 Heavy and Light Rail Energy Consumption 1986-2009 (Source APTA 2011 Fact Book) 49
7-2 Electricity Costs 2004-2010 (Source Data: US Energy Information Administration) 49
Page 4

NOTICE
This report was prepared by Dayton T. Brown, Inc. in the course of performing work contracted for and sponsored by the New York State Energy Research and Development Authority (hereafter “NYSERDA”). The opinions expressed in this report do not necessarily reflect those of NYSERDA or the State of New York, and reference to any specific product, service, process, or method does not constitute an implied or expressed recommendation or endorsement of it. Further, NYSERDA, the State of New York, and the contractor make no warranties or representations, expressed or implied, as to the fitness for particular purpose or merchantability of any product, apparatus or service, or the usefulness, completeness, or accuracy of any processes, methods, or other information contained, described, disclosed, or referred to in this report. NYSERDA, the State of New York, and the contractor make no representation that the use of any product, apparatus, process, method, or other information will not infringe privately owned rights and will assume no liability for any loss, injury, or damage resulting from, or occurring in connection with, the use of information contained, described, disclosed, or referred to in this report.
Abstract
Dayton T Brown (DTB), ElectroMotive Designs (EMD) and KLD Labs (KLD) researched the feasibility of on-car regenerative braking energy storage for the New York City MTA subway system. The study evaluated potential storage system solutions comprised of specific high power Lithium Ion cells, Electric Double Layer Capacitors (EDLC or ultracapacitors) or Nickel-Capacitors (NiCap). The study determined that the implementation of an on-board ESS comprised of EDLC ultracapacitors (or Lithium Ion batteries) could increase the recoverable regenerative energy to about 75% of the full amount available and that the mitigation of the current train limitations, through systems integration, could increase the available energy to about 24kWh per 10 car train per stop.
1. Overview
The New York Metropolitan Transportation Authority (MTA) consumes approximately 2150 GWh per year for traction power alone, at an electricity cost of approximately $237 M annually. MTA NYC Transit consumes about 80% (1715 GWh) of the annual MTA traction power usage.
Page 5

Dayton T Brown (DTB), ElectroMotive Designs (EMD) and KLD Labs (KLD) were commissioned by NYSERDA to research the concept of on-car regenerative braking energy storage for the New York City MTA subway system.
The New York City subway system is an electric powered rail car system with DC power being supplied to the tracks via substations located near local stops and throughout the system. A large percentage of present subway cars and all future ones are powered by AC traction inverters, which convert DC power from the rails to AC power for their traction motors. All of these AC traction inverter vehicles are capable of generating electrical power as the vehicle decelerates. However, the vast majority of the energy generated during vehicle braking is converted to waste heat. A small percentage of the power is used to supply “hotel loads” on the train. In some instances, power generated by one train during deceleration may be used to accelerate another train. However, this can only occur when both trains are operating on the same segment of track. This situation only exists during a small percentage of stops. At present, there is no capability to store regenerative energy, so the energy is dumped into resistors and dissipated as heat.
“New York City Transit (NYCT) has purchased more than 2,500 new technology railcars with AC propulsion (AC trains) since 1999. These AC trains use regenerative braking, and a significant portion of their braking energy is available for use by train auxiliaries and by trains accelerating nearby. – REIP, “New York City Transit Regeneration Energy Improvement Project”, NYPA Contract No. 4500116711, Final Report, Rev. 1.1, May 31, 2008
“For significant energy savings to take place, it is critical that, during train regeneration, at least one train is either accelerating or cruising in the same section of the system to use the regenerated energy. In the absence of the other train or trains, the regenerated energy will be used by the braking train auxiliary equipment, resulting in minimal energy saving.” - LTK report, “NEW YORK CITY TRANSIT TRACTION POWER SYSTEM STUDY ANDENERGY STORAGE SYSTEM ANALYSIS”, NYPA Contract No. 4500117064, Final Report, April 20, 2007
“However, the amount of electrical energy NYCT saves by AC train regeneration is not known. Ongoing monitoring of metered energy and power costs do not show any significant change.” – REIP
The REIP report concluded that, with modification to the propulsion system rheostatic chopper and ripple detection parameters, maximum regenerative energy possible on a 10 car train, per stop, is 12 kWh. This represents approximately half of the regenerative energy available from a braking train. Contributing factors include:
- Load limitation (acceleration vs deceleration profiles)
Page 6
- Train and propulsion inverter control configurations - Third Rail voltage limits (regen voltage limit) - Ripple detection (dead rail protection)
Additionally, investigations of previous technologies for Energy Storage Systems (ESS) have found that battery and ultracapacitor solutions did not meet the requirements due to energy density limitations, heat dissipation problems and overall implementation cost.
The DTB/EMD study determined that the implementation of an on-board ESS comprised of EDLC ultracapacitors (or Lithium Ion batteries) could increase the recoverable regenerative energy to about 75% of the full amount available and that the mitigation of the current train limitations, through systems integration, could increase the available energy to about 24kWh per 10 car train per stop. Based on the analysis presented in the MTA Blue Ribbon Commission Report this would result in an annual reduction of approximately 1060 GWh, representing a savings of approximately $115M per year.
1.1 Related Works
Numerous studies have been performed to evaluate the concept of storing regenerative braking energy. LTK Engineering performed one such study, which included system level simulations of a complete train and rail system in real world locations. This study included the influence of specific variables, such as rail material, inverter set points, and train scheduling. It assumed very general parameters for the energy storage system options.
The MTA Blue Ribbon Commission on Sustainability studied the concept of energy storage from a very macroscopic perspective. They included information on the size of the fleet, the mix of vehicle types, and scheduling. The report evaluated various energy storage technologies, including several battery chemistries, supercapacitors and flywheels. These energy storage technologies were represented by general specifications as to energy density and cost.
Electrical Power worX (EPX) Corp studied the concept of deploying an ultracapacitor based energy storage system on a train. Their report gave general coverage of many of the factors required to integrate onboard ultracapacitor energy storage with a train, including packaging cooling, and electrical integration.
New York City Transit (NYCT), The New York Power Authority (NYPA) and Turner Engineering Corporation (Tenco) performed a Regeneration Energy Improvement Project (REIP) whose purpose was to quantify train-to-train regeneration energy savings and identify means to increase the savings. This study quantified current regeneration
Page 7

energy performance, regeneration performance attainable with propulsion system parameter modification, and the factors limiting regeneration.
1.2 Concept of This Study
As illustrated above, numerous parties have attempted to evaluate the concept of energy storage for regenerative braking. Most all have attempted to perform some manner of all inclusive study of the feasibility of the concept. However, none of these reports delves into the specifics of how a particular energy storage medium will operate in the context of the subway. General “rule of thumb” specifications for an energy storage technology do not accurately represent how it will perform in a subway application. For example, a typical Lithium Ion battery may be able to store 16 Wh/kg, but very few of them could absorb anything close to a full charge in a span of 17 seconds, the time it takes a subway train to slow from 50 MPH to a stop using full service brake. Those batteries that can charge significantly in under a minute are subject to extreme heating during that charge cycle. In addition, Lithium Ion battery life is counted in the thousands of cycles unless charge excursions are a small percentage of the total capacity of the cell. As a result, significant extra energy storage must be used in order to deploy a practical system.
Likewise, even technical specifications are not sufficient for comparing different energy storage technologies at the level of granularity needed. For example, batteries are rated in Amp Hours, while capacitors are rated in Farads. Both of these parameters relate to charge storage. When determining the energy storage capability of a cell, the voltage must be taken into account. A typical battery will operate with a relatively consistent voltage over the course of its charge discharge cycle. A battery may release virtually all of its stored energy while sustaining a voltage that is on the order of 70% of its peak voltage or higher. A capacitor, by definition, experiences a voltage change during charge and discharge. The amount of energy that may be stored in a capacitor is intimately tied to the allowable range of voltage during operation. In addition, the current that capacitor can absorb depends on its cell voltage at any given point in time. Therefore, the capacitor charge curve must be overlaid with the power profile of the subway regeneration in order to understand the actual energy that may be captured on a braking cycle.
Given revelations of the type noted above, the value of examining specific energy storage technologies in the context of subway operation becomes apparent. At the same time, there is little value in an outside party (such as DTB or EMD) attempting to evaluate the feasibility of integrating energy storage with a subway car. There are too many varieties of car and too much of the integration is dependent on the car manufacturer. A power converter that requires packaging, a cooling system, and control integration with the traction inverters would be a major undertaking for a third party. However, the vehicle manufacturer would be able to integrate power converter
Page 8
functionality with existing traction inverter designs with only incremental size and cost. The braking resistor chopper circuit on a traction inverter already represents a significant percentage of the componentry required to implement a power converter for an energy storage system. Therefore, this report focuses on a practical evaluation of three representative energy storage technologies in the specific context of subway operation.
2. Methodology
2.1 Approach
The goal of this study is to evaluate the performance of real world energy storage devices within the context of normal subway operation. Three representative energy storage devices were chosen for the test, a high power Lithium Ion cell, a 3000F Electric Double Layer Capacitor (EDLC or ultracapacitor) and a Nickel-Capacitor (NiCap). Because the time available for charging is very short (30 seconds or less), these energy storage devices were chosen based on their extremely high power densities. Each cell was run through a series of tests in order to characterize its capacity and charge and discharge impedances and to fit these parameters to a capacitor model for simulation. In addition, cells were subjected to charge and discharge cycles, which simulate regeneration in a subway car and confirm the accuracy of the models for short term, high power charge and discharge cycles.
Once the energy storage devices were characterized, a general model of a subway car was created. Based on R-160 car specifications learned from the LTK report, the car model includes vehicle mass, maximum acceleration and deceleration rates and curves of tractive effort (motoring and regenerating), efficiency, and frictional loss as a function of velocity.
In order to keep the data set manageable, simulations had to be limited to a finite number of operational conditions. The test scenarios were constructed to demonstrate the relative strengths of each energy storage device while divorcing the analysis from configurable parameters of the system and details of specific locations as well as the cumulative effects of multiple consecutive stops. Each test run consists of a vehicle starting from an initial velocity, decelerating at the maximum service brake rate until a predetermined velocity is reached, then accelerating again to maximum velocity. In each test, the energy storage device begins the test completely empty (0% SOC) and is charged during the braking event. The total test duration is 120 seconds in every case. This time was chosen to allow the energy storage system to return nearly all of the energy that was stored during the braking event.
Page 9
2.2 Design Assumptions
2.2.1 Energy Storage System Assumptions
The goal of this study is to determine the fundamental applicability of various energy storage technologies to subway regeneration, without distortion caused by implementation details. Therefore, specifics such as number of cells in a string and system voltage ranges were ignored. In order to control charging and discharging of the energy storage system and to protect the system from damage, the voltage of the energy storage system must be controlled independently of the DC rail voltage supplying the train. Therefore, it is assumed that a DC-DC converter must be used to interface the energy storage system to the traction inverter’s DC bus. The use of a DC-DC converter lends a great deal of flexibility to the nominal string voltage of the energy storage system and allows for a variety of pack configurations. The actual voltage and current of the energy storage string are ignored. Each cell of the energy storage system operates within its allowable voltage and current ranges, but the pack is related to the traction inverter only in terms of power, not specific voltages and currents. In order to place a bound on operational range, each capacitor cell in the energy storage system is allowed to charge and discharge over a 2:1 voltage range. A range of 2:1 is reasonably easy to achieve with a DC-DC converter and is sufficient to return 75% of the stored energy in a capacitor. The Lithium Ion cells were evaluated over a range of 3.3V to 4.1V per cell, which corresponds with the usable open circuit voltage range for a Lithium Ion cell.
2.2.2 Vehicle Assumptions
As previously mentioned, the vehicle model was derived from specifications for an R-160 car. While the NYC MTA fleet consists of several types of car, the specifications of the R-160 are sufficiently representative of the entire fleet for the purposes of this study. All simulations were evaluated for one car rather than an entire train. This represents a scenario where one energy storage system is installed per car. While the drag due to wind resistance is much greater on the front car, this evaluation used the average drag for the entire train. Conclusions as to the relative merit of each energy storage technology are valid whether evaluated on a per-car or per-train basis. Any conclusions as to the ideal number of cells for one car may be extrapolated to an entire train or divided down for an energy storage system per truck design.
2.2.3 Utilization Assumptions
As previously described, the operation modeled for this analysis is a deceleration (charging) cycle followed by an acceleration cycle, which utilizes nearly all of the charge energy. The acceleration (discharge) cycle is included in order to evaluate the total
Page 10
energy returned to the traction system, after accounting for energy lost due to voltage drops during both charging and discharging. In addition, the lost energy is a direct indication of the heat generated within a cell, although actual temperature rise calculations would require a complete thermal model of the energy storage system and associated cooling systems.
Two types of deceleration event were evaluated. In one case, the train starts out at various speeds then decelerates to a complete stop before accelerating again. In the second evaluation, the train starts out at maximum speed (50 MPH) then partially decelerates to various lower speeds before accelerating again. Decelerating to a stop from maximum speed represents the most extreme case, with the highest amount of energy recapture possible. However, it is only one of many possible deceleration scenarios. Decelerating from lower speeds to a complete stop favors cells with relatively high energy storage and low power capability because the peak power is much lower. Partial decelerations from max speed to lower speeds favor energy storage systems with less energy capacity but higher power capability because peak power capability is crucial for capturing the high power available at high speeds.
For the purposes of this evaluation, it is assumed that these test cycles are sufficiently representative of the range of operation that an energy storage system is likely to encounter. No attempt is made to evaluate the likelihood of each scenario occurring and the relative value of each test. Likewise, evaluations of partial discharges and multi-cycle events are beyond the scope of this study.
3. Cell Characterization
3.1 Cell Model
The first step of the evaluation program was to create a capacitor model for simulations and parameterize it for each of the cell types to be evaluated. The cell model is implemented in Simulink and is a simplification of one used by EMD for battery monitoring. A cell is modeled as an ideal capacitor in series with one of two resistance values (one for charge, another for discharge). More sophisticated models include AC impedance factors, but are difficult to reliably parameterize and can provide misleading results. Extensive testing has demonstrated that EDLC ultracapacitors and nickel capacitors act very much like ideal capacitors with series DC resistance values. In addition, the particular Lithium Ion cell evaluated for this test acts substantially like a capacitor with DC resistance. Subsequent maximum charge current tests confirmed that the capacitor/resistor model accurately represents the high current discharge behavior (terminal voltage, peak current capability, energy storage capacity) of this cell.
Page 11
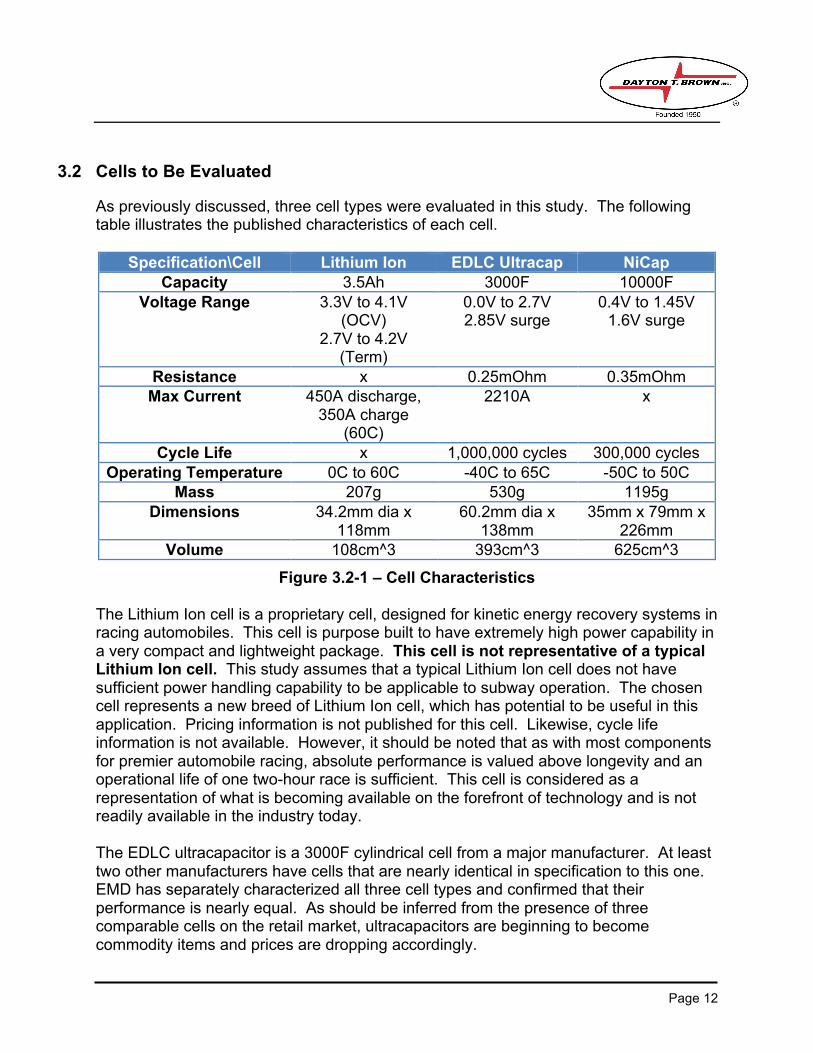
3.2 Cells to Be Evaluated
As previously discussed, three cell types were evaluated in this study. The following table illustrates the published characteristics of each cell.
Specification\Cell Lithium Ion EDLC Ultracap NiCap Capacity 3.5Ah 3000F 10000F
Voltage Range 3.3V to 4.1V (OCV)
2.7V to 4.2V (Term)
0.0V to 2.7V 2.85V surge
0.4V to 1.45V 1.6V surge
Resistance x 0.25mOhm 0.35mOhm Max Current 450A discharge,
350A charge (60C)
2210A x
Cycle Life x 1,000,000 cycles 300,000 cycles Operating Temperature 0C to 60C -40C to 65C -50C to 50C
Mass 207g 530g 1195g Dimensions 34.2mm dia x
118mm 60.2mm dia x
138mm 35mm x 79mm x
226mm Volume 108cm^3 393cm^3 625cm^3
Figure 3.2-1 – Cell Characteristics
The Lithium Ion cell is a proprietary cell, designed for kinetic energy recovery systems in racing automobiles. This cell is purpose built to have extremely high power capability in a very compact and lightweight package. This cell is not representative of a typical Lithium Ion cell. This study assumes that a typical Lithium Ion cell does not have sufficient power handling capability to be applicable to subway operation. The chosen cell represents a new breed of Lithium Ion cell, which has potential to be useful in this application. Pricing information is not published for this cell. Likewise, cycle life information is not available. However, it should be noted that as with most components for premier automobile racing, absolute performance is valued above longevity and an operational life of one two-hour race is sufficient. This cell is considered as a representation of what is becoming available on the forefront of technology and is not readily available in the industry today.
The EDLC ultracapacitor is a 3000F cylindrical cell from a major manufacturer. At least two other manufacturers have cells that are nearly identical in specification to this one. EMD has separately characterized all three cell types and confirmed that their performance is nearly equal. As should be inferred from the presence of three comparable cells on the retail market, ultracapacitors are beginning to become commodity items and prices are dropping accordingly.
Page 12

The Nickel Capacitor (NiCap) cell is a unique device in the industry. To the team’s knowledge, it is only available from one manufacturer and is not in widespread use in the industry. The cell is expected to have performance similar to an EDLC capacitor while potentially being more robust and more easily managed. The cell is manufactured by a company which supplies other battery technologies to the rail industry. The cell is flooded and thus has the potential to be maintained much like a flooded NiMH cell.
3.3 Characterization Techniques
Each cell was run through a characterization procedure in order to fit the Simulink model to the behavior of the real device. An automated test fixture cycled the cell through consecutive charge and discharge cycles. The cell was charged until the specified upper voltage limit was reached. The cell then rested for at least 5 seconds then discharged until the lower voltage was reached. The cell then rested for at least 5 seconds and the cycle was repeated. The test was performed at 275A first. The cycle was repeated 5 times then current was reduced by 25A. The cycle was repeated 5 times at each current level and current was stepped down until 25A was reached. After each charge or discharge phase, if the cell exceeded the ambient temperature by more than 5C, the cycle was paused until the cell temperature returned to the allowable range. At higher currents, this cycle illustrates the voltage step that results from the DC resistance of the cell. At lower currents, this cycle illustrates the capacitance value of the cell. The Lithium Ion cell was cycled between 3.2V and 4.1V, which provided a good fit to the capacitor model and utilized nearly all of the energy available in the cell.
While the test cycle was running, a data logger recorded terminal voltage and charge current at 100mS intervals. Finally, a parameter optimization tool in Simulink was used to adjust the parameters of the capacitor model for the best possible fit with the test data. Subsequently, this capacitor model was used in conjunction with the parameters for performance modeling in the subway application.
3.3.1 Model Fitting Results
The following graphs show examples of how the capacitor model fits measured data for each cell type. For each graph, the upper trace shows the charge/discharge current, which was applied to the sample cell and fed into the cell model for simulation. The lower trace shows the cell voltage. The yellow trace is the voltage predicted by the simulation, the purple trace is the voltage measured on the actual cell.
Page 13
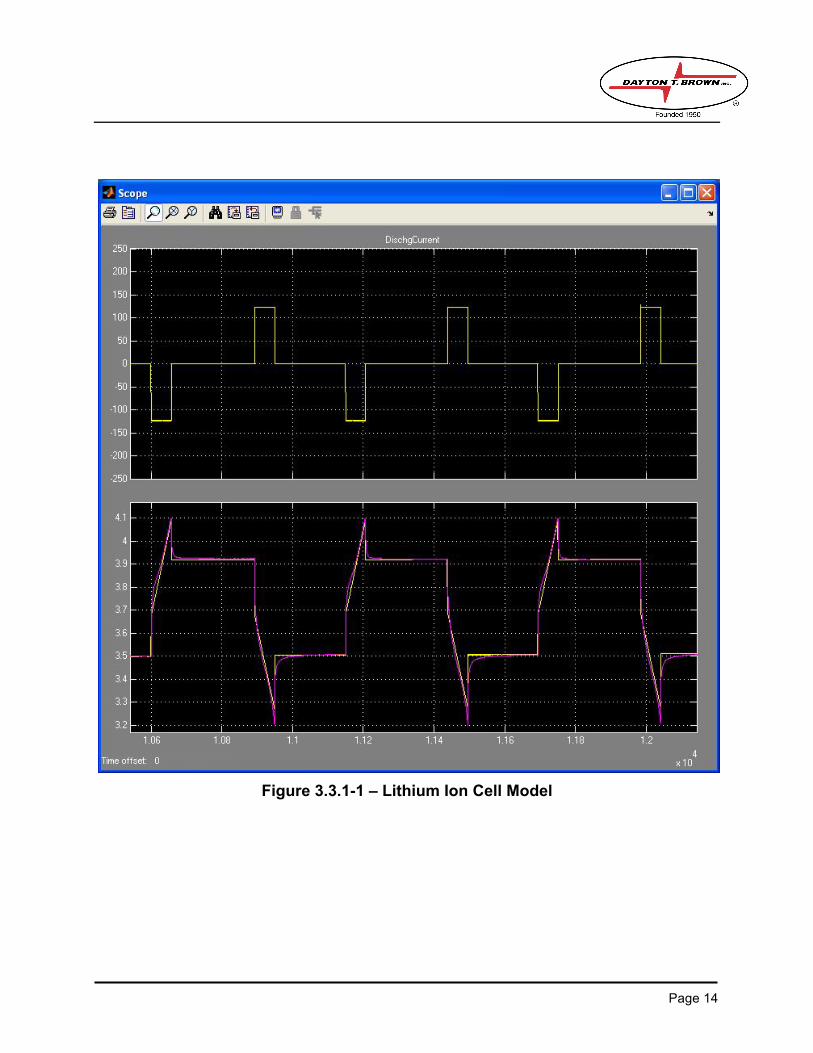
Figure 3.3.1-1 – Lithium Ion Cell Model
Page 14
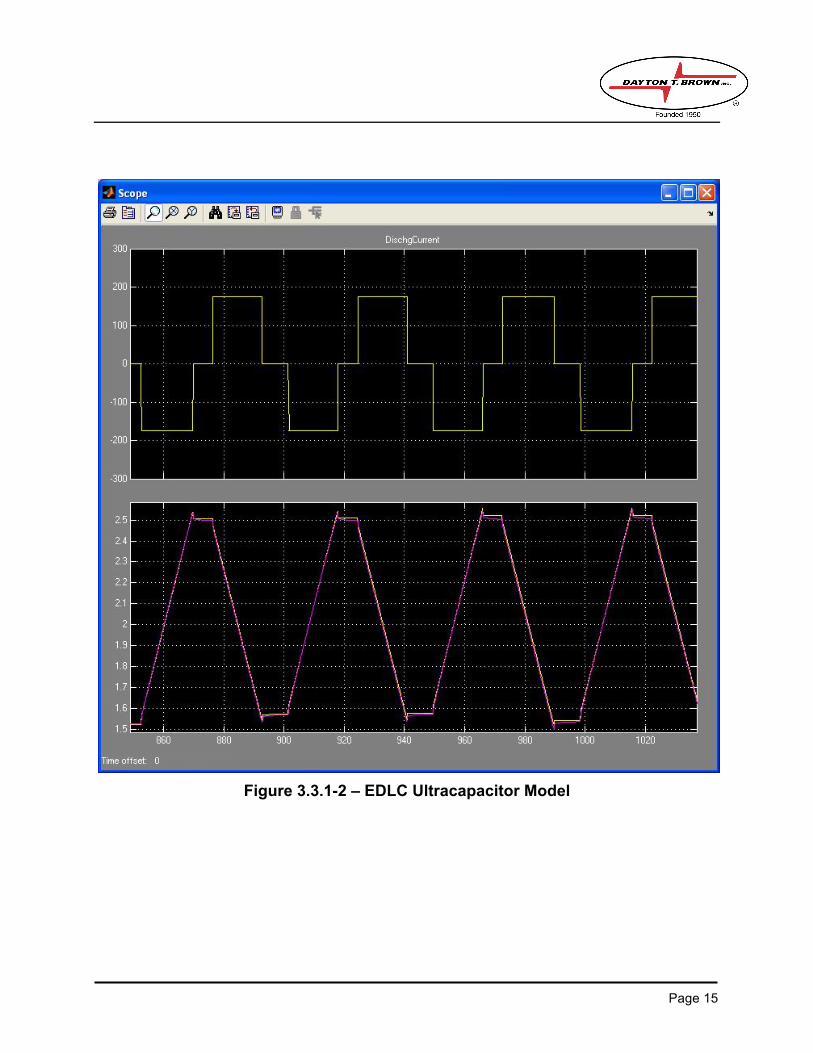
Figure 3.3.1-2 – EDLC Ultracapacitor Model
Page 15
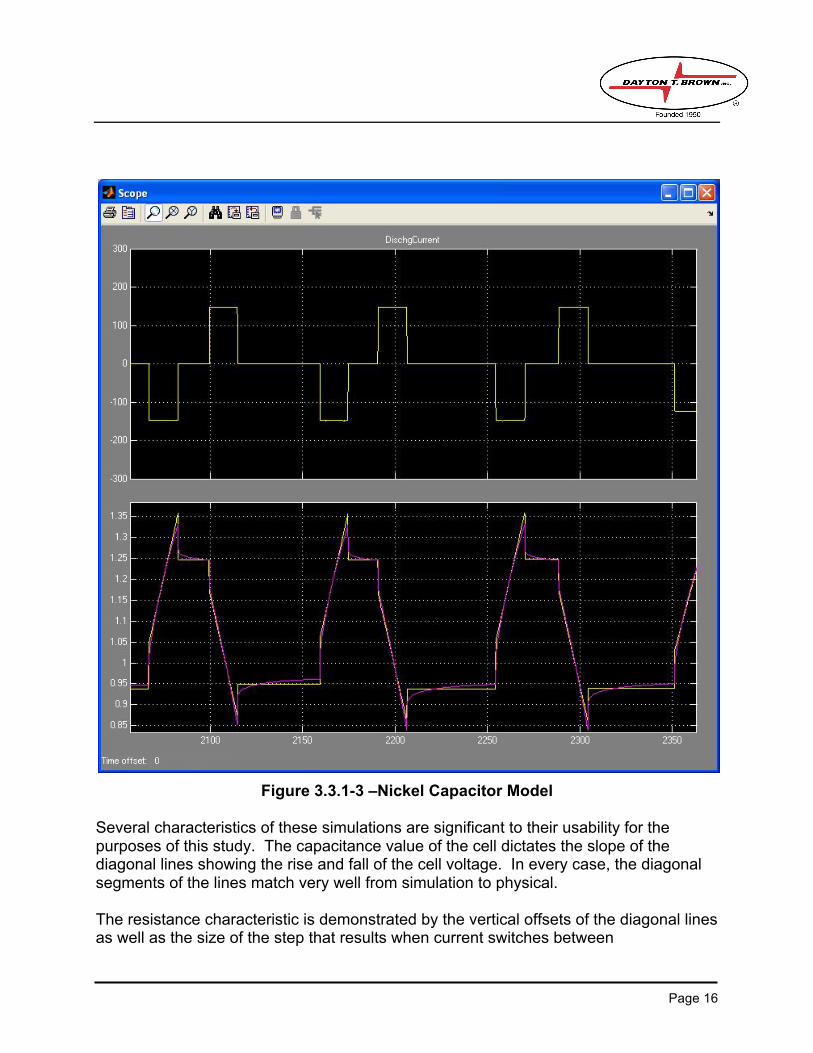
Figure 3.3.1-3 –Nickel Capacitor Model
Several characteristics of these simulations are significant to their usability for the purposes of this study. The capacitance value of the cell dictates the slope of the diagonal lines showing the rise and fall of the cell voltage. In every case, the diagonal segments of the lines match very well from simulation to physical.
The resistance characteristic is demonstrated by the vertical offsets of the diagonal lines as well as the size of the step that results when current switches between
Page 16

charge/discharge and zero. As mentioned above, the diagonal lines match very well, indicating that the offset and thus the impedance are very accurate. In addition, the simulated voltage does settle out to close to the measured voltage when the current is zero.
What does not match as well from the simulation to the physical sample is the AC impedance characteristic. The real world cell has an AC component to its impedance, which results in a curving characteristic in the voltage when zero current is applied. The model uses a pure DC resistance so voltage changes instantly when current is removed then does not change until current is again applied. However, this characteristic is not particularly important to the assessment being performed. The current waveforms during the braking event do not change significantly for many seconds at a time. The effect of the AC impedance is not enough to dramatically affect the ability of the cell to charge and discharge, which is the focus of the analysis.
It should also be noted that the ultracapacitor has dramatically smaller voltage steps, despite the fact that the example screen shots show the ultracapacitor at higher currents than the other cells. This is a good representation of the very low resistance of the cells. The voltage step of the NiCap looks larger than that of the Lithium Ion cell despite its somewhat lower resistance. This is a product of the fact that it operates at lower voltages than the Lithium Ion cell. If enough NiCap cells are placed in series to provide the same operating voltage, the total resistance will be significantly higher than that of the Lithium Ion cell.
3.4 Cell Model Data
The following chart summarizes the cell parameters derived from the characterization testing. Maximum voltage is derived from the cell specification and minimum voltage is half of maximum in order to represent DC-DC converter capabilities. Lithium Ion voltages are based on usable voltage range for the cell:
Parameter\Cell Lithium Ion EDLC Ultracap NiCap Capacitance 17000F 3057F 7563F
Charge Resistance 1.40mOhm 0.22mOhm 0.76mOhm Discharge Resistance 1.90mOhm 0.18mOhm 0.53mOhm Min Terminal Voltage 3.30V 1.35V 0.75V Max Terminal Voltage 4.20V 2.70V 1.50V
Figure 3.4-1 – Results of Cell Characterization Testing
Additional tests were performed across the operational temperature ranges of the energy storage devices. Data was not studied closely enough for comparison to the above values. However, the following characteristics were noted.
Page 17

The Lithium Ion cells had consistent capacitance value across the temperature range. Resistance however was subject to significant variation with temperature. At 0C, impedance values were around 3.2mOhm and 4.0mOhm for charging and discharging. At 60C, impedance was significantly lower than shown above.
The EDLC ultracapacitor cells were very stable across the range of -25C to 50C. Capacitance and resistance varied less than the degree of measurement error.
The Nickel Capacitor cells had fairly stable resistance values across the range of -25C to 50C. However, their capacitance value varied significantly with temperature. At -25C, capacitance was on the order of 6500F. At 50C, capacitance was approximately 9500F.
One important observation is that the performance of the Lithium Ion and NiCap cells improves as temperature rises. Because the subway application is extremely high power by the standards of small energy storage devices, it is inevitable that cells will heat during operation. Therefore, the cells will tend towards better performance (higher capacity, lower resistance) as temperatures rise. Also, if the cells fail to perform at peak capacity, the system will not be able to store all of the regenerative energy in the cells. The result is an excess of waste energy which could be used for pre-heating cells to bring them within their optimal operating range.
4. Performance Evaluation
As previously mentioned, the performance of each energy storage cell was evaluated in the context of a very simple physical model of a subway car. Various deceleration/acceleration profiles were then systematically evaluated for each energy storage device in order to gauge the energy recovered and heat lost in each situation. The results were then graphed in Excel in order to facilitate comparative evaluations among the technologies.
4.1 Subway Car/Energy Storage Model
4.1.1 System Model Details
The overall system model is shown below. It includes a model to represent the acceleration and deceleration of the car. This model outputs velocity as well as the mechanical power used to move the vehicle. The mechanical power information is then sent to a block which determines the electrical power requirements from the traction inverter (and thus available to the energy storage system). The electrical power
Page 18
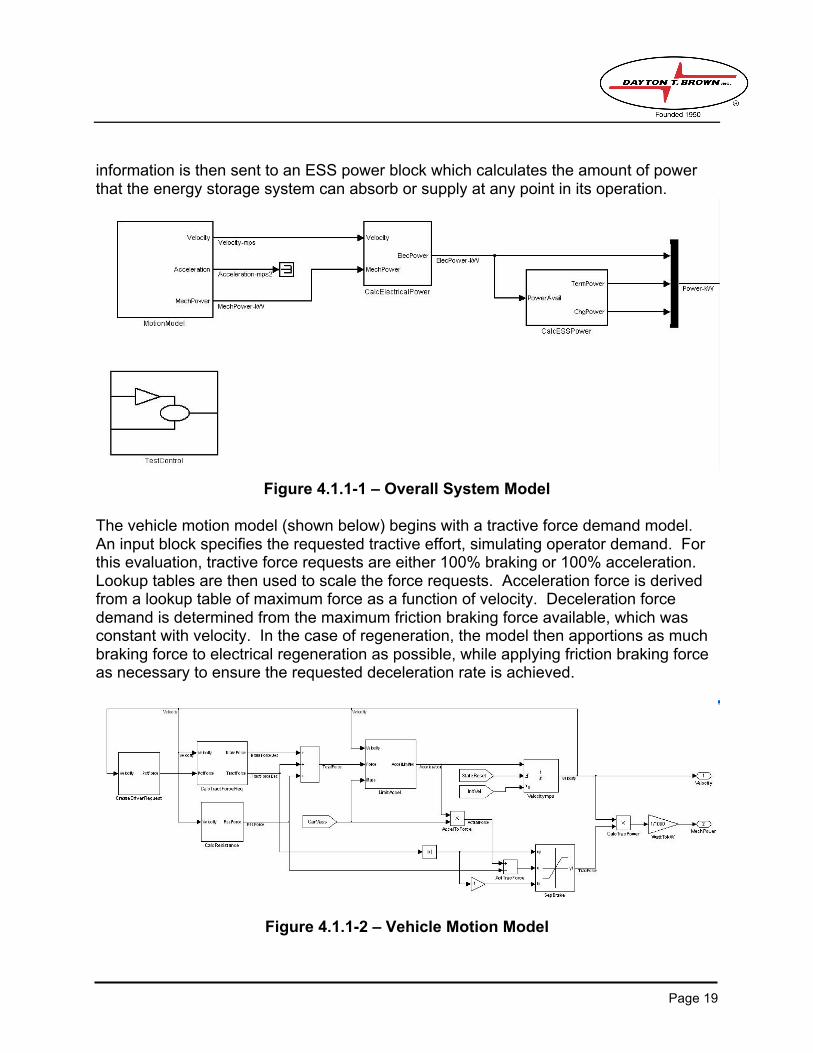
information is then sent to an ESS power block which calculates the amount of power that the energy storage system can absorb or supply at any point in its operation.
Figure 4.1.1-1 – Overall System Model
The vehicle motion model (shown below) begins with a tractive force demand model. An input block specifies the requested tractive effort, simulating operator demand. For this evaluation, tractive force requests are either 100% braking or 100% acceleration. Lookup tables are then used to scale the force requests. Acceleration force is derived from a lookup table of maximum force as a function of velocity. Deceleration force demand is determined from the maximum friction braking force available, which was constant with velocity. In the case of regeneration, the model then apportions as much braking force to electrical regeneration as possible, while applying friction braking force as necessary to ensure the requested deceleration rate is achieved.
Figure 4.1.1-2 – Vehicle Motion Model
Page 19

The tractive force demand is then added to a drag factor to account for the force lost to wind resistance and rail friction. The force is then limited based on pre-defined maximum acceleration and braking specifications. Finally, the force is applied to an integrator to calculate the instantaneous velocity, which is fed back into the models of available force and drag. The output of the motion model is the mechanical power consumed or generated by the traction drive.
The actual power from the traction drive system (acceleration or regeneration) is used as the basis for energy storage system evaluation. The mechanical power of the traction system is fed through an efficiency model to produce electrical power values. Those power levels are then fed into a model of the energy storage device to simulate charging and discharging (as shown below). The electrical power level was divided by the number of cells being considered and cell voltage to calculate cell current which is fed into a model of a single cell. The maximum terminal power for the energy storage device is determined based on maximum terminal voltage, cell open circuit voltage, and cell resistance and was used to limit the current actually captured by the energy storage system. Once the maximum cell voltage is reached, charge power drops off to zero. On the subsequent acceleration phase, power is removed from the energy storage device at the fastest rate that the cell will allow and within the power that is used by the traction drive for propulsion.
Figure 4.1.1-3 – Energy Storage Device Model
Page 20

4.1.2 Motion Simulations
The following graphs illustrate the data generated by the motion model of the system during a full stop sequence of simulations.
Figure 4.1.2-1 – Full Stop Motion Model Data
The top graph shows vehicle velocity (in meters/second). Each cycle includes starting at an initial positive speed, decelerating to zero speed then accelerating in reverse to the maximum speed (50MPH/22.3mps) and cruising until the next cycle. The first cycle shows deceleration from 5MPH (2.23mps) to zero. Subsequent cycles show increments of 5MPH in the starting speed up to a maximum of 50MPH.
Page 21
The second graph shows the acceleration of the train on each cycle.
The third graph shows electrical power available from the traction drive on each cycle. The negative halves of the cycles (acceleration from zero speed) look very similar. The positive halves of the cycle show peaks of increasing power and duration as the initial velocity increases.
The bottom graph shows the net electrical energy of the traction drive, starting at 0 kWh on each cycle. The positive hump is the energy recovered from regeneration, the negative peak is the energy used to propel the vehicle in reverse. The magnitude of the positive humps increases on each consecutive cycle as the initial velocity increases.
The following graphs illustrate the data generated by the motion model of the system during a partial deceleration sequence of simulations.
Page 22

Figure 4.1.2-2 – Partial Decelration Motion Model Data
Each cycle starts from an initial speed of 50MPH (22.3mps) then decelerates to a final speed before accelerating back to 50MPH. The first terminal speed is 0MPH. The speeds then increase by 5MPH per cycle until the final cycle, which shows deceleration from 50MPH to 45MPH. The top graph shows vehicle speeds, which start at 50MPH and decelerate to the specified minimum speed before accelerating back to 50MPH.
The second graph shows the acceleration of the train for each cycle. The deceleration rates (negative peaks) are the same magnitude (max deceleration rate is constant). Their duration gets shorter as the terminal speed increases. The acceleration peaks get
Page 23
shorter as the terminal speed increases. Their magnitude also gets smaller because acceleration is limited at higher speeds.
The third graph shows electrical power available from the traction drive. The regeneration power peaks are equal in magnitude because the initial velocity is the same. Their durations get shorter as the terminal velocity increases. This graph illustrates a situation where power capability becomes more significant than energy storage capacity.
The bottom graph shows the regeneration energy available on each cycle. The positive hump value (total energy available) gets lower on each subsequent cycle as the braking time is reduced. This illustrates the situation where less regenerative energy is available to be captured by an energy storage system.
4.1.3 Energy Storage System Simulations
The value of an energy storage device is gauged by the amount of energy that it returns to the traction drive system on the subsequent acceleration cycle. An energy storage system with a sufficient number of cells to receive the entire regenerative energy of the car will never return 100% of that energy to the traction system due to resistive losses in the cell. During charging, drops across the cell resistance will cause the energy captured in the cell to be less than the energy applied to the cell’s terminals. During discharge, drops across the cell resistance will cause the energy returned to the traction system to be less than the energy released from the cell.
Page 24

The following graphs illustrate the results of simulating four consecutive stops from 50MPH, followed by acceleration back to 50MPH and cruising, run with the Lithium Ion cells. For the four cycles shown, the numbers of cells simulated were 200, 300, 400, and 500.
Figure 4.1.3-1 – Model of Energy Storage with Lithium Ion Cells
Page 25

In each graph, the yellow line represents the power/energy delivered by the traction inverter. The purple line represents the electrical power/energy at the terminals of the energy storage system. The blue line represents the actual power/energy stored in the cells of the energy storage system. These graphs illustrate the behavior of a power limited energy storage system.
The top graph shows the power available from the traction inverter compared to the power used to charge the energy storage system. At 200 cells, the energy storage can only handle approximately half of the peak power. At 300 cells, approximately ¾ of the power can be absorbed. At 400 and 500 cells, the full peak regeneration power of the drive can be absorbed. The gap between the yellow line and the blue and purple lines on the negative side is indicative of the fact that more energy is required to propel the train than what can be absorbed by regeneration. Therefore, the yellow line will inevitably go lower as the vehicle consumes grid power to sustain forward motion. It should also be noted that there is a gap between the purple and blue lines. This is indicative of power that is being lost due to the resistance of the energy storage cells.
The second graph illustrates the net energy of each node in the system. The traction drive creates regenerative energy, which could theoretically be completely stored. However, the yellow line always goes negative as additional energy is required to sustain forward motion against drag forces. The blue line (cell energy) returns to zero at the end of each cycle, indicating that the energy captured during regeneration is all returned to the traction inverter in these examples. The purple line does not return to zero because there is a net loss of energy due to resistive drops. The value of the purple line at the end of each cycle is indicative of the power being dissipated in the energy storage system on each cycle and thus the heating of the cells.
The third graph shows the energy absorbed during charging. On the first two cycles (200 and 300 cells), the purple line is below the yellow line because the energy storage system is power limited and unable to absorb the full power. On the third and fourth cycles (400 and 500 cells), the purple line coincides with the yellow line because the system is no longer power limited. From cycle to cycle, the blue line (cell charging energy) rises along with the purple line as more energy is absorbed by the energy storage system. There is also a small rise from the third cycle to the fourth cycle as the total resistance is reduced and thus less energy is lost to heat. The increase is smaller though and it represents a diminishing return on the cost (monetary, volumetric, and weight) of the additional cells.
The bottom graph shows the energy returned to the traction inverter from the energy storage system. The purple line (terminal energy) represents the actual energy returned to the traction inverter. As with charging, there is a gap between the blue and purple lines, indicating the energy that is lost to heat because of voltage drops in the cell. The gap is smaller in the discharge graphs than in the charge graphs because the
Page 26
discharge is performed at lower current levels, which result in smaller voltage drops and less energy lost.
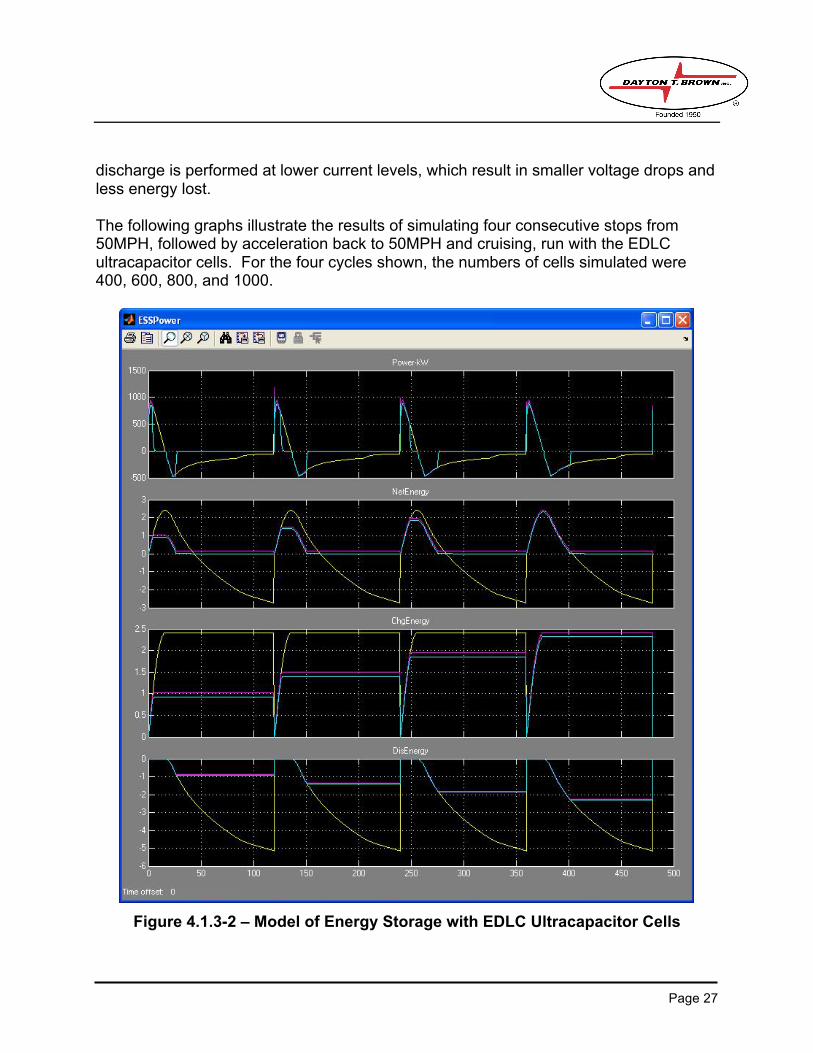
The following graphs illustrate the results of simulating four consecutive stops from 50MPH, followed by acceleration back to 50MPH and cruising, run with the EDLC ultracapacitor cells. For the four cycles shown, the numbers of cells simulated were 400, 600, 800, and 1000.
Figure 4.1.3-2 – Model of Energy Storage with EDLC Ultracapacitor Cells
Page 27
The descriptions of the graphs are very similar to those of the Lithium Ion cell simulations. However, they illustrate the behavior of an energy limited cell rather than a power limited cell. In the first three cycles, the peak power at the terminals (purple line) matches that of the traction inverter (yellow line). However, the charge cycle is cut short as the energy storage system becomes fully charged. On the fourth cycle, there is finally enough energy storage available to absorb the complete stop cycle. Note that this is close to the maximum energy storage requirement for one car because it illustrates a complete stop from maximum speed to zero speed.
The energy graphs are similar to those of the Lithium Ion cell, although the slope changes are more abrupt because the cell maintains higher power levels. It should be noted that the purple and blue lines are much closer together in every case. This is due to the fact that the cell has much lower resistance and thus much less energy is lost to heat. On a complete regeneration cycle from 50MPH to a stop, the traction drive inverter produces 2.40kWh (at 44,760kg mass). The 500 cell Lithium Ion pack returns 1.94kWh (2.09kWh for 1000 cells). Meanwhile, the 1000 cell ultracapacitor pack returns 2.28kWh. The difference may seem small, but the resultant heat generation is significantly different. The Lithium Ion cells generate 0.46 kWh (or 0.31 kWh) of heat while the ultracapacitors generate 0.12 kWh of heat (1/4 to 1/3 the amount). Also, as will be illustrated later, the ultracapacitor is charging extremely quickly, which results in the generation of more heat than is necessary. By limiting the peak charge current, the same energy can be captured while heat production can be substantially reduced, reducing heat at least an order of magnitude below that of the Lithium Ion cells.
A single car decelerating from 50MPH will produce 2.4kWH. A 10-car train will produce approximately 24kWh. This is consistent with estimates previously calculated by others. Conversely, the REIP demonstrated that the current R142 implementation, even when train synchronization is achieved, only produces 2 to 4 KWH. Even with modifications to propulsion system parameters only 6 to 10 kWh was produced. Indeed, the REIP report concluded that, with modification to the propulsion system rheostatic chopper and ripple detection parameters, maximum regenerative energy possible on a 10 car train, per stop, is 12 kWh. This represents approximately half of the total regenerative energy available from a braking train. Contributing factors include:
- Load limitation (acceleration vs deceleration profiles) - Train and propulsion inverter control configurations - Third Rail voltage limits (regen voltage limit) - Ripple detection (dead rail protection)
Page 28
4.1.4 Assessment of Simulation Data
As previously noted, the terminal discharge energy is a gauge of the energy savings that the energy storage system is producing. Therefore, it is used as the primary measure of energy storage technology performance. The difference between terminal charge energy and terminal discharge energy (minus any residual charge in the cell) represents the heat that is generated in the energy storage system due to resistive losses. This number is used as a measure of the heat produced in the cells. While the temperature rise and cooling requirements are not formally modeled, the heat production is a good indication of the level of investment that must be made in cooling equipment for the system.
4.2 Conditions Evaluated
As previously described, the model evaluates full discharges from various initial velocities down to 0MPH, followed by acceleration and cruising meant to nearly fully discharge the cell. An automatic test sequencer was created in order to step through various combinations of speeds, weights, and system configurations. The final energy numbers of each simulation were exported for further comparative analysis. The model evaluates stops from speeds between 5MPH and 50MPH in 5MPH increments. In addition, partial decelerations from 50MPH to lower speeds were evaluated. The model tested decelerations from 50MPH to speeds between 0MPH and 45MPH in 5MPH increments. These tests were evaluated at the empty, seated, and full weights of the car. Each test was repeated for groups of cells ranging from 50 cells to 2500 cells in 50 cell increments.
5. Results of Analysis
5.1 Single Cell Performance
As a precursor to the full system simulations, simulations were run for individual cells, charged at the highest rate the cell would accept. This type of test illustrates the amount of energy that a given cell can absorb for a given duration of charge event and the amount of time required to charge the device to its full capacity.
The following graph illustrates the peak charging capability of each of the energy storage devices studied.
Page 29

Energy Stored (W
H)
Energy Stored vs. Time (Peak Charge Rate)14.00
12.00
10.00
8.00 LiIon Energy (WH)
6.00 NiCap Energy (WH)
4.00 Ultracap Energy (WH)
2.00
0.00 0.0 20.0 40.0 60.0 80.0 100.0 120.0
Charge Time (Sec)
Figure 5.1-1 – Peak Charging Capability of Energy Storage Devices
Clearly, the Lithium Ion cell has significantly more energy storage capacity than the NiCap and ultracap. The NiCap stores 1.77WH, the ultracap stores 2.32WH, and the Lithium Ion cell stores 12.31WH. The graph does, however illustrate the significantly higher power capability of the ultracapacitor. The ultracapacitor fully charges in approximately 2 seconds while the Lithium Ion cell is still charging at 120 seconds. The stop from 50MPH at full service brake requires only 17 seconds. Within that time, the Lithium Ion cell is slightly less than half charged. The NiCap has relatively high impedance relative to its cell voltage and thus charges more slowly than either of the other technologies.
Page 30
Heat Generated vs. Time (Peak Charge Rate)1.40
1.20
1.00
0.80 LiIon Loss (WH)
0.60 NiCap Loss (WH)
0.40 Ultracap Loss (WH)
0.20
0.00 0.0 20.0 40.0 60.0 80.0 100.0 120.0
Charge Time (Sec)
Heat Gen
erated
(WH)
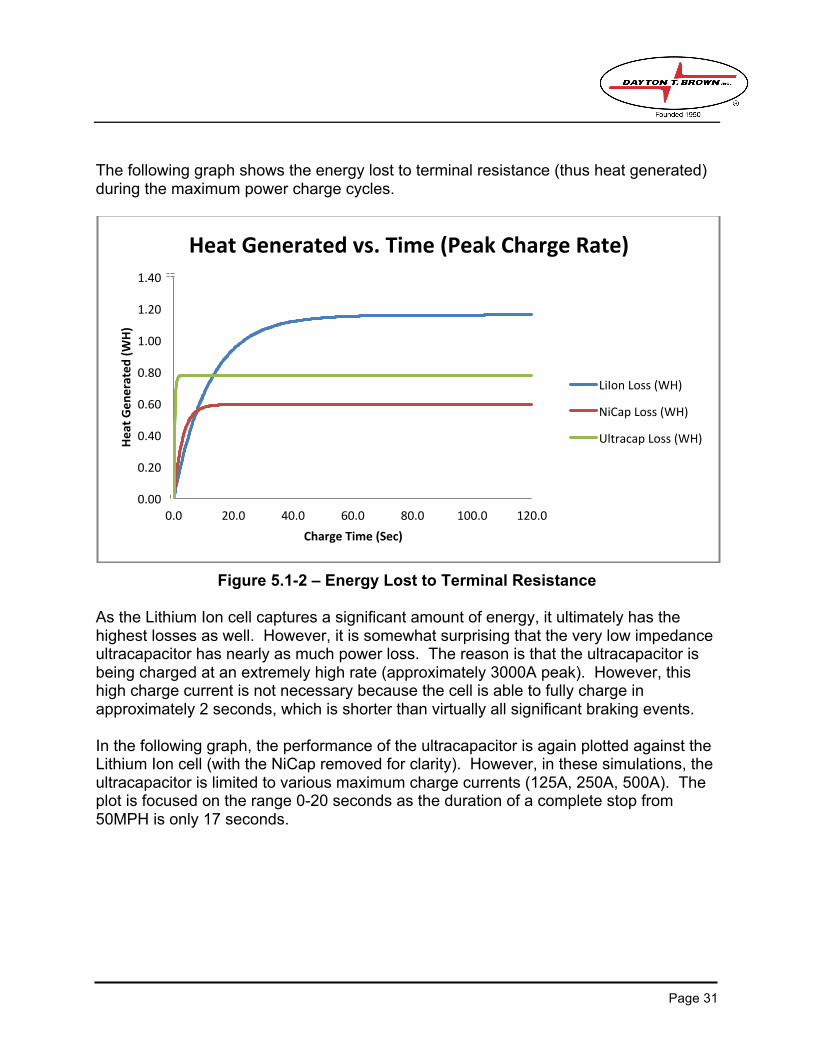
The following graph shows the energy lost to terminal resistance (thus heat generated) during the maximum power charge cycles.
Figure 5.1-2 – Energy Lost to Terminal Resistance
As the Lithium Ion cell captures a significant amount of energy, it ultimately has the highest losses as well. However, it is somewhat surprising that the very low impedance ultracapacitor has nearly as much power loss. The reason is that the ultracapacitor is being charged at an extremely high rate (approximately 3000A peak). However, this high charge current is not necessary because the cell is able to fully charge in approximately 2 seconds, which is shorter than virtually all significant braking events.
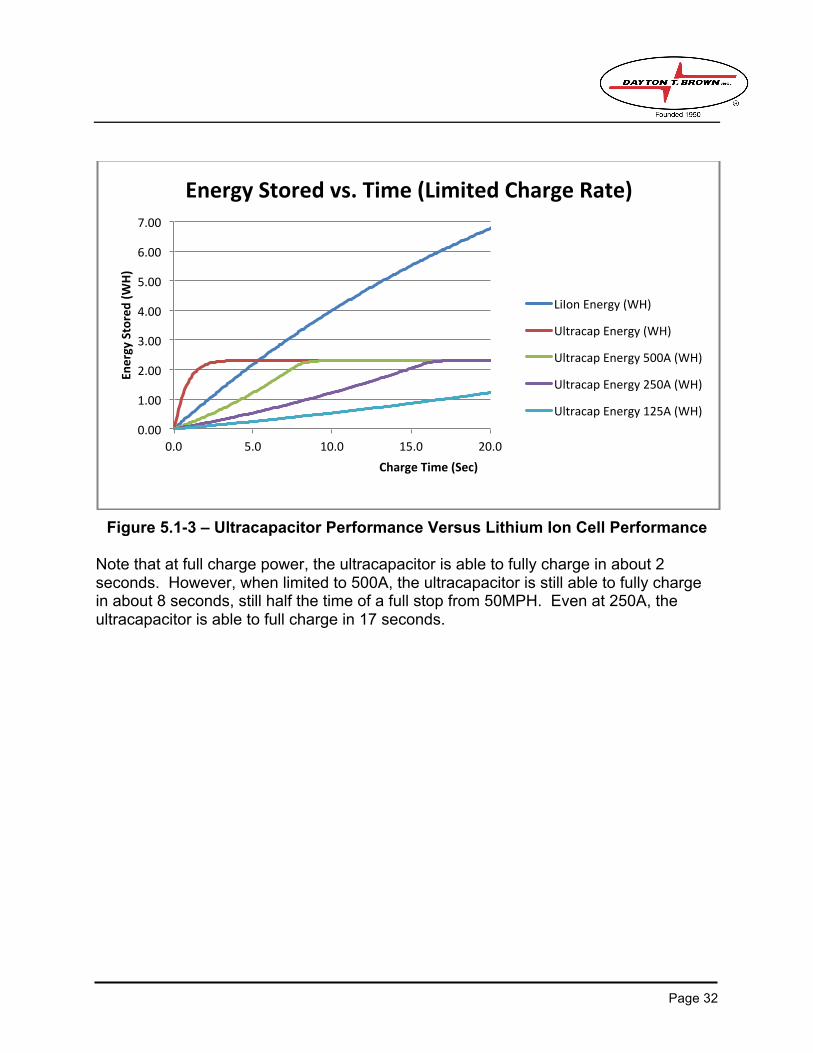
In the following graph, the performance of the ultracapacitor is again plotted against the Lithium Ion cell (with the NiCap removed for clarity). However, in these simulations, the ultracapacitor is limited to various maximum charge currents (125A, 250A, 500A). The plot is focused on the range 0-20 seconds as the duration of a complete stop from 50MPH is only 17 seconds.
Page 31
Energy Stored vs. Time (Limited Charge Rate)7.00
6.00
5.00
LiIon Energy (WH)4.00 Ultracap Energy (WH)
3.00 Ultracap Energy 500A (WH)
2.00 Ultracap Energy 250A (WH)
1.00 Ultracap Energy 125A (WH)
0.00 0.0 5.0 10.0 15.0 20.0
Charge Time (Sec)
Energy Stored (W
H)
Figure 5.1-3 – Ultracapacitor Performance Versus Lithium Ion Cell Performance
Note that at full charge power, the ultracapacitor is able to fully charge in about 2 seconds. However, when limited to 500A, the ultracapacitor is still able to fully charge in about 8 seconds, still half the time of a full stop from 50MPH. Even at 250A, the ultracapacitor is able to full charge in 17 seconds.
Page 32

The following graph illustrates power lost for the limited charge rate simulations.
Heat Gen
erated
(WH)
Heat Generated vs. Time (Limited Charge Rate)
1.00 0.90 0.80 0.70
LiIon Loss (WH)0.60 0.50 Ultracap Loss (WH)0.40
Ultracap Loss 500A (WH)0.30 0.20 Ultracap Loss 250A (WH)0.10
Ultracap Loss 125A (WH)0.00 0.0 5.0 10.0 15.0 20.0
Charge Time (Sec)
Figure 5.1-4 – Power Lost for Limited Charge Rate Simulations
This graph demonstrates the tremendous benefit of limiting charge current. By limiting charge current to 500A, the heat loss in the ultracapacitor cell drops from 0.77WH to 0.12WH (only 16% of the heating) while still maintaining the ability to charge fully in 8 seconds. Meanwhile, after a 17 second stop event, the Lithium Ion cell has dissipated 0.88WH of heat. The results of the single cell, maximum power tests immediately demonstrate a fundamental principle that underlies the results of the system simulations. The Lithium Ion cell is power limited in the subway application. It is not able to fully charge within the time available for a deceleration event. Therefore, the Lithium Ion cell must be operated at maximum power in order to utilize its superior energy storage and to use the fewest cells possible. Meanwhile, the ultracapacitor is energy limited in the subway application. It is capable of charging in 2 seconds, while a full stop event has duration of 17 seconds. An ultracapacitor based energy storage system that can capture all of the energy of a maximum stop will be operating far below its maximum permissible power level. The end result is that a Lithium Ion based energy storage system will be able to capture the maximum amount of energy with the fewest number of cells and smallest mass and volume, but it will be operated at extreme power levels and will require very aggressive cooling. An ultracapacitor based energy storage
Page 33

system will require significantly more cells and much larger mass and volume, but it will be operated at very benign power levels and will require much less cooling.
5.2 System Performance
The subway model was simulated in conjunction with each of the three candidate energy storage devices. For each device, simulations were performed at 3 car weight levels and 50 different cell counts (50 to 2500 in 50 cell increments). In addition, simulations were performed of full stops from speeds ranging from 5MPH to 50MPH (in 5MPH increments) and partial stops from 50MPH to speeds from 0MPH to 45MPH (in 5MPH increments). Each simulation included the deceleration event followed by an acceleration and cruise cycle that used close to all of the energy captured during braking. For each parameter combination, the final values of cell and terminal energy captured and released were stored. Subsequently, these values were plotted in Excel for comparison.
For each cell, the following performance characteristics evaluated. Total Energy Returned (total discharge energy at the cell terminals) is used as a measure of the amount of grid energy saved per cycle and the total benefit of a proposed ESS system. Similarly, Energy Returned Per Cell takes the above number and divides it by the number of cells. This graph is indicative of the benefit derived from adding more cells and the point of diminishing returns for additional cells. Total Energy Loss is the difference between charge energy at the battery terminals and discharge energy at the battery terminals. (Note that any net change in the cell energy is also subtracted out). The Total Energy Loss is indicative of the heat produced in the energy storage system while capturing and returning braking energy. It also indicates how much less energy the energy storage system returns as compared to the amount generated by the traction inverter. Energy Loss Per Cell is also plotted as an indication of the heating that will be associated with each cell and thus the relative aggressiveness of the cooling system requirements.
5.2.1 Individual Energy Storage Device Performance
The following sections present the performance graphs for each of the candidate energy storage technologies. Each technology is discussed in isolation in order to describe its characteristics. Subsequently, the performances of the three energy storage technologies will be directly compared. All data is from simulations run at 44760kg, the full seated weight of the car.
Page 34
5.2.1.1 Lithium Ion Cell
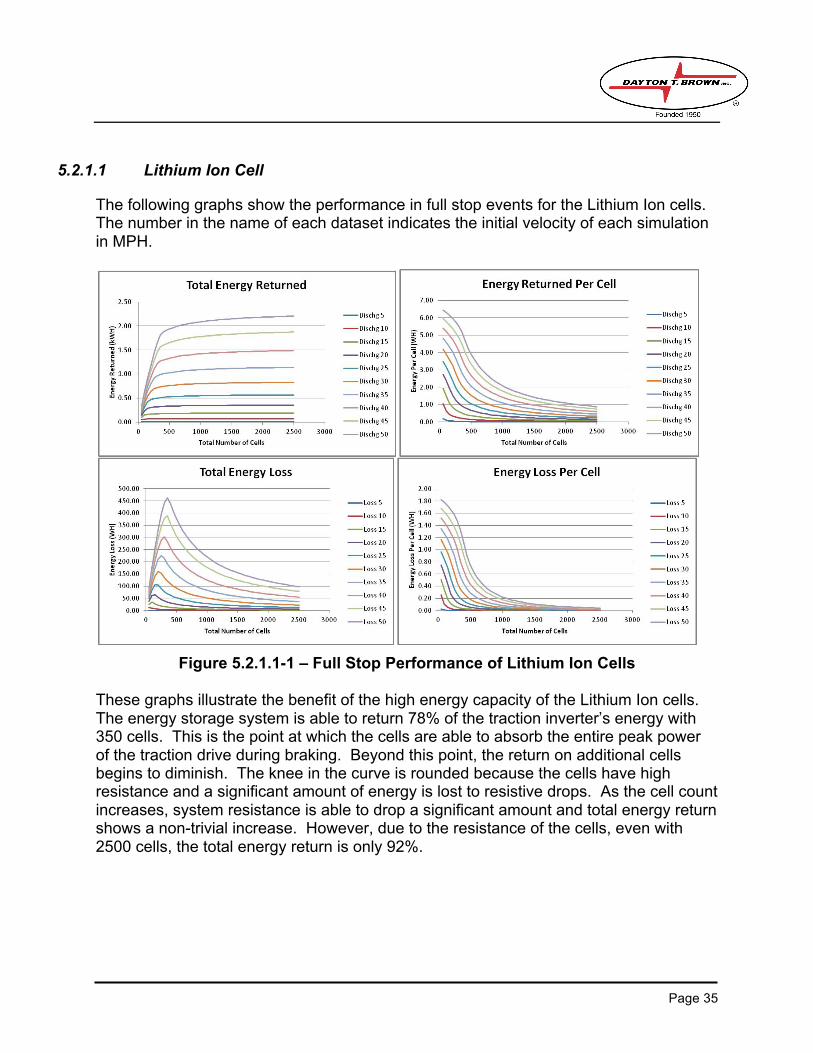
The following graphs show the performance in full stop events for the Lithium Ion cells. The number in the name of each dataset indicates the initial velocity of each simulation in MPH.
Figure 5.2.1.1-1 – Full Stop Performance of Lithium Ion Cells
These graphs illustrate the benefit of the high energy capacity of the Lithium Ion cells. The energy storage system is able to return 78% of the traction inverter’s energy with 350 cells. This is the point at which the cells are able to absorb the entire peak power of the traction drive during braking. Beyond this point, the return on additional cells begins to diminish. The knee in the curve is rounded because the cells have high resistance and a significant amount of energy is lost to resistive drops. As the cell count increases, system resistance is able to drop a significant amount and total energy return shows a non-trivial increase. However, due to the resistance of the cells, even with 2500 cells, the total energy return is only 92%.
Page 35
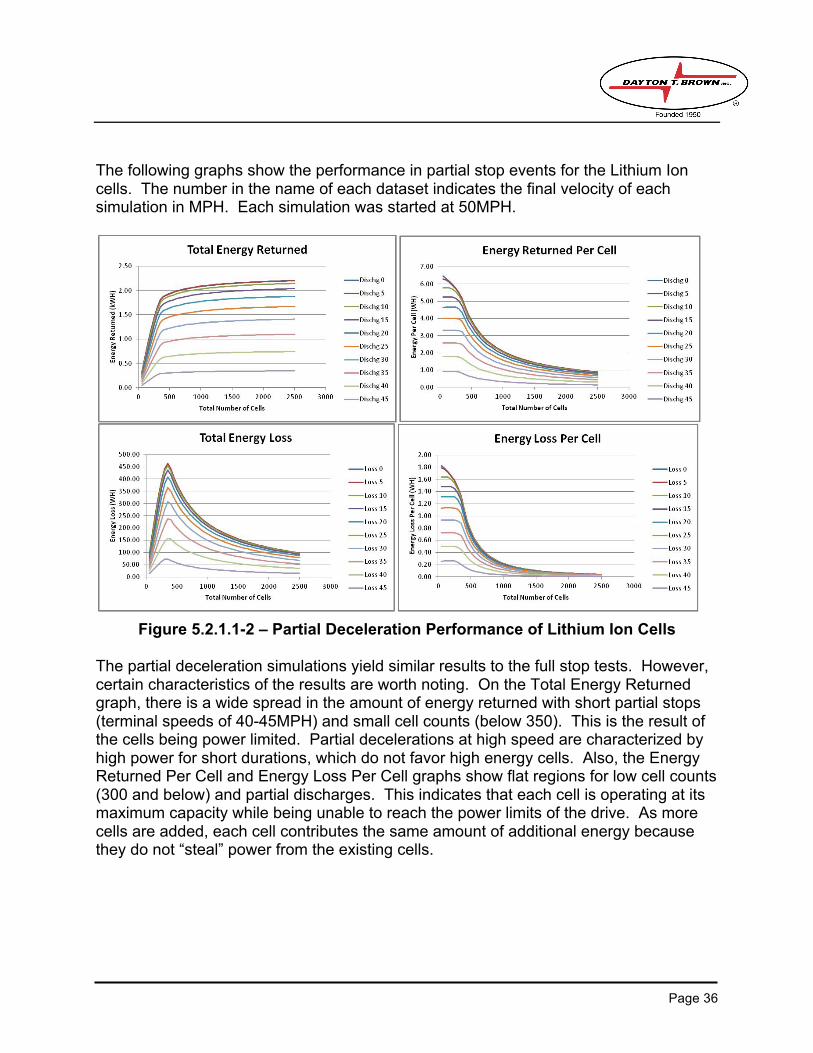
The following graphs show the performance in partial stop events for the Lithium Ion cells. The number in the name of each dataset indicates the final velocity of each simulation in MPH. Each simulation was started at 50MPH.
Figure 5.2.1.1-2 – Partial Deceleration Performance of Lithium Ion Cells
The partial deceleration simulations yield similar results to the full stop tests. However, certain characteristics of the results are worth noting. On the Total Energy Returned graph, there is a wide spread in the amount of energy returned with short partial stops (terminal speeds of 40-45MPH) and small cell counts (below 350). This is the result of the cells being power limited. Partial decelerations at high speed are characterized by high power for short durations, which do not favor high energy cells. Also, the Energy Returned Per Cell and Energy Loss Per Cell graphs show flat regions for low cell counts (300 and below) and partial discharges. This indicates that each cell is operating at its maximum capacity while being unable to reach the power limits of the drive. As more cells are added, each cell contributes the same amount of additional energy because they do not “steal” power from the existing cells.
Page 36
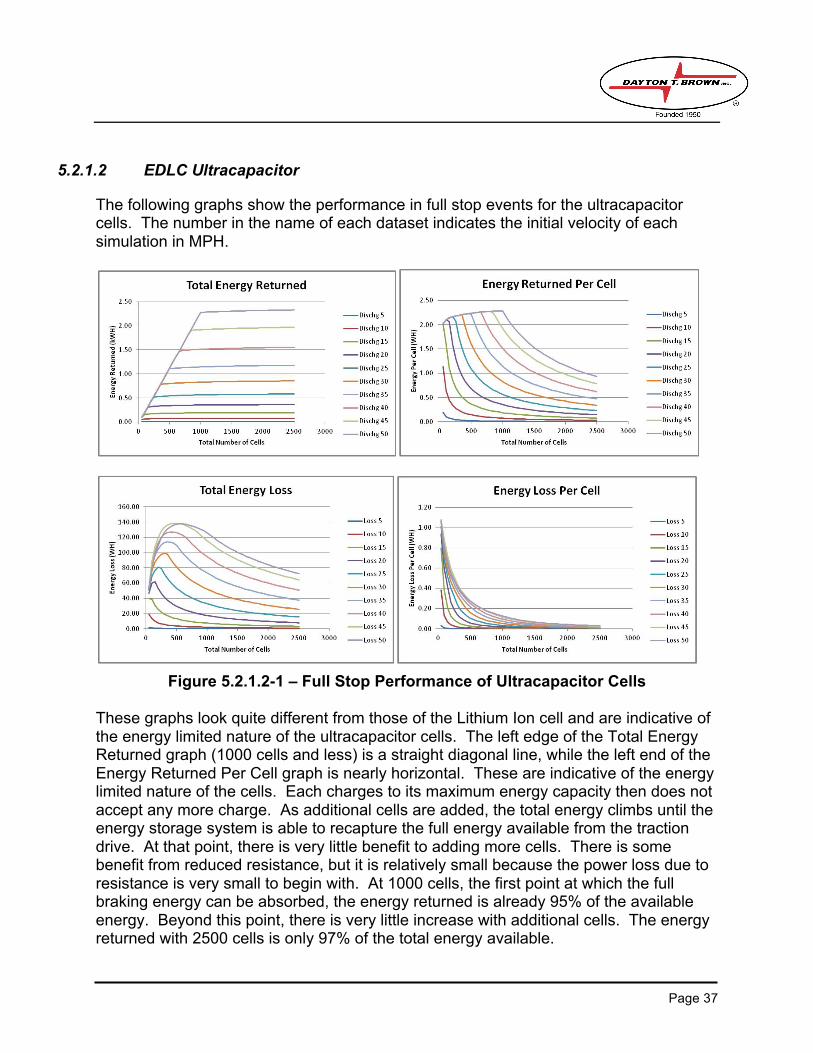
5.2.1.2 EDLC Ultracapacitor
The following graphs show the performance in full stop events for the ultracapacitor cells. The number in the name of each dataset indicates the initial velocity of each simulation in MPH.
Figure 5.2.1.2-1 – Full Stop Performance of Ultracapacitor Cells
These graphs look quite different from those of the Lithium Ion cell and are indicative of the energy limited nature of the ultracapacitor cells. The left edge of the Total Energy Returned graph (1000 cells and less) is a straight diagonal line, while the left end of the Energy Returned Per Cell graph is nearly horizontal. These are indicative of the energy limited nature of the cells. Each charges to its maximum energy capacity then does not accept any more charge. As additional cells are added, the total energy climbs until the energy storage system is able to recapture the full energy available from the traction drive. At that point, there is very little benefit to adding more cells. There is some benefit from reduced resistance, but it is relatively small because the power loss due to resistance is very small to begin with. At 1000 cells, the first point at which the full braking energy can be absorbed, the energy returned is already 95% of the available energy. Beyond this point, there is very little increase with additional cells. The energy returned with 2500 cells is only 97% of the total energy available.
Page 37
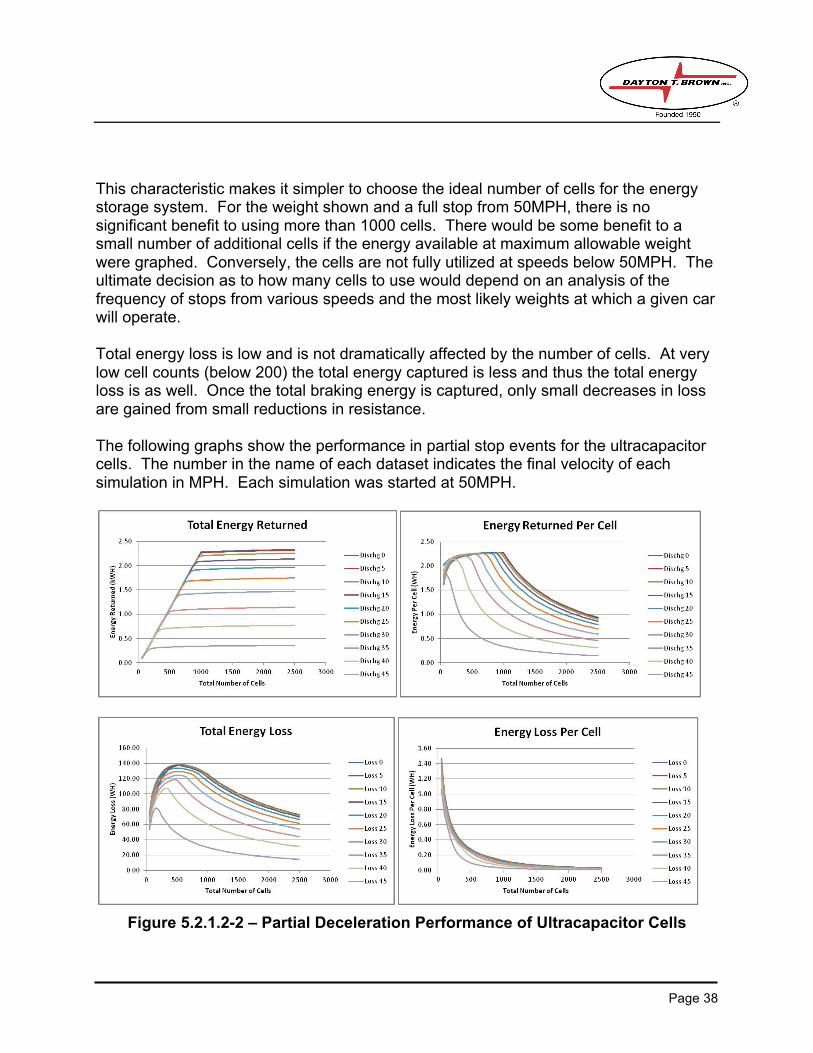
This characteristic makes it simpler to choose the ideal number of cells for the energy storage system. For the weight shown and a full stop from 50MPH, there is no significant benefit to using more than 1000 cells. There would be some benefit to a small number of additional cells if the energy available at maximum allowable weight were graphed. Conversely, the cells are not fully utilized at speeds below 50MPH. The ultimate decision as to how many cells to use would depend on an analysis of the frequency of stops from various speeds and the most likely weights at which a given car will operate.
Total energy loss is low and is not dramatically affected by the number of cells. At very low cell counts (below 200) the total energy captured is less and thus the total energy loss is as well. Once the total braking energy is captured, only small decreases in loss are gained from small reductions in resistance.
The following graphs show the performance in partial stop events for the ultracapacitor cells. The number in the name of each dataset indicates the final velocity of each simulation in MPH. Each simulation was started at 50MPH.
Figure 5.2.1.2-2 – Partial Deceleration Performance of Ultracapacitor Cells
Page 38
The partial deceleration graphs for the ultracapacitors show similar traits to the full stop graphs. The cells are energy limited and therefore increasing the number of cells will proportionally increase the amount of energy recaptured until the full braking energy is able to be absorbed. At that point, little benefit is gained from additional cells.
For very small numbers of cells, the ultracapacitor is able to capitalize on partial decelerations from high speeds (e.g. 200 cells and deceleration to 40MPH) because the ultracapacitors are able to absorb the full power of regeneration from 50MPH and fully utilize their energy storage capability. For significantly undersized energy storage systems, the high power capability of the ultracapacitor is able to provide the maximum benefit under the greatest number of conditions.
5.2.1.3 Nickel Capacitor
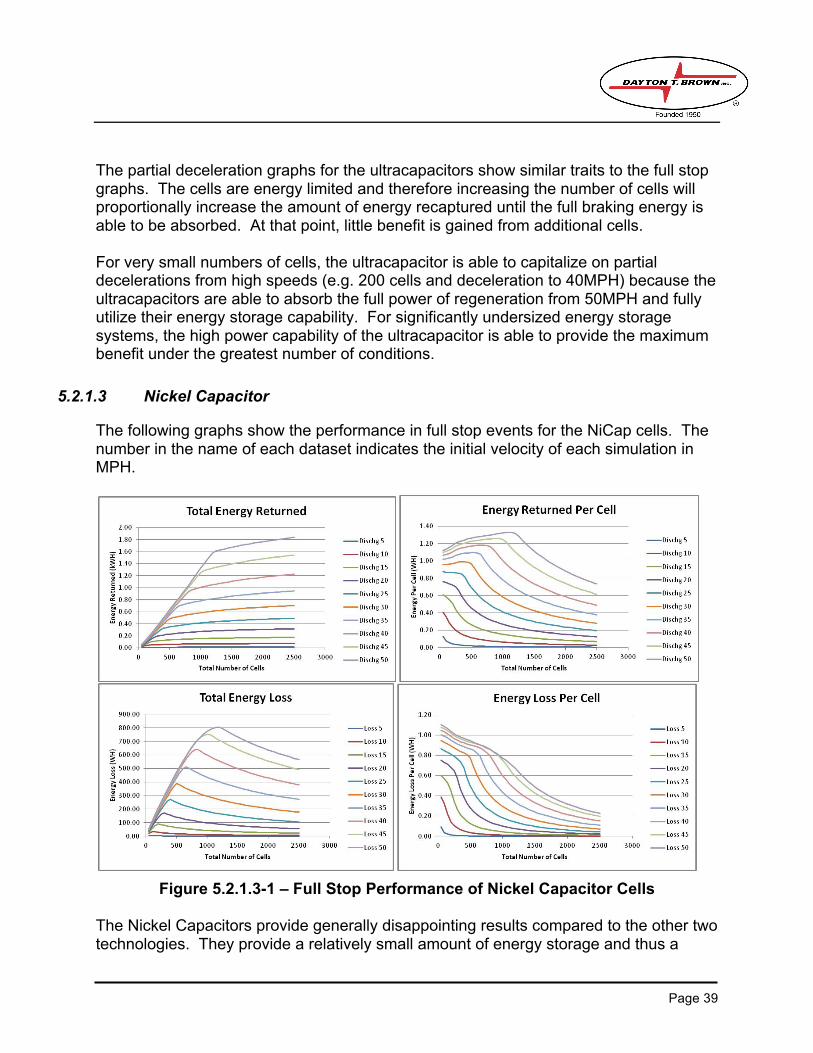
The following graphs show the performance in full stop events for the NiCap cells. The number in the name of each dataset indicates the initial velocity of each simulation in MPH.
Figure 5.2.1.3-1 – Full Stop Performance of Nickel Capacitor Cells
The Nickel Capacitors provide generally disappointing results compared to the other two technologies. They provide a relatively small amount of energy storage and thus a
Page 39
large number of cells (1000+) are required in order to absorb the entire braking energy of the traction drive. However, cell impedance is also quite high. As a result, a great deal of energy is lost during the charge discharge cycle and a very large number of cells are required to provide worthwhile performance. With 2500 cells in a stop from 50MPH, only 77% of the available energy is returned.
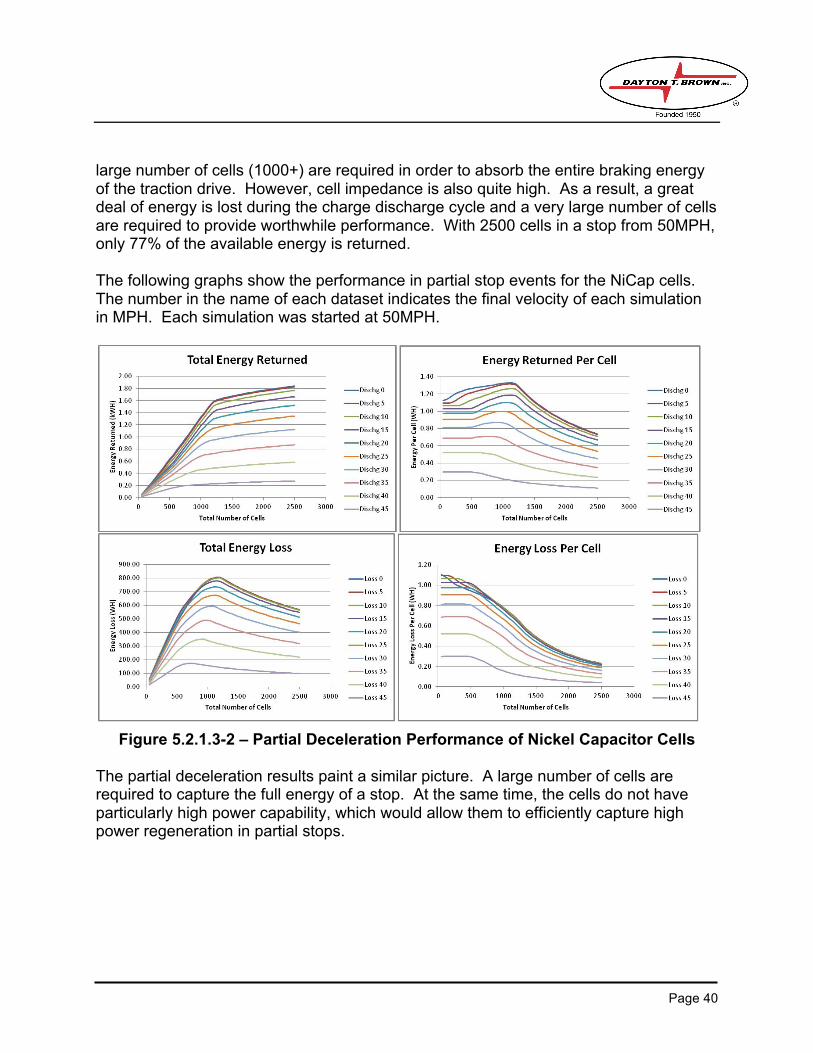
The following graphs show the performance in partial stop events for the NiCap cells. The number in the name of each dataset indicates the final velocity of each simulation in MPH. Each simulation was started at 50MPH.
Figure 5.2.1.3-2 – Partial Deceleration Performance of Nickel Capacitor Cells
The partial deceleration results paint a similar picture. A large number of cells are required to capture the full energy of a stop. At the same time, the cells do not have particularly high power capability, which would allow them to efficiently capture high power regeneration in partial stops.
Page 40
5.2.2 Comparative Performance Assessment
5.2.2.1 Full Stop Comparisons
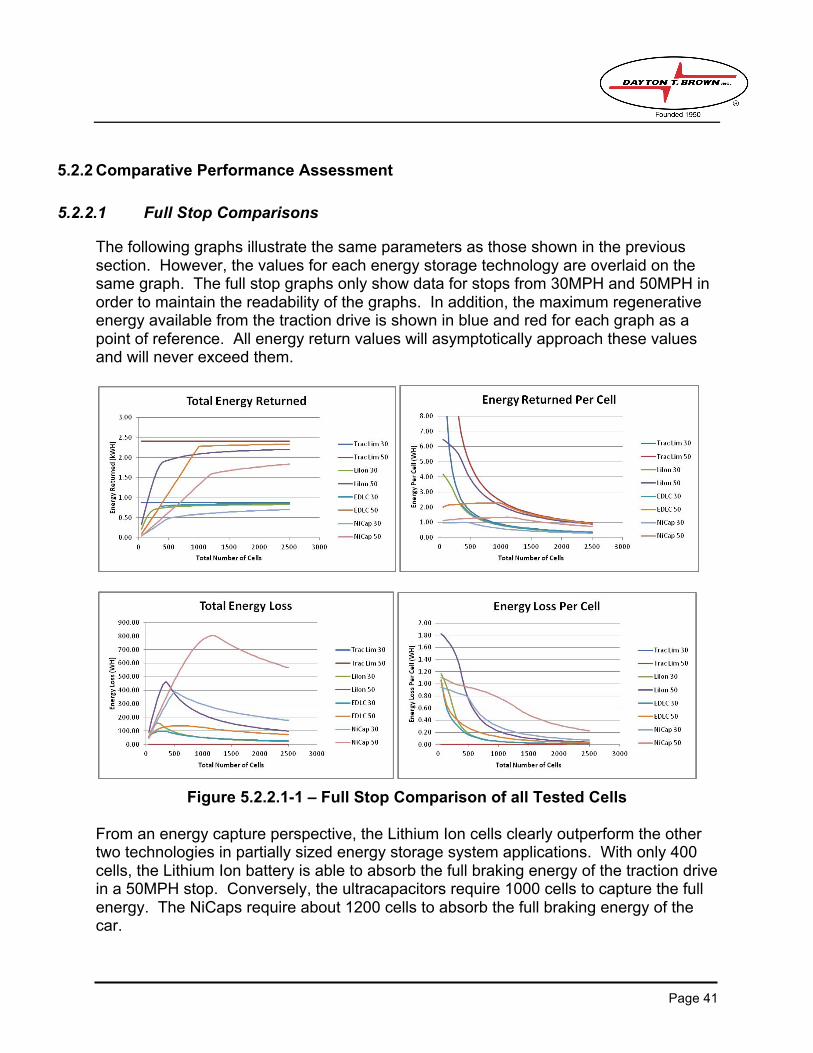
The following graphs illustrate the same parameters as those shown in the previous section. However, the values for each energy storage technology are overlaid on the same graph. The full stop graphs only show data for stops from 30MPH and 50MPH in order to maintain the readability of the graphs. In addition, the maximum regenerative energy available from the traction drive is shown in blue and red for each graph as a point of reference. All energy return values will asymptotically approach these values and will never exceed them.
Figure 5.2.2.1-1 – Full Stop Comparison of all Tested Cells
From an energy capture perspective, the Lithium Ion cells clearly outperform the other two technologies in partially sized energy storage system applications. With only 400 cells, the Lithium Ion battery is able to absorb the full braking energy of the traction drive in a 50MPH stop. Conversely, the ultracapacitors require 1000 cells to capture the full energy. The NiCaps require about 1200 cells to absorb the full braking energy of the car.
Page 41
If a “full sized” energy storage system is to be utilized (one that can capture the full braking energy), the ultracapacitors provide significant benefit over the Lithium Ion cells. With 1000 cells, the ultracapacitors are able to return 2.28kWH while the Lithium Ion cells can only return 2.08kWH. This is due to the lower resistance of the ultracapacitors. In a 50MPH stop, the ultracapacitors return more energy than the Lithium Ion cells starting at 900 cells. In a stop from 30MPH, the ultracapacitors provide greater value than the Lithium Ion cells at only 350 cells.
While the Lithium Ion cells return significantly more energy from undersized packs, the thermal situation favors the ultracapacitors. As previously noted, the Lithium Ion cells are constantly being operated at their maximum power capability. This leads to significant heating in the cells. The ultracapacitors heat less at maximum power because they quickly reach their energy limits. When enough cells are present to provide sufficient energy storage, the power is shared broadly enough that the power is well below the maximum limit of the cells. The Total Energy Loss graph shows peak losses of 450WH for Lithium Ion cells, but only 140WH for ultracapacitors. Also, the Energy Loss Per Cell graph shows that in arrays up to 1000 cells, the Lithium Ion cells have significant energy loss, while the ultracapacitors drop to very low levels of loss with as few as 250 cells. As will be demonstrated with the partial deceleration graphs, the ultracapacitors may be operated in a current-limited mode. In this case, total energy recapture is only affected in certain conditions but total energy loss is dramatically reduced in all cases (until the sheer quantity of cells pushes the “unlimited” power below the limit value automatically).
The energy loss per cell is a direct indication of the heating that cell will experience. These results clearly indicate that the Lithium Ion cells will have much more severe heating to contend with when compared to ultracapacitor cells.
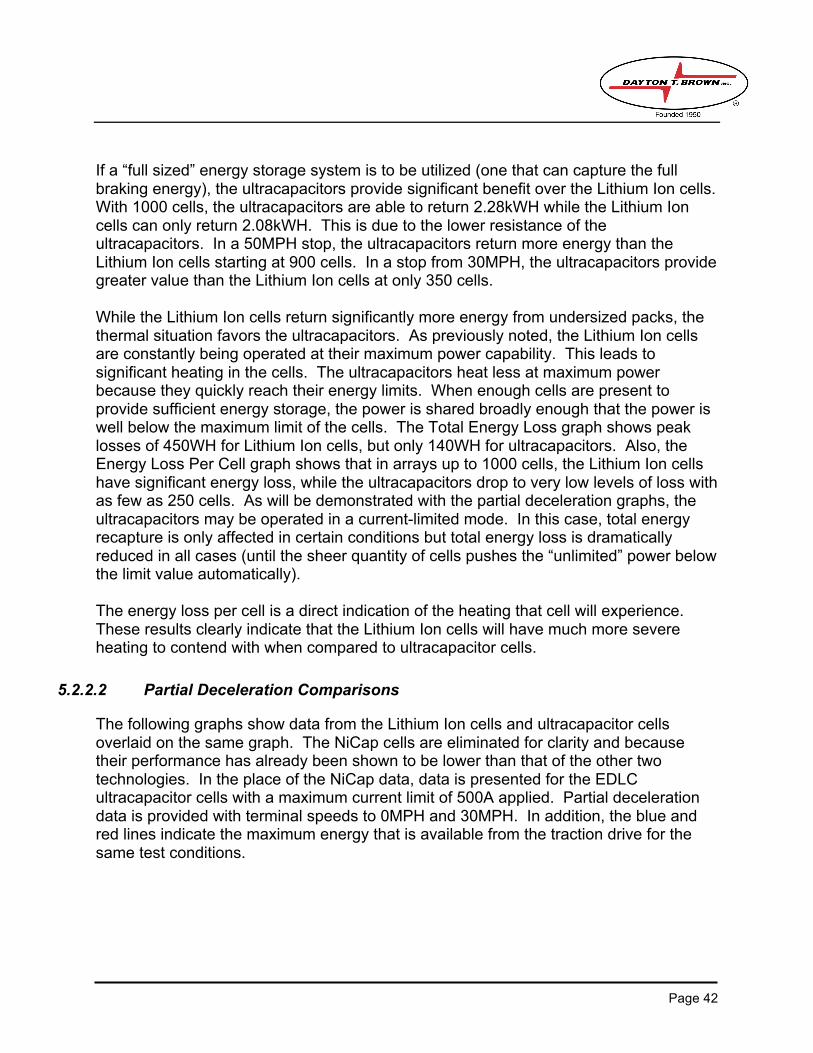
5.2.2.2 Partial Deceleration Comparisons
The following graphs show data from the Lithium Ion cells and ultracapacitor cells overlaid on the same graph. The NiCap cells are eliminated for clarity and because their performance has already been shown to be lower than that of the other two technologies. In the place of the NiCap data, data is presented for the EDLC ultracapacitor cells with a maximum current limit of 500A applied. Partial deceleration data is provided with terminal speeds to 0MPH and 30MPH. In addition, the blue and red lines indicate the maximum energy that is available from the traction drive for the same test conditions.
Page 42
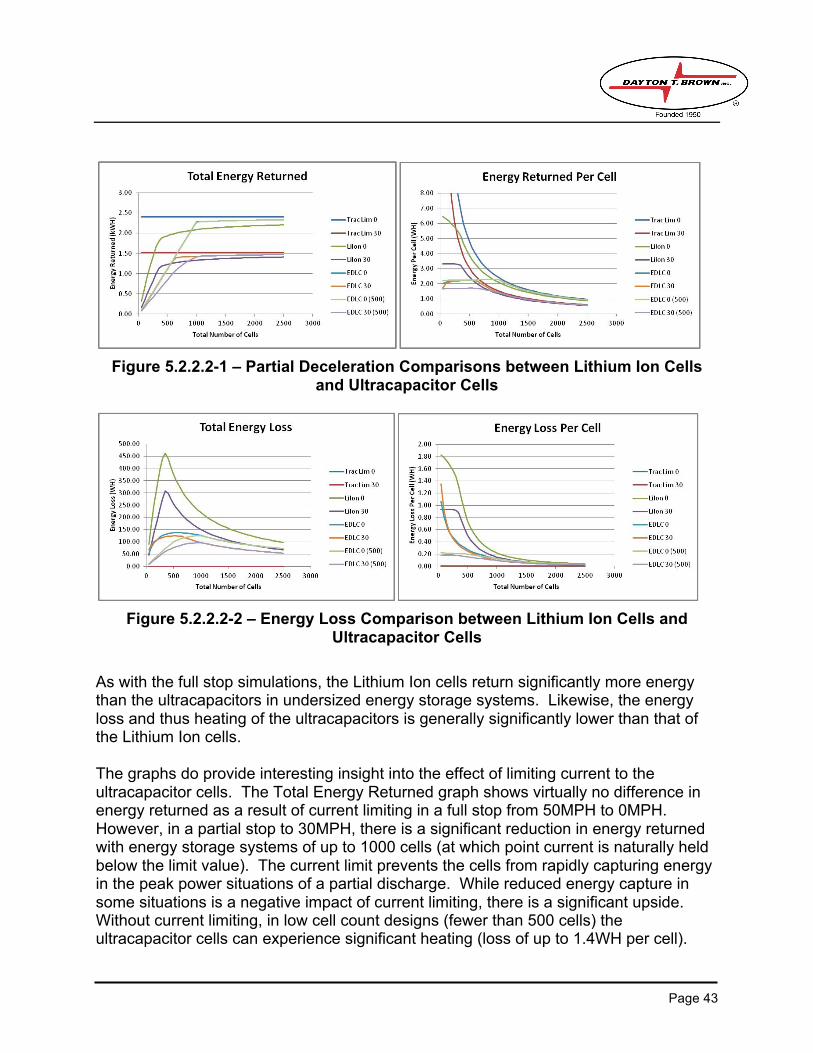
Figure 5.2.2.2-1 – Partial Deceleration Comparisons between Lithium Ion Cells and Ultracapacitor Cells
Figure 5.2.2.2-2 – Energy Loss Comparison between Lithium Ion Cells and Ultracapacitor Cells
As with the full stop simulations, the Lithium Ion cells return significantly more energy than the ultracapacitors in undersized energy storage systems. Likewise, the energy loss and thus heating of the ultracapacitors is generally significantly lower than that of the Lithium Ion cells.
The graphs do provide interesting insight into the effect of limiting current to the ultracapacitor cells. The Total Energy Returned graph shows virtually no difference in energy returned as a result of current limiting in a full stop from 50MPH to 0MPH. However, in a partial stop to 30MPH, there is a significant reduction in energy returned with energy storage systems of up to 1000 cells (at which point current is naturally held below the limit value). The current limit prevents the cells from rapidly capturing energy in the peak power situations of a partial discharge. While reduced energy capture in some situations is a negative impact of current limiting, there is a significant upside. Without current limiting, in low cell count designs (fewer than 500 cells) the ultracapacitor cells can experience significant heating (loss of up to 1.4WH per cell).
Page 43

However, with current limitation, heating never exceeds 0.2WH per cell. This is a stark contrast to the Lithium Ion cells, which could experience over 1.8WH of heat generation during a 50MPH to 0MPH stop.
6. System Considerations
Simulations provide insight into the energy savings that may be derived from a given energy storage technology under specific operating conditions. These simulations are important because no amount of engineering can compensate for an energy storage technology that is fundamentally incapable of absorbing the available energy at the available power levels. However, other, potentially far more serious, factors affect the practicality of implementing an energy storage system with a given technology.
6.1 Thermal Design
As has been mentioned throughout the document, heat generation in the cells is a major concern. The short charge/discharge cycles of subway operation cause the cells to be operated at or near their maximum power limits, which generates significant heat. As an example, during testing a complete discharge of a Lithium Ion cell at 300A caused a cell temperature rise of 17C in free air. Most charge discharge cycles during subway operation will not be complete cycles for the Lithium Ion cells. However, charge discharge cycles occur in rapid succession and without proper cooling, even a rise of 2-3C per cycle can quickly accumulate to a very large temperature rise.
Problems are compounded by the prospect of attempting to integrate an energy storage system with a subway car. The dirty environment is not suitable for direct air cooling of cells. The first line of defense against thermal problems is to prevent heat generation in the first place. In this regard, ultracapacitors have a significant advantage over Lithium Ion cells because they have significantly lower impedance and generate much less heat. While direct air cooling of the cells is not advisable, with low enough dissipation, a passive cooling approach may be sufficient. Ultracapacitors may be packaged in a metal enclosure with a cooling medium designed to conduct heat to the housing. From there, air cooling may be used to cool the outside of the enclosure.
The Lithium Ion cells studied in this report will produce significantly more heat for a given energy return level and this will require an aggressive cooling system in order to be used in a practical system. Each cell must have a low impedance thermal path to ambient cooling air. One approach that has been used successfully with power electronics devices is oil cooling. The electronics are mounted in a sealed enclosure, which is filled with non-electrically-conductive oil. The oil is then circulated through the enclosure and externally to a radiator. The oil is able to rapidly remove heat from the
Page 44

components and is able to reach all of the devices within a box without the significant disparity in cooling that can arise with forced air cooling. A proper system would still require proper fluid flow design to ensure equal flow to all cells and to prevent dead spots where oil does not flow.
Cooling is not the only concern for Lithium Ion cells. It is not permissible to charge Lithium Ion cells below 0C as this will cause permanent damage to the cells. Because the ambient environment for the system and thus the cells cannot be guaranteed, some means of pre-heating the cells must be provided. Fortunately, a train with a non-functioning energy storage system (due to cold temperature) has a significant amount of waste heat available from regeneration. Thus, a system must be designed to use waste heat from the train to heat the cells until they are up to operating temperature. The previously mentioned oil cooling system would provide a convenient means of heating the cells by passing the oil through a heat exchanger to braking resistors for the regeneration system.
6.2 Battery Electrical Management
When large numbers of energy storage cells are used in a series string, some form of electrical management is mandatory. Series strings of cells operate under the assumption that all cells in the string remain at equal states of charge because all cells are subjected to identical currents. However, cells are never ideal and variations in leakage current, charge acceptance, and capacity can lead to state of charge mismatch among cells in a series string. If one cell becomes excessively discharged, it may have a negative voltage applied to it, which will damage the cell. If one cell becomes excessively charged, it will exceed allowable voltage limits and will fail catastrophically.
The dangers of operating Lithium Ion batteries in a series string without electronic monitoring are well documented. At present, no reputable manufacturer supplies a Lithium Ion battery design that does not include some form of electronic protection that operates on a cell by cell basis. The battery management system must monitor individual cell voltages to guarantee that no one cell is allowed to go outside of the allowable voltage range. In addition, individual temperature must be monitored to ensure that no cell exceeds allowable temperature range. Most practical battery monitoring systems include some form of equalization to balance the states of charge of individual cells in a string. In the absence of equalization, a battery pack may become unusable as individual cells drift to very high or low states of charge, thus limiting the charge and discharge capacity of the entire pack. Most practical management systems for large Lithium Ion packs are digitally controlled, with a central controller that has the ability to monitor the voltage and temperature of each individual cell. Such systems are costly to implement for large packs and are susceptible to interference from electrical noise.
Page 45

Ultracapacitors have similar needs to be balanced and monitored in series strings. Like Lithium Ion cells, they can fail as the result of overcharge or overdischarge. However, ultracapacitors and not been shown to incinerate when overcharged the way Lithium Ion cells are known to. The industry has not settled on a standardized method of monitoring ultracapacitors in a series string, but several practical approaches have been implemented. The implementation depends on the manner in which the ultracapacitor pack is utilized. Several manufacturers have successfully implemented ultracapacitor management systems using independent per cell analog voltage monitor systems. These systems are inexpensive and reliable. They are not tied to a common data bus and thus are not susceptible to interference from electrical noise. Because ultracapacitors have a relatively small amount of energy storage and because their state of charge is intimately tied to their voltage, voltage-based balancing and monitoring systems are practical for ultracapacitor use.
While the Lithium Ion cell reviewed in this study is a true Lithium Ion chemical cell, it is designed for extremely high power density and relatively low energy density (compared to other types of Lithium Ion cell). In that regard, its behavior is very much like that of a capacitor. The cell experiences a very linear voltage change with state of charge and terminal voltages recover to the cell’s open circuit voltage in a very short period of time. These characteristics suggest that it may be possible to monitor and protect these cells in a similar manner to ultracapacitors. However, Lithium Ion cells do not have significant voltage headroom like an ultracapacitor. An ultracapacitor can operate at low voltages without compromising its ability to absorb current. A battery, however, will experience a significant reduction in charge current capability if it is held to a voltage significantly lower than its maximum rating.
6.3 Cycle Life
Section 3.2 includes a specification table for the cells studied in this report. It includes cycle life ratings for the cells. As noted in that section, cycle life ratings were not available for the Lithium Ion cells. Typical Lithium Ion cells have cycle life ratings in the thousands. Those ratings extend to the tens of thousands for partial cycles and potentially to the hundreds of thousands for very small micro-cycles. In order to ultimately gauge the necessary size of an energy storage system using the Lithium Ion cells review in this study, cycle life data must be available for the cells. Based on average vehicle operational data one can gauge the necessary cycle life. Then, one must determine the maximum allowable depth of discharge for the necessary cycle life. The energy storage system may have to be over-sized in order to keep the depth of discharge for each cell within that limit.
Ultracapacitors of the type studied in this report typically have cycle life ratings on the order to 1,000,000 cycles. Because the cells have low energy density, they are likely to experience close to full discharge and charge on every cycle. Therefore, the rated cycle
Page 46

life must be sufficient for the life of the train. Fortunately, these cycle life ratings are generally based on extreme circumstances, including charging to the maximum rated voltage and operation at the maximum temperature. If the system is designed to operate with some voltage margin and maintain the cells at lower temperatures, the cycle life can be increased significantly.
6.4 Propulsion Integration
As noted earlier, a single car decelerating from 50MPH will produce 2.4kWH. A 10-car train will produce approximately 24kWh. This is consistent with estimates previously calculated by others. Conversely, the REIP demonstrated that the current R142 implementation, even when train synchronization is achieved, only produces 2 to 4 KWH. Even with modifications to propulsion system parameters only 6 to 10 kWh was produced. Indeed, the REIP report concluded that, with modification to the propulsion system rheostatic chopper and ripple detection parameters, maximum regenerative energy possible on a 10 car train, per stop, is 12 kWh. This represents approximately half of the total regenerative energy available from a braking train. Contributing factors include:
- Load limitation (acceleration vs deceleration profiles) - Train and propulsion inverter control configurations - Third Rail voltage limits (regen voltage limit) - Ripple detection (dead rail protection)
These factors have been well documented, particularly in the REIP report, but a review and summary is appropriate.
Load limitation describes the inability of an accelerating train to absorb and utilize the instantaneous power produced by a decelerating train. An accelerating train can only absorb about half of the power available from a decelerating train. As physics would dictate, the energy required by the accelerating train is roughly equal to the energy available from a breaking train. The effect of this mismatch is further exacerbated by even small differences in start/stop synchronization.
Car-to-car variation and active interaction of train and propulsion inverter control configurations and parameters limit the initiation and continuation of regenerative braking modes on a car-to-car basis. The REIP demonstrated that these configuration and interaction issues typically result in a significant reduction in the number of cars providing any regenerative energy. These parameters are largely reacting to conditions on the third rail (receptivity, ripple, voltage limits) to determine whether or not to activate regenerative braking and route the energy to the third rail.
Page 47

Third rail voltage is monitored in order to determine line receptivity and to maintain this voltage within certain limits. The operational limits on voltage also limit the duration and amount of regenerative energy generation.
Substation ripple present on the third rail is monitored in order to determine if the rail is live. This provides for dead rail protection. The third rail is frequently deenergized in order to allow maintenance and repair activities. Applying regenerative energy to a track section that has been intentionally deenergized presents a significant safety issue for track workers. Unfortunately, ripple detection is not always a reliable indicator of track status. Ripple detection by the train car can be lost even when the track is not deenergized. The loss of ripple detection will prevent the car from providing regenerative energy.
Preliminary investigations and analysis not covered under this effort suggest that these limitations can be mitigated, allowing the total available regenerative energy to be available for train use significantly more often than is currently envisioned.
7. Market Analysis
The scope of this market analysis is to evaluate the market size and potential for technology that can store energy from regenerative braking systems on Heavy and Light rail systems. The scope is limited to Heavy and Light rail systems because their mode of operation includes frequent stops and thus offers better opportunities for energy recovery/storage from regenerative systems. There are many elements of a market study for technology products that one can consider. This market study focuses on fleet size to establish the size of the approximate market potential and on an energy perspective to rationalize the motivation for agencies to implement the technology.
If we look at 2009 power consumption numbers for light and heavy rail combined we see approximate 4.5 billion kilowatt hours offering a large opportunity for energy recovery. Evaluating approximately a 20 year trend of power consumption for heavy rail and light rail we also see a steady increase, see figure 1, emphasizing continued opportunity for further recovery and a long term benefit for storage of regenerative power.
Page 48
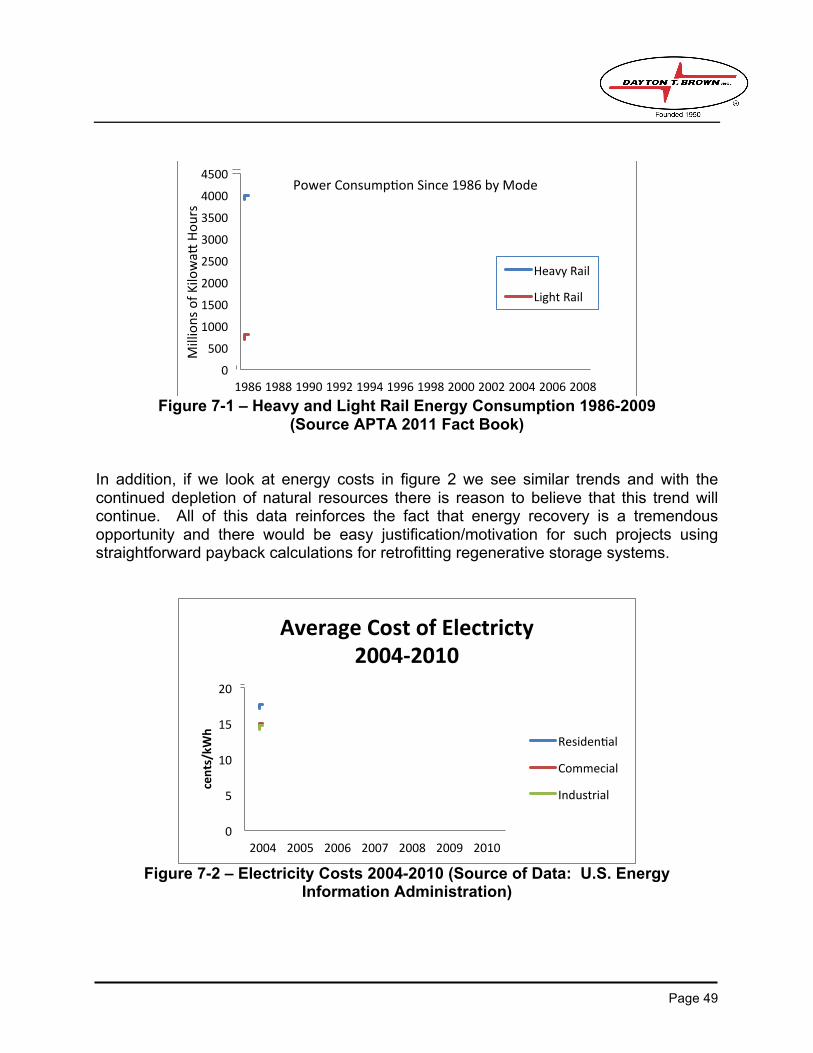
Millions
ofKilowa@
Hours
4500Power Consump>on Since 1986 by Mode
4000
3500
3000
2500Heavy Rail
2000Light Rail1500
1000
500
01986 1988 1990 1992 1994 1996 1998 2000 2002 2004 2006 2008
Average Cost of Electricty2004-‐2010
20
cents/kW
h
10
15Residen>al
Commecial
5 Industrial
02004 2005 2006 2007 2008 2009 2010
Figure 7-1 – Heavy and Light Rail Energy Consumption 1986-2009 (Source APTA 2011 Fact Book)
In addition, if we look at energy costs in figure 2 we see similar trends and with the continued depletion of natural resources there is reason to believe that this trend will continue. All of this data reinforces the fact that energy recovery is a tremendous opportunity and there would be easy justification/motivation for such projects using straightforward payback calculations for retrofitting regenerative storage systems.
Figure 7-2 – Electricity Costs 2004-2010 (Source of Data: U.S. Energy Information A dministration)
Page 49

In the US there are 15 heavy rail system and 26 light rail systems and new starts being planned. In Heavy rail there are approximately 11,377 revenue service vehicles and 1,969 on the light rail side. The average age of the heavy rail cars are 21 years old and light rail cars 18 years old. As railways replace cars there is a tendency to include regenerative braking. If we look at NYCT they have a fleet size of 6300 vehicles and in 2000 they introduced into service their new millennium train that have regenerative braking but no energy storage capability. Since then approximately 2500 vehicles have been put in service. Fleet statistics on vehicles equipped with regenerative power are not currently available for the entire US, so therefore we will assume a conservative value of 39% based on NYCT percentage of regenerative to non-regenerative vehicles (2,500/6,300). This would result in a total retrofit market of 5,205 rail vehicles in the US that would be well suited for storage system retrofit. In addition, given the average age of the fleet around 20 years and new vehicles being put in service at a 5 year average rate 400 rail vehicles per year. Clearly this suggests a there is great ongoing potential for this technology to integrate with new fleet delivery with the car manufactures. From a marketing perspective, the heavy and light rail markets are well suited for retrofitting of technology for energy storage. Given the long service life of the rail vehicles, the rising cost of electricity and the potential energy savings should make creating a short term ROI of the retrofit energy storage system quite feasible. The data presented throughout in this document is based on the APTA 2011 Fact Book and other noted resources.
8. Conclusions and Next Steps
This study involved the characterization of three energy storage devices and the simulation of their use in a subway car as storage for regenerative braking energy. The study reviewed a small, high power Lithium Ion cell, an Electric Double Layer Capacitor (EDLC or ultracapacitor) and a Nickel Capacitor (NiCap).
The simulation results indicate that purely from the perspective of energy density, the Lithium Ion cell is clearly superior. It is able to capture and return a significant portion of the braking energy with the fewest number of cells. In addition, these cells have the smallest mass and volume of any in the test. The resultant energy storage system would be the most compact and lightest weight option. However, these Lithium Ion cells would be operated close to their maximum power rating at all times. The result is a significant amount of heating, which mandates very aggressive cooling techniques. In addition, the Lithium Ion cells face other limitations (such as cycle life, temperature limitations and electrical management requirements) that further complicate their deployment in an onboard energy storage application. It should be noted that these cells are not representative of typical Lithium Ion cells. These cells are extremely high power devices, capable of absorbing charge currents over 100 times their C rate and
Page 50
fully charging in under a minute. Most Lithium Ion cells in the industry can only charge at 3 times their C rate and require tens of minutes or more to charge.
The simulations revealed that the ultracapacitor does not have the same ability to capture large amounts of energy with a small number of cells. In order to capture the greatest possible amount of braking energy, significantly more cells are required than the Lithium Ion solution. However, when the large number of cells is used, they will be operated significantly below their rated power. These cells have very low resistance values. The result is that very little heat is generated and a very high percentage of the braking energy is returned to the system on acceleration. The ultracapacitors are easier to manage than Lithium Ion cells and have a much greater cycle life, and are unaffected by operating temperature.
Finally, the Nickel Capacitors were shown not to perform as well as either of the other two solutions. These devices have practical benefits, such as robustness and maintainability. However, the cells are twice the mass and volume of the ultracapacitors and significantly more of them are required to absorb all of the braking energy. In addition, the high resistance of these cells causes significant energy loss during a charge discharge cycle.
The final selection of an energy storage medium would come down to the specifics of the project being proposed. With sufficient space and weight budget, the ultracapacitors can provide a simple, robust energy storage system with a straightforward design effort. If space and weight are at a premium and maximum energy density is desired, the Lithium Ion cells will provide the best energy return in the lowest weight and volume. However, these cells present significant engineering challenges which will complicate the design of the system and result in future maintenance expense.
The DTB/EMD study determined that the implementation of an on-board ESS comprised of EDLC ultracapacitors (or Lithium Ion batteries) could increase the recoverable regenerative energy to approximately 75% of the full amount available and that the mitigation of the current train limitations, through systems integration, could increase the available energy to about 24kWh per 10 car train per stop. Based on the analysis presented in the MTA Blue Ribbon Commission Report this would result in an annual reduction of approximately 1060 GWh, representing a savings of approximately $115M per year.
Additional benefits of an on-car ESS solution include: - Operational changes and accommodations not required. No need to attempt
the inefficient synchronization of train stops and starts. Results in increased savings.
- Storage and use of regenerative energy enroute. Performance not limited to
Page 51

stations. Results in increased savings. - Utilization of regenerative energy for partial acceleration/deceleration events.
Results in increased savings.
It is recommended that the following actions be performed: o Perform trade off analysis, including:
§ Energy Density § Thermal Analysis § Weight Analysis
o Develop integration approach and design for energy maximization o Design and develop DC Converter and ESS hardware o Develop and demonstrate prototype system
Page 52