feasibilityreporton - united states agency for ...pdf.usaid.gov/pdf_docs/pnace300.pdf ·...
TRANSCRIPT
PiJ -It cf - 30 0
lOOQ33
DEMAND SIDE MANAGEMENT
PROJECT
FEASIBILITYREPORT ON
UPGRADING OF AGRICULTURAL DISTRIBUTION NETWORK
FOR PALRA FEEDER
FOR
HARYANA VIDYUT PRASARAN NIGAM LIMITED
BY
INTERNATIONAL RESOURCE GROUP&
ENERGY ECONOMY & ENVIRONMENTAL CONSULTANTS
Sponsored byUmted States Agency for InternatIOnal Development
October 1998
~ ENERGY ECONOMY &. ENVIRONMENTAl UlNSlJIrANTS
ACKNOWLEDGEMENT
We are profoundly thankful to the Management of Haryana VIdyut Prasaran NIgam
(HVPN) for the support gIven m conductmg a Demand SIde Management study on the
Electncal DIstnbutlOn Network and the ImgatlOn pump-sets m Haryana
In partIcular we extend our thanks to Mr RanJlt Issar, Mr P K Vohra, Mr P C Dewan,
and Mr S K Ailawadhi
We are also thankful to the World Bank Staff, Mr DJamal Mostefat, Mr S
Padmanabhan, Ms Bhavana Bhatia, Mr Mohmder Mamat, Mr Suml Khosla and others
for theIr valuable suggestIons and comments
We hke to place on record our thanks to the Umted States Agency for IntematlOnal
Development for sponsonng thIS project
And m general, we thank all the members m the Headquarters, the Supenntendent
Engmeers, Sub DIVISlOnal Officers and Jumor Engmeers m the respectIve sub-statIons for
the timely aSSIstance and valuable mformation provIded for the study
We are smcerely thankful to the field personnel of HVPN and the farmers for theIr kmd
co-operatlOn WIth us dunng the conduct OfthlS project
~E9 ENERGY EcoNOMY & ENVIRONMENTAl CoNsuhANIS
EXECUTIVE SUMMARY
Pal1'a Feeder
Upgrading of Agricultural Distribution Network
INTRODUCTION
ThIS report IS a component of the Demand SIde Management study taken up byInternatIOnal Resource Group and Energy Economy & EnvIronmental Consultantsunder the aegIs of the Untted States Agency for InternatIOnal Development (USAID)m Palra Feeder ofHaryana VIdyut Prasaran NIgam LImlted(HVPN)
BACKGROUND
HVPN supplIes approxImately 13,000 million unzts of energy per annum! to Itsconsumers m VariOUS sectors The agncultural sector consumes 47 % of the totalenergy supplIed The revenue returns from thIs sector IS 17 % of the total revenueobtamed by the HVPN The subSidized rate offered by the HVPN to Its agnculturalconsumers IS the reason for the large energy consumption and Its dIsproportIOnatecontrIbutIon to revenue returns
THE PROBLEM
IrrIgation pump-sets are the major end-users m the agncultural sector These pumpsets operate at an average effiCIency of approxImately 29% The mefficlency of thepump-sets IS a combmatIon of Irregular mamtenance, low voltage supply and usageofnon-standardpumps
CAUSE IDENTIFICATION
The Low-TensIOn (LT) dlstnbutIOn constItutes a major portIOn of energy dlstnbutIOnnetwork In the agncultural sector These LT hnes carry large amount of load currentand traverse long dIstances m tree configuratIOn to cover the remotest agnculturalareas The energy lme losses occumng In these LT hnes contnbute towards the poorquahty of the power supphed Therefore, It IS ImperatIve that the energy losses bemmmZlzed to Increase the mput voltage to the Imgation pump-sets
'_Data Source HSEB Annual Accounts for 1995 - 1996FeaSlblllty Report Upgradmg ofAgricultural D,strlhutwn Network
Page A
~ ENERGY ECONOMY &ENVIRONMENtAl CoNsultANTS
METHODOLOGY
Palra Feeder
The project has been undertaken for Palra Feeder located m the Sonepat Circle of theHVPN dIstnbutIOn network A combmatIOn of field and analytical studies wasutIlIzed to arrIve at the solutIOn The analysIs mcludes detennmatIOn of VarIOUS
dIstnbutIOn network losses and the voltage scenano
RECOMMENDED SOLUTION
LT DIstrIbutIOn Network
A solutIOn of usmg LT less distributIOn system has been developed In the proposeddIstnbutIOn network, all the 415V lInes are converted to 11 kV and WIll be extendednear to the agncultural pump-sets Pole mounted mamtenance free dIstnbutlOntransfonners of 11 kV/415 V WIth a tap changer of 450 V, WIll be mstalled near toeach energy effiCIent pump-set
ThIS solutIOn for upgradmg the dIstnbution network WIll Improve the dIstnbutIOnvoltage level from eXIstmg 415 V to 11 kV 1 e, Improvement of approxImately 25tImes ThIS mturn WIll reduce the current loadmg of Ime by 25 tImes and hne loss(proportIOnal to square ofcurrent) by 625 tImes
HT Dlstnbutlon Network
In the HT Network, runmng a new lme of 16 2 km startmg from the sub-statIOn endand m parallel WIth the eXIstmg hne IS recommended
ENERGY SAVINGS
As per the recommended LT less option, the energy savmgs to the HVPN wIll be885 7 MW hr of per annum
As per the HT parallel hne recommendatIOn, the energy savmgs to the HVPN WIll be748 5 MW hr of per annum
FeaSlblllty Report Upgradmg ofAgrtcultural D,strlbutlon Network
PageB
@ ENERGY EcoNoMy & ENVIRONMENTAl CoNsvIrAN15
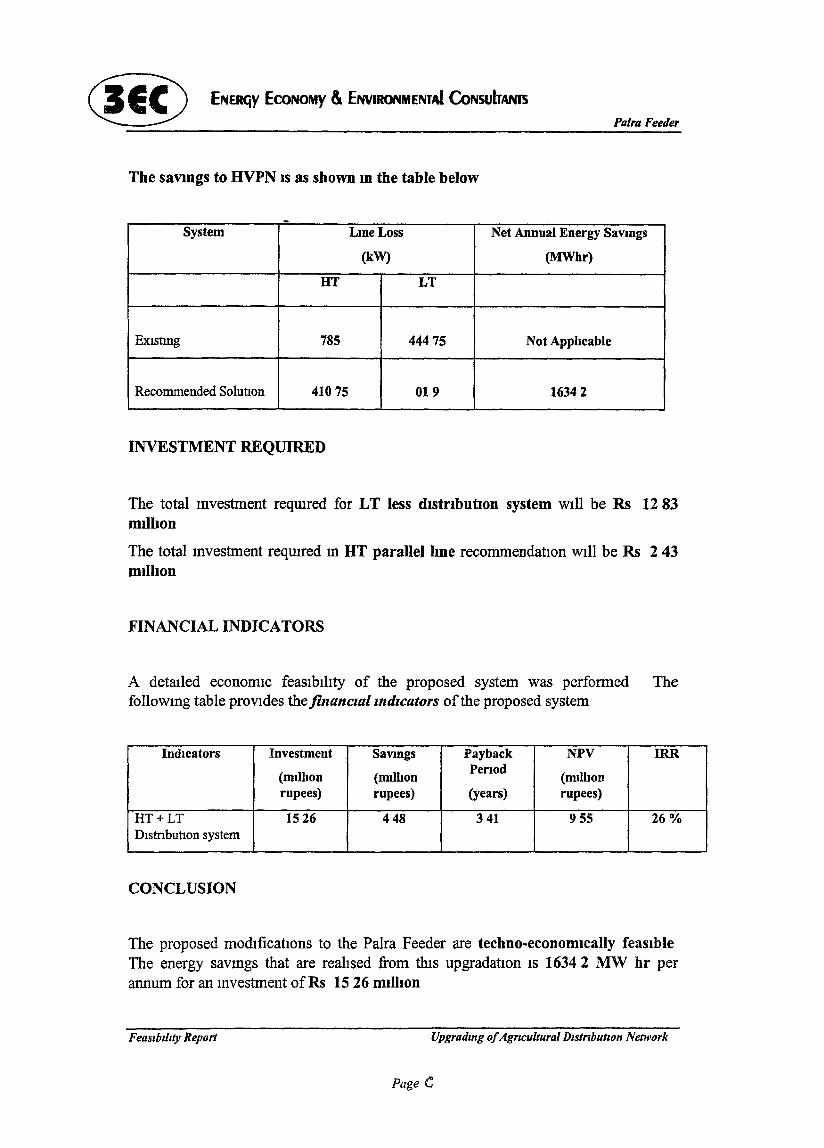
The savmgs to HVPN IS as shown m the table below
Palra Feeder
-System Lme Loss Net Annual Energy Savmgs
(kW) (MWhr)
HT LT
EXlstmg 785 44475 Not Apphcable
Recommended Solunon 41075 019 16342
INVESTMENTREQUllffiD
The total Investment reqUIred for LT less dIstrIbutIOn system wIll be Rs 12 83mIllIon
The total Investment reqUIred In HT parallel lIne recommendatIOn WIll be Rs 2 43mIllIon
FINANCIAL INDICATORS
A detaIled economIC feasIbIlIty of the proposed system was perfonned ThefollOWIng table provIdes thejinanclal md,cators ofthe proposed system
IndIcators Investment Savmgs Payback NPV IRR
(mdbon (nulhonPerIod
(mdhonrupees) rupees) (years) rupees)
HT+LT 1526 448 341 955 26%DlstnbutlOD system
CONCLUSION
The proposed modIficatIOns to the Palra Feeder are techno-economIcally feasIbleThe energy savmgs that are realIsed from thIs upgradatIOn IS 1634 2 MW hr perannum for an mvestment ofRs 1526 mIllIon
FeaSlbl/zty Report Upgradmg ofAgncultural DlstnbutlOll Network
Page C
® ENERGY ECONOMY &ENVIRONMENIAI CoNsullANIS
Parra Feeder
TABLE OF CONTENTS
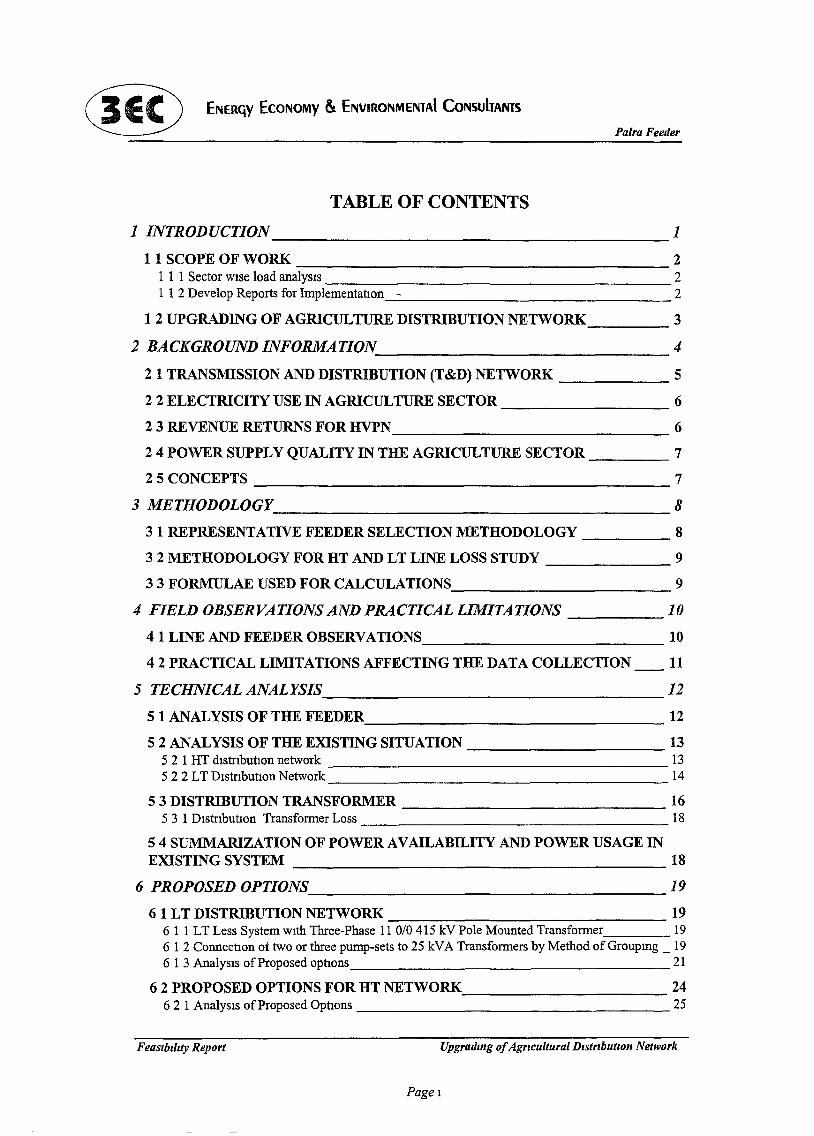
1 INTRODUCTION 1
11 SCOPE OF WORK 21 1 1 Sector wIse load analysIs 21 1 2 Develop Reports for Implementahon - 2
12 UPGRADING OF AGRICULTURE DISTRIBUTION NETWORK 3
2 BACKGROUND INFORMATION 4
2 1 TRANSMISSION AND DISTRIBUTION (T&D) NETWORK 5
22 ELECTRICITY USE IN AGRICULTURE SECTOR 6
23 REVENUE RETURNS FOR HVPN 6
24 POWER SUPPLY QUALITY IN THE AGRICULTURE SECTOR 7
2 5 CONCEPTS 7
3 METHODOLOGY 8
3 1 REPRESENTATIVE FEEDER SELECTION METHODOLOGY 8
32 METHODOLOGY FOR HT AND LT LINE LOSS STUDY 9
33 FORMULAE USED FOR CALCULATIONS 9
4 FIELD OBSERVATIONS AND PRACTICAL LIMITATIONS 10
41 LINE AND FEEDER OBSERVATIONS 10
42 PRACTICAL LIMITATIONS AFFECTING THE DATA COLLECTION 11
5 TECHNICAL ANALYSIS 12
5 1 ANALYSIS OF THE FEEDER 12
5 2 ANALYSIS OF THE EXISTING SITUATION 135 2 1 HT dlstnbuhon network 13522 LT DIstnbuhon Network 14
5 3 DISTRIBUTION TRANSFORMER 165 3 1 DIstnbutIOn Transformer Loss 18
54 SUMMARIZATION OF POWER AVAILABILITY AND POWER USAGE INEXISTING SYSTEM 18
6 PROPOSED OPTIONS 19
6 1 LT DISTRIBUTION NETWORK 1961 1 LT Less System WIth Three-Phase 11 DID 415 kV Pole Mounted Transformer 196 1 2 Connechon ot two or three pump-sets to 25 kVA Transformers by Method of Groupmg _ 196 1 3 AnalySIS ofProposed ophons 21
62 PROPOSED OPTIONS FOR HT NETWORK 246 2 1 AnalySIS of Proposed Ophons 25
FeaSibility Report Upgradmg ofAgrtcultural DistributIOn Network
Pagel
C!ID ENERGY ECONOMY & ENVIRONMENTAl CoNSUlTANTS
Palra Feeder
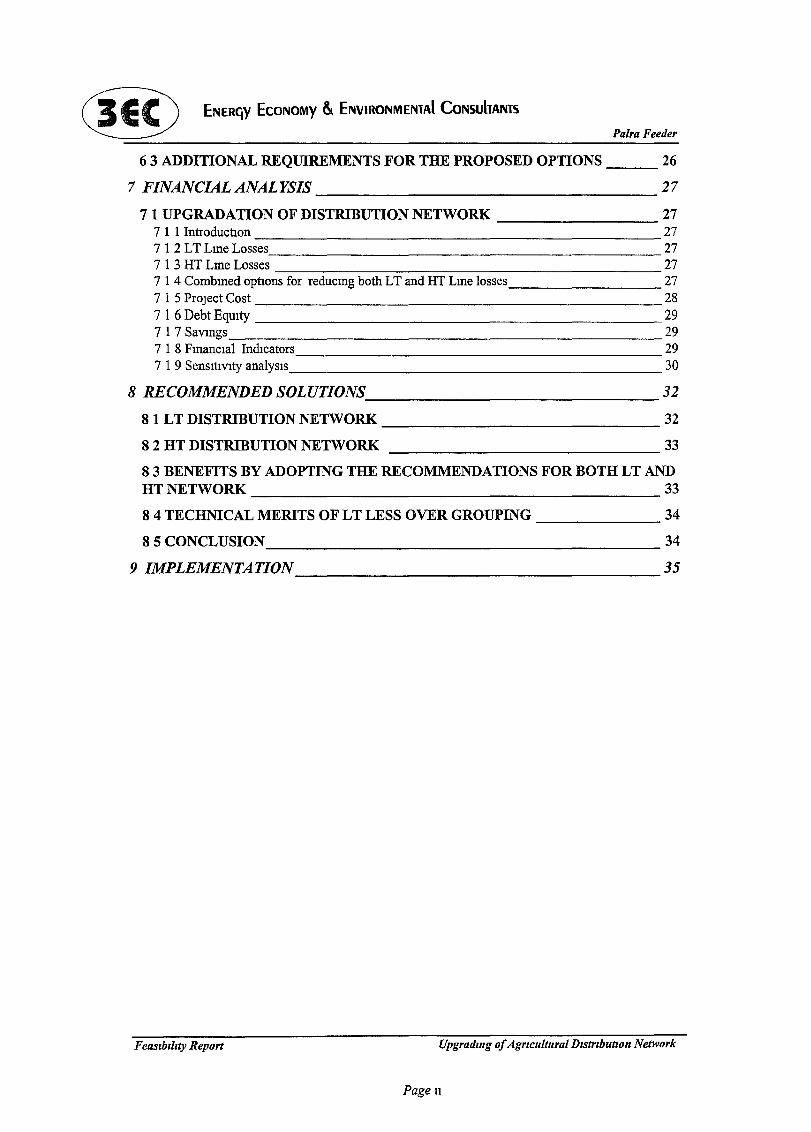
63 ADDITIONAL REQUIREMENTS FOR THE PROPOSED OPTIONS 26
7 FINANCIAL ANALYSIS 27
7 1 UPGRADATION OF DISTRIBUTION NETWORK 277 1 1 IntroductIon 27712 LT Lme Losses 277 1 3 HT Lme Losses 277 1 4 Combmed optIons for reducmg both LT and HT Lme losses 277 1 5 Project Cost 287 1 6 Debt Eqmty 297 1 7 Savmgs 297 1 8 Fmanclal IndIcators 297 1 9 SensItIvIty analysIs 30
8 RECOMMENDED SOLUTIONS 32
8 1 LT DISTRIBUTION NETWORK 32
8 2 HT DISTRIBUTION NETWORK 33
83 BENEFITS BY ADOPTING THE RECOMMENDATIONS FOR BOTH LT ANDHTNETWORK 33
84 TECHNICAL MERITS OF LT LESS OVER GROUPING 34
8 5 CONCLUSION 34
9 IMPLEMENTATION 35
FeaSlblilty Report Upgradzng ofAgrrcultural DlstrlbutlOn Network
Page 11
ENERGY ECONOMY &. ENVlRONMENTAI CoNSUlTANTs
Palra Feeder
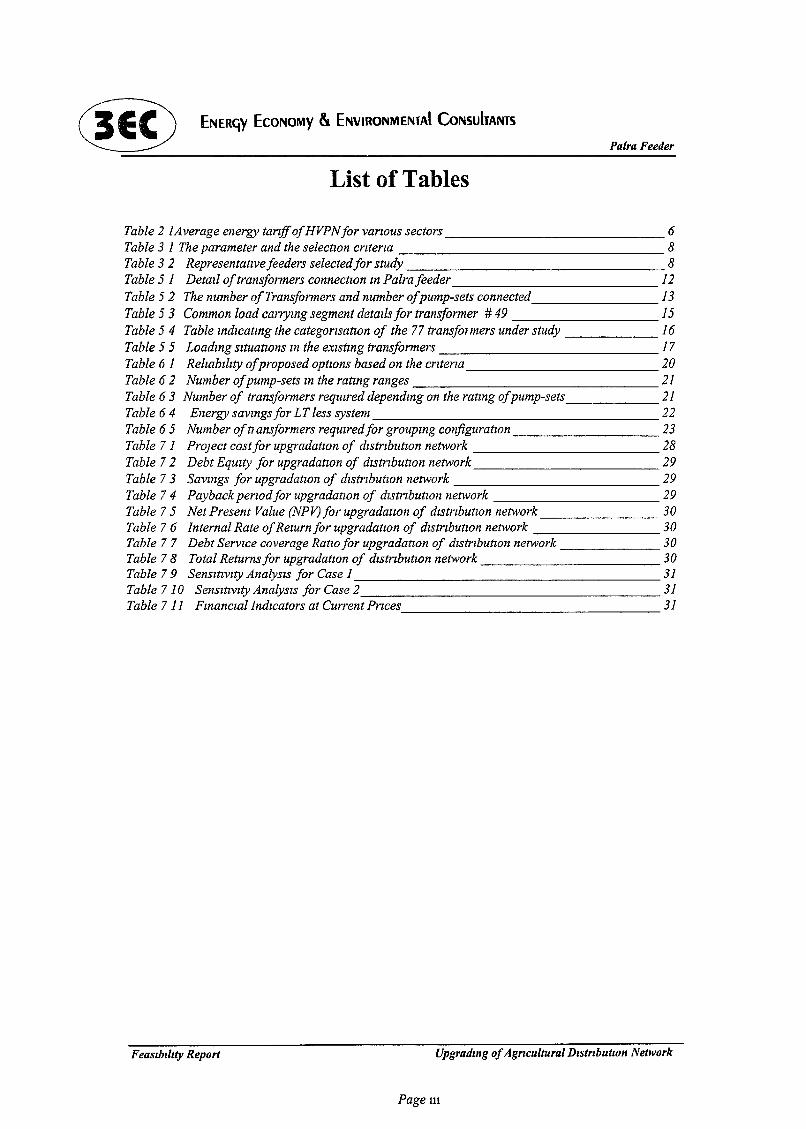
List of Tables
Table 2 1Average energy tariffofHVPNfor varIOus sectors 6Table 3 1 The parameter and the selectIOn crzterza 8Table 3 2 Representanvefeeders selectedfor study 8Table 5 1 Detail oftransformers connectwn mPalra feeder 12Table 5 2 The number ofTransformers and number ofpump-sets connected 13Table 5 3 Common load carrymg segment details for transformer # 49 15Table 5 4 Table mdlcanng the categorzsatwn of the 77 transf01 mers under study 16Table 5 5 Loadmg sltuanons m the eXlstmg transformers 17Table 6 1 Relzabllzty ofproposed optwns based on the criteria 20Table 6 2 Number ofpump-sets m the ratmg ranges 21Table 6 3 Number of transformers required dependmg on the ratmg ofpump-sets 21Table 64 Energy savmgs for LT less system 22Table 65 Number oftwnsformers required for groupmg configuratwn 23Table 7 1 Project costfor upgradatwn of dlstrlbutwn network 28Table 7 2 Debt EqUity for upgradatwn of dlstrlbutwn network 29Table 73 Savzngs for upgradatlOn of dlstrlbutwn network 29Table 74 Paybackperwdfor upgradatwn of distributIOn network 29Table 7 5 Net Present Value (NPV) for upgradanon of distributIOn network 30Table 7 6 Internal Rate ofReturn for upgradatzon of dlstrlbunon network 30Table 77 Debt Service coverage RatIO for upgradanon of distributIOn network 30Table 78 Total Returns for upgradatzon of dlstrlbunon network 30Table 79 SenSItiVity AnalySIS for Case 1 31Table 710 SensitiVity AnalYSIS for Case 2 31Table 7 11 Fmanczal Indicators at Current Prices 31
Feasibility Report Upgradmg ofAgricultural Dlstrlbutwn Network
Page 111
ENERGY ECONOMY & ENVIRONMENTAl CoNSUlTANTS
Palra Feeder
List of Figures
Figure 1 Graph showzng average power avallabllzty and maximum power demand m Haryana over aten year perzod 4Figure 2 Chart showzng sectoral energy consumptzon m Haryana 5Figure 3 Chart showmg revenue returns for HVPN from varzous sectors 6Figure 4 Typical sketch oftree configuratzon 15
Feaszbllzty Report Upgradmg ofAgrzcultural DlStrlbutzon Network
Page lV
® ENERGY EcoNOMY &ENVIRONMENTAl CoNsulTANTS
CHAPTER 1
1. INTRODUCTION
Palra Feeder
Agnculture IS the maInstay of the economy In the state of Haryana ThIs sector notprovIdes employment to the maJonty of the populatIon, but IS also the major revenueearner for the state The sector utIlIses over 47% of the electncal energy supplIed bythe Haryana VIdyut Prasaran NIgam LImIted (HVPN erstwhIle HSEB) However, Itcontnbutes approxImately 17% ofthe total revenue generated by HVPN, as the energyIS offered at SUbsIdIzed rates by the utIhty to thIS sector
Major portIon of the power supplIed to the agnculture sector IS utIlIsed for theoperatIOn of pump-sets The pump-sets are used to 1mgate cultIvable areas Over600,000 pump-sets utIlIsIng both dIesel dnven and e1ectncal energy dnven motors arelocated In Haryana The pump-sets operate at a very low efficIency
The possIble reasons for the low effiCIency of the pump-sets are as follows• InstallatIOn of InefficIent pump-sets• Irregular and Inadequate pump maIntenance• Poor qualIty of Energy Supply
Demand SIde Management (DSM) IS one of the methods that can be used to reducepower consumptIOn and Improve the qualIty of power DSM as a concept IS bemgattempted by power utilIties of dIfferent IndIan states such as Haryana, GUJarat, Onssaand Andhra Pradesh, all of whIch are developIng DSM proJectsl2 ThIS method ISbeIng conSIdered by the state electncity boards due to reduced capItal reqUirement andlow gestatIOn penod The DSM solutIOns have the advantage of decreaSIng demand,mcreasIng power qualIty and lowenng of tanff In general, the returns In a DSMproject are back-end loaded but In cases where the power IS SUbsIdIzed or free (Fore g , agncultural pump-sets and lIne losses) the returns are ImmedIate and attractIveThe DSM system uses a vanety of approaches such as energy conservatIOn, cogeneratIon and energy management technIques for selectIvely altenng the load curve
The current project InVestIgates how to replace the eXIstmg IneffiCIent agnculturalpump-sets by energy effiCIent pump-sets In thIS case, one of the prereqUiSItes ISImproved lIne voltage to operate the energy effiCIent pump-sets Therefore, theproject has two components to be effectIve The first component IS to Improve thelIne voltage by redUCIng voltage drop and consequent lIne losses Subsequently,energy conservatIOn In the pump-sets can be carned out The dIstnbutIOn modIficatIOnIn thIS case solves two problems, that of lIne losses and low voltages, SImultaneously
1 Strategic Approach for DSM m IndIa, RCGlHagler BaI1lay ConsultIng, Inc
2 Plannmg for Demand Side Management m the ElectrICIty Sector, lyon Pankh et al Tata McGrawHill Pubhshmg Company Ll1Tllted, New DelhI, 1994FeaSlbllzty Report Upgradmg ofAgricultural D,strlbutlon Network
Page 1
~ ENERGY ECONOMY & ENVIRONMENTAl CoNsuITA""
Palra Feeder
Haryana VIdyut Prasaran NIgam LImIted (HVPN) IS the nodal power utIlIty companym the state of Haryana HVPN IS responsIble for acceptance and ImplementatIOn ofthe vanous DSM solutIOns proposed m the project The reform ofthe HVPN IS takIngplace wlth the World Bank (WB) fundmg In pnnciple, HVPN has agreed to fund theImplementatIOn of the selected DSM projects Jomtly WIth the WB The support fortechmcal aSSIstance for thIS project comes from the Umted States Agency forInternatIOnal Development (USAID) USAID has selected InternatIOnal ResourceGroup (IRG) as the pnme consultant for carrymg out thIS project
\
Energy Economy & EnVIronmental Consultants (3EC) are the IndIan counterpartsselected and approved by USAlD, IRG, WB and HVPN to proVIde techmcal servIcesfor the project
1 1 SCOPE OF WORK
The DSM Project WIll be taken up m two phases The first phase WIll conSIst of thefollowmg three modulesModule 1 Sector-wIse Load AnalYSISModule 2 Develop Reports for ImplementatIOnModule 3 Trammg Component
The second phase consIstmg of two modules IS taken up after approval and fundmgfrom USAlD at a later stage The two modules areModule 4 DemonstratIOn ProjectsModule 5 Momtonng and EvaluatIOn
1 1 1 Sector wise load analySIS
A sample load data WIll be collected to estImate the eXIstmg load and a load curve WIllbe developed based on the estImate The data collected mclude, number of electnceqUIpment m each household dunng vanous seasons, the number of hours of usage,pattern of usage etc, m both urban and rural areas m domestIc sectors, number ofpumps m agnculture sector and the connected load and maXImum demand mmdustnal and commercIal sector
1 1 2 Develop Reports for ImplementatIOn
The major areas IdentIfied for ImplementatIOn are the followmg• Revampmg ofAgnculture DIstnbutIOn network• Pump Replacement StudIes• Co-generatIon m Sugar or Some Other Industnal Umts• Energy ConservatIOn Projects m Industry• Energy ConservatIon Projects m DomestIc and CommerCIal Sectors
Feaslbllity Report Upgradmg ofAgFlcultural DlstFlbutlOn Network
Page 2
~ ENERGY ECONOMY & ENVIRONMENTAl CoNSlJlrANlS
1 2 UPGRADING OF AGRICULTURE DISTRIBUTIONNETWORK
Palra Feeder
The dIsproportIonate contnbutIOn of the agncultural sector m terms of revenue andenergy consumptIOn IS largely responsIble for the dIfficultIes faced by the Board InVIew of the magmtude of the problem, the complexIty mvolved and the lImIted tImeaVaIlable, It was decIded to concentrate on revampmg the agncultural dIstnbutIOnnetwork and come out wIth a comprehensIve solutIOn In VIew of thIS, the reportactually dIscusses two Issues, voltage Improvement along wIth reductIOn of lme lossesand Improvement m the efficIency ofpump-sets
The scope of work IS to prepare a short hst of areas for study, out of several areas fordetaIled study For thIS, data on current, hne dIagram, pump detaIls of the eXIstmgfeeder need to be collected The technIcal and finanCIal analysIs of the field data ISperformed usmg appropnate methods Later, Implementable optIOns are comparedWIth the eXIstrng data to arnve at the techno-economIcally feasIble solutIOn
Feaslblltty Report Upgradmg ofAgncultural D,strlbutlon Network
Page 3
® ENERGY ECONOMY &. ENVIRONMENTAl CoNSUbANl§
CHAPTER 2
2. BACKGROUND INFORMATION
Palra Feeder
Haryana State located m northwestern IndIa IS spread over an area of 44,212 squarekIlometers The state came to eXIstence after the re-organizatIOn of the erstwhIlePunjab State m 1966 The populatIOn of the state IS approxImately 19 mIllIon, wIth amaJonty of the populatIOn hvmg m rural areas
The farmers of these vIllages cultIvate theIr lands by growmg crops In a normal year,the farmers grow two crops (paddy and wheat) However, some of the farmers growthree crops wherem one IS wheat, the second IS fodder/vegetable and the thIrd ISpaddy Paddy IS grown m the ramy season m the months of July to October, Wheat ISgrown m the wmter season form November to February and vegetables are grown many season ImgatIOn m fields IS earned out by farmers by drawmg the water throughthe electncal dnven motor pump-sets from the tube wells The power to these pumpsets are supplIed by the HVPN through LT dIstnbutIon hnes The LT dIstnbutIOnhnes are drawn from the transformers which are connected to the llkV mam and spurHT hnes These mam and spur hnes draw power from the sub-statIOn dIstnbutIOnfeeder Paddy growmg season IS the peak season and the energy consumptIOn IS foundto reach the peak pomt dunng thIS season
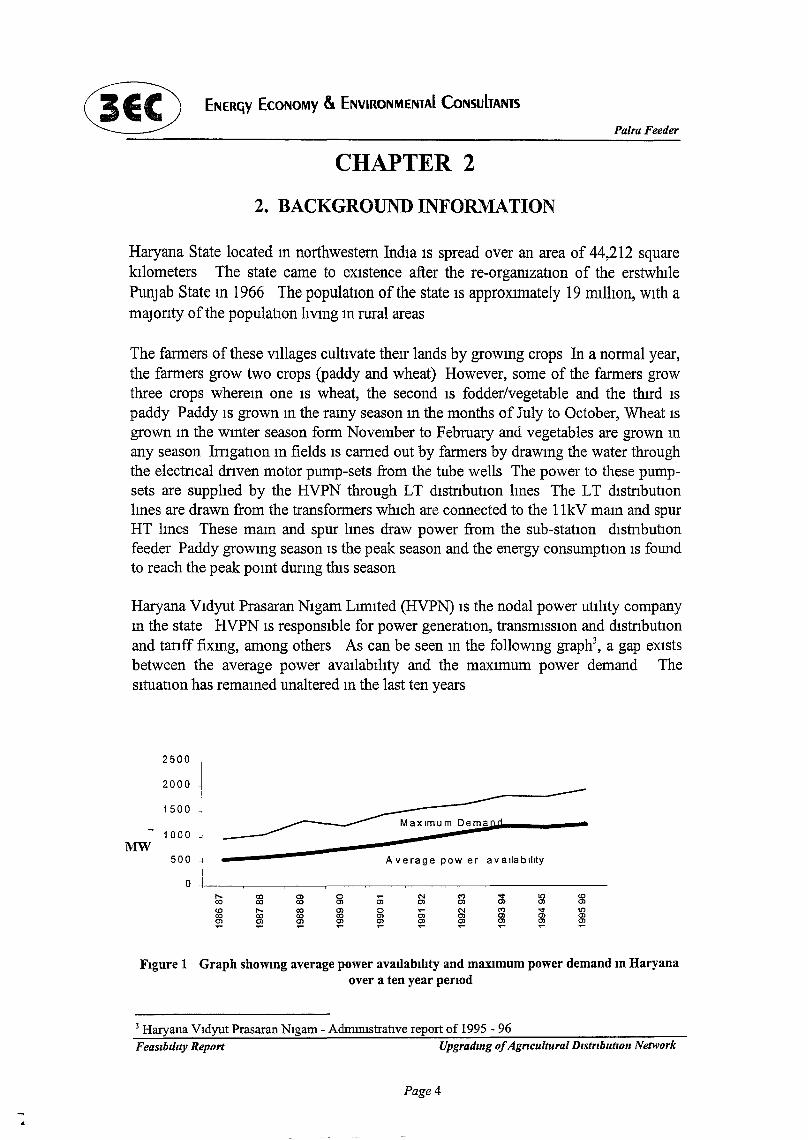
Haryana VIdyut Prasaran NIgam LImIted (HVPN) IS the nodal power utilIty companym the state HVPN IS responSIble for power generatIOn, transmISSIOn and dIstnbutIOnand tanff fixmg, among others As can be seen m the followmg graph3
, a gap eXIstsbetween the average power avaIlabIlIty and the maXImum power demand TheSItuatIOn has remamed unaltered m the last ten years
2500
2000
1500
1000 ~
MWA verage power availability500 ~
I
o +I-~----.----------r----------------""00<000Ol~
~0000Ol~
..
FIgure 1 Graph showmg average power avadablhty and maXImum power demand m Haryanaover a ten year penod
3 Haryana VIdyut Prasaran NIgam - Admnustranve report of 1995 - 96FeaSIbIlIty Report Upgradmg ofAgTlcultural Dlstrlbutwn Network
Page 4
~ ENERGY EcoNOMY &. ENVIRONMENIAI CoNSllITANB
Palra Feeder
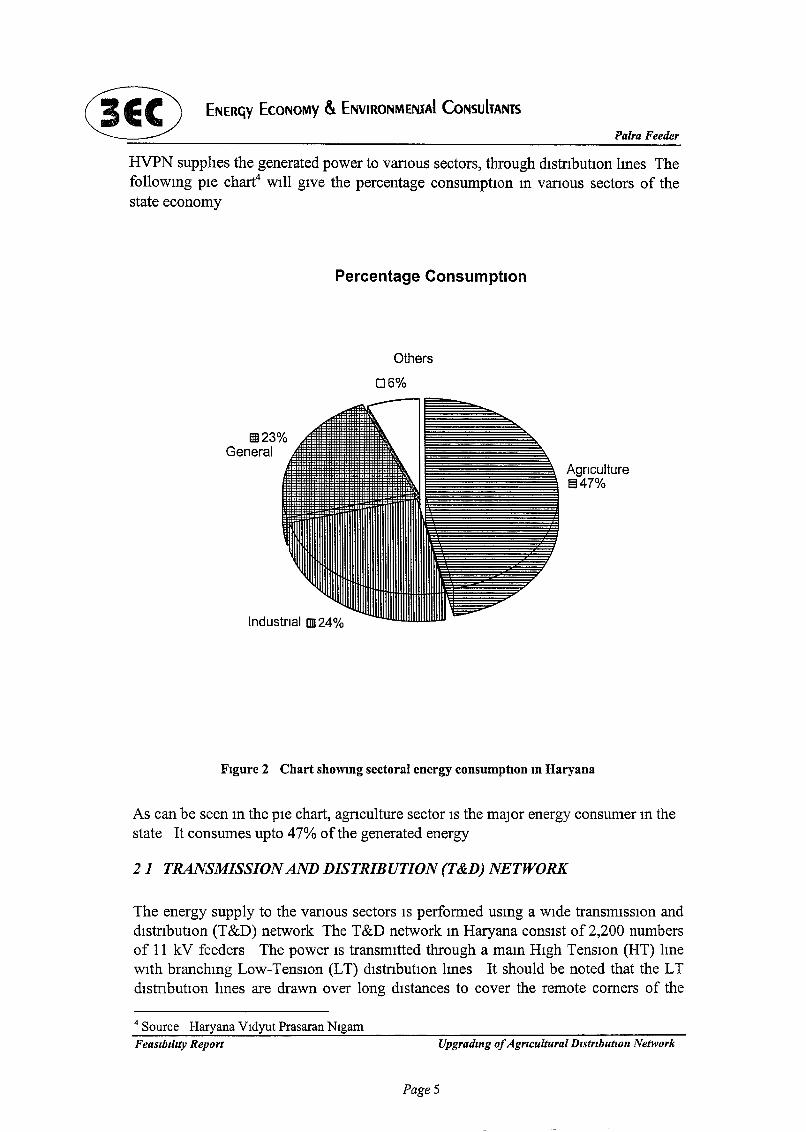
HVPN supplIes the generated power to vanous sectors, through dIstnbutIOn lmes Thefollowmg pIe chart4 WIll gIVe the percentage consumptIOn m vanous sectors of thestate economy
Percentage Consumption
Others
06%
ml23%General
Industrial un 24%
Agriculture1347%
FIgure 2 Chart showmg sectoral energy consumption m Haryana
As can be seen m the pIe chart, agnculture sector IS the major energy consumer m thestate It consumes upto 47% of the generated energy
21 TRANSMISSION AND DISTRIBUTION (T&D) NETWORK
The energy supply to the vanous sectors IS performed usmg a WIde transmISSIOn anddIstnbutIOn (T&D) network The T&D network m Haryana conSIst of 2,200 numbersof 11 kV feeders The power IS transmItted through a mam HIgh TenSIOn (HT) lmewIth branchmg Low-TensIOn (LT) dlstnbutIOn hnes It should be noted that the LTdIstnbutIOn hnes are drawn over long dIstances to cover the remote comers of the
4 Source Haryana Vldyut Prasaran NIgamFeaSlblllty Report Upgradzng ofAgrzcultural DistrIbutIOn Network
Page 5
® ENERGY EcoNOMY & ENVIRONMENTAl CoN5lJlTAN15
Palra Feeder
electncal dIstnbutlon network The lme, from the transformer pomt to the firstdemand pomt (known as common load carrymg segment) carnes the total load currentof all demand pomts Therefore, the losses occurrmg m these LT lInes are large Dueto these 1me losses, the voltage drop IS hIgh and the qualIty of power supplIed to theend user IS affected ThIs has a negatIve effect on the efficIency of vanous machIneswhIch IS dependent on the qualIty ofpower supply
22 ELECTRICITY USE IN AGRICULTURE SECTOR
IrngatIOn pump-sets constItute a major portIOn of electncity use III the agnculturalsector In 1995 -1996, there were a total of approxImately 600,000 pump-sets mHaryana The reported average rated capaCIty of the pump-sets IS 7 5 HP
2 3 REVENUE RETURNS FOR HVPN
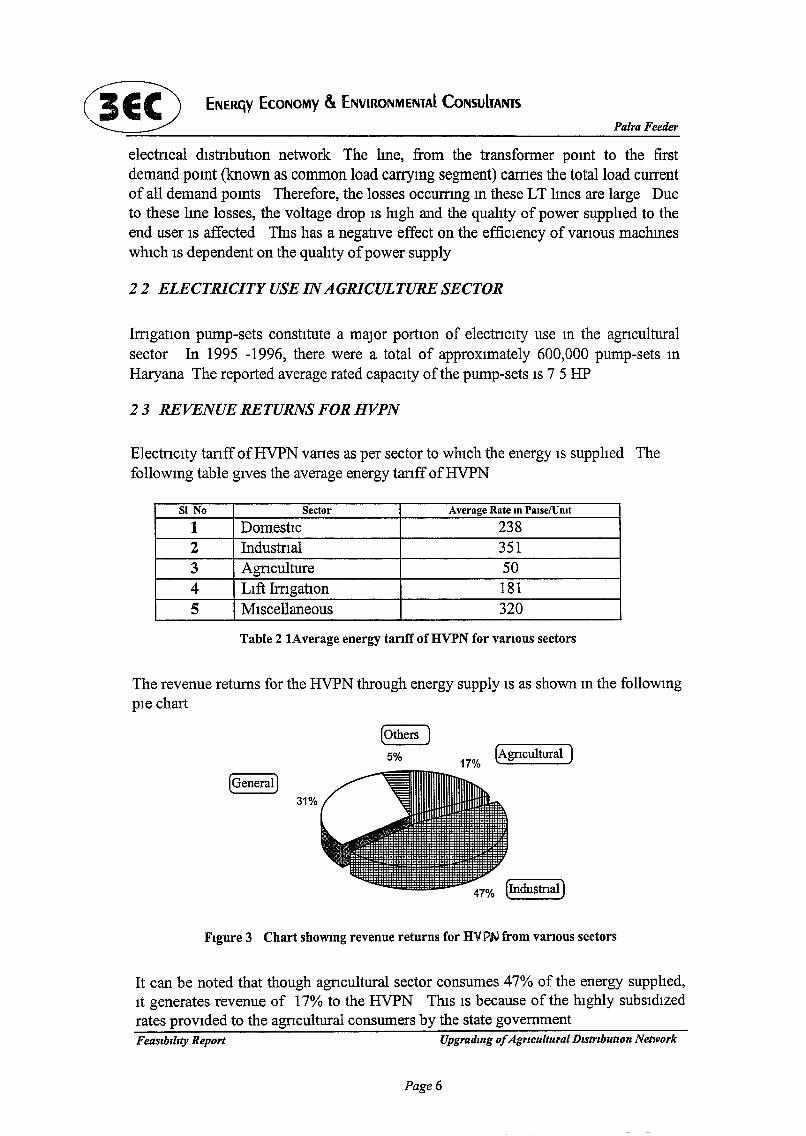
Electncity tanff ofHVPN vanes as per sector to WhICh the energy IS supplIed Thefollowmg table gIves the average energy tanff ofHVPN
SI No Sector Average Rate m Palse!Umt
1 DomestIC 2382 Industna1 3513 Agncu1ture 504 LIft IrngatIOn 1815 MIscellaneous 320
Table 2 lAverage energy tarIff of HVPN for various sectors
The revenue returns for the HVPN through energy supply IS as shown m the followmgpIe chart
(Others)
5%17%
(Agncultural )
(General)31%
Figure 3 Chart showmg revenue returns for HV PBIJ from various sectors
It can be noted that though agncu1tura1 sector consumes 47% of the energy supplIed,It generates revenue of 17% to the HVPN ThIs IS because of the hIghly SUbSIdIzedrates prOVIded to the agncultural consumers by the state governmentFeasrbrlrty Report Upgrading ofAgrzcultural Dzstrzbutlon Network
Page 6
® ENERGY ECONOMY &. ENVIRONMENTAl CoNSIlnANTS
24 POWER SUPPLY QUALITYIN THE AGRICULTURE SECTOR
Palra Feeder
ImgatIon pump-sets account for a major portion of consumption of power m theagncultural sector The LT lInes traverse long dIstances m tree-lIke configuratIOn toreach the pump-sets The losses occurnng m these lInes are illgh and m the year 1995- 1996, It was approxImately 32% of the dIstnbuted power In addItIOn, the averagevoltage aVailable at the pump-sets termmaiis approXImately 70% of the rated voltage,1 e , 290 V mstead of 415 V Thus, the voltage drop of 30% the rated voltage affectsthe efficIent workmg ofthe pump-sets
25 CONCEPTS
As noted m the preVIOUS sections, revenue earned by HVPN from the agnculturalsector IS dIsproportionate to the consumptIOn pattern ThIS revenue loss affects theperformance of HVPN, mcludmg mvestments for addmg power generatIOncapacItIes Moreover, the energy losses occurnng m the agncultural sector IS hugedue to the large mefficient network and mefficient pump-sets Tills energy lossprevents the effectIve utIlIzatIOn of generated energy m the revenue earmng sectorsTherefore, HVPN faces a dual problem for supplymg energy to the agncultural sectorOne IS of revenue generatIOn and another the extent of energy losses
Increasmg the effiCIency of the pump-sets reduces the electncity demand m theagncultural sector Therefore, a comprehenSIve rectIficatIOn scheme that upgrades theeXIstmg pumpmg system IS ImperatIVe to have energy effiCIent pumpmg systemTherefore, It IS Imperative that the lIne losses are mmimized to ensure better revenuesto the HVPN and better power qualIty to the end user
ThIs report mvolves a detaIled analysIs of the Palra feeder and analysIs of the pumpsets of the Sonepat CIrcle m the HVPN dIstnbutIOn network ThIs report mvestIgates,mterprets, analyses, proposes and recommends the solutIOns to be Implemented TheeconomIC feaSIbIlIty of the VarIOUS optIOns are also performed
FeasIbIlity Report Upgradmg ofAgrlcultural DIstributIOn Network
Page 7
® ENERGY ECONOMY 6. ENVIRONMENlAI CoNsuITANl5
CHAPTER 3
3. METHODOLOGY
Palra Feeder
The ObjectIve of the project IS to revamp the agncultural power dIstnbutIOn networkand mefficlent pump-sets utIlIsed m the agncultural sector The methods that wereemployed to amve at a solutIOn are dIscussed m the followmg sectIOns
3 1 REPRESENTATIVE FEEDER SELECTION METHODOLOGY
The T&D network m Haryana conSIsts of thIrteen CIrcles Four CIrcles were selectedfor the study The four CIrcles are, Kurukshetra, Jmdh, Kamal and SonepatRepresentatIve feeders were selected m these CIrcles for the study
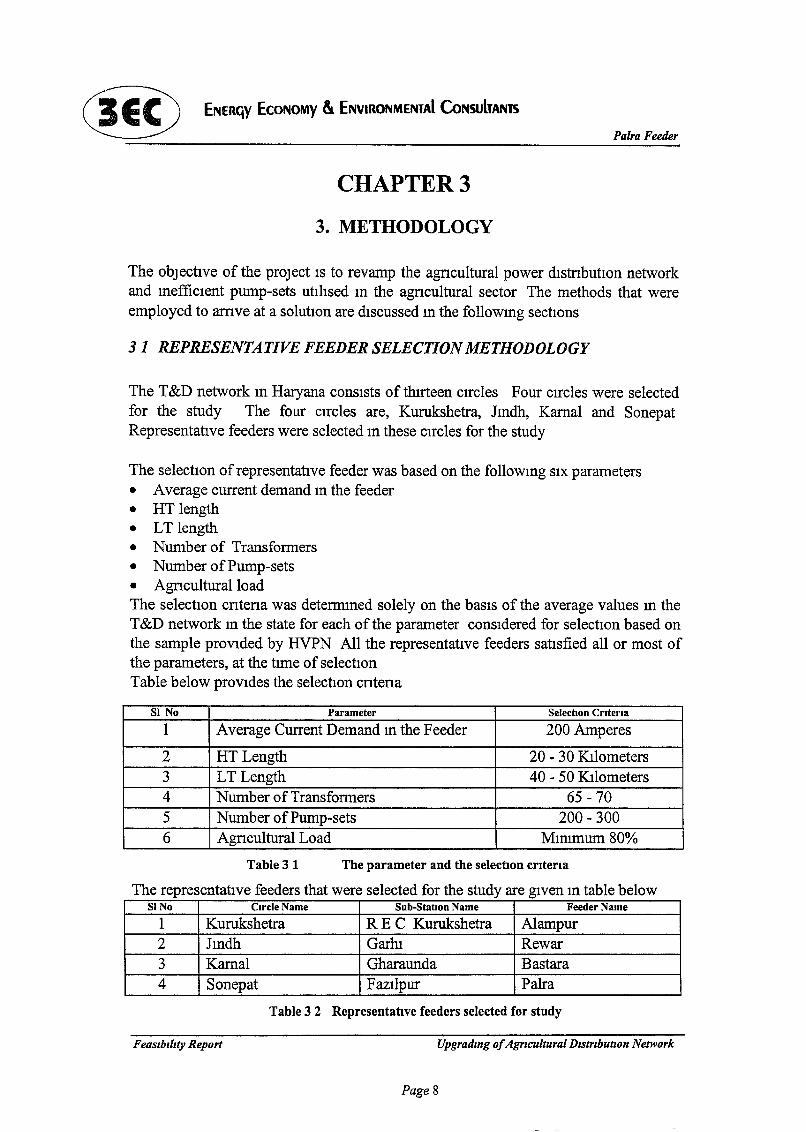
The selectIon ofrepresentatIve feeder was based on the followmg SIX parameters• Average current demand m the feeder• HT length• LT length• Number of Transformers• Number ofPump-sets• AgnculturalloadThe selectIon cntena was determmed solely on the baSIS of the average values m theT&D network m the state for each of the parameter conSIdered for selectIOn based onthe sample proVIded by HVPN All the representatIve feeders satIsfied all or most ofthe parameters, at the tIme of selectIonTable below proVIdes the selectIOn cntena
SI No Parameter Selection Criteria
1 Average Current Demand m the Feeder 200 Amperes
2 HT Length 20 - 30 KIlometers3 LTLength 40 - 50 KIlometers4 Number of Transformers 65 -705 Number ofPump-sets 200 - 3006 Agncultural Load MmImum80%
Table 31 The parameter and the selectIon crIteria
The representatIve feeders that were selected for the study are gIven m table belowSINo CJrcleName Sub-Statlon Name Feeder Name
1 Kurukshetra R E C Kurukshetra Alampur2 Jmdh GarhI Rewar3 Kamal Gharaunda Bastara4 Sonepat FazI1pur Palra
Table 3 2 RepresentatIve feeders selected for study
Feaslblllty Report Upgradmg ofAgTlcultural D,stTlbutlon Network
Page 8
~ ENERGY ECONOMY & ENVIRONMENTAl CoNSUIrANIS
32 METHODOLOGY FOR HT AND LTLINE LOSS STUDY
Palra Feeder
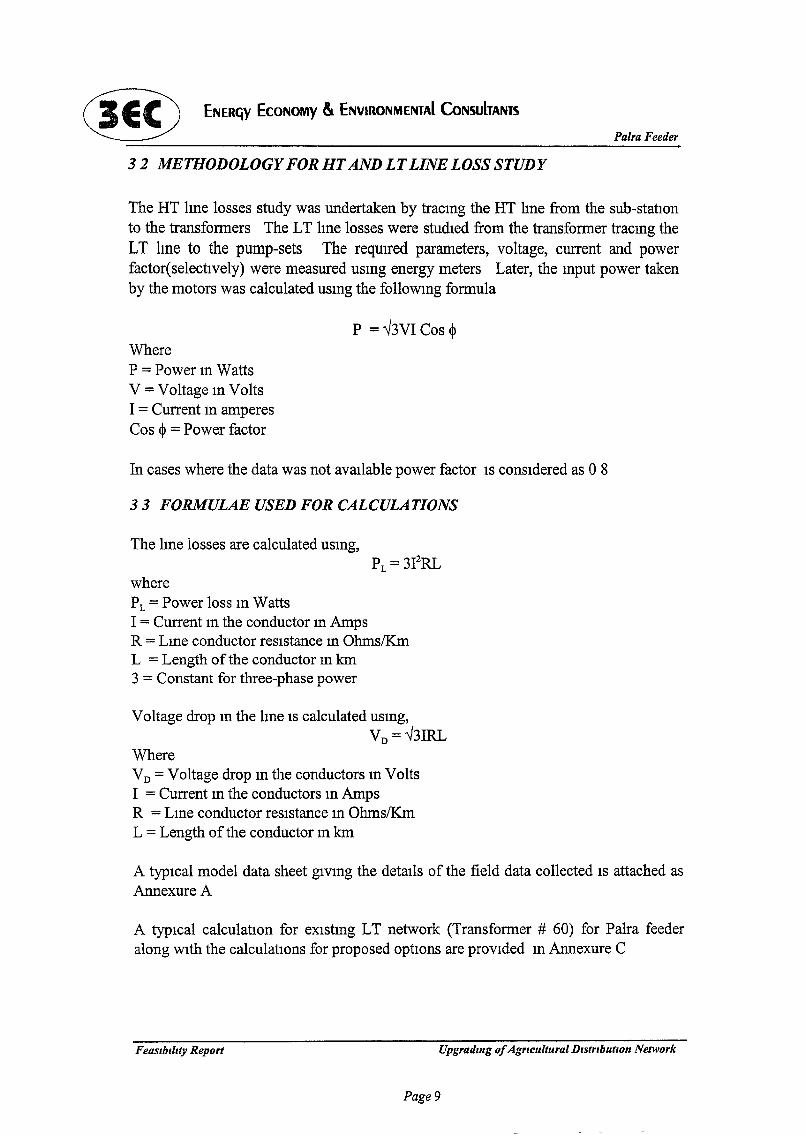
The HT Ime losses study was undertaken by tracmg the HT hne from the sub-statIOnto the transformers The LT hne losses were studIed from the transformer tracmg theLT lme to the pump-sets The reqUIred parameters, voltage, current and powerfactor(selectIvely) were measured usmg energy meters Later, the mput power takenby the motors was calculated usmg the followmg formula
P =..J3VI Cos $WhereP =Power m WattsV =Voltage m VoltsI =Current m amperesCos $ = Power factor
In cases where the data was not aVaIlable power factor IS consIdered as 0 8
3 3 FORMULAE USED FOR CALCULATIONS
The hne losses are calculated usmg,
wherePL = Power loss m WattsI = Current m the conductor m AmpsR = Lme conductor resIstance m OhmslKmL = Length ofthe conductor m kIn3 = Constant for three-phase power
Voltage drop m the hne IS calculated usmg,VD = ..J3IRL
WhereVD = Voltage drop m the conductors m VoltsI = Current m the conductors m AmpsR = Lme conductor resIstance m OhmslKmL = Length of the conductor m kIn
A typIcal model data sheet gIvmg the detaIls of the field data collected IS attached asAnnexure A
A typIcal calculatIOn for eXIstmg LT network (Transformer # 60) for Palra feederalong WIth the calculatIOns for proposed optIOns are provIded In Annexure C
FeasIbIlIty Report Upgradmg ofAgrzcultural DlstrzbutlOn Network
Page 9
C!ID ENERGY ECONOMY lit ENVIIlONMENlAI CoNsubANIS
CHAPTER 4
Palra Feeder
4. FIELD OBSERVATIONS AND PRACTICAL LIMITATIONS
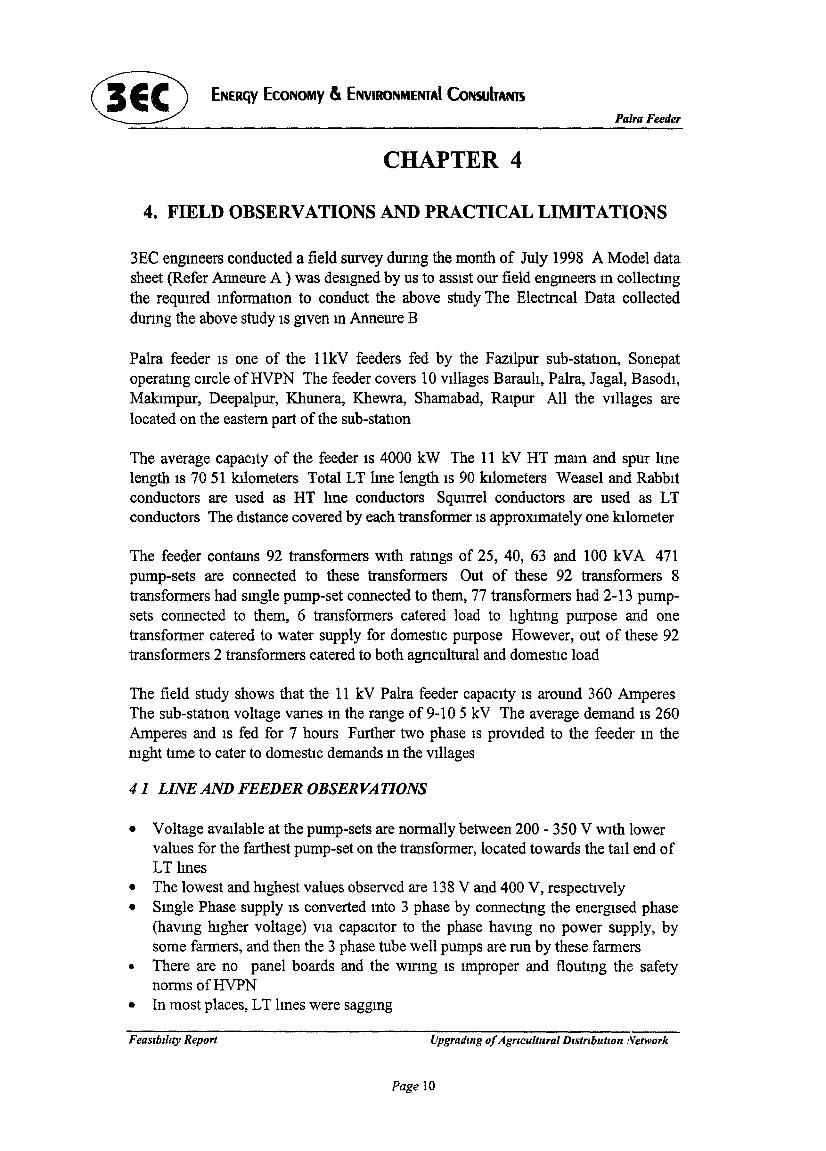
3EC engIneers conducted a field survey dunng the month of July 1998 A Model datasheet (Refer Anneure A ) was desIgned by us to asSISt our field engmeers m collectmgthe reqUIred InfOrmatIOn to conduct the above study The Electncal Data collecteddunng the above study IS glVen In Anneure B
Palra feeder IS one of the llkV feeders fed by the Fazllpur sub-statIOn, Sonepatoperatmg cIrcle ofHVPN The feeder covers 10 VIllages Barauh, Palra, Jagal, Basodl,Maklmpur, Deepalpur, Khunera, Khewra, Shamabad, Ralpur All the VIllages arelocated on the eastern part of the sub-statIOn
The average capacIty of the feeder IS 4000 kW The 11 kV HT mam and spur Imelength IS 7051 kilometers Total LT lIne length IS 90 kilometers Weasel and RabbItconductors are used as HT Ime conductors SqUIrrel conductors are used as LTconductors The dIstance covered by each transformer IS approXImately one kilometer
The feeder contams 92 transformers With ratmgs of 25, 40, 63 and 100 kVA 471pump-sets are connected to these transformers Out of these 92 transformers 8transformers had SIngle pump-set connected to them, 77 transformers had 2-13 pumpsets connected to them, 6 transformers catered load to lIghtmg purpose and onetransformer catered to water supply for domestIc purpose However, out of these 92transformers 2 transformers catered to both agncultural and domestIc load
The field study shows that the 11 kV Palra feeder capaCIty IS around 360 AmperesThe sub-statIOn voltage vanes m the range of 9-10 5 kV The average demand IS 260Amperes and IS fed for 7 hours Further two phase IS prOVIded to the feeder m themght tIme to cater to domestIc demands m the VIllages
41 LINE AND FEEDER OBSERVATIONS
• Voltage avaIlable at the pump-sets are normally between 200 - 350 V WIth lowervalues for the farthest pump-set on the transformer, located towards the tall end ofLT hnes
• The lowest and hIghest values observed are 138 V and 400 V, respectIvely• Smgle Phase supply IS converted mto 3 phase by connectmg the energIsed phase
(havmg hIgher voltage) VIa capaCItor to the phase havmg no power supply, bysome farmers, and then the 3 phase tube well pumps are run by these farmers
• There are no panel boards and the wmng IS Improper and floutmg the safetynorms ofHVPN
• In most places, LT hnes were sagging
FeaSIbilIty Report Upgradmg ofAgncultural D,strfbutlOn Network
Page 10
® ENERGY ECONOMY &. ENVIIlONMENIAI CoNsulIANlSPalra Feeder
42 PRACTICAL LIMITATIONS AFFECTING THE DATA COLLECTION
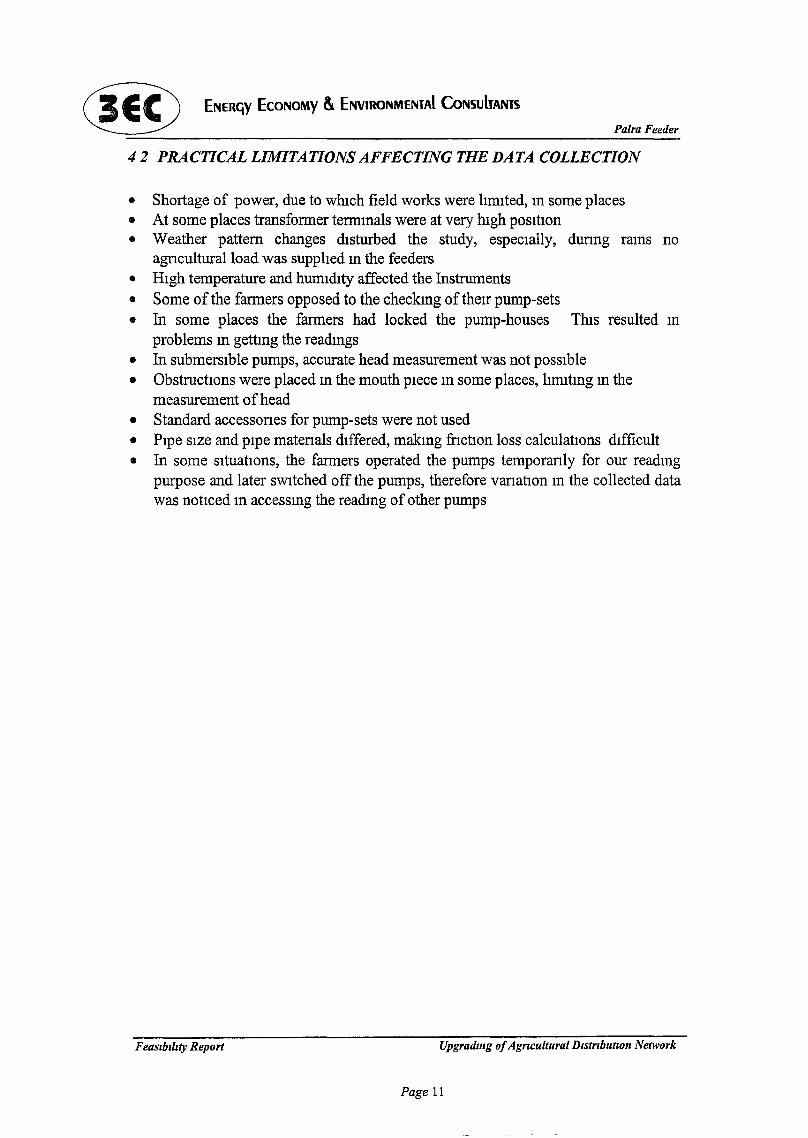
• Shortage of power, due to whIch field works were lImIted, m some places• At some places transformer termmals were at very hIgh posItIon• Weather pattern changes dIsturbed the study, espeCIally, dunng rams no
agnculturalload was supplIed m the feeders• HIgh temperature and humIdIty affected the Instruments• Some of the farmers opposed to the checkmg oftheIr pump-sets• In some places the farmers had locked the pump-houses ThIS resulted m
problems m gettmg the readmgs• In submersIble pumps, accurate head measurement was not possIble• ObstructIOns were placed m the mouth pIece m some places, IImItmg m the
measurement ofhead• Standard accessones for pump-sets were not used• PIpe sIze and pIpe matenals dIffered, makmg frIctIOn loss calculatIOns dIfficult• In some sItuatIOns, the farmers operated the pumps temporanly for our readmg
purpose and later SWItched off the pumps, therefore vanatIOn m the collected datawas notIced m accessmg the readmg ofother pumps
Feaslbtllty Report Upgradmg ofAgTlcultural D,strlbutlOn Network
Page 11
~ ENERGY ECONOMY &. ENVIRONMENTAl CONSUITAim
CHAPTER 5
5. TECHNICAL ANALYSIS
Palra Feeder
The techmcal analysIs for the eXIstmg dIstrIbutIOn network was performed as per theprocedure descnbed m the methodology It should be noted that the followmgassumptIOns were made for the analYSIS
1 The load demand IS dynamIc 1 e, the loadmg of pump-sets are changmgaccordmg to the demand cntena
2 All the pump-sets are m operatIOn3 The penod of energisatIOn of dIstrIbutIOn network IS taken as 2000 hours per
annum
51 ANALYSIS OF THE FEEDER
The Palra feeder IS one of the 11 kV feeders fed by Fazl1pur 132/11 kV sub-statIOnFrom the field study, It IS noted that the average current demand of thIs feeder IS 260Amperes The average voltage vanes m the range of 9 0 - 10 5 kV but at tImes dunngthe peak demand, the voltage reaches to a lower lImIt of 85 kV The average loaddemand ofPaIra feeder recorded IS 38 MW
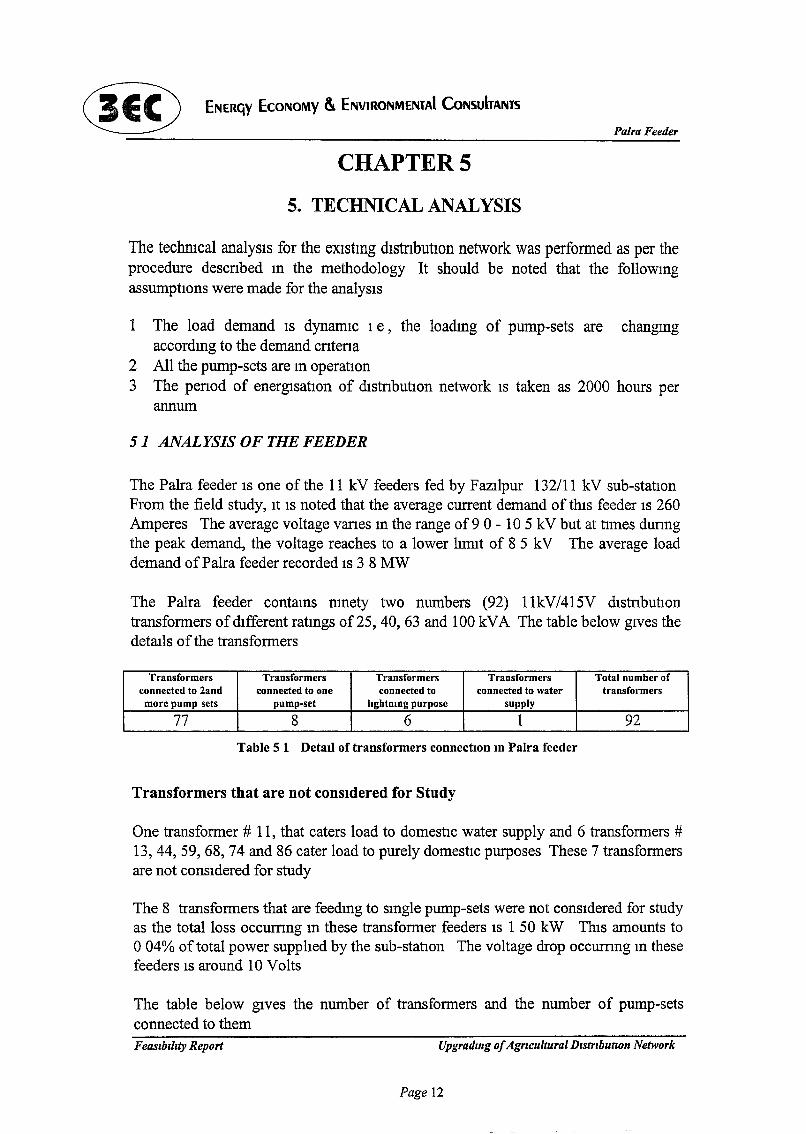
The Palra feeder contams mnety two numbers (92) llkV/415V dIstrIbutIOntransformers of dIfferent ratmgs of25, 40, 63 and 100 kVA The table below gIves thedetails ofthe transformers
Transformers Transformers Transformers Transformers Total number ofconnected to 2and connected to one connected to connected to water transformersmore pump sets pump-set hghtnmg purpose supply
77 8 6 1 92
Table 5 1 DetaIl of transformers connectIOn In Palra feeder
Transformers that are not conSidered for Study
One transformer # 11, that caters load to domestic water supply and 6 transformers #13,44,59,68, 74 and 86 cater load to purely domestic purposes These 7 transformersare not conSIdered for study
The 8 transformers that are feedmg to smgle pump-sets were not conSIdered for studyas the total loss occumng m these transformer feeders IS 1 50 kW ThIs amounts to004% of total power supplIed by the sub-statIOn The voltage drop occumng m thesefeeders IS around 10 VoIts
The table below gIves the number of transformers and the number of pump-setsconnected to themFeasibility Report Upgradmg ofAgrzcultural D,strzbutlon Network
Page 12
® ENERGY ECONOMY &. ENVIRONMENTAl CoNsUlTANTS
Palra Feeder
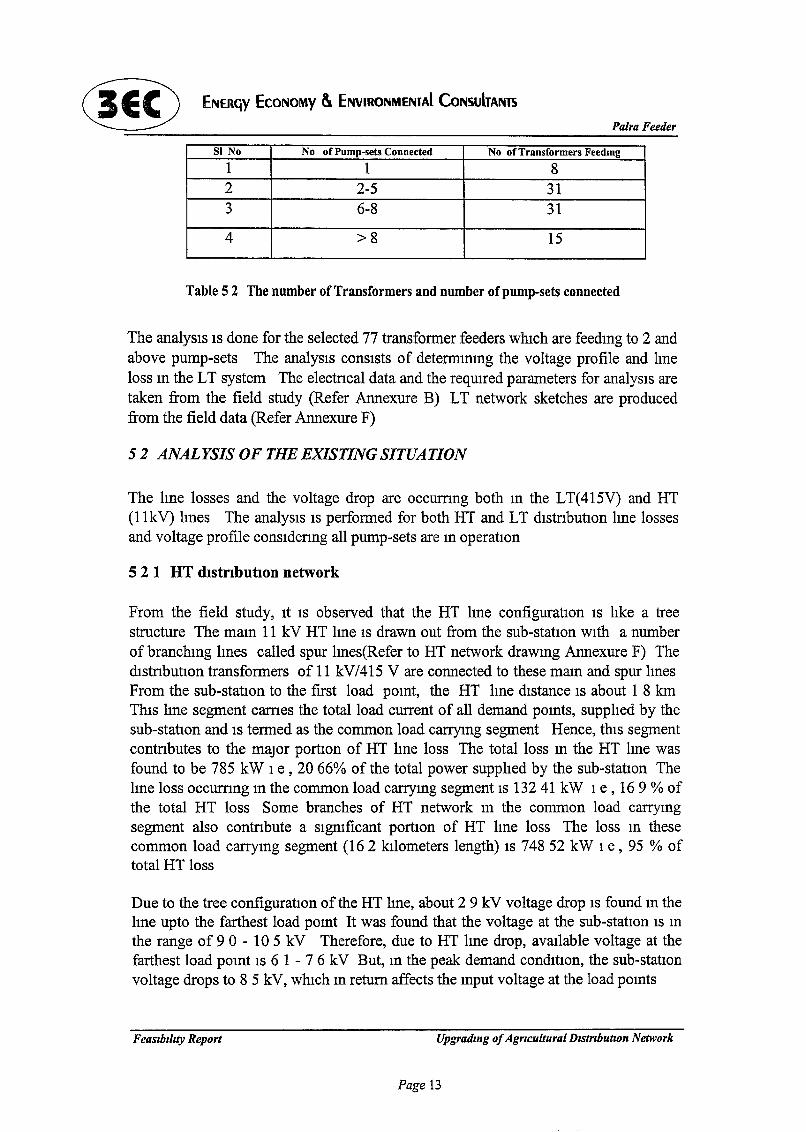
Sl No No of Pump-sets Connected No ofTransformers Feedmg
1 1 82 2-5 313 6-8 31
4 >8 15
Table 5 2 The number of Transformers and number of pump-sets connected
The analysIs IS done for the selected 77 transformer feeders whIch are feedmg to 2 andabove pump-sets The analysIs consIsts of determmmg the voltage profile and hneloss m the LT system The electncal data and the reqUIred parameters for analySIS aretaken from the field study (Refer Annexure B) LT network sketches are producedfrom the field data (Refer Annexure F)
52 ANALYSIS OF THE EXISTING SITUATION
The hne losses and the voltage drop are occumng both m the LT(415V) and HT(11kV) hnes The analYSIS IS performed for both HT and LT dIstnbutIOn hne lossesand voltage profile considenng all pump-sets are m operatIOn
5 2 1 HT dIstributIOn network
From the field study, It IS observed that the HT hne configuratIOn IS hke a treestructure The mam 11 kV HT hne IS drawn out from the sub-statIOn WIth a numberof branchmg hnes called spur Imes(Refer to HT network drawmg Annexure F) ThedIstnbutlon transformers of 11 kV/415 V are connected to these mam and spur hnesFrom the sub-statIOn to the first load pomt, the HT hne dIstance IS about 1 8 kmThIs hne segment carnes the total load current of all demand pomts, supphed by thesub-statIon and IS termed as the common load carrymg segment Hence, thIS segmentcontnbutes to the major portIOn of HT hne loss The total loss m the HT hne wasfound to be 785 kW 1 e , 2066% of the total power supphed by the sub-statIOn Thehne loss occumng m the common load carrymg segment IS 13241 kW 1 e, 169 % ofthe total HT loss Some branches of HT network m the common load carrymgsegment also contnbute a sIgmficant portIOn of HT hne loss The loss m thesecommon load carrymg segment (162 kilometers length) IS 74852 kW 1 e, 95 % oftotal HT loss
Due to the tree configuratIOn ofthe HT hne, about 2 9 kV voltage drop IS found m thehne upto the farthest load pomt It was found that the voltage at the sub-statIon IS mthe range of 90 - 105 kV Therefore, due to HT Ime drop, avaIlable voltage at thefarthest load pomt IS 6 1 - 76 kV But, m the peak demand condItIon, the sub-statIOnvoltage drops to 8 5 kV, whIch m return affects the mput voltage at the load pomts
FeaSIbILIty Report Upgradmg ofAgrlcultural DIStribution Network
Page 13
® ENERGY ECONOMY &. ENVIRONMENTAL CoN5lJbANT5
5 2 2 LT DIstrIbutIOn Network
Palra Feeder
The 11 kV HT mam and spur hnes contaIn 11 kV/415 V dIstnbutIOn transfonners of25,40,63 and 100 kVA These transfonners are feedIng to number ofpump-sets of 5,75, 10, 125 and 15 HP ratmgs by 415 V LT dlstnbutIOn hnes The average LTlength from the transfonner to the pump-sets IS about 1 kl10meter The analySIS wasdone for 77 transfonner feeders that are feedmg to two and above pump-sets The LThne had both tree and radIal configuratIOn fonns
From the parameters hke voltage, current and powerfactor ofpump-sets obtamed fromthe field survey, -the LT hne loss and voltage profile of the eXIstmg LT dIstnbutIOnnetwork IS calculated (Refer Annexur D, Table 1)
EXIstIng LT lIne loss and Voltage scenarIO(
The average LT loss occumng m the 77 transfonner feeders under study IS 444 75kW ThIs amounts to 11 7 % of total power supphed from the sub-statIOn ThedIstnbutIOn transfonners also contnbute a SIgnIficant portIOn of loss, therebymcreasmg the LT dIstnbutIOn losses The overall LT dIstnbutIOn networkloss(mcludmg dIstnbutIOn transfonner loss) was found to be 53225 kW Ie, 14 % oftotal power supphed from the sub-statIOn The average voltage drop m LT dlstnbutIOnnetwork IS m the range of50-100V
In cases where the transfonner feeders have tree configuratIOn wIth long hne lengths,the hne losses are m the range of 25-40% of the power supphed by the dIstnbutIOntransfonner These feeders are feedmg to five or more pump-sets of 10 HP - 15 HPratmg In these cases, maxImum hne loss as well as voltage drop are occumng m thecommon load carrying portIOn ofthe hne
ConfiguratIon In the eXIstIng LT network
The eXlstmg LT network has two configuratIOns The two configuratIOns are
1 Tree ConfiguratIOn2 Radial ConfiguratIOn
• Tree ConfiguratIOn
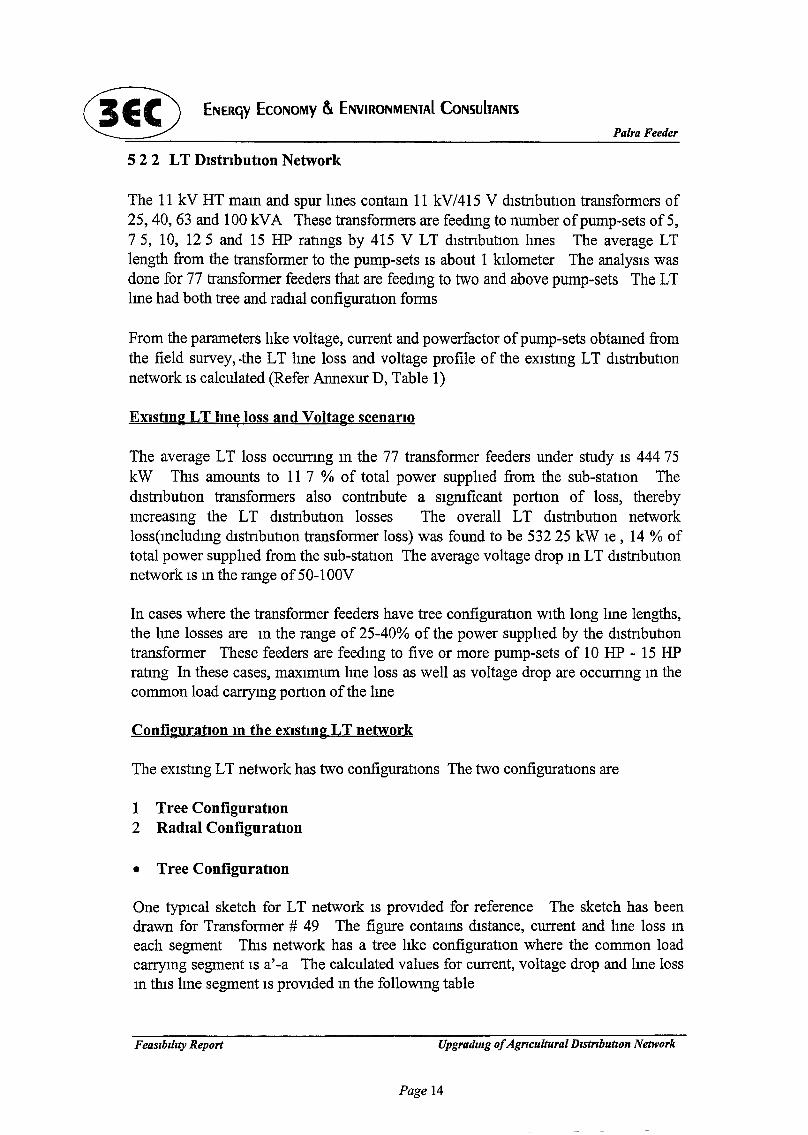
One typIcal sketch for LT network IS prOVIded for reference The sketch has beendrawn for Transfonner # 49 The figure contams dIstance, current and Ime loss meach segment ThIs network has a tree hke configuratIOn where the common loadcarrymg segment IS a'-a The calculated values for current, voltage drop and Ime lossm thIs Ime segment IS prOVIded In the followmg table
Feaslblilty Report Upgradmg ofAgTlcultural D,stTlbuhon Network
Page 14
ENERGY ECONOMY &. ENVIRONMENTAl CoNsulTANTS
Palra Feeder
Lme Segment DIstance m Current m amps Voltage Drop m Volts Lme Loss m kWlOts
a'-a 225 90 526 82
Table 5 3 Common load carrymg segment details for transformer # 49
Transformer - 49
75 HP,32198 V
o 75HP,32198V
j f")I.
\ \;~ \\ \\)\\\
280m ..._ f ~\).\,,\N)
30A (113 kW) ~ \\) /'>.\\\)
~ ~-a '7~~ g:;> 75HP,3186V
Owner Zlle Smgh
-90A (82kW)a
~.....,...----. 382 53V 225 m
63kVA
llkVf41SV
7
75HP 32679V
Slltn ;;~~~t;=i::~~~2z~-~~~d...........C OA (013 kW) d
:;::::-;\).\ "Wl __ 215 m d11l /'>. ",£: 70m '£' __
<::,£:'0: 10 A (01 kW)75HP 30705V "j ~
d "'f 75HP,29783V
8 ~
75 HP 30263 V
Note HP ratmgs of the pump sets are the ratmgs as declared by the farmers
Figure 4 Typical sketch of tree configuratIOn
The total loss occumng m the network IS 1276 kW The maXImum contnbutlon IScommg from thIs segment Also, the total voltage drop found m the network IS 84 7Vfrom the transfonner LT SIde to the farthest load pomt The major contnbutIOn for thevoltage drop IS from thIS segment Hence, It can be mferred that m tree configuratIOn,the maXImum Ime loss and voltage drop occurs m the common load carryIng segmentthat carnes the maXImum load current
• RadIal ConfiguratIOn
In radIal configuratIOn, the pump-sets are connected from the transfonner m radIalfashIon The common current carrymg segment of thIs type of CIrCUIt IS less or noneIt can be mferred that the Ime loss and voltage drop occumng m the CIrCUIt IS due tothe current of the pump connected to the Ime segment Hence, m radIal configuratIOnIme loss and voltage drop are found to be low or average
FeaSlbllzty Report Upgradzng ofAgrzcultural D,str,butlon Network
Page 15
® ENERGY ECONOMY & ENVIRONMENlAI CoNSUlrANlS
FIndIngs of the AnalysIs
Palra Feeder
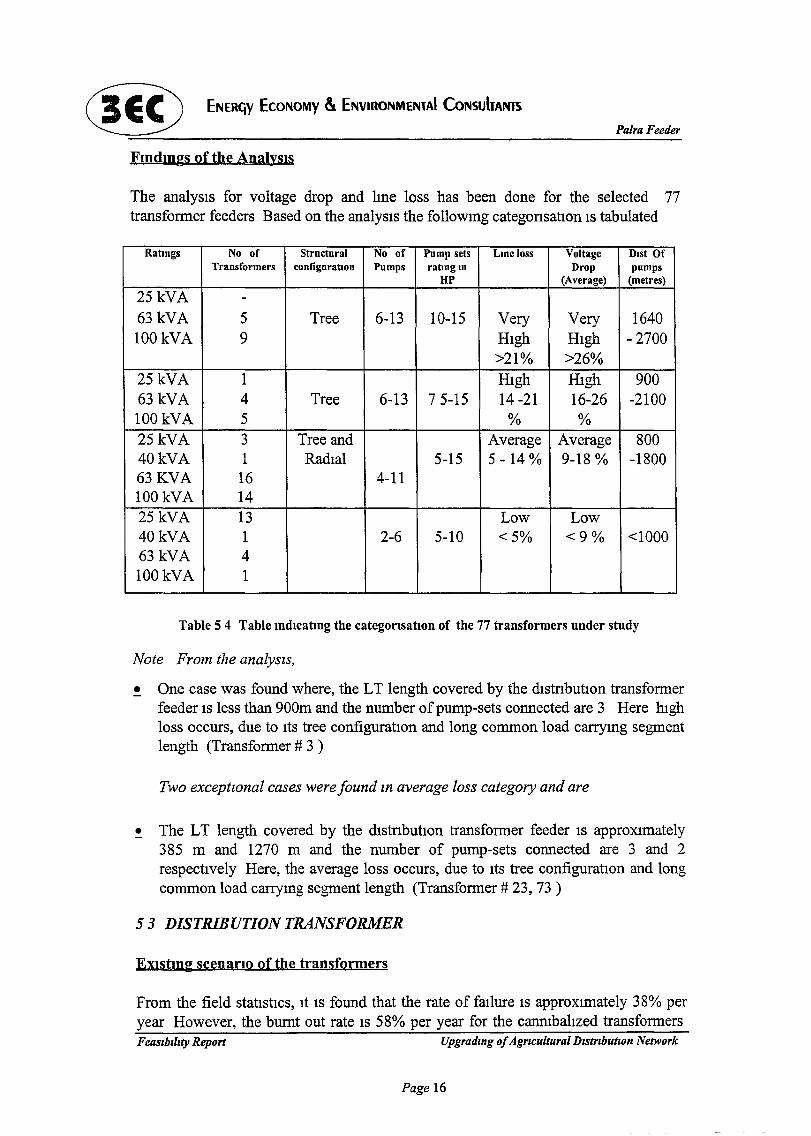
The analysIs for voltage drop and Ime loss has been done for the selected 77transfonner feeders Based on the analysIs the followmg categonsatIOn IS tabulated
Ratmgs No of Structural No of Pump sets Lme loss Voltage Dlst OfTransformers configuratIOn Pumps ratmgm Drop pumps
HP (Average) (metres)
25kVA -63kVA 5 Tree 6-13 10-15 Very Very 1640100kVA 9 HIgh HIgh - 2700
>21% >26%25kVA 1 HIgh HIgh 90063kVA 4 Tree 6-13 75-15 14 -21 16-26 -2100100kVA 5 % %25kVA 3 Tree and Average Average 80040kVA 1 Radial 5-15 5 -14% 9-18 % -180063KVA 16 4-11100kVA 1425kVA 13 Low Low40kVA 1 2-6 5-10 <5% <9% <100063kVA 4100kVA 1
Table 5 4 Table mdlcatmg the categorIsatIon of the 77 transformers under study
Note From the analyszs,
• One case was found where, the LT length covered by the dlstnbutIOn transfonnerfeeder IS less than 900m and the number ofpump-sets connected are 3 Here mghloss occurs, due to ItS tree configuratIOn and long common load carrymg segmentlength (Transfonner # 3 )
Two exceptzonal cases were found zn average loss category and are
• The LT length covered by the dlstnbutIon transfonner feeder IS approXImately385 m and 1270 m and the number of pump-sets connected are 3 and 2respectIvely Here, the average loss occurs, due to ItS tree configuratIon and longcommon load carrymg segment length (Transfonner # 23, 73 )
53 DISTRIBUTION TRANSFORMER
EXIStIng scenarIO of the transformers
From the field statIstIcs, It IS found that the rate of faIlure IS approxlffiately 38% peryear However, the burnt out rate IS 58% per year for the canmbaltzed transfonnersFeaSIbIlity Report Upgradmg ofAgTlcultural DlStrlbutlon Network
Page 16

Palra Feeder
Canmbahzed transformers are burnt out transformers that are replaced by usmg oldtransformers matenals
In the eXlstmg SItuatIon, the transformers are bemg used for several years FromstatIstIcs, It IS seen that the rate of faIlure IS qUIte hIgh It means that the eXlstmgtransformers have been rewound atleast once already Therefore, the loadmg capacItyof the transformers IS reduced to a maxImum of 64% of ItS rated capacIty and also thetransformer loss IS lngh (Refer Annexure D, Table 1)
The followmg table gIves the loadmg SItuatIon m some ofthe eXIstmg transfonners
Cases Transformer RatedkVA Loadmg ofTransformer m kVA Loadmg ofTransformerNumber Capacity w r t allowable hmlt
Allowable EXlstmg
over 38 63 403 9971 2474%loaded 51 63 403 11973 297%
30 63 403 7032 1745%
under 45 100 64 1902 297%loaded 31 100 64 13 74 2147%
41 63 403 1264 314%
Table 5 5 LoadlDg SItuatIOns lD the eXIstIng transformers
As can be seen from the table, some of the eXlstmg transformers are over loadedTherefore, two eqUIvalent capacIty of transformers WIll be requIred to meet the loaddemand In addItion, there are some transformers that are underloaded It can bemferred that there IS unequal dIstnbution of loadmg m the network ThIs SItuatIon canbe rectIfied by shlftmg some loads to the underloaded transformers
In the present scenano, the dlstnbutton transformers feedmg to agncultural pump-setsare over loaded
Reasons for overloadmg
• Pump-sets draw more power than the ratmgs• Length of the dIstrIbutIOn Imes IS large• Irregular mamtenance of transformers• Loadmg beyond permISSIble lllrutS• Low voltage aVaIlable at the termmal pomt
Effects of Overloadmg
• The transform~r core and the wmdmgs get heated Up to exceed the temperaturehmits and causes hot spots
Feas,blllfJ' Report Upgradmg ofAgrICultural DlstrzbutlOn Network
Page 17
® ENERGY ECONOMY & ENVIRONMENTAl CoNSUlTAIm
Palra Feeder
• Due to the hot spots, the WIndIngs get burnt frequently, reducIng the hfe of thetransfonner
• HVPN allows the core loss to two to three tImes of the specIfied value undernonnal condItIon In a rewound transfonner, when the overload occurs, core lossIncreases to exceed the allowable hmits
• The copper loss occumng In the transfonners IS dIrectly proportIonal to the squareof current supplIed by the transfonner Hence, dunng overload condItIOn thecopper loss mcreases m tenns of square of current, also affectImg the coolIngsystem
• Affects the LT sIde protectIOns
5 3 1 DlstnbutiOn Transformer Loss
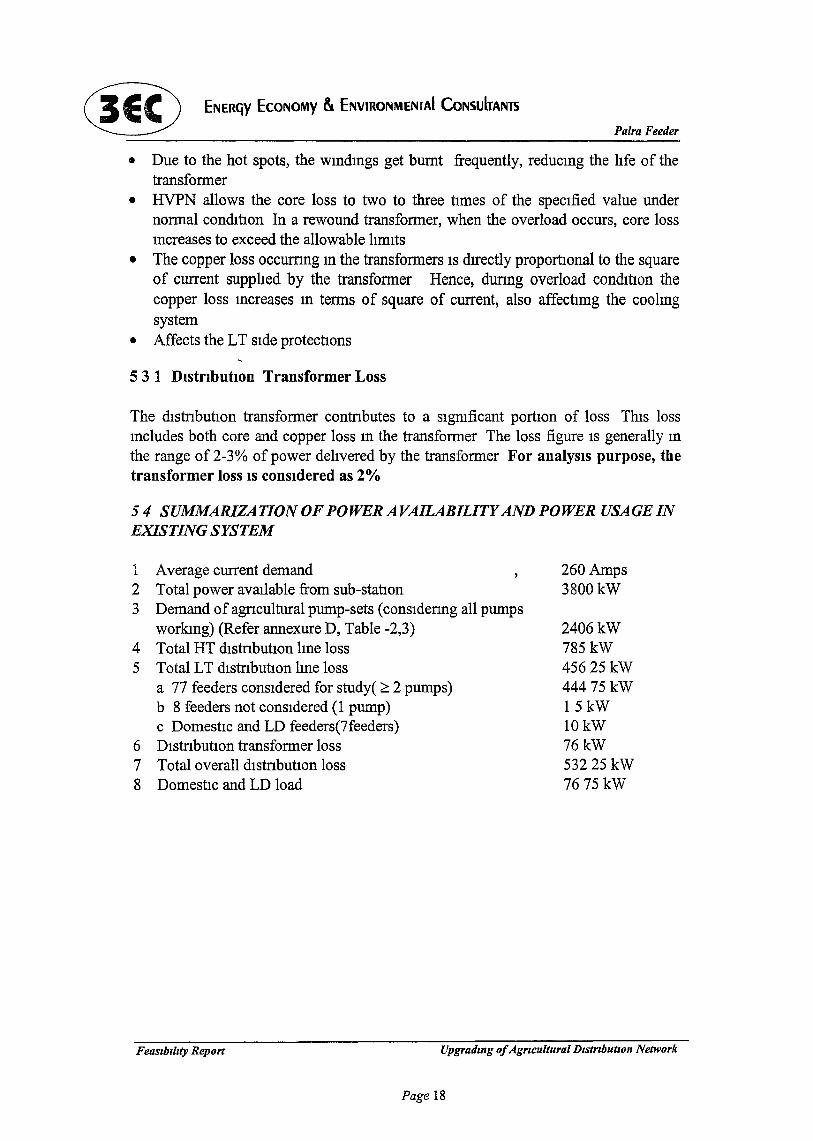
The dIstributIOn transfonner contributes to a SIgnIficant portIOn of loss ThIs lossmcludes both core and copper loss m the transfonner The loss figure IS generally mthe range of 2-3% of power delIvered by the transfonner For analySIS purpose, thetransformer loss IS consIdered as 2%
54 SUMMARIZATION OF POWER AVAILABILITYAND POWER USAGE INEXISTING SYSTEM
1 Average current demand2 Total power avaIlable from sub-statIon3 Demand of agncultural pump-sets (considenng all pumps
workIng) (Refer annexure D, Table -2,3)4 Total HT dIstnbutIOn lme loss5 Total LT dIstributIOn lIne loss
a 77 feeders consIdered for study( ;;::: 2 pumps)b 8 feeders not consIdered (1 pump)c DomestIc and LD feeders(7feeders)
6 DIstributIOn transfonner loss7 Total overall dIstnbutlon loss8 DomestIC and LD load
260 Amps3800kW
2406kW785kW45625 kW44475 kW15kW10kW76kW53225 kW7675 kW
Feaszbzllty Report Upgradmg ofAgricultural Dzstrlbutlon Network
Page 18
~ ENERGY ECONOMY &. ENVIRONMENtAl CoNSUltANtS
CHAPTER 6
6. PROPOSED OPTIONS
Palra Feeder
After the completIon of the field survey the, optIOns for bndgmg the gap betweendemand and avaIlabIlIty were amved for LT dIstnbutIOn network, HT dIstnbutIOnnetwork and Pumpmg system
61 LTDISTRIBUTION NETWORK,
FIVe optIOns were proposed for upgradmg the LT dIstnbutIOn network The fiveproposed optlOns are the followmg
I LT less system wIth smgle-phase 11 % 4 kV pole mounted transformer2 LT less system WIth three-phase 11 0/3 3/0 4 kV pole mounted transformer3 LT less system wIth three-phase 11 010415 kV, 15/25/40 kVA pole mounted
transformer4 CentralIzed transformer as at present but wIth relocatlOn and radIal feeders5 Connectmg two or three pumps to a common 11 0/0415 kV, 25 kVA pole
mounted transformer
OptIons 1, 2 and 4 were conSIdered and dIscussed wIth the HVPN and dropped But 3,and 5 optIons were analysed m detaIl
Each of the proposed optIOns are descnbed m the followmg sectIOns
611 LT Less System with Three-Phase 11 0/0415 kV Pole MountedTransformer
In tills optlOn, 11 kV / 415 V wIth a tap changer of450 V, 15/25/40 kVA mamtenancefree transformers WIll be mstalled mdividually at each motor end pomts Thesetransformer WIll be mounted on a pole to supply power to mdividual pump-sets
6 1 2 ConnectIOn of two or three pump-sets to 25 kVA Transformers by Methodof Groupmg
In tills optIOn, 11 kV / 415 V WIth a tap changer of 450 V, 25kVA mamtenance freetransformer WIll be mstalled to willch, two or three pump-sets WIll be connected ThIS25 kVA transformer w111 cater the load to the pump-set
The followmg table gIVes the ready ments and lIillltatIons of each of the proposedoptlOns
Feas,b,lzty Report Upgradmg ofAgTlcultural D,strlbutlOn Network
Page 19
® ENERGY ECONOMY & ENVIRONMENTAl CoNSUITAim
Palra Feeder
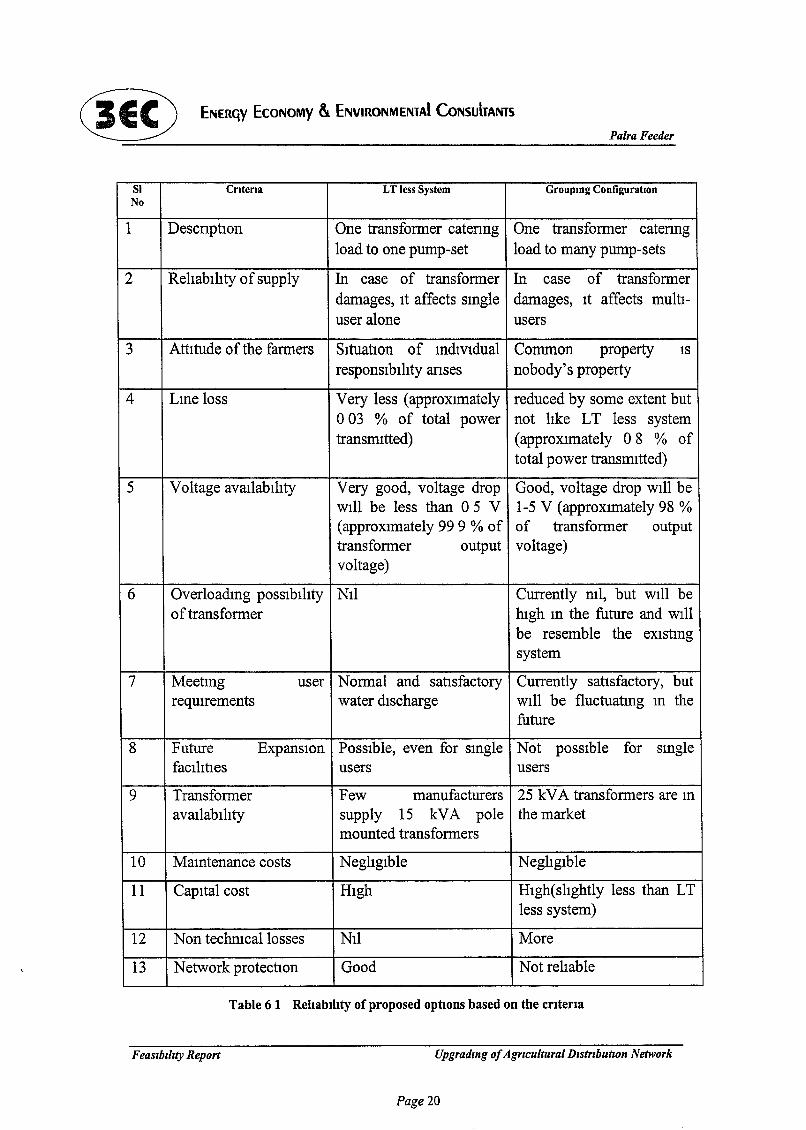
Sl CrIterIa LT less System Groupmg ConfiguratIOnNo
1 DescnptIOn One transformer catenng One transformer catenngload to one pump-set load to many pump-sets
2 RelIabilIty of supply In case of transformer In case of transformerdamages, It affects smgle damages, It affects multi-user alone users
3 AttItude of the farmers SItuatIOn of mdividual Common property ISresponslblhty anses nobody's property
4 Lme loss Very less (approxImately reduced by some extent buto03 % of total power not hke LT less systemtransmitted) (approXImately 08 % of
total power transmitted)
5 Voltage aVailabIlIty Very good, voltage drop Good, voltage drop w111 beWIll be less than 0 5 V 1-5 V (approxlmately 98 %(approXImately 99 9 % of of transformer outputtransformer output voltage)voltage)
6 Overloadmg possIbIlIty NIl Currently ml, but Will beof transformer mgh m the future and WIll
be resemble the eXIstmgsystem
7 Meetmg user Normal and satisfactory Currently satIsfactory, butreqUirements water discharge WIll be fluctuatmg In the
future
8 Future ExpanSIon POSSIble, even for SIngle Not pOSSIble for SInglefaCIlIties users users
9 Transformer Few manufacturers 25 kVA transformers are Inaval1ablllty supply 15 kVA pole the market
mounted transformers
10 Mamtenance costs NeglIgIble NeglIgIble
11 CapItal cost High HIgh(slIghtly less than LTless system)
12 Non techmcallosses NIl More
13 Network protectIOn Good Not relIable
Table 6 1 Rehablhty of proposed optIOns based on the Criteria
FeaSlblllty Report Upgradmg ofAgricultural DIstributIOn Network
Page 20
® ENERGY ECONOMY & ENVIRONMENTAl CoNsulTANB
6 1 3 AnalysIs of Proposed optIOns
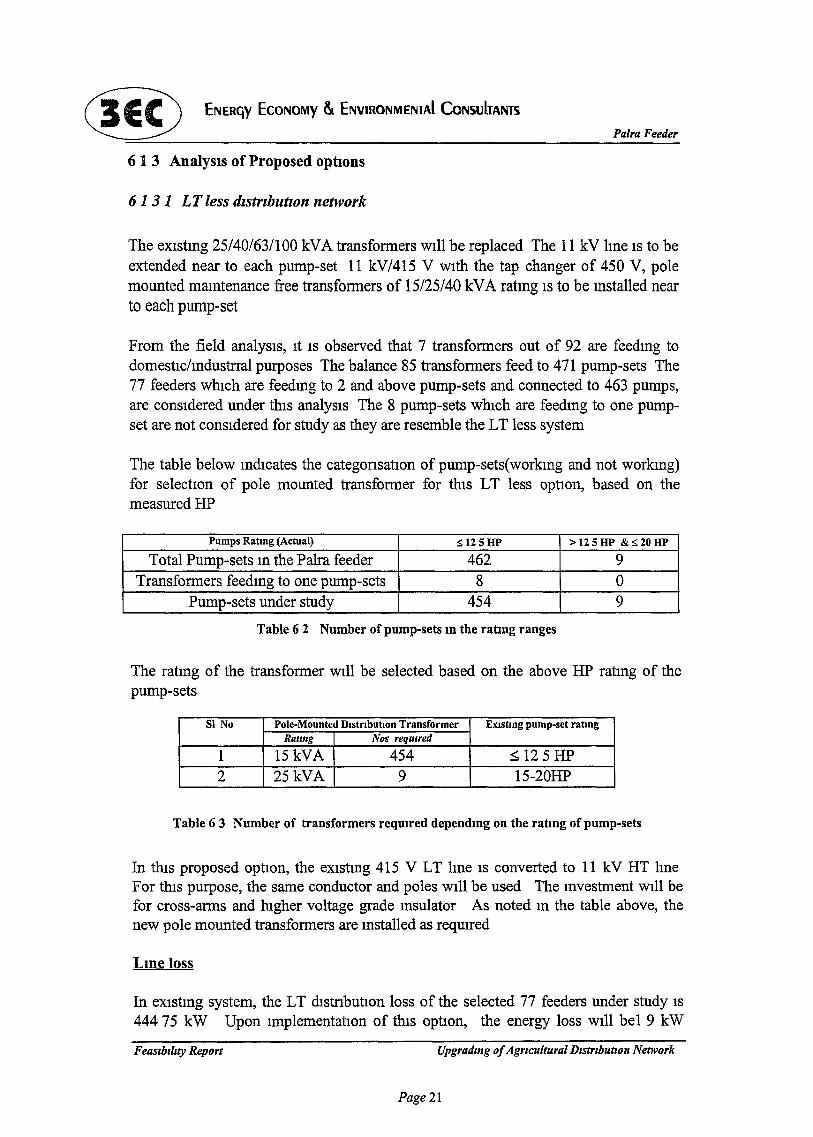
6131 LT less dIstributIOn network
Palra Feeder
The eXIstmg 25/40/63/100 kVA transfonners wIll be replaced The 11 kV lme IS to beextended near to each pump-set 11 kV/415 V WIth the tap changer of 450 V, polemounted mamtenance free transfonners of 15/25/40 kVA ratmg IS to be Installed nearto each pump-set
From the field analysIs, It IS observed that 7 transfonners out of 92 are feedmg todomestIc/mdustrral purposes The balance 85 transfonners feed to 471 pump-sets The77 feeders which are feedmg to 2 and above pump-sets and connected to 463 pumps,are consIdered under thIs analySIS The 8 pump-sets whIch are feedmg to one pumpset are not consIdered for study as they are resemble the LT less system
The table below mdicates the categonsatIOn of pump-sets(workmg and not workmg)for selectIOn of pole mounted transfonner for thIs LT less optIOn, based on themeasuredHP
Pumps Ratmg (Actual) :s;125HP >I25HP &:s;20HPTotal Pump-sets m the Palra feeder 462 9
Transfonners feedmg to one pump-sets 8 0Pump-sets under study 454 9
Table 6 2 Number of pump-sets In the ratIng ranges
The ratmg of the transfonner WIll be selected based on the above HP ratmg of thepump-sets
Sl No Pole-Mounted DIstrIbutIOn Transformer EXlstmg pump-set ratmgRatmg Nos required
1 15kVA 454 ~ 125 HP2 25kVA 9 15-20HP
Table 6 3 Number of transformers reqUIred dependIng on the ratmg of pump-sets
In thIS proposed optIon, the eXIstmg 415 V LT hne IS converted to 11 kV HT hneFor thIs purpose, the same conductor and poles WIll be used The mvestment WIll befor cross-arms and hIgher voltage grade msulator As noted m the table above, thenew pole mounted transfonners are mstalled as requIred
LIne loss
In eXIstmg system, the LT dIstnbutIon loss of the selected 77 feeders under study IS444 75 kW Upon ImplementatIon of thIs optIon, the energy loss WIll bel 9 kW
FeasIbIlIty Report Upgradmg ofAgrrcultural Dlstrlbutron Network
Page 21
~E9 ENERGY ECONOMY &. ENVIRONMENTAl CoNsuhAMS
Palra Feeder
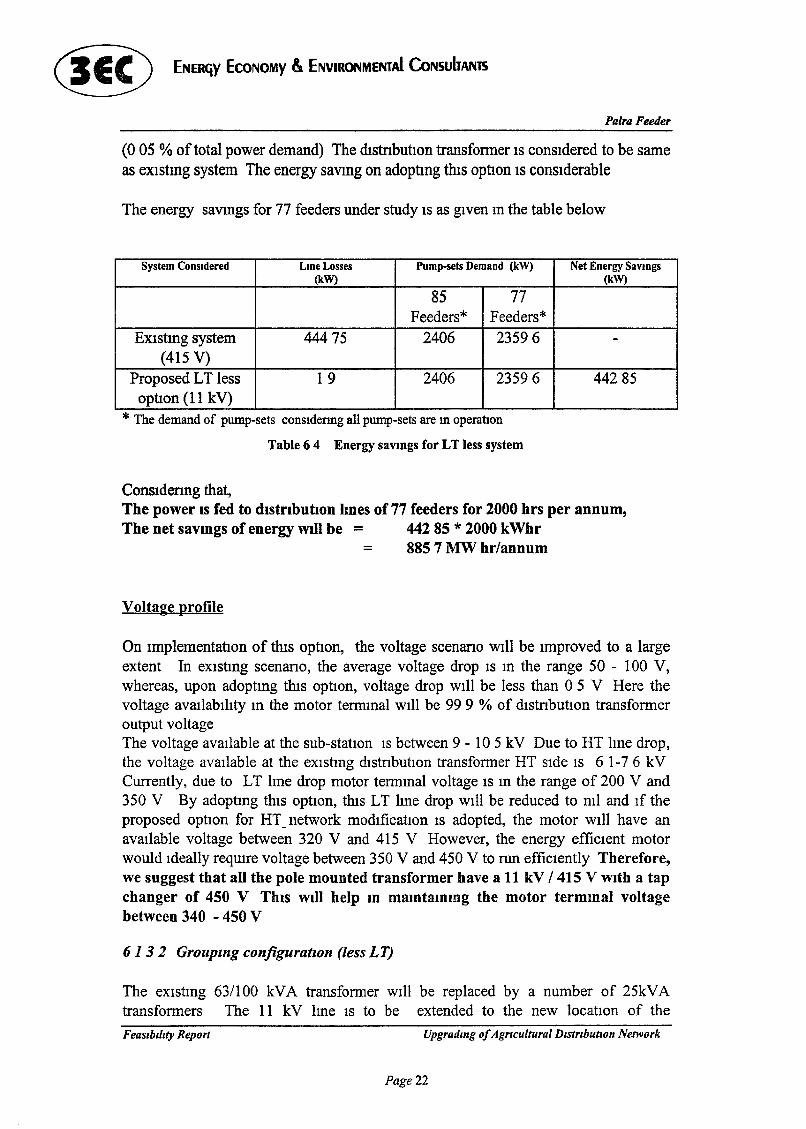
(O 05 % oftotal power demand) The dIstnbutiOn transformer IS conSidered to be sameas eXIstmg system The energy saVIng on adoptmg thIs optiOn IS conSiderable
The energy savmgs for 77 feeders under study IS as gIven m the table below
System ConSIdered LmeLosses Pump-sets Demand (kW) Net Energy SavlDgs(kW) (kW)
85 77Feeders* Feeders*
EXlstmg system 44475 2406 23596 -(415 V)
Proposed LT less 19 2406 23596 44285optiOn (II kV)
*The demand of pump-sets consldenng all pump-sets are m operanon
Table 6 4 Energy savIDgs for LT less system
Consldenng that,The power IS fed to distributIOn lmes of 77 feeders for 2000 hrs per annum,The net savmgs of energy Will be = 442 85 * 2000 kWhr
= 885 7 MW hr/annum
Voltage profile
On ImplementatIOn of thIs optIon, the voltage scenano wIll be Improved to a largeextent In eXIstmg scenano, the average voltage drop IS m the range 50 - 100 V,whereas, upon adoptmg thIs optIOn, voltage drop WIll be less than a5 V Here thevoltage avaIlabIhty m the motor termmal Will be 99 9 % of dIstnbutIOn transformeroutput voltageThe voltage aVailable at the sub-statIOn IS between 9 - 10 5 kV Due to HT hne drop,the voltage avaIlable at the eXIstmg dIstnbutIOn transformer HT SIde IS 6 1-7 6 kVCurrently, due to LT hne drop motor termmal voltage IS m the range of 200 V and350 V By adoptmg thIs optIOn, thiS LT hne drop WIll be reduced to ml and If theproposed optIOn for HT_network modIficatIOn IS adopted, the motor wIll have anavaIlable voltage between 320 V and 415 V However, the energy effiCIent motorwould Ideally reqUIre voltage between 350 V and 450 V to run effiCIently Therefore,we suggest that all the pole mounted transformer have a 11 kV I 415 V wIth a tapchanger of 450 V ThIS wIll help m mamtammg the motor termmal voltagebetween 340 - 450 V
61 3 2 Groupzng configuratIOn (less LT)
The eXIstmg 63/100 kVA transformer wIll be replaced by a number of 25kVAtransformers The 11 kV hne IS to be extended to the new locatIOn of the
Feaslbllzty Report Upgradmg ofAgrlcultural D,strlbutlOn Network
Page 22
® ENERGY ECONOMY & ENVIRONMENTAl CoNSUITANJ§
Palra Feeder
transformers where 2-3 number of pump-sets ,dependIng on HP ratIng, can be fedfrom the transformer For tlus the eXIstIng LT lIne IS to be converted to HT lIne Fortlus purpose, the same conductor and poles WIll be used The Investment WIll be forcross-arms and lugher voltage grade Insulator
In case of LT lInes, some of the eXIstIng LT hnes are reused along wIth new LT hnesthat are connected radIally The new LT lme WIll consIst of conductor, pole, msulator,cross-arm and accessones WhICh accounts for some portIOn of mvestment Themajor Investment WIll be for 25kVA transformers
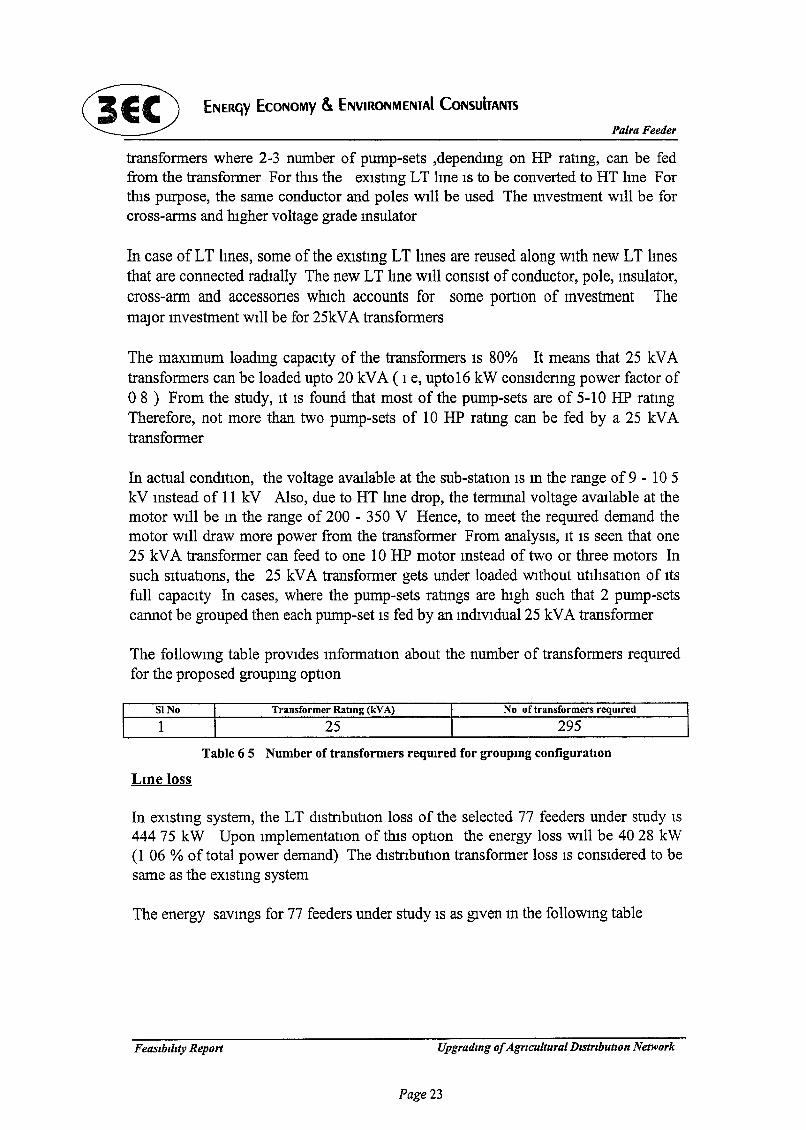
The maxImum loadmg capaCIty of the transformers IS 80% It means that 25 kVAtransformers can be loaded upto 20 kVA ( 1 e, uptol6 kW considenng power factor of08) From the study, It IS found that most of the pump-sets are of 5-10 HP ratmgTherefore, not more than two pump-sets of 10 HP ratmg can be fed by a 25 kVAtransformer
In actual condItIOn, the voltage avaIlable at the sub-statIon IS m the range of 9 - 10 5kV mstead of 11 kV Also, due to HT hne drop, the termmal voltage aVailable at themotor WIll be m the range of 200 - 350 V Hence, to meet the reqUIred demand themotor WIll draw more power from the transformer From analySIS, It IS seen that one25 kVA transformer can feed to one 10 HP motor mstead of two or three motors Insuch SItuatIOns, the 25 kVA transformer gets under loaded WIthout utIlIsatIon of Itsfull capaCIty In cases, where the pump-sets ratmgs are hIgh such that 2 pump-setscannot be grouped then each pump-set IS fed by an mdIVIdual25 kVA transformer
The followmg table prOVIdes mformatIOn about the number of transformers reqUIredfor the proposed groupmg optIon
SINo
1Transformer Ratmg (kVA)
25No of transformers reqUired
295
Lme loss
Table 6 5 Number of transformers reqmred for groupmg configuratIOn
In eXIstmg system, the LT dIstnbutIOn loss of the selected 77 feeders under study IS444 75 kW Upon ImplementatIon of tlus optIon the energy loss WIll be 4028 kW(1 06 % of total power demand) The dIstnbutIOn transformer loss IS conSIdered to besame as the eXIstmg system
The energy savmgs for 77 feeders under study IS as gIven m the followmg table
Feaslblllty Report Upgradmg ofAg71cultural Dlst71butlOn Network
Page 23
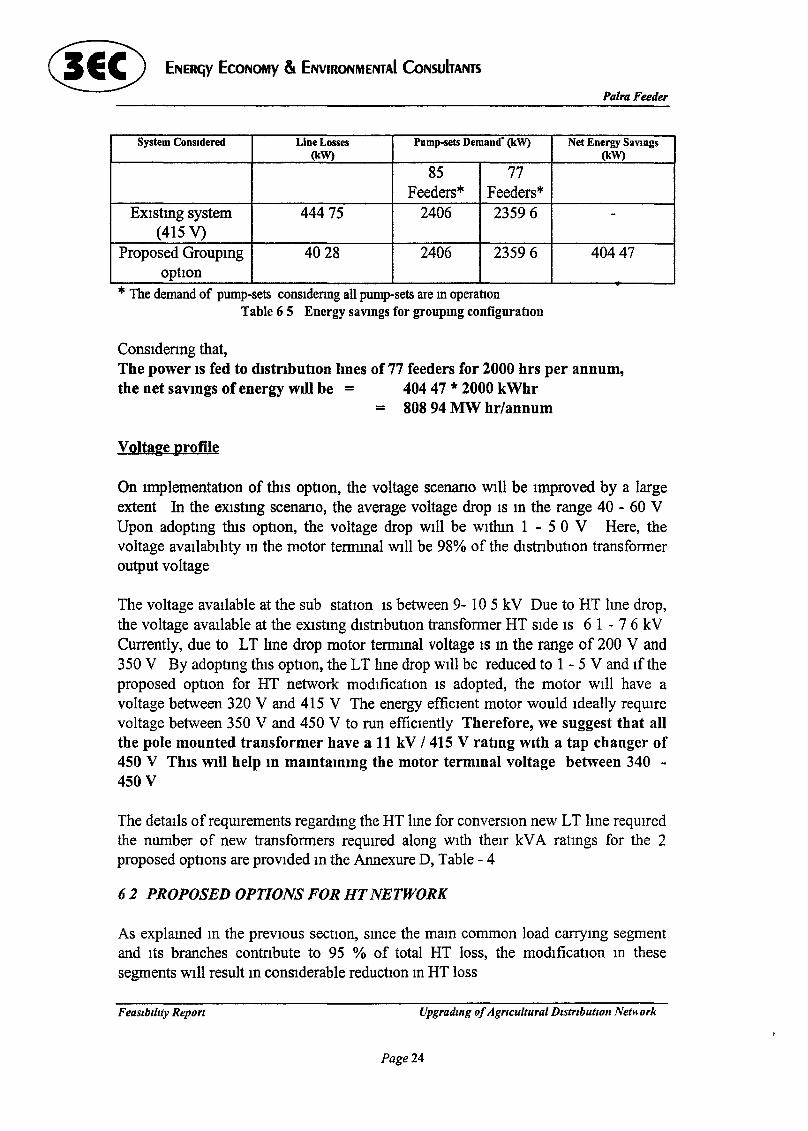
~E9 ENERGY EcoNOMy & ENVIRONMENTAl CoNsuhANTSPalra Feeder
System Considered Line Losses Pump-sets Demand (kW) Net Energy Savmgs(kW) (kW)
85 77Feeders* Feeders*
EXIstIng system 44475 2406 23596 -(415 V)
Proposed Groupmg 4028 2406 23596 40447optIon
*The demand of pump-sets cODSldenng all pump-sets are moperationTable 6 5 Energy savmgs for groupmg configuratIOn
Consldenng that,The power IS fed to distributIOn hnes of 77 feeders for 2000 hrs per annum,the net savmgs of energy will be = 404 47 * 2000 kWhr
= 808 94 MW hr/annum
Voltage profile
On ImplementatIon of thIs optIOn, the voltage scenano WIll be Improved by a largeextent In the eXlstmg scenano, the average voltage drop IS m the range 40 - 60 VUpon adoptmg thIs optIon, the voltage drop WIll be wlthm 1 - 5 0 V Here, thevoltage avallablhty m the motor termmal WIll be 98% of the dlstnbutIOn transformeroutput voltage
The voltage avaIlable at the sub statIOn IS between 9- 105 kV Due to HT hne drop,the voltage avaIlable at the eXlstmg dIstnbutIOn transformer HT SIde IS 6 1 - 76 kVCurrently, due to LT Ime drop motor termmal voltage IS m the range of 200 V and350 V By adoptmg tills optIon, the LT Ime drop WIll be reduced to 1 - 5 V and If theproposed optIOn for HT network modIficatIOn IS adopted, the motor WIll have avoltage between 320 V and 415 V The energy effiCIent motor would Ideally reqUIrevoltage between 350 V and 450 V to run effiCIently Therefore, we suggest that allthe pole mounted transformer have a 11 kV / 415 V ratmg With a tap changer of450 V ThiS will help m mamtammg the motor termmal voltage between 340 450 V
The detaIls of reqUIrements regardmg the HT Ime for converSIOn new LTIme reqUIredthe number of new transformers reqUIred along WIth theIr kVA ratmgs for the 2proposed optIOns are proVIded m the Annexure D, Table - 4
62 PROPOSED OPTIONS FOR HT NETWORK
As explamed m the prevIOUS sectIOn, smce the mam common load carrymg segmentand ItS branches contnbute to 95 % of total HT loss, the modIficatIOn m thesesegments WIll result m consIderable reductIOn m HT loss
Feaslblluy Report Upgradmg ofAgricultural Dlstrlbutwn Nernork
Page 24
® ENERGY ECONOMY & ENVIIlONMENIAI CoNsulrANlS
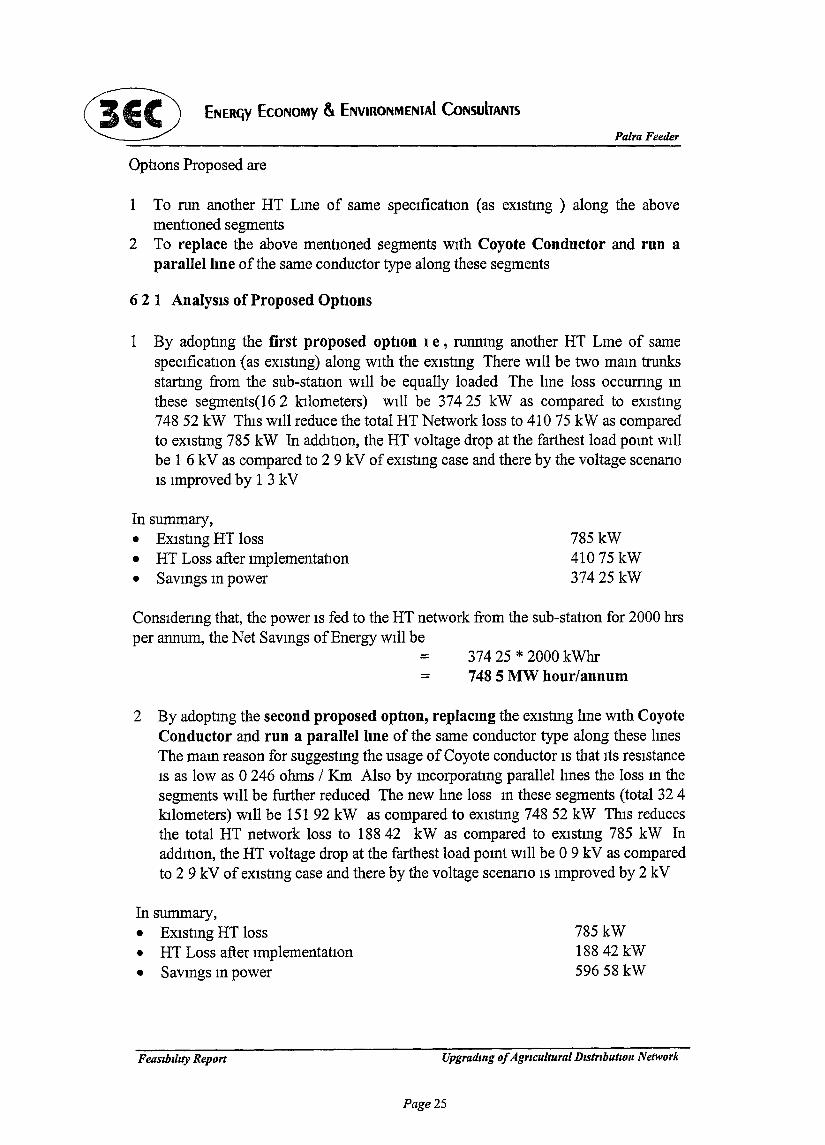
OptIons Proposed are
Palra Feeder
1 To run another HT Lme of same specIficatIon (as eXIstmg ) along the abovementIoned segments
2 To replace the above mentIOned segments wIth Coyote Conductor and run aparallellme of the same conductor type along these segments
6 2 1 AnalysIs of Proposed OptIOns
1 By adoptmg the first proposed optIOn Ie, runnmg another HT Lme of samespecIficatIOn (as eXIstmg) along wIth the eXIstmg There WIll be two mam trunksstartmg from the sub-statIon WIll be equally loaded The hne loss occumng mthese segments(162 lalometers) WIll be 37425 kW as compared to eXIstmg74852 kW ThIS WIll reduce the total HT Network loss to 410 75 kW as comparedto eXIstmg 785 kW In addItIOn, the HT voltage drop at the farthest load pomt WIllbe 1 6 kV as compared to 2 9 kV of eXIstmg case and there by the voltage scenanoIS Improved by 1 3 kV
In summary,• EXIstmg HT loss• HT Loss after ImplementatIOn• Savmgs m power
785kW410 75 kW37425 kW
Consldenng that, the power IS fed to the HT network from the sub-statIon for 2000 hrsper annum, the Net Savmgs ofEnergy WIll be
= 37425 * 2000 kWhr= 748 5 MW hour/annum
2 By adoptmg the second proposed optIOn, replacmg the eXIstmg hne wIth CoyoteConductor and run a parallel hne of the same conductor type along these hnesThe mam reason for suggestmg the usage of Coyote conductor IS that ItS resIstanceIS as low as 0 246 ohms / Km Also by mcorporatmg parallel hnes the loss m thesegments WIll be further reduced The new hne loss m these segments (total 324lalometers) WIll be 151 92 kW as compared to eXIstmg 748 52 kW ThIs reducesthe total HT network loss to 18842 kW as compared to eXlstmg 785 kW InaddItIOn, the HT voltage drop at the farthest load pomt WIll be 0 9 kV as comparedto 2 9 kV of eXIstmg case and there by the voltage scenano IS Improved by 2 kV
In summary,• EXIstmg HT loss• HT Loss after ImplementatIOn• Savmgs m power
FeaSlblllty Report
785kW18842 kW59658 kW
Upgradmg ofAgricultural DrstrlbutlOn Network
Page 25
® ENERGY ECONOMY & ENVIRONMENTAl CoNSUlTANl5
Palra Feeder
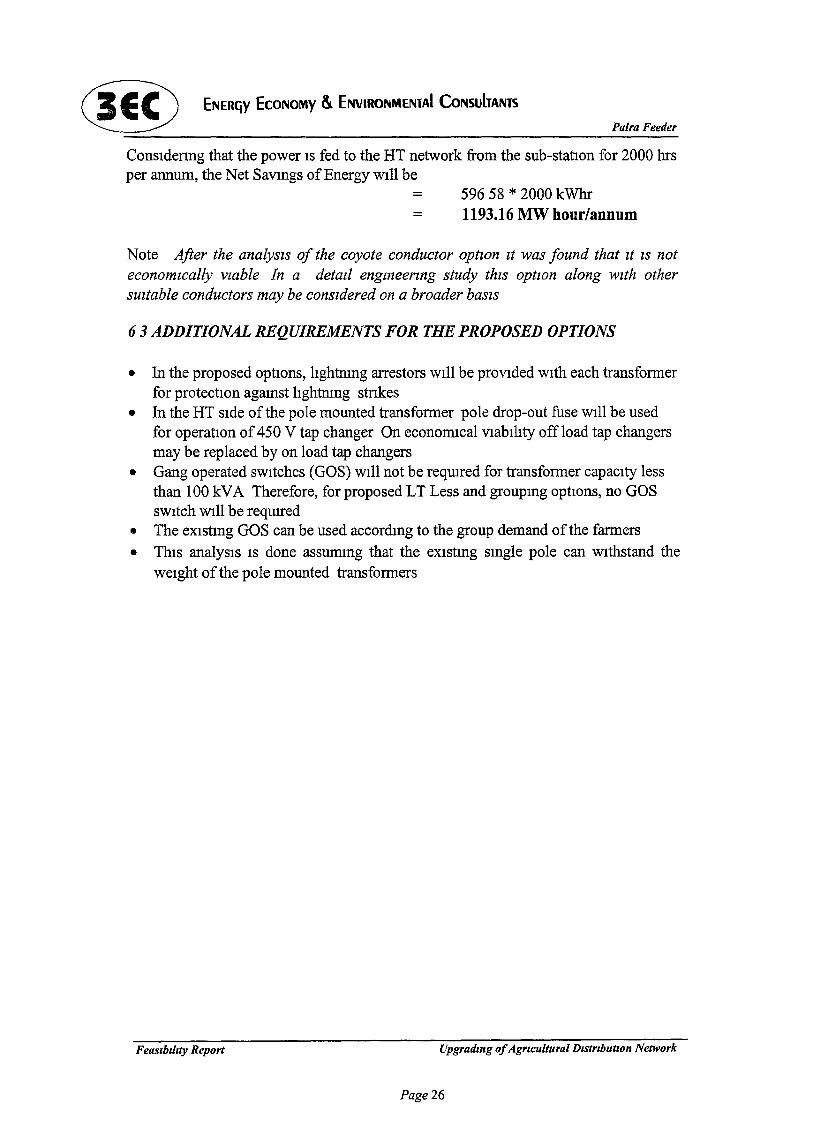
ConsIdenng that the power IS fed to the HT network from the sub-statIon for 2000 hrsper annum, the Net SavIngs ofEnergy wIll be
= 596 58 * 2000 kWhr= 1193.16 MW hour/annum
Note After the analys1s of the coyote conductor optzon 1t was found that 1t 1S noteconom1cally vzable In a detall engmeermg study th1S optzon along wzth othersUltable conductors may be cons1dered on a broader baS1S
63 ADDITIONAL REQUIREMENTS FOR THE PROPOSED OPTIONS
• In the proposed optIOns, lIghtmng arrestors wIll be provIded WIth each transformerfor protectIOn agaInst lIghtnIng strIkes
• In the HT sIde of the pole mounted transformer pole drop-out fuse WIll be usedfor operatIOn of450 V tap changer On economIcal VIabIlIty off load tap changersmay be replaced by on load tap changers
• Gang operated sWItches (GOS) WIll not be reqUIred for transformer capacIty lessthan 100 kVA Therefore, for proposed LT Less and groupmg optIOns, no GOSsWItch WIll be reqUIred
• The eXIstmg GOS can be used accordmg to the group demand ofthe farmers• ThIS analysIs IS done assumIng that the eXIstmg SIngle pole can WIthstand the
weIght ofthe pole mounted transformers
FeaSibility Report Upgradmg ofAgFlcultural DlStFlbutlon Network
Page 26
~ ENERGY ECONOMY &. ENVIRONMENTAl CoNsvlTANTS
CHAPTER 7
7. FINANCIALANALYSIS
71 UPGRADATION OF DISTRIBUTIONNETWORK
7 11 IntroductIOn
Palra Feeder
A detaIled financIal analysIs of the proposed optIOns for upgradatIOn of dIstnbutIOnnetwork by reducmg the HT and LT hne losses and ImprOVIng the voltage IS dIscussedIn thIS chapter Two optIOns each have been envIsaged In thIS report for reductIOn ofLT hne losses and reductIOn ofHT hne losses
712 LT LIne Losses
The two optIOns studIed for reductIOn ofLT LIne losses are1) LT Less System wIth three phase pole mounted transformer2) ConnectIOn oftwo or three pump sets to 25 kVA transformers by the method of
grOUpIng
Thefirst optzon envIsages InstallatIOn of 15/25 kVA maIntenance free pole mountedtransformers at each motor end pomts These transformer WIll be mounted on a poleand would supply power to mdIvIdual pump sets
The second optzon envIsages InstallatIOn of 25 kVA maIntenance free transformer towhIch two or three pump sets WIll be connected ThIS 25 kVA transformer WIll caterto the load of the pump sets
7 1 3 HT LIne Losses
It has been proposed to reduce HT LIne losses by Incorporatmg another parallel lIneWIth the eXIstIng lIne, along the common load carryIng segment where the maXImumloss occursThe optIOn proposed In thIs study IS Incorporatmg another parallel lIne WIth theeXIstmg Ime , along the common load carrymg segment where the maxImum lossoccurs ,WIth the eXIstmg type ofconductors
7 1 4 Combmed optIOns for redUCIng both LT and HT LIne losses
Based on the above , two cases for upgradatIon of dIstnbutIon network by redUCIngboth LT and HT hne losses In the system have been dIscussed finanCIally In thIschapter They are as below
Feasrbrlrty Report Upgradmg ofAgrrcultural Drstrlbutron Network
Page 27
c!E9 ENERGY ECONOMY &. ENVIRONMENTAl CoNsulTANtS
Palra Feeder
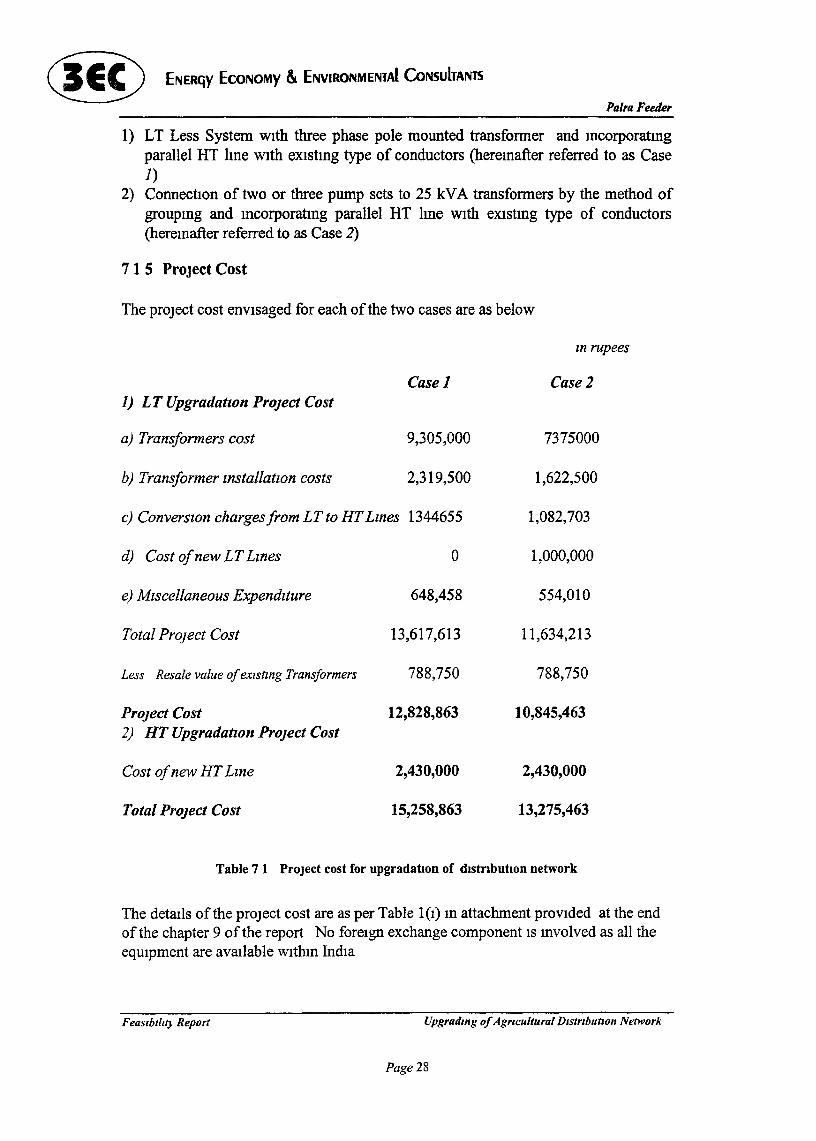
1) LT Less System wIth three phase pole mounted transfonner and IncorporatIngparallel HT lIne WIth eXIstmg type of conductors (heremafter referred to as Case1)
2) ConnectIOn of two or three pump sets to 25 kVA transfonners by the method ofgrOUpIng and mcorporatmg parallel HT lIne WIth eXIstmg type of conductors(hereInafter referred to as Case 2)
7 1 5 Project Cost
The project cost envIsaged for each of the two cases are as below
m rupees
Case 1 Casel1) LT UpgradatlOn Project Cost
a) Traflsformers cost 9,305,000 7375000
b) Transformer znstallatzon costs 2,319,500 1,622,500
c) Converszon charges from LT to HTLznes 1344655 1,082,703
d) Cost ofnew LTLznes 0 1,000,000
e) Mlscellaneous Expendlture 648,458 554,010
Total Project Cost 13,617,613 11,634,213
Less Resale value ofexlstzng Transformers 788,750 788,750
Project Cost 12,828,863 10,845,4632) HT Upgradatlon Project Cost
Cost ofnew HT Lzne 2,430,000 2,430,000
Total Project Cost 15,258,863 13,275,463
Table 7 1 Project cost for upgradatlon of dIstrIbution network
The detaIls of the project cost are as per Table 1(1) In attachment provIded at the endof the chapter 9 of the report No foreIgn exchange component IS mvolved as all theeqUIpment are avaIlable WIthIn IndIa
Feaslblllt} Report Upgradmg ofAgricultural D,strlbutlOn Network
Page2S
~E9 ENERGY ECONOMY 6. ENVIRONMENTAl CoNSUIrANTS
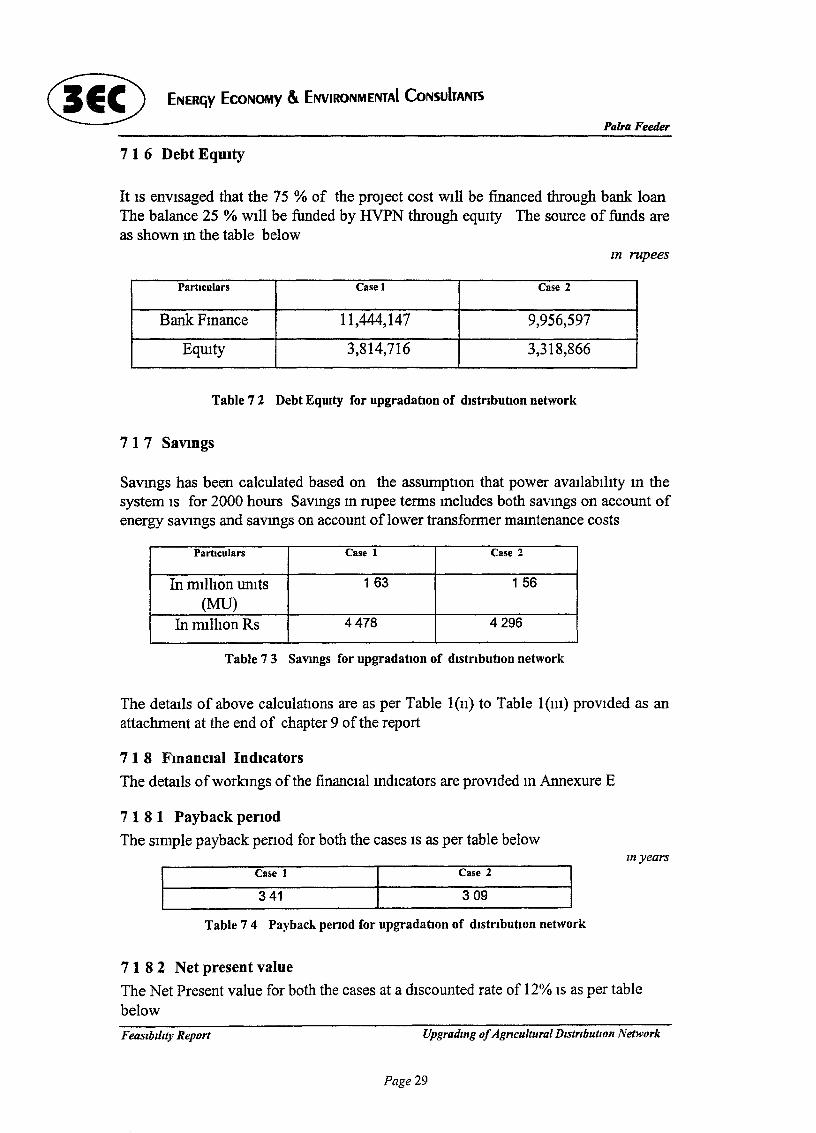
7 1 6 Debt Equity
Palra Feeder
It IS envIsaged that the 75 % of the project cost wIll be financed through bank loanThe balance 25 % wIll be funded by HVPN through eqUIty The source of funds areas shown In the table below
In rupees
PartIculars Case 1 Case 2
Bank FInance 11,444,147 9,956,597
EqUIty 3,814,716 3,318,866
Table 7 2 Debt EqUIty for upgradatlon of distribution network
71 7 Savmgs
SaVIngs has been calculated based on the assumptIon that power avaIlabIlIty In thesystem IS for 2000 hours SavIngs In rupee tenns Includes both saVIngs on account ofenergy saVIngs and saVIngs on account of lower transformer maIntenance costs
PartIculars Case 1 Case 2
In mIllIon umts 163 156
(MU)In mIllIon Rs 4478 4296
Table 7 3 Savmgs for upgradatlOn of distributIOn network
The detaIls of above calculations are as per Table l(n) to Table l(m) provIded as anattachment at the end of chapter 9 ofthe report
7 1 8 FmancIaI IndicatorsThe detaIls of worlangs of the finanCIal IndIcators are provIded In Annexure E
7 1 8 1 Payback periodThe SImple payback penod for both the cases IS as per table below
myearsCase 1
341
Case 2
309
Table 7 4 Payback period for upgradatlon of distributIOn network
7 1 8 2 Net present valueThe Net Present value for both the cases at a dIscounted rate of 12% IS as per tablebelow
FeaSibility Report Upgradmg ofAgTlcultural D,stTlbutwn Network
Page 29
® ENERGY ECONOMY &. ENVIRONMENTAl CoNsulTANTS
Palra Feeder
955 1034
m m,ll,on rupeesr-------C~a-se~l -----...---------,c"""'as-e""""2-----\
Table 7 5 Net Present Value (NPV) for upgradatIon of dIstrIbutIOn network
7 1 8 3 Internal Rate of Return
The Internal Rate ofReturn for both the cases are as per table
Case 1 Case 2
26% 29%
Table 7 6 Internal Rate of Return for upgradatlOn of dIstributIOn network
7 1 8 4 Debt Service Coverage RatIO
The DSCR for both the cases are as per table below
Case 1 Case 2
332 334
Table 7 7 Debt ServIce coverage RatIo for upgradatlon of dIstrIbutIon network
The DSCR IS well above the reqUIred nonns of 2 m both the cases
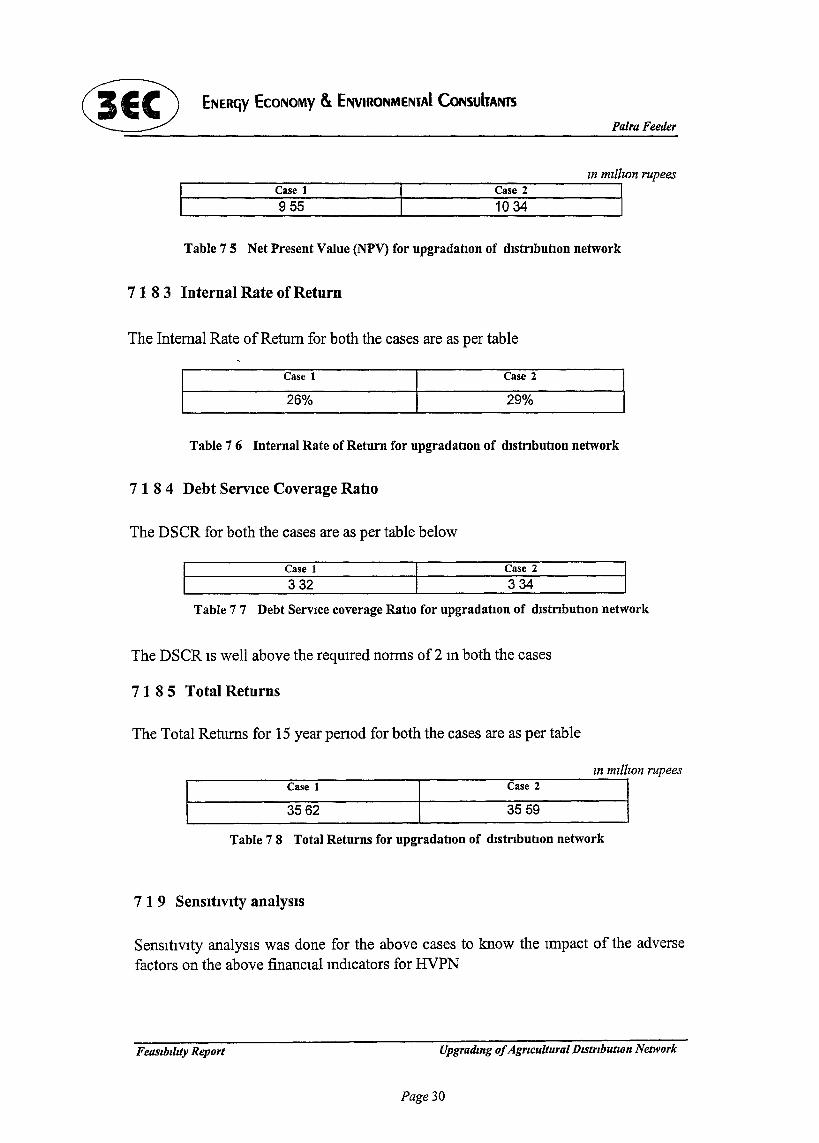
7185 Total Returns
The Total Returns for 15 year penod for both the cases are as per table
1- c_a_se_l -II- c ....as_e_2 m_m_dllzon rupees
3562 3559.
Table 7 8 Total Returns for upgradatlOn of dIstrIbutIOn network
7 1 9 Sensitivity analysIs
SenSItivIty analySIS was done for the above cases to know the Impact of the adversefactors on the above finanCIal mdicators for HVPN
Feas,b,lzty Report Upgradmg ofAgrzcultural Dzstrlbutlon Network
Page 30
ENERGY ECONOMY &ENVIRONMENTAl CoNSULTANTS
Palra Feeder
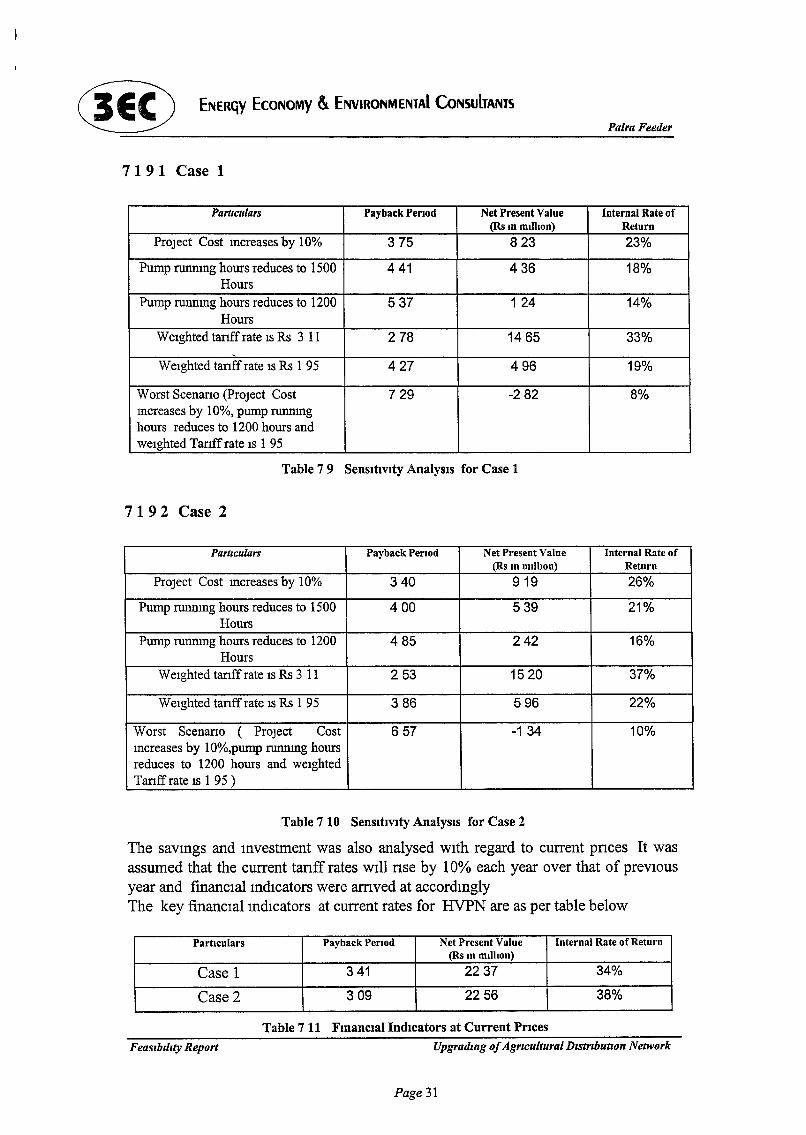
7191 Case 1
PartIculars Payback Period Net Present Value Internal Rate of(Rs In mllhon) Return
PrOject Cost mcreases by 10% 375 823 23%
Pump nmnmg hours reduces to 1500 441 436 18%Hours
Pump runnmg hours reduces to 1200 537 1 24 14%Hours
Weighted tanff rate IS Rs 3 11 278 1465 33%,
Weighted tanffrate IS Rs 1 95 427 496 19%
Worst Scenano (Project Cost 729 -282 8%mcreases by 10%, pump nmnmghours reduces to 1200 hours andweighted Tanff rate IS 1 95
Table 7 9 SensltlVlty AnalysIs for Case 1
7192 Case 2
Particulars Payback Period Net Present Value Internal Rate of(Rs In million) Return
PrOject Cost mcreases by 10% 340 919 26%
Pump nmnmg hours reduces to 1500 400 539 21%Hours
Pump runnmg hours reduces to 1200 485 242 16%Hours
Weighted tanff rate IS Rs 3 11 253 1520 37%
Weighted tanffrate IS Rs 1 95 386 596 22%
Worst Scenano ( Project Cost 657 -1 34 10%mcreases by 10%,pump runnmg hoursreduces to 1200 hours and weightedTanff rate IS 1 95 )
Table 710 SensltlVlty AnalysIs for Case 2
The saVIngs and Investment was also analysed WIth regard to current pnces It wasassumed that the current tanff rates wIll nse by 10% each year over that of prevIOusyear and financIal IndIcators were arnved at accordInglyThe key financIal IndIcators at current rates for HVPN are as per table below
Particulars Payback Period Net Present Value Internal Rate of Return(Rs In million)
Case 1 341 2237 34%
Case 2 309 2256 38%
Table 7 11 Fmanclal Indicators at Current Prices
Feaslbillty Report Upgradmg ofAgrIcultural DlstrlbutlOn Network
Page 31
~ ENERGY EcoNOMY &. ENVIRONMENTAl CoNsUlTANTS
CHAPTERS
8. RECOMMENDED SOLUTIONS
Palra Feeder
After analysIng the eXIstIng HT and LT dIstrIbutIOn network, the solutIOns arerecommended to Improve the present scenano ThIs chapter dIscusses m bnef, themodIficatIOns reqUIred for the recommended solutIOns and benefits that can beobtamed to the HVPN m terms ofenergy savmgs
8 1 LT DISTRIBUTIONNETWORK
The technIcal and financIal analysIs have been done for the dIfferent proposed optIOnsfor the LT dIstnbutIOn network From the analysIs, It IS found that the proposed optIOnof' LT less system WIth three phase llkV / 415 V WIth a tap changer of 450 V,mamtenance free pole mounted transformer, IS appropnate for Palra feeder
ModIficatIOns to EXIstmg System
Some modIficatIOns to the eXIstmg system are reqUIred for effectIve ImplementatIOnofthe proposed solutIOn These modIficatIOns are ,• The removal of eXIstmg 11 kV / 415 V, 100 kVA, 63 kVA, 25 kVA, dIstrIbutIOn
transformers connected to two or more pumps• Extendmg the 11 kV HT hnes upto the pole WhICh IS closest to each motor end
pornt• AddItion of stram and pm msulators of 12 kV voltage grade• ExtenSIOn ofthe pole top and WIdth ofthe cross-ann• InstallatIOn of 463 numbers of 11 kV / 415 V WIth a tap changer of 450 V
mamtenance free pole mounted transformers of vanous ratmg of 15/25/40 kVAnear each motor end
• SUItable arrangement for fiXIng the pole mounted transformer
As per the financial analysIs, dIscussed m Chapter 7, the totalmvestment WIll be Rs1283 mIllIon
Benefits
By Implementmg thIs recommended solutIOn, the HVPN and the fanners WIll bebenefited m many ways
A HVPN
• ReductIOn of huge amount of lIne loss from 444 75 kW to 1 9 kW per hour• The HVPN can save 0 886 MU of energy per annum
FeasIbIlity Report Upgradmg ofAgricultural DIstribution Network
Page 32
Palra Feeder
• MaIntenance work WIll be reduced to a great extent as the transfonners wIll be ofmamtenance free type
• The faIlure rate of the transfonner wIll be reduced as the transfonners wIll be newand good quahty
• The future extensIOn of the network wIll be easIer as the 11 kV lme can beextended by takIng a tap from the tennmatlon pomt of the HT lme
• The HVPN can gaIn a lot m tenns of money by supplymg the saved energy toother revenue earnmg sectors
B Farmers
• Quahty power WIll be aVaIlable at the motor tennmal as the LT lme drop can beelImmated almost completely
• As the aVaIlable voltage at the motor tennmal WIll be Improved a lot mcompanson to the present scenano, the pump can run effiCIently
• OptImum ImgatIOn practIces can be encouraged among the fanners• Pump-sets mamtenance reqUlrement wIll be reduced
82 HT DISTRIBUTIONNETWORK
Another recommendatIOn IS for modIficatIOn of HT network m whIch another parallelnew lIne of 162 km (as dIscussed In Chapter 6), startmg from the sub-statIon end IS
requIred to be drawn along WIth the eXIstIng lme
ModIficatIon to EXlstmg System
• A new 11 kV lme of 162 km length WIll be reqUlred• To draw the above mentIOned lIne, conductor, poles, cross-anus, and 12 kV grade
pm and stram msulators WIll be requIred
As per the financIal analYSIS, dIscussed In Chapter 7, the totalmvestment WIll be Rs243 mIllIon
Benefits
• There WIll be Improvement In HT voltage scenano ReductIon In HT hne lossfrom 785 kW to 410 75 kW per hour
• The savmgs of energy to HVPN, after adoptmg thIs, WIll be 0 749 MUper annum
83 BENEFITS BYADOPTING THE RECOMMENDATIONS FOR BOTH LTAND HT NETWORK
Thus, by nuplementmg the recommended solutIOns for both LT and HT network,HVPN can save upto 1 634 MU of energy per annum
Feasibility Report Upgradmg ofAgncultural DistributIOn Network
Page 33
® ENERGY ECONOMY & ENVIRONMENTAl CoNSUITANIS
84 TECHNICAL MERITS OF LTLESS OVER GROUPING
Palra Feeder
• In the proposed LT less, each pump-sets IS fed by a sIngle transformer, whereas IngrOUpIng one to three pump-sets wIll be fed from a sIngle transformer
• In case of future demands, under the LT less 11 kV hnes can be extended to meetthe new demand POInts Whereas m case of groupmg the farmers may tend to takethe hne connectIOn from the eXIstmg transformers mstead of drawmg new 11 kVhne for theIr pump-sets
• The Irregular hne lengths drawn m case of groupmg leads to further mcrease mhne loss and voltage drop In case of the LT less optIOn the transformers WIll belocated near to each motor end pomts, hence, hne losses and voltage drop areneghgIble
• In case of LT less, the charge of the transformer hes m the hands of the farmersHence, the farmers WIll be conscIOUS about the loadmg of the transformerWhereas In the grOUpIng optIon mdIvIdual farmers WIll be careless of theoverloadIng condItIon There IS every pOSSIbIlIty that the transformer getsoverloaded
8 5 CONCLUSION
The study as clearly brought out techmcal and economIC vIabIhty of completeupgradIng of the eXIstIng dIstnbutIon network to a LT less dIstnbutIOn network alongWIth the proposed modIficatIOn for HT network The energy savmgs that are realIsedfrom tills upgradIng IS 1634 2 MWhr per annum for an mvestment of Rs 15 26MIllIon In addItIon, HVPN WIll have a monetary savmgs of Rs 4 48 MIllIonFurther, the farmers wIll be ensured a good qualIty ofmput power to theIr pump-sets
FeaSibility Report Upgradmg ofAgTlcultural DlStrlbutlOn Network
Page 34
® ENERGY ECONOMY &. ENVIRONMENtAl CONSlJIrANB
CHAPTER 9
9. IMPLEMENTATION
Palra Feeder
From the analysIs of the two optIons for LT dlstnbutlOn network, It IS seen that bothLT less and Groupmg optIons are financIally more or less SImIlar Therefore, It ISsuggested that both the opttons be tmplemented on two dIfferent feeders fordemonstratlOn purposes ThIS wIll help m selectmg the better optlOn afterImplementatlOn
Detatled engmeenng IS necessary as the next step before Implementmg thedemonstratlOn proJects
\
FeaSlbllzty Report Upgradzng ofAgrzcultural Dlstrlbutzon Network
Page 35
Palra Feeder
ATTACHMENT
i) Project Cost
a) LTLess System
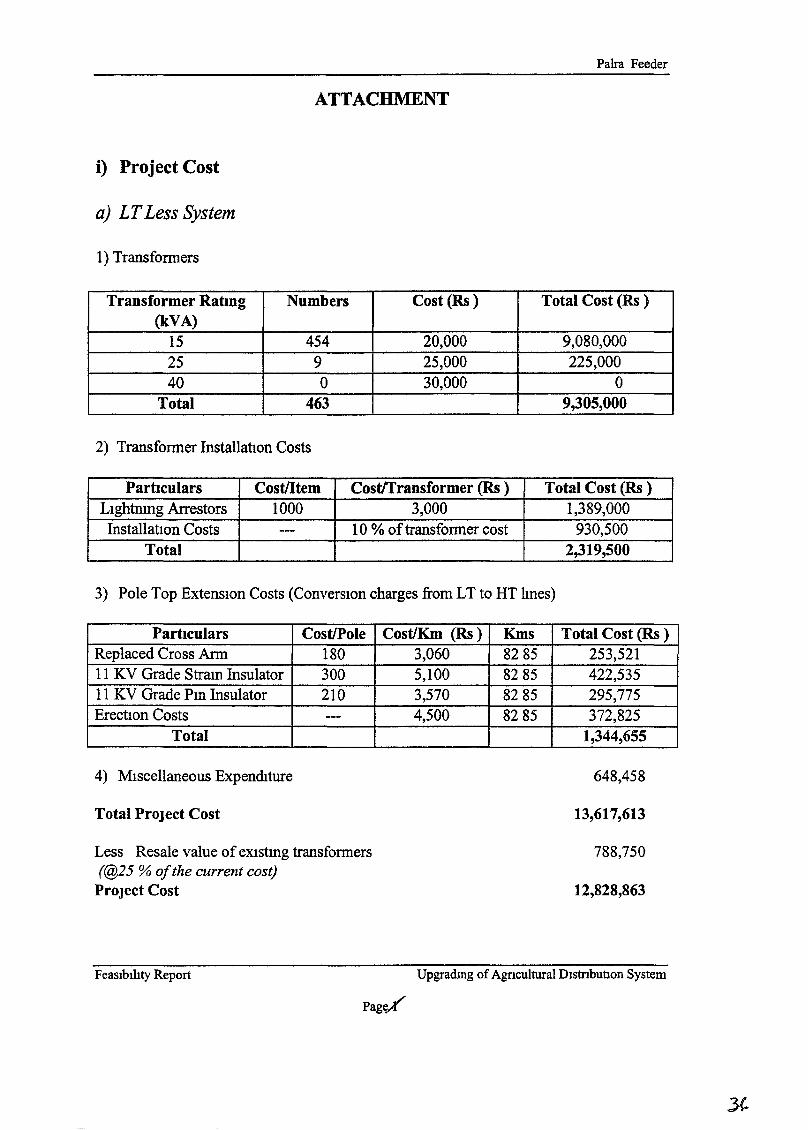
1) Transformers
Transformer Ratmg Numbers Cost (Rs) Total Cost (Rs )(kVA)
15 454 20,000 9,080,00025 9 25,000 225,00040 0 30,000 0
Total 463 9,305,000
2) Transformer InstallatIon Costs
PartIculars Cost/Item CostlTransformer (Rs ) Total Cost (Rs )LIghtnmg Arrestors 1000 3,000 1,389,000InstallatIon Costs --- 10 % of transformer cost 930,500
Total 2,319,500
3) Pole Top ExtenSIon Costs (ConversIon charges from LT to HT hnes)
PartIculars CostIPole CostJKm (Rs) Kms Total Cost (Rs)Replaced Cross Ann 180 3,060 8285 253,52111 KV Grade Stram Insulator 300 5,100 8285 422,53511 KV Grade Pm Insulator 210 3,570 8285 295,775ErectIon Costs --- 4,500 8285 372,825
Total 1,344,655
4) MIscellaneous ExpendIture
Total Project Cost
Less Resale value of eXIstmg transformers(@25 % a/the current cost)Project Cost
FeaSIbIlIty Report
Pag~
648,458
13,617,613
788,750
12,828,863
Upgradmg of Agncultural Dlstnbutlon System
Palra Feeder
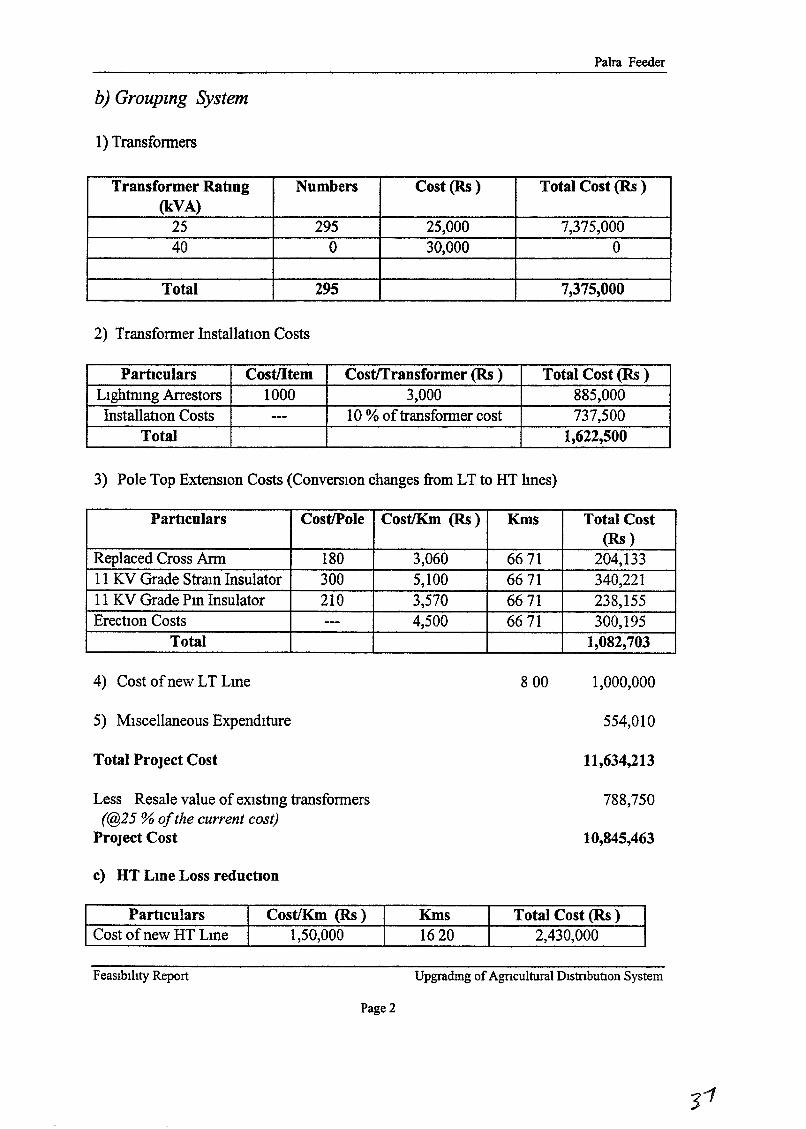
b) Groupzng System
1) Transfonners
Transformer RatIng Numbers Cost (Rs) Total Cost (Rs )(kVA)
25 295 25,000 7,375,00040 0 30,000 0
Total 295 7,375,000
2) Transfonner Installation Costs
Particulars CostlItem Cost/Transformer (Rs ) Total Cost (Rs )Lightmng Arrestors 1000 3,000 885,000Installation Costs --- 10 % oftransfonner cost 737,500
Total 1,622,500
3) Pole Top ExtenSIOn Costs (ConverSIOn changes from LT to HT hnes)
Particulars CostIPole CostlKm (Rs) Kms Total Cost(Rs)
Replaced Cross Arm 180 3,060 6671 204,13311 KV Grade Stram Insulator 300 5,100 6671 340,22111 KV Grade Pm Insulator 210 3,570 6671 238,155ErectIon Costs --- 4,500 6671 300,195
Total 1,082,703
4) Cost ofnew LT Lme
5) MIscellaneous ExpendIture
Total Project Cost
Less Resale value of eXIstmg transformers(@25 % ofthe current cost)
Project Cost
c) HT Lme Loss reductIOn
800 1,000,000
554,010
11,634,213
788,750
10,845,463
Particulars CostlKm (Rs) Kms Total Cost (Rs )Cost ofnew HT Lme 1,50,000 1620 2,430,000
FeaSlblhty Report
Page 2
Upgrading of Agncultural Dlstnbutlon System
Palra Feeder
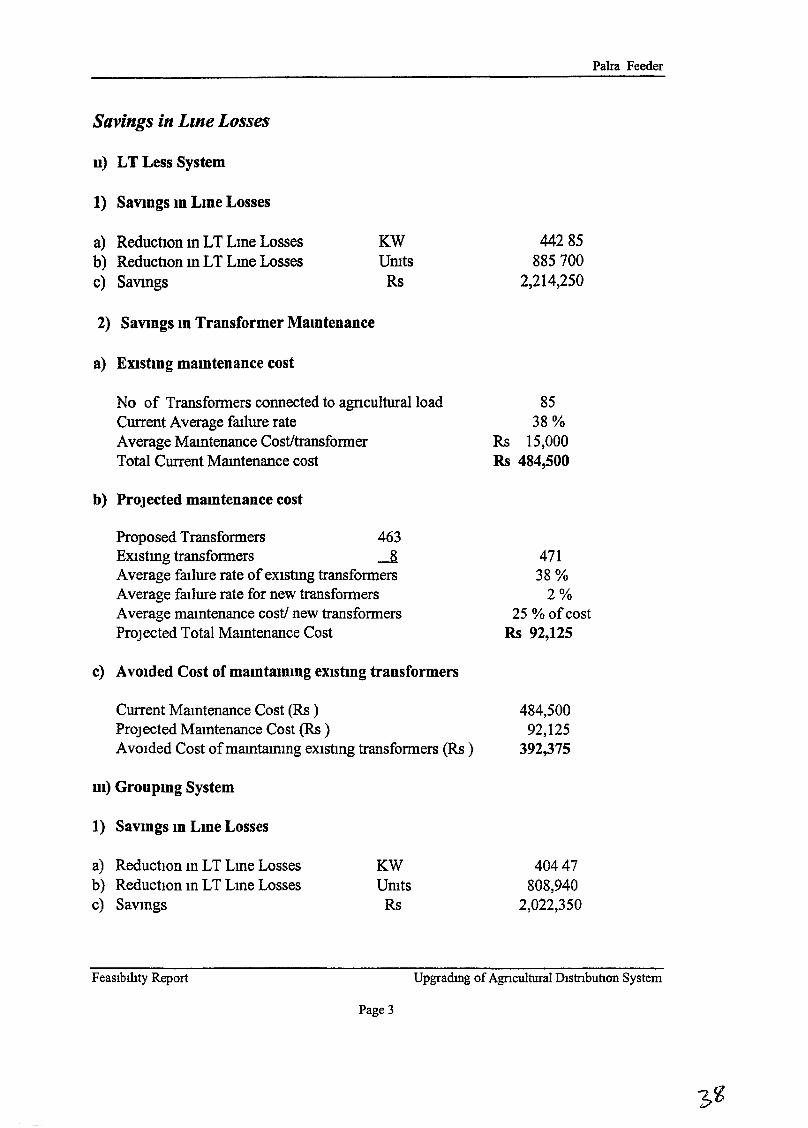
Savings in Lme Losses
n) LT Less System
1) Savmgs m Lme Losses
a) ReductIon m LT Lme Lossesb) ReductIon m LT Lme Lossesc) Savmgs
2) Savmgs m Transformer Mamtenance
a) Enstmg mamtenance cost
KWUmts
Rs
44285885700
2,214,250
No of Transfonners connected to agnculturalloadCurrent Average faIlure rateAverage Mamtenance Cost!transfonnerTotal Current Mamtenance cost
b) Projected mamtenance cost
Proposed Transfonners 463EXIstmg transfonners .-8Average faIlure rate ofeXIstIng transfonnersAverage faIlure rate for new transfonnersAverage maIntenance cost! new transfonnersProjected Total Mamtenance Cost
c) AVOided Cost of mamtammg eXIsting transformers
Current Mamtenance Cost (Rs )Projected Mamtenance Cost (Rs )AVOIded Cost ofmamtaImng eXIstmg transfonners (Rs )
Ill) Groupmg System
1) Savmgs lD Lme Losses
8538%
Rs 15,000Rs 484,500
47138%
2%25 % ofcost
Rs 92,125
484,50092,125
392,375
a) ReductIon In LT Lme Lossesb) ReductIOn In LT Lme Lossesc) Savmgs
Feasibility Report
KWUmts
Rs
Page 3
40447808,940
2,022,350
Upgradmg ofAgncultural DIstnbution System
Palra Feeder
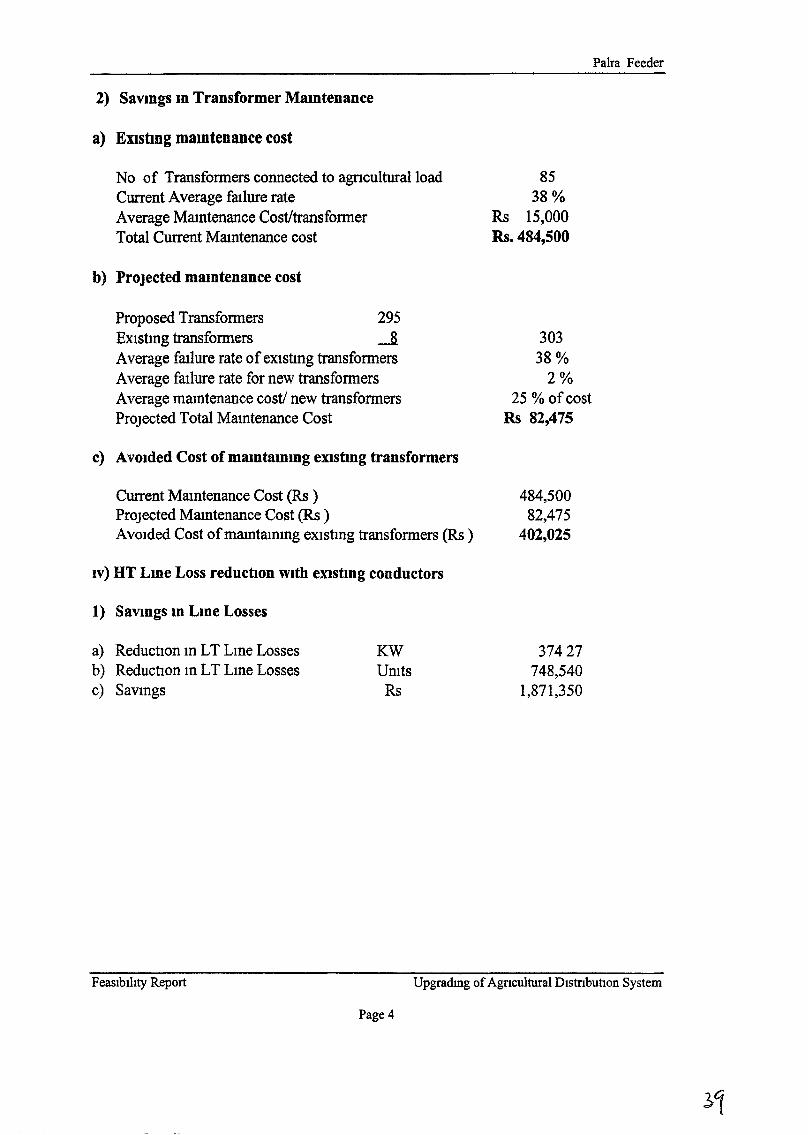
2) SavIngs In Transformer MaIntenance
a) Enstmg mamtenance cost
No of Transformers connected to agnculturalloadCurrent Average faIlure rateAverage Mamtenance Cost/transformerTotal Current MaIntenance cost
b) PrOjected maIntenance cost
Proposed Transformers 295EXIstmg transformers -8.Average faIlure rate ofeXIstmg transformersAverage failure rate for new transformersAverage mamtenance cost/ new transformersPrOjected Total Mamtenance Cost
c) AVOIded Cost ofmamtammg eXlstmg transformers
Current MaIntenance Cost (Rs )PrOjected Mamtenance Cost (Rs )AVOIded Cost ofmamtammg eXIstmg transformers (Rs)
IV) HT Lme Loss reductIOn with eXlstmg conductors
1) Savmgs m Lme Losses
8538%
Rs 15,000Rs.484,500
30338%
2%25 % ofcost
Rs 82,475
484,50082,475
402,025
a) ReductIon m LT Lme Lossesb) ReductIon m LT Lme Lossesc) Savmgs
FeaSIbIlity Report
KWUmtsRs
Page 4
37427748,540
1,871,350
Upgradmg ofAgncultural DIstnbutIon System

ANNEXURES
ANNEXURE-A
MODEL DATA SHEET
ttl
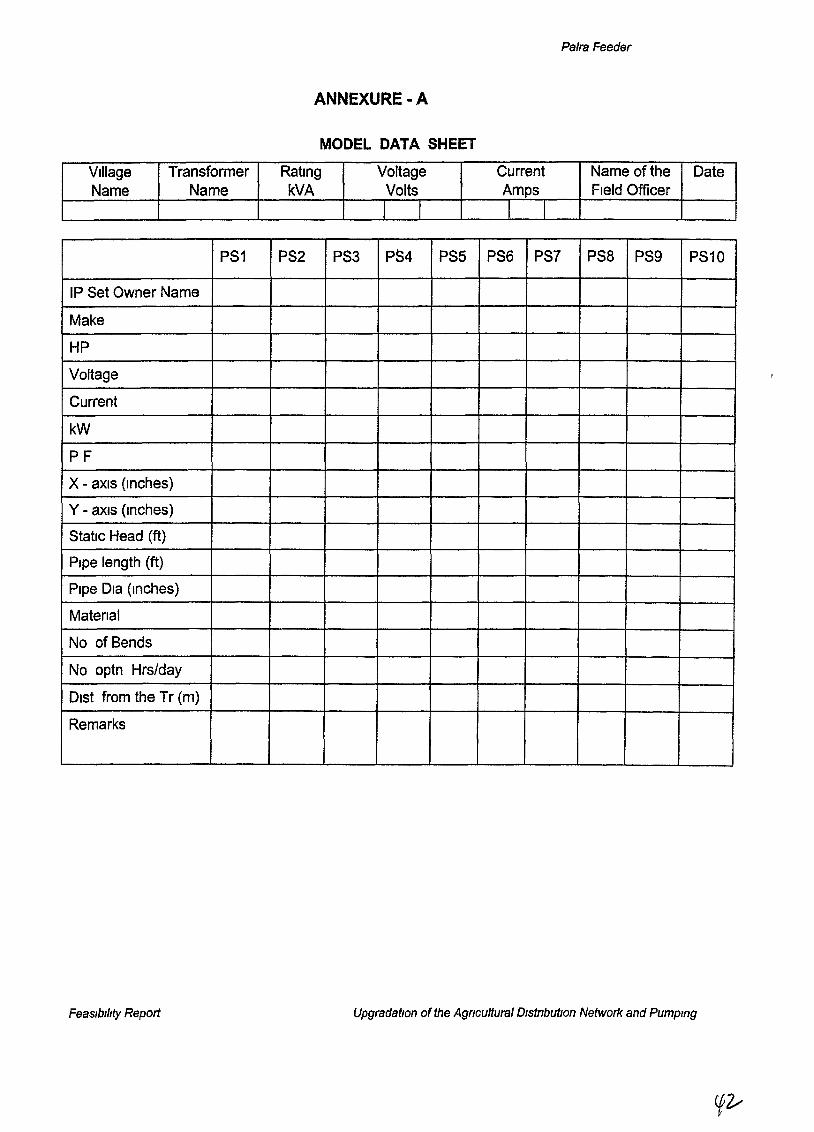
Palra Feeder
ANNEXURE -A
MODEL DATA SHEET
Village Transformer Rating Voltage Current Name of the DateName Name kVA Volts Amps Field Officer
I I I I
PS1 PS2 PS3 PS4 PS5 PS6 PS7 PS8 PSg PS10
IP Set Owner Name
Make
HP
Voltage
Current
kW
PF
X - aXIs (Inches)
Y-axIs (Inches)
Static Head (ft)
Pipe length (ft)
Pipe Dla (Inches)
Matenal
No of Bends
No optn Hrs/day
Dlst from the Tr (m)
Remarks
FeaSibIlity Report Upgradatlon of the Agncultural DistributIon Network and Pumpmg
ANNEXURE-B
DETAILS OF FIELD OBSERVED ELECTRICAL DATA
FOR MOTOR PUMPSETS
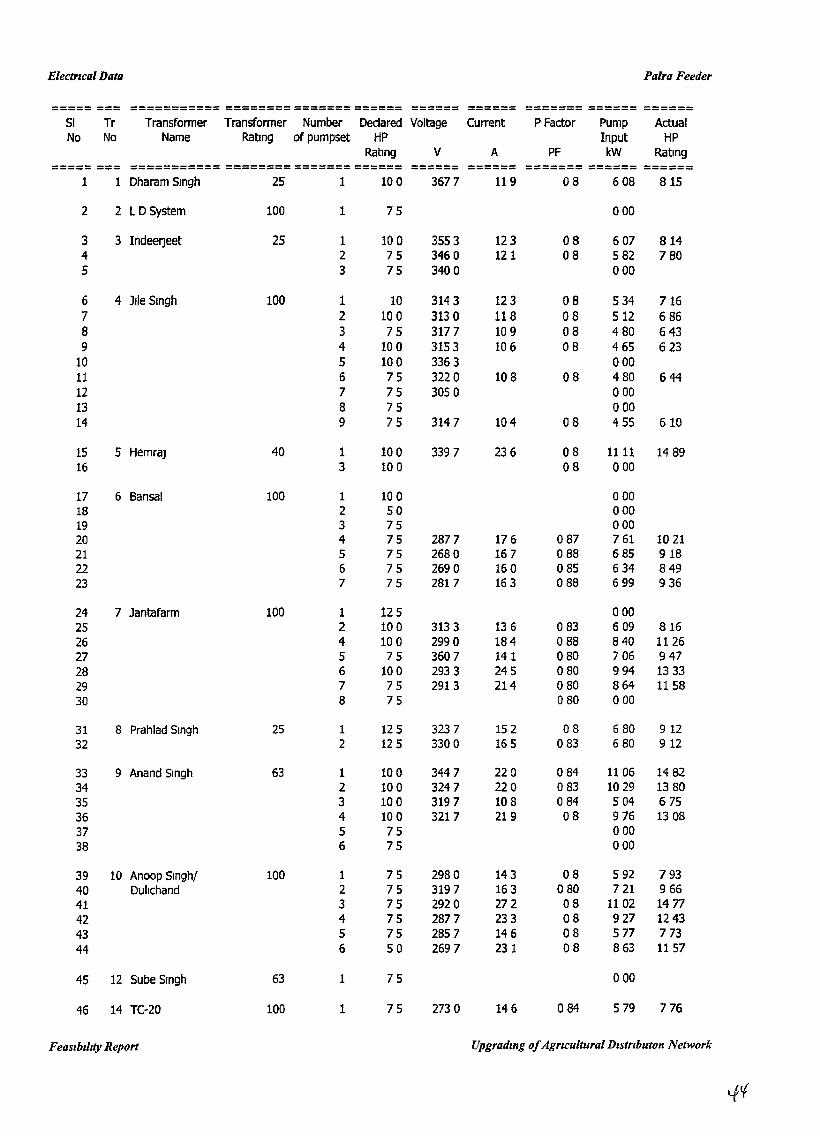
Electrical Data Palra Feeder
----- --- =========== ======== ======= ====== ====== ====== ======= ====== ======----- ---SI Tr Transformer Transformer Number Declared Voltage Current P Factor Pump ActualNo No Name Rating of pumpset HP Input HP
Rating V A PF kW Rating----- --- =========== ======== ======= ====== ------ ====== ======= ====== ======----- --- ------
1 1 Dharam Singh 25 1 100 3677 119 08 608 815
2 2 L D System 100 1 75 000
3 3 IndeelJeet 25 1 100 3553 123 08 607 8144 2 75 3460 121 08 582 7805 3 75 3400 000
6 4 Jlle Singh 100 1 10 3143 123 08 534 7167 2 100 3130 118 08 512 6868 3 75 3177 109 08 480 6439 4 100 3153 106 08 465 623
10 5 100 3363 00011 6 75 3220 108 08 480 64412 7 75 3050 00013 8 75 00014 9 75 3147 104 08 455 610
15 5 HemraJ 40 1 100 3397 236 08 1111 14 8916 3 10 a 08 000
17 6 Bansal 100 1 10 0 a0018 2 50 00019 3 75 a0020 4 75 2877 176 087 761 102121 5 75 2680 167 088 685 91822 6 75 2690 160 085 634 84923 7 75 2817 163 088 699 936
24 7 Jantafarm 100 1 125 00025 2 10 0 3133 136 083 609 81626 4 100 2990 184 088 840 112627 5 75 3607 141 080 706 94728 6 100 2933 245 080 994 13 3329 7 75 2913 214 080 864 115830 8 75 080 000
31 8 Prahlad Singh 25 1 125 3237 152 08 680 91232 2 125 330 a 165 083 680 912
33 9 Anand Singh 63 1 10 0 3447 220 084 1106 148234 2 100 3247 22 a 083 1029 138035 3 100 3197 108 084 504 67536 4 100 3217 219 08 976 13 0837 5 75 00038 6 75 000
39 10 Anoop Slngh/ 100 1 75 2980 143 08 592 79340 Duhchand 2 75 3197 163 080 721 96641 3 75 2920 272 08 11 02 147742 4 75 2877 233 08 927 124343 5 75 2857 146 08 577 77344 6 50 2697 231 08 863 1157
45 12 Sube Singh 63 1 75 000
46 14 TC~20 100 1 75 273 a 146 084 579 776
Feaslbl/zty Report Upgradmg ofAgflcultural D,strlbuton Network
'-!:<{
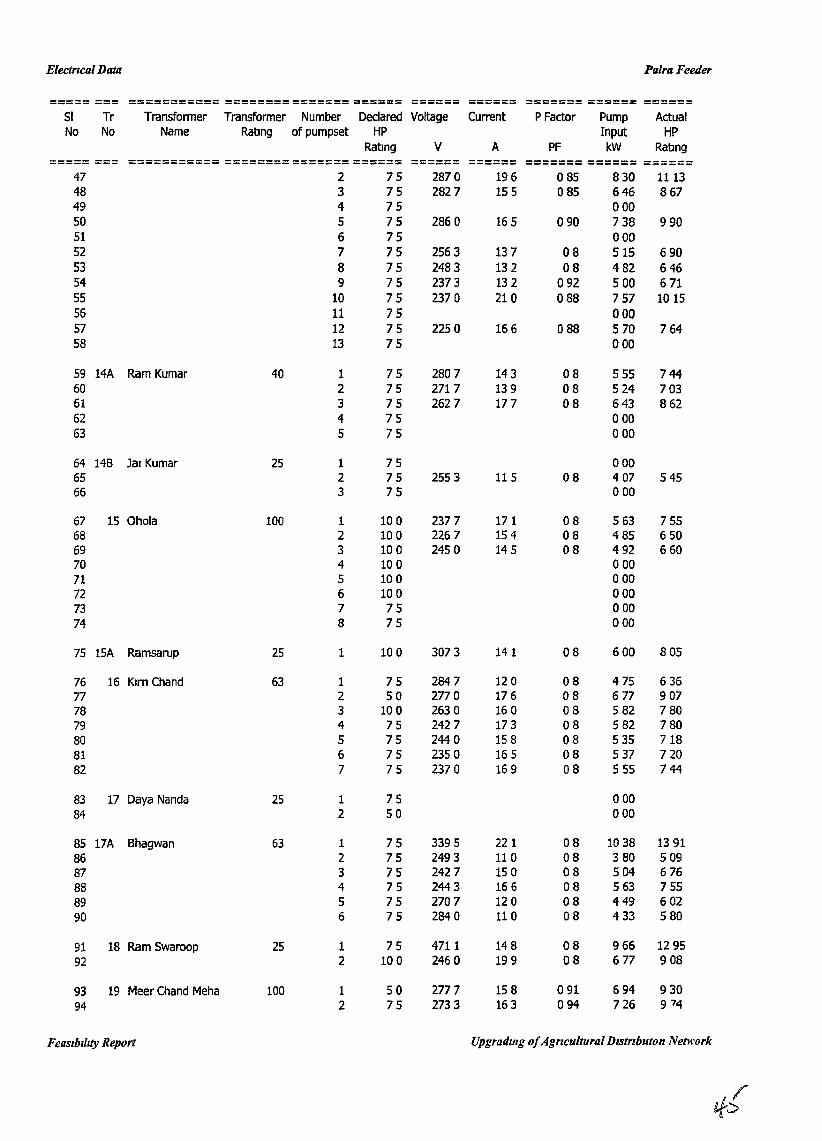
Electrical Data Palra Feeder
===== === =========== ======== ======= ====== ====== ====== ======= ====== ======51 Tr Transformer Transformer Number Declared Voltage Current PFactor Pump ActualNo No Name Rating of pumpset HP Input HP
Rating V A PF kW Rating----- --- =========== ======== ======= ====== ------ ------ ======= ====== ======----- --- ------ ------
47 2 75 2870 196 085 830 111348 3 75 2827 155 085 646 86749 4 75 00050 5 75 2860 165 090 738 99051 6 75 00052 7 75 2563 137 08 515 69053 8 75 2483 132 08 482 64654 9 75 2373 132 092 500 67155 10 75 2370 210 088 757 101556 11 75 00057 12 75 2250 166 088 570 76458 13 75 000
59 14A Ram Kumar 40 1 75 2807 143 08 555 74460 2 75 2717 139 08 524 70361 3 75 2627 177 08 643 86262 4 75 00063 5 75 000
64 146 Jal Kumar 25 1 75 00065 2 75 2553 115 08 4 07 54566 3 75 000
67 15 Ohola 100 1 100 2377 171 08 563 75568 2 10 0 2267 154 08 485 65069 3 10 a 2450 145 08 492 66070 4 100 00071 5 100 00072 6 100 00073 7 75 00074 8 75 000
75 15A Ramsarup 25 1 100 3073 141 08 600 805
76 16 Kim Chand 63 1 75 284 7 12 a 08 475 63677 2 50 2770 176 08 677 90778 3 10 a 2630 16 a 08 582 78079 4 75 2427 173 08 582 78080 5 75 2440 158 08 535 71881 6 75 235 a 165 08 537 72082 7 75 2370 169 08 555 744
83 17 Daya Nanda 25 1 75 00084 2 50 000
85 17A Bhagwan 63 1 75 3395 221 08 10 38 139186 2 75 2493 110 08 380 5 0987 3 75 2427 15 a 08 504 67688 4 75 2443 166 08 563 75589 5 75 2707 12 a 08 449 6 0290 6 75 2840 110 08 433 580
91 18 Ram 5waroop 25 1 75 4711 148 08 966 129592 2 100 2460 199 08 677 9 08
93 19 Meer Chand Meha 100 1 50 2777 158 091 694 93094 2 75 2733 163 094 726 9 74
FeaSibility Report Upgradzng ofAgricultural Dlstrzhuton Network
if?

Electrzcal Data Palra Feeder
===== === =========== ======== ======= ====== ====== ====== ------- ------ ------------- ------ ------51 Tr Transformer Transformer Number Declared Voltage Current P Factor Pump ActualNo No Name Rabng of pumpset HP Input HP
Rabng V A PF kW Rabng----- --- ----------- -------- ------- ------ ====== ------ ======= ====== ======----- --- ----------- -------- ------- ------ ------
95 3 75 00096 4 75 00097 5 75 2603 149 085 572 76798 6 75 2673 154 08 569 76399 7 75 2577 147 08 524 702
100 8 75 2537 135 08 476 638
101 20 Jaghlr Singh 25 1 75 2857 112 085 472 633102 2 75 2757 121 085 492 660103 3 75 2740 142 085 574 770
104 21 Puran Chand 63 1 75 277 3 139 092 616 825105 2 75 2420 112 08 374 502106 3 100 2320 119 08 383 513107 4 100 2557 151 093 625 838108 6 75 1687 102 093 278 373109 7 75 1650 93 094 252 337
110 22 TCA-22 100 1 75 2223 160 000 000111 2 50 000112 3 75 000113 4 75 000114 5 75 000115 6 75 000116 7 50 000117 8 75 000118 9 75 000119 10 75 000120 11 75 000
121 23 Han Singh 25 1 75 00 000122 2 75 00 000123 3 75 00 000
124 24 Kartar Singh 100 1 750 2847 135 085 567 760125 2 75 2797 140 085 575 771126 3 750 2760 152 085 619 830127 4 750 2747 138 085 557 746128 5 750 2630 143 085 554 742129 6 15 2623 114 085 442 592130 7 75 2577 142 085 539 722131 8 75 2757 150 085 607 814
132 25 Puran Stngh 63 1 75 3027 162 075 641 859133 2 75 2567 164 089 649 870134 3 75 2567 141 085 534 716
135 26 Nemrchand 63 1 10 2747 150 087 622 834136 2 75 2650 145 09 566 758137 3 75 000138 4 75 000139 5 75 000140 6 75 000141 7 75 000
142 27 Nemlchand 63 1 75 2563 114 088 445 597143 2 75 000
FeaslMlt)' Report Upgradmg ofAgrtcultural Dlstrzbuton Network
PI'
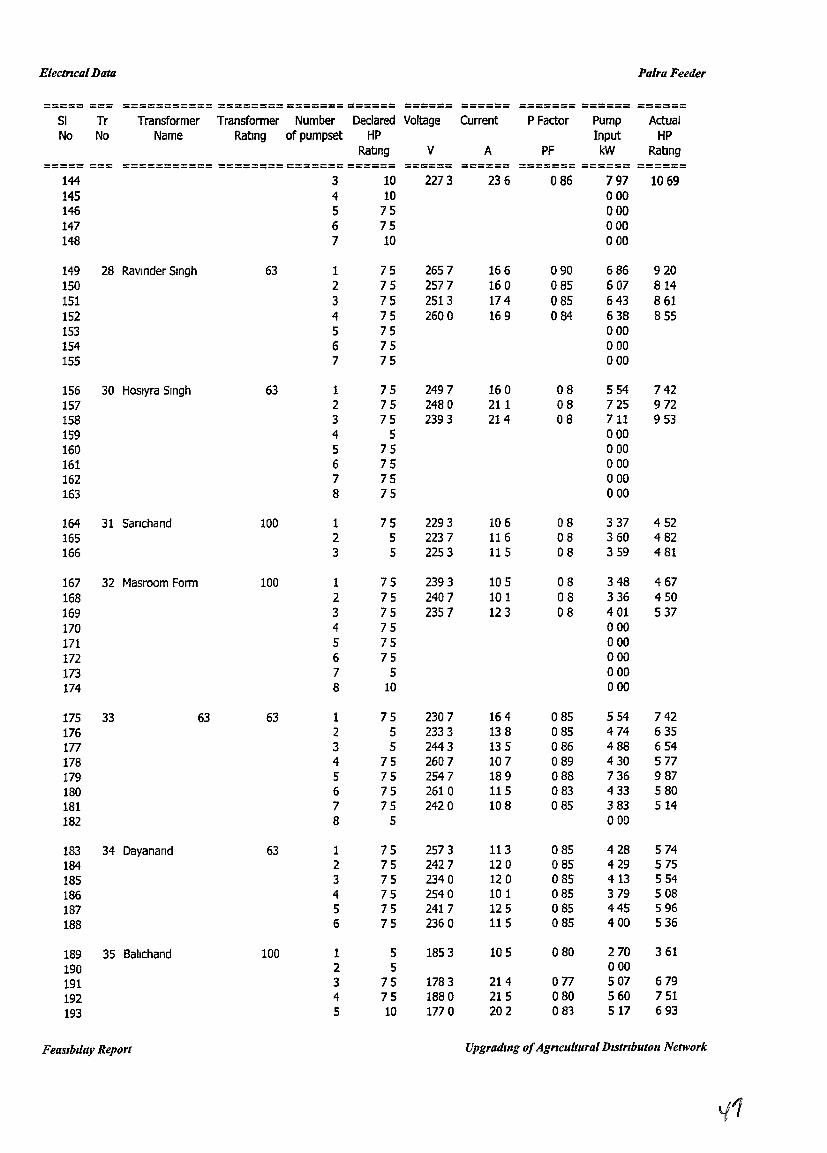
Electrical Data Palra Feeder
----- --- =========== ======== ======= ====== ====== ====== ======= ====== ======----- ---SI Tr Transformer Transformer Number Declared Voltage Current P Factor Pump ActualNo No Name Ratmg of pumpset HP Input HP
Rating V A PF kW Rating===== === =========== ======== ======= ====== ====== ====== ======= ====== ======
144 3 10 2273 236 086 797 1069145 4 10 000146 5 75 000147 6 75 000148 7 10 000
149 28 Ravlnder Singh 63 1 75 2657 166 090 686 920150 2 75 2577 160 085 607 814151 3 75 2513 174 085 643 861152 4 75 2600 169 084 638 855153 5 75 000154 6 75 000155 7 75 000
156 30 Hoslyra Singh 63 1 75 2497 160 08 554 742157 2 75 2480 211 08 725 972158 3 75 2393 214 08 711 953159 4 5 000160 5 75 000161 6 75 000162 7 75 000163 8 75 000
164 31 Sanchand 100 1 75 2293 106 08 337 452165 2 5 2237 116 08 360 482166 3 5 2253 115 08 359 481
167 32 Masroom Form 100 1 75 2393 105 08 348 467168 2 75 2407 101 08 336 450169 3 75 2357 123 08 401 537170 4 75 000171 5 75 000172 6 75 000173 7 5 000174 8 10 000
175 33 63 63 1 75 2307 164 085 554 742176 2 5 2333 138 085 474 635177 3 5 2443 135 086 488 654178 4 75 2607 107 089 430 577179 5 75 2547 189 088 736 987180 6 75 2610 115 083 433 580181 7 75 2420 108 085 383 514182 8 5 000
183 34 Dayanand 63 1 75 2573 113 085 428 574184 2 75 2427 120 085 429 575185 3 75 2340 12 a 085 413 554186 4 75 2540 101 085 379 508187 5 75 2417 125 085 445 596188 6 75 2360 115 085 400 536
189 35 Bahchand 100 1 5 1853 105 080 270 361190 2 5 000191 3 75 1783 214 077 507 679192 4 75 1880 215 080 560 751193 5 10 177 0 202 08'3 517 693
FeasIbIlity Report Upgrading ofAgncultural Dlstnbuton Network
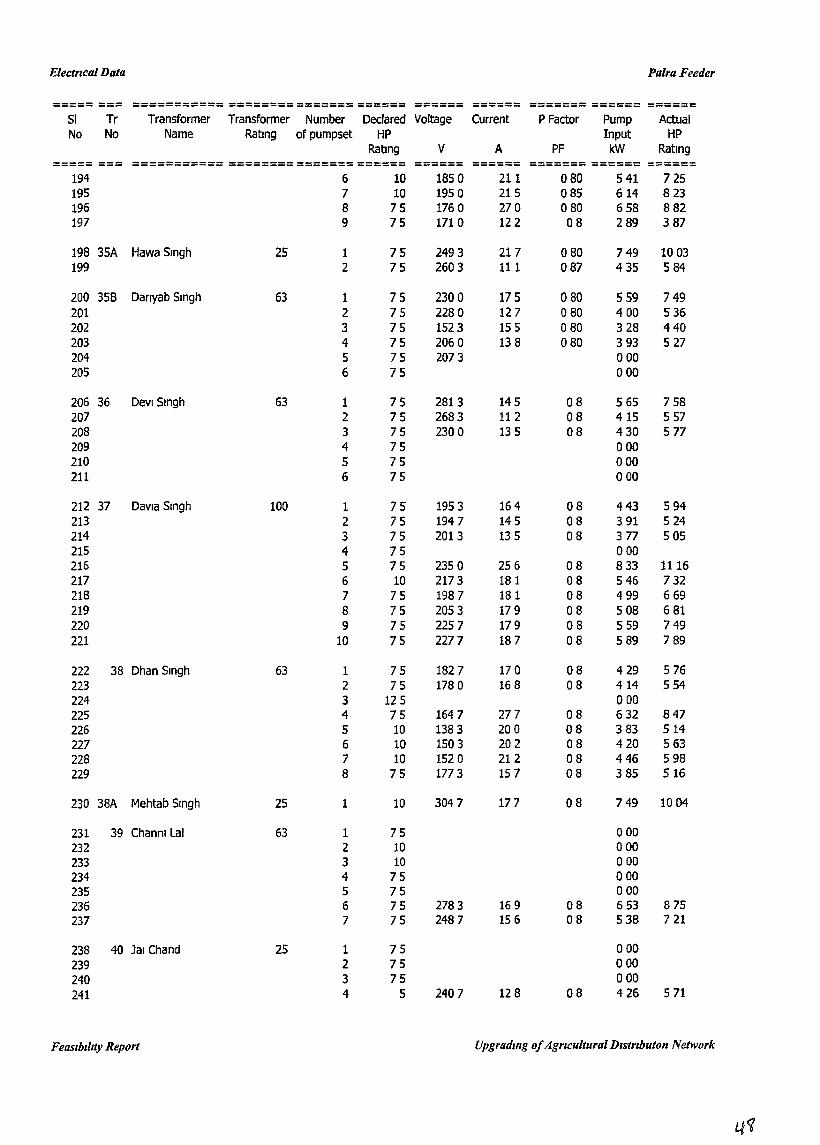
Electncal Data Palra Feeder
===== === =========== ======== ======= ====== ------ ------ ======= ====== =======------ ------SI Tr Transformer Transformer Number Declared Voltage Current P Factor Pump ActualNo No Name Rating of pumpset HP Input HP
Ratmg V A PF kW Rating===== === =========== ======== ======= ====== ------ ------ ======= ====== ======------ ------
194 6 10 1850 211 080 541 725195 7 10 1950 215 085 614 823196 8 75 1760 270 080 658 882197 9 75 171 0 122 08 289 387
198 35A Hawa Smgh 25 1 75 2493 217 080 749 1003199 2 75 2603 111 087 435 584
200 358 Danyab Singh 63 1 75 2300 175 080 559 749201 2 75 2280 127 080 400 536202 3 75 1523 155 080 328 440203 4 75 2060 138 080 393 527204 5 75 2073 000205 6 75 000
206 36 Devi Singh 63 1 75 2813 145 08 565 758207 2 75 2683 112 08 415 557208 3 75 2300 135 08 430 577209 4 75 000210 5 75 000211 6 75 000
212 37 DaVia Singh 100 1 75 1953 164 08 443 594213 2 75 1947 145 08 391 524214 3 75 2013 135 08 377 505215 4 75 000216 5 75 2350 256 08 833 1116217 6 10 2173 181 08 546 732218 7 75 1987 181 08 499 669219 8 75 2053 179 08 508 681220 9 75 2257 179 08 559 749221 10 75 2277 187 08 589 789
222 38 Dhan Singh 63 1 75 1827 17 a 08 429 576223 2 75 1780 168 08 414 554224 3 125 000225 4 75 1647 277 08 632 847226 5 10 1383 200 08 383 514227 6 10 1503 202 08 420 563228 7 10 1520 212 08 446 598229 8 75 177 3 157 08 385 516
230 38A Mehtab Singh 25 1 10 3047 177 08 749 1004
231 39 Channl Lal 63 1 75 000232 2 10 000233 3 10 000234 4 75 000235 5 75 000236 6 75 2783 169 08 653 875237 7 75 2487 156 08 538 721
238 40 JalChand 25 1 75 000239 2 75 000240 3 75 000241 4 5 2407 128 08 426 571
Feasibility Report Upgradmg ofAgTlcultural Dlstrtbuton Network
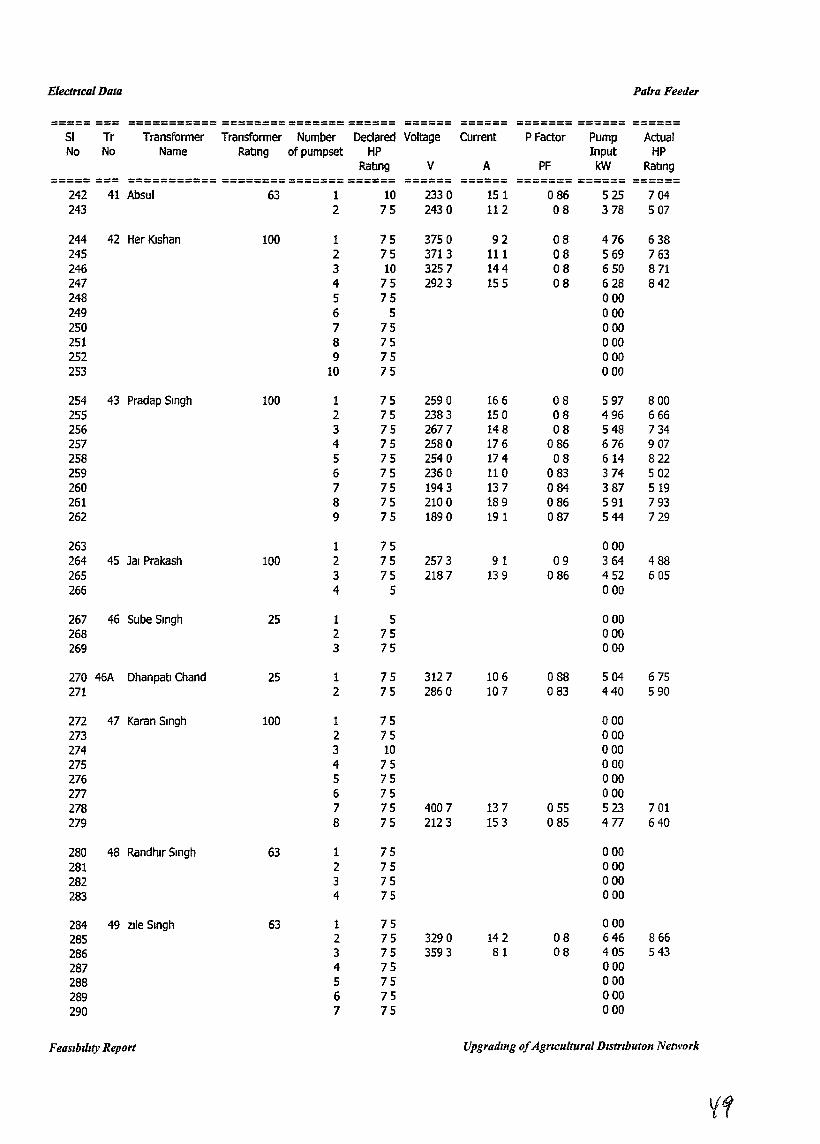
Electneal Data Palra Feeder
::==== === =========== ======== ======= ====== ------ ------ ======= ====== ======------ ------SI Tr Transformer Transformer Number Declared Voltage Current PFactor Pump ActualNo No Name Ratmg of pumpset HP Input HP
Rabng V A PF kW Rating===== === =========== ======== ======= ====== ------ ------ ======= ====== ======------ ------
242 41 Absul 63 1 10 2330 151 086 525 704243 2 75 2430 112 08 378 507
244 42 Her KJshan 100 1 75 3750 92 08 476 638245 2 75 3713 111 08 569 763246 3 10 3257 144 08 650 871247 4 75 2923 155 08 628 842248 5 75 000249 6 5 000250 7 75 000251 8 75 000252 9 75 000253 10 75 000
254 43 Pradap Singh 100 1 75 2590 166 08 597 800255 2 75 2383 150 08 496 666256 3 75 2677 148 08 548 734257 4 75 2580 176 086 676 907258 5 75 254 a 174 08 614 822259 6 75 2360 110 083 374 502260 7 75 1943 137 084 387 519261 8 75 2100 189 086 591 793262 9 75 1890 191 087 544 729
263 1 75 000264 45 Jar Prakash 100 2 75 2573 91 09 364 488265 3 75 2187 139 086 452 605266 4 5 000
267 46 Sube Singh 25 1 5 000268 2 75 000269 3 75 000
270 46A Dhanpatl Chand 25 1 75 3127 106 088 504 675271 2 75 2860 107 083 440 590
272 47 Karan Singh 100 1 75 000273 2 75 000274 3 10 000275 4 75 000276 5 75 000277 6 75 000278 7 75 4007 137 055 523 701279 8 75 2123 153 085 477 640
280 48 Randhlr Singh 63 1 75 000281 2 75 000282 3 75 000283 4 75 000
284 49 zlle Singh 63 1 75 000285 2 75 3290 142 08 646 866286 3 75 3593 81 08 405 543
287 4 75 000288 5 75 000289 6 75 000290 7 75 000
Feaslbrllty Report Upgradmg ofAgrlcultural DlStrlbutoll Network
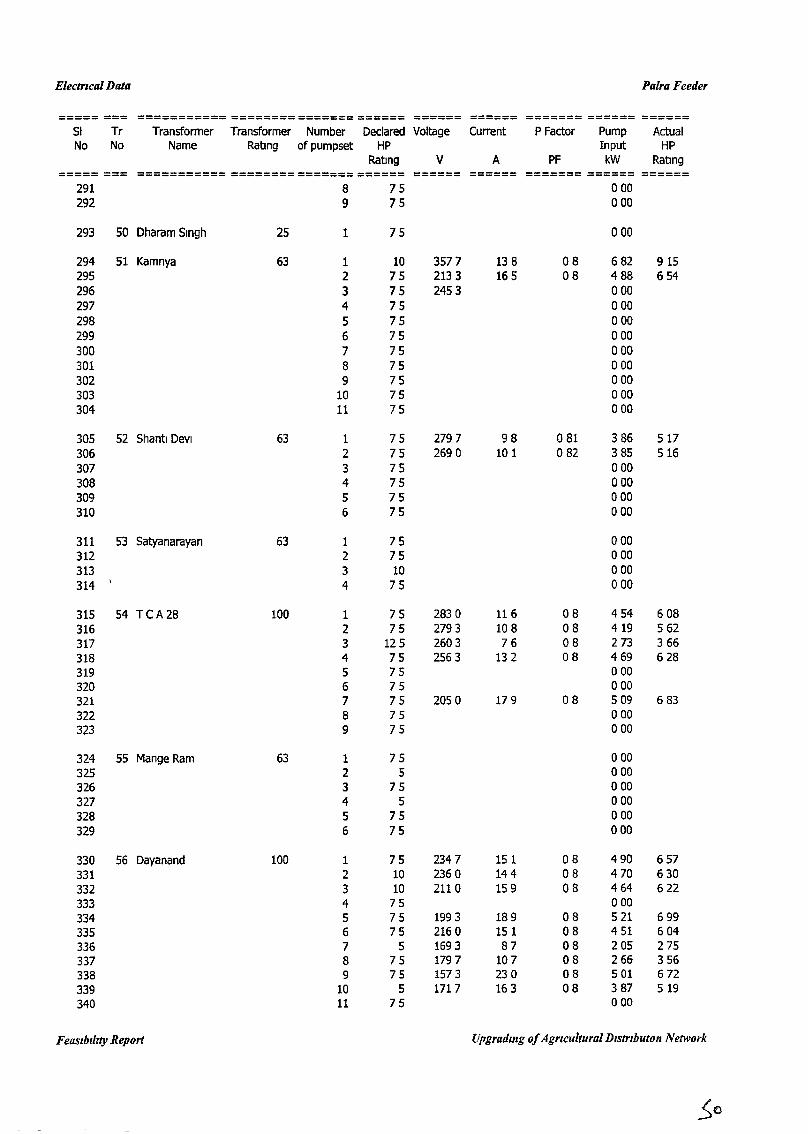
Electrical Data Palra Feeder
===== === =========== ======== ======= ====== ------ ====== ======= ====== ======------51 Tr Transformer Transformer Number Declared Voltage Current P Factor Pump ActualNo No Name Rating of pumpset HP Input HP
Rating V A PF kW Rating===== === =========== ======== ======= ====== ------ ====== ======= ====== ======------
291 8 75 000292 9 75 000
293 50 Dharam Singh 25 1 75 000
294 51 Kamnya 63 1 10 3577 138 08 682 915295 2 75 2133 165 08 488 654296 3 75 2453 000297 4 75 000298 5 75 000299 6 75 000300 7 75 000301 8 75 000302 9 75 000303 10 75 000304 11 75 000
305 52 Shant! Devi 63 1 75 2797 98 081 386 517306 2 75 269 a 101 082 385 516307 3 75 000308 4 75 000309 5 75 000310 6 75 000
311 53 Satyanarayan 63 1 75 000312 2 75 000313 3 10 000314
I4 75 000
315 54 TCA28 100 1 75 2830 116 08 454 608316 2 75 2793 108 08 419 562317 3 125 2603 76 08 273 366318 4 75 2563 132 08 469 628319 5 75 000320 6 75 000321 7 75 2050 179 08 509 683322 8 75 000323 9 75 000
324 55 Mange Ram 63 1 75 000325 2 5 000326 3 75 000327 4 5 000328 5 75 000329 6 75 000
330 56 Dayanand 100 1 75 2347 151 08 490 657331 2 10 2360 144 08 470 630332 3 10 211 0 159 08 464 622333 4 75 000334 5 75 1993 189 08 521 699335 6 75 2160 151 08 451 604336 7 5 1693 87 08 205 275337 8 75 1797 107 08 266 356338 9 75 1573 230 08 501 672339 10 5 1717 163 08 387 519340 11 75 000
Feaslbrllty Report Upgradmg ofAgTlcultural DrstTlbuton Network
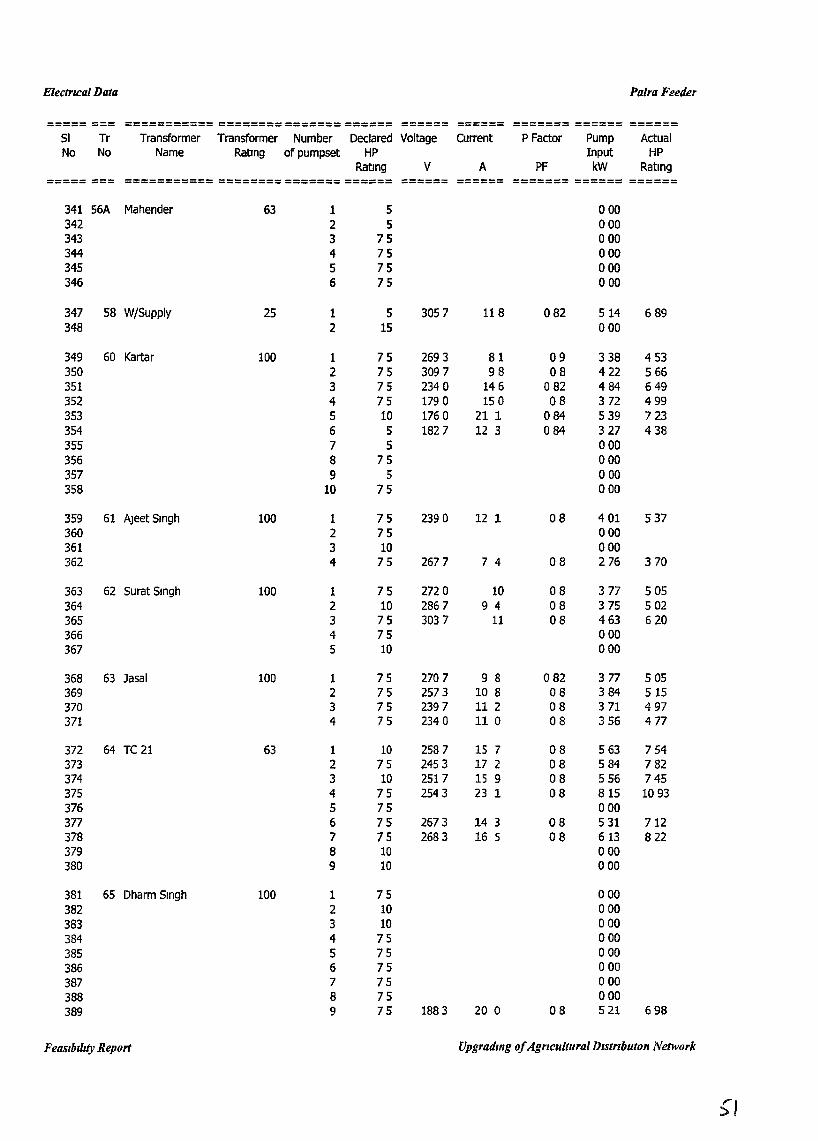
ElectrIcal Data Palra Feeder
===== === =========== ======== ======= ====== ====== ====== ======= ====== ======SI Tr Transformer Transformer Number Declared Voltage Current P Factor Pump ActualNo No Name Rating of pumpset HP Input HP
Rating V A PF kW Rating===== === =========== ======== ======= ====== ====== ------ ======= ====== ======------
341 56A Mahender 63 1 5 000342 2 5 000343 3 75 000344 4 75 000345 5 75 000346 6 75 000
347 58 W/Supply 25 1 5 3057 118 082 514 689348 2 15 000
349 60 Kartar 100 1 75 2693 81 09 338 453350 2 75 3097 98 08 422 566351 3 75 2340 146 082 484 649352 4 75 1790 150 08 372 499353 5 10 1760 21 1 084 539 723354 6 5 1827 12 3 084 327 438355 7 5 000356 8 75 000357 9 5 000358 10 75 000
359 61 A]eet Smgh 100 1 75 2390 12 1 08 401 537360 2 75 000361 3 10 000362 4 75 2677 7 4 08 276 370
363 62 Surat Singh 100 1 75 2720 10 08 377 505364 2 10 2867 9 4 08 375 502365 3 75 3037 11 08 463 620366 4 75 000367 5 10 000
368 63 Jasal 100 1 75 2707 9 8 082 377 505369 2 75 2573 10 8 08 384 515370 3 75 2397 112 08 371 497371 4 75 2340 110 08 356 477
372 64 TC 21 63 1 10 2587 lS 7 08 563 754373 2 75 2453 17 2 08 584 782374 3 10 2517 15 9 08 556 745375 4 75 2543 23 1 08 815 1093376 5 75 000377 6 75 2673 14 3 08 531 712378 7 75 2683 16 5 08 613 822379 8 10 000380 9 10 000
381 65 Dharm Singh 100 1 75 000382 2 10 000383 3 10 000384 4 75 000385 5 75 000386 6 75 000387 7 75 000388 8 75 000389 9 75 1883 20 0 08 521 698
FeaslbJllty Report Upgrading ofAgrlcultura[DlStTlbuton Network
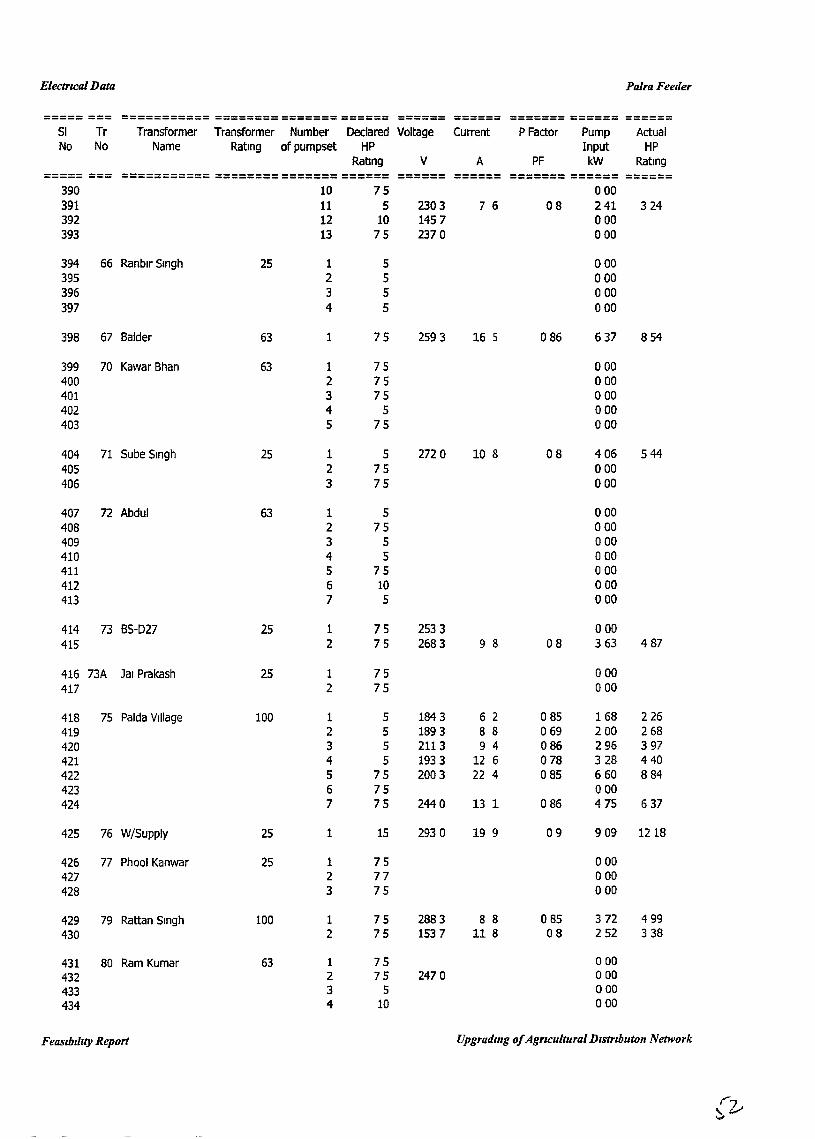
Electru:al Data Palra Feeder
----- --- =========== ======== ======= ====== ------ ====== ======= ====== ======----- --- ------SI Tr Transformer Transformer Number Declared Voltage Current P Factor Pump ActualNo No Name Rating of pumpset HP Input HP
RatIng V A PF kW Ratmg----- --- =========== ======== ======= ====== ====== ====== ======= ====== ======----- ---
390 10 75 000391 11 5 2303 7 6 08 241 324392 12 10 1457 000393 13 75 2370 000
394 66 Ranblr Smgh 25 1 5 000395 2 5 000396 3 5 a00397 4 5 a00
398 67 Balder 63 1 75 2593 16 5 086 637 854
399 70 Kawar Bhan 63 1 75 000400 2 75 000401 3 75 000402 4 5 000403 5 75 000
404 71 Sube Smgh 25 1 5 272 0 10 8 08 406 544405 2 75 000406 3 75 000
407 72 Abdul 63 1 5 000408 2 75 000409 3 5 000410 4 5 000411 5 75 000412 6 10 000413 7 5 000
414 73 BS-D27 25 1 75 2533 000415 2 75 2683 9 8 08 363 487
416 73A Jal Prakash 25 1 75 000
417 2 75 000
418 75 Palda Village 100 1 5 184 3 6 2 085 168 226419 2 5 1893 8 8 069 200 268420 3 5 2113 9 4 086 296 397421 4 5 1933 12 6 078 328 440422 5 75 2003 22 4 085 660 884423 6 75 000424 7 75 244 0 131 086 475 637
425 76 WjSupply 25 1 15 2930 19 9 09 9 09 1218
426 77 Phool Kanwar 25 1 75 000427 2 77 000428 3 75 000
429 79 Rattan Singh 100 1 75 2883 8 8 085 372 499
430 2 75 1537 118 08 252 338
431 80 Ram Kumar 63 1 75 000
432 2 75 2470 000
433 3 5 a00
434 4 10 000
Feasunllty Report Upgradmg ofAgrICulturalDlstnbuton Network
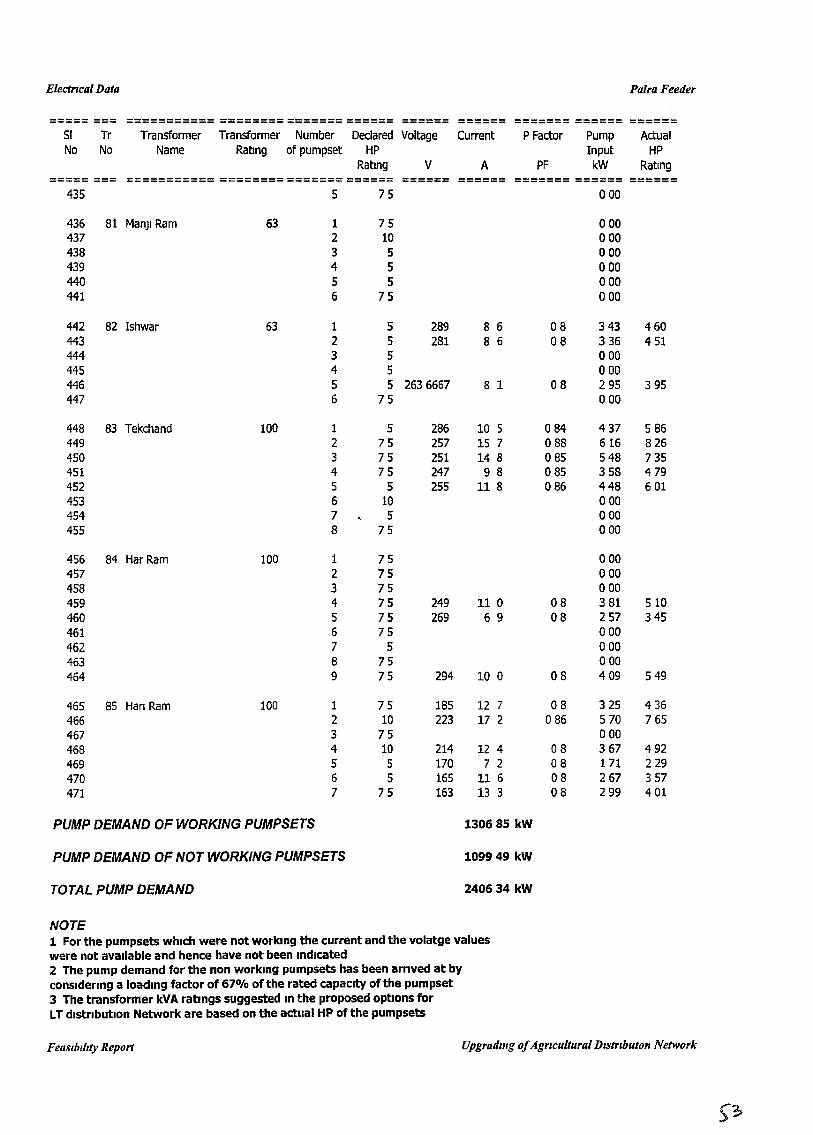
Electrical Data Palra Feeder
----- --- =========== ======== ======= ====== ------ ====== ======= ====== ======----- --- ------SI Tr Transformer Transformer Number Declared Voltage Current PFactor Pump ActualNo No Name RatJng of pumpset HP Input HP
Rating V A PF kW Rating===== === =========== ======== ======= ====== ====== ------ ======= ====== ======------
435 5 75 000
436 81 Man]1 Ram 63 1 75 000437 2 10 000438 3 5 000439 4 5 000440 5 5 000441 6 75 000
442 82 Ishwar 63 1 5 289 8 6 08 343 460443 2 5 281 8 6 08 336 451444 3 5 000445 4 5 000446 5 5 2636667 8 1 08 295 395447 6 75 000
448 83 Tekchand 100 1 5 286 10 5 084 437 586449 2 75 257 15 7 088 616 826450 3 75 251 14 8 085 548 735451 4 75 247 9 8 085 358 479452 5 5 255 118 086 448 6 01453 6 10 000454 7 5 000455 8 75 000
456 84 Har Ram 100 1 75 000457 2 75 a00458 3 75 000459 4 75 249 110 08 381 510460 5 75 269 6 9 08 257 345461 6 75 000462 7 5 000463 8 75 000464 9 75 294 10 0 08 409 549
465 85 Han Ram 100 1 75 185 12 7 08 325 436466 2 10 223 17 2 086 570 765467 3 75 000468 4 10 214 12 4 08 367 492469 5 5 170 7 2 08 171 229470 6 5 165 116 08 267 357471 7 75 163 13 3 08 299 401
PUMP DEMAND OF WORKING PUMPSETS 130685 kW
PUMP DEMAND OF NOT WORKING PUMPSETS 109949 kW
TOTAL PUMP DEMAND 240634 kW
NOTE1 For the pumpsets which were not working the current and the volatge valueswere not available and hence have not been indicated2 The pump demand for the non working pumpsets has been arrived at byconsldermg a loading factor of 67% of the rated capacity of the pumpset3 The transformer kVA ratmgs suggested In the proposed options forLT distribution Network are based on the actual HP of the pumpsets
FeaSIbIlity Report Upgradmg ofAgricultural DlStrlbuton Network
ANNEXURE-C
TYPICAL CALCULATIONS
C.l. Existing System
C.2. Proposed LT less Option
C.3. Proposed Grouping Option
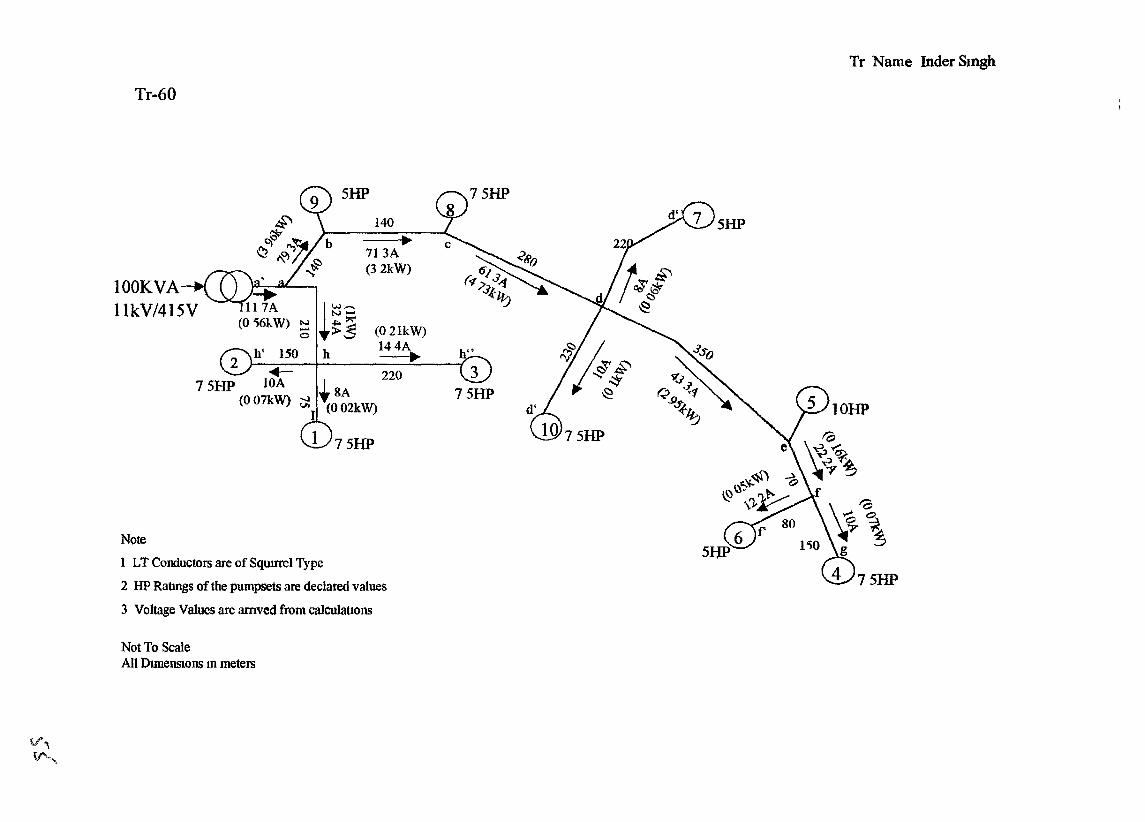
InderSmghTr Name
75HP
Note f Sqwrrel TypeI LT Conductors are 0 declared values
umpsetsare2lIP RatIngs of the p aleulaUol1s
amved from c3 Voltage Values are
75HP
Tr-60
75HP5lIP
140 .. c
~ ,!~$§'713A
6/.)(32kW)
(~/.)..f-~d ~
lOOKVA
(0 21kW)llkV/415V
144A.. h"
375HP
Not To Scalens 10 metersAll Dtmensto
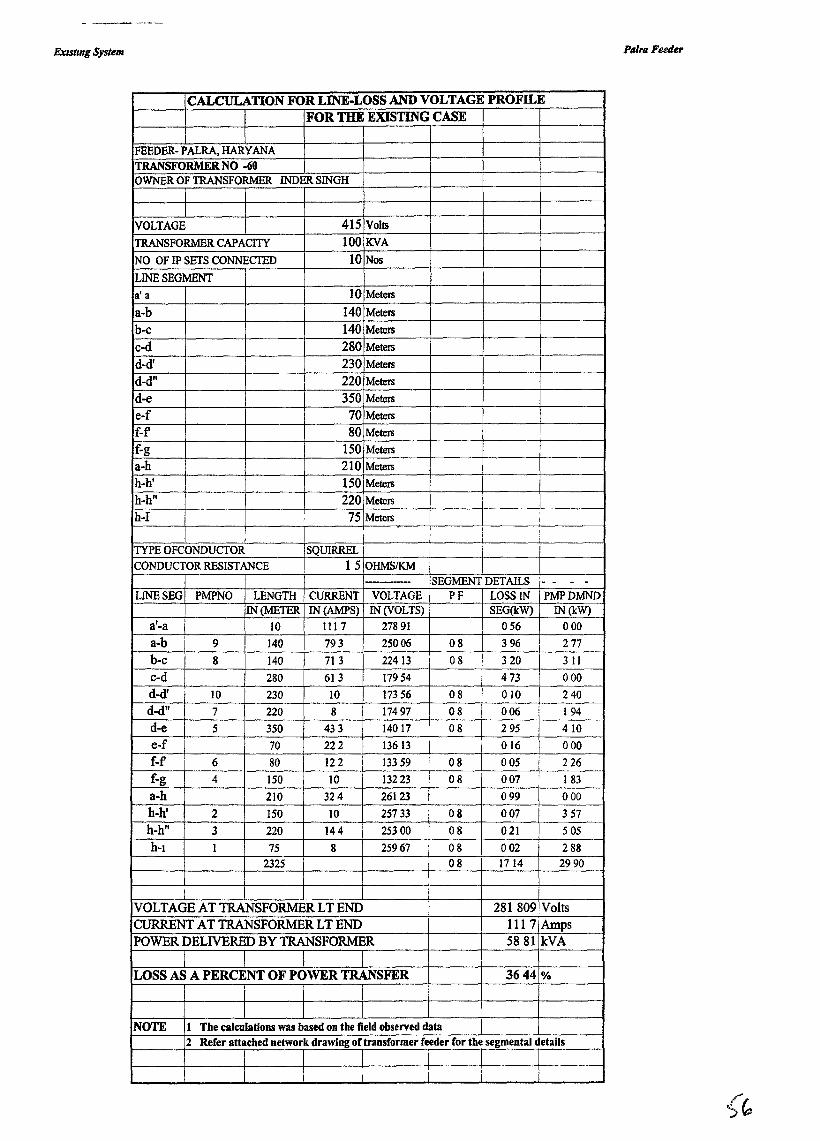
Exzstzng System
CALCULATION FOR LINE-LOSS AND VOLTAGE PROFH..EFOR THE EXISTING CASE
FEEDER- PALRA, HARYANATRANSFORMER NO -60OWNER OF TRANSFORMER INDER SINGH
VOLTAGE 415 Volts
TRANSFORMER CAPACITY 100 KVA
NO OF IF SETS CONNECTED 10 Nos
LINE SEGMENT
a' a 10 Meters
a-b 140 Meters
b-c 140 Meters
c-d 280 Meters
d-d' 230 Meters
d-d" 220 Meters
d-e 350 Meters
e-f 70 Meters
f-f 80 Meters
f-g 150 Meters
a-h 210 Meters
h-h' 150 Meters
h-h" 220 Meters
h-I 75 Meters I
I I I II
TYPE OFCONDUCTOR SQUIRREL iCONDUCTOR RESISTANCE 15 OHMSIKM
--- SEGMENT DETAILS - - - -LINESEG PMPNO LENGTH CURRENT VOLTAGE PF LOSS IN PMPDMND
IN (METER IN (AMPS) IN (VOLTS) SEG(kW) IN(kW)a'-a 10 1117 27891 056 000
a-b 9 140 793 25006 08 396 277
b-c 8 140 713 22413 08 320 311
c-d 280 613 17954 473 000
d-d' 10 230 10 17356 08 010 240
d-d" 7 220 8 17497 08 006 194
d-e 5 350 433 14017 08 295 410
e-f I 70 222 13613 016 000
f-f 6 80 122 13359 08 005 I 226
f-g 4 150 10 13223 08 007 I 183
a-h 210 324 26123 099 000
h-h' 2 ISO 10 25733 08 007 357
h-h" 3 220 144 25300 08 021 5 OS
h-l 1 75 8 25967 08 002 2882325 08 1714 2990
IVOLTAGE AT TRANSFORMER LT END 281809 VoltsCURRENT AT TRANSFORMER LT END 111 7 AmpsPOWER DELIVERED BY TRANSFORMER 5881 kVA
LOSS AS A PERCENT OF POWER TRANSFER 3644 0/0
I
NOTE 1 The calculations was based on the field observed data2 Refer attached network drawing oftransformer feeder for the segmental details
I
Palra Feeder
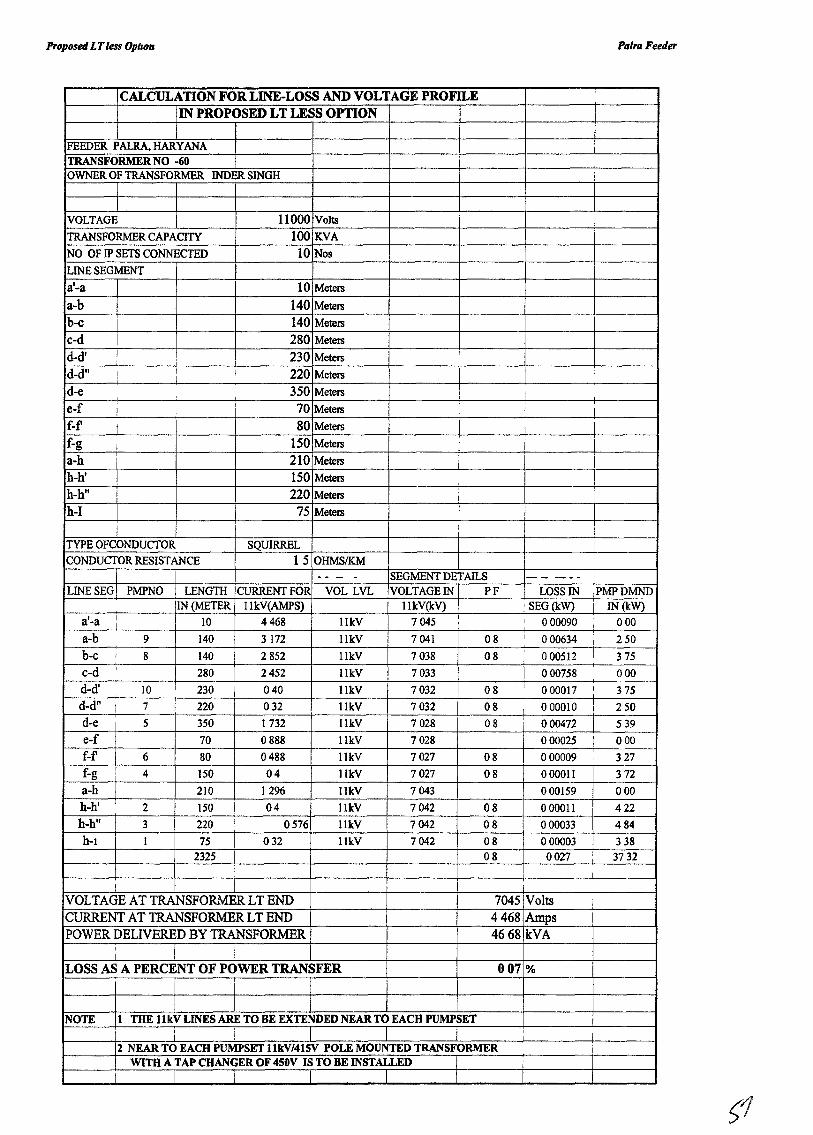
Proposed LTless Optum Palm Feeder
CALCULATION FOR LINE-LOSS AND VOLTAGE PROFll..EIN PROPOSED LT LESS OPTION
FEEDER PALRA, HARYANATRANSFORMER NO -60OWNER OF TRANSFORMER INnER SINGH
VOLTAGE 11000 Volts
TRANSFORMER CAPACITY 100 KVA
NO OF IP SETS CONNECTED 10 Nos
LINE SEGMENT
a'-a 10 Meters
a-b 140 Meters
b-c 140 Meters
c-d 280 Meters
d-d' 230 Metersd-d" i : I 220 Meters
d-e 350 Meters Ie-f I 70 Meters I
I I If-f' j 80 Meters I
f-g 150 Meters I I
a-h 210 Meters
h-h' 150 Metersh-h" 220 Meters
h-I 75 Meters
TYPE OFCONDUCTOR SQUIRREL
CONDUCTOR RESISTANCE 15 OHMSIKM
...... - - SEGMENT DETAILS --- --- ,
LINESEG PMPNO LENGTH ICURRENT FOR VOL LVL VOLTAGE IN PF LOSS IN 'PMPDMNDlIN (METER 1IkV(AMPS) 11kV(kV) I SEG(kW) IN(kW)
a'-a I 10 4468 11kV 7045 I 000090 000I I
a-b 9 140 I 3172 11kV 7041 08 I 000634 I 250
b-c I 8 140 2852 11kV 7038 08 I 000512 I 375I
c-d I280 2452 IlkV 7033 I 000758 000
d-d' 10 I 230 040 llkV 7032 08 I 000017 I 375
d-d" I 7 220 032 11kV 7032 08 000010 I 250
d-e I 5 350 1732 11kV 7028 08 000472 539
e-f I 70 0888 11kV 7028 000025 I 000
f-f' 6 80 0488 llkV 7027 08 000009 327
f-g I 4 150 04 llkV 7027 08 000011 372
a-h 210 1296 IlkV 7043 000159 000
h-h' 2 150 04 llkV 7042 08 000011 422
h-h" 3 220 0576 11kV 7042 08 000033 484
h-l 1 75 032 11kV 7042 08 000003 3382325 08 0027
,3732I
I
VOLTAGE AT TRANSFORMER LT END 7045 VoltsCURRENT AT TRANSFORMER LT END 4468 AmpsPOWER DELIVERED BY TRANSFORMER 4668 kVA
I
I
LOSS AS A PERCENT OF POWER TRANSFER 007 %
NOTE 1 mE llkV LINES ARE TO BE EXTENDED NEAR TO EACH PUMPSETI
2 NEAR TO EACH PUMPSET 11kV/41SV POLE MOUNTED TRANSFORMERWlm A TAP CHANGER OF 4S0V IS TO BE INSTALLED
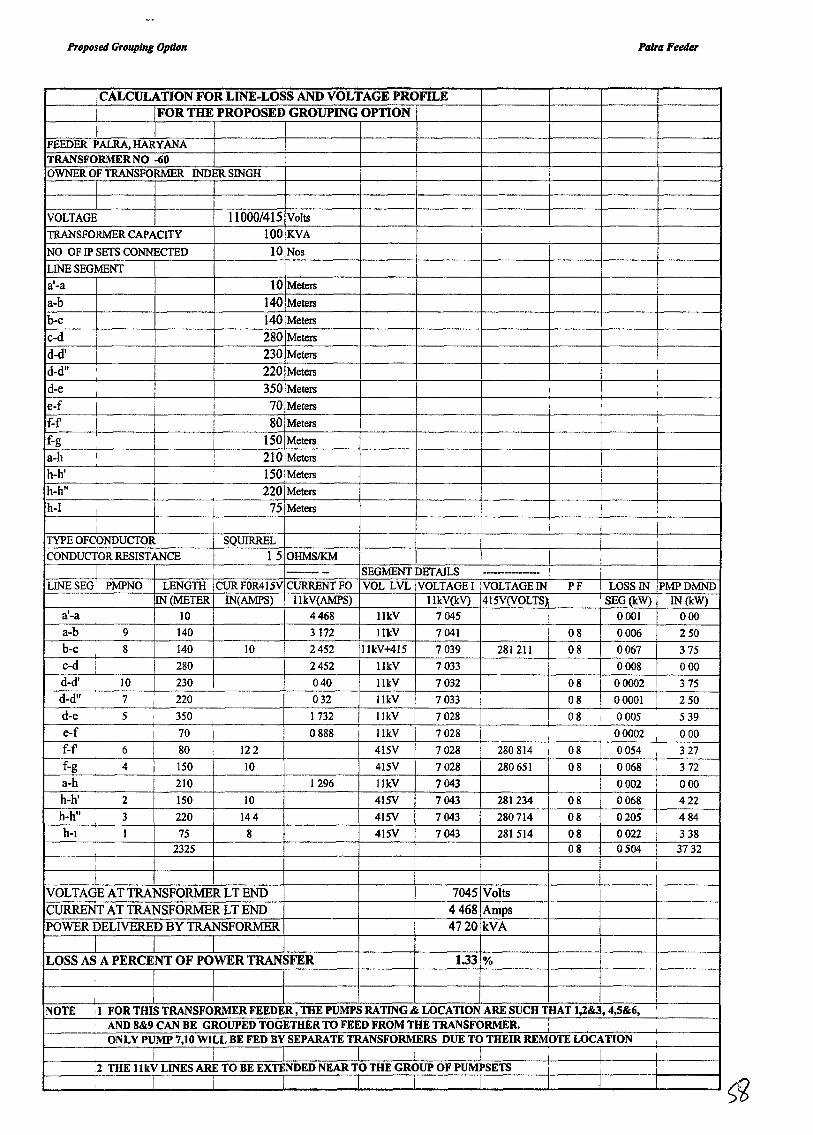
Proposed Grouping Option Palrll Feeder
CALCULATION FOR LINE-LOSS AND VOLTAGE PROFILEI FOR THE PROPOSED GROUPING OPTION
FEEDER PALRA,HARYANATRANSFORMER NO -60OWNER OF TRANSFORMER INDER SINGH
VOLTAGE 11000/415 Volts
TRANSFORMER CAPACITY 100 KVA
NO OF IP SETS CONNECTED 10 Nos
LINE SEGMENT
a'-a 10 Meters
a-b 140 Meters
b-c 140 Meters
c-d 280 Meters
d-d' 230 Meters I
d-d" I I 220 Meters Id-e 350 Meters I
I
I I
e-f I 70 Meters I I
f-f 80 Meters I I
f-g 150 Meters :a-h I i 210 Meters I
Ih-h' I 150 Meters
I
h-h" I 220 Metersh-l I I 75 Meters I I
I
I I ITYPE OFCONDUCTOR SQUIRREL I
CONDUCTOR RESISTANCE 15 OHMSIKM iI ---- SEGMENT DETAILS ------
LINESEG PMPNO LENGTH CUR FOR415V CURRENTFO VOL LVL VOLTAGE I VOLTAGE IN PF LOSS IN PMPDMNDIN (METER I IN(AMPS) IlkV(AMPS) 11kV(kV) 415V(VOLTS I SEG(kW) IN(kW)
a'-a I 10 4468 llkV 7045 0001 000
a-b 9 140 3172 IllcV 7041 I 08 0006 250
b-c 8 140 10 2452 llkV+415 7039 281211 08 0067 375
c-d I 280 2452 llkV 7033 0008 000
d-d' 10 230 040 llkV 7032 08 00002 I 375
d-d" 7 I 220 032 mv 7033 I 08 I 00001 i 250
d-e 5 I 350 I 1732 IlkV 7028 08 I 0005 539
e-f I 70 I 0888 11kV 7028I
00002I
000
f-f 6 80 122 415V 7028 280814 I 08 I 0054 327I ,f-g 4 150 10 415V 7028 280651 08 I 0068 I 372
a-h 210 1296 llkV 7043 0002 I 000
h-h' 2 150 10 415V 7043 281234 08 0068 422
h-h" 3 220 144 415V 7043 280714 08 0205 484
h-l I 75 8 415V 7043 281514 08 0022 3382325 08 0504 3732
VOLTAGE AT TRANSFORMER LT END 7045 VoltsCURRENT AT TRANSFORMER LT END 4468 AmpsPOWER DELIVERED BY TRANSFORMER 4720 kVA
LOSS AS A PERCENT OF POWER TRANSFER 1.33 %
I
NOTE 11 FOR THIS TRANSFORMER FEEDER, THE PUMPS RATING.& LOCATION ARE SUCH THAT 1,2&3, 4,5&6, I
I AND 8&9 CAN BE GROUPED TOGETHER TO FEED FROM THE TRANSFORMER. II
ONLY PUMP 7,10 WILL BE FED BY SEPARATE TRANSFORMERS DUE TO THEIR REMOTE LOCATION I
I I II
,2 THE J1kV LINES ARE TO BE EXTENDED NEAR TO THE GROUP OF PUMPSETS II
ANNEXURE-D
TABLES
Table I--Techmcal detaIls ofLT DIstributIOn Network under study
Table 2--Techmcal DetaIls of Transformer feeder feeding above 2 pumpsets
Table 3--Techmcal DetaIls of Transformer feeder feedIng one 1 pumpset
Table 4--Details of requirements of proposed optIOns
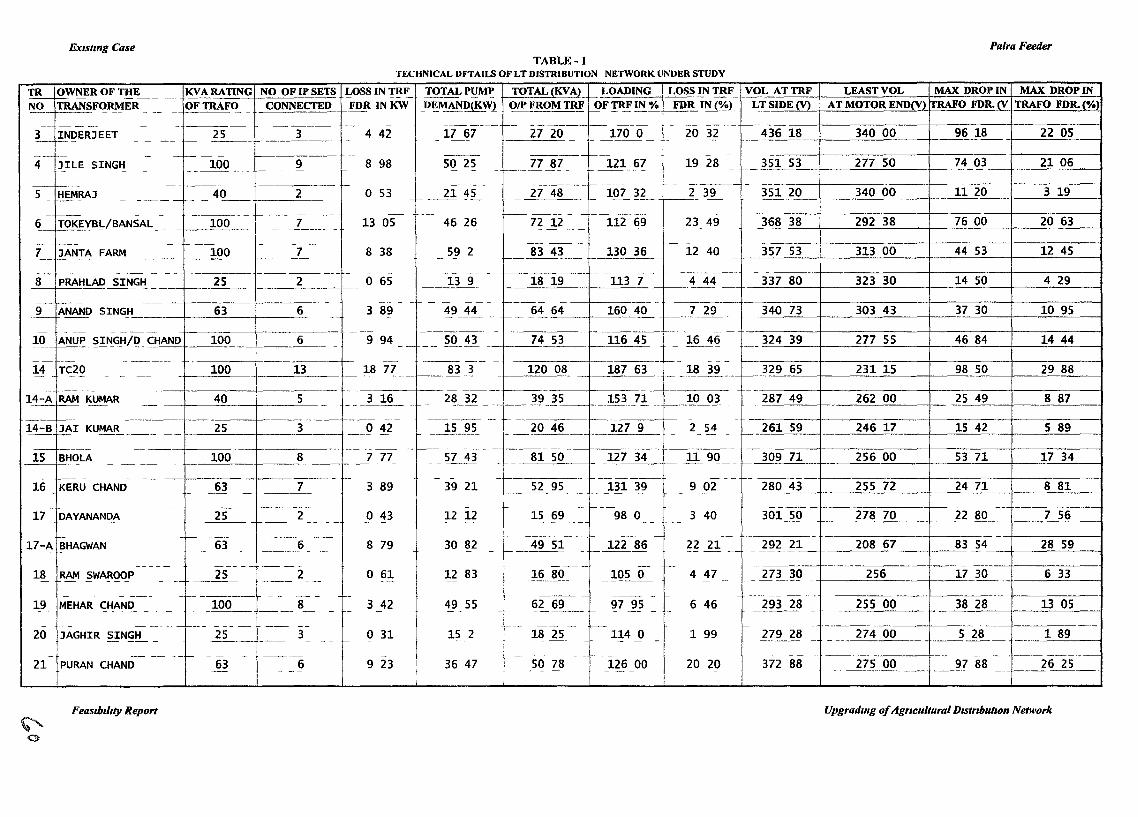
ExlStmg CaseTABLE-l
TECHNICAL DFTAILS OF LT DISTRIBUTION NETWORK UNDER STUDY
Palra Feeder
TR OWNER OF THE KVARATING NO OFIPSETS LOSS IN TRF TOTAL PUMP TOTAL (KVAL c- LOADING LOSS IN TRF VOL ATTRF LEAST VOL MAX DROPIN MAX DROPIN~- --- -- - -- - ---- - -
NO TRANSFORMER OFTRAFO CONNECTED FDR INKW _D~MAND(~l O/PFROMTRF OF TRF IN % ~IN(~l LTSIDE(V) AT MOTOR END(V) TRAFO FDR. CV TRAFO FDR. (%)- -- - ----- - - --~-
-- --- -- - -----~ - - ------- 1-- - --- - -- ---~-3 ,!!"!?ERJEET 25 3 4 42 17 67 27 20 -170 0 ___ 20 32 436 18 340 00 96 18 22 05
- - -- - ---- ------ - - -- - - - -
--- - - -f-- - - l--~ - --- ---~-1---- - -
4 JILE SINGH 100 9 8 98 50 25 77 87 121 67 19 28 351 53 277 50 74 03 21 06- ------ - - - - - - ------ - ----- - --
- 1--- - 1------ - ---- -- - -----5 HEMRAJ 40 2 0 53 21 45 27 48 107 32 2 39 351 20 340 00 11 20 3 19
- f'--'-- - - ----- - - - - - - --- --- ----- - ----- 1-----
- --- - - - -~-- - -- '--- --- - - ----- - -
6 TOKEYB!,.!BANSAL __100__ 7 13 05 46 26 72 12 112 69 23 49 368 38 292 38 76 00 20 63- - - ------ - - - ---- - -
-- 1--- - -- - - - - --- ---- -- - ----7 JANTA FARM 100 7 8 38 59 2 1--_ 83 43___ 130 36 12 40 357 53 313 00 44 53 12 45
1--- - --- - - - -- -- - - --------- -
-- - - - ---- - - - ------ ------- - - - - --- - 1------- - - - -- ------ -- -8 PRAHLAD SINGH 25 2 0 65 139
I--~18 19 113 7 4 44 337 80 323 30 14 50 4 29----- --- -
----- --- -f--- - -- - - - - - -- - I--~--- - - --------
_L ANAND SING!"L___I-_ 63 6 3 89 49 44 1-- __6±- 64 160 40 7 29 340 73 303 43 37 30 10 95- - ---- 1--------
- - --- ----- --- ------ - - -- --10 ~.I:_gN.~!:l/!? CHAND 100 6 9 94 -- 50 43 -- I----
74 53 116 45 16 46 324 39 277 55 46 84 14 44-- - -- - --- ---
---- ---- - --- ----- - ------ -- - - -14 TC20 100 13 18 77 83 3 120 08 187 63 18 39 329 65 231 15 98 50 29 88- -- - - -- -- ------- -
- -- -- - - ------ --- --- - -14-A~ KU~R -- 40 5 ___L16 _ 28 32 l-_l~_15 153 71 10 03 287 49 262 00 25 49 8 87- - --- -- ------ - -
---- ---- -- ~---- - I-- - -14-B ~I KUMAR 25 3 0 42 15 95 20 46 127 9 2 54 261 59 246 17 lS 42 S 89----- -- --- - ---- ------ ---- - -
- ---- -- ------- -- --
~L~<!LA 100 8 7 77 57 43 81 50 _~~7 34__ 11 90 309 71 256 00 53 71 17 34- --- - - -- - - ----- - - - --- ----
-- - - - - ------ - - - -1--- 1-------- -- -- -16 KERU CHAND 63 7 3 89 39 21 52 95 I-- _1!~_~~ 9 02 280 43 255 72 24 71 8 81
- -- - ----- ---- - -- - - -
- - - -- ----- - - --- ----17 DAYANANDA 25 2 0 43 12 12 15 69 98 0 3 40 101 50__ 278 70 22 80 7 56- - - - - - --- - 1--- - -- - - c-_ ---
- ------ - ------ - - --------I- ____~-- 29221-- -------- --
17-A ~AGWAN 63 6 8 79 30 82 c-.-_--.1U! _I- 122 ~§ ~~~! - 208 67 83 54 28 S9- - -- - ------ - - ----- -
-- --- ~- -- - - ---- ---- - - -----1--- --18 RAM SWAROOP 25 2 0 61 12 83 16 80 105 0 4 47 273 30 256 17 30 6 33
- - - - -- - - ---- --- --- -- -- ---- ------ - - ------ - -- - - ---- -------- - - -- - - ---- -- - ---- --- ----
19 MEHAR CHAND 100 8 3 42 49 55 62 69 97 95 6 46 293 28 255 00 38 28 13 05- - - ---- - - - - --- --- -- - - - - - ---- - - -- - - ----- - -
- -- --------- ---~-- --- -- --- -- - -- - - -20 JAGHIR SINGH 25 3 0 31 15 2 18 25 114 0 1 99 279 28 274 00 -~- 1 89-- --- ---- --- - - - - -- -- - - - - ---- - -
- -- -- -- f- - - - ---- - - -- - - -- - - - - ---- - - 1---------21 PURAN CHAND 63 6 9 23 36 47 50 78 126 00 20 20 372 88 _ ....175_.QQ.. _ 97 88 f--~6 25-- - -- t - - - - --
I
FeasIbIlIty Report Upgradmg ofAgricultural D,stributIOn Network
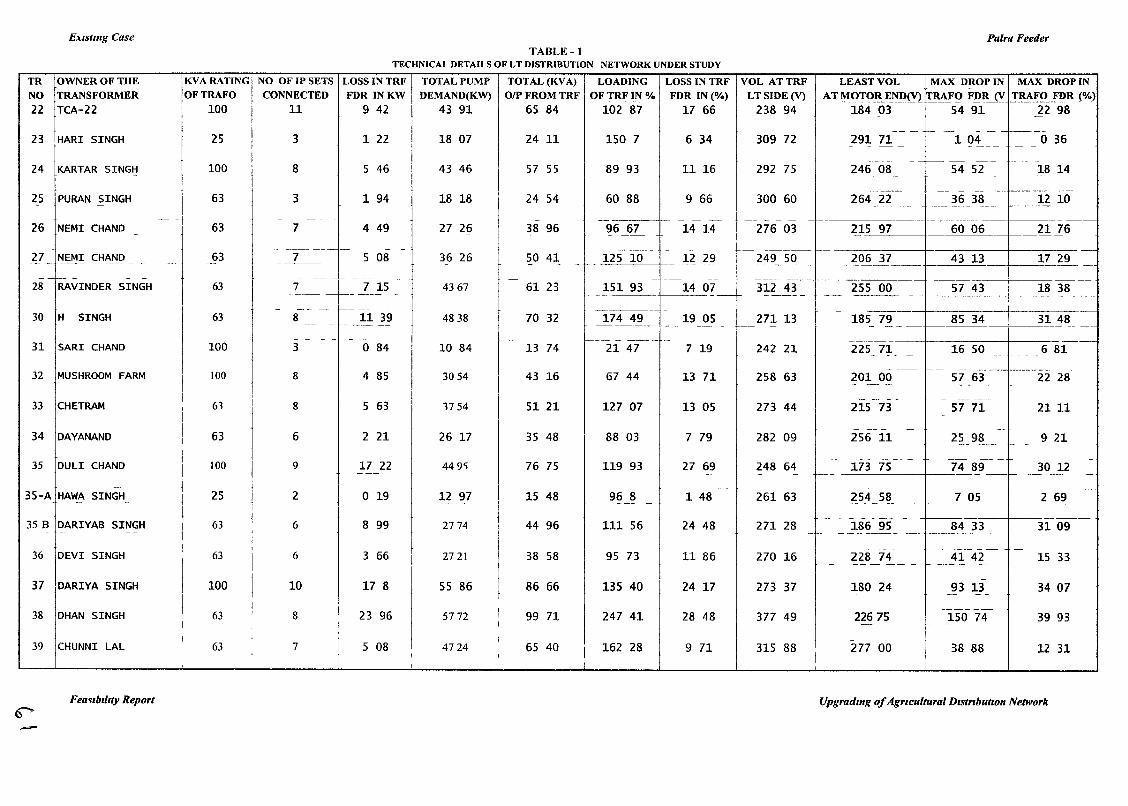
E:ustmg CaseTABLE -I
TECHNICAl DETAil S OF LT DISTRIBUTION NETWORK UNDER STUDY
Palra Feeder
TR OWNER OF THE !KVARATING NO OFIPSETS LOSS INTRF TOTAL PUMP TOTAL (KVA) LOADING LOSS IN TRF VOL ATTRF LEAST VOL MAX DROPIN MAX DROPINNO TRANSFORMER OFTRAFO CONNECTED FDR INKW DEMAND(KW) O/P FROM TRF OF TRF IN % FDR IN (%) LTSIDE(V) Al' ~-!>!~RE~.!>(Vl:r-~J?9 F.!>R (V TRAFO F~~ io/~
22 TCA-22 I 100 11 9 42 43 91 65 84 102 87 17 66 238 94 184 03 54 91 22 98---- - f- -- - -- ---
23 HARI SINGH 25 3 1 22 18 07 24 11 150 7 6 34 309 72 291 71 1 04 o 36- - -- ~ --- - -
~--- --I---- -- --- - --24 KARTAR SINGH 100 8 5 46 43 46 57 55 89 93 11 16 292 75 246 08 54 52 18 14- - --
-- -- -- - ----~~--
25 PURAN SINGH 63 3 1 94 18 18 24 54 60 88 9 66 300 60 264 22 36 38 12 10--- - ~--~- -- ----
- -I - --- - - - ~ - -- - - - -1---------f- ---26 NEMI CHAND
I63 7 4 49 27 26 38 96 96 67 14 14 276 03 £1~ 9?_ __60 06 __ ,--_21 26
- - --
- - ------- - - - ---- - - - ~---- 1-- --_2J_ NEMI CHAND 63 7 5 08 36 26 50 41 125 10 12 29 249 50 206 37 43 13 e----!~?~ --- -~-- - ----- - - -- --~ - ---- - - - -------- -- - - - - -- - - -- - - -- - -- -- --- --
28 RAVINDER SINGH I 63 7 7 15 4367 61 23 151 93 14 07 312 43 255 00 57 43 18 38- ---- - ----- - ------ ------ ----- -- ---- - - ------- 1-- --- ----- -- - 1-- -- -- ------ - -
30 H SINGH 63 8 11 39 4838 70 32 174 49 19 05 27113 185 79 85 34 3148-- 1------ ------- -- - -- - - ---- I----- --- - - - - - - 1------ - ----- - --- ---
31 SARI CHAND 100 3 0 84 10 84 13 74 21 47 7 19 242 21 225 71 16 50 6 81- - - - -- - - -- --- -- --32 MUSHROOM FARM 100 8 4 85 3054 43 16 67 44 13 71 258 63 201 00 57 63 22 28
- -- - - - -
- - -- - --- --33 CHETRAM I 61 8 5 63 1754 51 21 127 07 13 05 273 44 215 73 57 71 2111
I -
I - ~-- -- --34 DAYANAND 63 6 2 21 26 17 35 48 88 03 7 79 282 09 256 11 25 98 9 21-- -- -
- - --- - --- --- -- - -
35 DUll CHAND 100 9 17 22 449'; 76 75 119 93 27 69 248 64 173 75 74 89 30 12--- - - - - --- - -- f--- -- --- -
- - - - -- ---------j------ - - - - --35-A HAWA SINGH 25 2 0 19 12 97 15 48 96 8 1 48 261 63 254 58 _~~1__ 2 69- - - -- - --- -- - - - --
- - - --- - ---35 B DARIYAB SINGH I 63 6 8 99 2774 44 96 111 56 24 48 271 28 186 9S 84 33 31 09- - -- 1 - - -- --- ---- --- --~ ---- --
! --~-- - --- -- -36 DEVI SINGH 63 6 3 66 2721 38 58 95 73 11 86 270 16 228 74 41 42 15 33
- -- - -- - - ---- -
37 DARIYA SINGH 100 10 17 8 SS 86 I 86 66 135 40 24 17 273 37 180 24 93 13 34 07I
I - --- - - -
II ---- ---
38 DHAN SINGH 63 I 8 23 96 5772 99 71 247 41 28 48 377 49 22675 150 74 39 93It t - -
I
t I I -39 CHUNNI LAL 63 I 7 5 08 4724 6S 40 162 28 971 315 88 277 00 38 88 12 31, I t II I I
FeaVlbllrty Report Upgradmg ofAgricultural DistributIOn Network
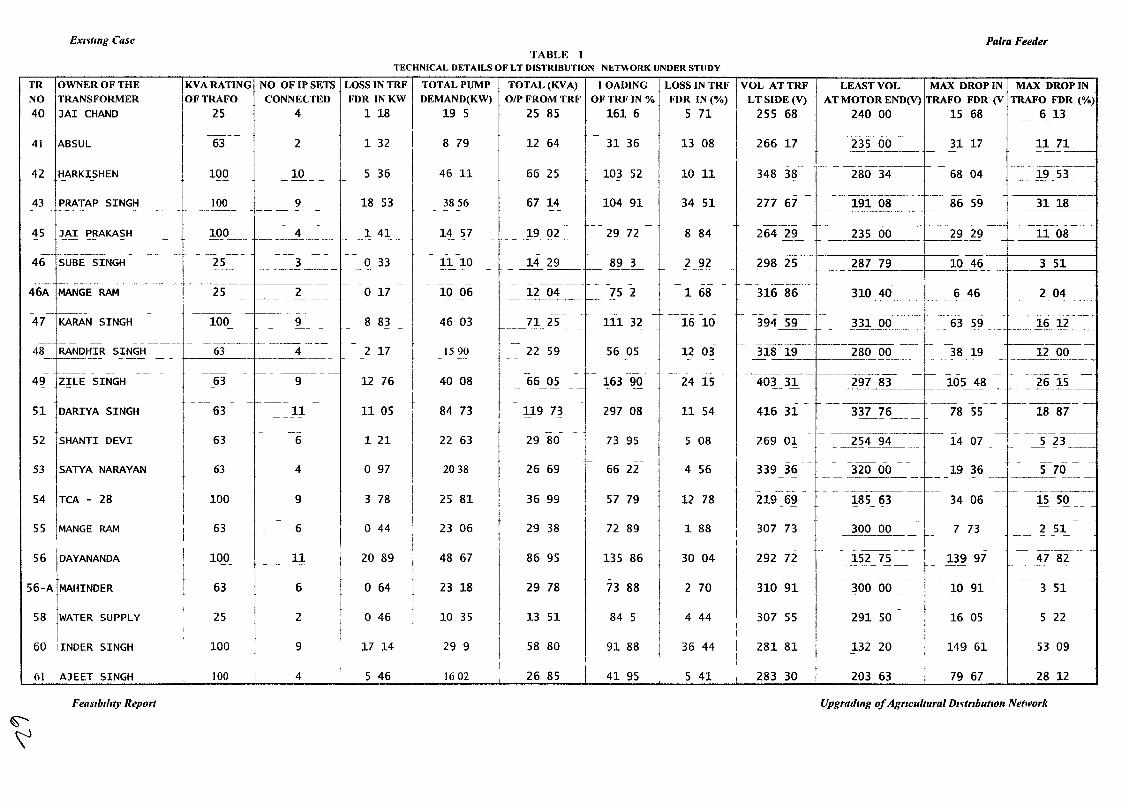
Exntmg CaseTABLE I
TECHNICAL DETAILS OF LT DISTRIBUTION N...T\\ORK UNDER STUDY
Palm Feeder
TR jOWNEROFTHE !KVARATING NO OFIPSETS LOSS INTRF TOTAL PUMP TOTAL (KVA) lOADING LOSS IN TRF VOL ATTRF LEAST VOL MAX DROPIN MAX DROPIN
NO rRANSFORMER IOFTRAFO CONNELTED FDR INKW DEMAND(KW) O/P FROM TRF OF TRF IN % FDR IN (%) LT SIDE (V) AT MOTOR END(V) TRAFO FDR (V TRAFO FDR (%)
40 JAI CHAND t 25 4 1 18 19 5 25 85 161 6 5 71 255 68 240 00 15 68 6 13
j-- -
----- - ------- -41 ABSUL 63 2 1 32 8 79 12 64 31 36 13 08 266 17 235 00 31 17 11 71
- - ------ - - ----
- --- -- -------- - - -42 HARKISHEN 100 10 5 36 46 11 I 66 25 103 52 10 11 348 38 280 34 68 04 19 53-- ---- - - --~- --
-- - - - --43 PRATAP SINGH 100 9 18 53 3856 67 14 104 91 34 51 277 67 191 08 86 59 31 18
- - -~- - -- - ---- ------ ~ - - - - -- - - - --- -- --
- - - - - - - - --- - --------'---- - - -------45 JAI PRAKASH 100 4 1--_-1: 43:_ 14 57 ___ --.!9~2__ 29 72 8 84 264 29 235 00 29 29 11 08-- -- - ----- -- - - r-- - - - -- ---- -
- ---- - -- - - -- --- - -- -- - - - - - - - - - - --- - -46 SUBE SINGH 25 3 0 33 11 10 14 29 89 3 2 92 298 25 287 79 c-----!CLi6__ 3 51----- -- ------- - - -- - - - ----- 1-- ---- - --- - ---
-- -- --- - - - - - -- - - - ----- - - - - -- - -- - - -- --46A MANGE RAM 25 2 0 17 10 06 12 04 75 2 1 68 316 86 310 40 6 46 2 04
I - -- ----- - - - ----- I---- - --
- -- ---- - --- - C---_____ --- - - ---- - - - -- - -- -- - ---- -- -- - ---------47 KARAN SINGH 100 9 8 83 46 03 __71-_ 2L __ 111 32 16 10 394 59 331 00 63 59 16 12- -- - - - --- -
-- -- -- - - ----- - -------'---- --- - -- - - ----- ------- --- - -------48 RANDHIR SINGH 63 4 2 17 1590 22 59 56 05 12 03 318 19 280 00 38 19 12 00- ----- --- - - f------- ------ - - -- -- - - - - - -------------- - -- - - - -------
- --- - - --- - --- - ~- ------ - - - -- - -- --- ----- ------- - -- - - - - -~--- -49 ZILE SINGH 63 9 12 76 40 08 66 05 163 90 24 15 403 31 297 83 10L~__ 26 15- --- -- - -- - -------
- -- - _c- ___ - f - - - - -- --- - -- -------51 DARIYA SINGH 63 11 11 05
1
84 73 119 73 297 08 11 54 416 31 337 76 78 55 18 87- --- - -- ~--
- -- - - - -- -- - - - - -- --- ------52 SHANTI DEVI 63 6 1 21 22 63 29 80 73 95 5 08 269 01 254 94 14 07 5 23- ---- ---- -- - - ---
c- - - - - - - --- - -- - -- - - -53 SATYA NARAYAN 63 4 0 97 2038 26 69 66 22 4 56 339 36 320 00 19 36 5 70
- - -- -- ------ - --- - --- ---- ----
!TCA I I- --- - - - ----- - -- - ------
54 - 28 100 9 3 78 25 81 36 99 57 79 12 78 219 69 185 63 34 06 15 50
lMANGE
- - - - - -- - --j -
II -- - -
55 RAM I 63 6 o 44 23 06 29 38 72 89 1 88 I 307 73 300 00 7 73 2 51I - ----- - --- - - -
1- - - - ----- - - -----
'61DAYANANOA 100 11 I 20 89 48 67 86 95 135 86 30 04 292 72 152 75 139 97 47 821 -- - - - -- -- -- - --- - -- -
I - - -- - --- - - -- - -56-A MAHINDER I 63 6 0 64 23 18 29 78 73 88 2 70 310 91 300 00 10 91 3 51
I I - - - --- - -I,
I , -58 IWATER SUPPLY 25 2 0 46 I 10 35 13 51 84 5 4 44 307 55 291 50 16 05 5 22
1 !j
I II II ,1 I60 IINDER SINGH 100 I 9 17 14 29 9 I 58 80 91 88 36 44 281 81 132 20 149 61 53 09
I II I
II
61 AJEET SINGH 100 I 4 5 46 1602 26 85 41 95 5 41 I 283 30 203 63 79 67 28 12
Feasibility Report Upgradmg ofAgricultural DntTlbutlOn Network
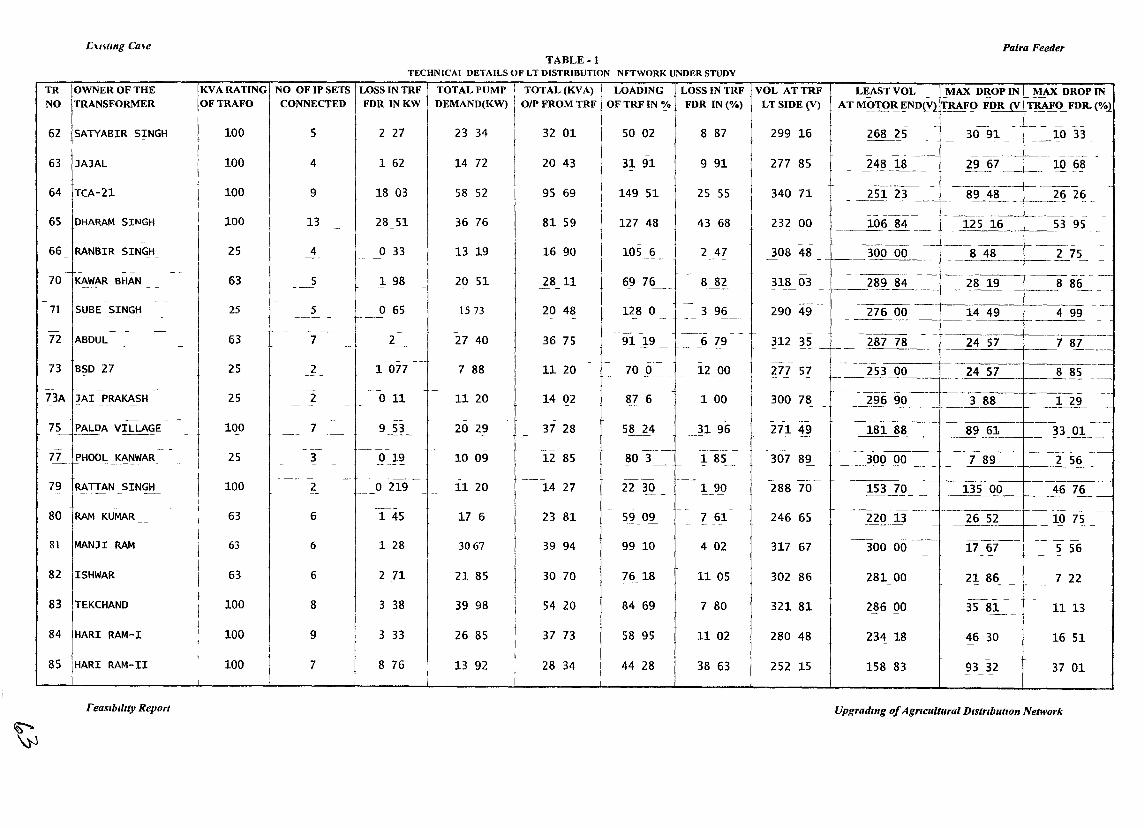
TABLE-lTECHNICAl DETAILS OF LT DISTRIBUTION NFTWORK UNDER STUDY
Palra Feeder
TRNO
30 91 10 33
------~~li7 10 68
--268 25
- ----248 18
LEAST VOL MAX DROP IN MAX DROP IN- - - - -..e:..=. _
ATl\1Q'!'.Q~~ND(v1 ~!() F~ T~L~FDR.(%l
277 85
299 168 87
9 91
50 02
-31 91
LOADING L()SS IN TRF jVOL AT TRFOF TRF IN % FDR IN (%) LT SIDE (V)
20 4314 72
TOTAL PUMP I TOTAL (KVA)
DEMAND(KW) 1O/P FROM TRF
23 34 32 01
1 624100
IKVA RATING I NO OF IP SETS !LOSS IN TRF!OF TRAFO I CONNECTED FDR IN KW
100 5 f 2 27
163 JAJAL
(
OWNER OF THETRANSFORMER
62 SATYABIR S!NGH
64 TCA-21 100 9 18 03 58 52 95 69 149 51 25 55 340 71-------1-- ----
_ 251 2} 8~~__~~ 2~_
65 DHARAM SI~GH 100 13 28 51 36 76 81 59 127 48 43 68 232 00 106 84--------- -_ 125 16 ~~3 95 __
66 RANBIR SINGH
- - --70 KAWAR BHAN
25
63
4
5
o 33
1 98
13 19
20 51
16 90
28 11
105 6
69 76--
2 47
8 82
.108 48 _ 1--__ 300 00-- -- ------- -
8 48 2 75
71-
SUBE SINGH 25 5 o 65f----
1573-
20 48 128 0 3 96 290 49---- - 1---._----+------
276 00 14 49 4 99- ----- - -- - -c.-'-----J_ ---__ _
- - -- ~
11 20 70 0 12 00
-312 ~~ _I- _ 287 7872 ABDUL
73 BSD 27
63
25
7
2
2
1077
-27 40
7 88
36 75 91 19 6 79
277 57
- - -------+--------__-,2::...4:.......::5.:..,7_-+__7 81.. _
- --- -----1-- -----~e----------
8\ MANJI RAM
80 RAM KUMAR
73A JAI PRAKASH
79 RATTAN SINGH
5 56
1 29
10 75
17 67
- -+------+-----_.__.-
300 00
181 88
!53..?.Q_ __ _=13::..:5:....c::0..=.0_+-_...:.46?~ _
-------+------ 1--.- -
_~ _~l:.._I__- ~3 _Q!__
--- - -- -- - --_._---- - -- -- -~~13 _ 26 52
- - --- - --- f--.-- ---_-1-- ____296 90_ _ 3 88
271 49
300 78
317 67
246 65
-288 70
- - --1---------- _307 8~_ _-l.Q.9 .QO __ _ _ ....:..7-=..:89=-_-1__--'2=_..::5...::...6 _
1 00
1 85--
1 90
4 02
87 6
80 3 1-
22 30
99 10
~ - ~ -59 09 7 61
58 24 31 96---
39 94
-37 28
14 27
14 02
12 85
23 81
3067
17 6
-20 29
11 20
-11 20
-10 09
011
1 28
o 19
1 45
9 53
o 219
2
7
6
6
3-~-- -
2
63
25
25
63
100
100
7~ YALDA V~L_L_AGE_ - II
'U-!,!,OO~ _~"!~~~ _
jIt
I
I
82 ISHWAR 63 6 271 21 85 30 70 76 18 11 05 302 86 281 00 21 86- -- 7 22
83 TEKCHAND 100 8 3 38 39 98 54 20 84 69 7 80 321 81 286 00 35 81 11 13
84 HARI RAM-I
85 iHARI RAM-III
100
100
9
7
3 33
8 76:
26 85
13 92
37 73
28 34
58 95
44 28
11 02 280 48
38 63 I 252 15
234 18
158 83
46 30 16 51
-93 32 37 01
Feasibility Report Upgradmg ofAgricultural DistributIOn NelJVork

Existmg Case Palra FeederTABLE-l
TECHNICAL DETAILS OF LT DISTRIBUTION NETWORK UNDER STUDY
KVARATING NO OF IP SETS LOSSINTRF TOTAL PUMP !Q't~L{KVA) LQAJ)Irt!~_ !-Q~S!rt!T~F_ VOL.ATTRF LEASTVOL __MAX DR0I>..-I~ ~AX DROPIN_()~~RAFO ~ONNEC.!~D_ FDR INKW _DEMA~!!(If~l O/PFROMTRF ~!TRFINo/!. YP!!_JN(%)_ !-!~!D~Q:L ATMOTOREN~(V} TRAFO FDR (V TRAFO FOR ~o/!l
--j--------f
-----t-- - -- - ---+-------+---.-----1
---::-c----j---------
.;::2c:5_2==--.:1::=5_+--_l,?_8_8_3_ _ 93 32 37 01- - -- - - - - -- -
28 34 44 28 38 63- ---- - - - -~--- -- -.
- - - ---1--- ------~ - ---- --f---- --- ---~ -------+-------~--__II_----
13 92
f----
8 767100
i------ ------- -
-----1'------- - ----- -
TR OWNER OF THENO TRANSFORMER- - -- ---
- ~~ ~--
85 HARI RAM-II-- - -
- - - --
----- -- -
164 %
---+----
-- -j----
-----
-~--------+--------- ---------- - ------1--------144475 kW--------t-------\
- -------
- -----1---
----- - - - --- ---
TOTAL LOSS IN THE mANSFORMER EEEDER1---- _-- I ~~_-~_-
AVERAGE VOLTAGE DROP IN THE mANSFORMER EEEDERI ---=-=__ -r=-:=-l ~--_--L- -_--1---=--_- __-_~-=~__
AVERAGE LOSS IN mANSFORMER EEEDERS w r t: TOTAL POWER SUPP FROM SUBSTATION 11 7 %r- - --L~-~--C-- r - I ----- ---~- - --e- ---- -------=-~---+---- - --------~---~-----
NOTE 1 T!a."~for"!.er_NOS 13,59,7~f!6,~~nd 68 ~ter to pur~ly I!0mes_tlc load _ _ _ _ _ _ _ _ . -----+--------1~ .!!ansformet: No 11 caters to put:~DomestiC ",,~t~r ~~.plyj ___ _ __~_ _ f----- _ _ f-------!--------~-_+_--~Transformer Nos 79 and 85 caters to both agricultural and domestiC loae:! ~___ _ _ _c-_____ __ ~ -+_____ _ -+--------f4 However for our study purposes only agnculturalload IS accounted __ ___ ~__I--_~ j- -+- +-__~
___~9?nslderlngthat the eXisting transformers are run!!.lnQ. for several years and a!e.. rewound at lea~on~e _~~Ir permiSSible loading limit ha~ been taken as 64% o! the transformer r..ated capacItY __~ _ _ ~__I--- _
~ % loading of eXisting transformers has been arrived on t¥ baSIS _ _ ___ -+-- -j- +- ---t--------\
Feas'b'"ty Report Upgradmg ofAgricultural DlStrlbut,on Network
•
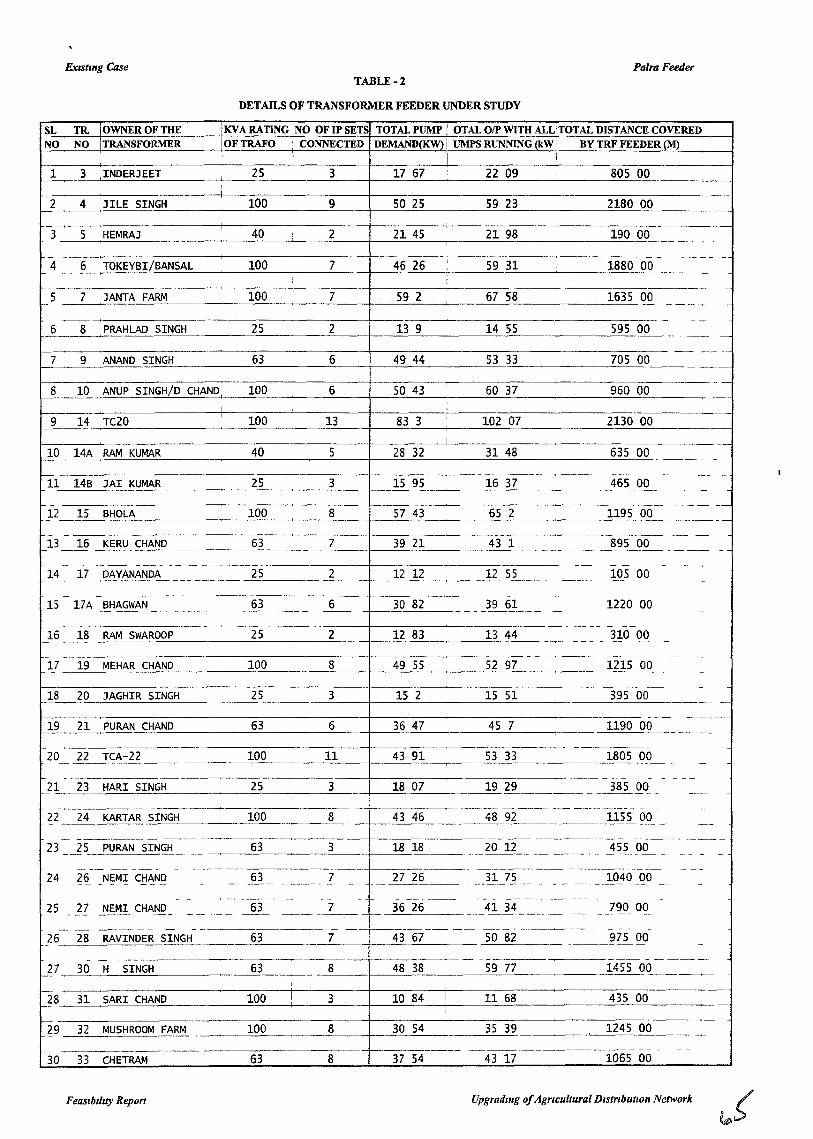
ExISting Case Palra FeederTABLE-2
DETAILS OF TRANSFORMER FEEDER UNDER STUDY
SL TR. IOWNER OF THE iKVARATING INO OFIPSETS TOTAL PUMP OTAL OIP WITH ALL TOTAL DISTANCE COVEREDNO NO ITRANSFORMER IOFTRAFO I CONNECTED DEMAND(KW) UMPS RUNNING (kW BY TRF FEEDER (M)
I I1 3 INDERJEET 25 3 17 67 22 09 I 805 00
I
2 4 JILE SINGH 100 9 50 25 59 23 2180 00
--3 5 HEMRAJ 40 I 2 21 45 21 98 190 00I
~ --- -
- --- --- -- -4 6 TOKEYBI/BANSAL 100 I 7 46 26 I 59 31 1880 00I--
I- -
I- -5 7 JANTA FARM 100 7 59 2 67 58 1635 00
- - -------- - -
6 8 PRAHLAD SINGH 25 2 139 14 55 595 00-~-- -
-- -- .,.............-
_? 9 ANAND SINGH 63 6 49 44 53 33 705 00 ----
8 10 ANUP SINGH/D CHAND 100 6 50 43 60 37 960 00:
--I
I
9 14 TC20I
100 13 83 3 102 07 2130 00I
10 14A RAM KUMAR 40 5 28 32 31 48 635 00 --- --11 14B JAI KUMAR 25 3 15 95 16 37 465 00
- ~ -- - --
12 15 BHOLA 100 8 57 43 65 2 1195 00 ----- - -- -13 16 KERU CHAND 63 7 39 21 43 1 895 00
- --- -------- ----- -
- --- -- ---- -- - --I-- -- - - ~ - - -
14 17 DAYANANDA 25 2 12 12 12 55 105 00- -- ---- --- ---- ----- ------~ -- - - - ---- - - - -- - ---- --- - -
15 17A BHAGWAN 63 6 30 82 39 61 1220 00--- ---- - -----~-- - -------- - - - ------- - -- --0----- _____ --16 18 RAM SWAROOP 25 2 12 83 13 44 310 00
- ---- -- --- --- --- -
- --- -- -- - - -17 19 MEHAR CHAND 100 8 49 55 52 97 1215 00
- ---- --- -18 20 JAGHIR SINGH 25 3 15 2 15 51 395 00 -
- ---19 21 PURAN CHAND 63 6 36 47 45 7 1190 00 -- --
- -------20 22 TCA-22 100 11 43 91 53 33 1805 00
-~ -- -
- - - - -- - - - --21 23 HARI SINGH 25 3 18 07 19 29 385 00-- ------ - ---- -- ------- ---- - -- - -------- - - -
22 24 KARTAR SINGH 100 8 43 46 48 92 1155 00----- --- ---- --- --------
23 25 PURAN SINGH 63 3 18 18 20 12 455 00-- - ------ ---- - -- - -
--- --- -~~ - ----- --- - -24 26 NEMI CHAND 63 7 27 26 31 75 1040 00-- - - --- - ----- ----- - -------- --- --- -- -------- -- -
- - ~- --- --- -- - - ------- - --- ----- - --- - -
25 27 NEMI CHAND 63 ______7___ 36 26 41 34 790 00--- -- -- ____-0-_ - -------- -- -- -- --
-- - ---- - ------------ ----------- -- --- --------- - - - -26 28 RAVINDER SINGH 63 7 43 67 50 82 975 00------- -
- --- -- -- ------- - -- -----27 30 H SINGH 63 8 48 38 59 77 1455 00___--"--_
-I
-10 84 11 68 435 0028 31 SARI CHAND 100 I 3 I
- -I
-- --29 32 MUSHROOM FARM 100 8 30 54 35 39 1245 00 -- -
--~----------- - ~- - -
30 33 CHETRAM 63 8 37 54 43 17 1065 00
FeasIbILIty Repon Upgradmg ofAgrlcultural DIStributIOn Network
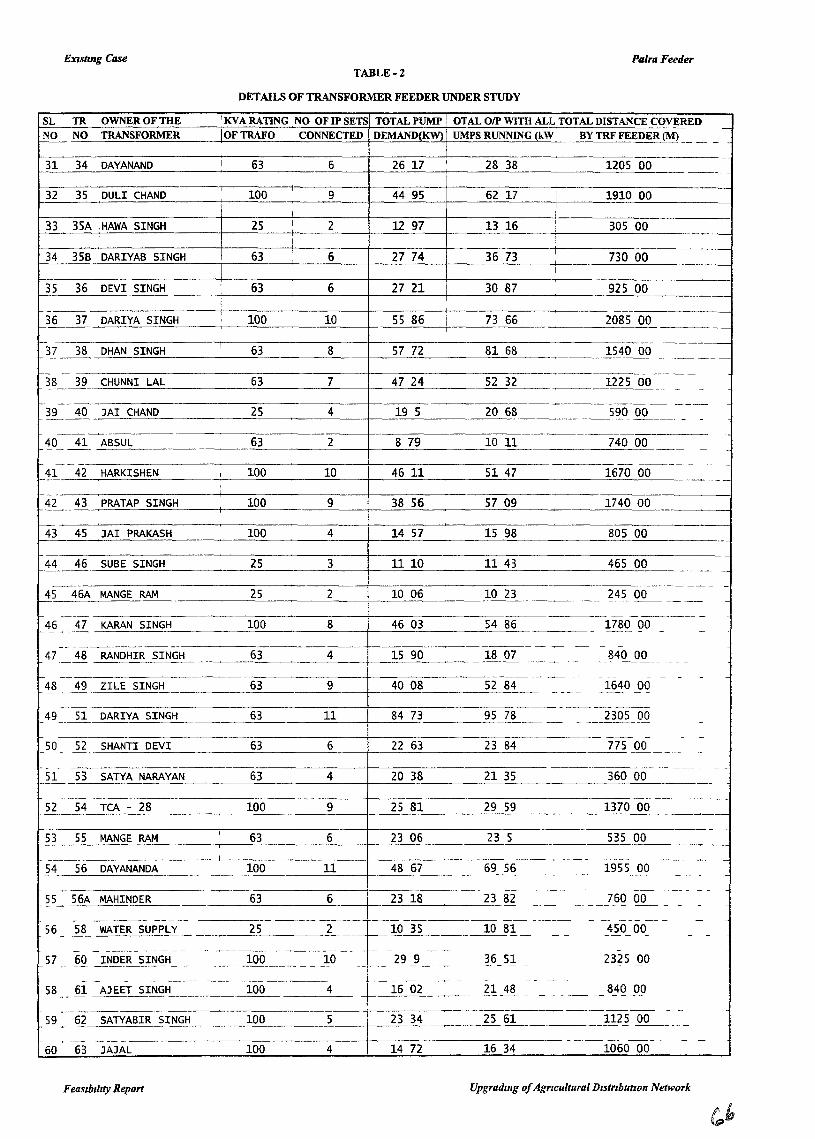
EXlStmg Case Palra FeederTABLE-2
DETAILS OF TRANSFORMER FEEDER UNDER STUDY
~TR OWNER OF THE IKVARATING NO OF IP SETS TOTAL PUMP OTAL OIP WITH ALL TOTAL DISTANCE COVEREDNO NO TRANSFORMER OFTRAFO CONNECTED DEMAND(KW) UMPS RUNNING (kW BY TRF FEEDER (M)
-e--- -- -- ---
I --31 34 DAYANAND I 63 6 26 17 I 28 38 1205 00
I---
32 35 DULl CHANDI
100 9 44 95 62 17 I 1910 00I :I
33 3SA I HAWA SINGH 25 I 2 12 97 13 16 I 305 00I
II
34 35B DARIYAB SINGH 63I
6 27 74 36 73 I 730 00I
35 36 DEVI SINGH 63 6 27 21 I 30 87 925 00 ---36 37 DARIYA SINGH I 100 10 55 86 I 73 66 2085 00If-.--- --
- --- ------37 38 DHAN SINGH 63 8 57 72 81 68 1540 00
- --- ----- -----38 39 CHUNNl LAL 63 7 47 24 52 32 1225 00
- -- ----
39 40 JAI CHAND 25 4 19 5 20 68 590 00--- - --
40 41 ABSUL 63 2 8 79 10 11 740 00---- -
-- ----- ------ - -41 42 HARKISHEN I 100 10 46 11 51 47 1670 00 --
I
-
_12 43 PRATAP SINGH 100 9 38 56 57 09 1740 00
-43 45 JAI PRAKASH 100 4 14 57 15 98 805 00
44 46 SUBE SINGH 25 3 1110 11 43 465 00-- -
---- -45 46A MANGE RAM 25 2 10 06 10 23 245 00- ------ -
--- - ------~-
46 47 KARAN SINGH 100 8 46 03 54 86 1780 00----- --- . ----------- --- -- - .
47 48 RANDHIR SINGH 63 4 15 90 18 07 840 00--- ------- -- ~--~------ - -
- -- ---~- - -- - - - -48 49 ZILE SINGH 63 9 40 08 52 84 1640 00---~ - --- -- - -
--------49 51 DARlYA SINGH 63 11 84 73 95 78 2305 00- ----.- - -----~---- -
-- - - -50 52 SHANTI DEVI 63 6 22 63 23 84 775 00
- - ------ .- - ---~ - -
2L 53 SATYA NARAYAN 63 4 20 38 21 35 360 00 -
52 54 TCA - 28 100 9 25 81 29 59 1370 00 --- -
53 55 MANGE RAM I 63 6 23 06 23 5 535 00--~-
I~--------- -
54 56 DAYANANDA 100 11 48 67 69 56 1955 00---------- - ---
, --- ------- ------ --S5 S6A MAHINDER 63 6 I 23 18 23 82 760 00
- - --- - ~--- - --- - -- -- --- ----- -------- ---------- -- ------ - - --- --- -
56 58 WATER SUPPLY 25 2 --f--10 35 10 81 450 00. -- -------- -- - - --- - - -
- - ------ --- - -----~ -------- --- - - --- -
57 60 INDER SINGH 100 10 29 9 36 Sl 2325 00..... -- ------ - - -------- - - -- - 1--- - - - - - -
- - - - ---- ------- ---- --- -- -- - - - - -- -58 61 AJEET SINGH 100 4 16 02 21 48 840 00-- -- ---- ---- - ~ --- - - ~--
----- ------ - -
59 62 SATYABIR SINGH 100 5 23 34 25 61 1125 00- - --~---
..- --- --------- ----- ---- - -60 63 JAJAL 100 4 14 72 16 34 1060 00
FeasIbIlIty Report Upgradmg ofAgrIcultural DlStrlbutlon Network
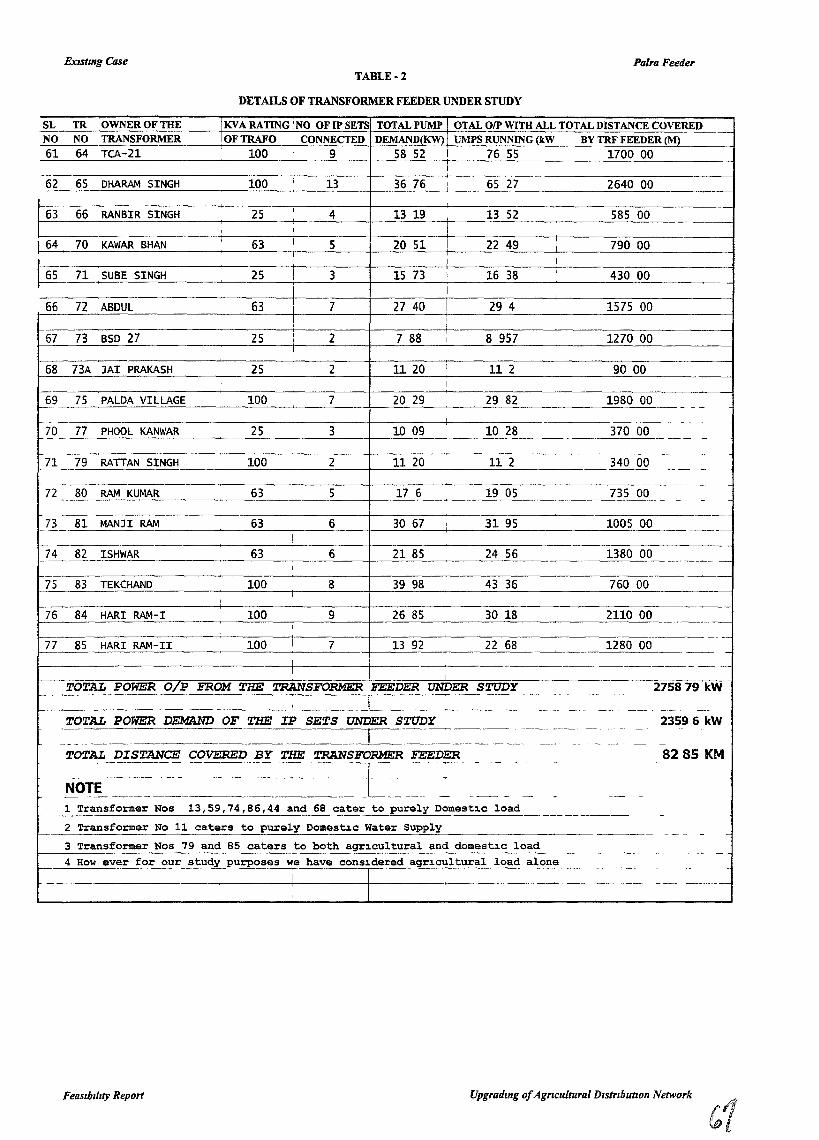
exISting Case Paira FeederTABLE·2
DETAn.s OF TRANSFORMER FEEDER UNDER STUDY
SL TR OWNEROFTHE IKVARATING NO OF IPSETS TOTAL PUMP I OTALOIPWITHALVTOTALDISTANCECOVEREDNO NO TRANSFORMER IOF TRAFO CONNECTED DEMAND(KW) I UMPS RUNNING (kW BY TRF FEEDER (M) --
61 64 TCA-21 100 I 9 58 52 I 76 55 1700 00-=:...-.-...::..c..~-="':'-::':::"'-'-_---_---':::::":::'-_-+-_-=:"'---1--=:"""::':=---r-I-""':"":~-=--- ~~~~ "_
62 65 DHARAM SINGH 100 I 13 36 76 ' 65 27 2640 00I I
790 0022 49
63 66 RANBIR SINGH 25 4 13 19 13 52 585 00t--=-=---=-=---:..:::-::-=.;=---=-=.:..:.=-=----+-'--=-=---+,__-'--_-+_-=-==---+1__-==---=-=-- -=-:::-::-.-= _
I 64 70 KAWAR BHAN I 63 I 5 20 51 II I I IJ------------------+-----+-----+--------------------
65 71 SUBE SINGH 25! 3 15 73 I 16 38 ' 430 00I-'-=---'--=--...=--:---'---'------~-=-=---I----=----+--=-'--=---+---=-=--=---------'-'=--=-~---"-----
I
66 72 ABDUL 63 7 27 40 I 29 4 1575 00
67 73 BSD 27 25 2 7 88 8 957 1270 00
68 73A JAI PRAKASH 25 2 11 20 112 90 00
69 75 PALDA VILLAGE 100 7 20 29 29 82 1980 00-----------------------t--'--"--'-------'-----'-'--------==---'--=--- - --- - ----------------------t------+---------------~- - - -
70 77 PHOOL KANWAR 25 3 10 09 10 28 370 00-----=-=--=,--"-------=--'=--=-=-- -- - ------------ --,--_+-1 +-_--------:-"---------- _ _ _
71 79 RATTAN SINGH 100 2 11 20 11 2 340 00
-----------------------+-------------------- ----- --72 80 RAM KUMAR 63 5 17 6 19 05 735 00
73 81 MANJI RAM 63 6 30 67, 31 95 1005 00--==----==---.C-::-=-:.:-=-.=..::-'-----~--=--'--t__--=---f_-=-=--.:::..:.--I----=-=--'=-=-------==-=..:=--=-=-------
74 82 ISHWAR 63 I 6 21 85 24 56 1380 001--'--'-----=-=---==-=---=-=--------""-=---1----=-----1----==-=-=------=--=-=--------==--=--=--=-=--'-- ------
75 83 TEKCHAND 100 8 39 98 43 36 760 001--'-=---=-=--'----'-"'---'-'-"----------==-=--=---.,----=-----1----==--=-:=-------=-=-=----------'-'=--=--=--=---------I1----------------1-----------1----------------------------
76 84 HARI RAM-I 100 9 26 85 30 18 2110 00
~=77===8=5==H=A=R=I==RAM==-::I::I=====~'===::1=0:::0===I:====7====:===1:3=9:2===:=====22==6:8===========::1:2:::80==0::0===--_~_-:--=f_----------------+:-----!-------------------"--- -- -
-- TOTAL POWER. OjP FROM THE T.RANSFORMER FEEDER UNDER STUDY 2758 79 kW1--------------=-------------,--------------- - ----- --, --'-' -----.1.. " _
8285 KM
23596 kW---
TOTAL POWER. DEMAND OF THE II' SETS UNDER STUDYI ------~------------__ _ --1- " _
TOTAL DISTANCE COVERED BY THE T.RANSFORMER FEEDER
NOTE ~=_~~----- --------~_--_~~--~- ~~~~-_-~ -~ ~1 Transformer Nos 13,59,74,86,44 and 68 cater to purely Domest1c load
2 Transformer No 11 caters to purely Domest1c water SupplyI-----:=-:.--'------------~--'----:.'----'-'-'------_---:.'-"--"----------------- - - - ~ -
3 Transformer Nos 79 and 85 caters to both agr1cultural and domest1c load1------------------------"------------------------ ~ ~- -4 However for our study purposes we have cons1dered agr1cultural load alone
------------ -+I --+_-------------------~------
Feasibility Report Upgrading ofAgricultural D,strzbutlOIl Network
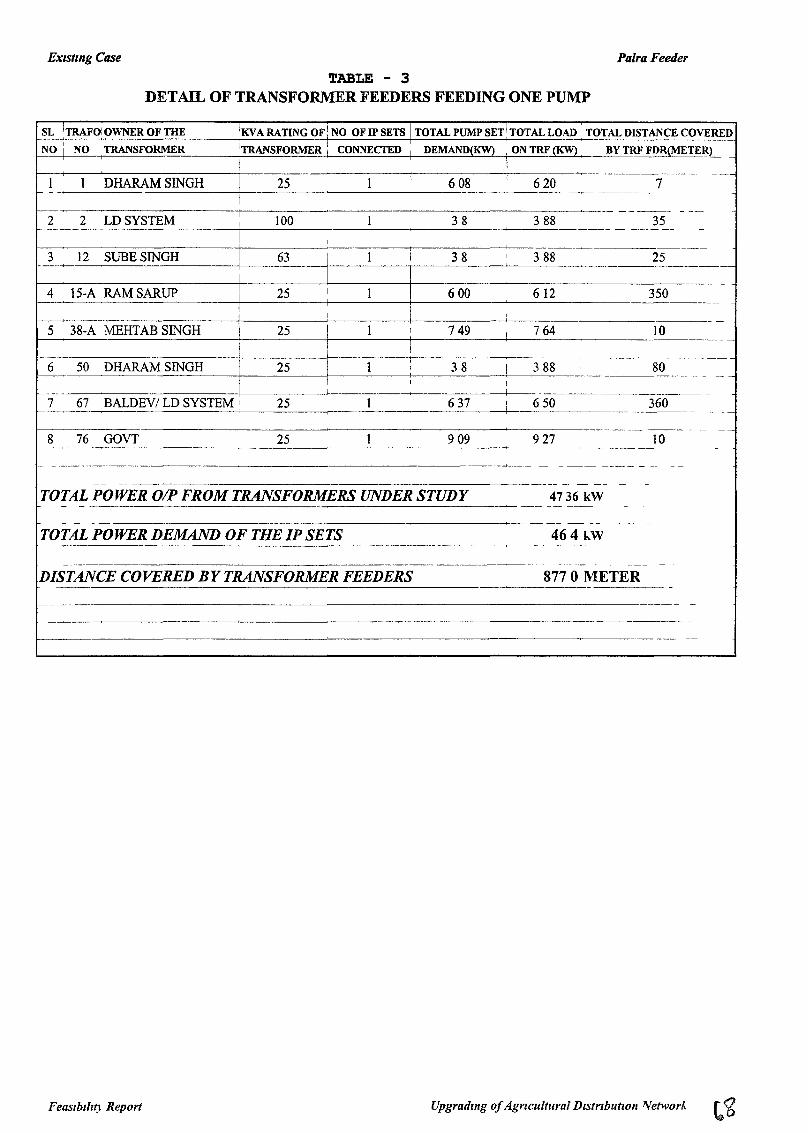
EXlStmg Case Palra Feeder
TABLE - 3DETAIL OF TRANSFORMER FEEDERS FEEDING ONE PUMP
SL ITRAFOiOWNEROFTHE IKVA RATING OF INO OF IP SETS ITOTAL PUMP SET ITOTAL LOAD TOTAL mSTANCE COVEREDNO I NO TRANSFORMER 'TRANSFORMER: CONNECTED I DEMAND(KW) IONTRF(KW) BY TRF FDR(METER)I I
I-
II I
~ --- ---
I I DHARAM SINGH I 25 1 608 620 7I- -- I
-- ------I
--I -- ----- - --~
2 2 LDSYSTEM I 100 1 38 388 35I ---~ - ----- -
I II
I I
3 12 SUBESINGH I 63 I 1 I 38 I 388 25I
II
II --
I-
4 15-A RAM SARUP 25 I I 600 612 350, ! I
-
5 38-A MEHTAB SINGH 25 I 1 I 749 , 764 10
I-
I
6 50 DHARAM SINGH 25 I 1I
38 388 80I I I
I-- -- -
I I
-
7 67 BALDEV/ LD SYSTEM I 25 1 637 I 650 360I I
I - - --
--8 76 GOVT 25 1 909 927 10
---- - - -
I-- - -- - ---- ---- - - - -
-- -- -- - - -- - -
TOTAL POWER OIP FROM TRANSFORMERS UNDER STUDY 4736 kW- - -- --- --~ - -
- - -- ------~~ - - -
TOTAL POWER DEMAND OF THE IP SETS 464 kW- -- ---~ - -- -- -
--~ -- --- --
DISTANCE COVERED BY TRANSFORMER FEEDERS 8770 METER-
- I - -
I -
-- -I
I
FeaSlblllt) Report Upgradmg ofAgricultural DistributIOn 'Vetworl..
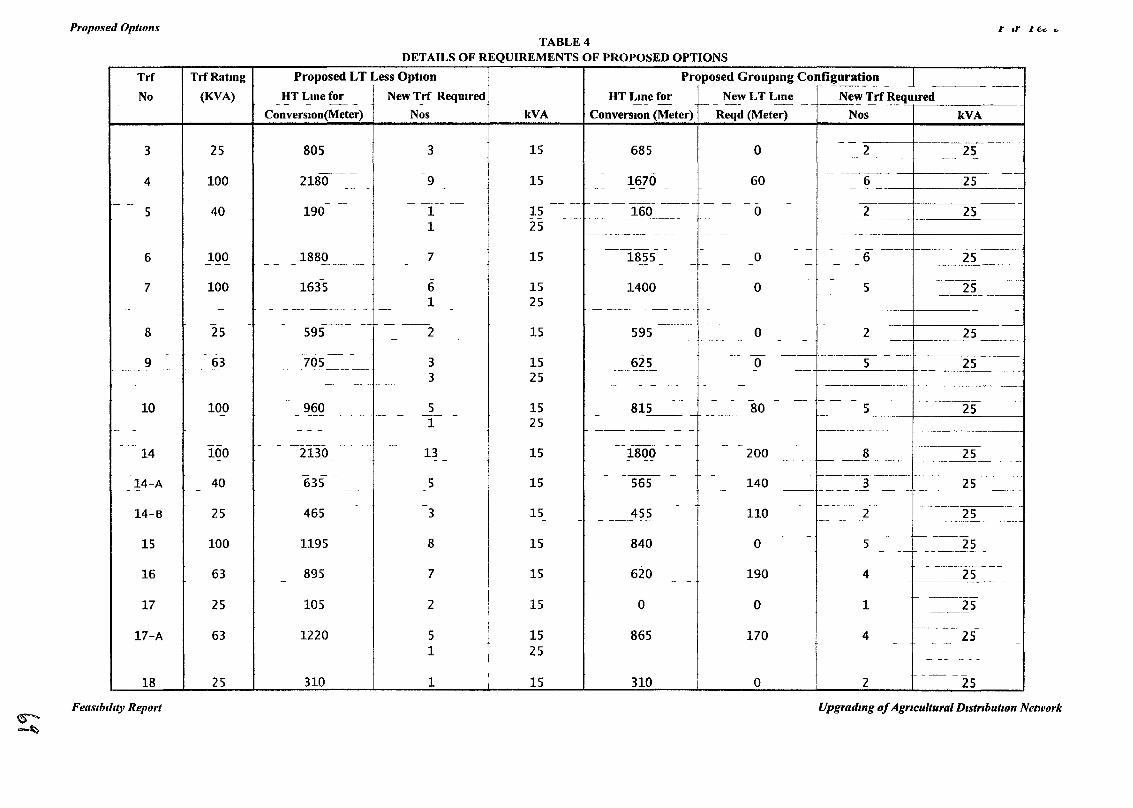
Proposed OptwnsTABLE 4
DETAILS OF REQUIREMENTS OF PROPOSED OPTIONS
Trf TrfRatmg Proposed LT Less Option Proposed Groupmg Configuration J- ---- - --~--- --No (KVA) HT Lmefor New T_rf Required HTLmefor NewLTLme ~!'! ,!-rf Required- - - - -- -- - 1--- -- -- -
ConverslOn(Meter) Nos kVA ConversIOn (Meter) Reqd (Meter) Nos kVA
-- 2---f------- -- - -3 25 805 3 15 685 0 25- ---
---- - - --- ----- - 1------ --4 100 2180 9 15 1670 60 6 25-- - - -- - - - - - -
- - - -- -- -- - -~- -- -- -- ---------- - - - - -
5 40 190 1 15 160 0 2 25- - - - - ---~--- ---- -- --
I 25- ----- --- - - - -~--
----- -- - - - - - -6 100 1880 7 15 1855 0 6 25
- - -- - - - ---- - - -- - - - - - - - - - -
- - ----- --7 100 1635 6 15 1400 0 5 25- - - - - -------
1 25-- - - -~-- --- - -- - --------- - - -- -
- - ---- -- - -~--- - -- ----- - -- -- -
8 25 595 2 15 595 0 2 25- - -- -- -- - - - --
- - - - - - -- - - - - - --- ---- 1--------- -9 63 705 3 15 625 0 5 25---- -- ----- -- -~--------- - - ------- - -- r- --
3 25- - - - -- - - - - - ---- - - -
- - - - - - - - -- f- -- -10 100 960 5 15 815 80 5 25- --- - - - - - - - ---- - -- -- - -- --- f---
1 25- - - - - - ----- - - - - - -
--- -- - - ------ - - -- - -- - - - - - -14 100 2130 13 15 1800 200 8 25- - - - -- ---i-- --- -- --
- - - - - --- - - - - ------ - -14-A 40 635 5 15 565 140 3 25- - - --- - - --- ---- -- -- -
- - - -- -- -- -- -- - -14-6 25 465 3 15 455 110 2 25- - - - --- - -- --- - -- ---- - -----
- - - - - -- ----IS 100 1195 8 15 840 0 5 25-- - -- ------ -
895 15 620-------
16 63 7 190 4 25- - - - ------- - -
105 15 0f- -----
17 25 2 0 1 25-----
1220 5 I 15 865f----- -
17-A 63 f 170 4 251 25
- - - -
I - -- - --
310I
310-- --
18 25 1 15 0 2 25
FeaSibility Report Upgradmg ofAgricultural DistributIOn Network
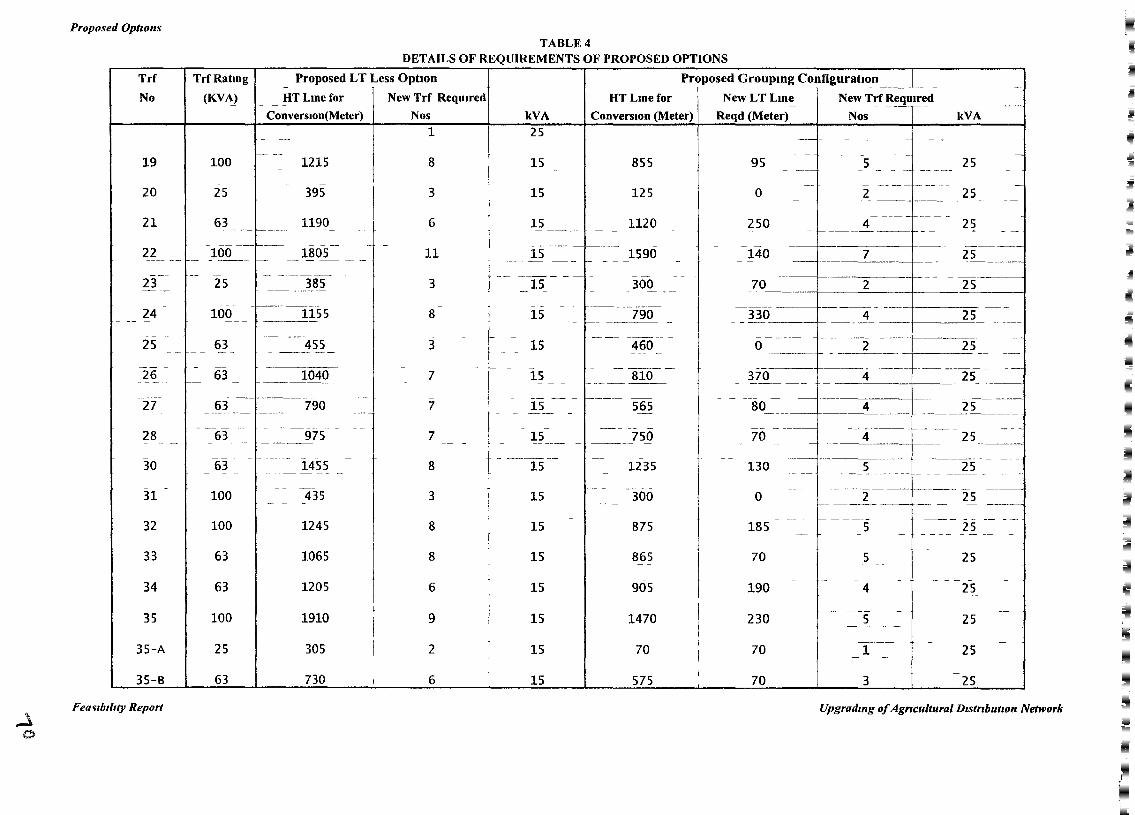
TABLE 4DETAILS OF REQUIREMENTS OF PROPOSED OPTIONS
Proposed Optwns
Trf
No
TrfRatmg
(KVA)
Proposed LT Less OptIon-
HT Lme for New Trf ReqUIred
ConverslOn(Meter) Nos1
kVA
25
Pr~posed Groupmg Configuratlo~ L _HT Lme for I New LT Lm~ New Ti! ~eqUl!"t!.d
ConversIOn (Meter) Reqd (Meter) Nos
-
kVA--
II
1@
19 100 1215 8 15 855 95 - --- 5- -
25
20
21
25
63- --1---
395
1190
3
6
15
15
125
1120
o
250
1.. ----f---- _ 25_- ----f---- - -
_ I- ~___ __ 25
22 1805 11-f----
15 1590 140 ______-=7~_-l-_------~L__
23 25 385 3 15 300-----1---------+-- - - -----~
}O- +-_--=2=--__i- -=-2=.5__-I
24 100-1-------
1155 8 15 790-- 1-- ------ -
--------1----- --.-+----- ---__ 33_0 1- 4... __i~--=-25:.-_-- _
25 63 455 3 15 460---1-----o __-=-2 i__.......:2::.::5 _. _
26
27
63 1040- - -1--------63 790
7
7
- - -15
15
810
565
-----~---- --1------ ---_ ~O _ _ _-.:.4 +-__ 25 _
- - - --------1-- -----80_ 4 1--_--=2:.:5~ _
1-- --
25_ 1-- 4..:..-_-l-__7501579756328
530 63 1455 8 15 1235- --1-------
130 25-
31 100 435- -3 15 300 o -- - -- - -1------- - ----
I-- ~ 25 __
32 100 1245 8 15 875 185I- - --
5 25
33 63 1065 8 15 865 70 5 25
34 63 1205 6 15 905 190 4 25
35 100 1910 9 15 1470 230 5 25
35-A 25 305 2 15 70 70-----
1 25
Upgradl1lg ofAgricultural DIstributIon Network
35-8
Fea~lbllttyReport
63 730 6 I 15 575 70 3 25
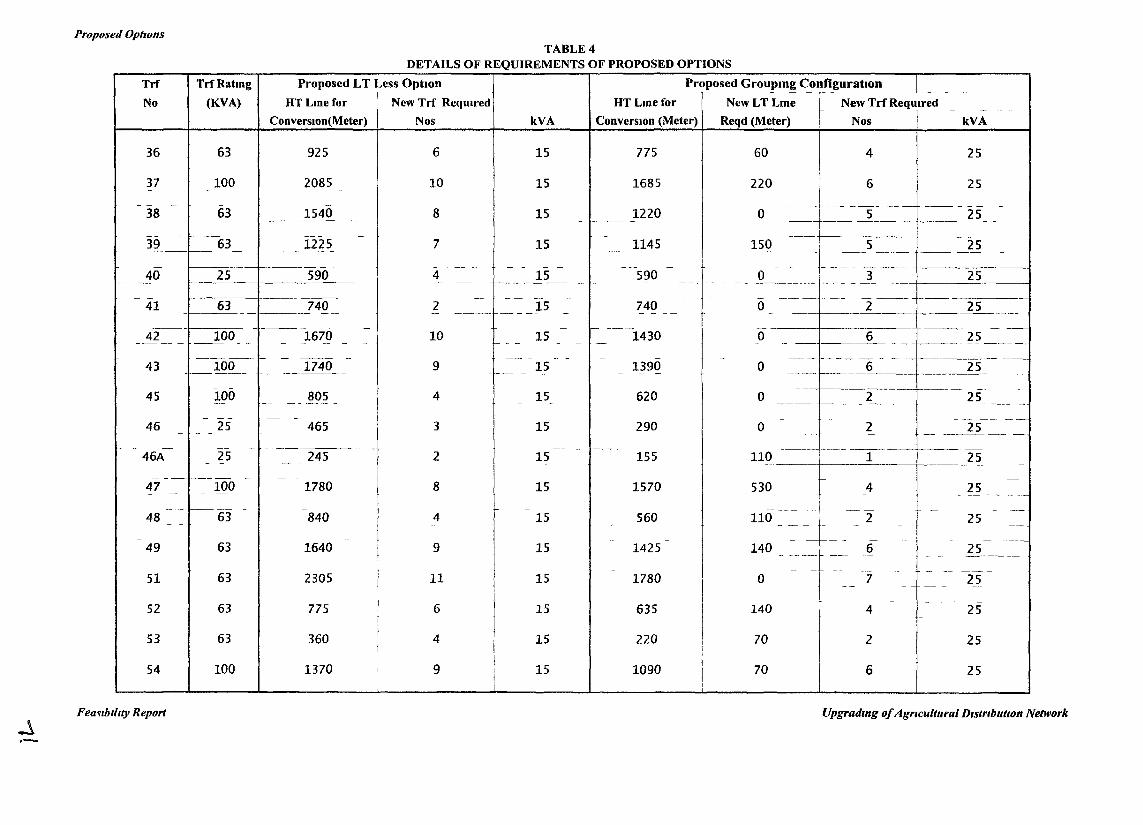
Proposed OptionsTABLE 4
DETAILS OF REQUIREMENTS OF PROPOSED OPTIONS
Tn Tn Ratmg Proposed LT Less OptIOn Proposed Groupmg ConfiguratIOn jI
1 - -
r-- - -
No (KVA) HTLmefor New Tn Required HT Lmefor New LT Lme New Tn Required
I- - - -
ConverslOn(Meter) Nos kVA ConversIOn (Meter) Reqd (Meter) Nos kVA
36 63 925 6 15 775 60 4 25
37 100 2085 10 220- - -
15 1685 6 25- - -
- - - - - --- --- --- ----- -38 63 1540 8 15 1220 0 5 25- - - - -- - - ~---~ - ---- --- -~ -
-- - -- -~- - - - - - -- -39 63 1225 7 15 1145 150 5 25-----------r - - -- - --- - ----- - ---- -
-- - - - - -- - - - - - --- - - - - - -- -~--- - --40 25 590 4 15 590 0 3 25-- -- - - - --- - ------ - - --- - - --- ---- --- - -- -
- - - ---- -- -- -- - - - - ---- -- --- ---41 63 740 2 15 740 0 2 25----- -- - ---- ---- - - - -- - ---I----- ------- ------ - - - --- -- --- ---
42 100 1670 10 15 1430 0 6 25---- - -- - - - - - - - - - - - - -- - - ------ -- ------------- - - -- - -- - - - - - --- - -- - - -- --------
43 100 1740 9 15 1390 0 6 25------ - ------ -r- - - - - - r--------- ------ -
- - --------- ----- -- -45 100 805 4 15 620 0 2 25-- - ---- - - --- ---- - --- -
- - - - - - - - -- -- --46 25 465 3 15 290 0 2 25- - - -- -- ------ -- - -- -- - ---------- - -- - -- --- ---- - -
46A 25 245 2 15 155 110 1 25- - - - - - -- - --- ----- - - - - --47 100 1780 8 15 1570 530 4 25- -- - - - - -- - - --
-- c---- - - - - ----- - -- -- - --48 63 840 4 15 560 110 2 25- - - - - --- - - - -
- - - - - - -- - - - - -- --49 63 1640
I 9 15 1425 140 6 25- -- --- --- -- - - ----
63 I 11- - - - -- -- - - -- ---
51 2305 I 15 1780 0 7 25I -- - - -- - --
52 63 I 6 635- - - -
775 I 15 140 4 25-
53 63 360 I 4 15 220 70 2 25I I
54 100 1370 9I
15 1090 70 6I
I 25
Fea~lbillty Report Upgradmg ofAgrlcultural Dlstrlbutlon Network
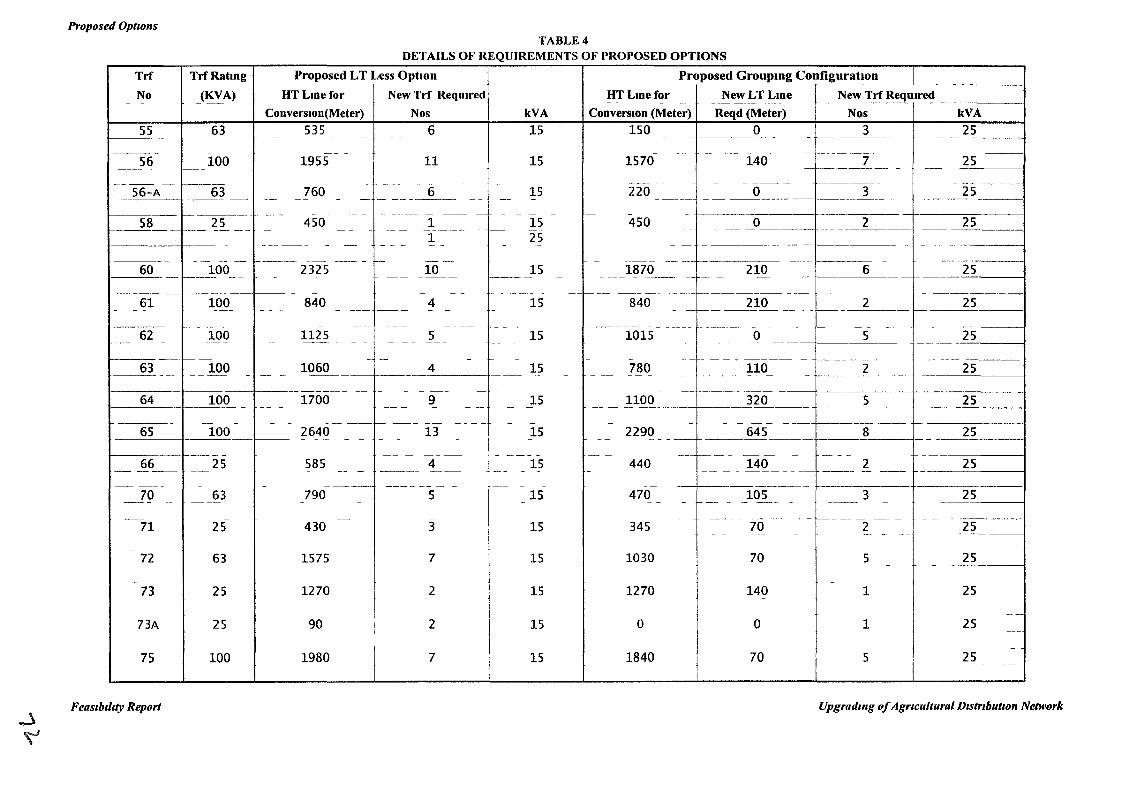
Proposed OptIonsTABLE 4
DETAILS OF REQUIREMENTS OF PROPOSED OPTIONS
535 6 15 150 0 3 25- ----- - - -- ------- -- ----
Proposed LT Less OptIOn Proposed Groupmg Configuration IHT Lme for New Trf Required !I_T Lme f~r _~e~_~,T~ne I _Ne;Trf !!~q~lIre~-_~ - - -- --
ConverslOn(Meter) Nos kVA ConversIOn (Meter) Reqd (Meter) r Nos kVA
Trf TrfRatmg
No J~~A)- -
55 63
------ ~
56 100
56-A 63
1955
760
11
6
15
15
1570
220
140
o
- -------7- ------- -
1---------
3
25
-25---------- ---I
------ f--- ----- --- -58 25
e----- - --- --- - - -
------- -
450 1--- ----1
1525
450 o 2 25-- --- ------------- -------1
----- - - - ------ - - -- -----
1060 4 15---- -----------1------- -
430 3 15
1575 7 15
1270 2 15
90 I 2 15II
1980I
7 15
60 100 2325---- --
------------- -
61 100 840 25
25
25
25
25
25
25-----
25- ----5
5
2
1
1
Upgradmg ofAgricultural D,strtbut,on Network
--- ----6 - 25--+------- --- - -------1
o
70
70
70
210
140
110 2
--- --- --140 2 25
-- - - --- - - -- ---- -- -- ---------1
--+-----,------ ------- ---------105 3 25
- f- -- - - -- -
210 2- -- - - ----- - - - - ----- 1-------------
o
345
-780
440
470
840
--f------ -- -----j------,------+----,------1320 5 25
--------- -- ----- - -- - - --+------ --- ----::-:::c---1
2290 645 8 25- - - - ----------t--------f- - -------
1270
1030
1840
1870
1100
------ -- ----- 1----- - -
1015 0 5__ - __ ___-+ ----'C- _
-- - -- -- -- ---f------------ - --- - -
-15
15
15
-
15
4
5
10 15f-------
~ - ---- -
4 15
-5 15
13
585
-----790
2640
-
1125- --- -
62 100
------63 100-----
64 100
-----65 100
f----- -66 25
-----
-----70 63--- -
71 25
72 63
73 25
73A 25
75 100
~FeaSIbIlIty Report
\'"'
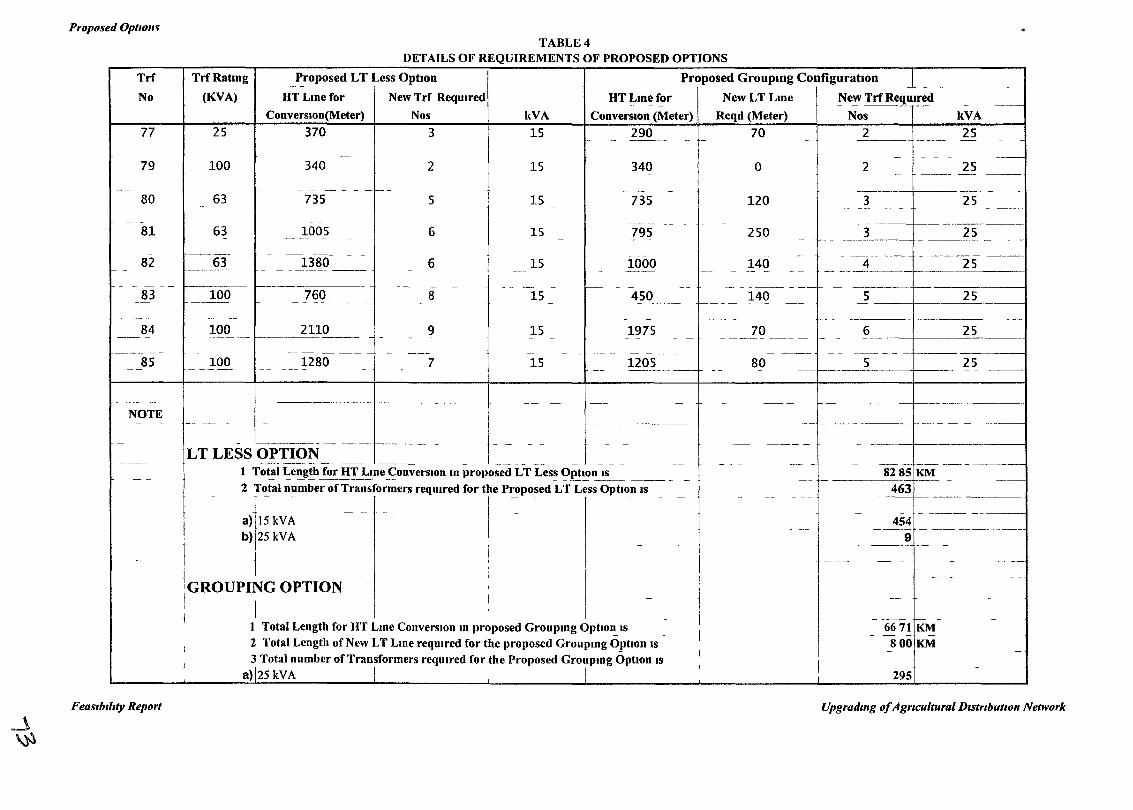
Proposed OptlOll"TABLE 4
DETAILS OF REQUIREMENTS OF PROPOSED OPTIONS
Trf
No
77
TrfRatmg
(KVA)
25
Proposed LT Less OptIOn- - ---
HT Lme for New Trf Required
ConverslOn(Meter) Nos
370 3kVA
15
Proposed Groupmg Configuration 1HT !-m~ ~or New LT Lme I ~e!V !rfR!~I!_~d --
Conversion (Meter) Reqd (Meter) Nos
__ __ ~90 _ __ __ 70 _ ~ _kVA
25
---
79 100 340 2 15 340 o 2 25
-----+--- ---- -80 63 735 5 15 735 120 3 25
- --
81 63 1005 6 15 795 250------ -- --------
3 25
82 63 1380 6 15 1000 140- -------- - ----- --
4 25
83 100_.-------------
760--- -
8 15f------- - --
450-----------
140e---- - -- --
- -------- e-------.----I-2 __+- 2-'-.5__-I
84 100 2110e---------- 9 15-
1975-- --
70f--- - ---------1--------- ---
6 25- - --f------=-------
1-----85
- -100
--- -- - ---
1280 7 15 1205 80-- - --- - - -- 1------ -------1
____ e- ...::5 + ~~ --
---f----------1----- -
NOTE-- -I- - ---------+-- -- -- - --
- - ---- ------I
--
-- ---- e--- -6671 KM
~ - - -800 KM
295
454~-~- - --- --~----
9------ -
IiI
---- - -- --- - ----8285 KM
-- J.- ---------+----463
---- J.--- -------
- ----- - ----1--- -- -- -LT LESS OPTION
1 To~l l,e'!..g!.h!or H!_l.!ne_<::onve!"slOn m proposed LT Les~ ~p..!~~__ __ _ _2 Total number of Transformers reqUIred for the Proposed LT Less OptIOn IS
::j:: ~~~ _.... . I ~ - .j -- -- 1 -- -- -
IGROUPING OPTION --
! I II I
1 Total Length for HT Lme ConversIOn m proposed Groupmg OptlO~IS _2 Total Length of~ew LT Lme reqUIred for the proposed Groupmg OptIOn IS3 Total number of Transformers reqUIred for the Proposed Groupmg Option IS
a)125 kVA! 1
Feaslbltlty Report Upgradmg ofAgrrcultural DIstributIOn Network
ANNEXURE-E
FINANCIAL ANALYSIS FOR DISTRIBUTION NETWORK
ANNEXURE-F
DRAWINGS FOR DISTRIBUTION NETWORK
LT NETWORK DRAWINGS
F 1 REPRESENTATIONS OF THE PROPOSED OPTIONS INTHE LT DRAWINGS
F 2 DISTRIBUTION TRANSFOMERS WITH 2 PUMPSETSCONNECTED ALONG WITH THE PROPOSEDOPTIONS
F 3 DISTRIBUTION TRANSFORMERS WITH MORE THAN 2PUMPSETS CONNECTED WITH THE PROPOSEDOPTIONS
F 4 DISTRIBUTION TRANSFORMERS WITH 1 PUMPSETCONNECTED (NOT UNDERSTUDY)
HT NETWORK DRAWING
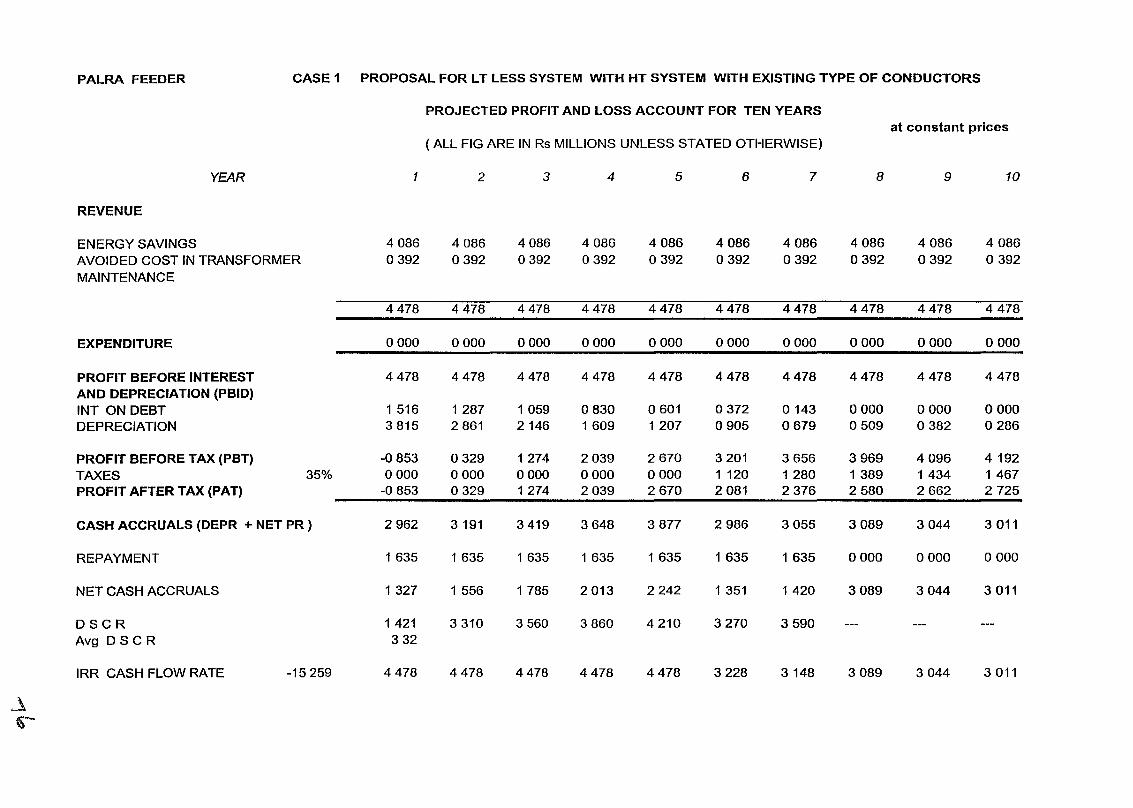
PALRA FEEDER CASE 1 PROPOSAL FOR LT LESS SYSTEM WITH HT SYSTEM WITH EXISTING TYPE OF CONDUCTORS
PROJECTED PROFIT AND LOSS ACCOUNT FOR TEN YEARSat constant prices
( ALL FIG ARE IN Rs MILLIONS UNLESS STATED OTHERWISE)
YEAR 1 2 3 4 5 6 7 8 9 10
REVENUE
ENERGY SAVINGS 4086 4086 4086 4 086 4086 4086 4086 4086 4 086 4 086AVOIDED COST IN TRANSFORMER 0392 0392 0392 0392 0392 0392 0392 0392 0392 0392
MAINTENANCE
4478 4478 4478 4478 4478 4478 4478 4478 4478 4478
EXPENDITURE 0000 0000 0000 0000 0000 0000 0000 0000 0000 0000
PROFIT BEFORE INTEREST 4478 4478 4478 4478 4478 4478 4478 4478 4478 4478AND DEPRECIATION (PBID)INT ON DEBT 1 516 1287 1059 0830 0601 0372 0143 0000 0000 0000DEPRECIATION 3815 2861 2146 1609 1207 0905 0679 0509 0382 0286
PROFIT BEFORE TAX (PBT) -0 853 0329 1274 2 039 2670 3201 3656 3969 4096 4192TAXES 35% 0000 0000 0000 0000 0000 1 120 1280 1389 1434 1 467PROFIT AFTER TAX (PAT) -0 853 0329 1274 2039 2670 2081 2376 2580 2662 2725
CASH ACCRUALS (DEPR + NET PR ) 2962 3191 3419 3648 3877 2986 3055 3089 3044 3011
REPAYMENT 1635 1635 1635 1635 1635 1635 1635 0000 0000 0000
NET CASH ACCRUALS 1327 1 556 1785 2 013 2242 1 351 1420 3089 3044 3011
DSCR 1 421 3310 3560 3860 4210 3270 3590Avg D S C R 332
IRR CASH FLOW RATE -15259 4478 4478 4478 4478 4478 3228 3148 3089 3 044 3011
~~
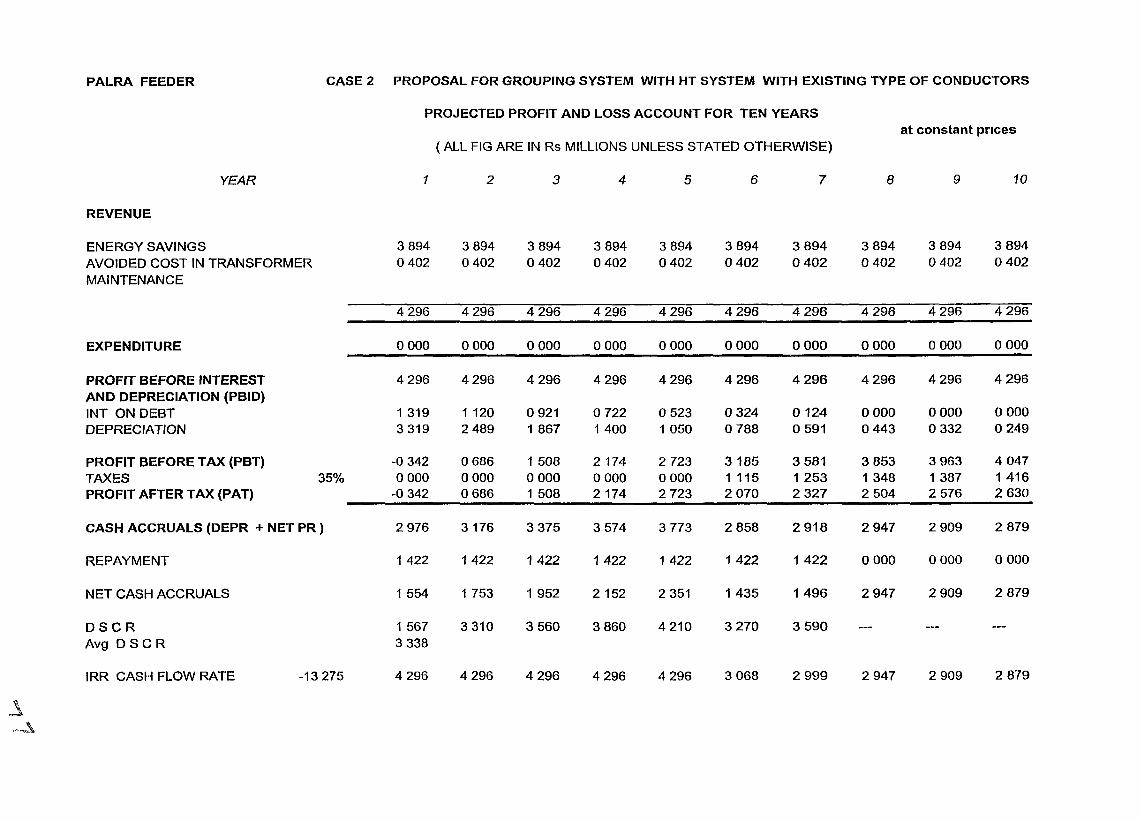
PALRA FEEDER CASE 2 PROPOSAL FOR GROUPING SYSTEM WITH HT SYSTEM WITH EXISTING TYPE OF CONDUCTORS
PROJECTED PROFIT AND LOSS ACCOUNT FOR TEN YEARSat constant pnces
(ALL FIG ARE IN Rs MILLIONS UNLESS STATED OTHERWISE)
YEAR 1 2 3 4 5 6 7 8 9 10
REVENUE
ENERGY SAVINGS 3894 3894 3894 3894 3894 3894 3894 3894 3894 3894
AVOIDED COST IN TRANSFORMER 0402 0402 0402 0402 0402 0402 0402 0402 0402 0402
MAINTENANCE
4296 4296 4296 4296 4296 4296 4296 4296 4296 4296
EXPENDITURE 0000 0000 0000 0000 0000 0000 0000 0000 0000 0000
PROFIT BEFORE INTEREST 4296 4296 4296 4296 4296 4296 4296 4296 4296 4296AND DEPRECIATION (PBID)INT ON DEBT 1 319 1120 0921 0722 0523 0324 0124 0000 0000 0000
DEPRECIATION 3319 2489 1 867 1400 1050 0788 0591 0443 0332 0249
PROFIT BEFORE TAX (PBT) -0 342 0686 1508 2174 2723 3185 3581 3853 3963 4 047
TAXES 35% 0000 0000 0000 0000 0000 1 115 1253 1348 1387 1 416PROFIT AFTERTAX (PAT) -0 342 0686 1 508 2174 2723 2 070 2327 2504 2576 2630
CASH ACCRUALS (DEPR + NET PR ) 2976 3176 3375 3574 3773 2858 2918 2947 2909 2879
REPAYMENT 1422 1422 1422 1422 1422 1422 1422 0000 0000 0000
NET CASH ACCRUALS 1554 1753 1952 2152 2351 1435 1496 2947 2909 2879
DSCR 1567 3310 3560 3860 4210 3270 3590Avg D S C R 3338
IRR CASH FLOW RATE -13275 4296 4296 4296 4296 4296 3068 2999 2947 2909 2879
~~
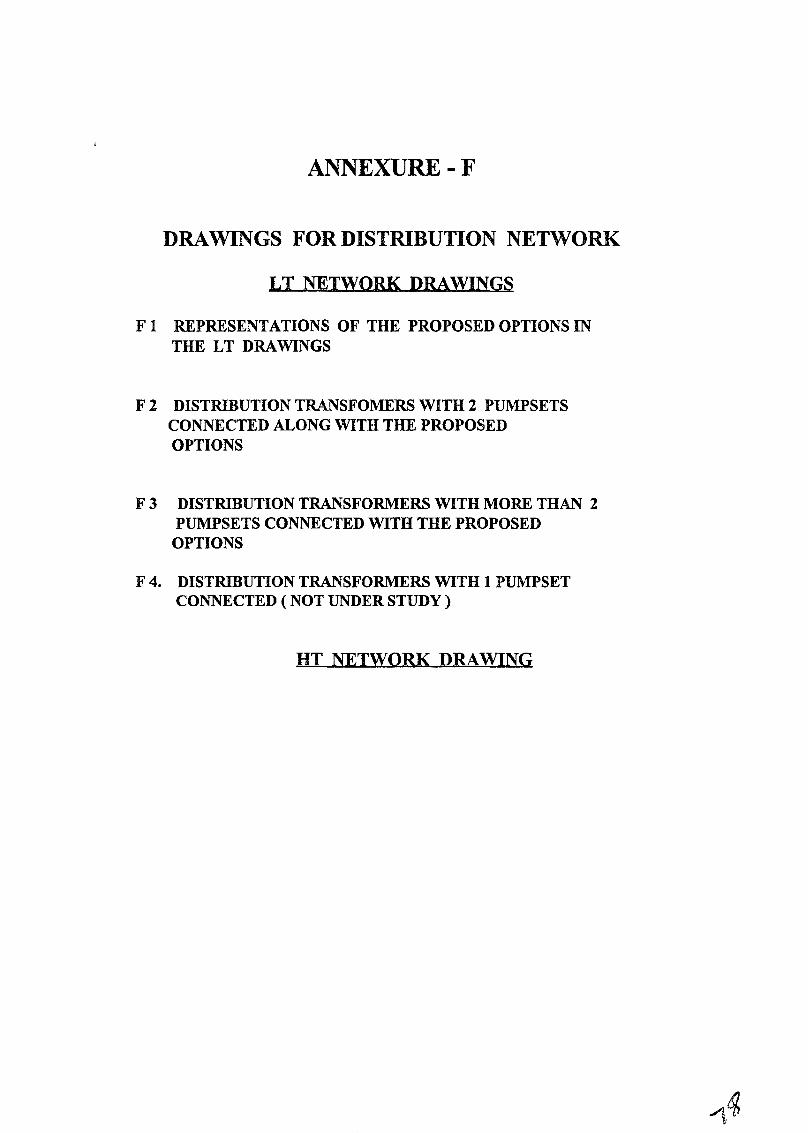
ANNEXURE-F
DRAWINGS FOR DISTRIBUTION NETWORK
LT NETWORK DRAWINGS
F 1 REPRESENTATIONS OF THE PROPOSED OPTIONS INTHE LT DRAWINGS
F 2 DISTRIBUTION TRANSFOMERS WITH 2 PUMPSETSCONNECTED ALONG WITH THE PROPOSEDOPTIONS
F 3 DISTRIBUTION TRANSFORMERS WITH MORE THAN 2PUMPSETS CONNECTED WITH THE PROPOSEDOPTIONS
F 4. DISTRIBUTION TRANSFORMERS WITH 1 PUMPSETCONNECTED (NOT UNDER STUDY)
HT NETWORK DRAWING
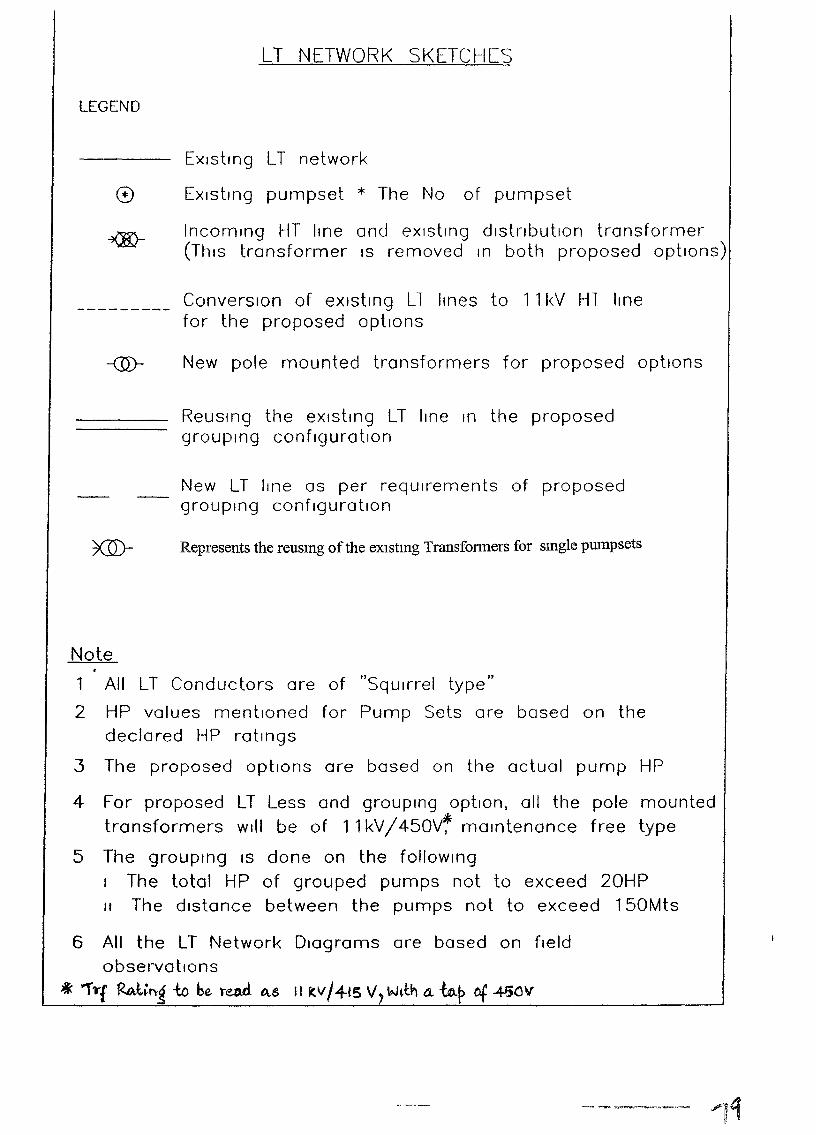
LT NETWORK SKETCHCS
LEGEND
EXisting LT network
EXlstmg pumpset * The No of pumpset
Incoming HT Ime anu eXlsttng dlstrlbutton transformer(This transformer IS removed In both proposed options)
Conversion of eXisting L1 lines to 11 kV Hl linefor the proposed options
New pole mounted transformers for proposed options
Reusing the eXlstmg LT line In the proposedgrouping conflguratton
New LT lille as per requirements of proposedgrouping configuration
Represents the reusmg ofthe eXIstmg Transformers for smgle pumpsets
Note
1 All LT Conductors are of "Squirrel type"
2 HP values mentioned for Pump Sets are based on thedeclared HP ratmgs
3 The proposed options are based on the actual pump HP
4 For proposed LT Less and grouprng opbon, all the pole mountedtransformers will be of 11 kV/ 450V~ maintenance free type
5 The grouping IS done on the followingI The total HP of grouped pumps not to exceed 20HPII The distance between the pumps not to exceed 150Mts
6 All the LT Network Diagrams are based on fieldobservations
t: '1''rf ~l;n~ -to be. reo.d Ot-S II t,Vl4-t5 V w~t" it -ta~ of 4?OV
DISTRIBUTION TRANSFORMERS WITH 1 PUMPSET
CONNECTED (NOT UNDERSTUDY)
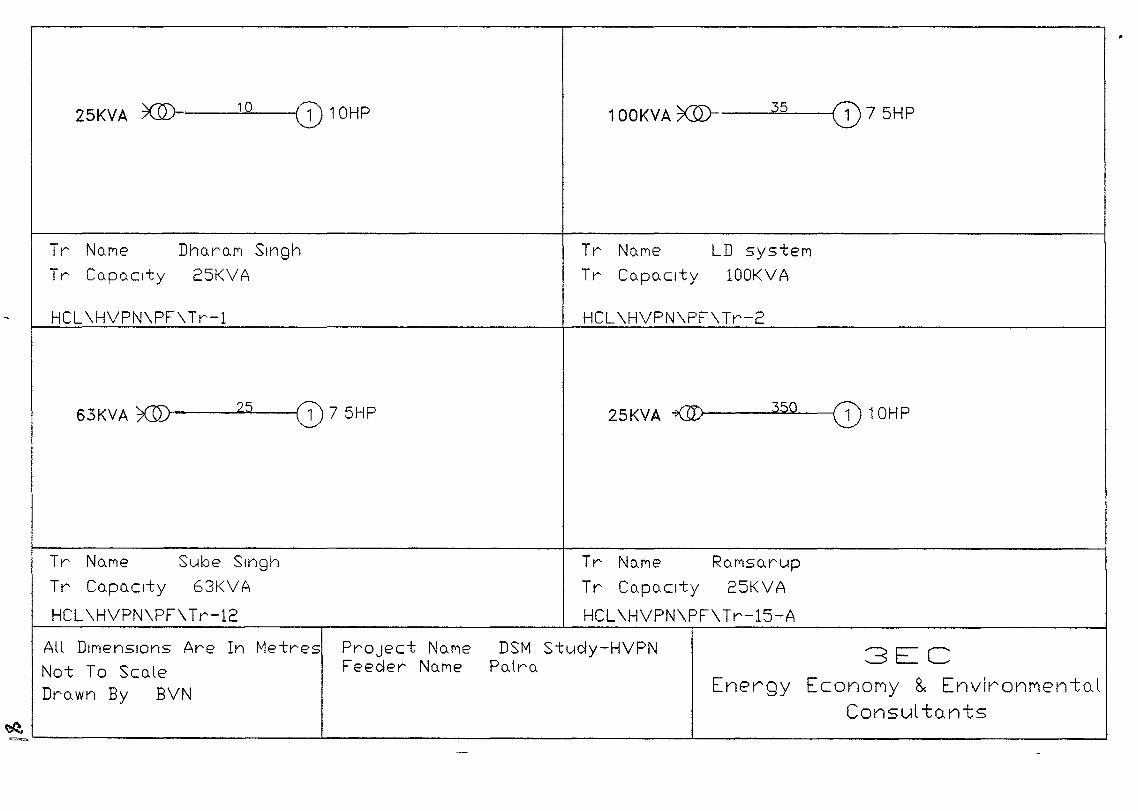
25KVA ~----~1~Q--~CD10HP 1OOKVA ;;(ID-__~35::.--CD7 5H P
Tr NO-Me
Tr CO-pO-cl"ty
DhO-rO-l""1 Singh
25KVA
Tr No.Me
Tr Co.po.Clty
LD systeM
lOOK VA
HCL \HVPN\PF\Tr-l
63KVA x.ID~w.--""""'25""'----1CD 7 5HP
Tr NO-ME' Sube Singh
Tr CO-pO-C1ty 63KVA
HCL\HVPN\PF\Tr-12
HCL\HVPN\PF\Tr-2
25KVA 7(ID1--------'3""'5~Q-----,CD 10HP
Tr No.Me RO-MsO-rup
Tr Co.pO-C1ty 25KVA
HCL\HVPN\PF\Tr-15-A
All DIMensions Are In Metres Project No-Me DSM Stuc!y-HVPNNot To ScO-le Feeder No-Me PO-trO-
DrO-wn By BVN
3ECEnergy EconoMy & EnvironMento.l
Consul ta-nts~-.-..'-------------'------- --'- ----1
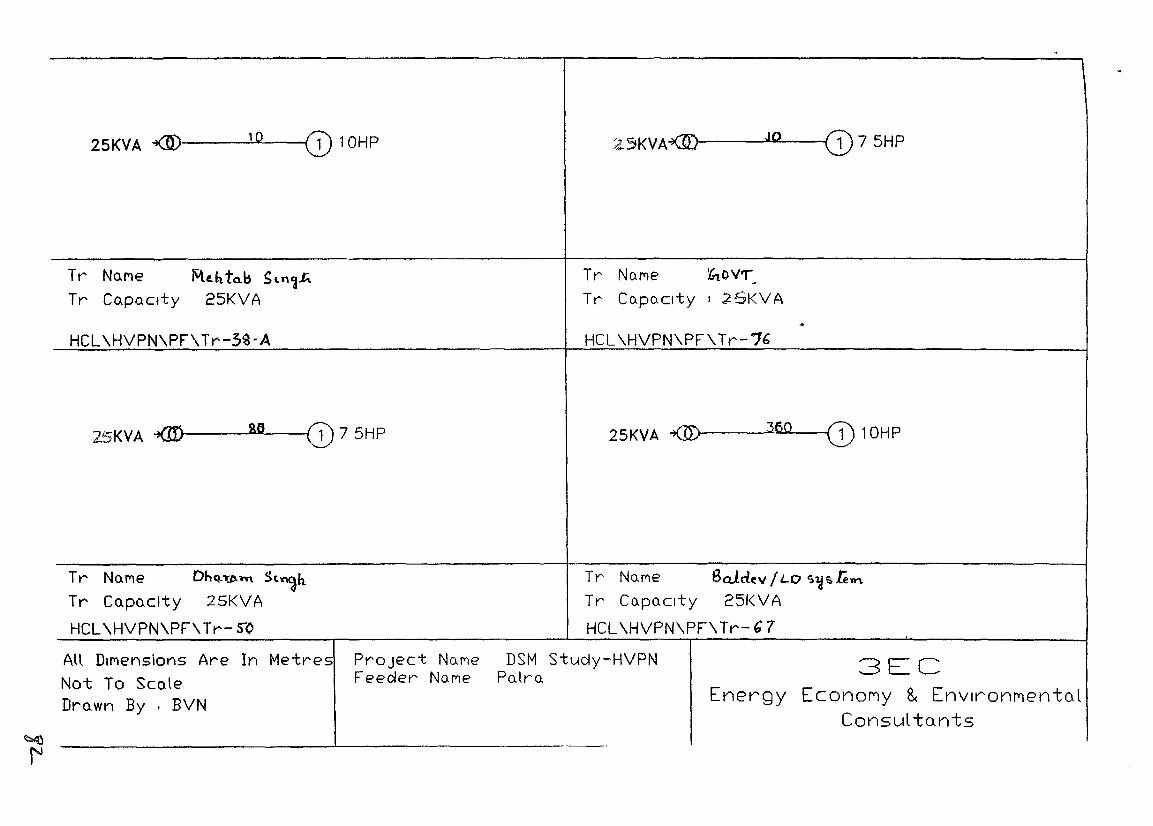
25KVA <ID.----!..1Q~-CD 1OHP 2-SKVA-@----'J~Qt-.--CD 7 5HP
Tr No.Me
Tr Co.Po.clty)\{t.hta.b SI.T\1h
25KVA
Tr No.Me r;.,.ovr_Tr Co.Po.clty I :t.5KVA
HCL\HVPN\PF\Tr-3~-A
2.5KVA -<ID~_--,BIUB~-CD 7 5HP
Tr No.Me Dhq..y.,tl.""" StT\CJhTr Co.po.clty 25KVA
HCL\HVPN\PF\Tr-~¢
HCL\HVPN\PF\Tr-76
25KVA -<IT>------"3ol..lw6~Q_ ......CD 1OHP
Tr No.Me Ba1d~v I LO s1J",-lel\"\.Tr Co.Po.clty 25KVA
HCL\HVPN\PF\Tr-&7
All DIMensions Are In Metres Project No.ME' DSM Study-HVPNNot To Sco.le Feecler NO-ME' Po.lro.
Dro.wn By . BVN
____________--1- _
3ECEnergy EconoMy & EnvlronMentoJ
Consul to.nts
DISTRIBUTION TRANSFOMERS WITH 2 PUMPSETS
CONNECTED ALONG WITH THE PROPOSED
OPTIONS
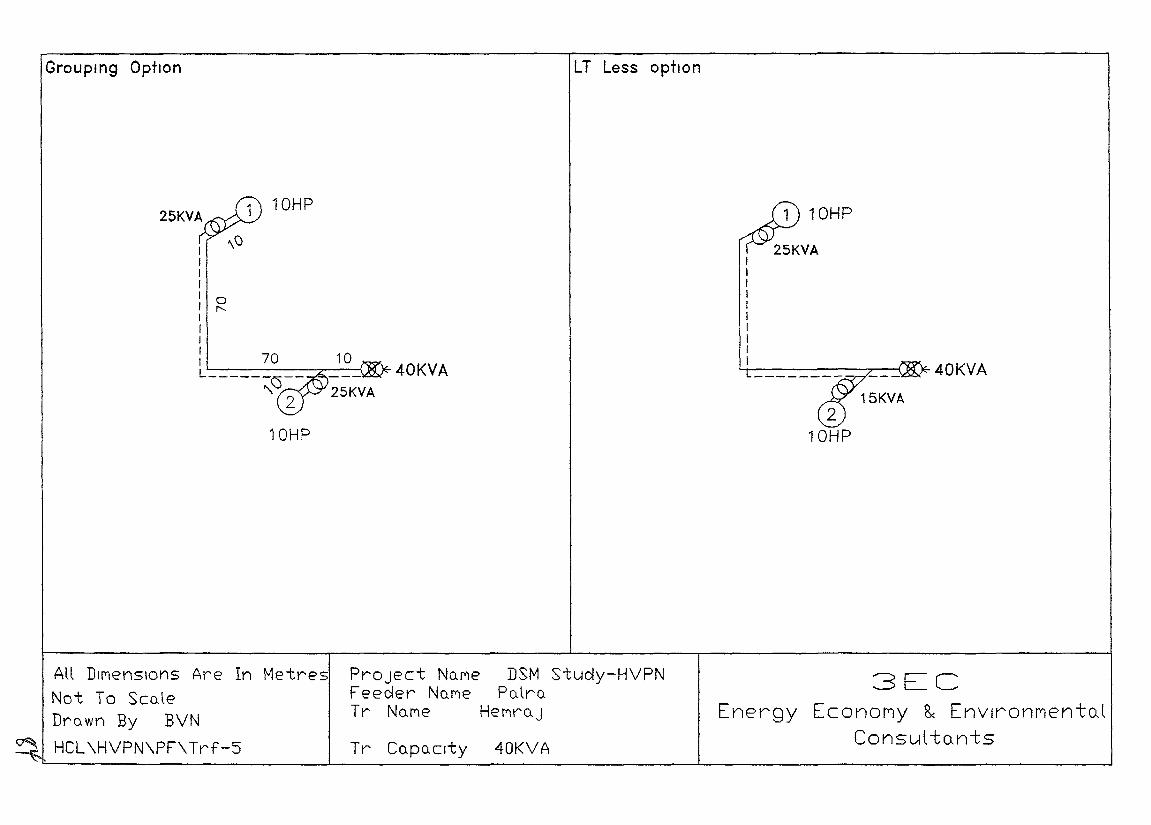
Groupmg Option LT Less optIon
10HP
40KVA40KVA
10HP
IIIII 0
I "III
: 70
All DlfYlenSIOns Are In Metres
Not To ScnleDrnwn By BVN
~ HCL\HVPN\PF\Trf-5
PrOject NnfYle DSM Study-HVPNFeeder NnfYle Pnlro.Tr NnMe Hel"'irQJ
Tr Cnpo.clty 40KVA
3ECEnergy EconoMy & EnvlronMentoJ
Consul tQn-ts
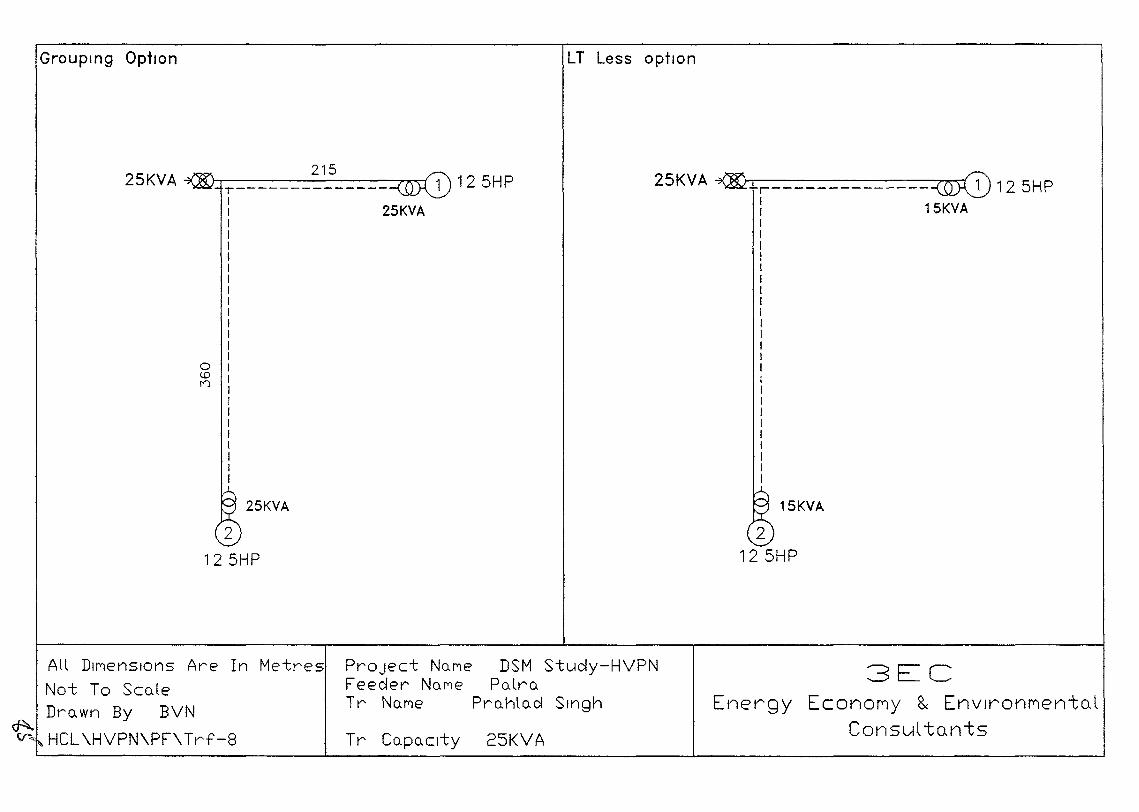
Grouping Option
25KVA 215h-T-_-_-_-_-_-_-_-_-_-_-_-_-_-_----r~ 1 12 5H P
II 25KVAIIIIIIIIIIIII
o I<.0 In I
IIIIIIII
25KVA
LT Less option
25KVA r-------------- 1 12 5HPl 15KVAIIIIIIIIIIIIIIIIIIIIIIII
15KVA
PrOject NO-MeFeeder No-MeTr No.Me
DSM Study-HVPNPO-lro.
Pro.hlo.d Singh
All DII"'lenSIOns Are In Metres
Not To ScO-leDrO-wn By BVN
HCL\HVPN\PF\Trf-8 Tr Co.po.Clty 25KVA
3ECEnergy EconoMy 8< EnvlronMento.l
Consut to.nts
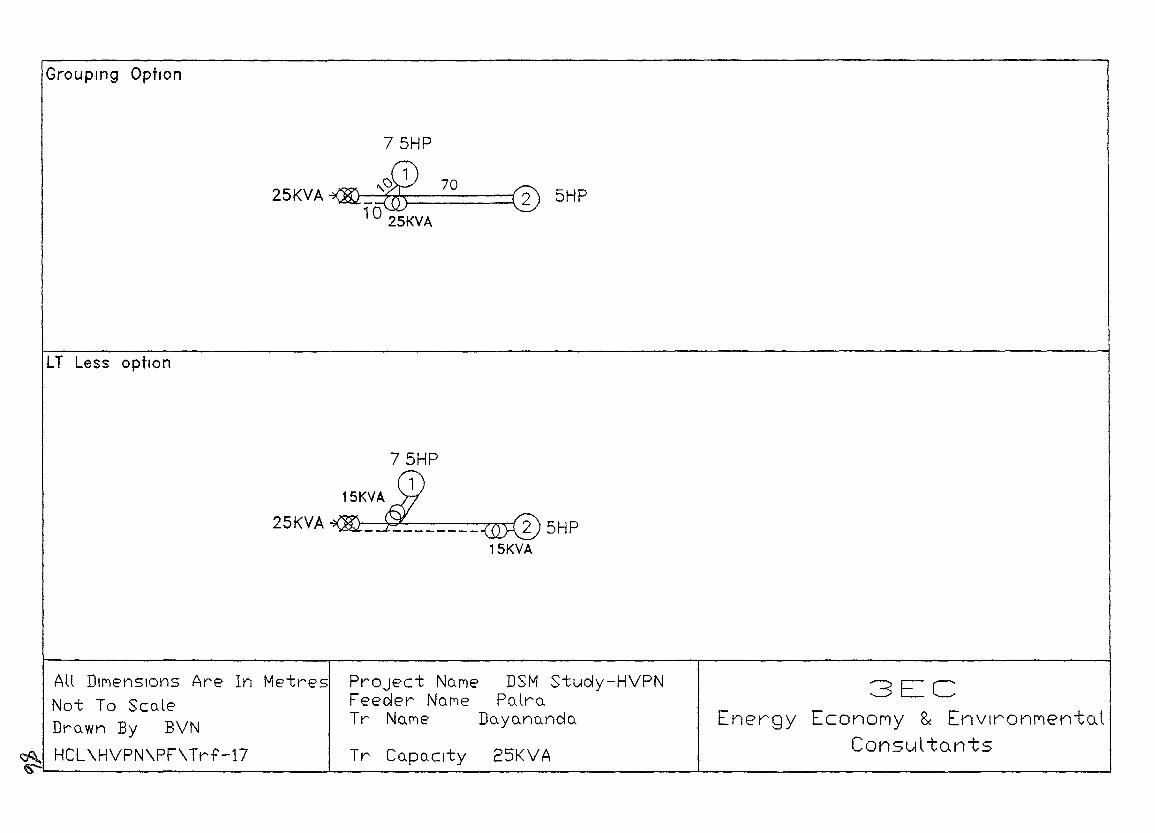
Groupmg OptIOn
l T Less option
75HP
~25KVA-® ~ 70
1025KVAo 5HP
75HP
;l15KVA
25KVA~_~ ~ 5HP
15KVA
PrOject No.Ple DSM Study-HVPNFeeder NOPle Po.lro.Tr No.Me Do.yo.no.ndo
All DIPlenSIOns Are In MetresNot To ScoJeDrO-wn By BVN
~ HCL\HVPN\PF\Trf-17 Tr Co.Po.clty 25KVA
3ECEnergy EconoMy 8< EnvlronMentoJ
Consul toni;s
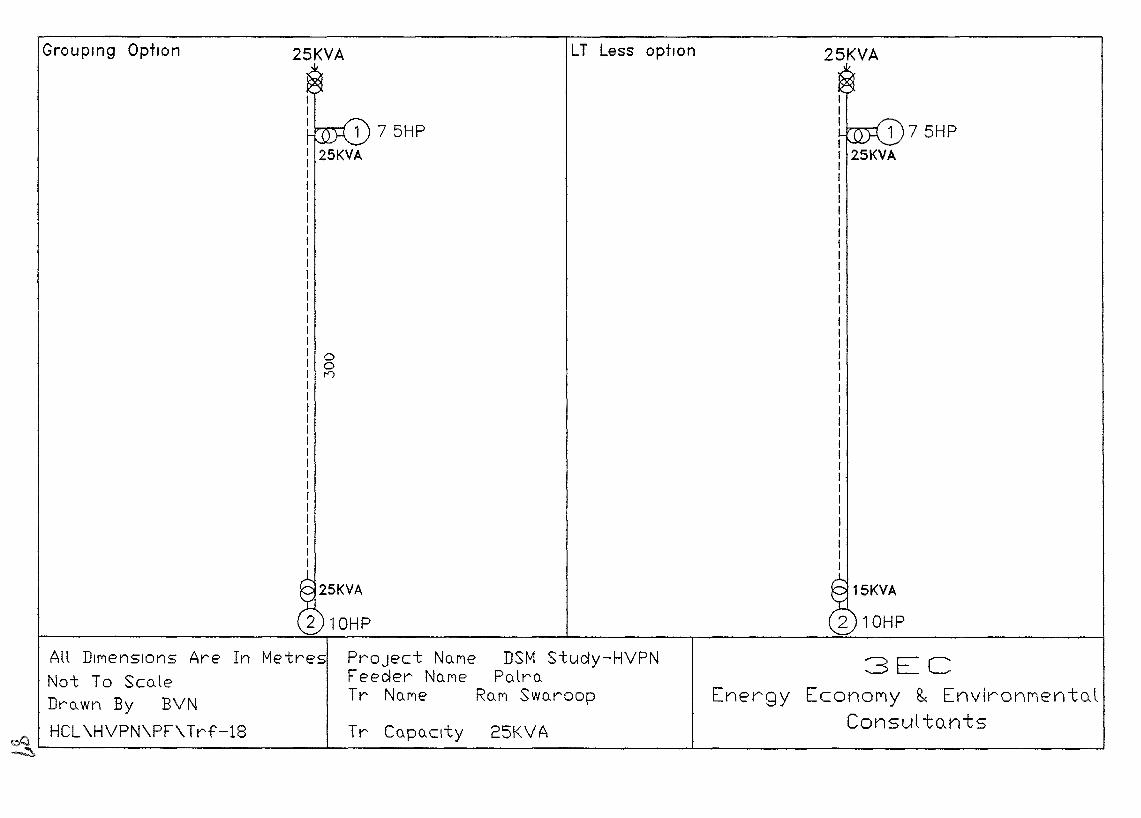
Grouping Option 25KVA LT Less option 25KVA
1 75HP25KVA
1 75HP25KVA
oon
15KVA
10HP
3ECEnergy EconoMy & EnvironMen-toJ
Consul to.n-tsTr Co.po.Clty 25KVA
PrOject No.Me DSM Study-HVPNFeeder No.Me Po.lro.Tr No.Me Ro.M Swo.roop
All DIMensions Are In Metres
Not To Sco.leDro.wn By BVN
HCL\HVPN\PF\Trf -18eN~~--- ..J-- '-- ---.J
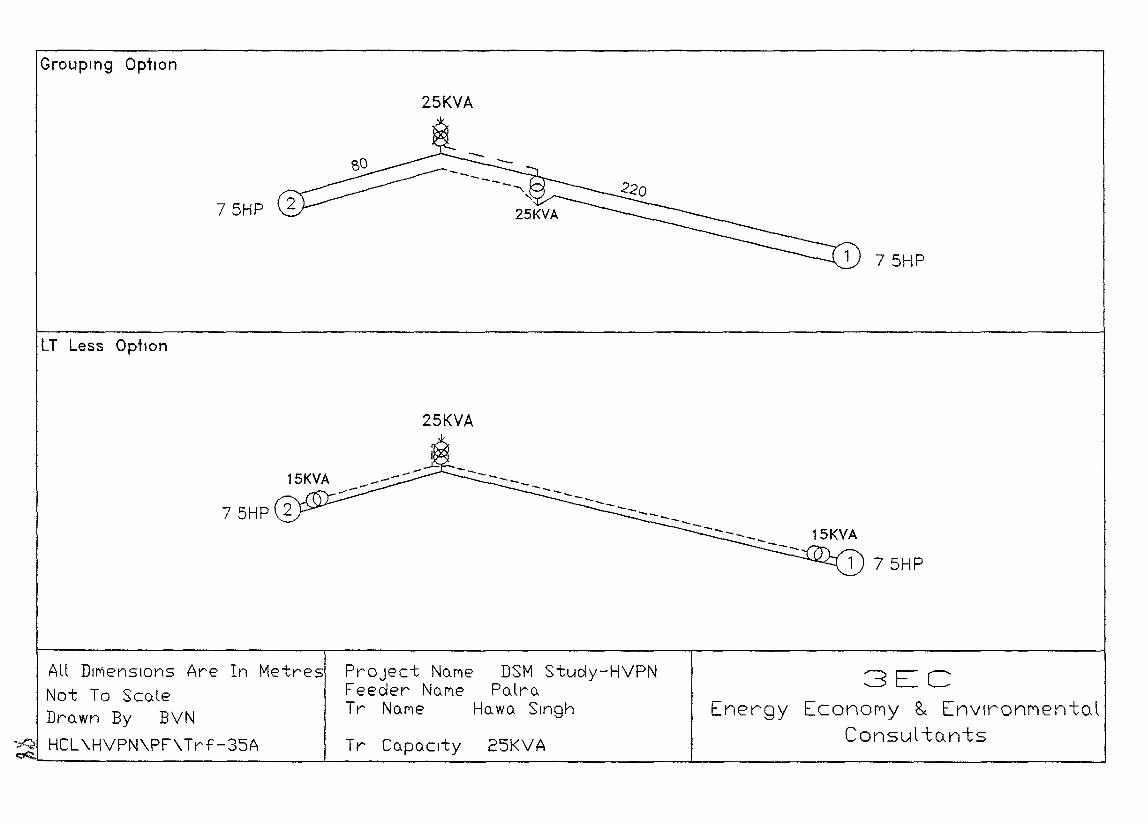
Grouping Option
25KVA
75HP
75HP
LT Less Option
25KVA
75HP
75HP
All DIl'1enSIOns Are In Metres
Not To ScoJeDrown By BVN
~ HCL\HVPN\PF\Trf-35A
PrOject NOMe DSM Study-HVPNFeeder NOMe Po.lroTr NOMe Howo SIngh
Tr Copoclty 25KVA
3ECEnergy EconoP"lY & EnvlronP"lento.l
Consul-to.n-ts
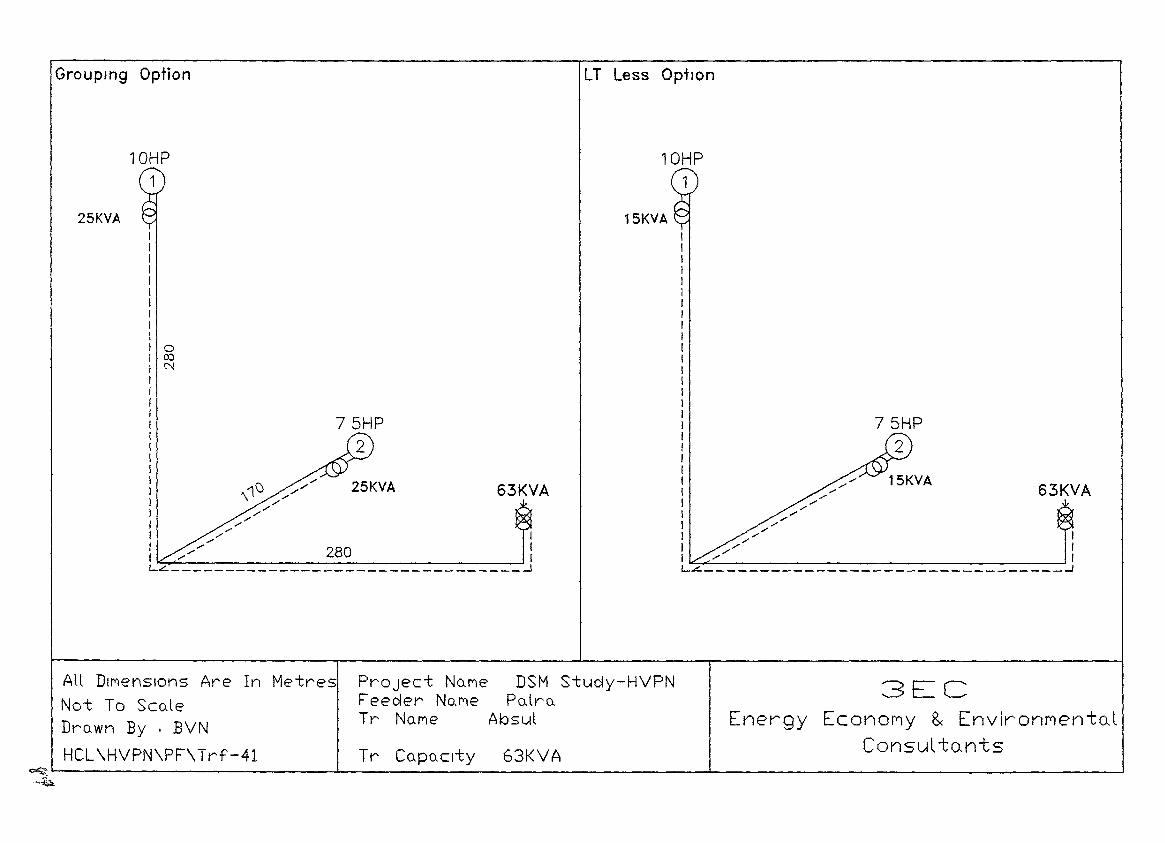
Grouping Option LT Less Option
25KVA
10HP1
10HP
1
15KVAIIIIIIIIIIIIIIIIIIIIIII /I // 63KVAI //I //I //I //
-'I -'I /-' I~L ~
63KVA25KVA
IIIIIIIIII101001<"-1IIIIIIIIII /I \1\J ///I /I //I //I //I //I // 280 I~4 ~
All DIMensions Are In Metres
Not To Sco.leDro.wn By I BVN
HCL\HVPN\PF\Trf-41
PrOject No.r"'IeFeeder No.l""leTr No.l""le
Tr CQpo.crty
DSM Stuc!y-HVPNPo.lro.
Absul
63KVA
3ECEnergy EconorlY 8< EnvironMentoJ
Consul tQnts~""---------- '-- ...l....-. --1
~
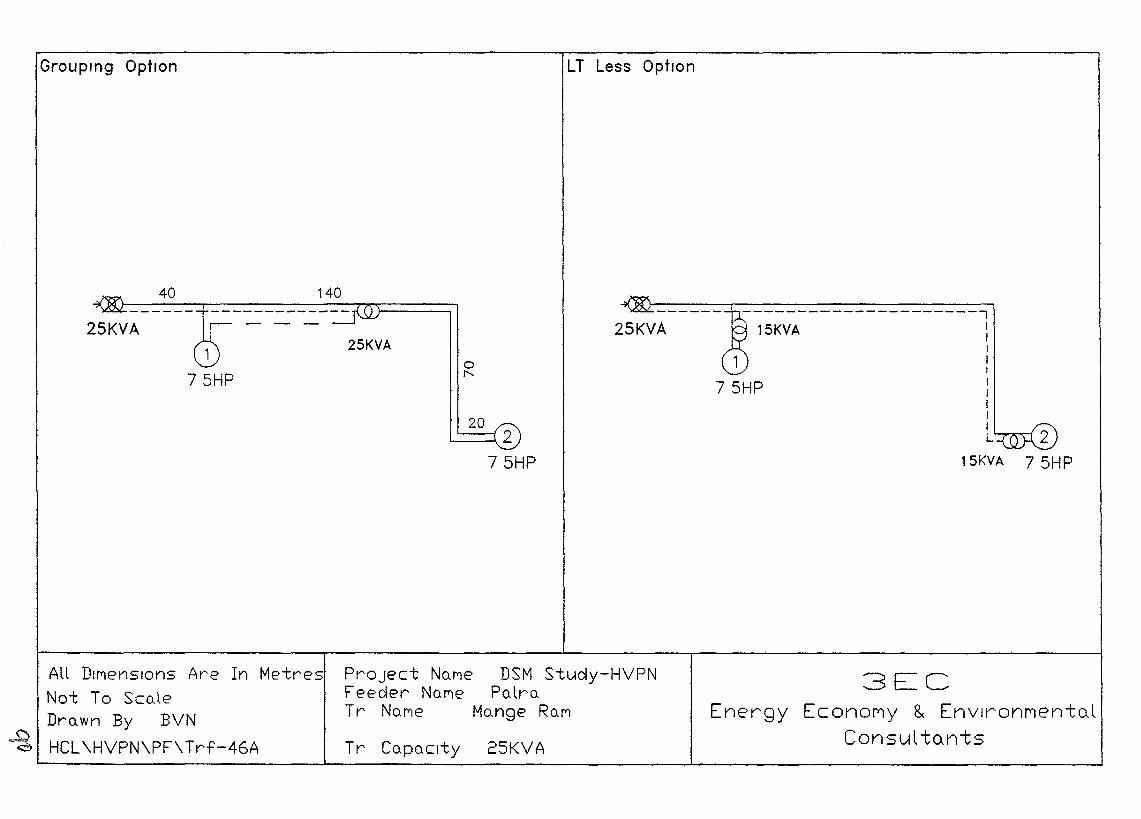
Grouprng Option LT Less Option
15KVA
---------------------115KVA :
IIIIIIII L..----IL
1
75HP
25KVA25KVA
140
1
75HP
All DIMensIons Are In Metres
Not To Sco.leDro. wn By BVN
HCL\HVPN\PF\Trf-46A
PrOject No.Me DSM Stuay-HVPNFeeder No.Me Po.lro.Tr No.Me Mo.nge Ro.M
Tr Co.po.C1ty 25KVA
3ECEnergy EconoMy 8.< EnvlronMentctl
Consul tQnts
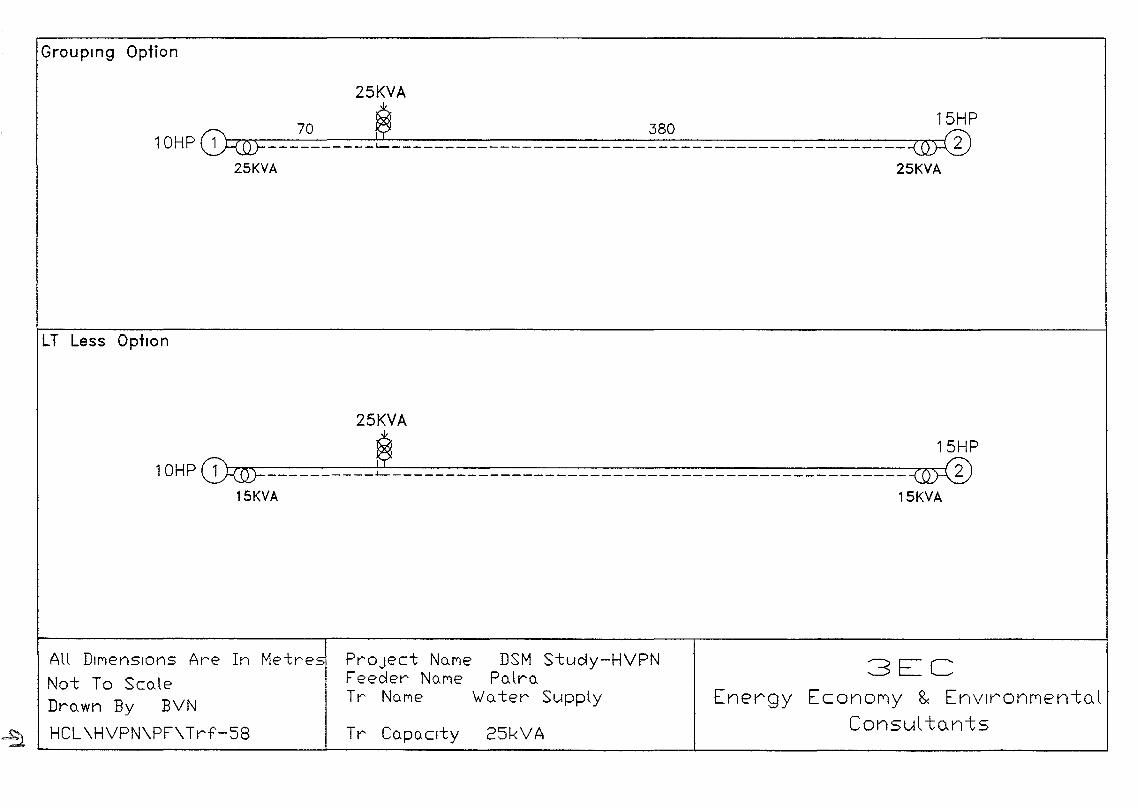
Grouping Option
1OHP CD=zw:25KVA
LT Less Option
10HPCD-<w=15KVA
70
25KVA
$
25KVA
$
380 15HP
------------------------------~25KVA
15HP
------------------------------~15KVA
PrOject No.MeFeeder No.f'leTr No.f'le
All DIl'Y'1I2nslons Are In Metres
Not To Sco.leDro.wn By BVN
HCL\HVPN\PF\Trf-58 Tr Co.Po.clty
DSM Study-HVPNPo.lro.
'Wo.ter Supply
25kVA
3ECEnergy EconOMy 8< EnvlronMento.l
Consul ta-nts
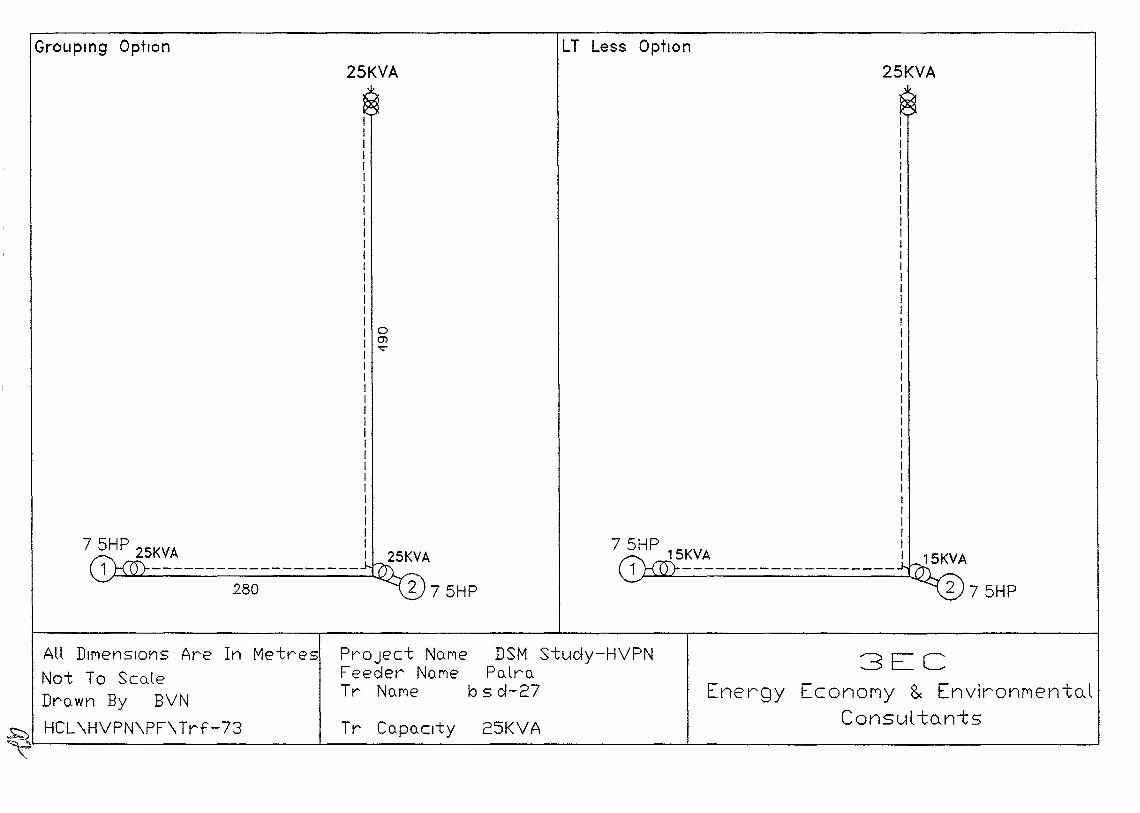
Grouping Option LT Less Option
25KVA 25KVA
o(j)v
7 5HP 25KVA
1 -------------------280
75HP 15KYA
1 -------------------
3ECEnergy EconoMy & EnvironMentoJ
Consul to.nts25KVA
DSM Study-HVPNPo.lro.
b s d-27
Tr Co.po.Clty
Project No.MeFeeder No.MeTr No.Me
All DIMensions Are In Metres
Not To Sco.leDro. wn By BVN
.£;::;) HCL\HVPN\PF\Trf-73~'----_--_------t......---------------L..------------------J
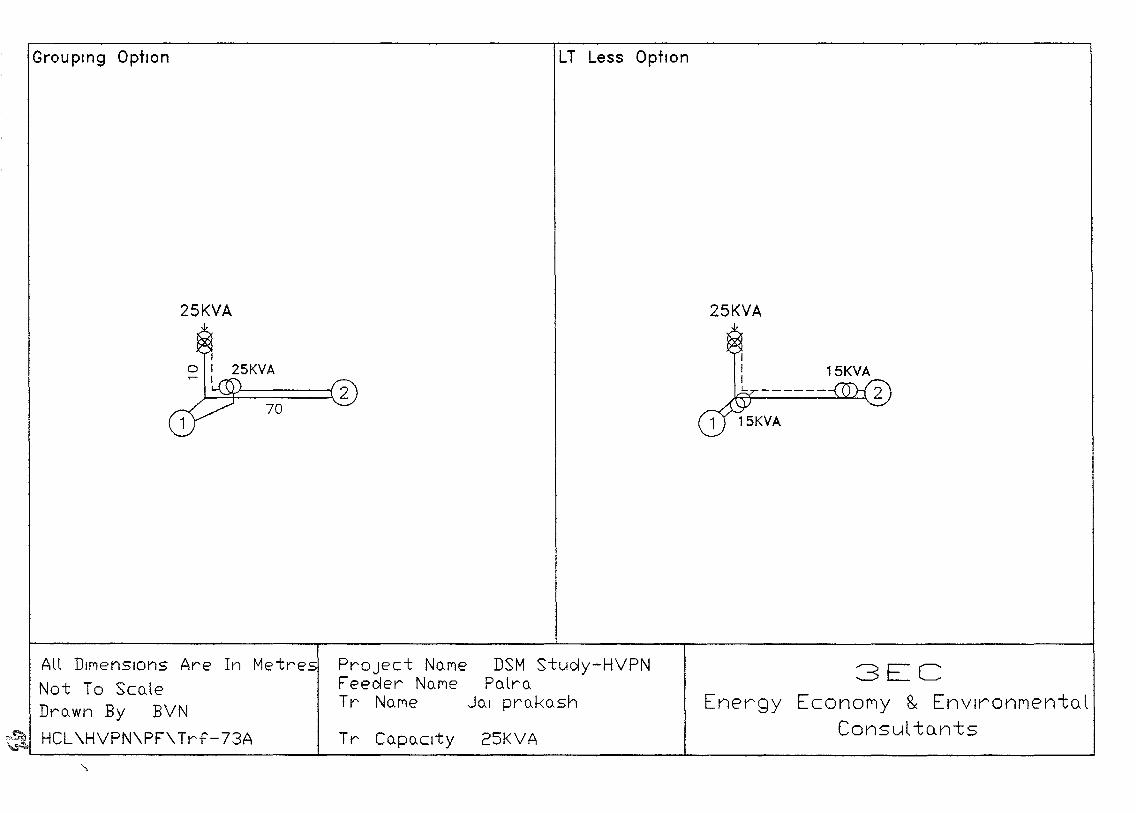
Grouping Option LT Less Option
25KVA 25KVA
~i======:::( 270
3ECEnergy EconoMy &: EnvlronrJentoJ
Consul to.nts25KVA
DSM Stucly-HVPNPatra
Jal prakash
Project NQMeFeecler NaMeTr NaMe
All DIMensions Are In Metres
Not To SculeDruwn By BVN
HCL\HVPN\PF\Trf-73A~~L..- ....L..... ...L.--. ----J
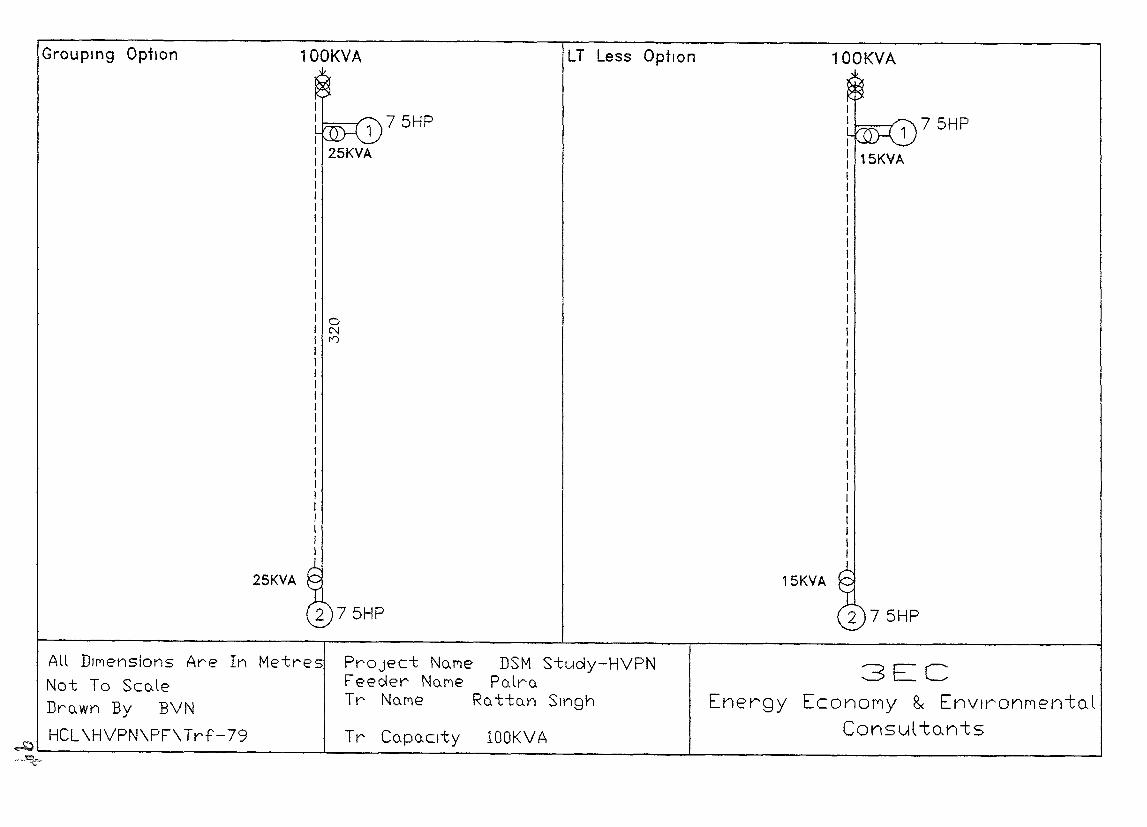
Grouping Option 100KVA LT Less OptIon 100KVA
1 75HP
25KVA 15KVA
75HP
oC'-Jn
25KVA
75HP
15KVA
3ECEnergy EconoMy 8< Envlronf'lentcd
ConsultQnts
DSM Study-HVPNPo-lro.
RQtto.n SIngh
PrOject No.T'leFeeder NaMeTr NQMe
All DIMensions Are In Metres
Not To Sco.leDruwn By BVN
HCL\HVPN\PF\Trf-79 Tr CapacIty lOOKVA~~------------_.l..-_--- L-- ---I
~~
DISTRIBUTION TRANSFORMERS WITH MORE THAN 2
PUMPSETS CONNECTED WITH THE PROPOSED
OPTIONS
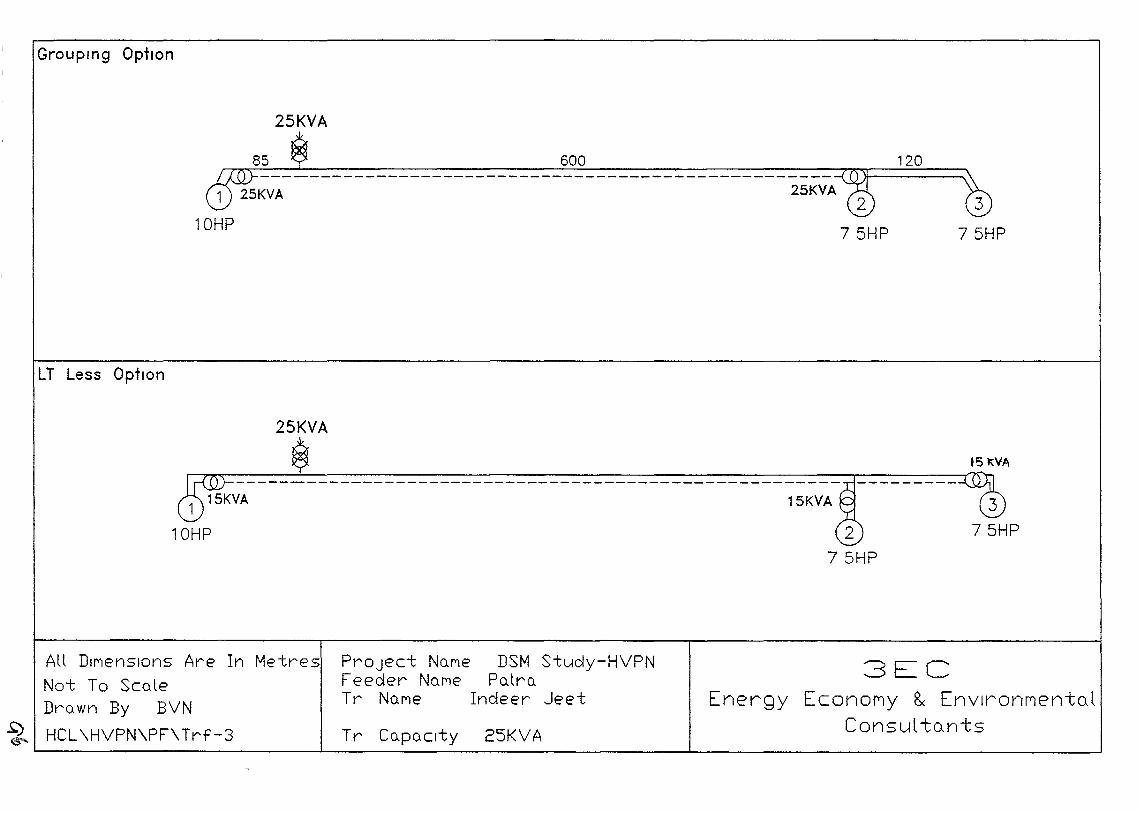
Grouping Option
25KVA
1
10HP
600 120
75HP
LT Less Option
25KVA
1
10HP
15KVA
ISt:.VA
3ECEnergy EconoMy 8< EnvlronMentoJ
Consul to.nts25KVATr Co'Po'Clty
PrOject No'Me DSM Study-HVPNFeeder No'Me PO,lrO,Tr No'Me Indeer Jeet
Alt DIf"lenSIOns Are In Metres
Not To ScoJeDrO,wn By BVN
~ HCL\HVPN\PF\Trf-3L-- --.L ....I...- -l
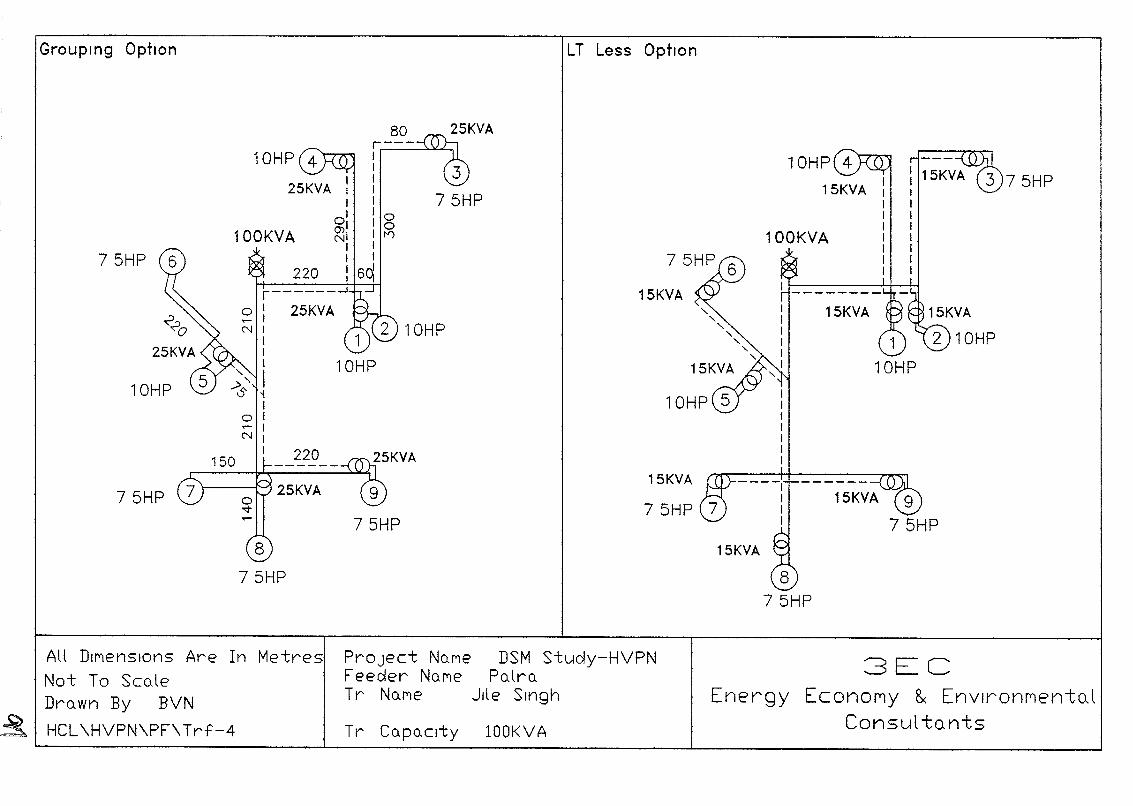
Grouping Optton LT Less OptIon
1
10HP
15KVA
15KVA
100KVA
15KVA
75HP
15KVA
75HP
80r---II
I I25KVA 1 I
1 I01 J 0enl 1 0
100KVA NI I f")I II I
220 I 6qr------.....I
~: 25KVAN 1 10HP
11I
;" Is ~1
01...-1NI
1 220
\----r--'l 25KVA
10HP
75HP
75HP
All DII"'lenSIOns Are In Metres
Not To SculeDruwn By BVN
HCL\HVPN\PF\Trf-4
PrOject NUMeFeecler NUMeTr NUl"'le
Tr Cupo.Clty
DSM Study-HVPNPulru
Jile Singh
lOOKVA
3ECEnergy EconoMy & Envlronr'lentoJ
Consul to.nts
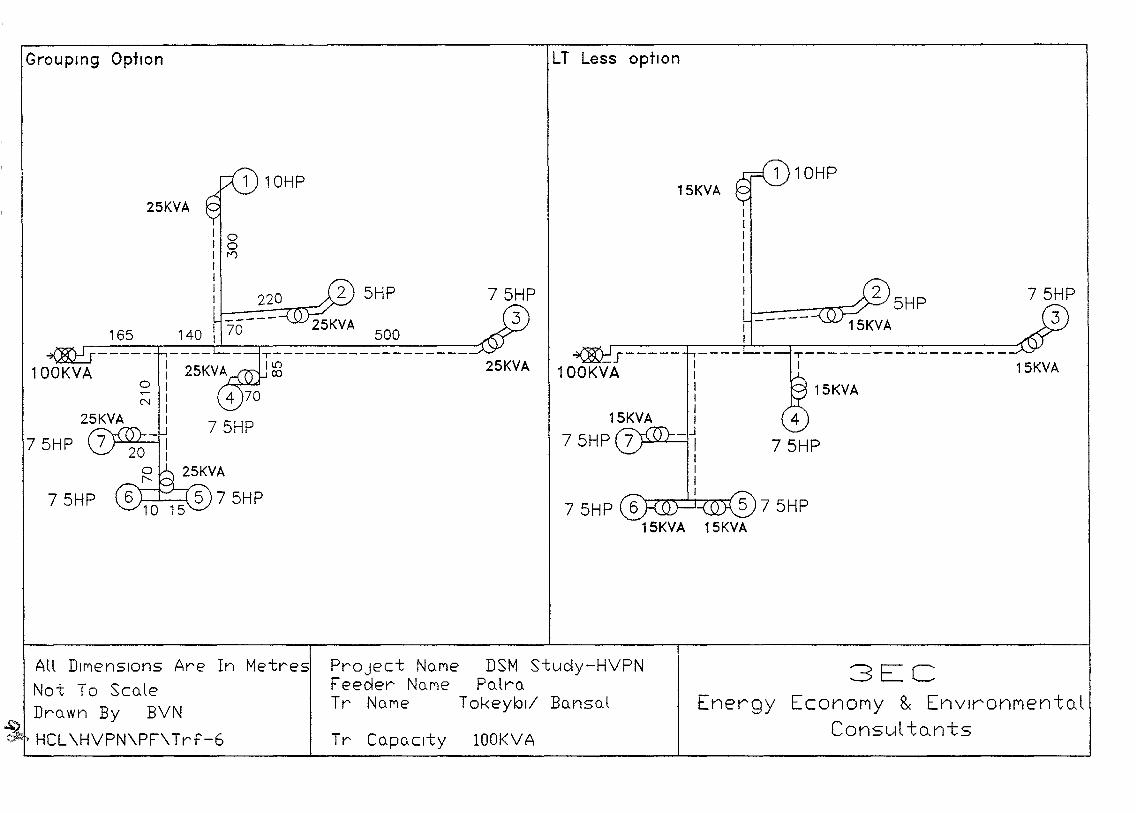
Grouping OptIon LT Less option
1 10HP 1 10HP15KVA
25KVA
00f'Il
2 5HP15KVA
T------------------ _J-----100KYA I lID 25KVA 100KYA 15KVA
I co0 I 15KVA..-
INII 75HP
15KVA_J
75HP I 75HP 7I
75HP 75HP75HP 75HP
Project No.Me DSM Study-HVPNFeecler No.Me Po.lro.Tr No.Me Tokeylol/ Bo.nso.l
All DIMensions Are In Metres
Not To Sco.leDro.wn By BVN
~HCL\HVPN\PF\Trf-6 Tr Co.po.C1ty lOOKVA
3ECEnergy EconoMy 8< EnvlronrrentoJ
Consul to.nts
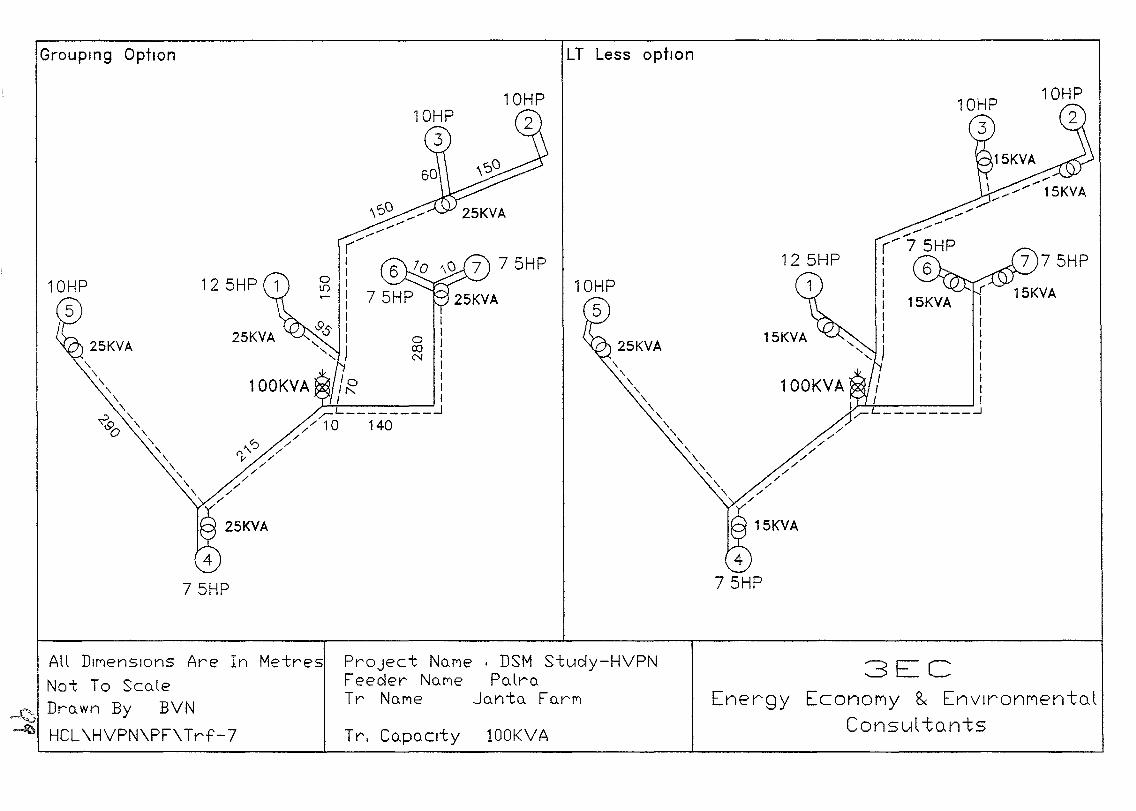
Groupmg OptIOn LT Less optIon
125HP
1 (
15KVA IIIIIII
100KYA :I I I,.,,-L ...J
15KVA
//
//
//
//
//
/
25KVA
""""""-"""-
"""""""
100KVA
II
o Jco IN I
II
I I,.,,-L ~
,,/ 10 140/
..<:> /'),,' //
//
//
//
25KVA
125HP 1
75HP
10HP
5
All DIMensions Are In Metres
Not To ScoleDrown By BVN
HCL\HVPN\PF\Trf-7
PrOject NcuYJe ' DSM Study-HVPNFeeder NOMe PolroTr NOMe JontQ ForM
Tr. Copo.C1ty lOOKVA
3ECEnergy EconoMy 8< EnvlronrientoJ
Consul tonts
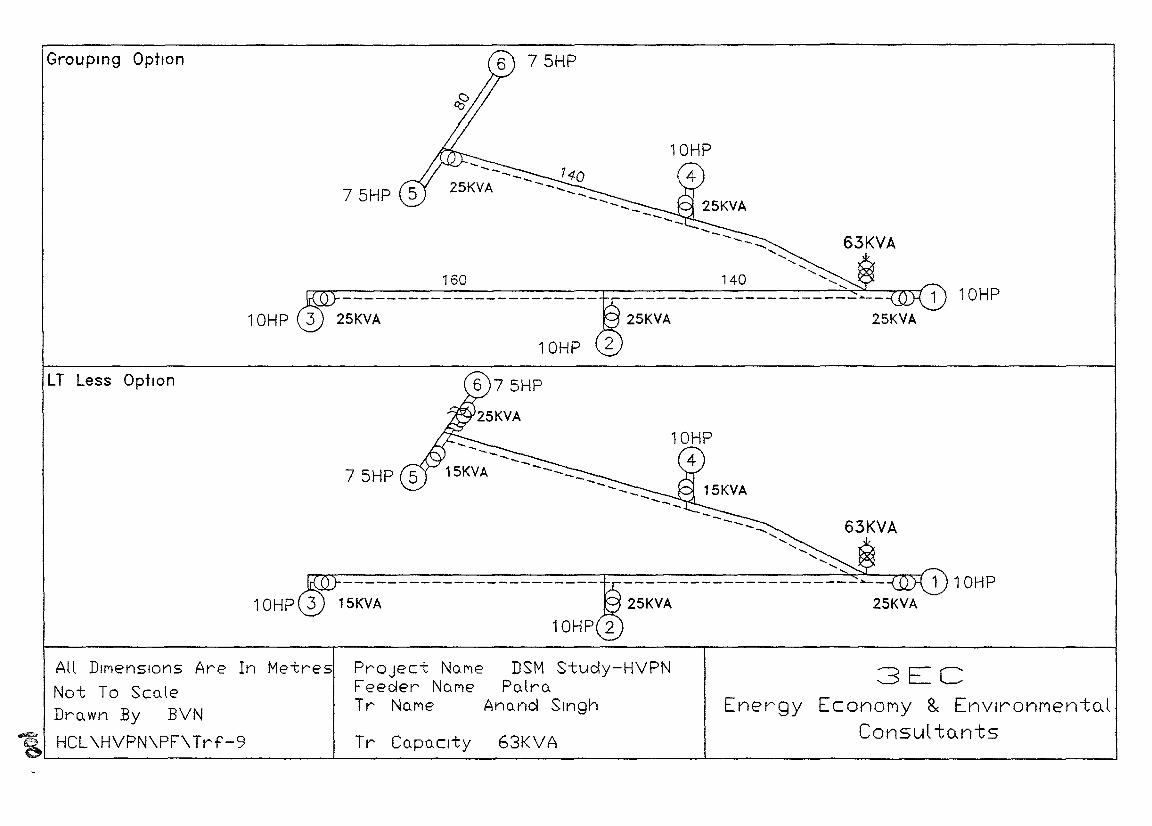
10HP
25KVA
25KVA
63KVA
63KVA
140
25KVA
25KVA
75HP
10HP
25KVA
160
15KVA
LT Less OptIon
Grouping OptIon
All DIMensions Are In Metres
Not To Sco.leDro.wn By BVN
HCL\HVPN\PF\Trf-9
PrOject No.t'leFeeder No.t'lE?Tr Not'lE?
Tr CopoCity
DSM Study-HVPNPo.lro.
Anond Singh
63KVA
3ECEnergy EconoMy 8< EnvlronMento.l
Consul to.nts
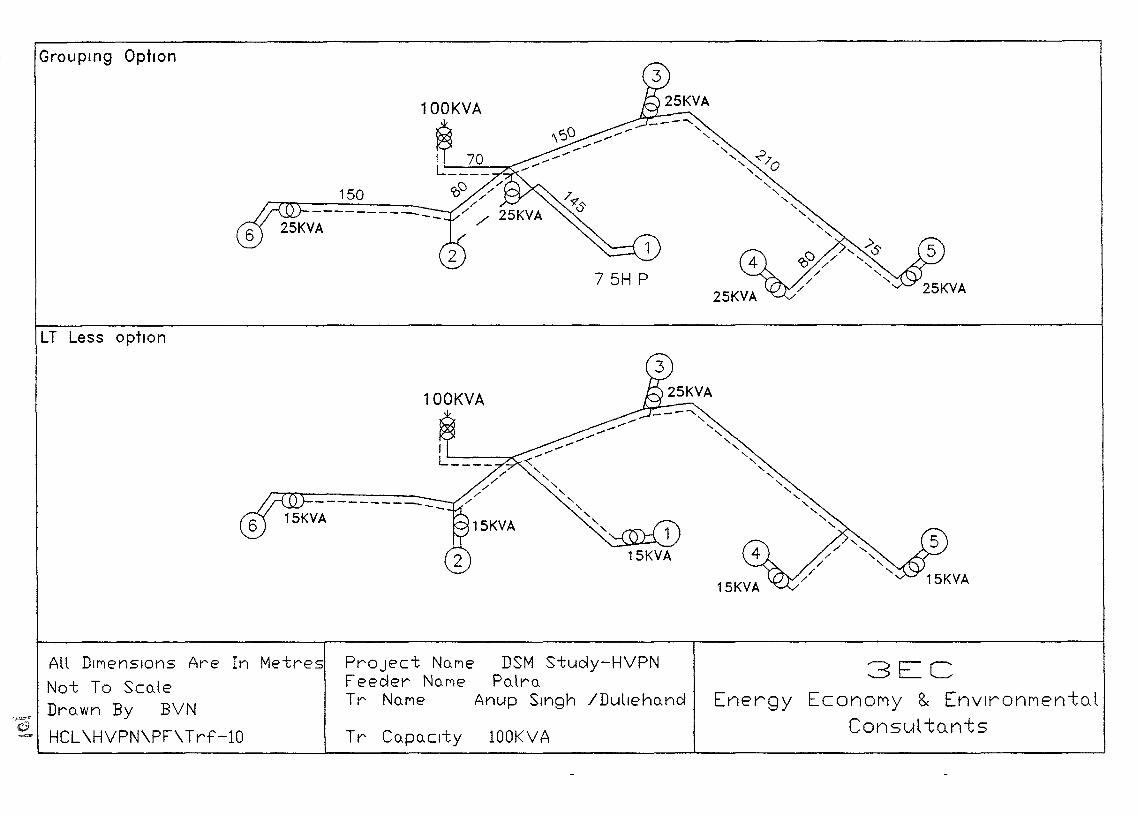
Grouping Optton
150-----------
7 5H P
LT Less option
100KYA
----------15KVA 1
'- .-'>.:><-J-"-
15KVA
All DII'IenSIOns Are In Metres
Not To Sco.leDro.wn By BVN
dHCL\HVPN\PF\Trf-10
PrOject No.MeFeeder No-ME'Tr No.ME'
Tr Co.po.C1ty
DSM Study-HVPNPo.lro.
Anup Singh /Dulleho.ncl
lOOK VA
3ECEnergy EconoMy 8< EnvlronPlento.l
Consul to.nts
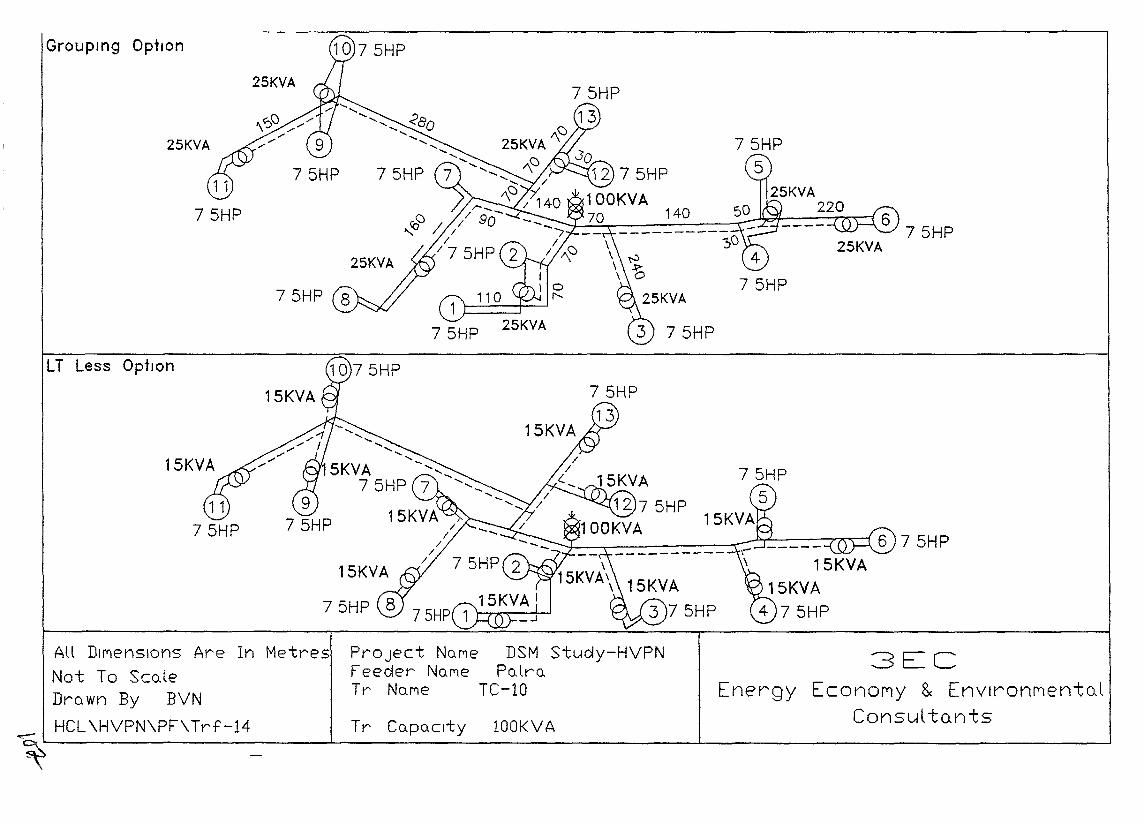
Grouping OptIon
25KVA
25KVA
75HP
LT Less Option
15KVA3 75HP
15KVA15KVA
4 75HP
75HP
3ECEnergy EconoMy 8.: Envlronl"'lentoJ
Consul tQnts
PrOject No-Me DSM Study-HVPNFeeder No-ME' PO-lro.Tr No.Me TC-I0
AU DIJYlenSl0ns Are In Metres
Not To ScO-leDrO-wn By BVN
HCL \HVPN\PF\Trf-14 Tr CO-pa.cti:y lOOK VA, -L-__~ _..l_ _l
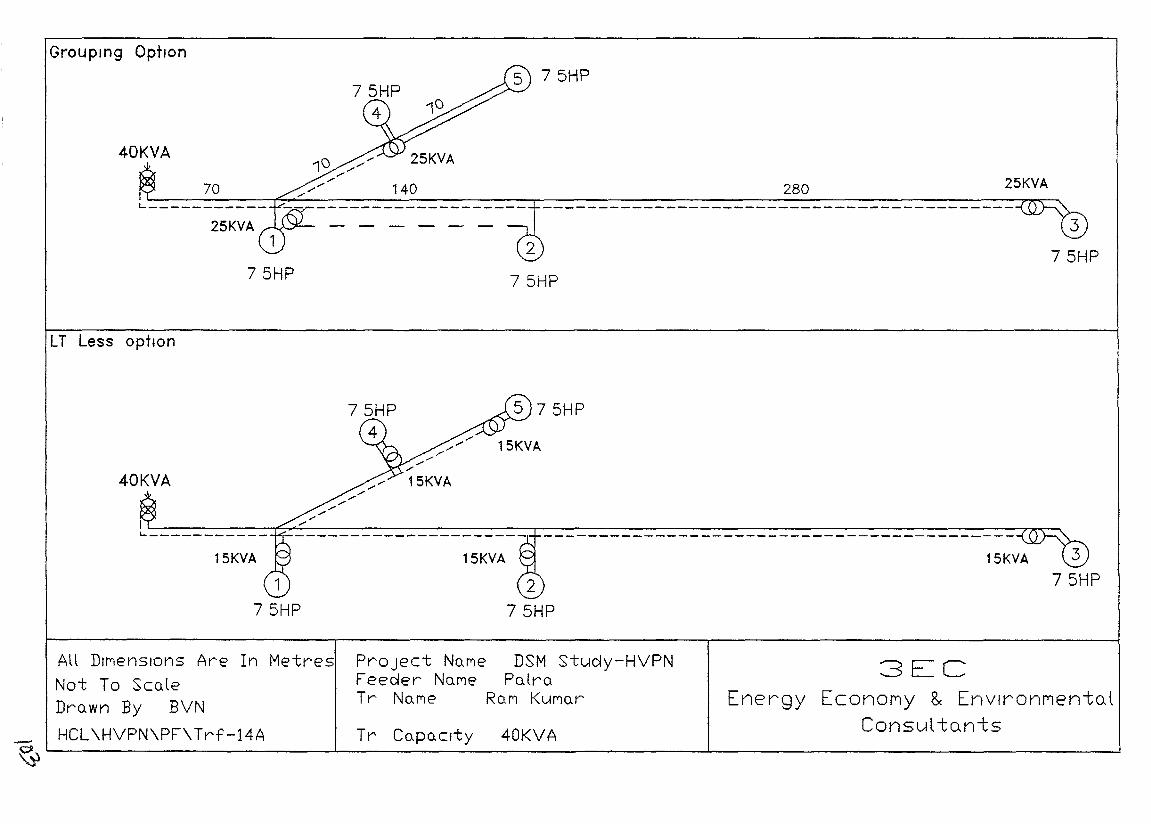
Groupmg Option
40KVA
25KVA ~.r--
75HP
140
75HP
280 25KVA
75HP
LT Less option
15KVA
// 15KVA/...
//...-,.
Ll-_-_-_-_-_-_-_-_-_-_-_--I"S,....:/::..------------,--_-_-_-_-_-_-_-_-_-_-_-_-_-_-_-_-_-_-__-_-_-_-_-_-_-_-_-_-_-_-_-_-_-_-_-_-_-_-_-_-_---r~--..
40KVA
1
75HP
15KVA
Project No.MeFeeder NOMeTr NQMe
DSM Study-HVPNPolrQ
ROM KUMor
AU DIMensions Are In Metres
Not To ScoJeDro. wn By BVN
HCL\HVPN\PF\Trf-14A Tr CQpoClty 40KVA
3ECEnergy Econor1Y & Envlronr1ento.l
Consul to.n-ts
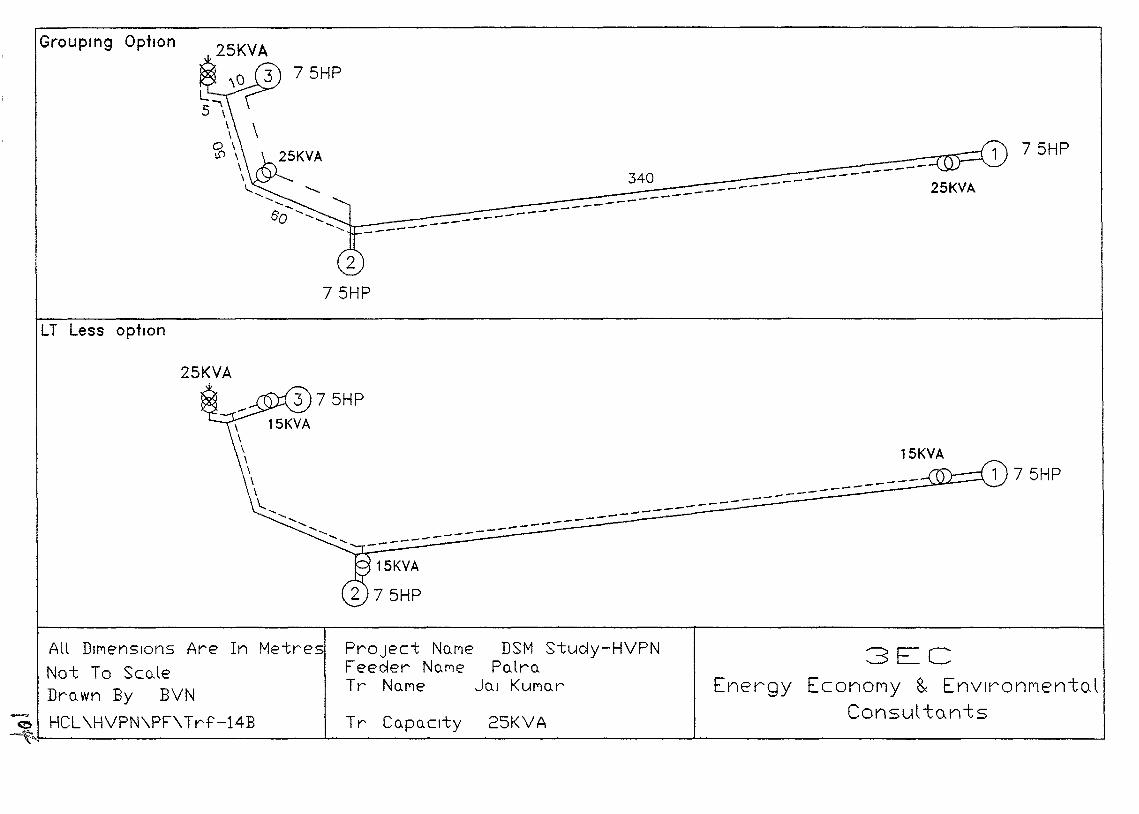
75HP
75HP----
340 _--------_---------- 25KVA--------------..L__-~ ----------
Grouping Option
LT Less option
25KVA
3 75HP15KVA
15KVA
__~~~~~~~-~-~-~-~-~-~-~--~-~-~-~-~-~-~-~-~-~--~-~-~~~1 75HP
------------------------::"'1-=:.::-::;.--:.::.::---15KVA
3ECEnergy EconoMy 8< EnvlronfYlentoJ
Consul to.nts
DSM Stuc!y-HVPNPCllro.
Jo.l KUMo.r
PrOject NClMeFeeder No.MeTr No.Me
All DIMensions Are In Metres
Not To ScoJeDrClwn By BVN
o HCL\HVPN\PF\Trf-14B Tr CClpo.Clty 25KVA~~ --l__"""":'----':=--- -L ---J
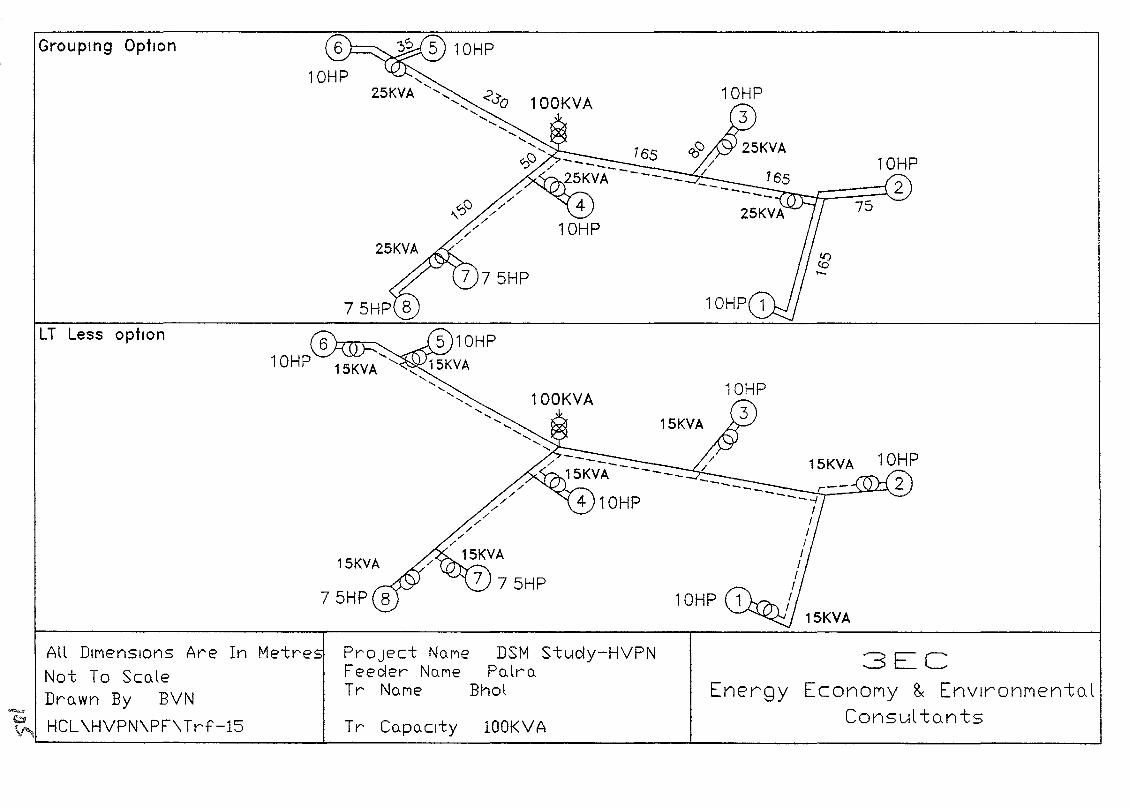
Project Ncu"leFeeder No.l"'lt2Tr No.Mt2
Grouping Option
LT Less option
All DIMensions Are In Metres
Not To ScoJeDro.wn By BVN
---~ HCL\HVPN\PF\Trf-15
15KVA
Tr Co.po.crty
DSM Stuoly-HVPNPo.lro.
Bhol
lOOKVA
10HP
"<::---I::::=::::=:~2
15KVA
3ECEnergy Econorty 8< EnvlronrtentoJ
Consul tQnts
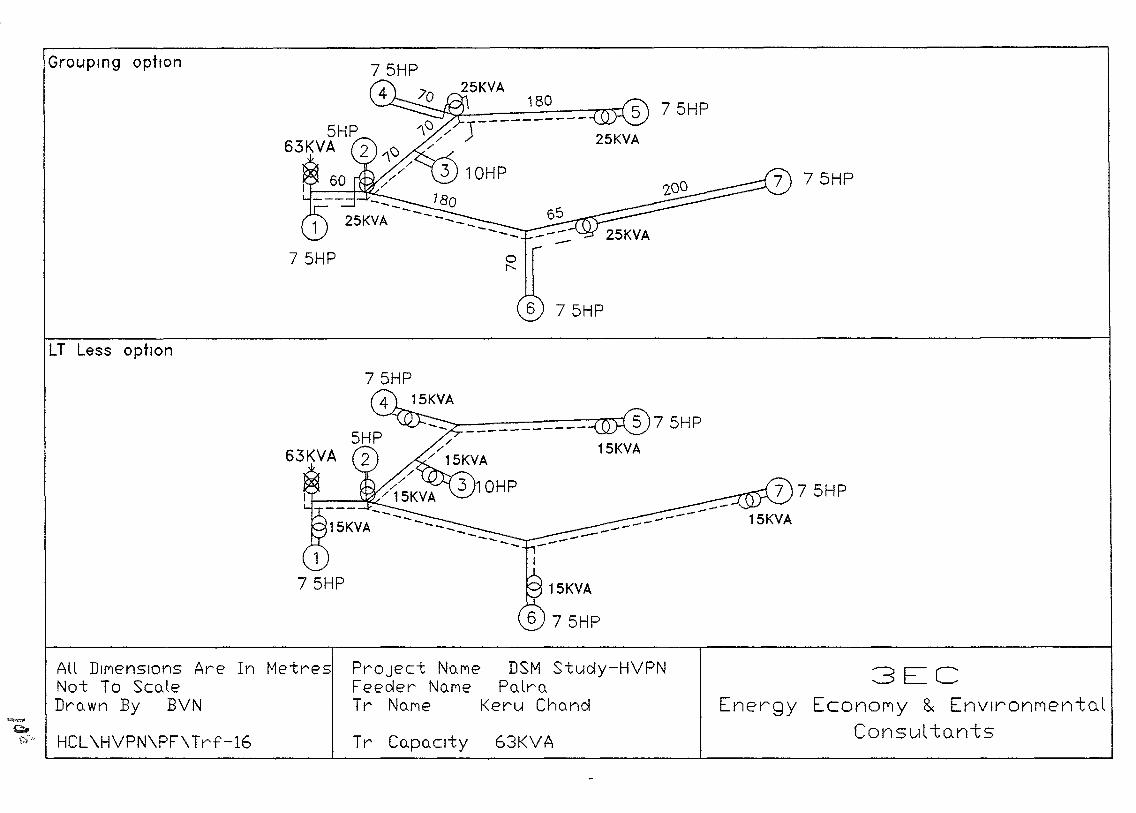
Grouping optton
75HP
180---------
25KVA
10HP
-75HP
75HP
75HP
LT Less option
15KVA
75HP
75HP
--------~--- ----
15KVA------------
1
75HP
DSM Stuoly-HVPNPO-lro.
Keru ChO-nd
All DIMensions Are In MetresNot To ScoJeDrO-wn By BVN
HCL\HVPN\PF\Trf-16
PrOject No-MeFeeder NO-ME?Tr No-Me
Tr CO-pO-clty 63KVA
3ECEnergy EconoMy & EnvlronMento.l
Consul to.nts
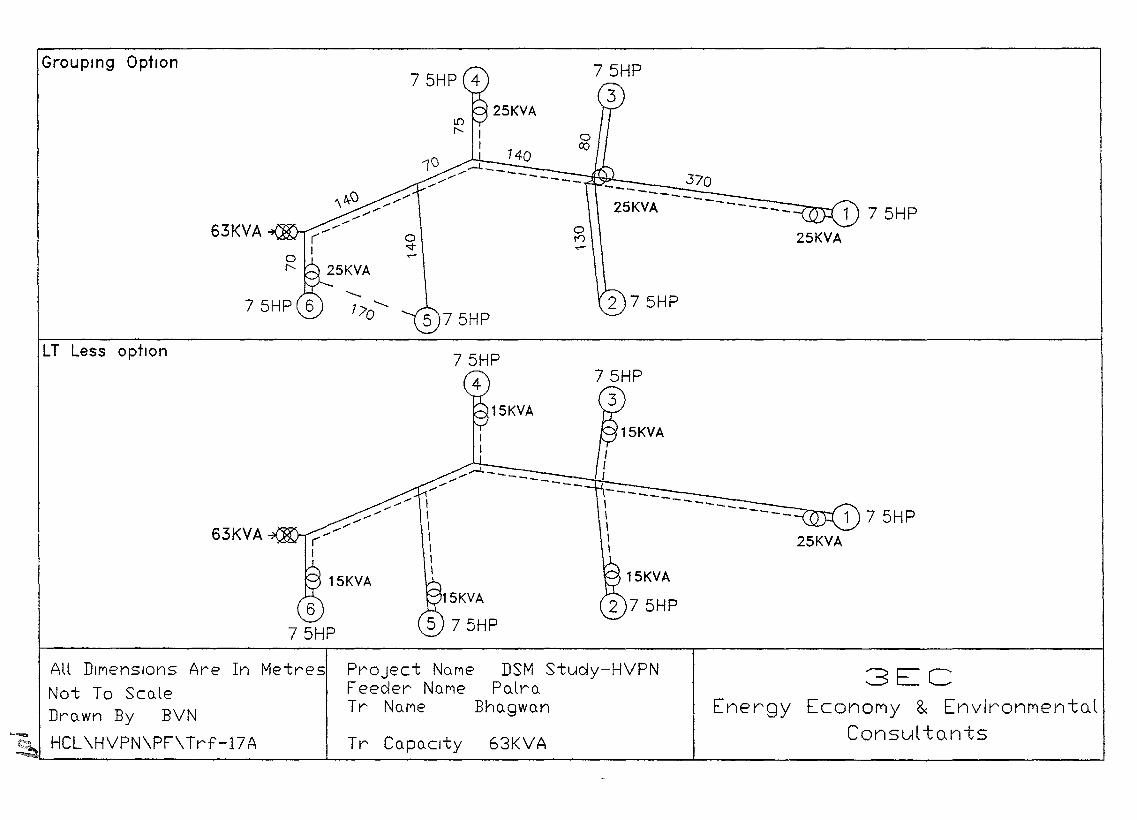
Grouping Option
63KVA25KVA
or0..-
2 75HP5 75HP
75HP25KVA
LT Less option
63KVA
15KVA
--75HP
All DIMensions Are In Metres
Not To Sco.teDro.wn By BVN
~""'"
~ HCL\HVPN\PF\Trf-17A
PrOject No.Me DSM Study-HVPNFeeder No.Me Po.lro.Tr No.Me Bho.gwo.n
Tr Co.Po.clty 63KVA
3ECEnergy EconoMy & EnvironP'lento.l
Consul tonts
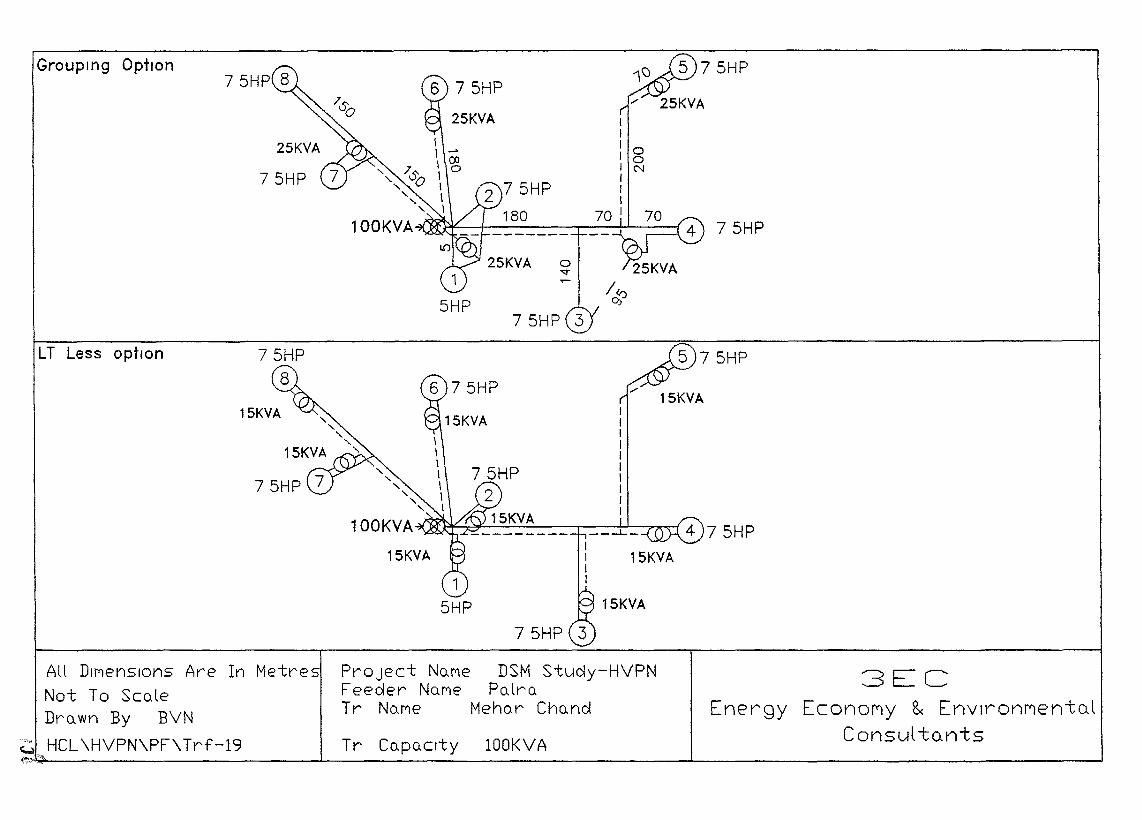
Grouping Option
75HP
LT Less option
All DII"')enSIOns Are In Metres
Not To ScaleDrawn By BVN
y HCL\HVPN\PF\Trf-19
tI1 01 0INI1I
70 I
75HP 3
75HP215KYA
15KVA
PrOject NaMe DSM Study-HVPNFeeder Nal"')e PalroTr Nal"')e MehQr Chand
Tr CQpoClty lOOKVA
75HP
3ECEnergy Econol"lY & Envlronl"'lento.l
Consul to.nts
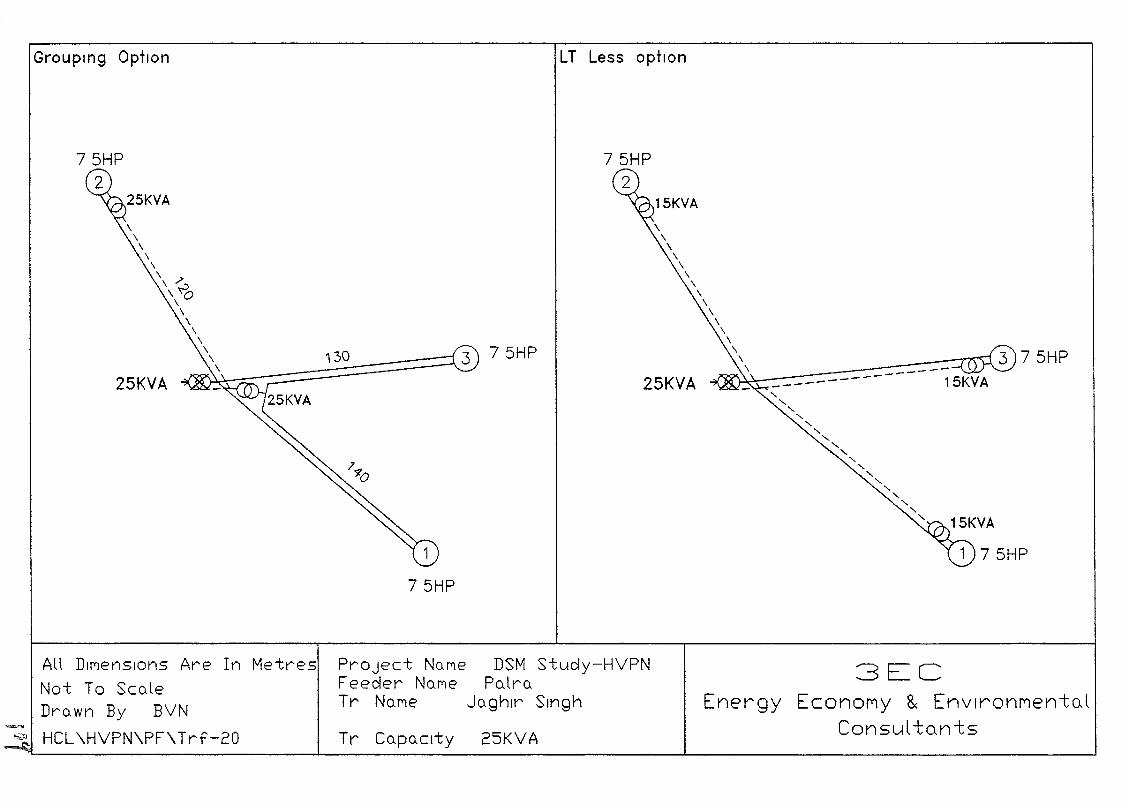
Grouping Option LT Less option
1 75HP
\\
\\
\\
\\
\\
\\
\\
,\~~ ~--=:::-:::-.::::::::::--::_:::-_:-:-::_~-~~~ _-------- 15KVA
"""""" ............
""""""""""
25KVA
\\
\\
\\\~\ 0
\\
\\
\
\~\i--~--:===::::~1~3=O::::::::::::::::::::...\ 3 7 5HP25KVA
75HP
Project Na.MeFeeder Na.MeTr Na.Me
All DIMensions Are In Metres
Not To Sca.leDra. wn By BVN
~ HCL\HVPN\PF\Trf-20 Tr Ca.pa.clty
DSM Study-HVPNPa.lra.
Ja.ghlr SIngh
25KVA
3ECEnergy EconoMy & EnvlronMen-toJ
Consul-ton-ts
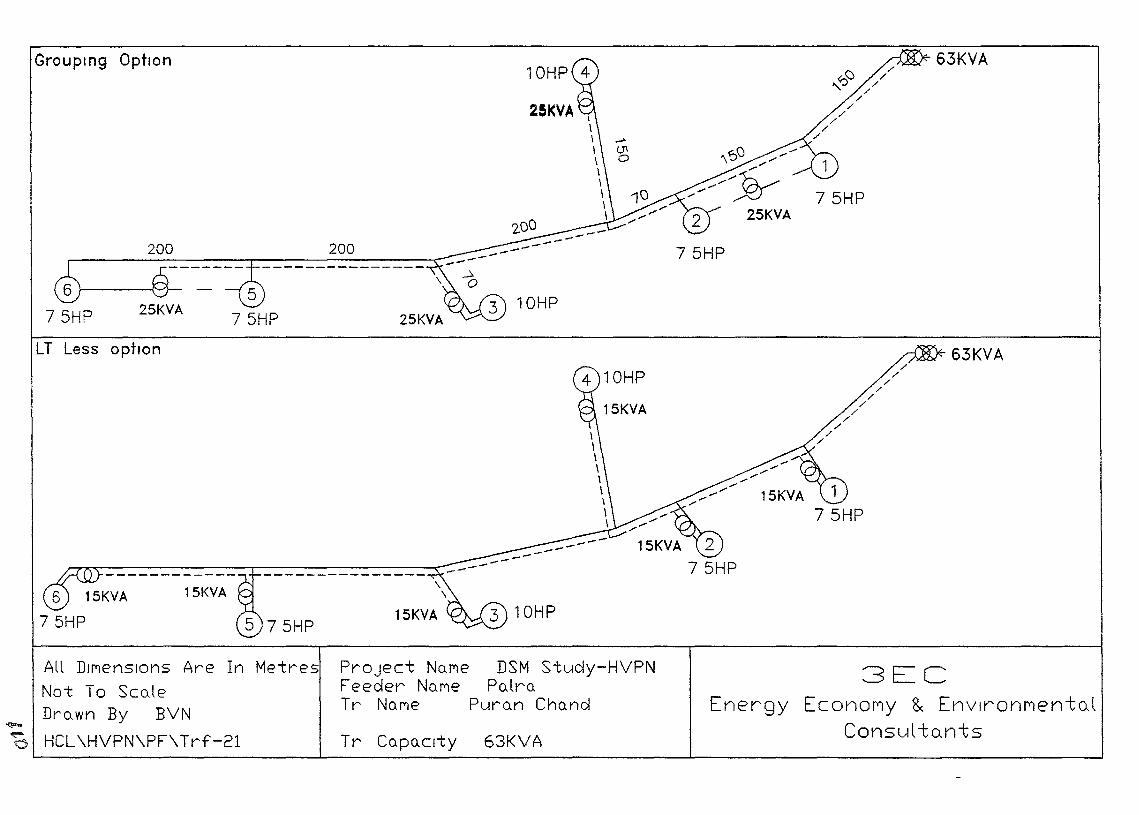
63KVA
63KVA
//
//
//
//
//
/
75HP
1
75HP
75HP
15KVA 275HP
15KVA
10HP
\
25KVA
200
15KVA
25KVA
200
LT Less optIon
Grouping Option
PrOject No.MeFeeder No.MeTr No.Me
All DIMensIons Are In Metres
Not To Sco.leDro.wn By BVN
HCL\HVPN\PF\Trf-21 Tr Co.po.C1ty
DSM Stucly-HVPNPo.lro.
Puro.n Cho.ncl
63KVA
3ECEnergy EconorlY & Envlronrlento.l
Consul to.nts
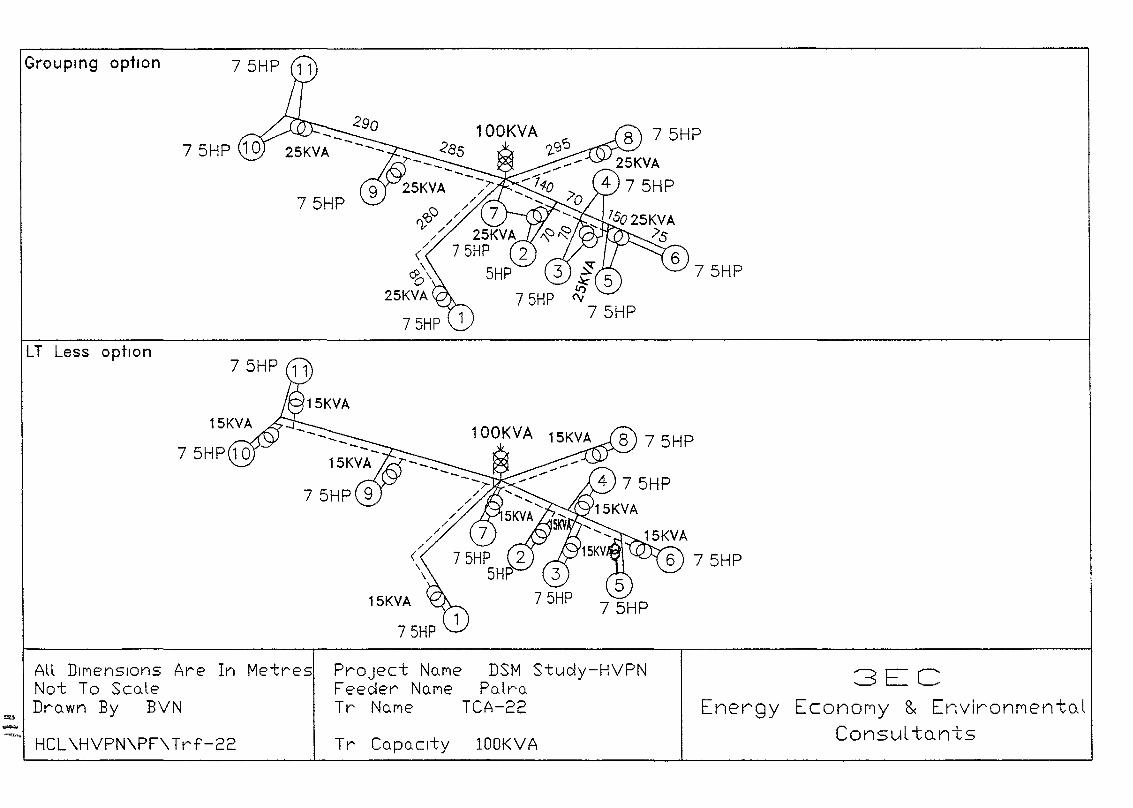
75HP
75HP
15KVA
LT Less opfton
Grouping option
All DIMensIons Are In MetresNot To Sco.leDro.wn By BVN-
Project No.Me DSM Study-HVPNFeecler No.Me Po.lro.Tr No.Me TCA-22
- HCL\HVPN\PF\Trf-22 Tr Co.po.C1ty lOOK VA
3ECEnergy EconoMy & EnvironMentoJ
Consul to.nts
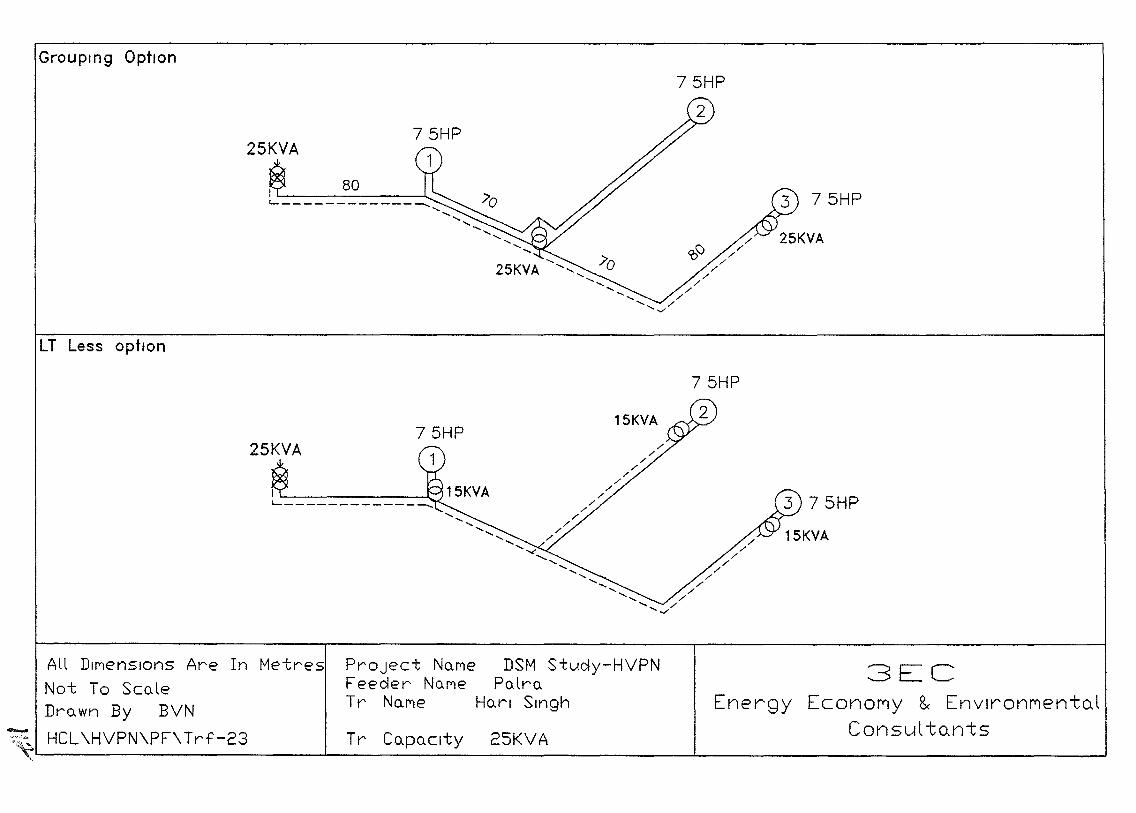
Grouping Option
25KVA
80I L.--------J...:1.-. -......
......' ........ ,'-
' ...........................
75HP
LT Less option
75HP
25KVA75HP
1
15KVA
3ECEnergy EconoMy 8< EnvlronlYJento.l
Consul tQnts25KVA
DSM Stuoly-HVPNPedro
Hort Singh
Project NOMeFeeder NOMeTr No.Me
All DIMensions Are In Metres
Not To ScoleDrown By BVN
-.-..~ HCL\HVPN\PF\Trf-23 Tr CopoCity",'----------- L-__-.:..._--= -L ---l
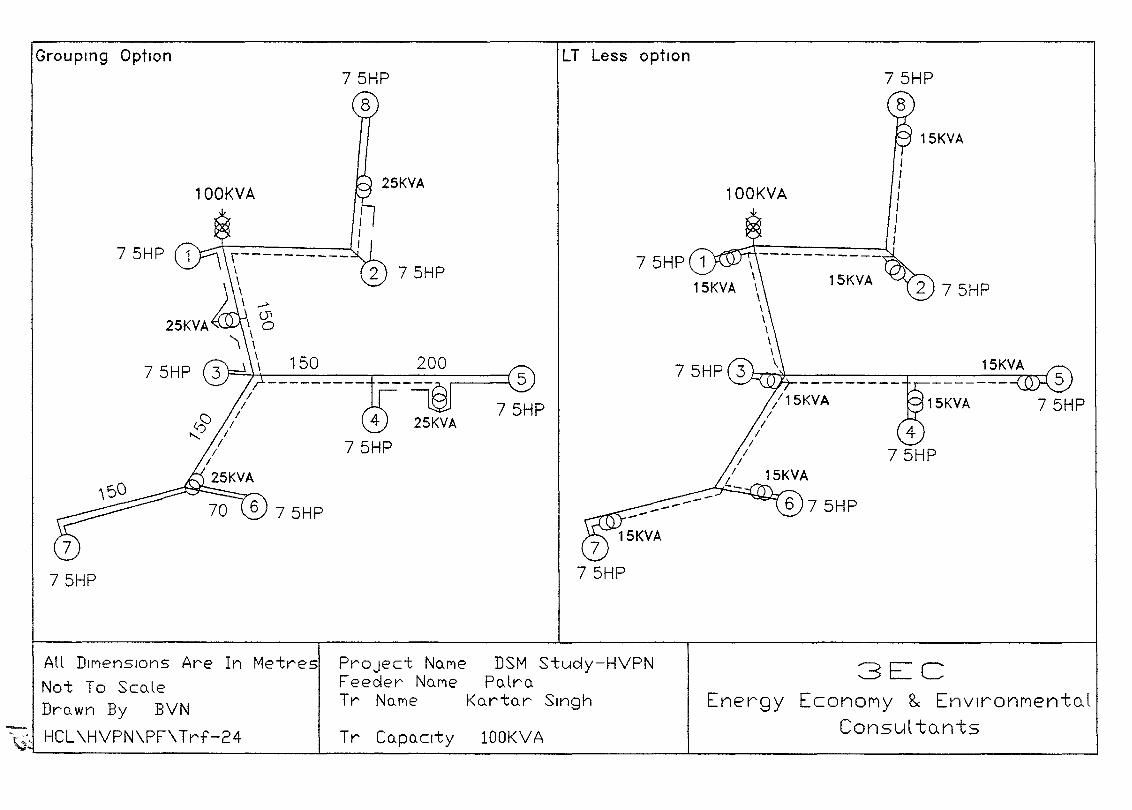
Grouping Option LT Less optIon
15KVA
15KVA
15KVA
100KVA
75HP
75HP
r----------\\\\~
\lJI\0
'\ \\ 150
100KVA
75HP
75HP
75HP
3ECEnergy EconoMy 8.< EnvlronMentoJ
Consul tentslOOKVA
DSM Stuc!y-HVPNPedro.
Ko.rto.r SIngh
Tr Co.po.C1ty
PrOject No.MeFeeder No.ME'Tr No.ME'
All DII'letlSIOns Are In Metres
Not To ScoJeDro.wn By BVN
HCL\HVPN\PF\Trf-24,,~~
\f.-l.- -..l... ..1.- --J
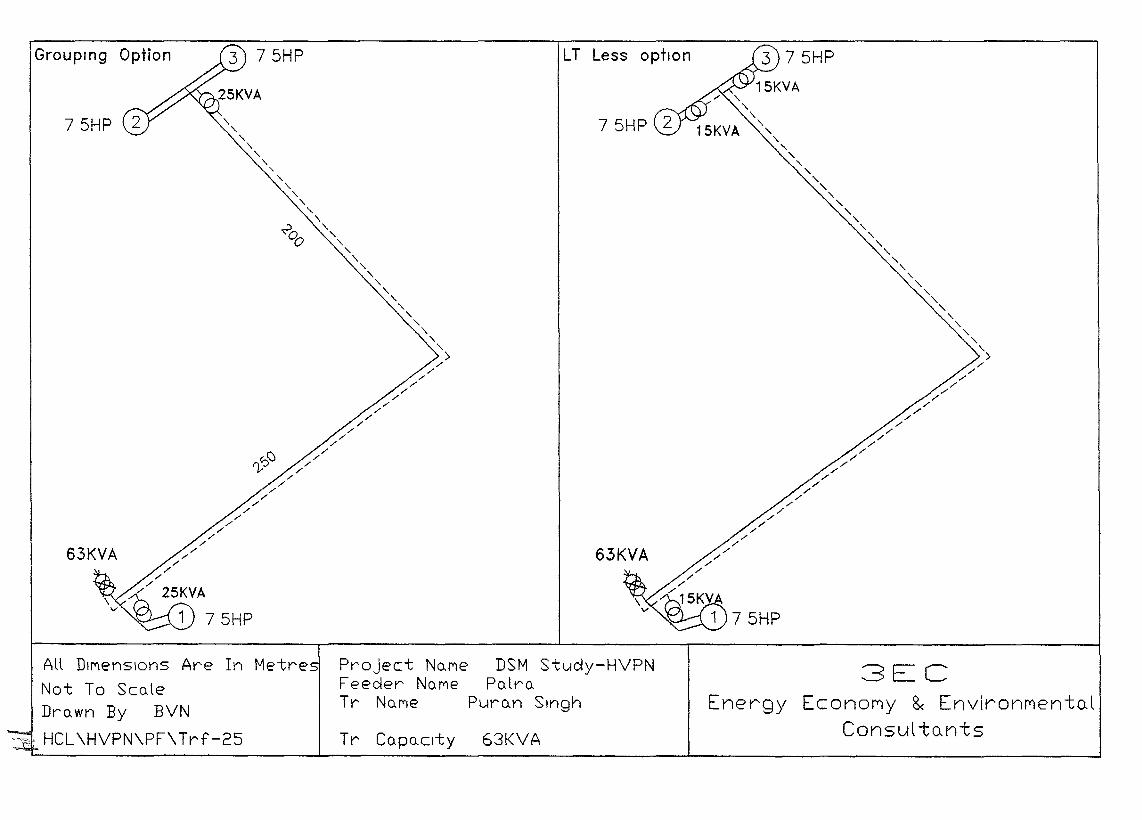
75HP
63KVA
LT Less option
~Qo
75HP
75HP
75HP
Grouping Option
DSM Study-HVPNPelro.
Puro.n SIngh
All DIMenSIons Are In Metre
Not To ScoJeDrO-wn By BVNHCL\HVPN\PF\Trf-25
Project No-MeFeeder NO-MeTr No-Me
Tr CO-po.Clty 63KVA
3ECEnergy EconoMy 8< EnvironMento.l
Consul to.nts
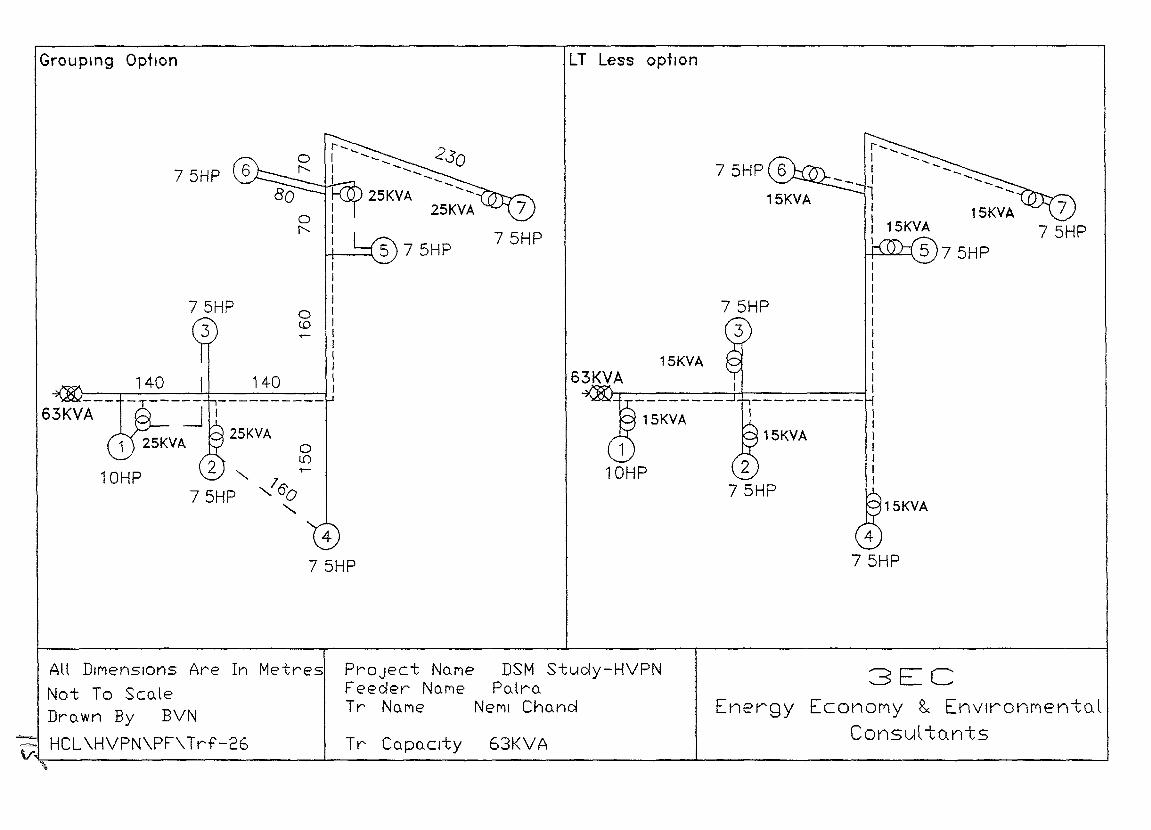
Grouping Option LT Less optIon
75HP
i-_I --_I --_
-... I .............-~l ~-~
I
: 15KVAI
1SKVA
75HP
r---_ 2I --_ 30I ..................
I -----75HP
15KVA
15KVA15KVA
15KVA
110HP
4
75HP
oL()
oto
140
25KVA
10HP
DSM Study-HVPNPulrO-
NeMI Chund
All DIMensions Are In Metres
Not To SculeDrO-wn By BVN
\7 HCL\HVPN\PF\Trf-26'\
Project NO-MeFeeder No-MeTr No-Me
Tr CupO-clty 63KVA
3ECEnergy EconoMy 8.: Envlronrlen-tcd
Consul-to.n-ts
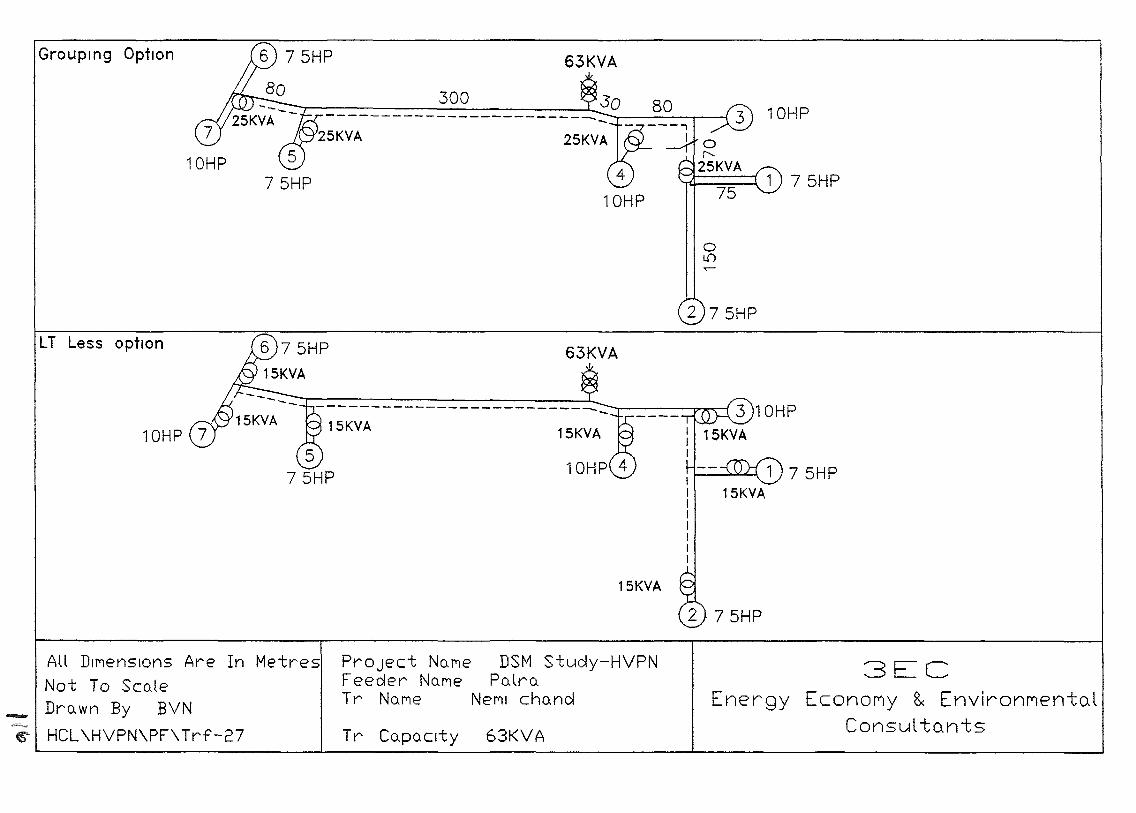
Groupmg Option
10HP
63KVA
300-----------------------~ 10HP
~::::::;:;:;:::::( 1 7 5HP
oL{)
2 75HP
f--....;:"..:,{..",-\ 1 7 5HP15KVA
63KVA
15KVA15KVA-------------------------
LT Less option
15KVA
PrOject NOMeFeeder NOMeTr NOMe
DSM Study-HVPNPe-lre-
NeMI che-nd
All DIMensions Are In Metres
Not To Scole__ Drown By BVN-~ HCL\HVPN\PF\Trf-27 Tr Ce-po.C1ty 63KVA
3ECEnergy EconorlY & EnvironMentol
Consul to.nts
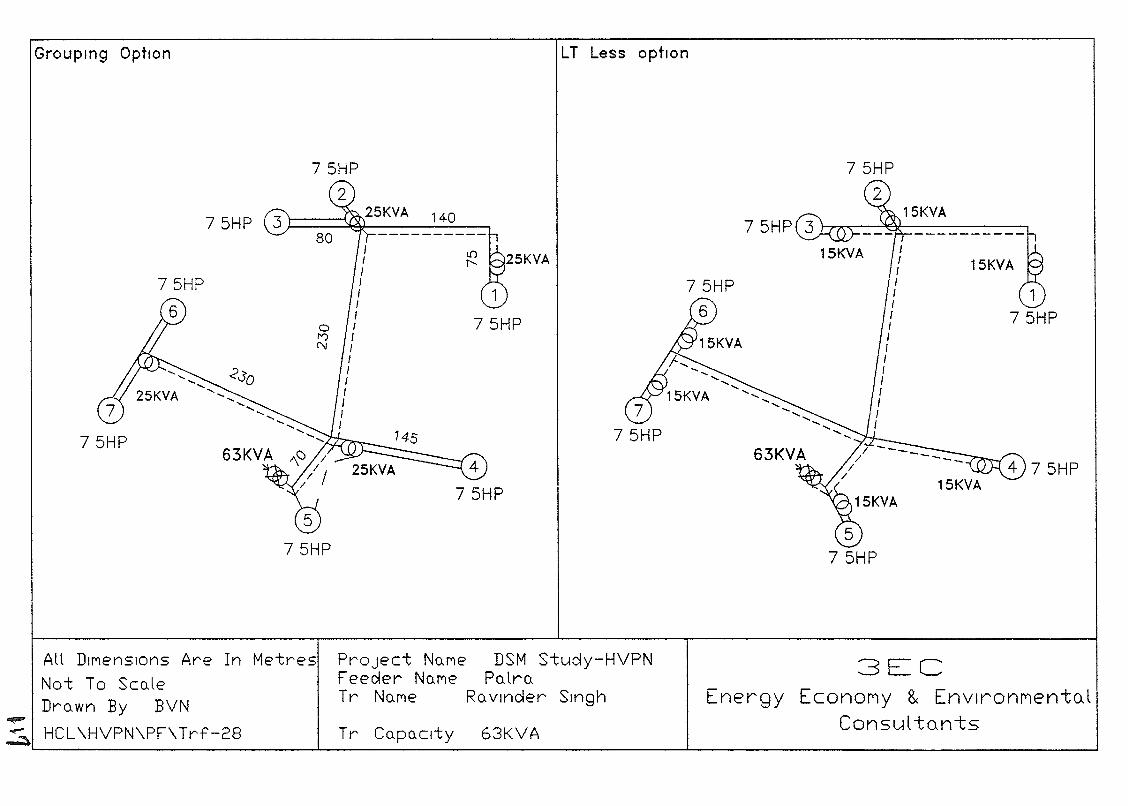
Groupmg Option LT Less option
1
75HP
15KVAIfIIIIIIIfIIffffI
63KVA
75HP
75HP
3ECEnergy EconoMy 8.: EnvlronMentoJ
Consul tonts63KVATr cQPo.clty
PrOject NQMe DSM Study-HVPNFeeder NQMe PQlrQTr NQMe RQ vlncler SIngh
All DIMensIons Are In Metres
Not To SCQleDrQwn By BVN
HCL\HVPN\PF\Trf-28~
"'!'"~'- ..J.- ..J.- ---l
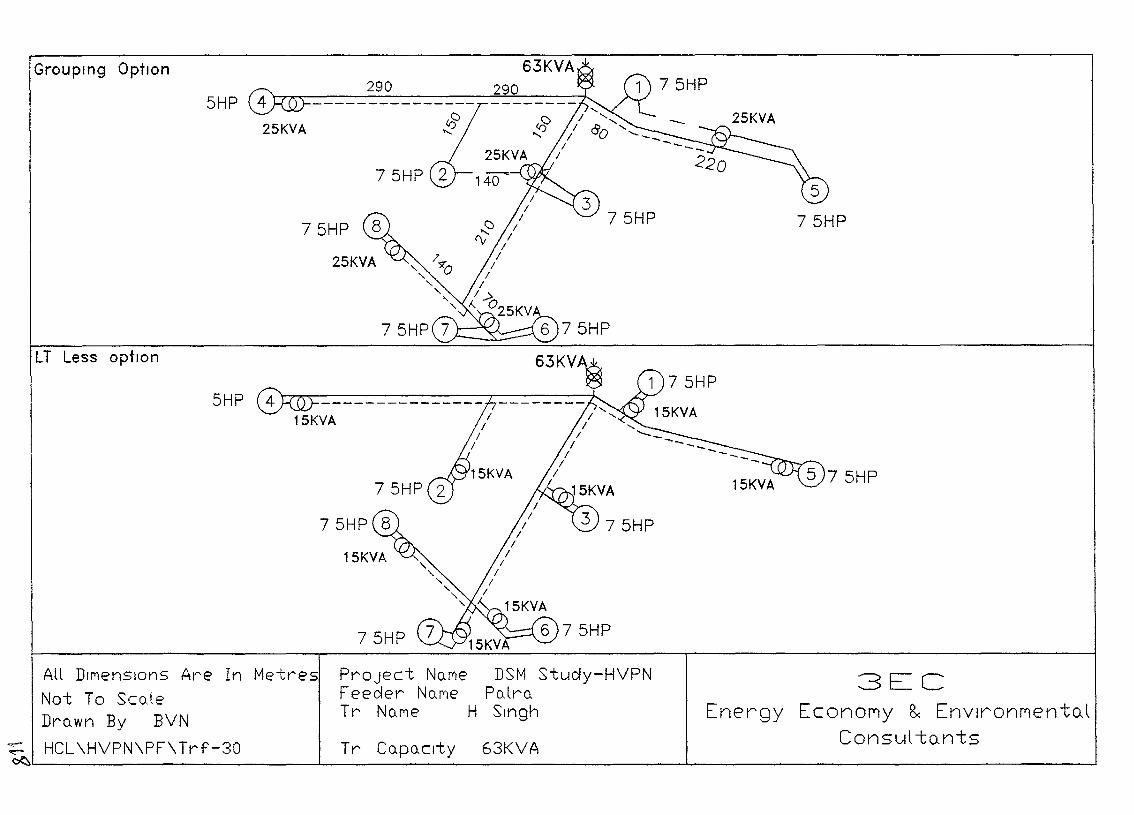
Grouping OptIon
LT Less option
5HP
5HP
25KVA
75HP
15KVA
290
75HP
75HP
75HP
I/
II
15KVA
75HP
1 75HP
1 75HP
25KVA
3ECEnergy EconoMy 8< EnvlronMento.l
Consul to.nts
All DIMensions Are In Metres Project NQMe DSM Study-HVPNNot To SCQle Feeder NQMe pQlro.DrQwn By BVN Tr NQMe H Singh
~ HCL\HVPN\PF\Trf-30 Tr CQPQClty 63KVA~~ ...L-__':----=- ..L- -J
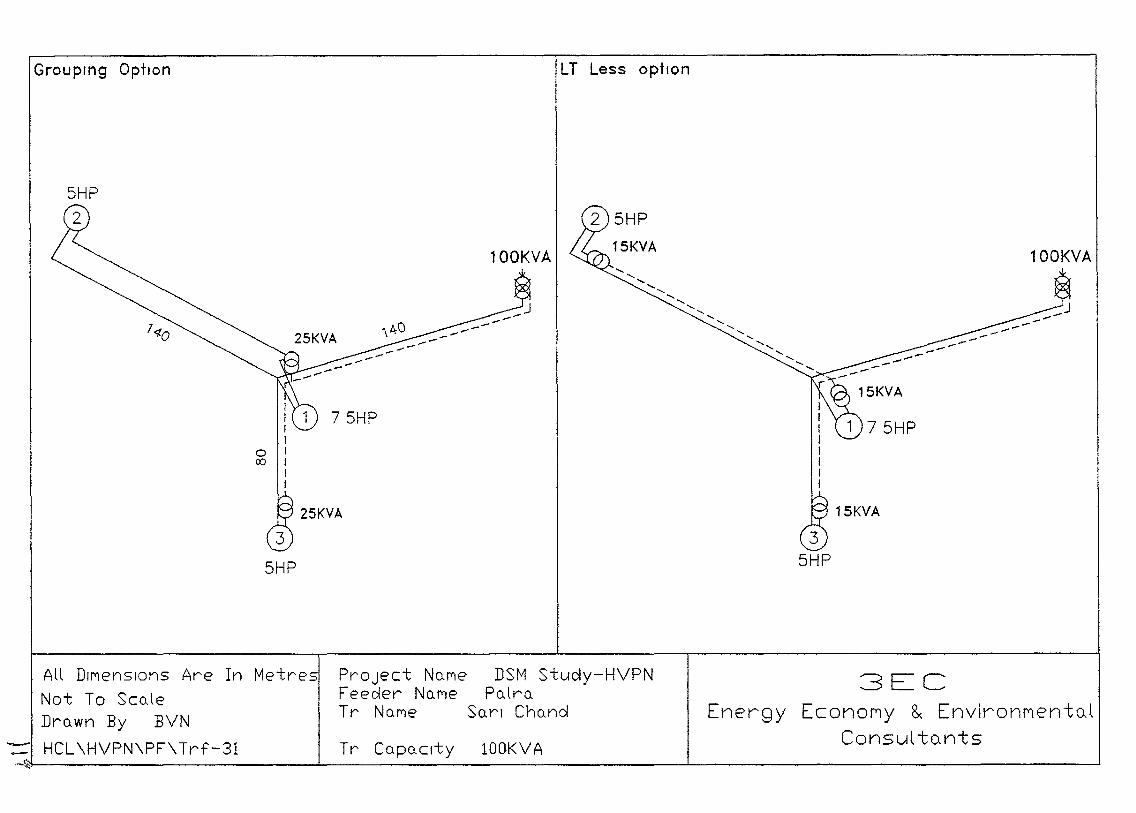
Grouping Option LT Less optIOn
100KVA100KVA
75HP
oOJ
25KVA 15KVA
PrOject NaMe DSM Study-HVPNFeeoler No.Me Po.lro.Tr No.Me SarI Cho.nd
-
All DIMensions Are In Metres
Not To ScaleDrawn By BVN
HCL\HVPN\PF\Trf-31 Tr CapacIty 100KVA
3ECEnergy EconoMy 8< EnvironMentoJ
Consul to.nts
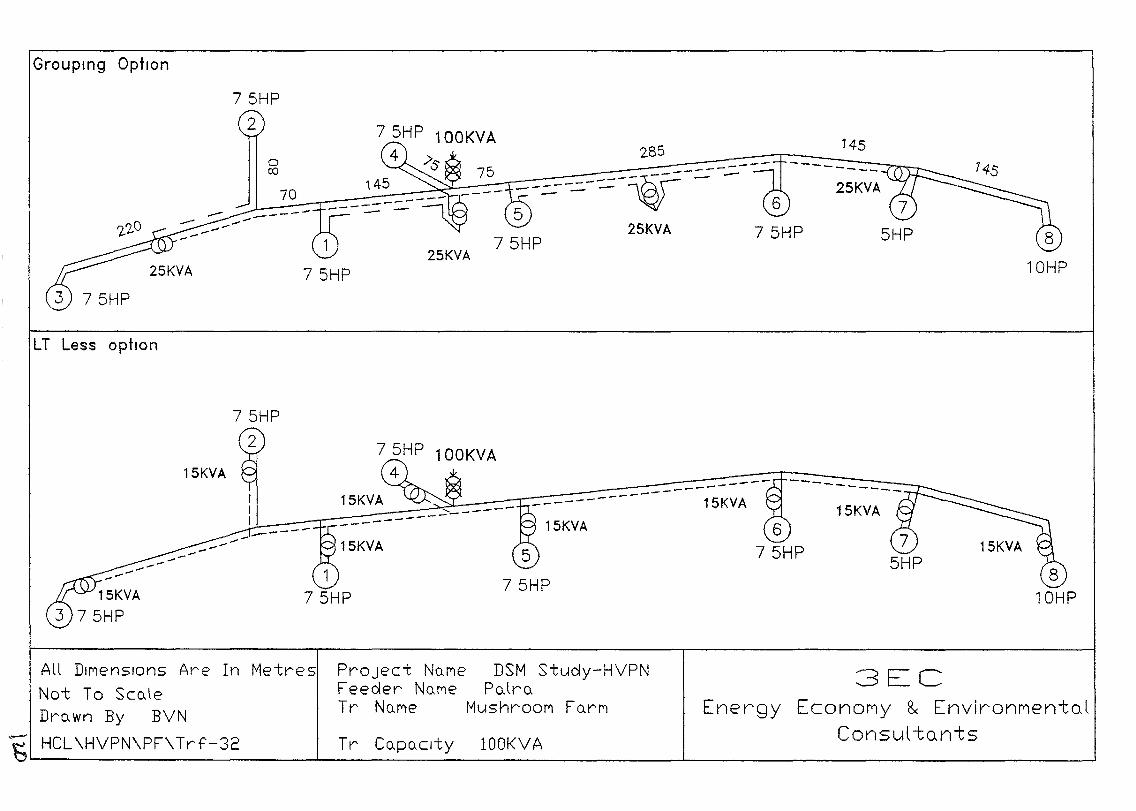
Grouping Option
145
----25KVA
------285
--------:.=-;~r-- ~5
25KVA75HP
25KVA
'\45
----=-70----
1
75HP
oco
75HP
2
25KVA
LT Less option
15KVA
15KVA
----------------- 15KVA
15KYA
----15KYA
15KYA
lOOK VA
PrOject No.MeFeeder NUMeTr NUMe
All DIMensIons Are In Metres
Not To Sco.leDro. wn By BVN
~ HCL\HVPN\PF\Trf-32
DSM Study-HVPNPo.lru
MushrooM FurM
3ECEnergy EconoMy 8.< EnvironMentoJ
Consul tQnts
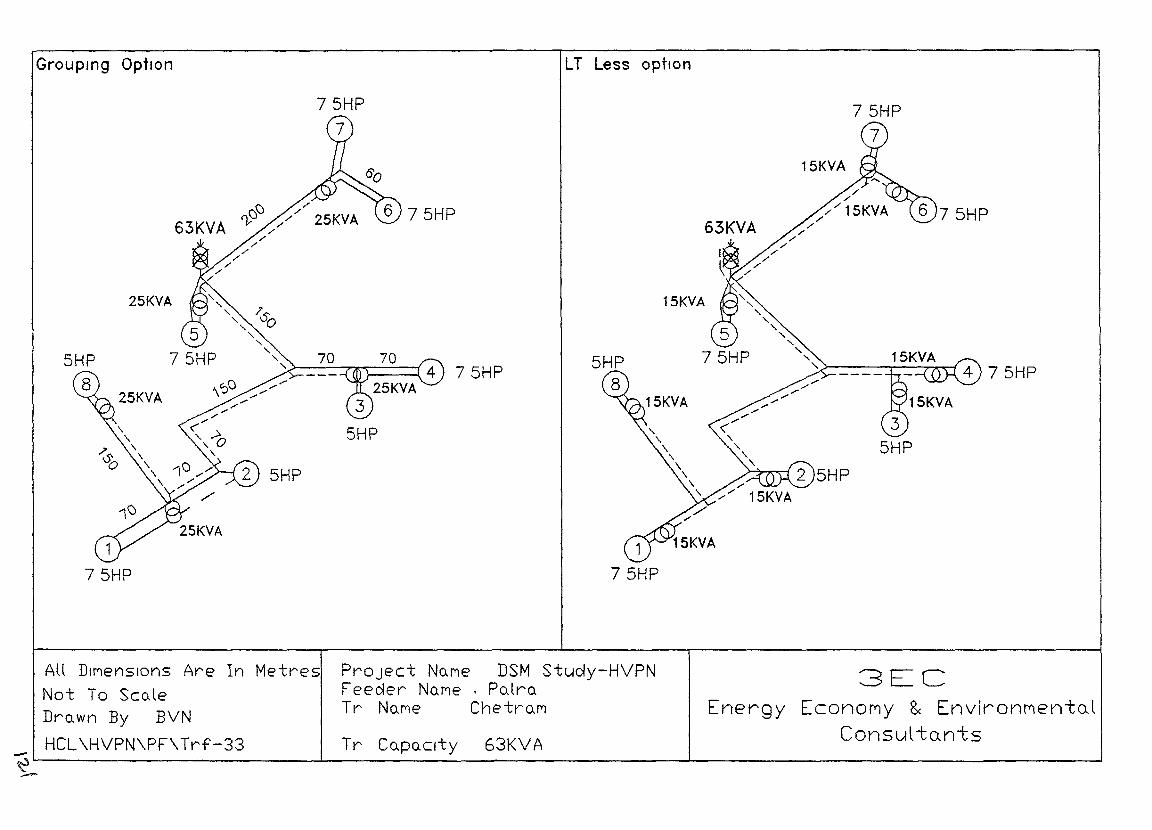
Groupmg Option LT Less optIon
25KVA
1
75HP
75HP
75HP
15KVA
175HP
63KVA
15KVA
5HP
3ECEnergy EconoMy 8< Environt"lentoJ
Consul tentsTr CQpo.C1ty 63KVA
PrOject NQMe DSM Stuay-HVPNFeeaer NQMe I pQlroTr NOMe ChetrQM
All DIMensions Are In Metres
Not To Sco.leDrQwn By BVN
HCL\HVPN\PF\Trf-33-~'-- ...J- ..J-- ----l
--
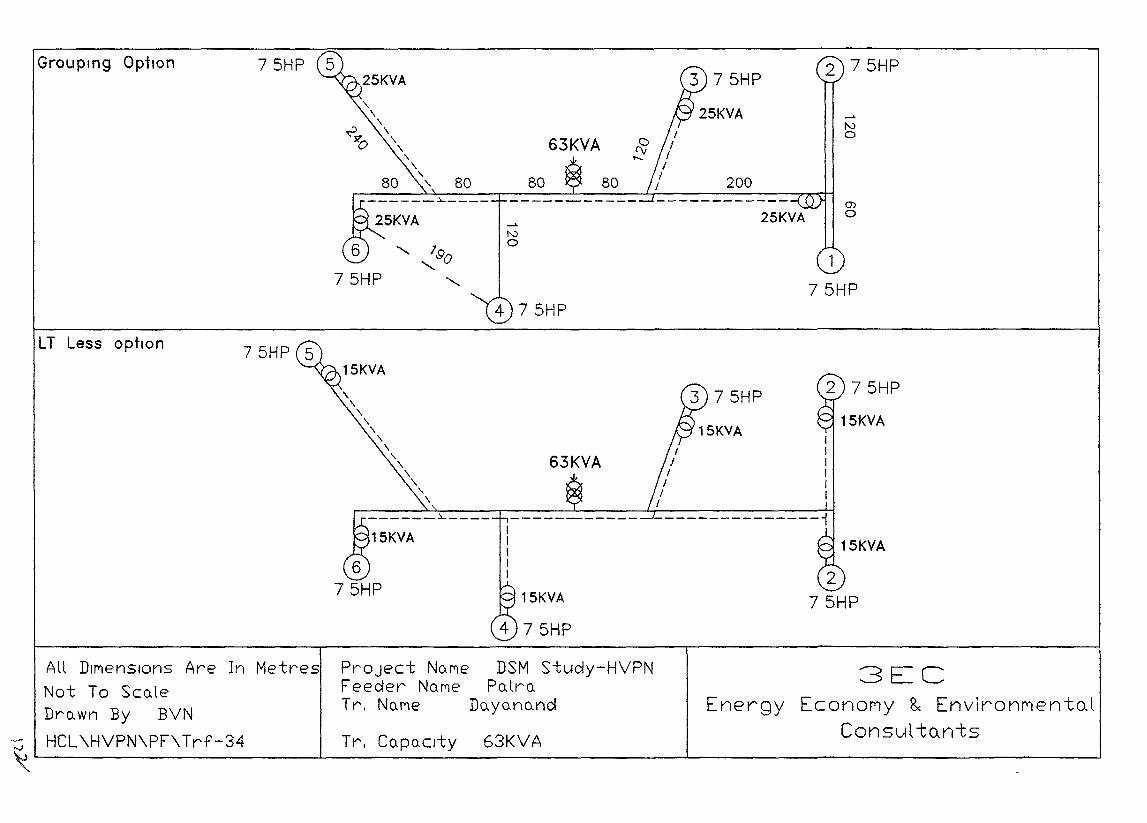
(j)
o
tvo
2 75HP
200
15KVA
1
75HP
I/
II
II
---------------i
15KVA
tvo
\\'\
'\'\
\\'\
\'\
'\
"\
75HP
LT Less optIon
Grouping Optton
3ECEnergy EconoMy 8< EnvlronMento.l
Consul tents
Project No.Me DSM Stuay-HVPNFeeder No.Me Po.lro.Tr, No.l"'lE' Do.yuno.nd
All DIMensIons Are In MetresNot To Sco.teDro.wn By BVN
...J HCL\HVPN\PF\Trf-34 Tr, Co.po.C1ty 63KVA~~--------------'------------------'-----------------------J
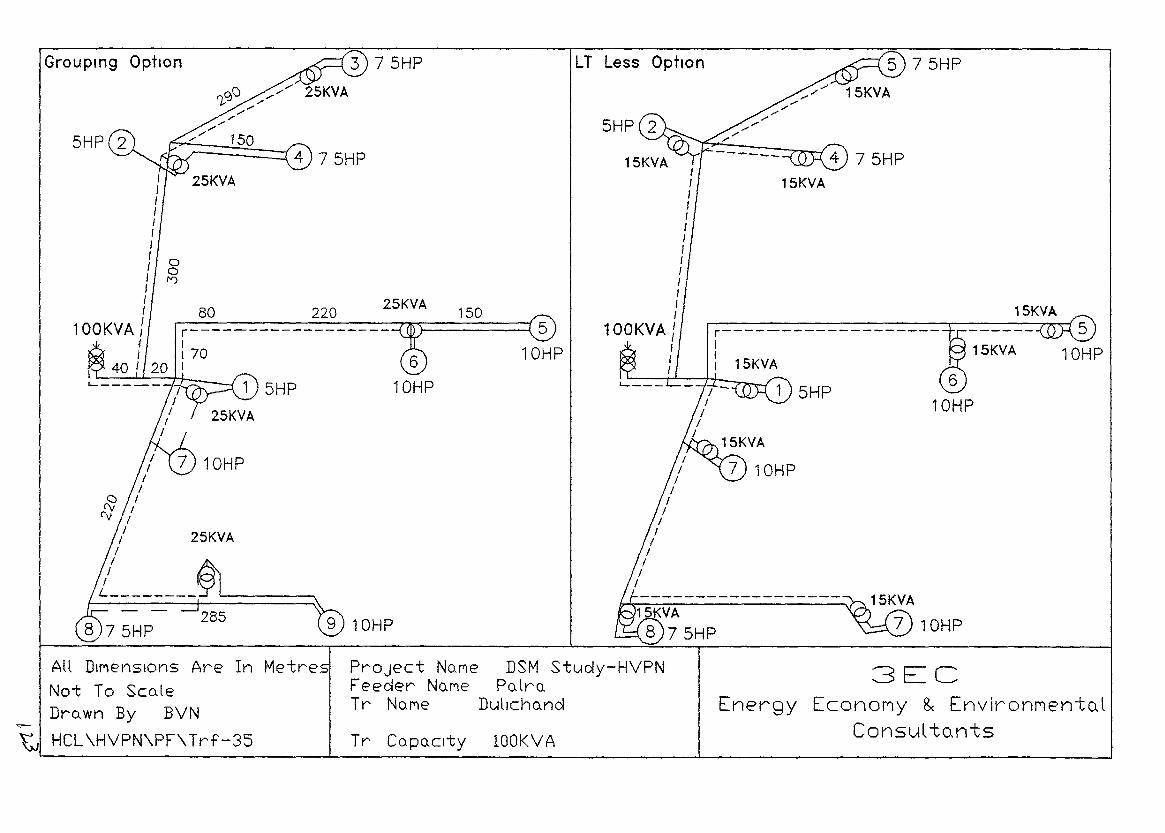
75HP
15KVA
7 10HP
75HP
5HP
15KVA
15KVAr-------------------I
: 15KVA
IIIIIIIIIII1II
100KVA fIII
LT Less Option
15025KVA
75HP
10HP
220
25KVA
10HP
80
25KVA
aot")
C=====:==:=f 4 7 5HP
Groupmg OptIOn
PrOject NO-MeFeeder No-MeTr NOMe
All DIMenSions Are In Metres
Not To ScoJeDrnwn By BVN
~ HCL\HVPN\PF\Trf-35 Tr CopO-clty
DSM Study-HVPNPnlro.
Dullchnnd
lOOKVA
3ECEnergy EconorlY 8< EnvironMento.l
Consul to.nts
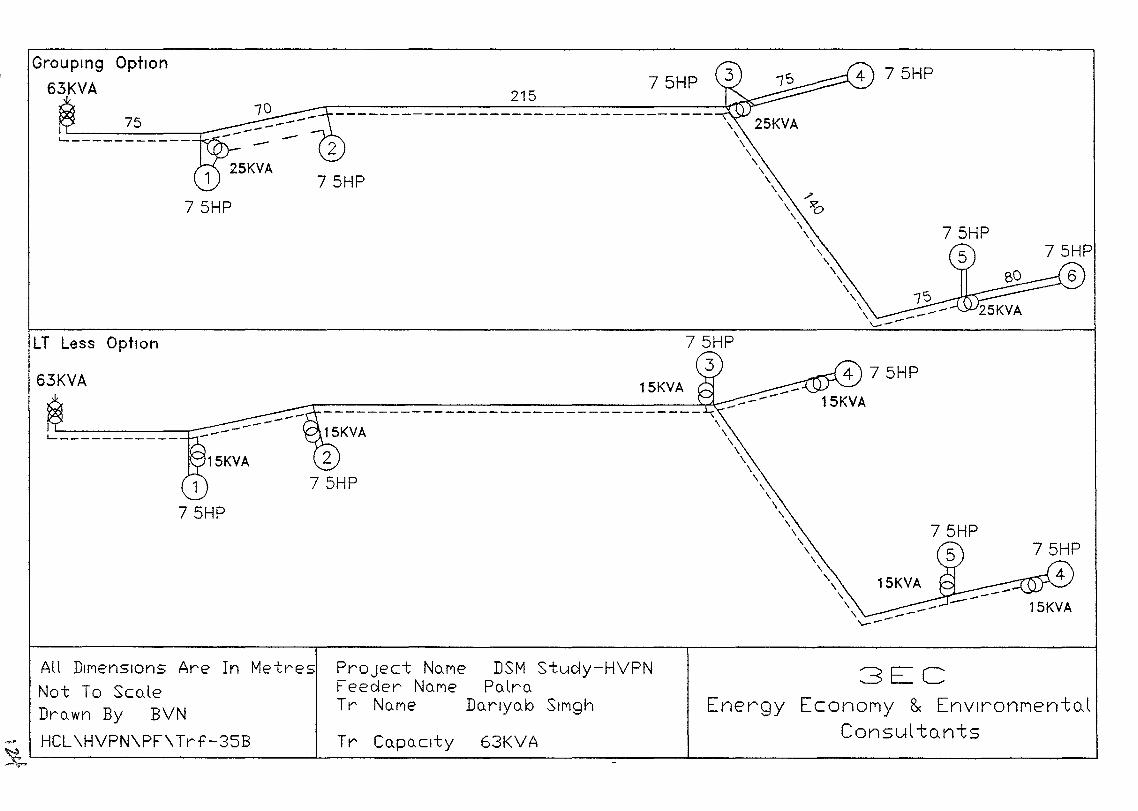
\\
"\
"\\
\\
\
""\
"\\
\
""\\
" -\.---
"\\
\
"\
"\\ .;-\ 3iQ"
75HP
15KVA
215
75HP
15KVA
1
75HP
75I L...- ,--
'------------
75HP
I "-- .....---_--L.... _
63KVA
LT Less Option
Grouping Option
63KVA
3ECEnergy Econol"'lY & EnvlronrientO-l
Consul to-nts
All DIMensions Are In Metres Project No.Me DSM Stuoly-HVPNNot To Sco.le Feeoler No.Me Po.lro.Dro.wn By BVN Tr No.Me Do.rlyo.b SIMgh
HCL\HVPN\PF\Trf-35B Tr Co.Po.clty 63KVA~'--- ...L.-__""":'--_-=- ---:__-.l. -.J-
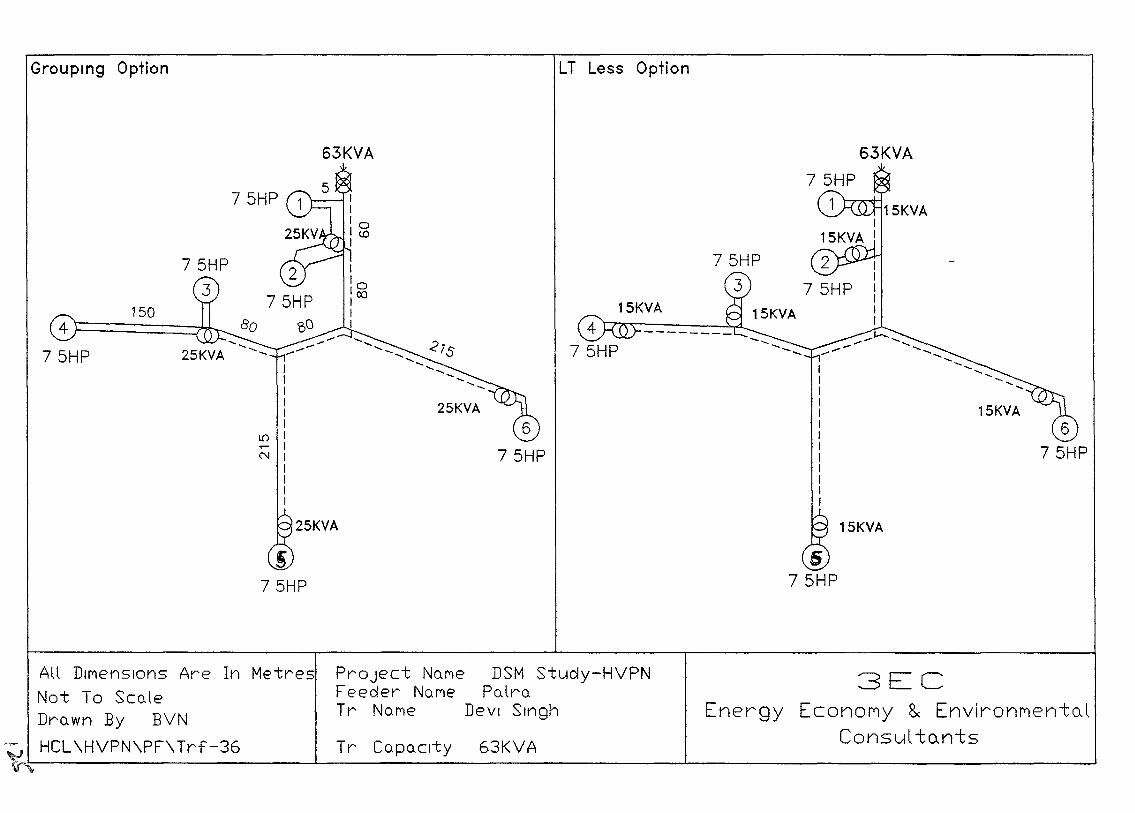
Grouping Option LT Less Option
..... ......
.................
..................
63KVA75HP
1
-.....--.....
15KVA 15KVA'cn~---~C
I10leoIII
63KVA
150
75HP
3
4 )========:===:M75HP
25KVA 15KVA
3ECEnergy EconoMy 8< EnvironMen-to.l
Consul-to.n-ts63KVA
DSM Study-HVPNPo.lro.
Devi Singh
PrOject No.MeFeeder NOMeTr No.Me
All Dll"'lenSIOns Are In Metres
Not To Sco.leDro.wn By BVN
~J HCL\HVPN\PF\Trf-36 Tr Co.po.C1tyv-,,~-----------_...L-_--------------_...L_---------------_--.J
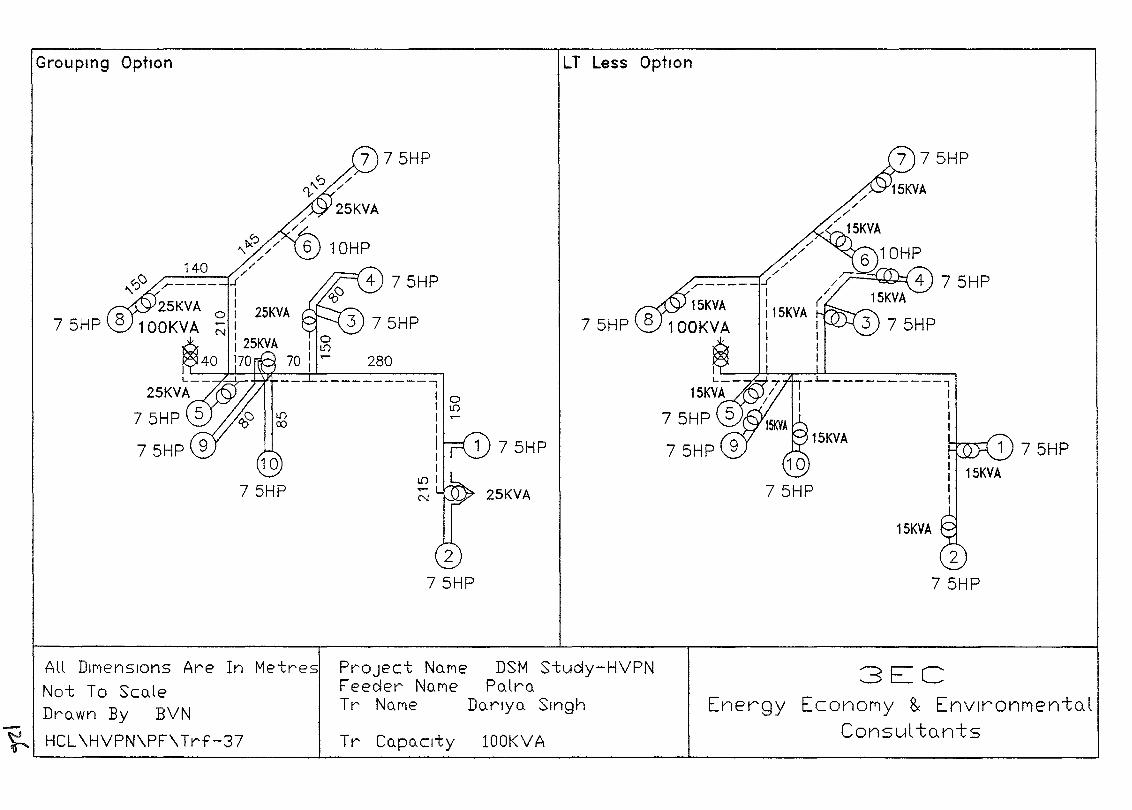
Groupmg Option LT Less OptIon
7 5HP
75HP
75HP
15KVA
15KVA
/'/'
/'/'
.,..----< /'",- ..1'I /
15KVA : 15KVA L(.-...... ~
100KVA I II II I
25KVA
1 75HP
-----------,'0II.!)II
III
I.!) I.-N
I~70 I .- 280
I
10
75HP
",-----
140
75HP
3ECEnergy EconoMy 8< Envlronrlento.l
Consul to.ntslOOKVA
DSM Study-HVPNPolro
Dorlyo Singh
Tr Co.poCity
PrOject NOMeFeeder NOMeTr NOMe
All DIMensions Are In Metres
Not To ScoJeDrown By BVN
HCL\HVPN\PF\Trf-37~ '--- --1.. ...1-- --1
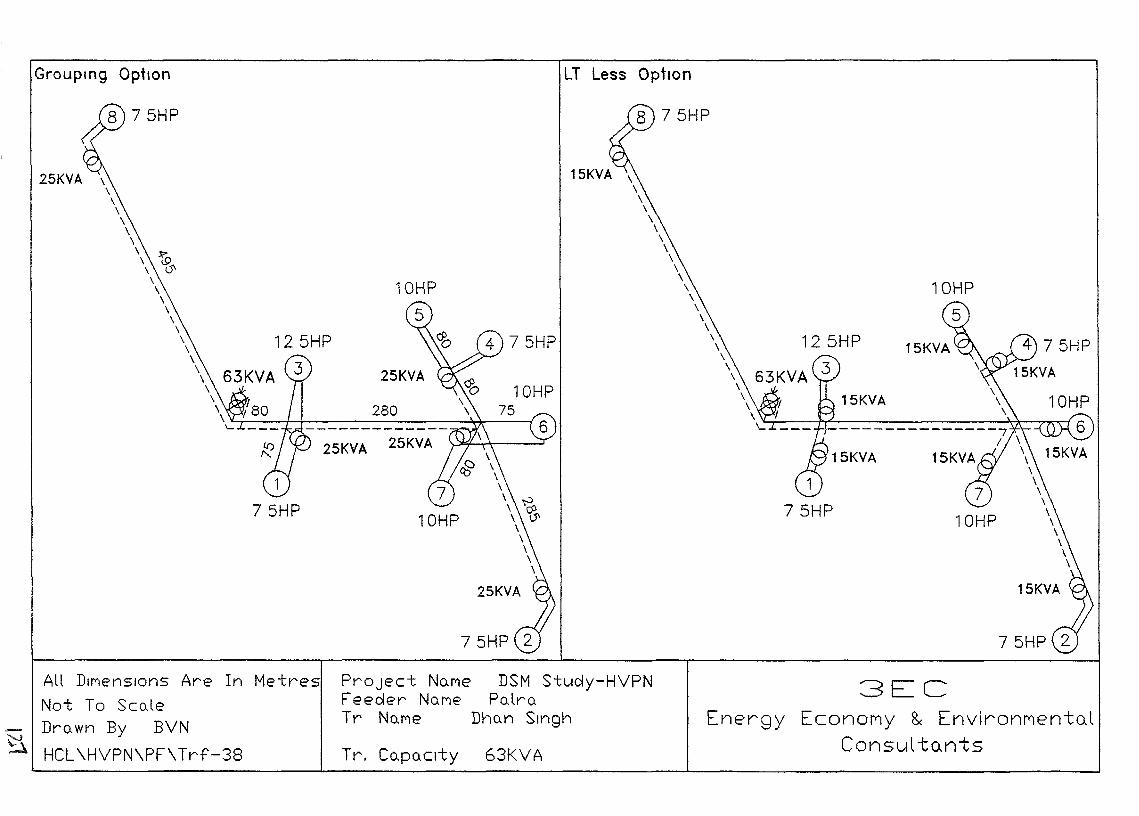
Groupmg OptIon
1
75HP
25KVA 25KVA
LT Less OptIon
1
75HP
Project NUMeFeeder No.MeTr No.Me
ALL DIMenSions Are In Metres
Not To Sco.LeDruwn By BVN
~ HCL\HVPN\PF\Trf-38 Tr. CQPQClty
DSM S-tudy-HVPNPuLro.
Dho.n SIngh
63KVA
3ECEnergy EconoMy & EnvironMento.l
Consul to.nts
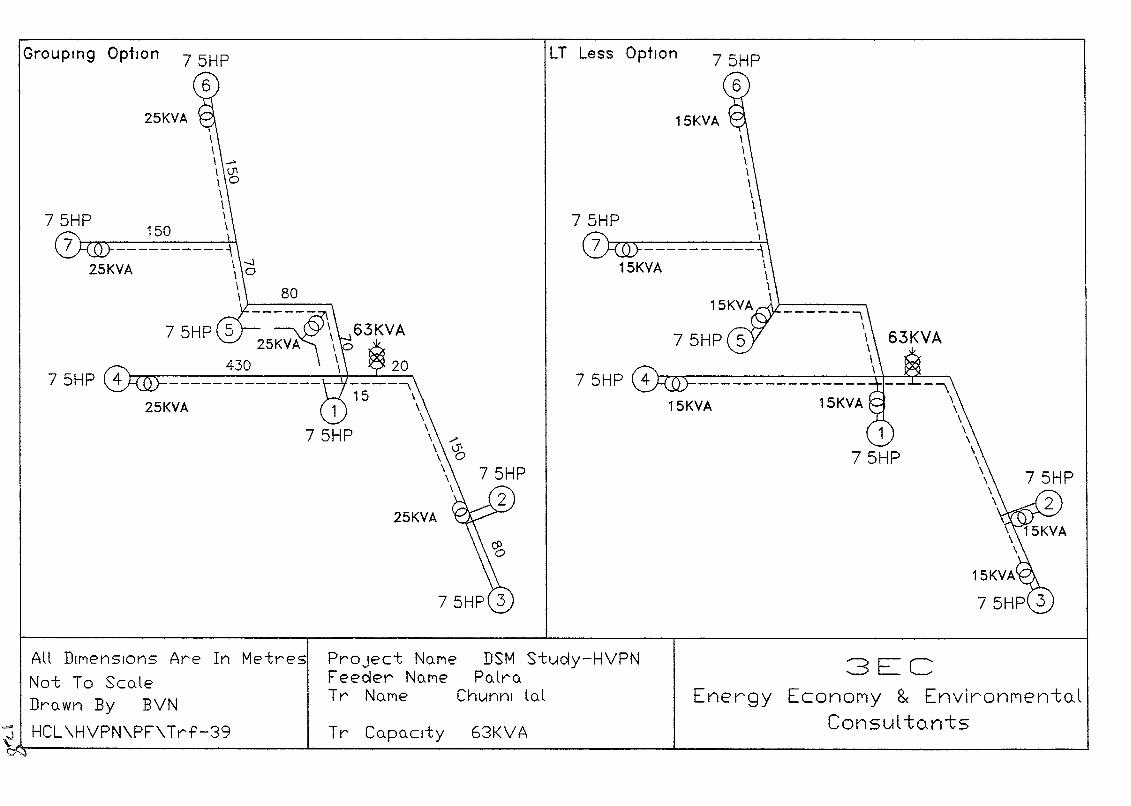
Grouping Option
25KVA
25KVA
80
25KVA
LT Less Option
15KVA\\\\\\\\\\
-----------\15KVA \
\\
15KVA 15KVA
3ECEnergy EconoMy ~ EnvironMente-l
Consul ta-n-ts63KVA
DSM Study-HVPNPo.lro.
Chunnl lo.l
ProJect No-MeFeeder No.MeTr No.Me
AU DIMensions Are In Metres
Not To ScO-leDro.wn By BVN
~ HCL\HVPN\PF\Trf-39 Tr Co.Po.clty~---- ....L- ......J... ----l
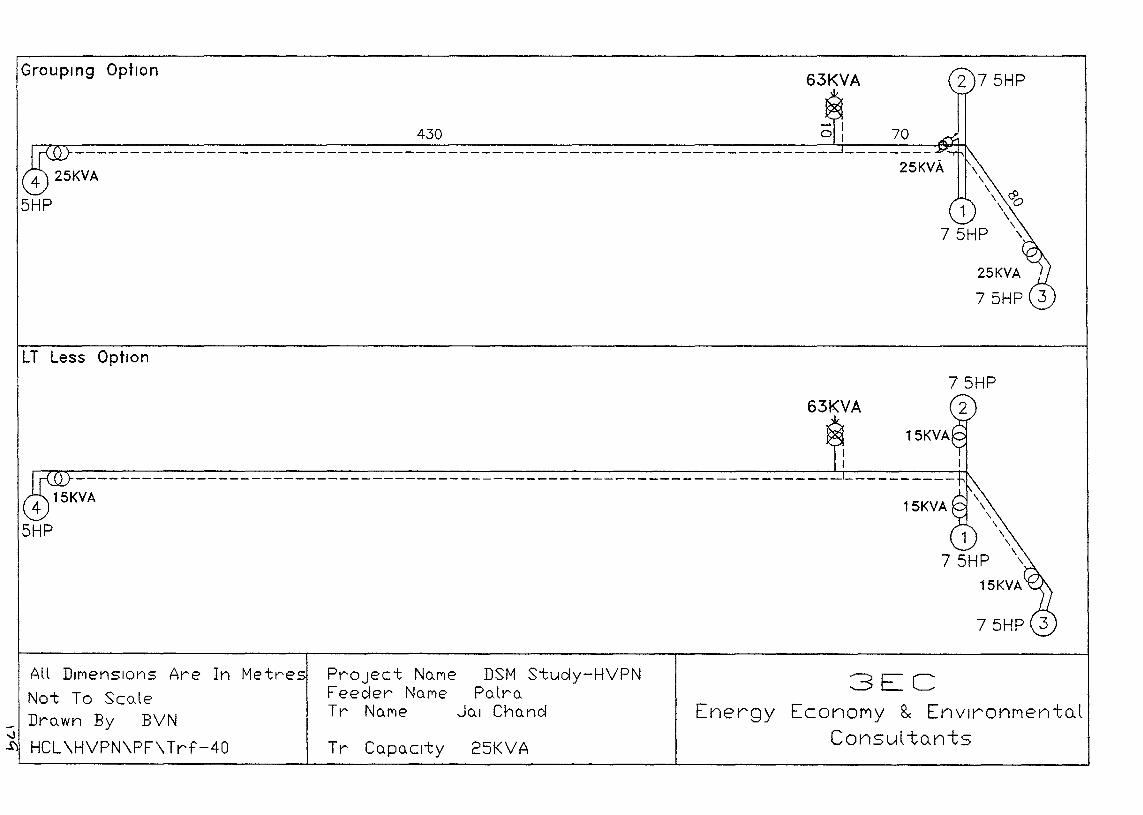
Grouping Option
LT Less Option
430
63KVA
70
175HP
63KVA
15KVA
175HP
15KVA
All DII"l)enSIOns Are In Metres
Not To ScoJeDrnwn By BVN
HCL\HVPN\PF\Trf-40
PrOject NnMeFeeder NaMeTr NnMe
Tr Copnclty
DSM Study-HVPNPnlra
Jnl Chand
25KVA
3ECEnergy EconoMy 8< EnvlronMento.l
Consul to.nts
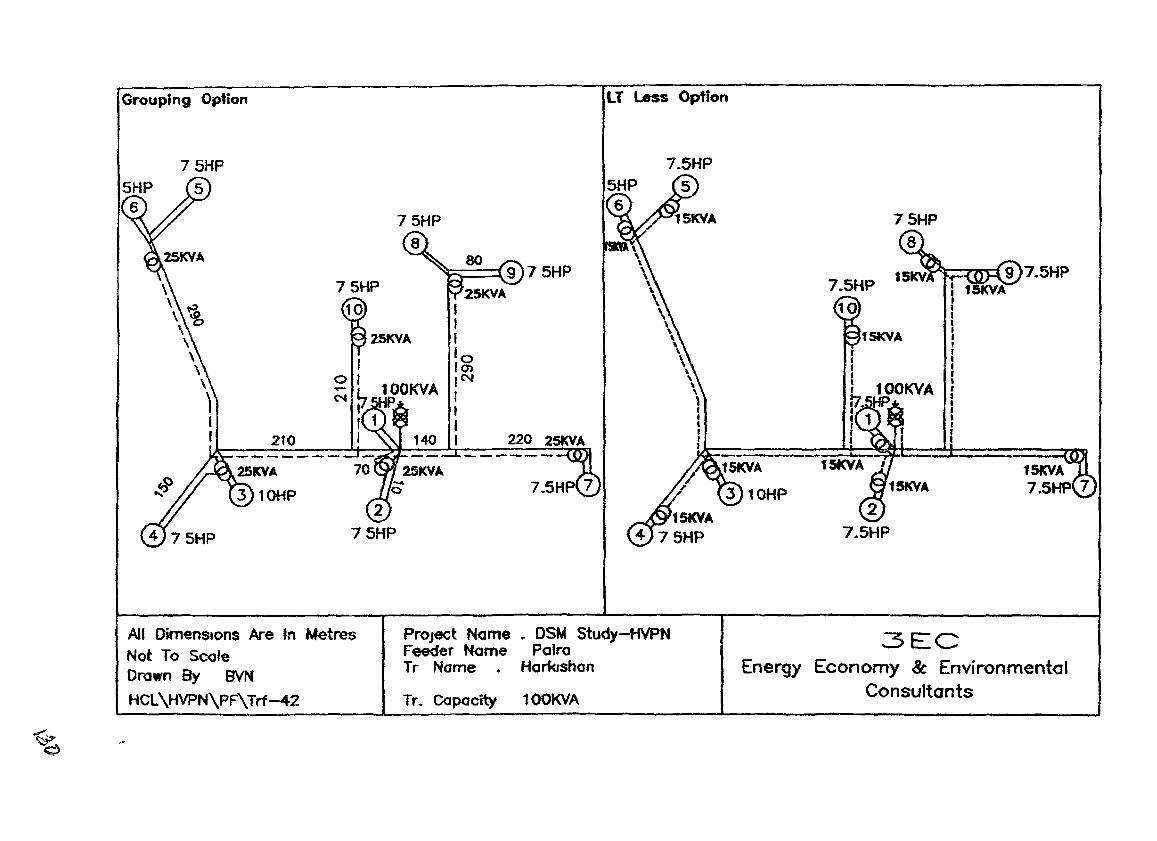
Grouping Option IT less Option
~==::(9 7 5HP2SKVA
III1010>INIIII
All DimensIons Are In MetresNot To ScofeDrawn By BVN
HCL\HVPN\PF\Trl-42
PrOject N<Jme • OSM Study-HVPNFeeder Name PalmTr Name Harktshon
Tr. Capacity 100KVA
3ECEnergy Economy & Environmental
Consultants
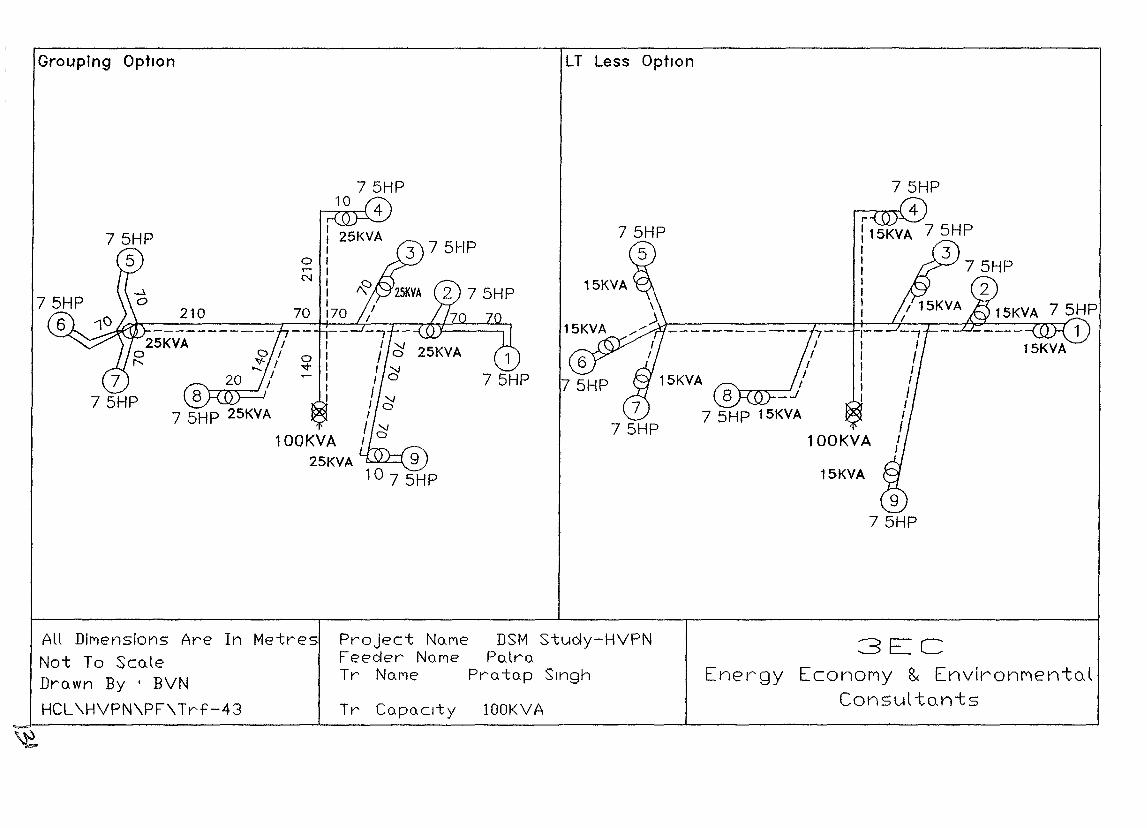
GroupIng Option LT Less Option
75HP...----,....,..",..( 4
r
: 15KVA 75HP: 3I1I1I
15KVA
87 5HP 15KVA
100KVA
15KVA
75HP.\A---------r---HI------<-;--.--.p,e;;.'-----r7'~1
15KVA
210
87 5HP 25KVA
100KVA25KVA
Tr Co.Po.clty lOOKVA
Project NO-\'Y'\eFeeder No.MeTr No.Me
All DIMensions Are In Metres
Not To ScnleDro.wn By I BVN
HCL\HVPN\PF\Trf-43
DSM Stucly-HVPNPo.lro.
Pro. to.p Singh
3ECEnergy Econorty 8< EnvironP"1ento.l
Consul to.n-ts
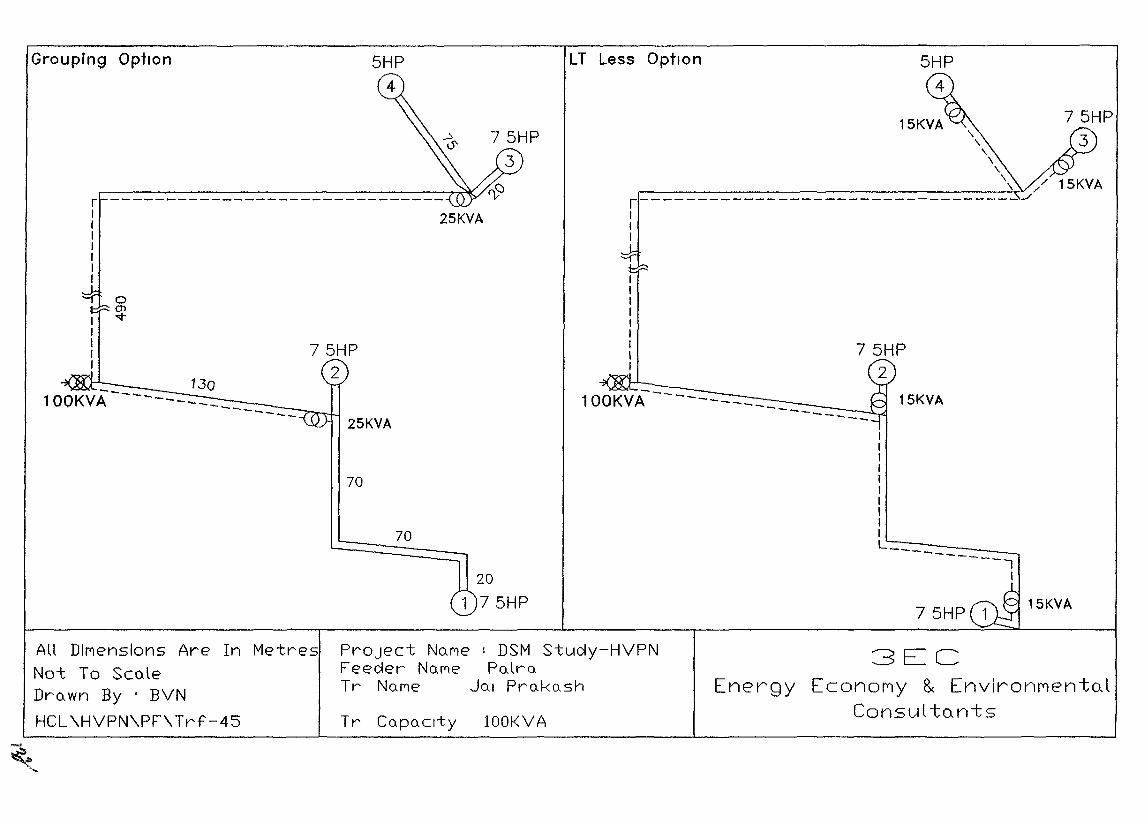
Grouping OptIOn
r ------------------------------IIIIIII
LT Less OptIon
15KVA---
70
70
IIIIIII,IIL::-::_:-::_:-:_:::_:.-:----~------,
I
75HP15KVA
All DiMensions Are In MetrE's
Not To ScoJeDro. wn By , BVN
HCL\HVPN\PF\Trf-45
PrOject No.Me I DSM Stucly-HVPNFeecler No.ME' PulruTr NUMe jUt Pro.ko.sh
Tr Co-po-CIty lOOKVA
3ECEnergy EconofYlY 8< EnvironfYlentoJ
Consul to.nts
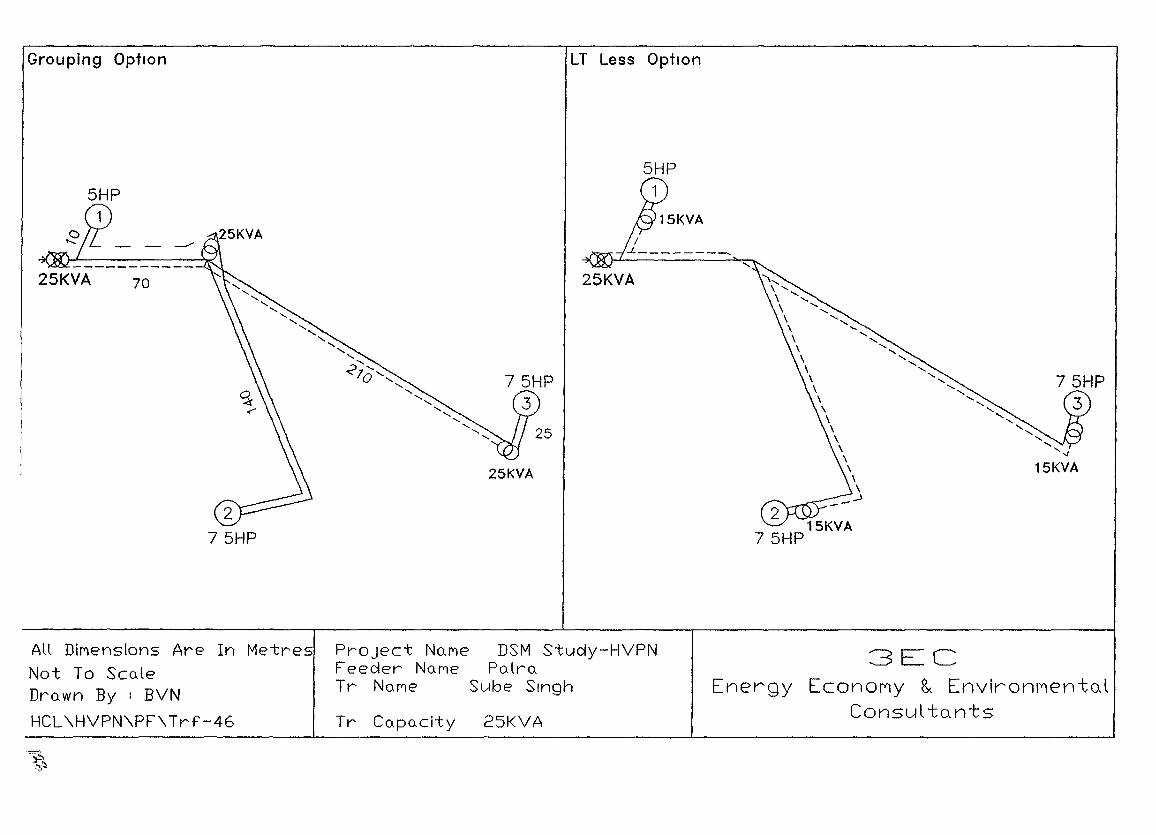
Grouping Option LT Less Option
15KVA
215KVA
75HP
25KVA
25KVA
70
- --/
25KVA
DSM Study-HVPNPolro.
Sube SIngh
All DIMensions Are In Metres
Not To Sco.leDro.wn By : BVNHCL\HVPN\PF\Trf-46
PrOject No.MeFeeder NOMeTr NOMe
Tr Co.pocl-ty 25KVA
3ECEnergy EconoMy & EnvironMen-toJ
Consul-tunts
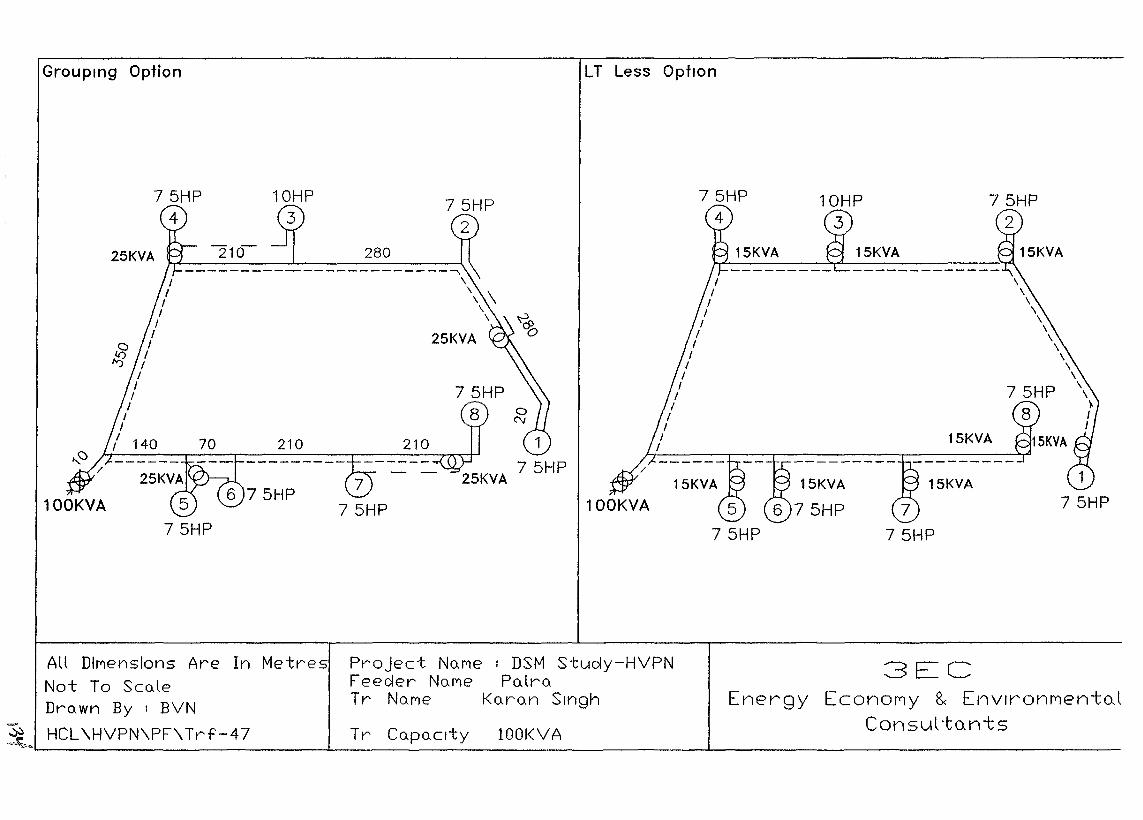
GroupIng Option LT Less OptIon
1
75HP15KVA
15KVA
100KVA
1
75HP25KVA
25KVA
210
280
210
210-
-----------------------,\
\\\
\
3ECEnergy EconoMy 8< EnvlronMentoJ
Consul tQntsTr Co.Po.clty lOOK VA
Project No.Me I DSM Stuoly-HVPNFeeoler No.Me Po.lro.Tr No.Me Ko.ro.n Singh
All DIMensions Are In MetresNot To Sco.leDro.wn By I BVN
~ HCL\HVPN\PF\Trf-47~'----------------'-------------------"---------------------
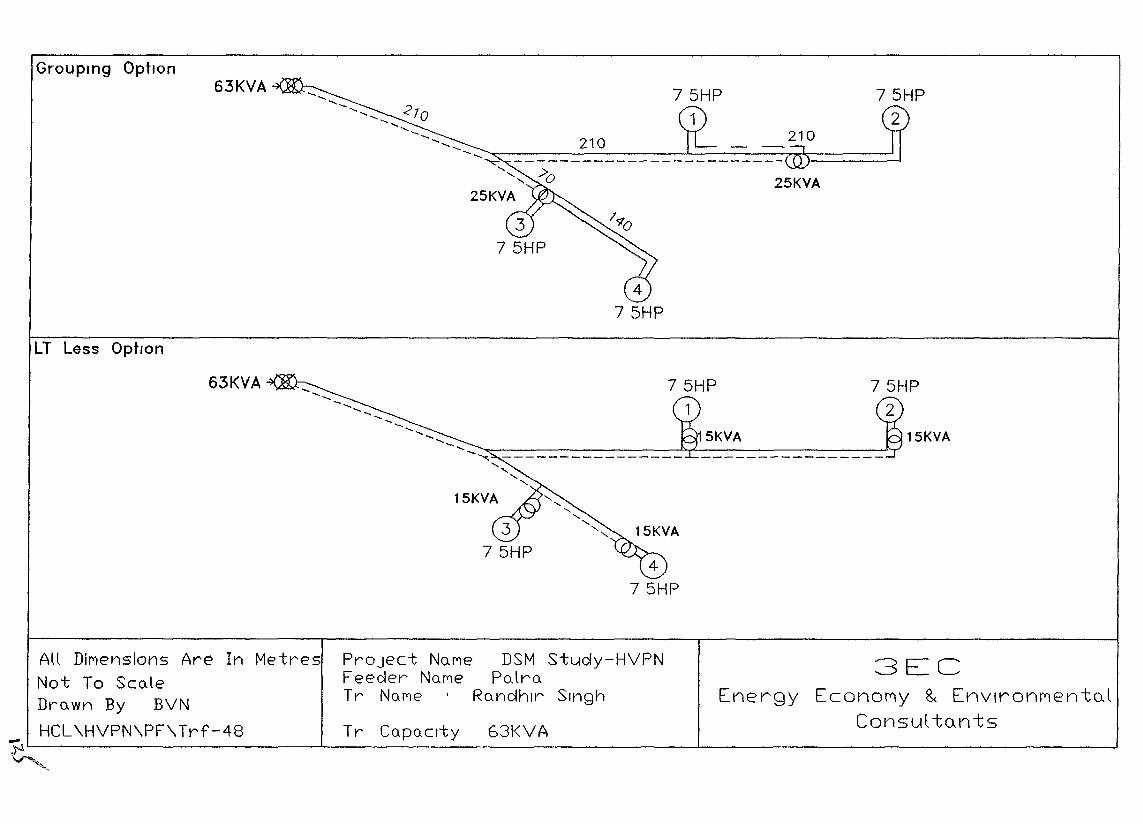
210
25KVA
75HP
1210
--- ....---- .... -.. ....................-- .....--------~ ------------------------.....
.....,
63KVAGroupmg Option
LT Less OptIOn
63KVA 75HP
1
15KVA 15KVA
PrOject NOMe DSM Stucfy-HVPNFeecler NOMe PolroTr NOMe Roncfhlr SIngh
Tr COpoClty 63KVA
3ECEnergy Econor'lY & Envlronr"lento.l
Consul -to.nts
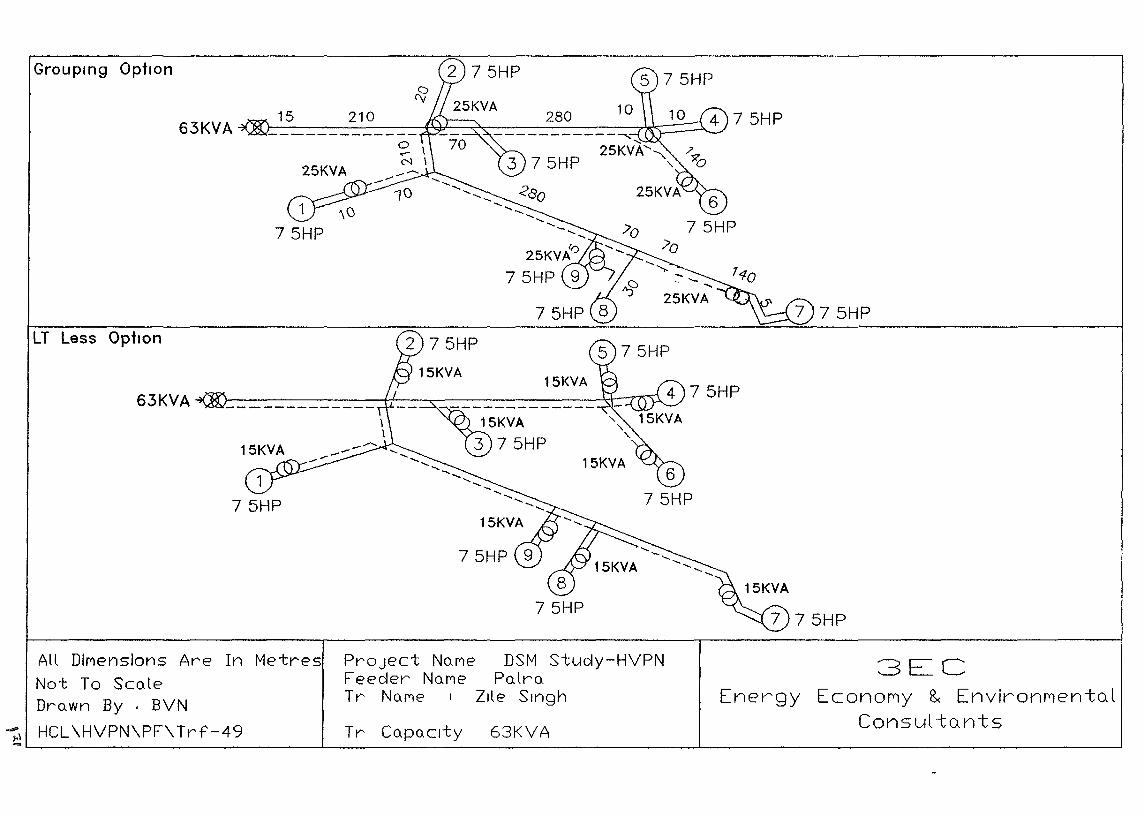
75HP
280 75HP
15KVA
------------..;:"25KVA..... " /"5(';
" 0
15 210
1
7 5HP
63KVA
63KVA
Grouping Option
LT Less Option
1
75HP
All DiMensions Are In MetresNot To ScoleDro.wn By t BVN
~ HCL \HVPN\PF\Trf-49
PrOject No.MeFeecler No.MeTr NOMe
Tr CopQcrty
DSM Stucly-HVPNPolro.
Zile Singh
63KVA
3ECEnergy EconoMy & EnvironMental
Consul tants
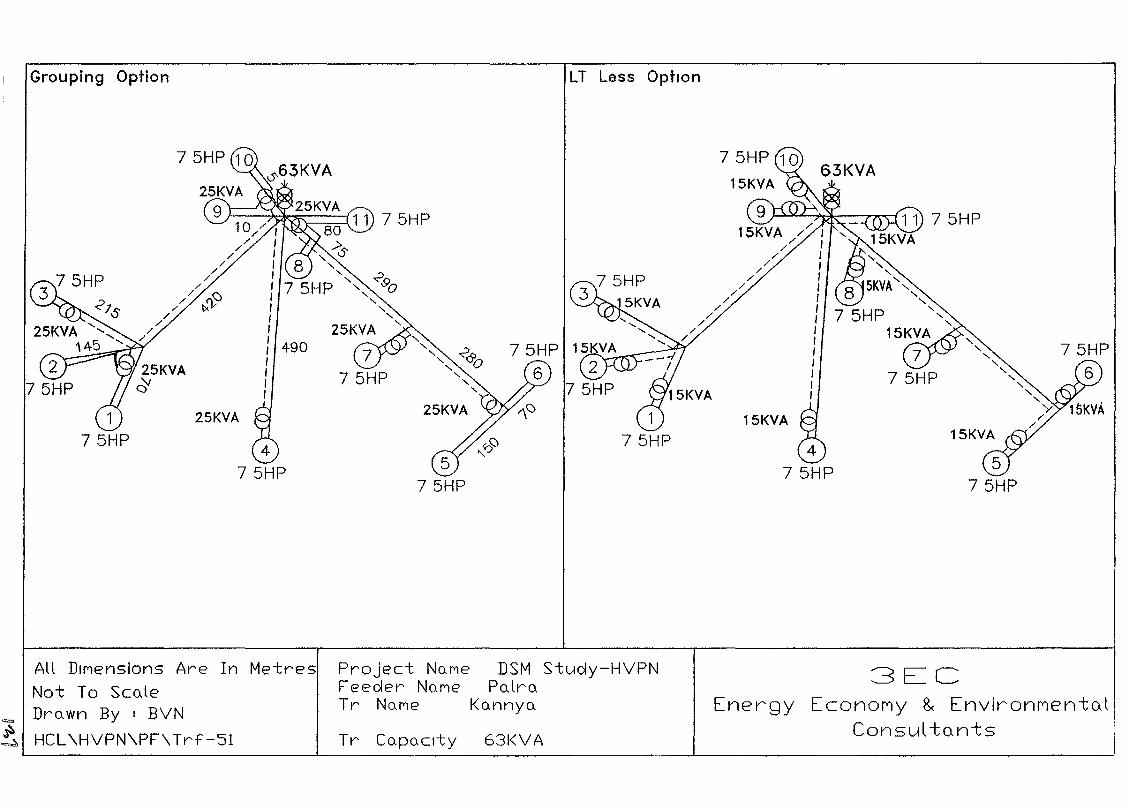
Grouping Option
175HP
25KVA
75HP
LT Less Option
15KVA
75HP
Project No.MeFeeder No.MeTr No.Me
All DIMensions Are In Metres
Not To Sco.le-. Dro.wn By I BVN
"t HCL\HVPN\PF\Trf-51 Tr Co.Po.clty
DSM Study-HVPNPo.lro.
Ko.nnyo.
63KVA
3ECEnergy EconoMy 8< EnvironMentol
Consul tonts
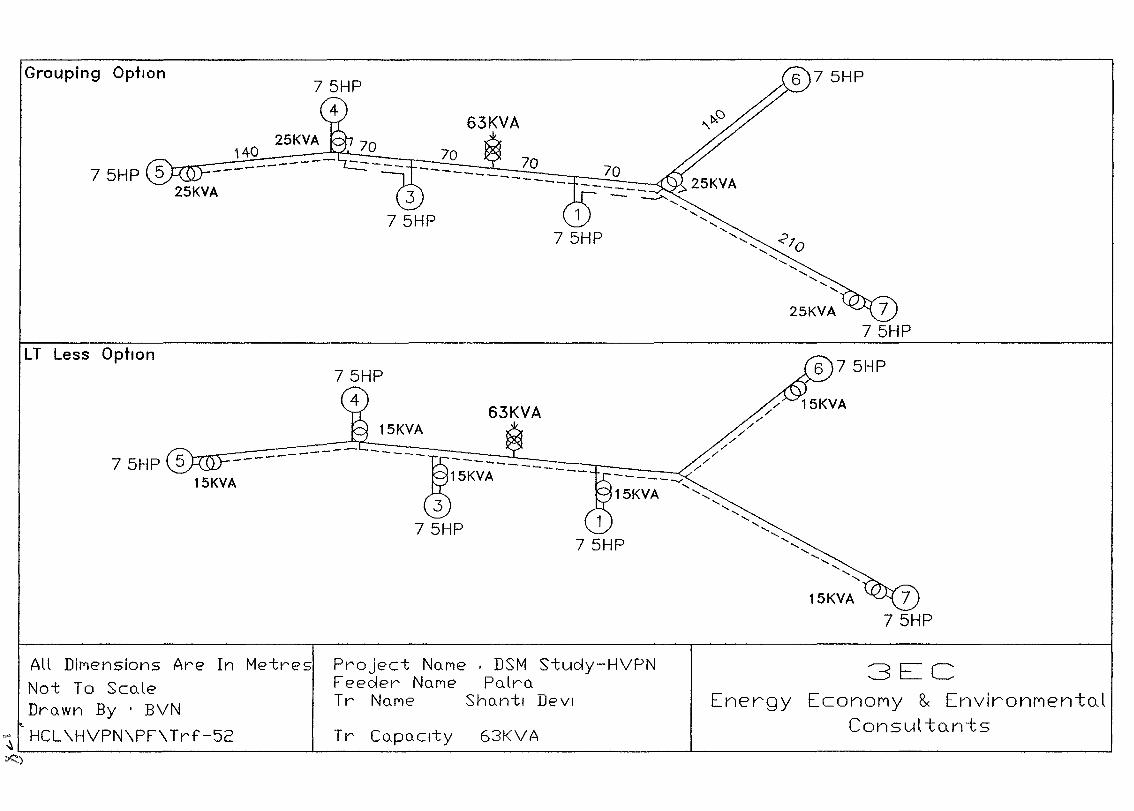
75HP
70
1
75HP
63KVA
70
63KVA
-------70
15KVA
-------
Grouping OptIOn
14025KVA
25KVA
LT Less OptIOn
All DIMensions Are In Metres
Not To Sco.teDro.wn By I BVN
~ HCL\HVPN\PF\Trf-52~
Project No.Me I DSM Stucly-HVPNFeecler No.Me Po.lro.Tr NOMe Sho.ntl Devi
Tr COPo.clty 63KVA
3ECEnergy EconoMy 8< EnvironMen-tQl
Consul-to.n-ts
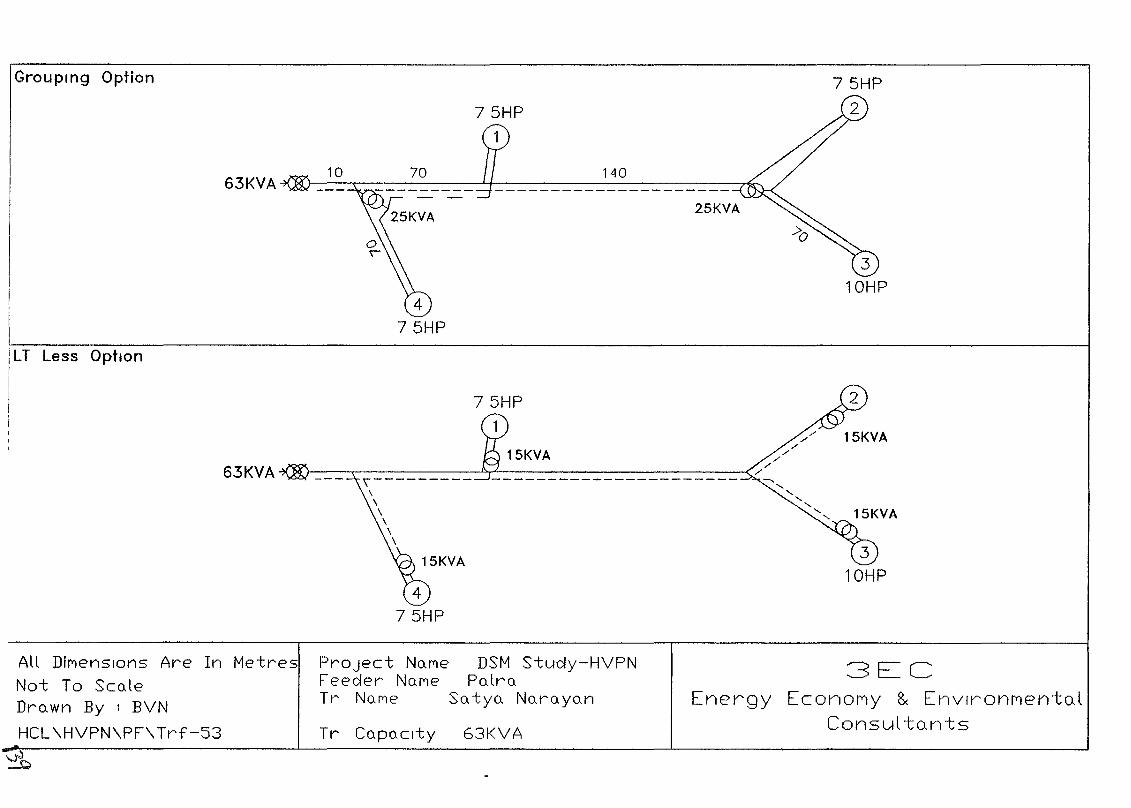
Grouping Option
63KVA
75HP
1
140
LT Less Option
75HP1
\---------\\\\\\
,/,/
,/,/
,/,/
}--~-------"'r"'----------------<'/....... ..........
..... ..........
.....
63KVA
Project No.ME?Feecler No.MeTr No.Me
All DiMensIons Are In Metres
Not To ScoJeDro.wn By I BVN
HCL\HVPN\PF\Trf-53 Tr Cupo.C1ty
DSM Stucly-HVPNPulro.
Sutyo. Nuruyo.n
63KVA
3ECEnergy EconorlY 8< Envlronl"'lentQl
Consul tQnts
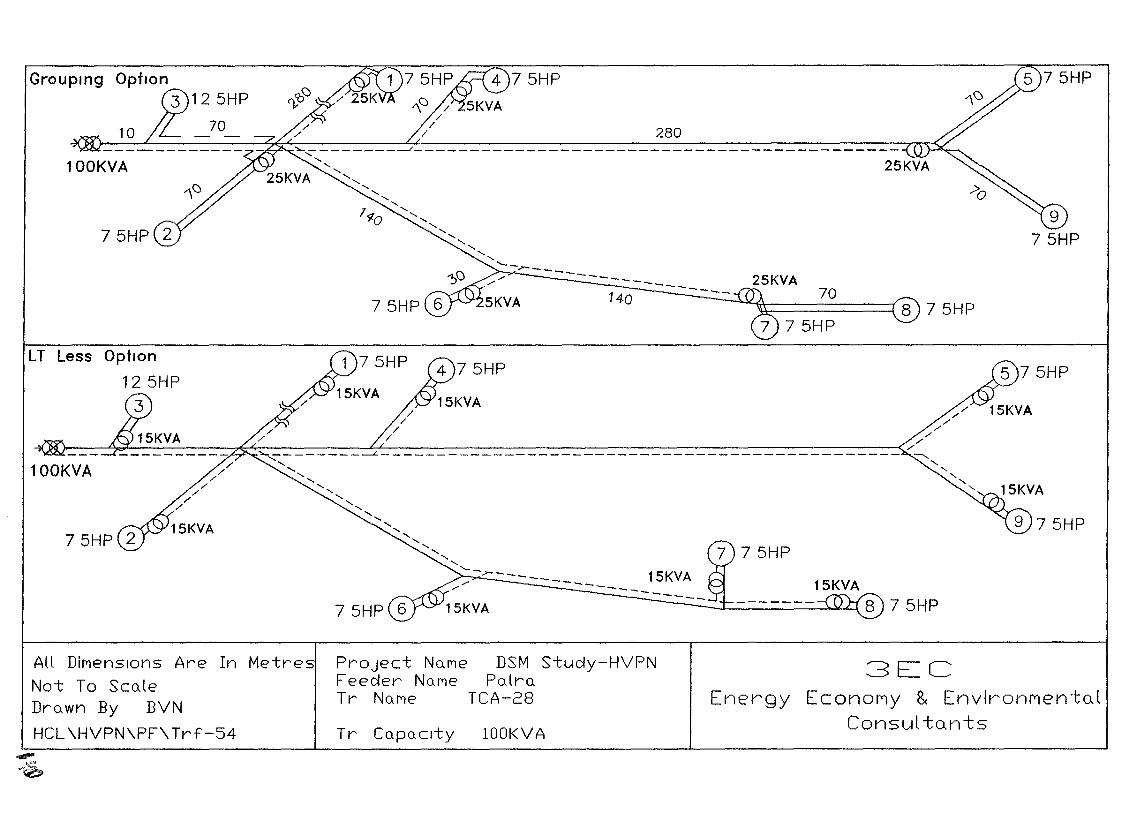
75HP
25KVA70
---~~=========18 7 5HP
280
15KVA-------~._-
15KVA
75HP
1 75HP
~,-------~-------------------------------------------, ," , , , ,
" " , ,.....
" ..... ,'--.,,--/.7'----.:,-=.-.::-_-- --
/'/'
/'/'
/' /'/'
~,_--_----L--------------------------------------------__ /~, ,.... ,, ,..... ,
" '..... , , ,..... .....
..... ," .....,
.....'--..::---
125HP
70
100KVA
100KVA
Grouping
LT Less Option
125HP
3
All DiMensions Are In Metres
Not To ScaleDrawn By BVN
HCL\HVPN\PF\Trf-54
PrOject NO-MeFeecler NUMeTr NUMe
Tr Cupucl"ty
DSM S"tucly-HVPNPulru
TCA-28
lOOK VA
3ECEnergy EconOMy 8< EnvironMental
Consul tonts
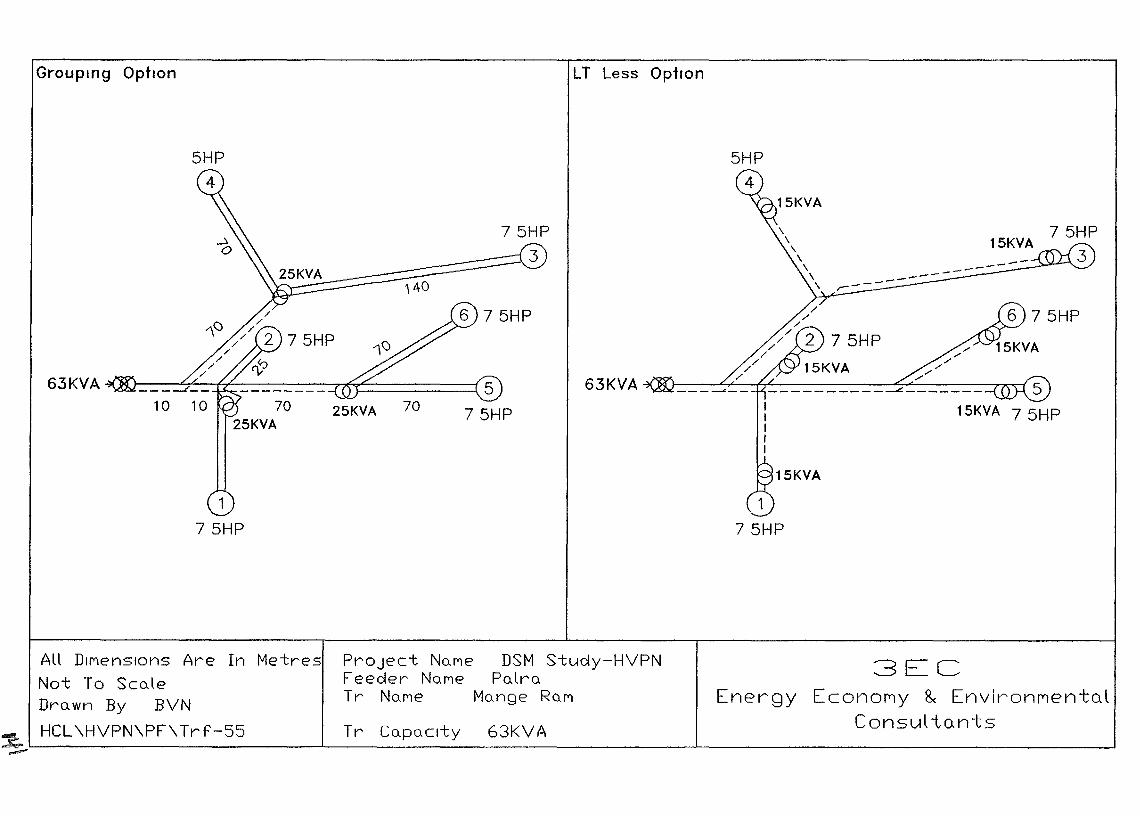
Groupmg OptIOn LT Less Option
75HP
63KVA70
25KVA
1
75HP
25KVA 70
63KVA
15KVA
1
75HP
15KVA
3ECEnergy EconoMy & EnvironMento.l
Consul to.nts63KVA
DSM Stucly-HVPNPalra
Mange RQM
Tr Co.Po.clty
ProJec-t NaMeFeeder NaMeTr NaMe
All DIl.....enslons Are In Me-tres
Not To SccdeDrawn By BVN
HCL\HVPN\PF\Trf-55:e;.._'-------------------'-------------------.1----------------------.1
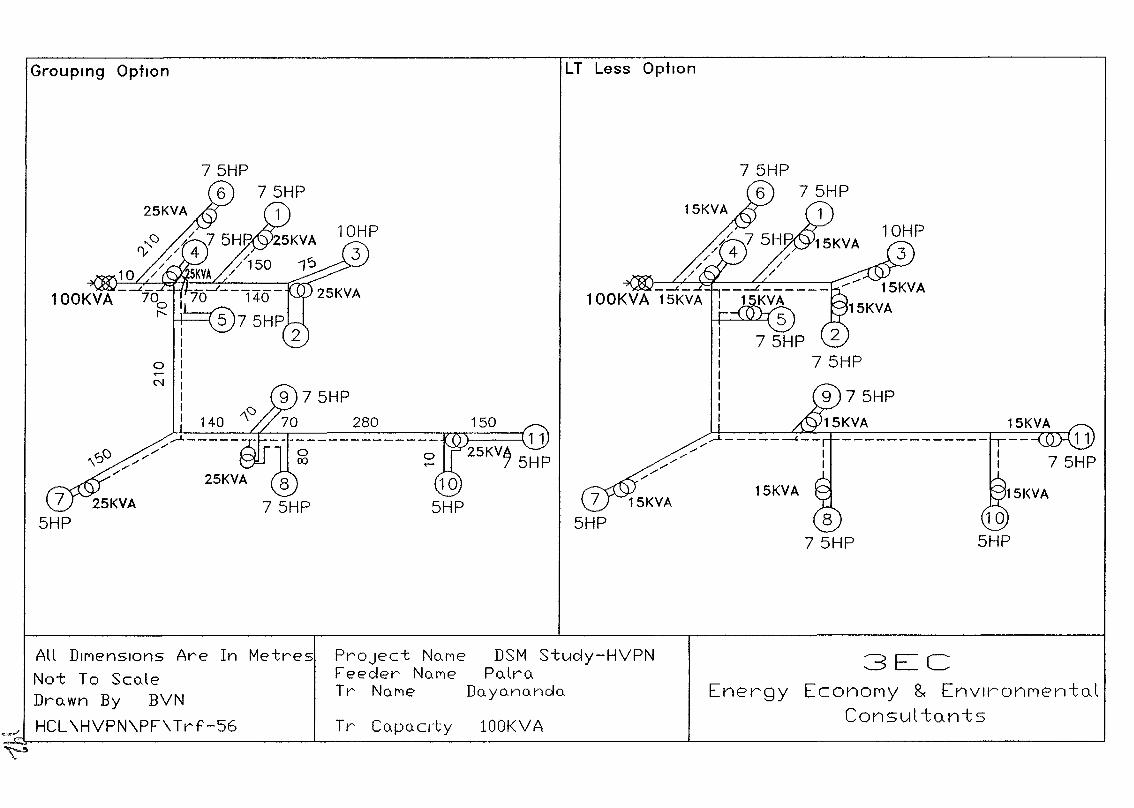
Grouping Option LT Less OptIOn
25KVA
15KVA
3ECEnergy EconoMy & EnvlronMento.l
Consul tGntslOOK VA
DSM Study-HVPNPo.lro.
Do.yo.no.ndo.
Tr Co.po.cli;y
PrOject No.MeFeeder No.MeTr No.Me
All DIr''lenslons Are In Metres
Not To Sco.leDro. wn By BVN
...- HCL \HVPN\PF\Trf-56~~ "-- ---l..- -l
~
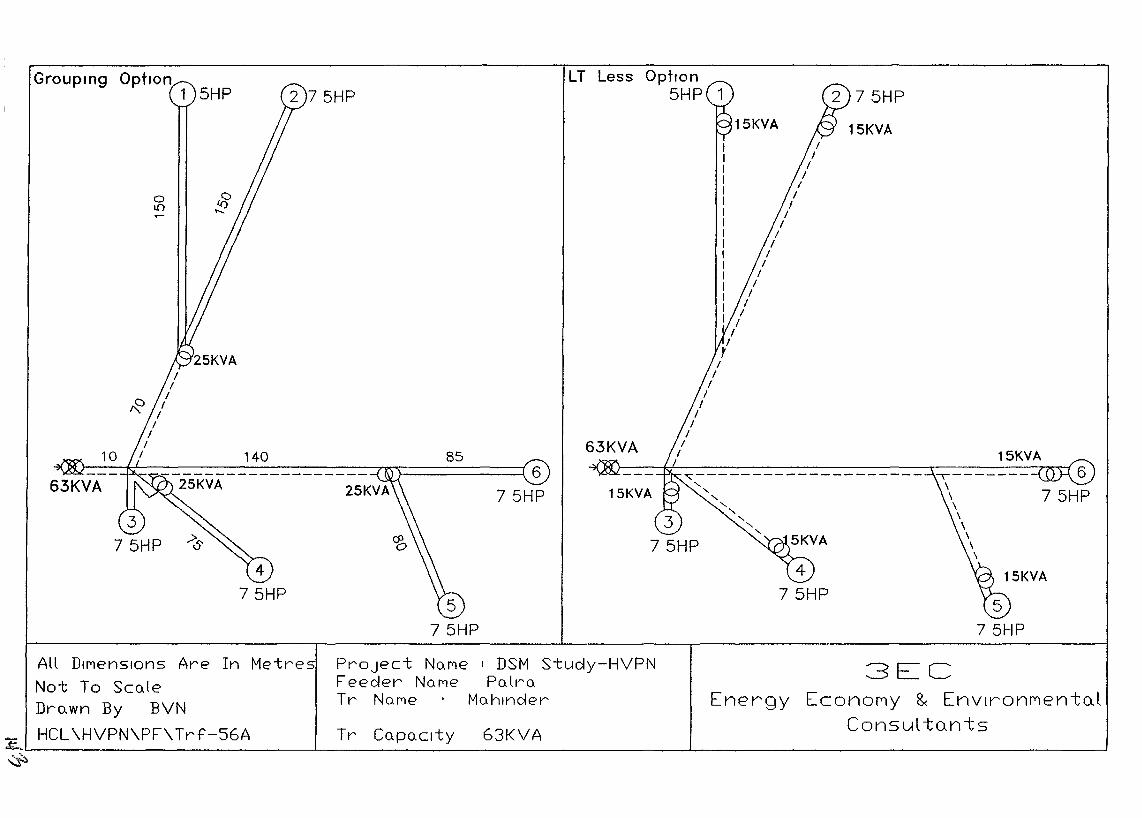
:-\-------\\\\\\\\
15KVA15KVA
,--------------------"
"-"-
"-"-" "-
"-
LT Less OptIOn5HP
85140
o10
~~=:$~;;:===-==-:=-=-======-===:nr,}::=======:::::(6
75HP
Groupmg OptIOn1 5HP
3ECEnergy EconoMy 8< EnvlronMentQl
Consul to.nts
Project No.Me I DSM Si:udy-HVPNFeeder No.Me Po.lro.Tr No.Me Mo.hlnder
All DIMensIons Are In Metres
Not To Sco.leDro.wn By BVN
HCL\HVPN\PF\Trf-56A Tr Co.Po.cl-ty 63KVA~1.- _L. __I_ --,
~
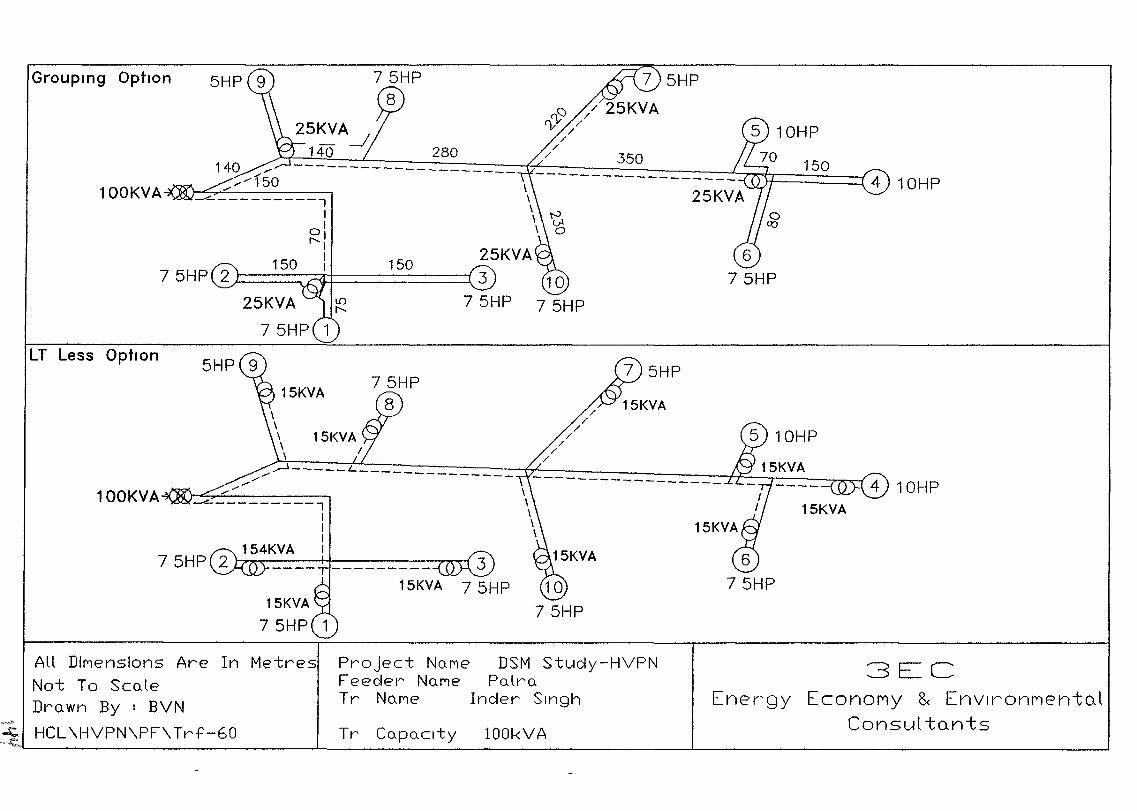
----------
----,---------15KVA
15KVA
75HP
5HP
:&> /25KYArv //
/
;:r==:=:====-=~=2=8=0=-=-=-=~f/~/-=-==:=3~5~0~=-=-===-=~~~~~~=t140 / ---_______ 150.... //150 ---------- 4 10HP
-<----------1I
01
,....,1
: 150 25KYAJ======v::=:¢=========~3
75HP
100KYA
100KYA
Grouping Option
LT Less Option
3ECEnergy EconoMy 8< EnvlronMento.l
Consul tonts
DSM Stucly-HVPNPalra
Incler Singh
Project No.MeFeecler NaMeTr No.Me
All DIMensions Are In Metres
Not To Sco.leDro. wn By I BVN
-""
..l; HCL \HVPN\PF\Trf-60 Tr Co.Po.clty lOOkVA~,'---- L-.- ___L __l
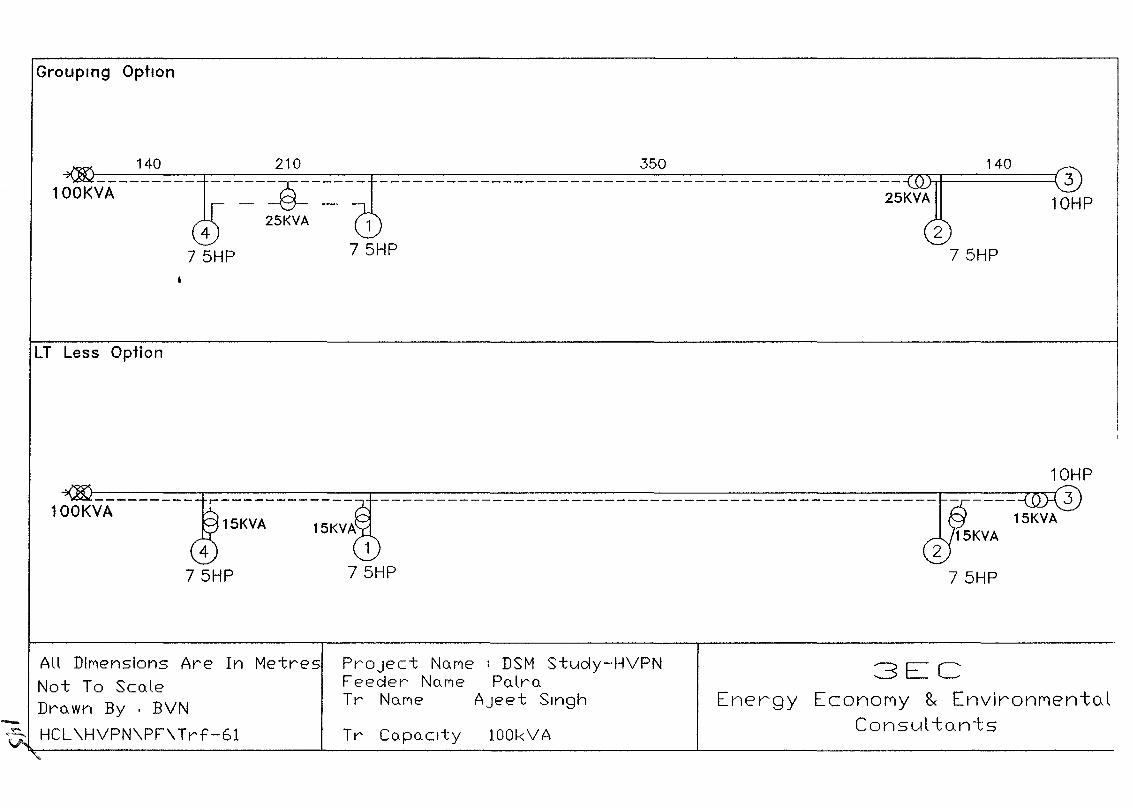
Grouping OptIon
140 21 0 350 140
l~VA-------~-~-~-~-~--------------------------------------------~~~
7 5HP 7 5HP 7 5HP
LT Less Option
o10HP
All DiMensions Are In Metres
Not To ScoJeDro. wn By I BVN-~ HCL\HVPN\PF\Trf-61
"
PrOject NaMe I DSM Study-HVPNFeeder NOME' PolroTr NOME' AJE'et Singh
Tr CapaCity 100kVA
3ECEnergy EconoMy & EnvironMentO-l
Consul to.nts
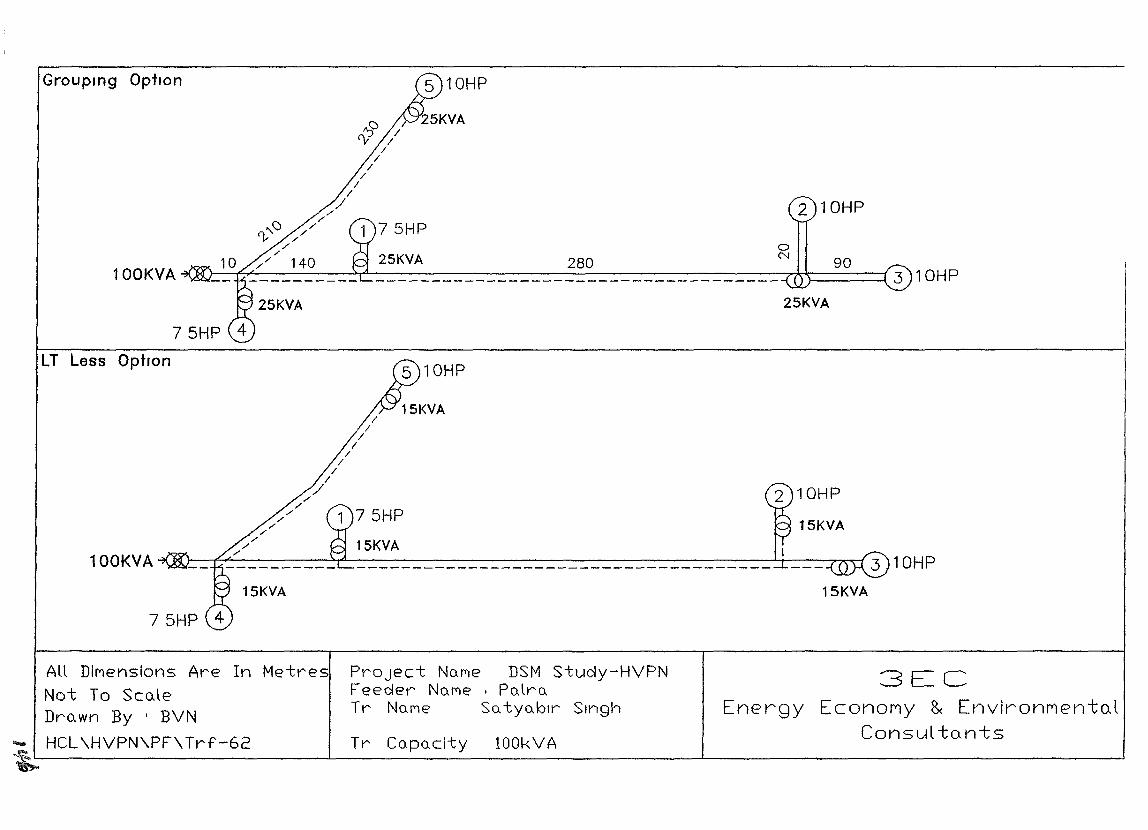
90
10HP
25KVA
280
:":><:) /CV /
//
//
//
'/./
./
1f...,C> ./././ 7 5HP./
./// 140 25KVA
~~=:=-=:==~~-=-=- -=-=-=-=-=-=_:-=_=_=_-=-=_::_::_=_:::_=-=-=--=-=_::_=-=-=-=-=_:-=_=-=-=--=-=ri~====:=( 3 1OH P100KVA
Grouping Option
LT Less OptIOn
100KVA
15KVA
75HP
15KVA
10HP
15KVA
15KVA
10HP
3ECEnergy EconoMy & Environrlen-to.l
Consul-tcu'Its
PrOject No.Me DSM Study-HVPNFeeder No.Me I Po.lro.Tr No.Me So. tyo.blr Singh
All DIMensions Are In Metres
Not To Sco.leDro.wn By I BVN
...... HCL \HVPN\PF\Trf-62 Tr Co.po.clty lOOkVA~L...-- -L.- ---'- -.J
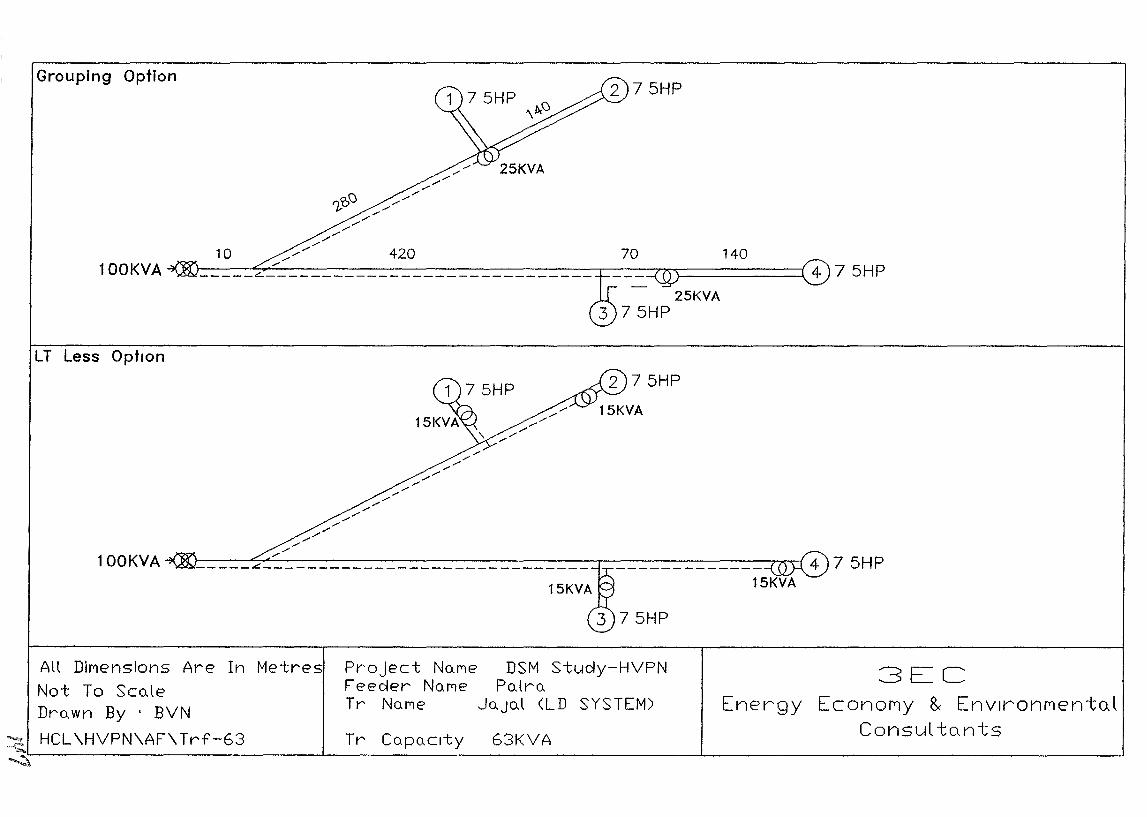
2 75HP
14070
/'/'
/'//'
'1-'?§:> /'/'/,/,/
/',/
/'/'
/'/'
10 /'//' 420/'
c_=_-=_=-_=:,:_c:..Z_:=-:_=-=_::_=-=_=-=_=-=_=_=_-=_=-_=-__=_=_=_=-=_=-=_=-=_=-=_=-=_=-=_=-=_=_=_-=_=-_=_-=-+=-==-==i:IT'}=========:={ 4 7 5HP100KVA
Grouping Option
25KVA3 75HP
LT Less Option
100KVA
3ECEnergy EconoMy 8< EnvlronMento.l
Consul to.nts
DSM Stucly-HVPNPnlrn
JQJnl (LD SYSTEM)
63KVATr CnpuCity
Project NnMeFeecler NnMeTr NOMe
All DiMensions Are In Metres
Not To ScoJeDrnwn By I BVN
~ HCL \HVPN\AF\ Trf-63~'--- --'- J..-- --J
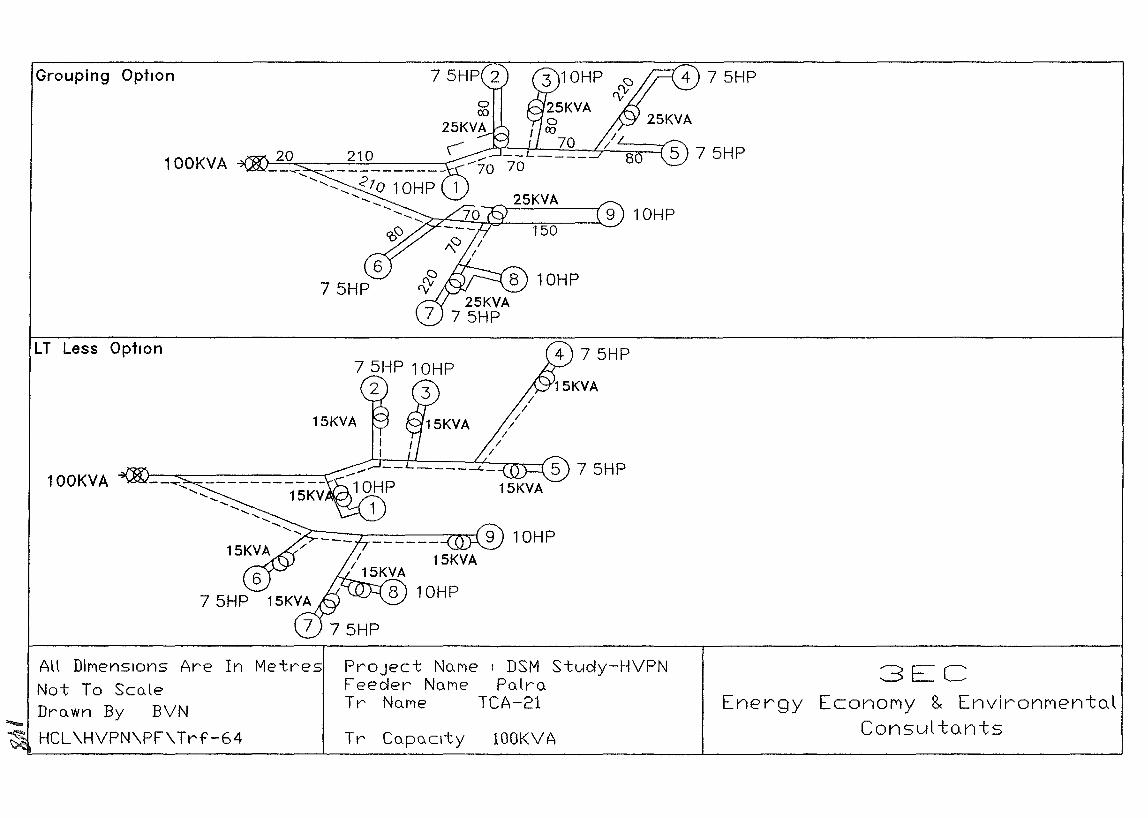
Grouping Option
100KVA
LT Less Option
100KVA
15KVA
25KVAcz::-'-=:.n.;;L----;;--;::-;:;----.l....9~ 10 HP
150
10HP
75HP
10HP
75HP
All DIMenSions Are In Metres
Not To Sco.leDro.wn By BVN- HCL\HVPN\PF\Trf-64
PrOject No.Me I DSM Study-HVPNFeeder NOMe Po.lro.Tr No.Me TCA-21
Tr Co.po.Clty lOOKVA
3ECEnergy EconoMy 8< EnvironMentQl
Consul tQnts
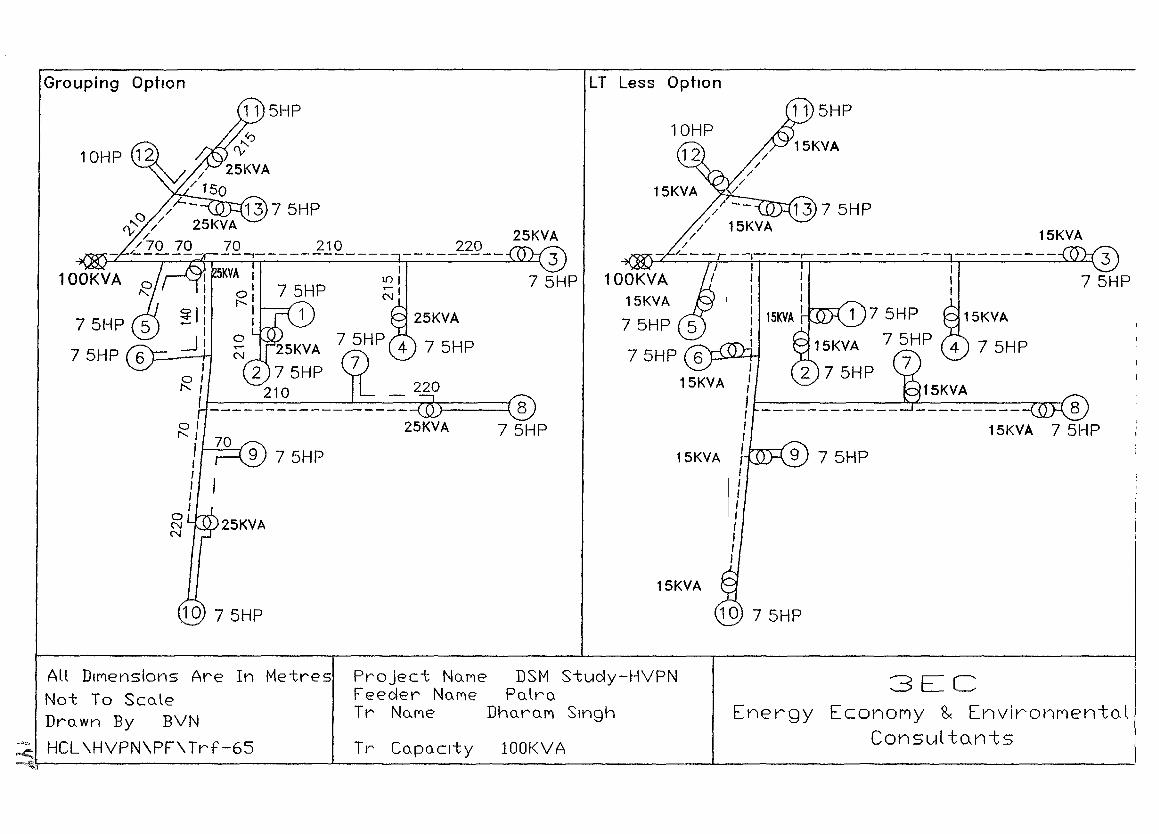
Grouping OptIOn LT Less OptIOn
15KVA
15KVA
15KVA
II,,,,
II,
I II J
IIIIII
15KVA
15KVA
//
//
15KVA //1~75HP
/ 15KVA/
/- /---r --,----,------------220
25KVA
25KVA
25KVA 7 5HP 4 7 5HP
2 75HP 7210
25KVA
3ECEnergy EconoMy & EnvironMento.l
Consul to'n-tslOOKVA
DSM Study-HVPNPo.lra
Dharo.M Singh
Tr Capo.C1ty
Project NCH"leFeeder NaMeTr No.Me
All DIMensions Are In MetresNot To Sco.leDrawn By BVN
~ HCL\HVPN\PF\Trf-65~!;-- .L...- .L...- --'
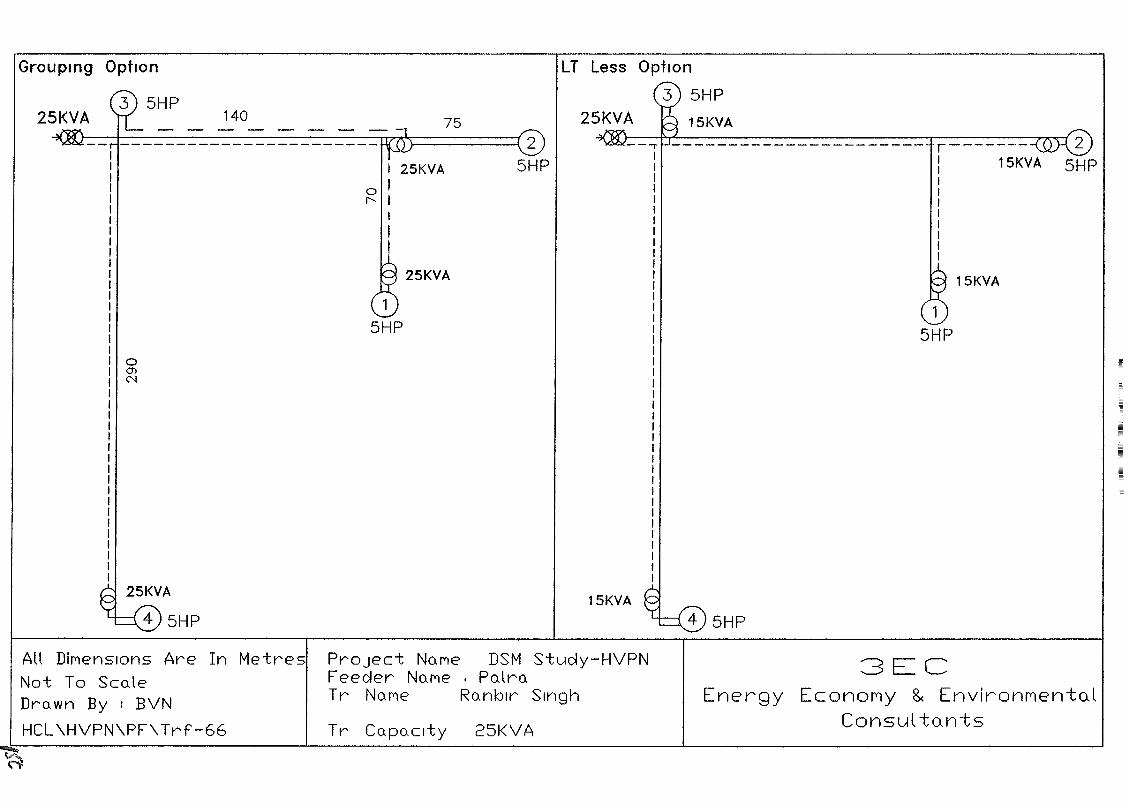
15KVA
r-------l 15KVAIIIIIIII
LT Less Option
3 5HP
15KVA75
25KVA
25KVA
140
IIIIIIIIIIIIIIIIIIII 0I enI C'JIIIIIIIIIIIIIIIIII
t==-;:f=--=-=-=-=-=-=--=--=--=-=-=-=-=-=--=--=--=-=-=-=-=-=-=--=--=1-wrll=========t 25HP
Groupmg Option
5HP15KVA
All DiMensions Are In MetresNot To ScoleDrown By I BVN
HCL\HVPN\PF\Trf-66
PrOject NOMe DSM Study-HVPNFeeder NOMe . PolroTr NaMe Ranblr Singh
Tr Capo.clty 25KVA
3ECEnergy Econot""ly 8< Environt""lentoJ
Consul to.n-ts
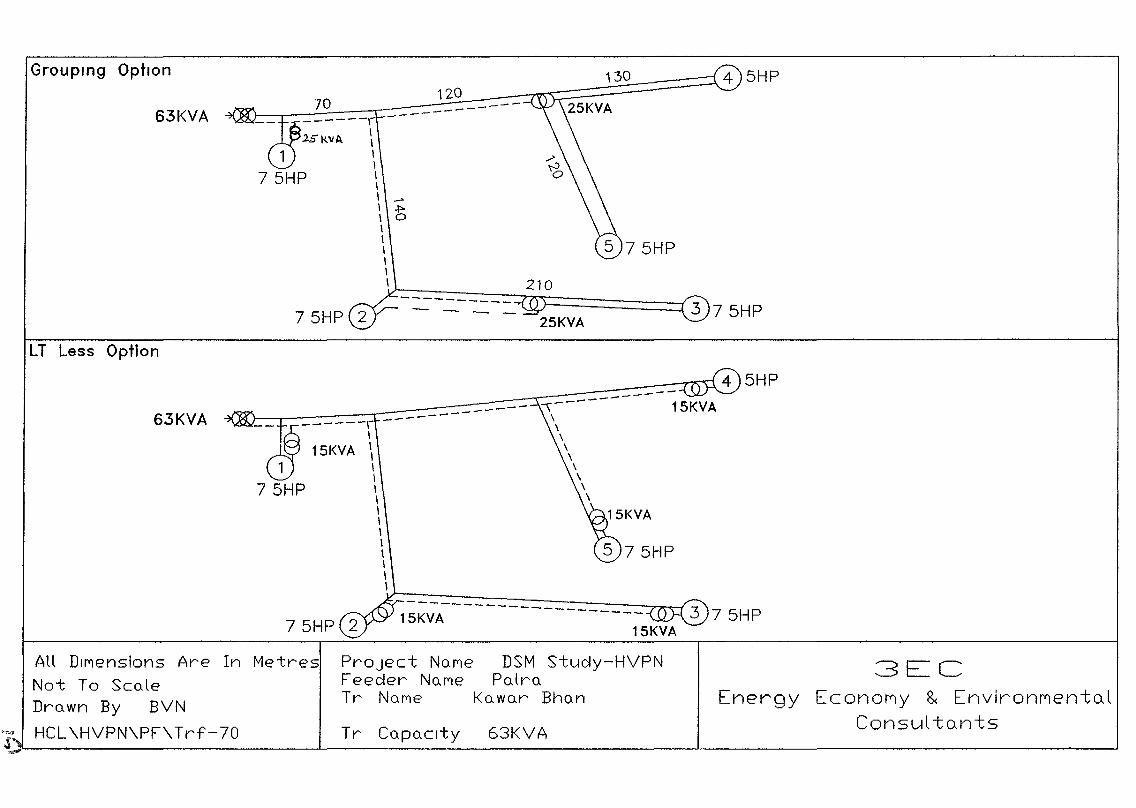
210
~-=:-=::=-~-_-::-=_==-~--=-~F===========i3 7 5HP25KVA
\-~_1'2_ _::J~~~~~~=-=<3f5~~~1~3=0::=:::=:::=:=='- 4 5H P12070 _----------------\
2.51<:vA \\\II\ ......
\t\\\\\\
63KVA
Grouping Option
LT Less Option
5HP-------
.....-_------------
_------ :\---- 15KVA---- \\\\\\\\\
15KVA
------\
-~ 15KVA \1 \
175HP \
\\\\\\\\
63KVA
3ECEnergy EconoMy 8< EnvironMentoJ
Consul to.nts
DSM Study-HVPNPolro
Kowor Bho.n
PrOject NOMeFeeder No.MeTr No.Me
Atl DIMensions Are In Metres
Not To ScoleDrown By BVN
""<# HCL \HVPN\PF\Trf-70 Tr CopoCity 63KVA01- .1....- .1..-.... ---1
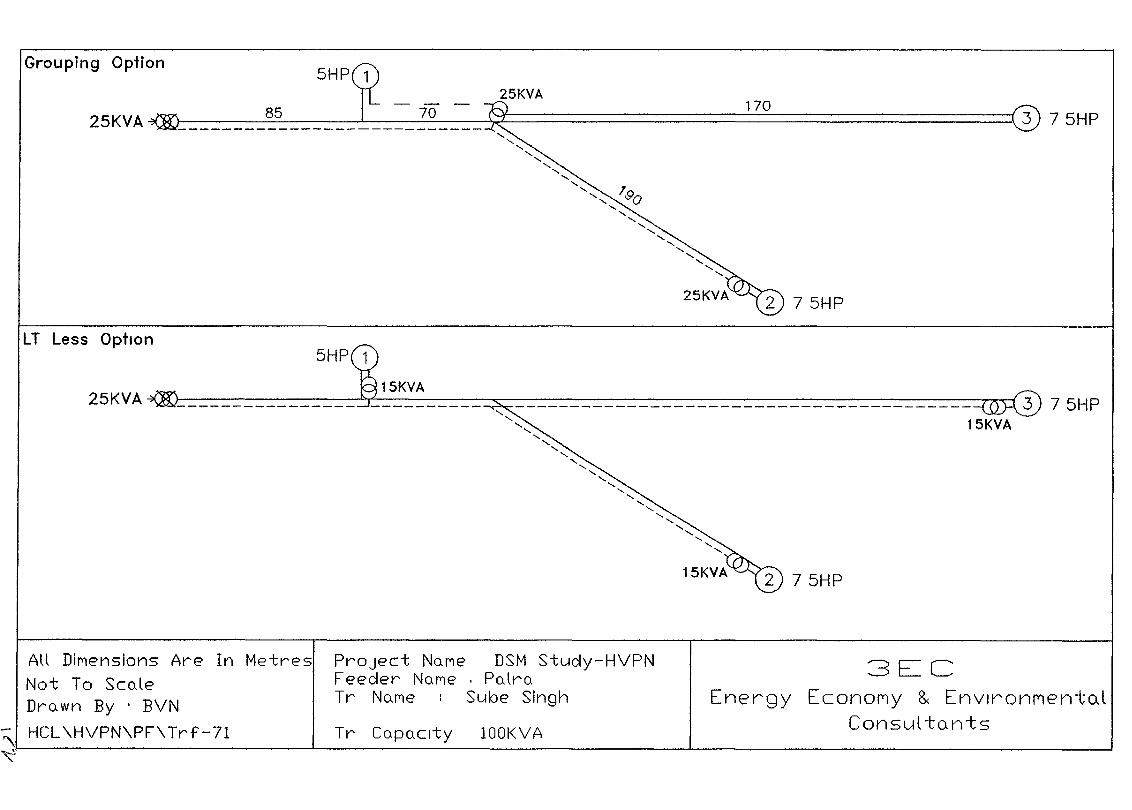
Grouping Option
25KVA25KVA
170~__~8~5 .l-_-!..7~0__~=========================================::(3 7 5HP
LT Less Option
25KVA15KVA
15KVA
All DIMensions Are In Metres
Not To ScO-leDrO-wn By , BVN
~ HCL\HVPN\PF\Trf-7l~
Project No-Me DSM Stucly-HVPNFeecler No-Me ' PO-lroTr No-Me Sube Singh
Tr Co-po-city lOOK VA
3ECEnergy EconoMy & EnvlronMen-to.l
Consul-to.n-ts
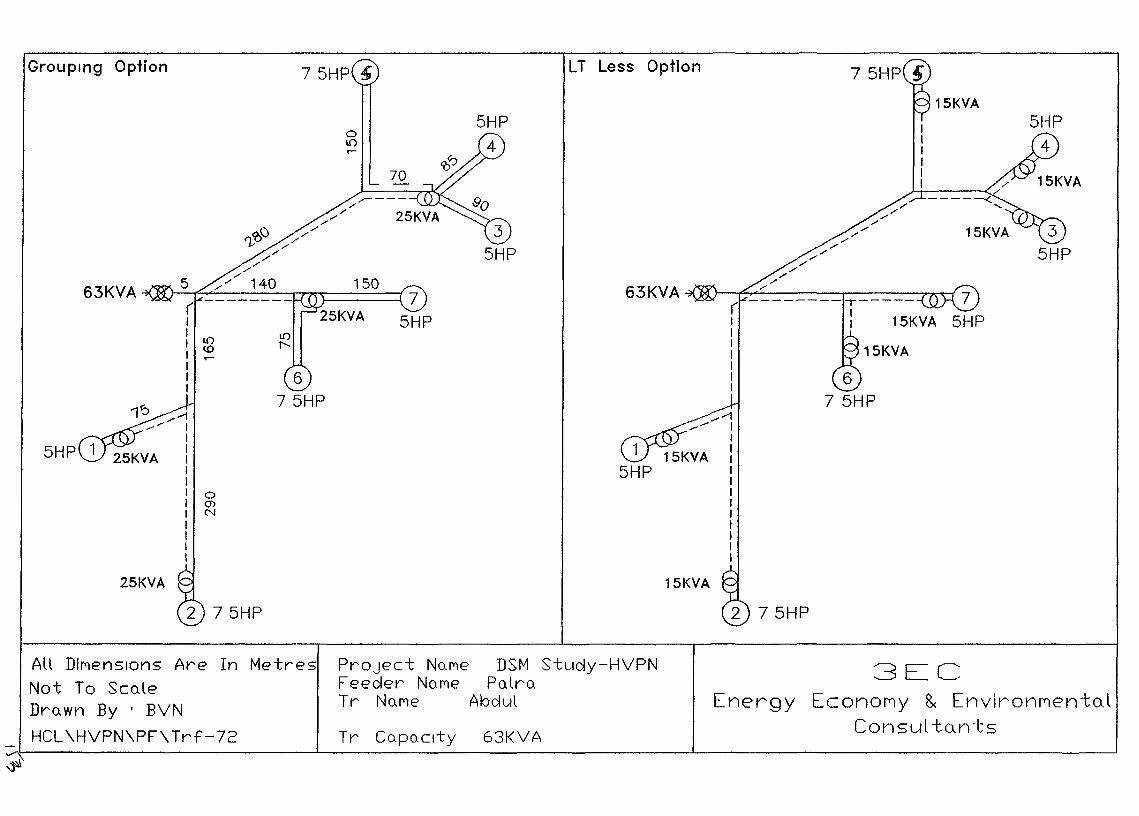
15KVA
,/..J--t----<
--------T-----( II I 15KVAI
: 15KVAIII
..... .-1__ -- IIIIIIIIIIIII
63KVA
LT Less Option
70
7 5HP ~
1-"]:(;=-===-=-=r-r(')'}::====::( 7I 5HPI L()Iq)I .....III
1~ ..... --1.......... I
IIIIII 0I (j)I NIIII
63KVA
Grouping Option
25KVA 15KVA
All DIl"'lenslons Are In Metres
Not To SCQleDrQwn By I BVN
HCL\HVPN\PF\Trf-72
PrOject NQMeFeeder No.MeTr No.Me
Tr CQPo.clty
DSM Study-HVPNPQlrQ
Abdul
63KVA
3ECEnergy EconoMy & EnvlronMen-to.l
Consul-to.n-ts
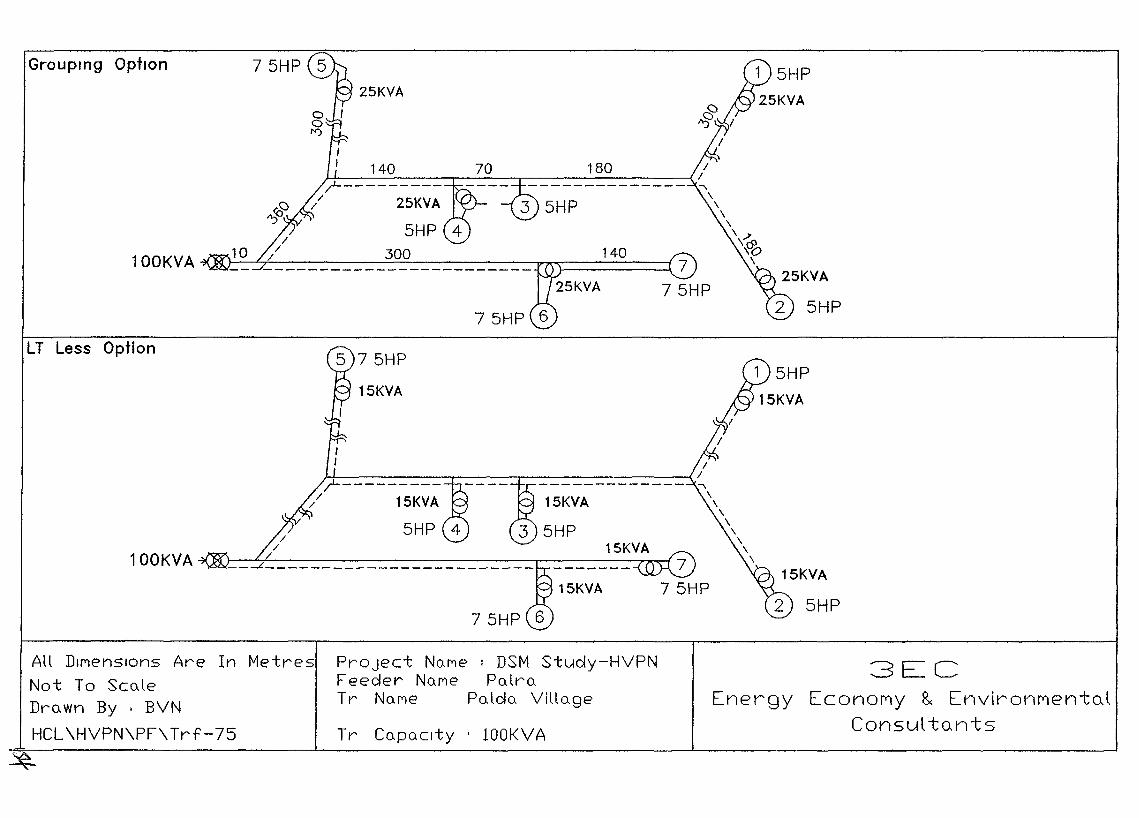
5HP
5HP
""'\\
\\
\~~\0
\
15KVA
180
15KVA
15KVA
140 70
25KVA
15KVA
75HP
-r---------/ 25KVA
140c=z_=_-=-__=-=_=_=_=_=_-=-=-=-=-=_-=-=-=-=_=_=_-=-=-=-TIT')::::=====::::( 7
75HP
100KVA
100KVA
Grouping Option
LT Less Option
All DIMensions Are In Metres
Not To ScoJeDro.wn By I BVN
HCL\HVPN\PF\Trf-75
PrOject No.Me 1 DSM Study-HVPNFeecler No.Me Po.lro.Tr No.Me Po.lolo. Villo.ge
Tr co.Po.clty I lOOKVA
3ECEnergy EconoMy 8< EnvironP"lento.l
Consul tants
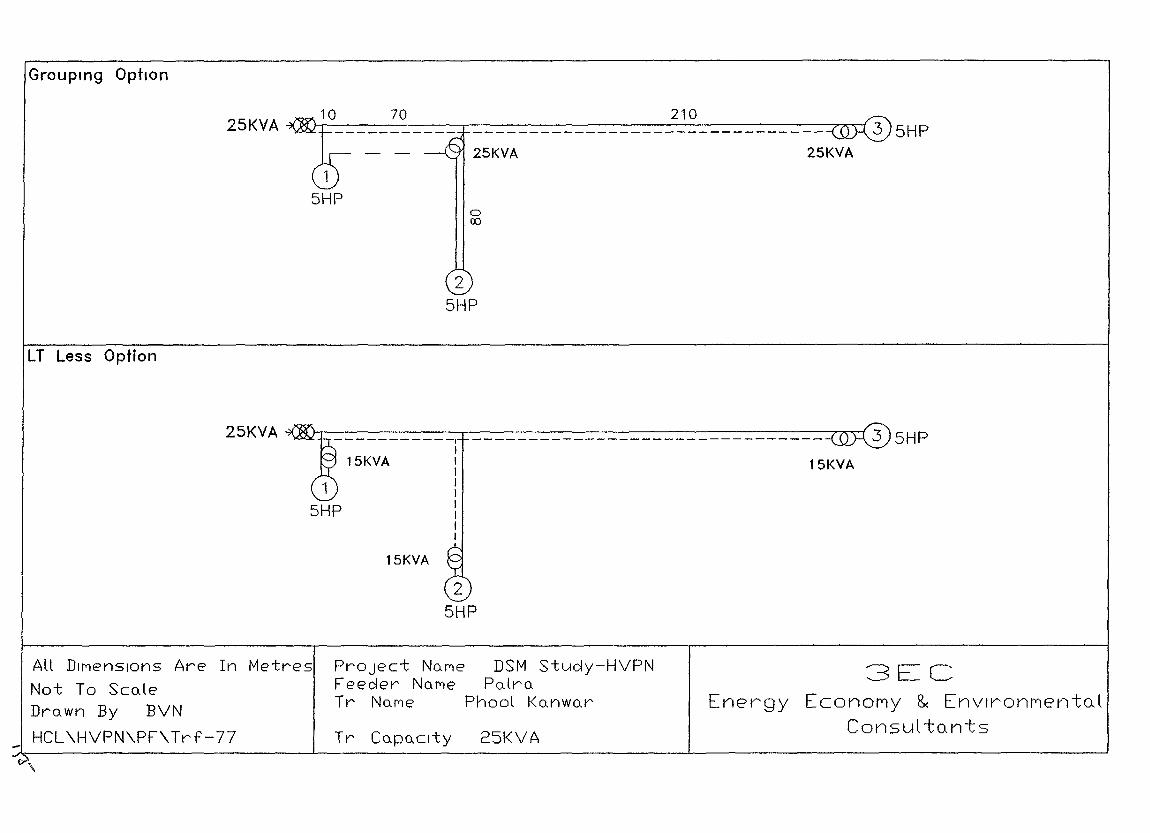
Grouping OptIOn
25KVA
25KVA
210
25KVA
LT Less Option
25KVA
aIX)
25HP
-----------1I
15KVA IIIIIIII
15KVA
25KVA
Project NUMeFeeder NUMeTr NUMe
All DIMensions Are In Metres
Not To ScoJeDruwn By BVN
HCL\HVPN\PF\Trf-77
15KVA
DSM Study-HVPNPo.lru
Phool Kunwo.r
3ECEnergy EconoMy 8< EnvlronMento.l
Consul tants
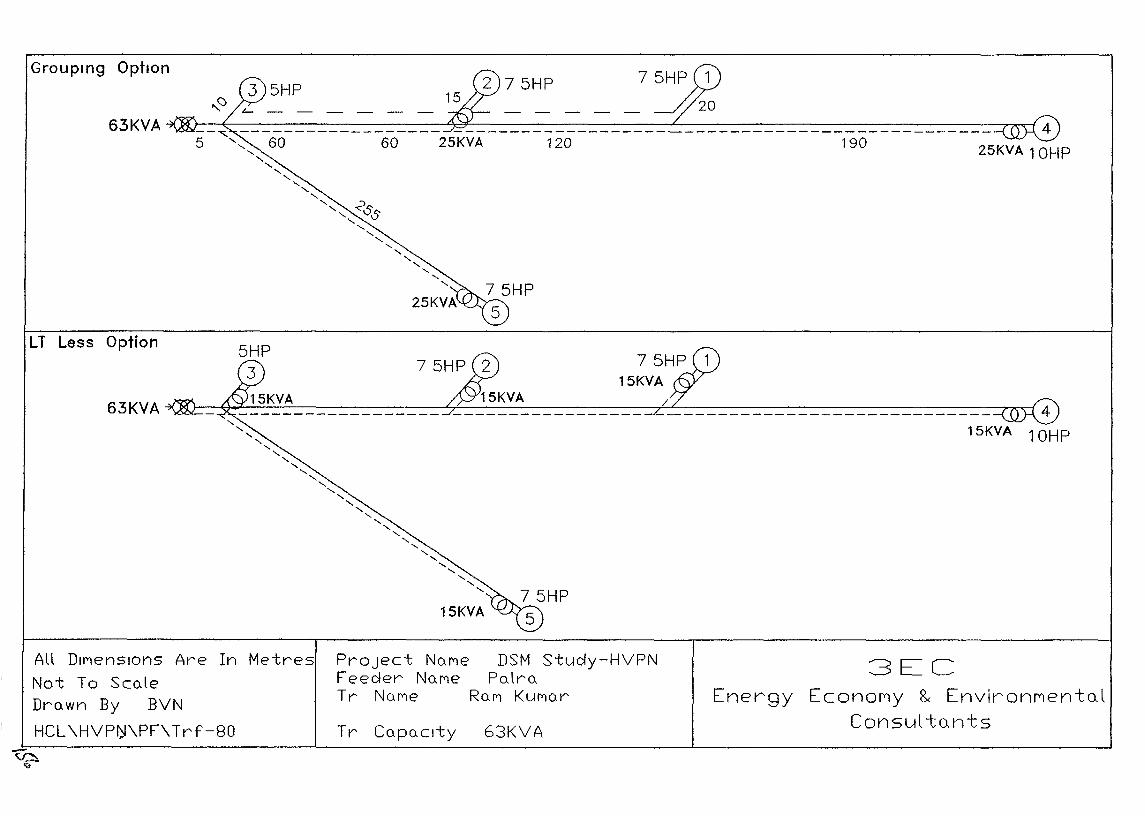
15KVA
75HP3 5HP
15KVA
--~ ------------------ ----------------------------------------------- 45 "'-, 60 60 25KVA 120 190 25KVA 10HP
, , , , , ,'" <SS,
'-,'- , ,
','
''-
63KVA
63KVA
Grouping Option
LT Less Option
DSM study-HVPNPo.lro.
Ro.M KUMo.r
All DIMensions Are In Metres
Not To Sco.leDro.wn By BVN
HCL\HVP~\PF\Trf-80
Project No.MeFeeder No.MeTr No.Me
Tr Co.po.C1ty 63KVA
3ECEnergy EconorlY 8< EnvironrrtentoJ
Consul tQtlts
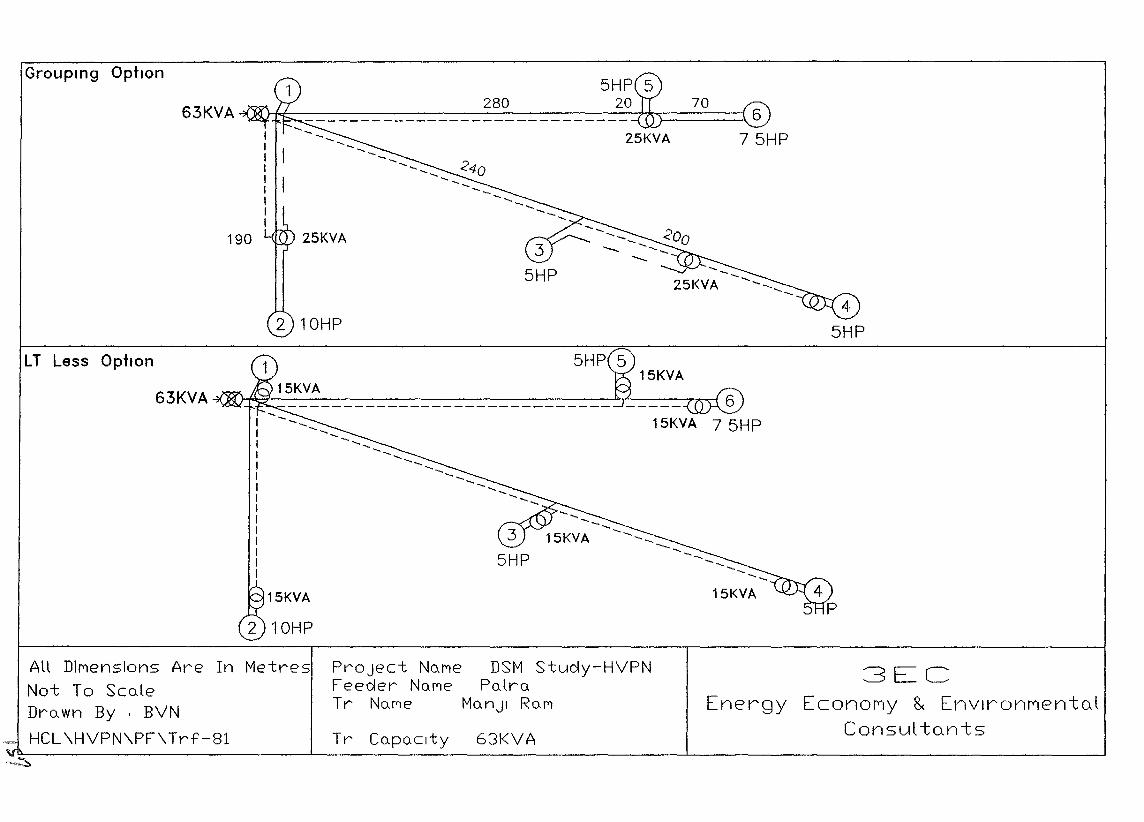
15KVA
15KVA
.........
25KVA
.........
-- .....
25KVA
10HP
15KVA
280 70~~-~_:-=-_=__=_:-=-_=__=_=__=_=_=__=_=_==_-=-=-=-=--=-=-=--=-~i>====::( 6
75HP
190
63KVA
63KVA
Grouping Option
LT Less Option
PrOject No.MeFeeder No.MeTr NC).f"'1e
DSM Study-HVPNPo.lro.
Mo.nJI Ro.M
All DIMensions Are In Metres
Not To Sco.leDro. wn By I BVN
HCL\HVPN\PF\Trf-81 Tr Co.Po.clty 63KVA
3ECEnergy EconoMy 8< EnvlronMen-toJ
Consul-tnnts
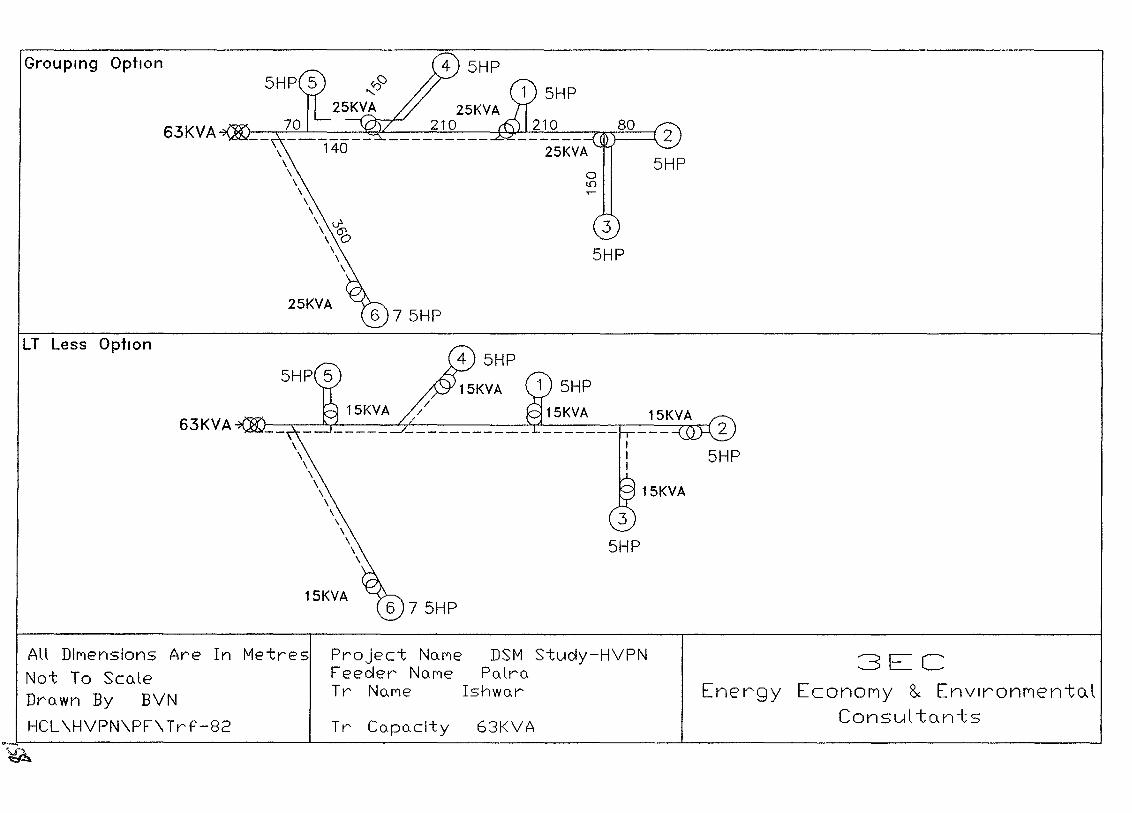
63KVA
15KVA
3
5HP
15KVA
\\
\\\
\\
\\
\\\\
25KVA
\\\\
\\
\
\~\ 0
\\
\
63KVA
Grouping Option
LT Less Option
3ECEnergy EconoMy & EnvlronMentcd
Consul to.n-ts63KVA
DSM Stucly-HVPNPo.lro.
Ishwo.r
Tr Co.po.clty
Project No.MeFeecler No.MeTr Nc.Me
AU DIMensions Are In Metres
Not To Scc.leDrc. wn By BVN
HCL\HVPN\PF\Trf-82_~ ---ll.-- --I.- ....J
~
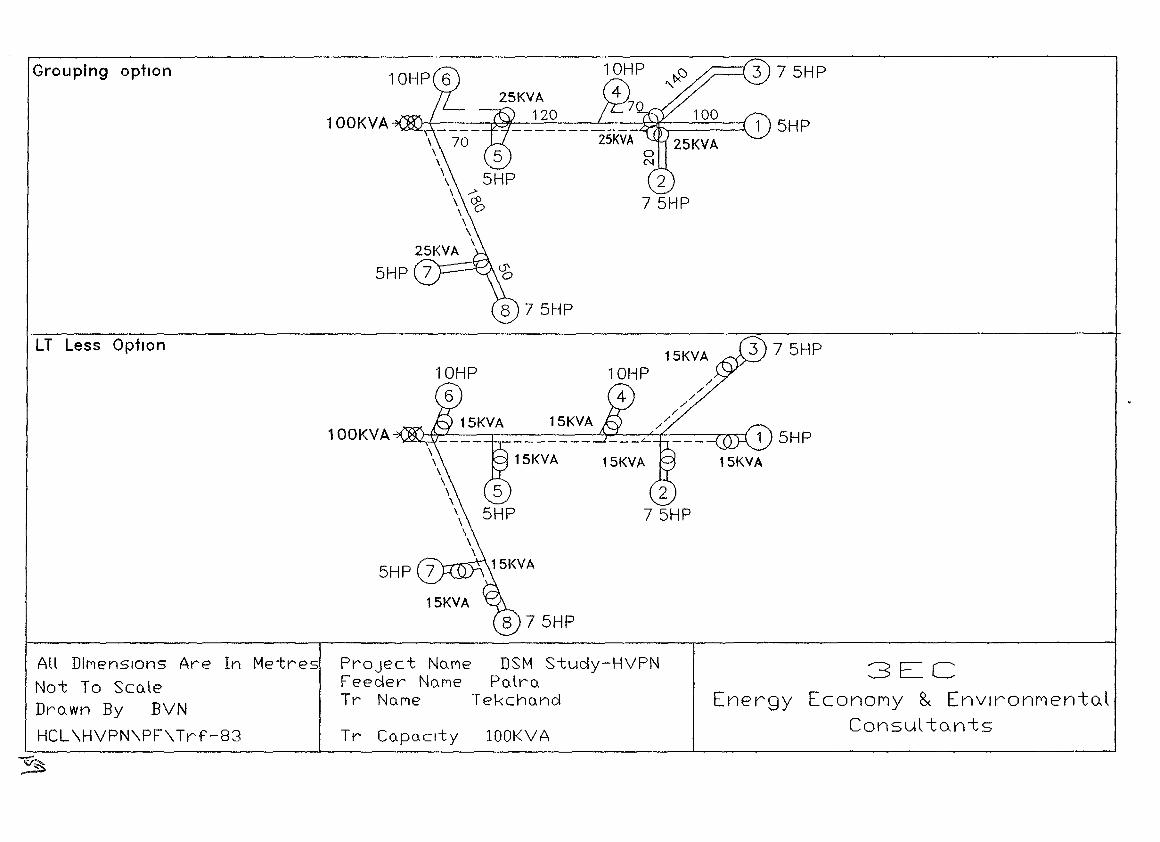
5HP
5HP
75HP
15KVA
15KVA
75HP
5HP
100KVA
100KVA
LT Less Option
Grouping option
All DIMensions Are In Metres
Not To ScoleDro wn By BVN
HCL\HVPN\PF\Trf-83
PrOject NOMeFeec!er NaMeTr NOMe
Tr Capo.cl"ty
DSM Stuc!y-HVPNPalro
TeKchoncl
lOOKVA
3ECEnergy EconOMy & EnvlronMentoJ
Consulio.nis
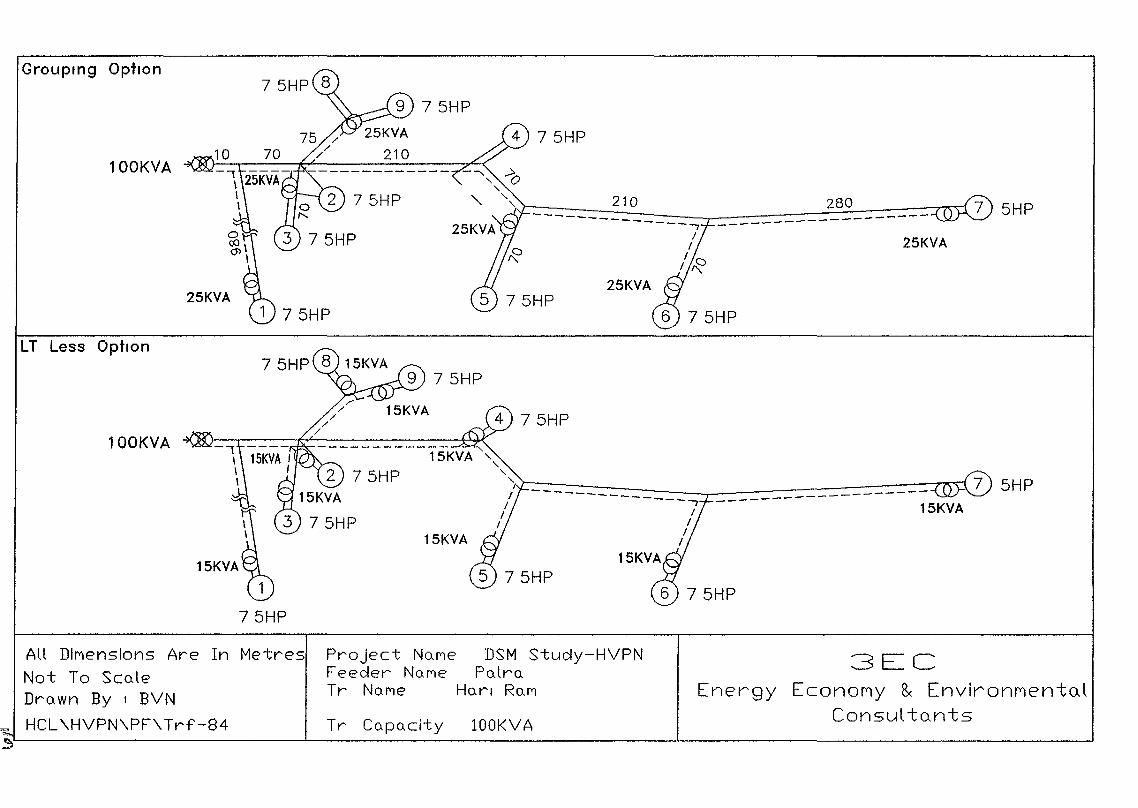
25KVA
25KVA
280
15KVA
------------------
----------_ ....... ---------------
210
75HP
---------------
15KVA
75HP
100KVA
25KVA
1
75HP
75HP
100KVA
Grouping Option
LT Less Option
Project NaMeFeeder NaMeTr NaMe
DSM Study-HVPNPalra
Han Ro.M
All DIMensions Are In Metres
Not To ScaleDrawn By I BVN
~ HCL\HVPN\PF\Trf-84~
Tr Capo.city lOOKVA
3ECEnergy EconoMy 8< EnvironMentCAl
Consul tCAnts
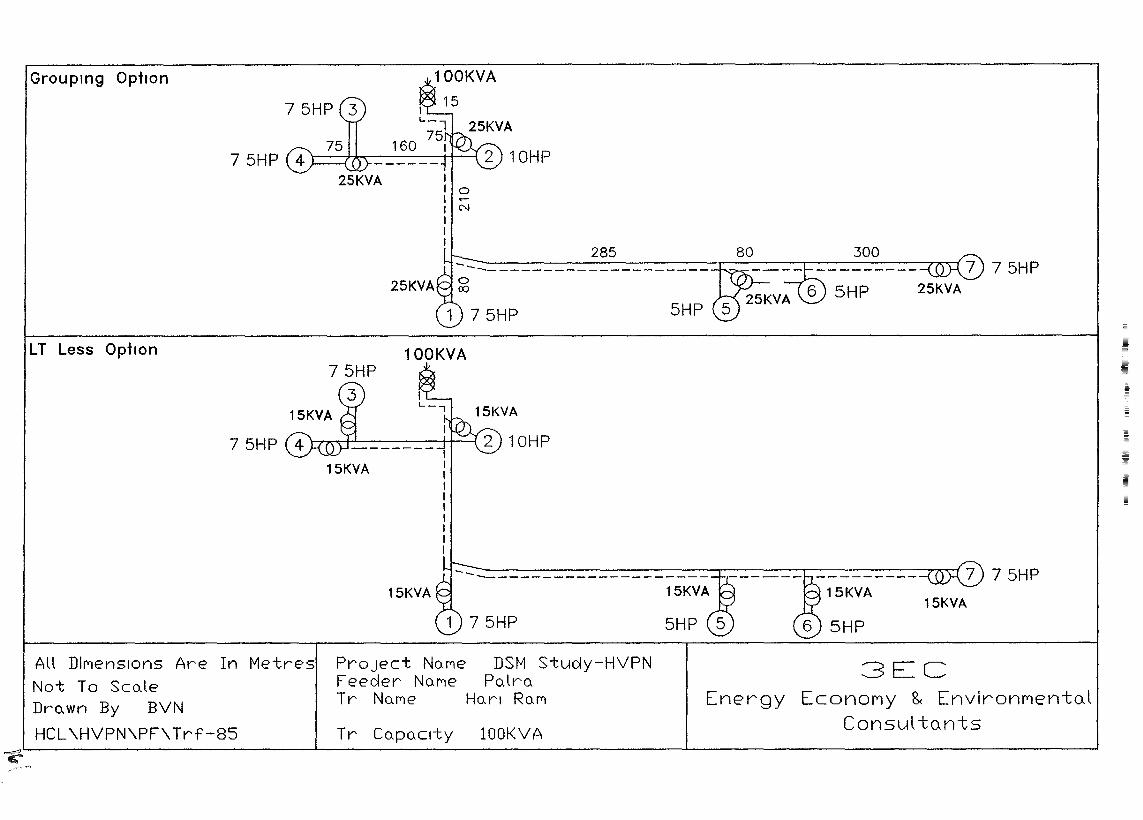
Grouping Optton 100KVAI 151...-
175
160 I
25KVAoN
100KVA
75HP30080
5HP
285-_:-------------,.-----.--------,~---------------------
25KVA
LT Less Option
75HP
I1..._-,
15KVA
75HP
15KVA
5HP
15KVA-_--------------r----.,---------".~---------------------
1 75HP
15KVA
PrOject Na.MeFeeder NOME'Tr NOME'
DSM Study-HVPNPa.lra.
Ha.rl Ra.M
All DIMensions Are In Metres
Not To Sca.leDra.wn By BVN
HCL\HVPN\PF\Trf-85 Tr Copa.Clty lOOK VA
3ECEnergy EconoMy 8< EnvironMental
Consul tants