theperformance ofagricultural - ageconsearch.umn.eduageconsearch.umn.edu/bitstream/46195/2/vol 12...
TRANSCRIPT

The Performance of AgriculturalMarketing Cooperatives inDifferentiated Product Markets
Ronald w: Cotterill
Recent empirical work suggests that cooperative presence in differentiated product markets lowers the consumer prices of all brands. This paper focuses on the theoretical basis forthis competitive yardstick effect by cooperatives. It identifies two market structures where thecompetitive yardstick theorem for cooperatives can be extended from farmer-first handlermarkets to differentiated consumer product markets. They are (1) oligopoly with significantbarriers to entry and (2) monopolistic competition with entry but only non-price competition.In the latter, the cooperative can also ensure that the socially optimal number of brands (product variety) is provided by the industry. The theory also provides useful guidance for determining when supply-limiting conduct in differentiated product markets should be challengedas undue price enhancement under the Capper-Volstead law.
Introduction
Cooperative marketing theory for homogeneous products is reasonably welldeveloped. HeImberger and Hoos (1962) explain the basic model for an agricultural cooperative that purchases raw agricultural product, transforms or processesit, and sells a homogeneous food product to food distributors. Others includingHeImberger (1964), Youde and HeImberger (1966), Knutson (1966), Sexton (1986),and Cotterill (1987) have extended the HeImberger Hoos model to analyze theperformance of agricultural cooperatives under conditions of monopsony andoligopsony. Agricultural marketing cooperatives do have an impact on farm-firsthandler market prices and can, under fairly general conditions, perform a competitive yardstick role if these markets are plagued with buyer price distortions.Cooperative conduct can elevate the prices farmers receive for their raw productto the competitive level (Cotterill 1987, 207).
Some general work for the homogeneous product case has also analyzed theparticipation of marketing cooperatives in tight oligopolies (Mason and Eisenstat1977; Mueller, HeImberger, and Paterson 1987; Rogers and Marion 1990; Petragliaand Rogers 1991; and Royer and Bhuyan 1995). The only empirical study in thislist (Petraglia and Rogers 1991) suggests that price-cost margins are low in industries where cooperatives have large market shares. This result is consistent with a
Ronald w: Cotterill is director, Food Marketing Policy Center, University of Connecticut. Theauthor gratefully acknowledges helpful comments by two anonymous reviewers and the editor of thisjournal. Responsibility for content, however, remains with the author.
This research was supported by the U.S. Department of Agriculture/Rural Business CooperativeDevelopment Service, Cooperative Services Research Cooperative Agreement No. 43-3531-2-0017,"Development of the Theory of Agricultural Cooperation in Noncompetitive Markets." The typingassistance of Karen Nye and graphics assistance of Andrew Franklin are gratefully acknowledged.
24 Journal of Cooperatives 1997
competitive yardstick effect if all industries are homogeneous. However, if product differentiation exists, this result is necessary but not sufficient to prove that acompetitive yardstick effect holds. It does not explicitly show that the investorowned firms (lOFs) in markets where cooperatives have a large share have lowerprice-cost margins and, assuming similar costs, lower prices. The industry-levelrelation between cooperatives' share and industry price-cost margin may be dueto the heavier weight given to the cooperatives' low price-cost margins whencooperatives have a larger share. This low cooperative price-cost margin phenomenon may be due to higher costs and not lower processed product prices.
In 1979, the National Commission for Review of the Antitrust Laws clearlystated the primary concern about large and possibly dominant agricultural marketing cooperatives. They wrote (Mueller 1979a, 3):
Testimony before the commission shows that the threat of monopoly by somecooperatives is now substantial ... In the future less than twenty cooperatives willcontrol the nation's milk supply. Today it is not uncommon for one cooperative todominate the national production of a single fruit. Some staple crop cooperativesapparently would like to attain similar market control of their commodities.
In response, Mueller explained why a commodity marketing cooperative cannot exercise market power (1979a, 3).
The antitrust commission never adequately analyzed the fact that the typical cooperative has no control over the supply of the product it markets. Itcannot control the production of its own members, much less that of nonmembers. This lack of control over production severely limits a cooperative's abilityto enhance prices. The inability to control supply makes the customary indexof market power, a seller's share of the market, virtually meaningless whenapplied to agricultural cooperatives.
As in the famous Sun Maid Raisin case of the 1920s, any price elevation due tomarket power sows the seeds of its own destruction (Cotterill 1984). Membersrespond to higher prices, and then they produce, and deliver more raw productto the cooperative. Absent a dumping or surplus disposal scheme, the cooperative must lower prices to sell it.
To date, agricultural marketing cooperative theorists have not focused much attention on the role of agricultural marketing cooperatives as major marketers of leading and highly differentiated brands in some food industries. Recent empirical worksby Wills (1985), Haller (1993), Cotterill and Haller (1994), and Haller and Cotterill(1995) analyze brand marketingbycooperatives. Wills reports that cooperative brandswith similar market shares and advertising levels tend to have lower, but not significantly different, prices than their proprietary counterparts because of flatter shareprice and advertising-price relationships (1985, 190). Based on this result, Wills concludes that cooperatives that have large-share, differentiated brands behave nodifferently than similarly positioned IOFs. They do not "unduly" enhance price.
Wills's empirical work concurs with the legal economic analysis presented inJesse et al. (1982). They conclude that cooperatives that exercise market power ina fashion similar to IOFs should not be singled out, via Section 2 of CapperVolstead, for tougher standards of enforcement. They quote Mueller:
The Performance of Agricultural Marketing Cooperatives/Cotterill 25
The performance of cooperatives should be judged within the context of aneconomy where varying degrees of market power are the rule, not the exception, and a public policy environment in which little has or is likely to be doneabout existing entrenched power...
If it is deemed in the public interest to control directly the price performanceof cooperatives that unduly enhance prices-and I think there is merit in sucha policy-sound public policy argues for such a standard in all sectors of theeconomy...
Unless something is done to cope with the pervasive problem of undue priceenhancement in other areas, pleas for hard-line enforcement of Section 2 of theCapper-Volstead Act seem unjustified. (1979b, 262)
The Haller and Cotterill work is stronger than the Wills study and lessens theneed for Mueller's parity norm because it suggests that, in some markets, cooperatives actually exercise less market power than similarly situated IOFs would.Haller and Cotterill report that the slope difference between cooperatives andIOFs is statistically significant, with cooperatives having a flatter share-price relationship. Moreover, their work is the first study to document that cooperativepresence in differentiated product markets significantly lowers the prices of proprietary brands, i.e., cooperatives have a direct competitive yardstick effect onthe price conduct of proprietary brand managers.
This paper focuses on the theoretical basis for this competitive yardstick effectby agricultural marketing cooperatives in differentiated consumer product markets. Models will be formally presented of cooperative pricing in differentiatedmarkets that are characterized by monopolistic competition or oligopoly. Questions that will be answered include:
1. Does the competitive yardstick effect of cooperatives that cannot, or donot, control supply in oligopsonistic food processing markets (Cotterill 1987,206-209) carryover to differentiated oligopolistic product markets?
2. Also, can agricultural cooperatives do more than ensure noncollusive prices;can they provide the socially optimal number of brands (product variety)?
3. Finally if agricultural marketing cooperatives control the supply of their members, how does such restraint influence brand prices? Specifically, shouldsupply limiting conduct be sufficient evidence to prove undue price enhancement under Capper-Volstead, or is it conduct that merely allows the cooperative to market differentiated products in a fashion similar to investorowned firms OOFs) that are not deemed in violation of the antitrust laws?
TheTheory of Agricultural Marketing in Differentiated Product Markets
Product differentiation or product heterogeneity complicates the analysis offirm and market equilibrium. Consumers no longer consider products from different firms as fungible. Brands and brand loyalty exist due to real or perceivedquality differences (Aaker and BieI1993). Consequently profit maximizing firmsface downward sloping, brand-level demand curves.
There are two general approaches to the analysis of product differentiation.Chamberlin (1933) presented a symmetric model that analyzes a representativeconsumer who desires product variety as well as low prices. Recent work usingthe symmetric model includes Deneckere and Davidson (1985). Hotelling (1929)
26 Journal of Cooperatives 1997
introduced the spatial model of product differentiation, which has subsequentlybeen generalized by Salop (1979) and others.1 In the spatial model, consumersthat prefer one brand consider as substitutes only brands that are located nearthat brand. For example, if driving on Interstate 90 across the country, when oneis running low on gasoline, only one or two service exits in the immediate vicinityare going to compete for your business.
Hotelling's original model was of the location of two sellers of food on a beach.The existence of end points in this line model affects equilibrium location. Thetwo firms tend to cluster at the center of the beach so that each can capture a"hinterland" or one side of the beach. Salop showed that this clustering disappears when one eliminates end points by generalizing the model from a finite lineto a circle model. Firms in equilibrium then locate equidistant from each otheraround the circle. Since a circle is, in essence, an infinite line this predicts thatsellers on a beach would locate equidistant from each other.
Whether a particular industry conforms to the symmetric or spatial model ofproduct differentiation is not trivial, and it is testable. Willig (1991) explains thatif differentiation is symmetric, then when the price of one brand is elevated customers are lost to other brands in proportion to their market share. However, ifdifferentiation is spatial, customers switch only to nearby brands, and industrywide market shares of other brands are not valid indicators that these brandscross price elasticities. For example, Shredded Wheat accounts for only 3 percentof all breakfast cereal sales. Under symmetric differentiation, the brand's manager appears to have little market power because consumers can switch to thebrands that account for the other 97 percent of the market. However, differentiation in the cereal industry is spatial. Shredded Wheat consumers regard othersimple and healthy unsweetened cereals such as Post Grape Nuts, G.M. Total andKelloggs Special K as their next best substitutes. The fact that Kelloggs FrostedFlakes, Quaker Captain Crunch, and other kid cereals exist and have market sharesthat are roughly equal to those of these simple, healthy cereals does not mean thatShredded Wheat buyers are equally likely to switch to kid cereals if ShreddedWheat's price goes up. Therefore, Shredded Wheat's market share dramaticallyunderstates the ability of Shredded Wheat, by itself or possibly in concert withnearby brands, to elevate price over costs.
For modeling purposes we need not determine whether differentiation is symmetric or spatial. Each model generates brand-level demand curves that havenegative own-price-slopes and positive cross-price effects for several brands.However, several alternative models have been presented. The distinction, as willbe explained below, helps us to determine which model may be most appropriatefor particular food industries.
The theory presented here expands work on cooperative theory by Cotterill(1987). It relies heavily on concepts introduced there as well as the standard graphical presentation of monopolistic competition for IOFs presented in Ferguson andGould (1975, chapter 11). In this paper it will be assumed that each firm marketsonly one brand, so brand and firm are equivalent. It will also be assumed thatbrands have identical cost curves, and, at a given price, industry demand is sharedequally among n brands (Chamberlin's symmetry assumption). These assumptions make the graphical presentation tractable; however, conclusions of this paper do not depend on them. Deneckere and Davidson (1985) relax them and showthat, in equilibrium, different brands can have different prices.
The Performance of Agricultural Marketing Cooperatives/Cotterill 27
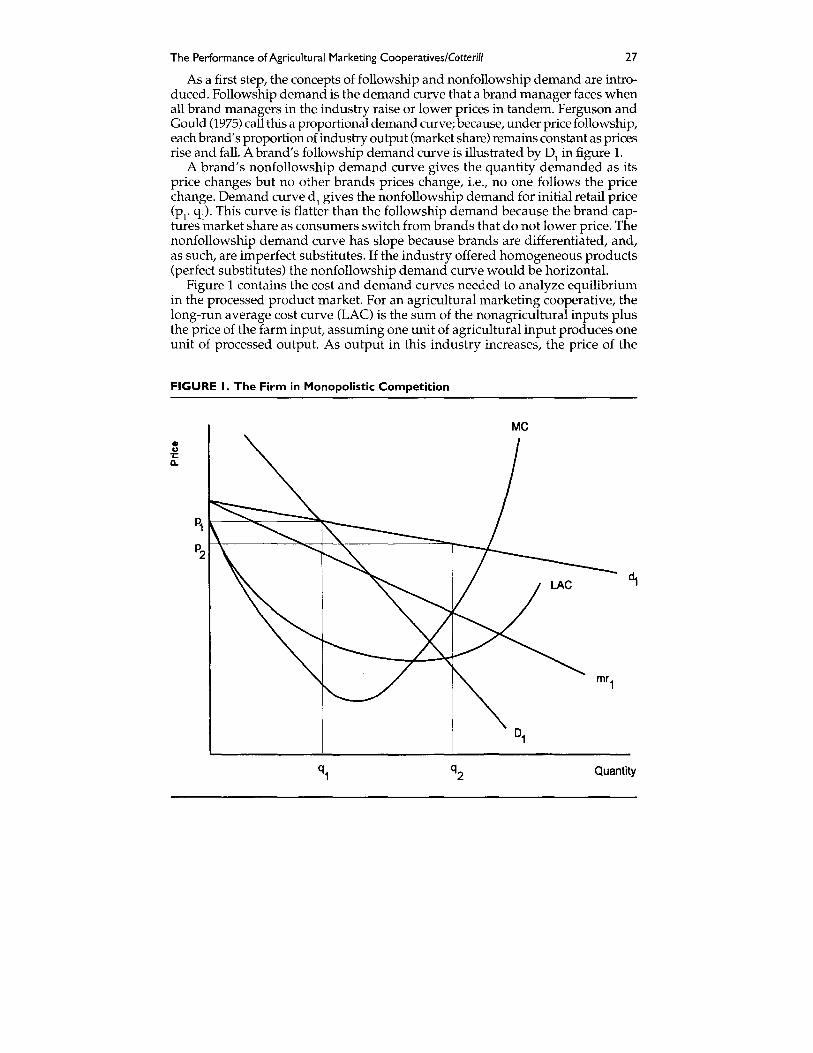
As a first step, the concepts of followship and nonfollowship demand are introduced. Followship demand is the demand curve that a brand manager faces whenall brand managers in the industry raise or lower prices in tandem. Ferguson andGould (1975) call this a proportional demand curve; because, under price followship,each brand's proportion of industry output (market share) remains constant as pricesrise and fall. A brand's followship demand curve is illustrated by Dj in figure 1.
A brand's nonfollowship demand curve gives the quantity demanded as itsprice changes but no other brands prices change, Le., no one follows the pricechange. Demand curve d j gives the nonfollowship demand for initial retail price(Pr qj). This curve is flatter than the followship demand because the brand captures market share as consumers switch from brands that do not lower price. Thenonfollowship demand curve has slope because brands are differentiated, and,as such, are imperfect substitutes. If the industry offered homogeneous products(perfect substitutes) the nonfollowship demand curve would be horizontal.
Figure 1 contains the cost and demand curves needed to analyze equilibriumin the processed product market. For an agricultural marketing cooperative, thelong-run average cost curve (LAC) is the sum of the nonagricultural inputs plusthe price of the farm input, assuming one unit of agricultural input produces oneunit of processed output. As output in this industry increases, the price of the
FIGURE I. The Firm in Monopolistic Competition
Me•o.;:Il.
P1 k--~oc----=""l-_
P2
Quantity
28 Journal of Cooperatives 1997
agricultural input may increase due to a positively sloped agricultural input supply curve. This farm-level supply effect would contribute to the right-hand-side,positive slope of the LAC in figure 1.
Assume initially that the IOFs and the cooperative maximize profits. Point (Pjqj) in figure 1 is not an equilibrium point. Each brand manager thinks that otherswill not follow, and that lowering price to P2 will sell output Q2' wherenonfollowship marginal revenue equals marginal cost. Thus the manager thinkshe is maximizing profits. Since all managers think this way all prices decline, andoutput expansion is given by the followship demand curve, Dj, not dj"
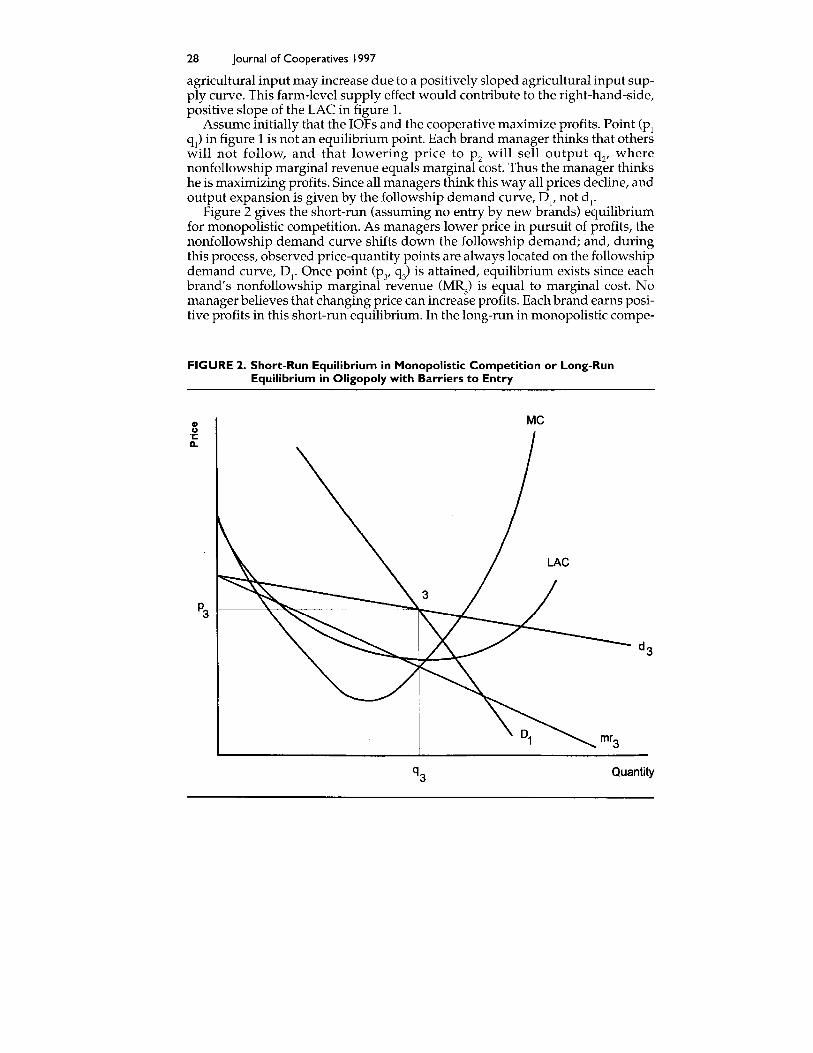
Figure 2 gives the short-run (assuming no entry by new brands) equilibriumfor monopolistic competition. As managers lower price in pursuit of profits, thenonfollowship demand curve shifts down the followship demand; and, duringthis process, observed price-quantity points are always located on the followshipdemand curve, Dj. Once point (py g) is attained, equilibrium exists since eachbrand's nonfollowship marginal revenue (MR
3) is equal to marginal cost. No
manager believes that changing price can increase profits. Each brand earns positive profits in this short-run equilibrium. In the long-run in monopolistic compe-
FIGURE 2. Short-Run Equilibrium in Monopolistic Competition or Long-RunEquilibrium in Oligopoly with Barriers to Entry
Me
Quantity
The Performance of Agricultural Marketing Cooperatives/Cotterill 29
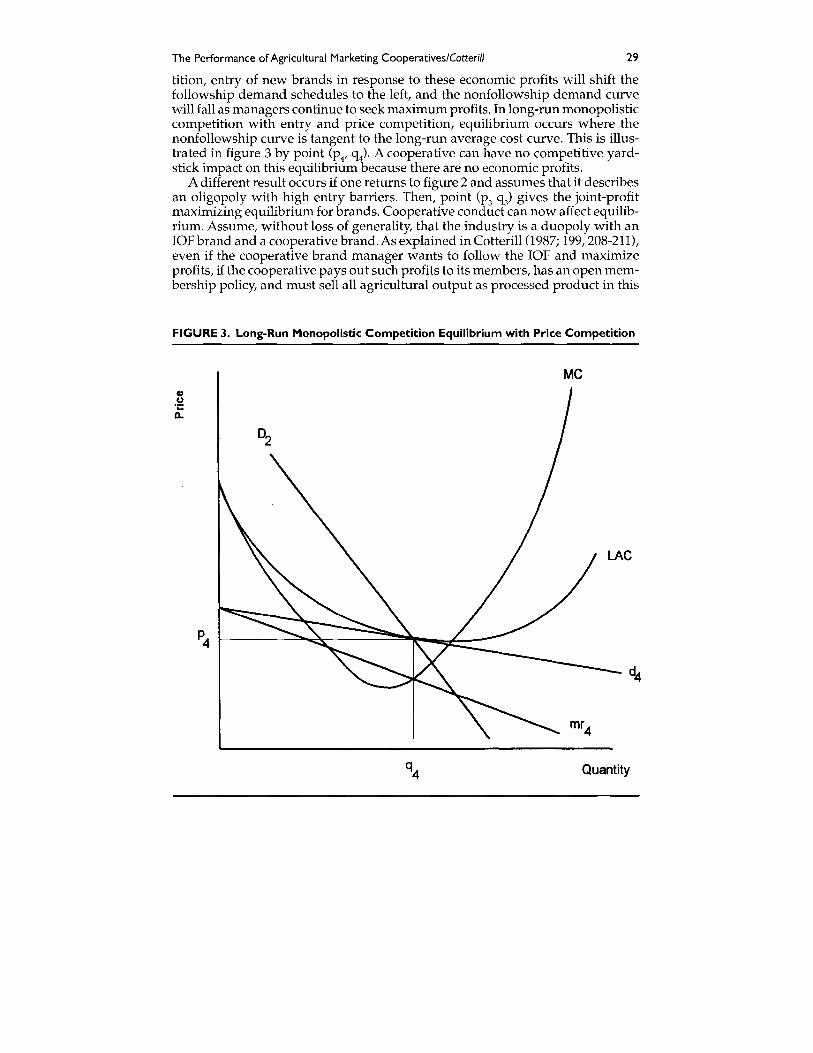
tition, entry of new brands in response to these economic profits will shift thefollowship demand schedules to the left, and the nonfollowship demand curvewill fall as managers continue to seek maximum profits. In long-run monopolisticcompetition with entry and price competition, equilibrium occurs where thenonfollowship curve is tangent to the long-run average cost curve. This is illustrated in figure 3 by point (P4' q4)' A cooperative can have no competitive yardstick impact on this equilibrium because there are no economic profits.
A different result occurs if one returns to figure 2 and assumes that it describesan oligopoly with high entry barriers. Then, point (P3 q3) gives the joint-profitmaximizing equilibrium for brands. Cooperative conduct can now affect equilibrium. Assume, without loss of generality, that the industry is a duopoly with anIOFbrand and a cooperative brand. As explained in Cotterill 0987; 199,208-211),even if the cooperative brand manager wants to follow the IOF and maximizeprofits, if the cooperative pays out such profits to its members, has an open membership policy, and must sell all agricultural output as processed product in this
FIGURE 3. Long-Run Monopolistic Competition Equilibrium with Price Competition
Met)u.;:0..
Quantity
30 Journal of Cooperatives 1997
market, then the cooperative must lower price to sell product. This is becausefarmers increase output when they receive marketing profits in proportion topatronage. The payments increase the price received for their raw inputs andfarmers supply more product. As the cooperative lowers price to sell this increasedoutput, consumers switch to the cooperative brand, and, as demand for the IOFbrand shifts to the left, the profit maximizing price for the IOF also declines. Consequently, the cooperative and the IOF move down the followship demand curvetoward the long-run average cost curve.3
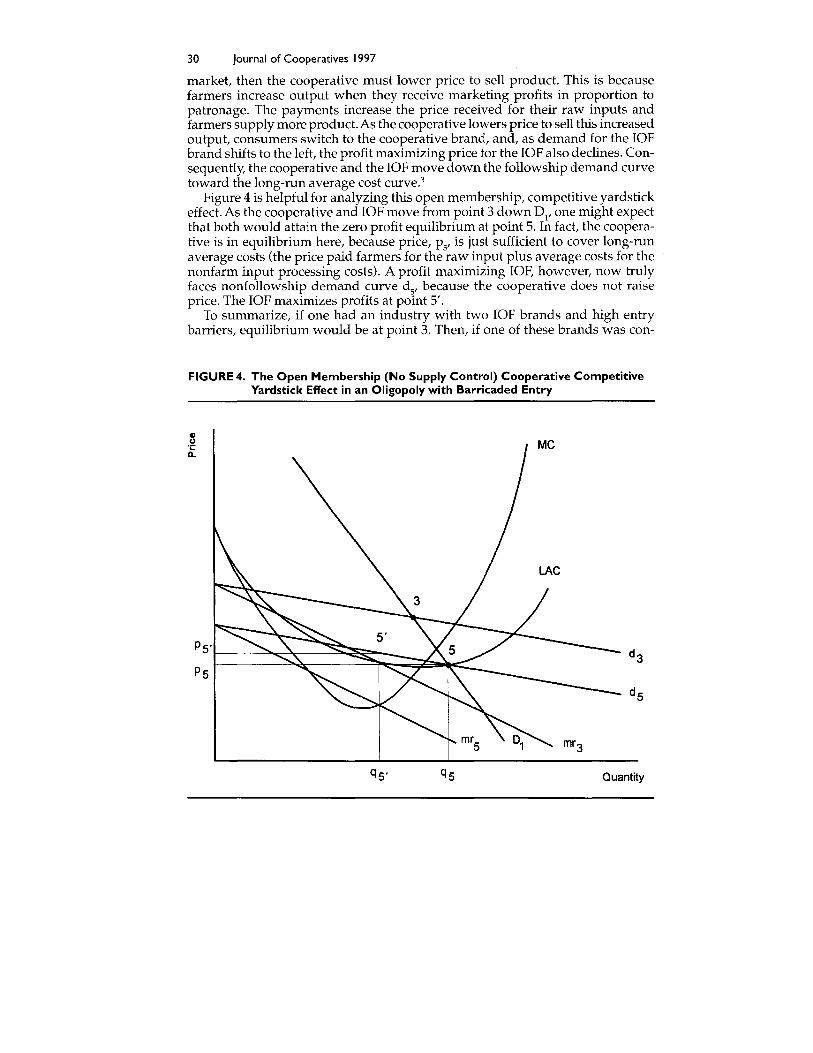
Figure 4 is helpful for analyzing this open membership, competitive yardstickeffect. As the cooperative and IOF move from point 3 down D1, one might expectthat both would attain the zero profit equilibrium at point 5. In fact, the cooperative is in equilibrium here, because price, Ps' is just sufficient to cover long-runaverage costs (the price paid farmers for the raw input plus average costs for thenonfarm input processing costs). A profit maximizing IOF, however, now trulyfaces nonfollowship demand curve ds' because the cooperative does not raiseprice. The IOF maximizes profits at point 5'.
To summarize, if one had an industry with two IOF brands and high entrybarriers, equilibrium would be at point 3. Then, if one of these brands was con-
FIGURE 4. The Open Membership (No Supply Control) Cooperative CompetitiveYardstick Effect in an Oligopoly with Barricaded Entry
Quantity
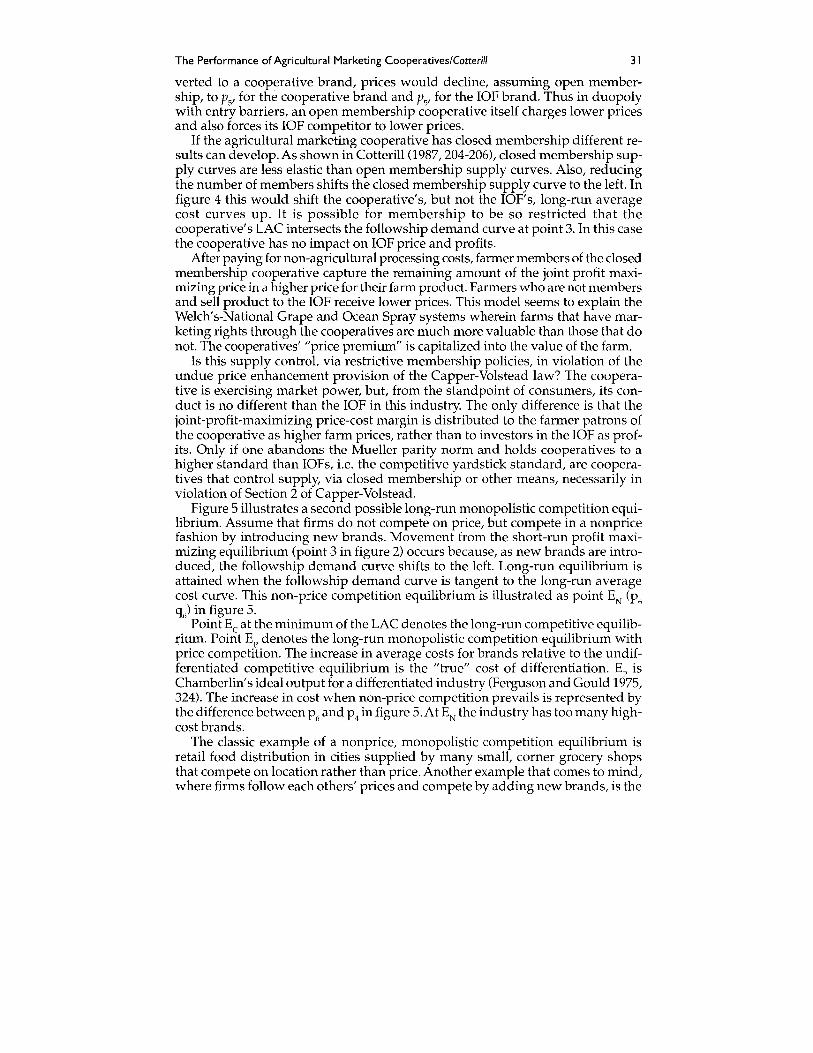
The Performance of Agricultural Marketing Cooperatives/Cotterill 31
verted to a cooperative brand, prices would decline, assuming open membership, to PS' for the cooperative brand and PS' for the IOF brand. Thus in duopolywith entry barriers, an open membership cooperative itself charges lower pricesand also forces its IOF competitor to lower prices.
If the agricultural marketing cooperative has closed membership different results can develop. As shown in Cotterill (1987, 204-206), closed membership supply curves are less elastic than open membership supply curves. Also, reducingthe number of members shifts the closed membership supply curve to the left. Infigure 4 this would shift the cooperative's, but not the lOP's, long-run averagecost curves up. It is possible for membership to be so restricted that thecooperative's LAC intersects the followship demand curve at point 3. In this casethe cooperative has no impact on IOF price and profits.
After paying for non-agricultural processing costs, farmer members of the closedmembership cooperative capture the remaining amount of the joint profit maximizing price in a higher price for their farm product. Farmers who are not membersand sell product to the IOF receive lower prices. This model seems to explain theWelch's-National Grape and Ocean Spray systems wherein farms that have marketing rights through the cooperatives are much more valuable than those that donot. The cooperatives' "price premium" is capitalized into the value of the farm.
Is this supply control, via restrictive membership policies, in violation of theundue price enhancement provision of the Capper-Volstead law? The cooperative is exercising market power, but, from the standpoint of consumers, its conduct is no different than the IOF in this industry. The only difference is that thejoint-profit-maximizing price-cost margin is distributed to the farmer patrons ofthe cooperative as higher farm prices, rather than to investors in the IOF as profits. Only if one abandons the Mueller parity norm and holds cooperatives to ahigher standard than IOFs, i.e. the competitive yardstick standard, are cooperatives that control supply, via closed membership or other means, necessarily inviolation of Section 2 of Capper-Volstead.
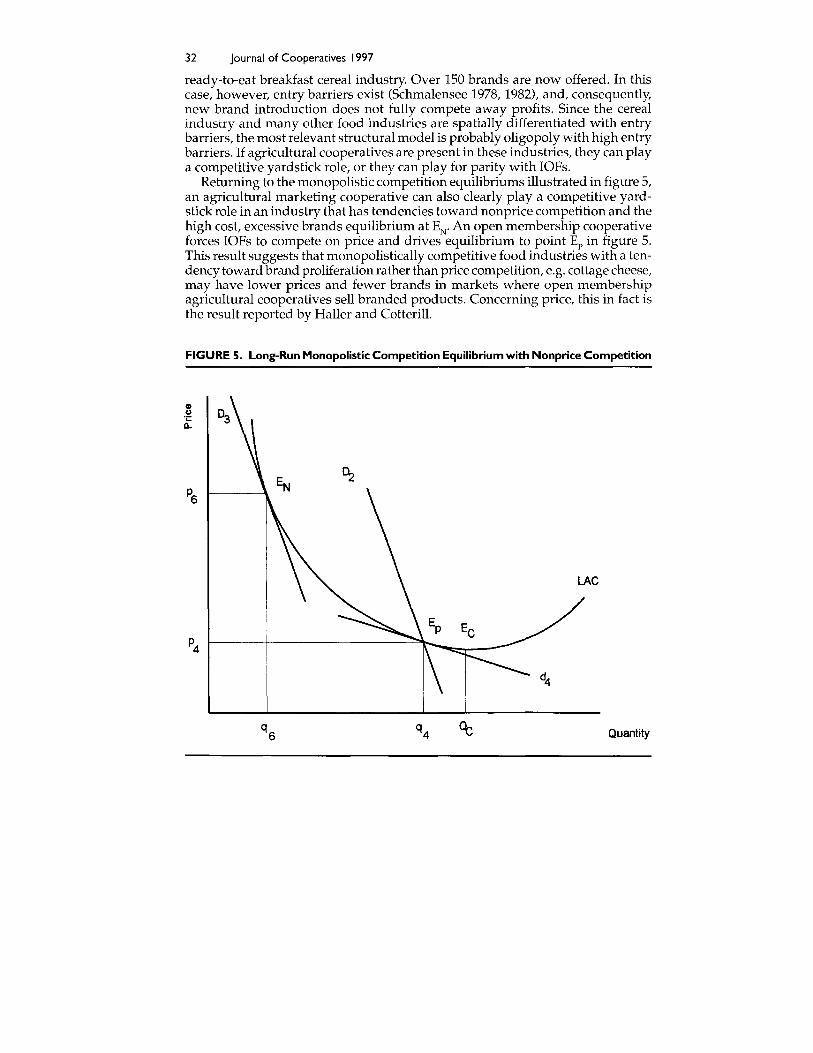
Figure 5 illustrates a second possible long-run monopolistic competition equilibrium. Assume that firms do not compete on price, but compete in a nonpricefashion by introducing new brands. Movement from the short-run profit maximizing equilibrium (point 3 in figure 2) occurs because, as new brands are introduced, the followship demand curve shifts to the left. Long-run equilibrium isattained when the followship demand curve is tangent to the long-run averagecost curve. This non-price competition equilibrium is illustrated as point EN (P6q6) in figure 5.
Point Ec at the minimum of the LAC denotes the long-run competitive equilibrium. Point Ep denotes the long-run monopolistic competition equilibrium withprice competition. The increase in average costs for brands relative to the undifferentiated competitive equilibrium is the "true" cost of differentiation. Ep isChamberlin's ideal output for a differentiated industry (Ferguson and Gould 1975,324). The increase in cost when non-price competition prevails is represented bythe difference between P6 and P4 in figure 5.At EN the industry has too many highcost brands.
The classic example of a nonprice, monopolistic competition equilibrium isretail food distribution in cities supplied by many small, corner grocery shopsthat compete on location rather than price. Another example that comes to mind,where firms follow each others' prices and compete by adding new brands, is the
32 Journal of Cooperatives 1997
ready-to-eat breakfast cereal industry. Over 150 brands are now offered. In thiscase, however, entry barriers exist (Schmalensee 1978, 1982), and, consequently,new brand introduction does not fully compete away profits. Since the cerealindustry and many other food industries are spatially differentiated with entrybarriers, the most relevant structural model is probably oligopoly with high entrybarriers. If agricultural cooperatives are present in these industries, they can playa competitive yardstick role, or they can play for parity with IOFs.
Returning to the monopolistic competition equilibriums illustrated in figure 5,an agricultural marketing cooperative can also clearly playa competitive yardstick role in an industry that has tendencies toward nonprice competition and thehigh cost, excessive brands equilibrium at EN" An open membership cooperativeforces IOFs to compete on price and drives equilibrium to point Ep in figure 5.This result suggests that monopolistically competitive food industries with a tendency toward brand proliferation rather than price competition, e.g. cottage cheese,may have lower prices and fewer brands in markets where open membershipagricultural cooperatives sell branded products. Concerning price, this in fact isthe result reported by Haller and Cotterill.
FIGURE 5. Long-Run Monopolistic Competition Equilibrium with Nonprice Competition
LAC
Quantity
The Performance of Agricultural Marketing Cooperatives/Cotterill 33
Notes1. See also Neven (1985), and Brander and Eaton (1984).2. See Cotterill et al. 1996 for further discussion of alternative behavioral specifications.3. Strictly speaking, this equilibrating process is different than the independent, profit
maximizing conduct that generates the followship demand curve. Cooperatives must lowerprice to move members' product, and IOFs are maximizing profits after the resulting shiftsin their demand curves, rather than maximizing profits by moving along a perceived, butchimeric, nonfollowship demand curve. We assume, however, for ease of exposition, thatthis process generates price-quantity points on D
"the follOWing demand curve.
ReferencesAaker, D. A, and A L. Biel, eds. 1993. Brand equity & advertising: Advertising's role in build
ing strong brands. Mahwah, New Jersey: Lawrence Erlbaum Associates, Publishers.Brander, J. A, and J. Eaton. 1984. Product line rivalry. The American Economic Review
74(3):323-333.Chamberlin, E. 1933. The theory of monopolistic competition. Cambridge, Massachusetts:
Harvard University Press.Cotterill, R W. 1984. The competitive yardstick school of cooperative thought. In American
Cooperation, 41-54. Washington D.C.: American Institute of Cooperation.__. 1987. Agricultural cooperatives: A unified theory of pricing, finance, and invest
ment. In Cooperative theory, new approaches, Jeffrey Royer, ed., 171-258. ACS Service Report 18. Washington, D.C.: u.s. Department of Agriculture.
Cotterill, R w., and L. E. Haller. 1994. Market strategies in branded dairy product markets. In Competitive strategy analysis for agricultural marketing cooperatives, R W. Cotterill,ed., 99-144. Boulder: Westview Press.
Deneckere, R, and C. Davidson. 1985. Incentives to form coalitions with Bertrand competition. Rand Journal of Economics 16(4):473-486.
Ferguson, C. E., and J. P. Gould. 1975. Microeconomic theory 4th ed. Homewood, Illinois:Irvin.
Haller, L. E. 1993. Branded product marketing strategies in the cottage cheese market:Cooperative versus proprietary firms. In Competitive strategy analysis in the food system,R W. Cotterill, ed. Boulder: Westview Press.
Haller, L. E., and R W. Cotterill. 1995. Cooperative influence and pricing strategies inretail dairy markets: Evidence from the cottage cheese industry. Presented at the 1995American Agricultural Association meeting, August 6-9, Indianapolis, Indiana.
HeImberger, P. 1964. Cooperative enterprise as a structural dimension of farm markets.Journal of Farm Economics 46(Aug.):603-617.
HeImberger, P., and S. Hoos. 1962. Cooperative enterprise and organization theory. Journal of Farm Economics 44(2):275-290.
Hotelling, H. 1929. Stability in competition. Economic Journal 39.Jesse, E., A C. Johnson, B. W. Marion, and A C. Manchester. 1982. Interpreting and en
forcing Section 2 of the Capper-Volstead Act. American Journal of Agricultural Economics64(3):431-443.
Knutson, R D. 1966. Cooperatives and the competitive ideal. Journal of Farm Economics48(3):111-121.
Mason, R T., and P. Eisenstat. 1977. Capper-Volstead and milk cooperative market power:Some theoretical issues. In Agricultural cooperatives and the public interest, Proceedings ofa NCR-I17 sponsored workshop, 51-68. Madison: University of Wisconsin.
Mueller, W. F. 1979a. The National Antitrust Commission: Implications of cooperatives. InEconomic Issues. Dept. of Agricultural Economics, University of Wisconsin-Madison,No. 37.
__. 1979b. The Capper-Volstead exemption. Report to the President and the Attorney General, vol. 2., 22 Jan. Washington, D.C.: National Commission for the Review ofAntitrustLaws and Procedures.
34 Journal of Cooperatives 1997
Mueller, W. F., P. G. Heimberger, and T. W. Paterson. 1987. The Sunkist case. Lexington,Massachusetts: Lexington Books.
Neven, D. 1985. Two stage (perfect) equilibrium in Hotelling's model. The Journal of Industrial Economics 33(3):317-325.
Petraglia, L. M., and R. T. Rogers. 1991. The impact of agricultural marketing cooperativeson market performance in U.S. food manufacturing industries for 1982. Food Marketing Policy Center Research Report No. 12, University of Connecticut, Storrs.
Rogers, R. T., and B. Marion. 1990. Food manufacturing activities of the largest agricultural cooperatives: Market power and strategic behavior implications. Journal of Agricultural Cooperation 5:59-73.
Royer, J. S., and S. Bhuyan. 1995. Forward integration by farmer cooperatives: Comparative incentives and impacts. Journal of Cooperatives 10:33-48.
Salop, S. C. 1979. Monopolistic competition with outside goods. Bell Journal of Economics10(1):141-156.
Schmalensee, R. 1982. Product differentiation advantages of pioneering brands. The American Economic Review 72(3):349-365.
__. 1978. Entry deterrence in the ready-to-eat breakfast cereal industry. Bell Journal ofEconomics 9(2):305-327.
Sexton, Richard J. 1986. The formation of cooperatives: A game-theoretic approach withimplications for cooperative finance, decision making and stability. American Journal ofAgricultural Economics 68:214.
Willig, R. D. 1991. Merger analysis, industrial organization theory, and merger guidelines.In Brookings papers on economic activity, M. N. Bailey and C. Winston, eds., 281-312.Washington D.C.: Brookings Institution.
Wills, Robert L. 1985. Price enhancement by cooperatives. American Journal of AgriculturalEconomics 67(2), 183-192.
Youde, J. G., and P. G. HeImberger. 1966. Marketing cooperatives in the U.S.: Membershippolicies, market power, and antitrust policy. Journal of Farm Economics 48(Aug.):23-36.