feed & food - fefac · feed & food statistical yearbook ... turkey, serbia, russia and...
TRANSCRIPT

Feed & FoodStatistical Yearbook 2005Statistical Yearbook 2016

2
FEDERATION EUROPEENNE DES FABRICANTS D'ALIMENTS COMPOSES POUR ANIMAUX
EUROPÄISCHER VERBAND DER MISCHFUTTERINDUSTRIE
EUROPEAN FEED MANUFACTURERS FEDERATION
Rue de la Loi 223, bte 3 - B-1040 Bruxelles - Tél. : (32.2) 285.00.50 - Fax : (32.2) 230.57.22 - e-mail : [email protected] - Website : www.fefac.eu
Copyright © FEFAC 1992 All rights reserved. No part of this Yearbook may be reproduced or transmitted in any
form or by any means, electronic or mechanical, including photocopying, recording or by any information storage
and retrieval system, without permission in writing from the Publisher.
This Yearbook was produced by Arnaud Bouxin.

3
FEED & FOOD
NOTE: Figures on the production of dry petfood by compound feed manufacturers are no longer included in our statistics of
compound feed production because they do not provide a meaningfull representation of the petfood market. Data over the
past years have been corrected accordingly.
1. The value of livestock production – amounting to €160 billion – accounts for 39.4% of the overall EU-28 agricultural output
amounting to €407 billion in 2016.
Animal feedingstuffs, including feed materials and compound feeds, are the main input into livestock production. Within the
EU-28, about 481 mio. t of feedingstuffs are consumed by livestock each year. Out of this quantity, 233 mio. t mostly are
roughages grown and used on the farm of origin. The balance, i.e. 248 mio. t of feed, includes cereals grown and used on the farm
of origin (52 mio. t) and feed purchased by livestock producers to supplement their own feed resources (either feed materials or
compound feed).
In 2016, 156.5 mio. t of compound feed were produced by EU compounders, accounting for 80% of all purchased feedingstuffs.
The value of all feedingstuffs used by EU livestock producers, including forages produced on the farm, is evaluated at
€87.5 billion in 2016. This accounts for 37% of all inputs and 55% of the turnover in livestock production.
Purchases of compound feed amounted in 2015 to €49 billion.
Compound feed are manufactured from a mixture of raw materials designed to achieve pre-determined performance objectives
among animals. These raw materials are obtained from a wide variety of sources. Hence, the industry provides a major market for
EU cereals, oilseeds and pulses. Some raw materials are obtained from the co-products of the food industry. Other important
ingredients, which cannot be grown in sufficient quantity in the EU, are imported from third countries. These diverse sources of
raw material supplies are an important factor in the industry's ability to manufacture feeds of both high quality and at
competitive prices for livestock farmers.
2. The compound feed industry has become capital intensive in recent years and makes use of a very high level of technology.
Advanced methods are used to formulate feeds according to the demands of the livestock farmer – which reflects final
consumers’ demand - and to control the raw materials used, the manufacturing process and the quality of the finished feeds. The
compound feed industry is subject to a complex body of both EU and national legislation affecting almost every part of its
operation. This legislation is designed to ensure that feeds are of high quality and are safe for both livestock and consumers.

4
3. The market for feedingstuffs depends on the market for livestock products. In 2016, the EU-28 livestock population produced
51.5 mio. t of meat (thereof 7.8 mio. t of beef, 23.6 mio. t of pork and 14.8 mio. t of poultry meat), 164 mio. t of milk and
7.7 mio. t of eggs.
Average per capita consumption of meat (including horse meat, rabbits and offals) in 2016 was 91.0 kg, compared to only 50 kg in
the EC-6 during the late 1950s.
4. Compound feed production in the EC-9 grew by over 7.5% per year during the 60s and early 70s. This reflected the development
of the demand for animal products closely linked to the increasing purchasing power. In addition, particularly in the pig and poultry
sectors, production was becoming more intensive requiring greater use of industrial compound feed to meet high performance and
quality requirements.
For the remainder of the 1970s, annual average growth in EC-9 compound feed production slowed down to a rate stabilising at only
4.4%. This lower rate partly reflected the effects of the 1973 "oil price shock" on consumers' incomes. After a period of steady
increase from the mid 80s on, consumption of all livestock products grew more slowly, because of the saturation of the EU-15
market and because of increasing consumer concern about health matters and animal welfare. From 1996 on, the compound feed
production suffered from the impact of the BSE crisis which resulted in a 9% reduction in cattle feed in 1998 compared to 1995.
This decrease was offset by a parallel growth of consumers’ demand for white meat. As a result, compound feed production in the
EU has remained almost stable since 1996. The 2004, 2007 and 2013 enlargements brought some 23 further mio. t of compound
feed to the EU production.
5. FEFAC was created in 1959. Its primary purpose is to represent, support and promote the views and interests of compound feed
manufacturers at the EU institutions.
FEFAC, the European Compound Feed Manufacturers Federation, represents 23 national Associations in EU Member States as well
as Associations from Norway, Turkey, Serbia, Russia and Switzerland with observer / associate member status. The European
compound feed industry employs over 100,000 persons on app. 3,500 production sites often in rural areas, which offer few
employment opportunities.
For more information see our web site (www.fefac.eu).

5
TABLE OF CONTENT
I. THE INDUSTRY OF ANIMAL FEEDING AND
ANIMAL NUTRITION
Page II. INDUSTRIAL COMPOUND FEED PRODUCTION Page
1. Compound feed production in national production 8-10 11. Industrial compound feed output in some non-EU
European countries
43-44
2. Nominal EU-Index of agricultural prices 11-12 12. Global industrial compound feed production 45-47
3. Animal feed in intermediate consumption and final
production
13-15 13. Industrial feed material consumption in the EU 48-49
4. Compound feed industry - Turnover 16-17 14. Imports of feed materials in the EU 50-51
5. Number of compound feed production units 18-19 15. EU-28 balance sheet for protein rich feed materials 52-54
II. INDUSTRIAL COMPOUND FEED PRODUCTION III. MACROECONOMIC DATA ON THE AGRICULTURAL
PRODUCTION IN THE EU AND ITS DISPOSAL
6. Industrial compound feed production in 2015 22-23 16. Breakdown of agricultural production 56-57
7. Industrial compound feed production in 2016 24-27 17. Meat production 58-61
8. Industrial compound feed production in 2015-2016 28-29 18. Livestock population 62-64
9. Industrial compound feed production – 2000-2016 30-34 19. Self-sufficiency 65-66
10. Industrial compound feed output per livestock class 35-42

6
EXPLANATORY NOTES
1) : = data not available
2) Where necessary, figures relating to previous years have been corrected according to the latest statistical issue. Data on petfood
production are no longer included in our statistics and data on previous years have been corrected accordingly.
3) Tables 4, 5, 6, 7a, 7b, 8a, 8b, 9, 10a, 10b, 11a, 11b and 12 are based on information received from the Member Associations, FEFAC
contact points in EFTA and candidate Scountries and FEFAC calculations. The others have been abstracted from EUROSTAT
database and data released by DG Agriculture, a.v.e.c., Alltech, Feed International and Toepfer.
4) As far as Luxembourg, Greece and Malta are concerned, no data are available. Therefore, tables 4, 5, 6, 7a, 7b, 8a, 8b, 9, 10a, 10b,
11a and 11b do not take account of the production figures of these countries.
Total industrial production estimates: Luxembourg: 48,000 t, Greece: 3,000,000 t
5) Conversion rates in € for non-euro area Member States: 2016
1 € CZK SEK RON PLN GBP HUF HRK
27.034 9.4689 4.4904 4.3632 0.81948 311.44 7.53333
DKK BGN
7.4452 1.9558

7
THE INDUSTRY OF ANIMAL FEEDING
AND ANIMAL NUTRITION

8
TAB. 1a: COMPOUND FEED PRODUCTION IN NATIONAL PRODUCTION
DE FR IT NL BE LU UK IE DK EL ES PT AT SE
1. GDP at market prices (Index of volume 2010= 100)
2013 104.7 102.9 96.1 100.4 102.2 105.9 105.1 104.7 102.5 81.5 94.5 93.2 103.6 103.6
2014 106.7 103.8 96.2 101.8 103.6 112.0 108.3 113.4 104.2 82.1 95.8 94.0 104.5 106.3
2015 108.6 104.9 97.1 104.1 105.1 115.2 110.8 142.4 105.8 81.9 99.1 95.7 105.6 11.1
2016 110.7 106.2 98.0 106.4 106.6 118.8 112.8 149.7 107.9 81.7 102.3 97.2 107.2 114.7
2. Industrial production (Index of volume 2010 = 100)
2013 107.7 100.1 91.9 101.5 105.7 94.9 99.7 96.4 109.4 86.8 90.0 96.2 116.3 94.2
2014 109.7 99.9 91.8 102.6 108.9 99.4 102.6 117.7 112.9 88.3 91.8 98.0 117.6 92.0
2015 110.2 101.6 92.9 103.2 109.2 100.6 102.6 165.8 115.7 89.8 95.5 100.4 111.4 94.5
2016 111.6 101.9 94.6 106.1 111.7 101.4 103.8 166.6 120.8 93.6 97.9 100.4 114.3 96.1
3. Thereof: food & beverage industry (Index of volume 2010 = 100)
2013 101.2 100.9 98.0 103.4 106.8 : 103.3 116.7 100.0 89.7 96.2 94.6 105.6 92.0
2014 101.4 101.9 98.5 105.2 107.1 : 107.9 121.1 98.8 91.5 99.8 95.8 106.2 86.2
2015 100.0 104.7 98.4 107.3 109.6 : 108.3 136.0 100.1 90.9 100.6 94.8 107.8 80.5
2016 101.2 104.7 99.9 110.7 113.8 : 110.4 134.1 102.7 92.3 102.6 94.9 108.8 79.4
4. Thereof: compound feed industry (Index of volume 2010 = 100)
2013 106.6 99.2 98.5 94.3 105.2 : 106.4 119.8 95.0 : 99.5 93.4 110.2 99.5
2014 109.1 98.6 98.9 99.1 102.4 : 105.2 99.1 95.3 : 106.5 93.3 115.4 95.8
2015 108.0 98.4 98.7 101.8 103.2 : 105.9 109.1 91.0 : 107.3 95.2 120.5 101.8
2016 108.7 95.0 100.0 101.4 102.2 : 106.4 107.3 90.6 : 112.4 95.5 119.6 98.0
1. Gross domestic product at market prices 2. Total industrial production (excluding construction) 3. Thereof: food & beverage industry 4. Compound feed industry
Source: EUROSTAT – FEFAC

9
TAB. 1b: COMPOUND FEED PRODUCTION IN NATIONAL PRODUCTION
FI CY CZ EE HU LV LT MT PL SK SI BU RO HR EU-28
1. GDP at market prices (Index of volume 2010 = 100)
2013 100.3 91.5 100.5 114.4 102.1 113.5 114.0 108.8 108.2 106.1 96.9 102.8 105.3 96.8 101.5
2014 99.7 90.2 103.2 117.7 106.4 115.7 118.0 117.7 111.7 109.0 99.7 104.2 108.5 96.7 103.3
2015 99.7 92.0 108.7 119.7 110.0 119.0 120.4 126.2 116.0 113.2 102.0 108.0 112.8 99.0 105.7
2016 101.6 94.8 111.5 122.2 112.4 121.5 123.2 133.1 119.4 117.0 105.2 112.2 118.0 102.1 107.8
2. Industrial production (Index of volume 2010 = 100)
2013 97.6 71.0 107.6 129.5 106.7 122.5 121.1 99.0 112.5 125.2 97.6 105.8 120.9 91.1 101.8
2014 96.1 70.2 114.8 136.3 115.5 122.4 122.4 92.9 117.4 131.1 101.2 109.8 130.9 94.0 104.0
2015 94.9 72.6 122.0 138.0 124.4 127.6 129.1 99.2 123.6 141.6 106.8 114.2 135.1 97.3 106.5
2016 97.0 78.0 126.4 140.6 125.8 133.9 133.2 94.8 129.1 149.0 116.4 118.9 139.2 102.5 108.4
3. Thereof: food & beverage industry (Index of volume 2010 = 100)
2013 99.7 : 96.3 109.1 107.5 108.6 118.2 : 112.7 : : 93.4 109.6 : 101.6
2014 97.8 : 99.4 116.7 111.7 108.4 124.1 : 112.8 : : 91.7 113.2 : 103.2
2015 94.6 : 103.7 114.4 116.5 103.3 127.4 : 115.6 : : 92.2 119.9 : 101.1
2016 96.0 : 103.3 113.3 117.3 104.6 129.9 : 121.4 : : 95.0 123.5 : 102.7
4. Thereof: compound feed industry (Index of volume 2010 = 100)
2013 103.0 102.7 91.0 100.0 93.0 116.8 112.5 : 108.3 106.1 88.7 109.8 80.2 99.1 101.1
2014 103.1 106.1 94.4 100.0 95.9 95.9 110.0 : 112.1 107.4 84.6 105.2 71.7 108.7 102.1
2015 106.1 104.8 94.4 100.0 93.7 96.2 127.7 : 117.7 105.3 85.1 127.4 76.9 110.4 103.2
2016 104.1 110.6 94.7 100.0 90.4 96.2 146.8 : 127.7 100.2 91.5 131.6 84.9 112.6 104.2
1. Gross domestic product at market prices 2. Total industrial production (excluding construction) 3. Thereof: food & beverage industry 4. Compound feed industry
Source: EUROSTAT – FEFAC

10
95
100
105
110
115
120
125
130
135
140
145
1995 1997 1999 2001 2003 2005 2007 2009 2011 2013 2015
COMPOUND FEED PRODUCTION IN EU-28 PRODUCTION
(Index of volume: 1995=100)
GDP at market prices Industrial production Food industry Compound feed industry

11
TAB. 2: NOMINAL EU-INDEX OF AGRICULTURAL PRICES
(Index basis 2010 = 100)
I. EU nominal index of producer prices
EU-28 2011 2012 2013 2014 2015 2016
General index 110.6 117.3 120.4 112.4 109.8 108.7
Livestock products 108.7 115.7 119.3 116.3 108.5 103.4
Crop products (except fruits and vegetables) 122.0 129.8 129.1 113.6 115.5 116.0
II. EU nominal index of purchase prices for goods and services currently consumed in agriculture
EU-28 2011 2012 2013 2014 2015 2016
General index 111.9 117.3 118.8 114.3 111.2 107.8
Animal feedingstuffs general index 118.7 126.7 131.6 119.7 114.6 110.8
Source: EUROSTAT

12
80
90
100
110
120
130
140
150
160
170
180
1995 1997 1999 2001 2003 2005 2007 2009 2011 2013 2015
COMPARISON BETWEEN PRODUCER PRICES FOR
ANIMAL PRODUCTS AND FEEDINGSTUFF PRICES
(Nominal Index 1995=100)
Animal products Feedingstuffs

13
TAB. 3a: ANIMAL FEED IN INTERMEDIATE CONSUMPTION AND FINAL PRODUCTION
€ at current basic prices and exchange rates
2016 Unit DE FR IT NL BE LU UK IE DK EL ES PT AT SE
Animal feed mio. € 14,825 14,365 7,460 5,007 3,020 178 5,551 2,397 3,132 1,988 10,602 2,020 1,532 1,247
Intermediate consumption (IC) mio. € 35,954 43,524 22,830 16,650 5,826 306 18,340 5,103 7,835 5,189 21,098 4,357 4,092 4,317
Share of animal feed in IC % 41.2 33.0 32.7 30.1 51.8 58.2 30.3 47.0 40.0 38.3 50.3 46.4 37.4 28.9
Total production mio. € 52,940 70,350 53,407 27,020 7,981 410 28,069 7,420 9,892 10,398 48,091 6,941 6,815 5,959
Share of IC in final agricultural production
% 67.9 61.9 42.7 61.6 73.0 74.6 65.3 68.8 79.2 49.9 43.9 62.8 60.0 72.4
Animal production mio. € 23,937 24,906 14,965 10,332 4,274 201 15,163 5,288 6,075 2,676 16,951 2,631 3,197 2,678
Share of animal production in total production
% 45.2 35.4 28.0 38.2 53.6 49.0 54.0 71.3 61.4 25.7 35.2 37.9 46.9 44.9
Share of animal feed in animal production
% 61.9 57.7 49.8 48.5 70.7 88.6 36.6 45.3 51.6 74.3 62.5 76.8 47.9 46.6
Source: EUROSTAT

14
TAB. 3b: ANIMAL FEED IN INTERMEDIATE CONSUMPTION AND FINAL PRODUCTION
€ at current basic prices and exchange rates
2016 Unit FI CY CZ EE HU LV LT MT PL SI SK BU RO HR EU-28
Animal feed mio. € 953 190 1,145 226 1,530 249 507 28 5,165 394 387 467 2,482 464 87,511
Intermediate consumption mio. € 3,099 381 3,230 599 4,859 983 1,837 63 13,823 737 1,765 2,227 8,903 1,216 239,143
Share of animal feed in IC % 30.8 49.9 35.4 37.7 31.5 25.3 27.6 44.4 37.4 53.5 21.9 21.0 27.9 38.2 36.6
Total production mio. € 4,311 690 4,918 750 8,309 1,316 2,835 126 22,411 1,222 2,391 4,004 15,444 2,184 406,604
Share of IC in total agricultural production
% 71.9 55.2 65.7 79.9 58.5 74.7 64.8 50.0 61.7 60.3 73.8 55.6 57.6 55.7 58.8
Animal production mio. € 2,294 399 1,683 349 2,693 456 837 68 11,281 528 787 990 3,780 749 160,168
Share of animal production in total production
% 53.2 57.8 34.2 46.5 32.4 34.7 29.5 54.0 50.3 43.2 32.9 24.7 24.5 34.3 39.4
Share of animal feed in animal production
% 41.5 47.6 68.0 64.8 56.8 54.6 60.6 41.2 45.8 74.6 49.2 47.2 65.7 61.9 54.6
Source: EUROSTAT

15
0 10 20 30 40 50 60 70 80 90 100
LU
PT
SI
EL
BE
CZ
RO
EE
ES
HR
DE
LT
FR
HU
EU-28
LV
DK
IT
SK
NL
AT
CY
BU
SE
PL
IE
FI
MT
(in %)
VALUE OF FEEDINGSTUFFS IN ANIMAL PRODUCTION IN 2016

16
TAB. 4: COMPOUND FEED INDUSTRY - TURNOVER
Current value of production
mio. € 2002 2003 2004 2005 2006 2007 2008 2009 2010 2011 2012 2013 2014 2015
DE 4,168 3,881 4,500 4,020 3,940 5,120 6,290 5,347 5,809 6,700 7,200 6,780 6,730 6,700
FR 5,660 6,356 6,380 6,280 6,300 6,850 8,450 6,850 7,136 7,900 8,400 7,930 7,650 7,000
IT 3,950 3,900 4,300 4,300 4,350 4,650 5,600 4,900 5,195 6,400 6,700 6,270 6,100 5,860
NL 3,284 3,110 3,400 3,120 3,500 3,750 4,750 3,900 4,077 4,700 5,000 4,550 4,630 4,833
BE 1,591 1,622 1,780 1,620 1,635 1,970 2,350 2,045 2,195 2,600 2,900 2,830 2,670 2,632
UK 3,000 2,936 2,714 2,680 2,840 3,056 3,550 3,037 3,331 3,710 3,840 3,720 3,580 3,376
IE 832 818 820 760 860 940 1,150 857 898 1,000 1,250 1,250 1,000 1,160
DK 1,250 1,132 1,151 1,067 1,022 1,171 1,501 1,191 1,210 1,300 1,400 1,320 1,280 1,202
ES 4,120 4,418 5,183 5,460 4,468 5,730 6,600 5,450 5,531 5,850 6,350 5,900 6,130 6,887
PT 945 945 950 951 906 1,050 1,200 1,006 1,023 1,020 1,100 1,000 950 956
AT 240 240 250 250 270 320 380 370 413 510 560 540 550 563
SE 520 490 490 445 470 500 570 460 471 530 580 550 510 541
FI 331 330 328 323 318 325 399 310 338 400 450 420 410 430
CY : 40 50 53 55 69 57 59 70 70 65 60 65
CZ : 631 675 549 750 668 545 546 730 780 790 730 734
EE : 45 44 42 50 50 40 41 60 60 55 55 55
HU : 1,190 1,200 1,220 1,180 1,440 1,230 1,205 1,500 1,600 1,460 1,300 1,294
LV : 60 38 52 55 95 75 81 100 120 120 100 98
LT : 61 65 63 94 76 71 83 130 160 155 145 156
PL : 1,226 1,398 1,720 2,062 2,770 2,260 2,537 2,850 3,400 3,250 3,270 3,361
SK : 185 198 201 250 253 214 222 240 280 260 260 259
SI : 115 115 115 135 160 135 123 130 120 110 105 107
BU : : : 135 210 170 181 240 240 255 235 290
RO : : : 520 740 610 667 800 900 630 540 590
HR 185 175 180
EU (*) (**) 29,891 30,178 35,799 35,059 34,894 40,718 49,321 41,130 43,372 49,470 53,460 50,395 49,165 49,328
(*): EU-15 from 1995 until 2003, EU-25 from 2004 until 2006, EU-27 until 2012, EU-28 from 2013 (**): Without Luxembourg, Greece and Malta
Source: FEFAC

17
24.000
29.000
34.000
39.000
44.000
49.000
54.000
59.000
1991 1993 1995 1997 1999 2001 2003 2005 2007 2009 2011 2013 2015
TURNOVER OF THE EU COMPOUND FEED INDUSTRY
Mio. €
(EU-15 from 1994, EU-25 from 2004 - EU-27 from 2007 - EU-28 from 2013 Without Greece, Luxembourg and Malta)

18
TAB. 5: NUMBER OF COMPOUND FEED PRODUCTION UNITS
DE FR IT NL BE UK IE DK ES PT AT SE FI CY CZ EE HU LT LV PL SK SI BU RO HR EU (**)
2006 361 342 650 130 77 445 72 71 900 61 94 21 11 46 215 18 275 19 17 117 48 17 4,007
2007 352 317 640 120 77 440 70 64 900 61 103 20 10 45 186 18 260 19 17 117 47 17 90 119 4,109
2008 346 309 630 120 76 415 68 65 909 61 96 20 10 43 165 18 250 17 15 117 46 16 90 110 4,012
2009 330 301 611 118 76 370 68 63 935 59 95 20 10 42 152 17 250 17 15 115 45 16 88 105 3,918
2010 336 297 590 116 75 375 67 61 880 58 97 20 10 41 199 16 245 16 15 110 44 16 86 100 3,870
2011 319 289 580 110 75 345 67 61 854 52 97 20 10 39 190 16 233 16 15 105 43 11 84 95 3,726
2012 313 292 510 100 74 340 65 60 859 52 84 20 10 39 184 16 195 16 27 105 42 11 118 95 3,627
2013 312 282 495 97 74 340 64 57 833 52 80 20 11 38 173 16 160 16 31 106 41 11 118 154 62 3,643
2014 314 295 477 109 87 350 63 46 820 52 88 20 11 38 174 15 160 15 38 106 40 11 115 121 60 3,625
2015 313 297 440 109 85 365 63 46 793 52 87 20 11 38 174 15 160 15 34 111 39 11 110 121 55 3,564
2016 (*) 313 305 435 108 80 365 63 46 793 52 67 20 12 38 165 15 160 15 34 103 12 38 115 120 55 3,529
(*) Estimates (**) Without Luxembourg, Greece and Malta
Source: FEFAC

19
0
500
1.000
1.500
2.000
2.500
3.000
3.500
4.000
4.500
20
25
30
35
40
45
50
00 01 02 03 04 05 06 07 08 09 10 11 12 13 14 15 16
EU
pro
du
cti
on
pe
r u
nit
, in
1 0
00 t
Nu
mb
er
of
un
its
NUMBER AND AVERAGE SIZE OF
FEED PRODUCTION UNITS IN THE EU
(EU-15 until 2003, EU-25 from 2004, EU-27 from 2007, EU-28 from 2013)

20

21
INDUSTRIAL COMPOUND FEED
PRODUCTION IN EUROPE

22
TAB. 6a: INDUSTRIAL COMPOUND FEED PRODUCTION IN 2015
1,000 t
Types of compound feed DE FR IT NL BE UK IE DK ES PT AT SE FI EU-15 (**)
Cattle 6,716 5,351 3,172 4,098 1,332 5,224 2,544 897 7,447 730 556 872 681 39,620
fattening : 1,709 721 474 427 1,285 1,093 : : 260 : : : :
dairy cows : 3,642 2,349 3,395 658 3,596 1,128 678 : 315 : : : :
calves (excluding milk replacers) : : : 229 247 264 251 219 : 38 : : : :
others : 102 79 72 117 Pigs 9,649 5,070 3,558 5,362 3,592 2,075 696 2,421 9,937 840 273 308 279 44,060
piglets : 734 : 714 1,028 79 137 512 : 82 : : 54 :
pigs for fattening : 3,479 : 3,483 2,072 1,534 388 1,371 : 560 : : 120 :
breeding pigs : 857 : 1,165 492 452 115 538 : 170 : : 55 :
others : : : : : 10 56 : : 28 : : 50 : Poultry 6,535 8,854 5,741 3,856 1,297 6,704 576 598 4,205 1,400 570 627 347 41,280
broilers 4,176 3,408 2,845 1,783 665 3,747 : 179 : 860 : : 237 :
chicks & layers 2,359 2,464 1,914 2,073 495 1,738 : 399 : 340 : : 87 :
others : 2,982 982 : 137 1,219 : 20 : 200 : : 23 :
Milk replacers 155 337 105 550 (*) 51 : : : : : : 2 : 1,200
: Others 734 1,513 880 646 378 1,587 172 200 147 190 138 123 125 6,833
TOTAL 23,789 21,125 13,456 14,512 6,650 15,560 3,988 4,116 21,736 3,160 1,537 1,932 1,432 132,993
(*) Estimates (**) Without Luxembourg and Greece
Source: FEFAC

23
TAB. 6b: INDUSTRIAL COMPOUND FEED PRODUCTION IN 2015
1,000 t
Types of compound feed CY CZ EE (*) HU LV (*) LT PL SK SI BU RO (*) HR EU-13 (**) EU-28 (***)
Cattle 127 520 40 540 57 113 847 206 85 141 75 129 2,880 42,500
fattening 16 : : : : 3 : 15 : : : : : :
dairy cows 100 : : : : 98 : 156 : : : : : :
calves (excluding milk replacers) 11 : : : : 8 : 15 : : : : : :
others 4 20 Pigs 34 786 140 1,345 85 40 1,940 246 50 367 1,120 223 6,376 50,436
piglets 2 : : : : 14 : 26 : : : : : :
pigs for fattening 24 : : : : 18 : 161 : : : : : :
breeding pigs 8 : : : : 7 : 37 : : : : : :
others 0 : : : : 1 : 22 : : : : : : Poultry 46 949 48 1,590 173 241 5,929 229 200 614 1,300 288 11,607 53,887
broilers 34 : : : : 174 : 98 : : : : : :
chicks & layers 10 : : : : 60 : 116 : : : : : :
others 2 : : : : 7 : 15 : : : : : : Milk replacers 1 2 : : : : : : : : : : 3 1,203 Others 99 94 2 150 11 127 592 15 25 30 2 8 1,155 7,988 TOTAL 307 2,351 230 3,625 326 521 9,308 696 360 1,152 2,497 648 22,021 155,014
(*) Estimates (**) Without Malta (***) Without Luxembourg, Greece and Malta
Source: FEFAC

24
TAB. 7a: INDUSTRIAL COMPOUND FEED PRODUCTION IN 2016 (*)
1,000 t
Types of compound feed DE FR IT NL BE UK IE DK ES PT AT SE FI EU-15 (**)
Cattle 6,999 5,113 3,136 4,419 1,350 5,071 2,544 981 7,799 750 543 833 677 40,215
fattening : 1,749 651 508 443 1,291 1,134 : : 270 : : : :
dairy cows : 3,364 2,365 3,667 657 3,441 1,051 741 : 350 : : : :
calves (excluding milk replacers) : : : 244 250 256 222 240 : 38 : : : :
others : : 120 : : 83 73 : : 92 : : : : Pigs 9,646 4,897 3,598 5,132 3,500 2,028 697 2,312 10,420 800 257 277 262 43,826
piglets : 719 : 752 993 72 122 498 : 78 : : 50 :
pigs for fattening : 3,356 : 3,289 2,033 1,512 387 1,298 : 550 : : 113 :
breeding pigs : 822 : 1,091 474 434 109 516 : 140 : : 53 :
others : : : : : 10 51 : : 32 : : 46 : Poultry 6,515 8,537 5,887 3,840 1,312 6,990 573 615 4,401 1,430 601 674 351 41,726
broilers 4,148 3,337 2,920 1,970 702 3,890 : 199 : 900 : : 241 :
chicks & layers 2,367 2,442 1,929 1,870 476 1,773 : 378 : 345 : : 87 :
others : 2,758 1,038 : 134 1,327 : 38 : 185 : : 23 :
Milk replacers 159 338 100 520 55 0 0 0 0 0 0 2 0 1,174 : Others 607 1,510 910 538 374 1,546 108 190 151 190 125 74 115 6,438
TOTAL 23,926 20,395 13,631 14,449 6,591 15,635 3,922 4,098 22,771 3,170 1,526 1,860 1,405 133,379 (*) Estimates (**) Without Luxembourg and Greece
Source: FEFAC

25
TAB. 7b: INDUSTRIAL COMPOUND FEED PRODUCTION IN 2016 (*)
1,000 t
Types of compound feed CY CZ EE (*) HU LV (*) LT PL SK SI BU RO (*) HR EU-13 (**) EU-28 (***)
Cattle 132 533 40 500 57 148 857 200 92 168 49 113 2,889 43,104
fattening 16 : : : : 1 : 16 : : : : : :
dairy cows 105 : : : : 142 : 151 : : : : : :
calves (excluding milk replacers) 11 : : : : 2 : 14 : : : : : :
others : : : : : 3 : 19 : : : : : Pigs 33 765 140 1,330 85 36 2,061 224 51 343 1,176 248 6,492 50,318
piglets 2 : : : : 8 : 25 : : : : : :
pigs for fattening 23 : : : : 20 : 147 : : : : : :
breeding pigs 8 : : : : 7 : 34 : : : : : :
others 0 : : : : 1 : 18 : : : : : : Poultry 46 983 48 1,540 173 243 6,504 222 228 638 1,529 288 12,442 54,168
broilers 34 : : : : 173 : 88 : : : : : :
chicks & layers 10 : : : : 65 : 119 : : : : : :
others 2 : : : : 5 : 15 : : : : : : Milk replacers 1 2 : : : 0 : : : : : : 3 1,177 Others 1112 75 2 130 11 172 671 16 16 41 2 12 1,260 7,698 TOTAL 324 2,358 230 3,500 326 599 10,093 662 387 1,190 2,756 661 23,086 156,465
(*) Estimates (**) Without Malta (***) Without Luxembourg, Greece and Malta
Source: FEFAC

26
BE6.6
CZ2.4
DE23.9
DK 4.1
ES22.8
FR20.4
HU3.5
IT13.6
IE3.9
NL 14.4
PT3.2
RO2.8 PL
10.1
UK 15.6
AT1.5
CY0.3EE
0.2
FI1.4
LT0.6
LV0.3
SE1.9
SI0.4
BU1.2
SK0.7
HR0.7
Other9.2
EU-28 COMPOUND FEED PRODUCTION IN 2016
156.5 mio. t (+0.9%)

27
Cattle27.5%
Pigs32.2%
Poultry & eggs34.6%
Milk replacers0.8%
Others4.9%
INDUSTRIAL COMPOUND FEED PRODUCTION
PER CATEGORY IN 2016 IN THE EU-28
Source: FEFAC

28
TAB. 8: INDUSTRIAL COMPOUND FEED PRODUCTION IN 2015-2016
1,000 t
CATTLE PIGS POULTRY MILK REPLACERS OTHERS TOTAL
2015 2016 TAV 2015 2016 TAV 2015 2016 TAV 2015 2016 TAV 2015 2016 TAV 2015 2016 TAV
DE 6,716 6,999 4.2 9,649 9,646 0.0 6,535 6,515 -0.3 155 159 2.6 734 607 -17.3 23,789 23,926 0.6
FR 5,351 5,113 -4.4 5,070 4,897 -3.4 8,854 8,537 -3.6 337 338 0.3 1,513 1,510 -0.2 21,125 20,395 -3.5
IT 3,172 3,136 -1.1 3,558 3,598 1.1 5,741 5,887 2.5 105 100 -4.8 880 910 3.4 13,456 13,631 1.3
NL 4,098 4,419 7.8 5,362 5,132 -4.3 3,856 3,840 -0.4 550 520 -5.5 646 538 -16.7 14,512 14,449 -0.4
BE 1,332 1,350 1.4 3,592 3,500 -2.6 1,297 1,312 1.2 51 55 7.8 378 374 -1.1 6,650 6,591 -0.9
UK 5,224 5,071 -2.9 2,075 2,028 -2.3 6,674 6,990 4.7 : : n.a. 1,587 1,546 -2.6 15,560 15,635 0.5
IE 2,544 2,544 0.0 696 697 0.1 576 573 -0.5 : : n.a. 172 108 -37.2 3,988 3,922 -1.7
DK 897 981 9.4 2,421 2,312 -4.5 598 615 2.8 : : n.a. 200 190 -5.0 4,116 4,098 -0.4
ES 7,447 7,799 4.7 9,937 10,420 4.9 4,205 4,401 4.7 : : n.a. 147 151 2.7 21,736 22,771 4.8
PT 730 750 2.7 840 800 -4.8 1,400 1,430 2.1 : : n.a. 190 190 0.0 3,160 3,170 0.3
AT 556 543 -2.3 273 257 -5.9 570 601 5.4 : : n.a. 138 125 -9.4 1,537 1,526 -0.7
SE 872 833 -4.5 308 277 -10.1 627 674 7.5 2 2 0.0 123 74 -39.8 1,932 1,860 -3.7
FI 681 677 -0.6 279 262 -6.1 347 351 1.2 : : n.a. 125 115 -8.0 1,432 1,405 -1.9
CY 127 132 3.9 34 33 -2.9 46 46 0.0 1 1 0.0 99 112 13.1 307 324 5.5
CZ 520 533 2.5 786 765 -2.7 949 983 3.6 2 2 0.0 94 75 -20.2 2,351 2,358 0.3
EE(*) 40 40 0.0 140 140 0.0 48 48 0.0 : : n.a. 2 2 0.0 230 230 0.0
HU 540 500 -7.4 1,345 1,330 -1.1 1,590 1,540 -3.1 : : n.a. 150 130 -13.3 3,625 3,500 -3.4
LV(*) 57 57 0.0 85 85 0.0 173 173 0.0 : : n.a. 11 11 0.0 326 326 0.0
LT 113 148 31.0 40 36 -10.0 241 243 0.8 : : n.a. 127 172 35.4 521 599 15.0
PL 847 857 1.2 1,940 2,061 6.2 5,929 6,504 9.7 : : n.a. 592 671 13.3 9,308 10,093 8.4
SK 206 200 -2.9 246 224 -8.9 229 222 -3.1 : : n.a. 15 16 6.7 696 662 -4.9
SI 85 92 8.2 50 51 2.0 200 228 14.0 : : n.a. 25 16 -36.0 360 387 7.5
BU 141 168 19.1 367 343 -6.5 614 638 3.9 : : n.a. 30 41 36.7 1,152 1,190 3.3
RO(*) 75 49 -34.7 1,120 1,176 5.0 1,300 1,529 17.6 : : n.a. 2 2 0.0 2,497 2,756 10.4
HR 129 113 -12.4 223 248 11.2 288 288 0.0 : : n.a. 8 12 50.0 648 661 2.0
EU-28(**) 42,500 43,104 1.4 50.436 50.318 -0.2 52,887 54,168 2.4 1,203 1,177 -2.2 7,988 7,698 -3.6 155,014 156,465 0.9
(*) Estimates (**) Without Luxembourg, Greece and Malta
Source: FEFAC

29
-10,0%
-5,0%
0,0%
5,0%
10,0%
15,0%
20,0%
DE
FR
IT NL
BE UK
IE DK ES
PT
AT
SE
FI C
Y
CZ
EE
HU
LV
LT
PL
SK
SI
BU
RO
HR
EU
Cattle
EU
Pig
s
EU
Pou
ltry
EU
To
tal
EVOLUTION OF COMPOUND FEED PRODUCTION BETWEEN 2015 AND
2016 PER COUNTRY AND PER CATEGORY

30
TAB. 9a: INDUSTRIAL COMPOUND FEED PRODUCTION 2000-2016
1,000 t
DE FR IT NL BE UK IE DK ES PT AT SE FI EU-15 (**)
2000 19,636 23,109 11,522 14,655 6,303 13,647 3,503 6,128 16,885 3,832 911 2,271 1,295 123,697
2001 19,474 23,285 11,877 14,251 6,365 13,998 3,561 6,045 18,486 3,848 921 2,318 1,320 125,749
2002 19,695 22,758 13,146 13,349 6,291 13,674 3,808 5,782 19,648 3,938 968 2,270 1,360 126,695
2003 20,009 22,577 13,205 12,846 6,150 13,718 3,695 5,562 19,425 3,778 1,001 2,224 1,398 125,588
2004 20,139 22,290 13,782 13,078 6,347 14,085 3,545 5,630 20,339 3,794 1,015 2,144 1,414 127,602
2005 19,449 21,985 13,500 12,979 5,994 13,770 3,580 5,329 20,988 3,799 1,018 2,097 1,452 125,940
2006 20,304 21,585 13,190 13,491 5,958 14,115 3,918 5,206 19,218 3,440 1,081 2,057 1,417 124,980
2007 21,310 22,344 13,553 13,730 6,242 14,341 3,556 5,205 21,203 3,605 1,153 2,140 1,405 129,787
2008 21,825 22,642 13,735 14,577 6,288 13,993 3,648 4,960 21,351 3,490 1,171 2,074 1,385 131,139
2009 20,875 21,236 13,245 14,079 6,185 13,799 3,606 4,588 20,556 3,380 1,177 1,909 1,275 125,910
2010 22,019 21,478 13,633 14,249 6,446 14,694 3,654 4,525 20,255 3,318 1,276 1,897 1,350 128,794
2011 23,019 21,294 13,903 14,073 6,460 14,418 3,495 4,267 20,148 3,235 1,330 1,836 1,350 128,828
2012 23,437 21,211 13,502 13,841 6,547 15,146 4,125 4,285 20,361 3,200 1,370 1,886 1,397 130,308
2013 23,479 21,299 13,432 13,441 6,784 15,633 4,377 4,299 20,150 3,100 1,406 1,888 1,391 130,679
2014 24,021 21,170 13,489 14,118 6,603 15,465 3,622 4,311 21,571 3,095 1,472 1,818 1,392 132,147
2015 23,789 21,125 13,456 14,512 6,650 15,560 3,988 4,116 21,736 3,160 1,537 1,932 1,432 132,993
2016(*) 23,926 20,395 13,631 14,449 6,591 15,635 3,922 4,098 22,771 3,170 1,527 1,860 1,405 133,379
(*) Estimates (**) Without Luxembourg and Greece
Source: FEFAC

31
TAB. 9b: INDUSTRIAL COMPOUND FEED PRODUCTION 2000-2016
1,000 t
CY CZ EE HU LV LT PL SK SI BU RO HR EU-13 (**) EU-28 (***)
2000 240 3,362 187 5,288 169 327 4,270 1,318 526 561 1,570 500(*) 18,318 142,015
2001 238 3,599 212 5,564 173 327 4,598 1,249 526 555 1,603 500(*) 19,144 144,893
2002 230 3,206 221 5,610 200 327 4,741 1,344 504 475 1,682 500(*) 19,040 145,735
2003 234 3,138 206 5,123 233 243 5,559 1,279 503 480 1,745 500(*) 19,243 144,831
2004 220 3,052 227 4,759 238 283 5,464 1,082 501 613 1,852 510 18,801 146,403
2005 281 2,731 223 4,500 190 297 5,276 1,002 484 669 2,042 540 18,235 144,175
2006 288 2,839 212 4,456 207 352 6,341 1,069 474 685 2,323 541 19,787 144,767
2007 287 3,002 224 4,150 202 515 7,053 990 495 710 2,705 603 20,936 150,723
2008 289 2,799 236 4,125 327 398 7,129 834 495 863 3,032 616 21,143 152,282
2009 293 2,576 230 4,070 323 361 7,255 655 477 874 3,060 578 17,998 143,908
2010 293 2,490 230 3,870 339 408 7,906 661 423 904 3,245 587 21,356 150,150
2011 325 2,209 230 3,780 339 422 7,738 640 409 948 3,335 611 20,986 149,814
2012 315 2,090 230 3,720 361 449 8,413 701 379 878 3,520 635 21,691 151,999
2013 301 2,266 230 3,600 396 459 8,566 701 375 993 2,602 582 21,071 151,750
2014 311 2,350 230 3,710 325 449 8,865 710 358 951 2,328 638 21,225 153,372
2015 307 2,351 230 3,625 326 521 9,308 696 360 1,152 2,497 648 22,021 155,014
2016(*) 324 2,358 230 3,500 326 599 10,093 662 387 1,190 2,756 661 23,086 156,465
(*) Estimates (**) Without Malta (***) Without Luxembourg, Greece and Malta
Source: FEFAC

32
70
80
90
100
110
120
130
140
150
160
1995 1997 1999 2001 2003 2005 2007 2009 2011 2013 2015
Ind
ex
10
0 =
19
95
EVOLUTION OF COMPOUND FEED PRODUCTION
IN SOME EU-15 COUNTRIES
FR IT NL UK ES DE
Source: FEFAC

33
70
90
110
130
150
170
190
1995 1997 1999 2001 2003 2005 2007 2009 2011 2013 2015
Ind
ex
10
0 =
19
95
EVOLUTION OF COMPOUND FEED PRODUCTION
IN OTHER EU-15 COUNTRIES
BE IE DK PT AT SE FI
Source: FEFAC

34
50
75
100
125
150
175
200
225
250
275
1999 2001 2003 2005 2007 2009 2011 2013 2015
Ind
ex
10
0 =
19
99
EVOLUTION OF COMPOUND FEED PRODUCTION
IN EU-13 MEMBER STATES
CZ HU PL SK BU RO Other EU-13
Source: FEFAC

35
TAB. 10a: INDUSTRIAL COMPOUND FEED OUTPUT PER LIVESTOCK CLASS 2012-2016
1,000 t
DE FR IT NL BE UK IE DK ES PT AT SE FI EU-15 (**)
Cattle feed
2012 6,724 5,236 3,420 3,543 1,253 5,212 2,555 918 7,060 710 472 932 662 38,697
2013 6,906 5,449 3,410 3,543 1,388 5,574 2,746 939 6,700 675 482 903 669 39,384
2014 7,157 5,494 3,293 3,852 1,322 5,387 2,327 917 7,154 695 522 841 674 39,635
2015 6,716 5,351 3,172 4,098 1,332 5,224 2,544 897 7,447 730 556 872 681 39,620
2016(*) 6,999 5,113 3,136 4,419 1,350 5,071 2,544 981 7,799 750 543 833 677 40,215
Pig feed
2012 9,721 5,516 3,310 5,451 3,682 1,858 701 2,649 8,758 870 274 312 309 43,411
2013 9,597 5,332 3,335 5,360 3,716 1,842 690 2,582 8,900 830 275 297 293 43,049
2014 9,694 5,148 3,255 5,349 3,643 2,002 676 2,584 9,625 820 277 302 275 43,650
2015 9,649 5,070 3,558 5,362 3,592 2,075 696 2,421 9,937 840 273 308 279 44,060
2016(*) 9,646 4,897 3,598 5,132 3,500 2,028 697 2,312 10,420 800 257 277 262 43,826
Poultry feed
2012 6,110 8,606 5,700 3,802 1,392 6,606 501 548 4,409 1,410 504 554 317 40,459
2013 6,094 8,696 5,695 3,602 1,458 6,570 529 594 4,400 1,400 524 548 324 40,434
2014 6,230 8,680 5,936 3,689 1,235 6,640 521 610 4,654 1,390 547 572 330 41,034
2015 6,535 8,854 5,741 3,856 1,297 6,674 576 598 4,205 1,400 570 627 347 41,280
2016(*) 6,515 8,537 5,887 3,840 1,312 6,990 573 615 4,401 1,430 601 674 351 41,726
Milk replacers
2012 150 363 135 616 38 2 : : : : : 2 : 1,306
2013 155 364 110 616 36 : : : : : : 2 : 1,283
2014 160 346 109 595 46 : : : : : : 2 : 1,258
2015 155 337 105 550 51 : : : : : : 2 : 1,200
2016(*) 159 338 100 520 55 : : : : : : 2 : 1,174
(*) Estimates (**) Without Luxembourg and Greece
Source: FEFAC

36
TAB. 10b: INDUSTRIAL COMPOUND FEED OUTPUT PER LIVESTOCK CLASS 2012-2016
1,000 t
CY CZ EE HU LV LT PL SK SI BU RO HR EU-13(**) EU-28(***)
Cattle feed
2012 117 427 40 530 74 59 962 212 98 109 170 120 2,918 41,615
2013 118 473 40 570 115 63 934 208 95 153 100 103 2,972 42,356
2014 124 505 40 600 62 60 1,032 223 84 125 64 130 3,049 42,684
2015 127 520 40 540 57 113 847 206 85 141 75 129 2,880 42,500
2016(*) 132 533 40 500 57 148 857 200 92 168 49 113 2,889 43,104
Pig feed
2012 45 735 140 1,380 100 78 1,816 230 59 246 1,600 229 6,658 50,069
2013 34 802 140 1,350 109 78 1,850 239 59 285 1,000 211 6,157 49,206
2014 36 803 140 1,350 91 60 1,906 248 48 291 1,011 221 6,205 49,855
2015 34 786 140 1,345 85 40 1,940 246 50 367 1,120 223 6,376 50,436
2016(*) 33 765 140 1,330 85 36 1,061 224 51 343 1,176 248 6,492 50,318
Poultry feed
2012 52 853 48 1,640 165 295 5,233 247 208 499 1,750 276 11,266 51,725
2013 48 902 48 1,520 161 300 5,259 241 208 530 1,500 261 10,978 51,412
2014 49 956 48 1,600 162 310 5,370 225 202 510 1,251 276 10,959 51,993
2015 46 949 48 1,590 173 241 5,929 229 200 614 1,300 288 11,607 52,887
2016(*) 46 983 48 1,540 173 243 6,504 222 228 638 1,529 288 12,442 54,168
Milk replacers
2012 1 3 : : : 2 : : : : : : 6 1,312
2013 1 2 : : : 3 : : : : : : 6 1,289
2014 1 2 : : : 4 : : : : : : 7 1,265
2015 1 2 : : : 0 : : : : : : 3 1,203
2016(*) 1 2 : : : 0 : : : : : : 3 1,177
(*) Estimates (**) Without Malta (***) Without Luxembourg, Greece and Malta
Source: FEFAC

37
EVOLUTION OF COMPOUND FEED PRODUCTION PER CATEGORY PER COUNTRY
0
2.000
4.000
6.000
8.000
10.000
12.000
2012 2013 2014 2015 2016 2012 2013 2014 2015 2016 2012 2013 2014 2015 2016
(*1
,00
0
t)
GERMANY
CATTLE PIG POULTRY
0
1.500
3.000
4.500
6.000
7.500
9.000
10.500
2012 2013 2014 2015 2016 2012 2013 2014 2015 2016 2012 2013 2014 2015 2016
(*1
,00
0
t)
FRANCE
CATTLEPIG POULTRY
0
1.000
2.000
3.000
4.000
5.000
6.000
7.000
2012 2013 2014 2015 2016 2012 2013 2014 2015 2016 2012 2013 2014 2015 2016
(*1
,00
0
t)
ITALY
CATTLE PIG POULTRY
0
1.000
2.000
3.000
4.000
5.000
6.000
2012 2013 2014 2015 2016 2012 2013 2014 2015 2016 2012 2013 2014 2015 2016
(*1
,00
0
t)
THE NETHERLANDS
CATTLE PIG POULTRY

38
EVOLUTION OF COMPOUND FEED PRODUCTION PER CATEGORY PER COUNTRY
0
500
1.000
1.500
2.000
2.500
3.000
3.500
4.000
2012 2013 2014 2015 2016 2012 2013 2014 2015 2016 2012 2013 2014 2015 2016
(*1
,00
0
t)
BELGIUM
CATTLE PIG POULTRY
0
1.000
2.000
3.000
4.000
5.000
6.000
7.000
8.000
2012 2013 2014 2015 2016 2012 2013 2014 2015 2016 2012 2013 2014 2015 2016
(*1
,00
0
t)
UNITED KINGDOM
CATTLE PIG POULTRY
0
400
800
1.200
1.600
2.000
2.400
2.800
2012 2013 2014 2015 2016 2012 2013 2014 2015 2016 2012 2013 2014 2015 2016
(*1
,00
0
t)
IRELAND
CATTLE PIG POULTRY
0
500
1000
1500
2000
2500
3000
2012 2013 2014 2015 2016 2012 2013 2014 2015 2016 2012 2013 2014 2015 2016
(*1
,00
0
t)
DENMARK
CATTLE PIG POULTRY

39
EVOLUTION OF COMPOUND FEED PRODUCTION PER CATEGORY PER COUNTRY
0
1.000
2.000
3.000
4.000
5.000
6.000
7.000
8.000
9.000
10.000
11.000
2012 2013 2014 2015 2016 2012 2013 2014 2015 2016 2012 2013 2014 2015 2016
(*1
,00
0
t)
SPAIN
CATTLE PIG POULTRY
0
200
400
600
800
1000
1200
1400
1600
2012 2013 2014 2015 2016 2012 2013 2014 2015 2016 2012 2013 2014 2015 2016
(*1
,00
0
t)
PORTUGAL
CATTLE PIG POULTRY
0
200
400
600
800
1000
2012 2013 2014 2015 2016 2012 2013 2014 2015 2016 2012 2013 2014 2015 2016
(*1
,00
0
t)
SWEDEN
CATTLE PIG POULTRY
0
200
400
600
800
2012 2013 2014 2015 2016 2012 2013 2014 2015 2016 2012 2013 2014 2015 2016
(*1
,00
0
t)
FINLAND
CATTLE PIG POULTRY

40
EVOLUTION OF COMPOUND FEED PRODUCTION PER CATEGORY PER COUNTRY
0
100
200
300
400
500
600
700
2012 2013 2014 2015 2016 2012 2013 2014 2015 2016 2012 2013 2014 2015 2016
(*1
,00
0
t)
AUSTRIA
CATTLE PIG POULTRY
0
200
400
600
800
1000
1200
2012 2013 2014 2015 2016 2012 2013 2014 2015 2016 2012 2013 2014 2015 2016
(*1
,00
0
t)
CZECH REPUBLIC
CATTLE PIG POULTRY
0
1000
2000
3000
4000
5000
6000
7000
2012 2013 2014 2015 2016 2012 2013 2014 2015 2016 2012 2013 2014 2015 2016
(*1
,00
0
t)
POLAND
CATTLE PIG POULTRY
0
200
400
600
800
1000
1200
1400
1600
1800
2012 2013 2014 2015 2016 2012 2013 2014 2015 2016 2012 2013 2014 2015 2016
(*1
,00
0
t)
HUNGARY
CATTLE PIG POULTRY

41
EVOLUTION OF COMPOUND FEED PRODUCTION PER CATEGORY PER COUNTRY
0
50
100
150
200
250
300
2012 2013 2014 2015 2016 2012 2013 2014 2015 2016 2012 2013 2014 2015 2016
(*1
,00
0
t)
SLOVAKIA
CATTLE PIG POULTRY
0
50
100
150
200
250
2012 2013 2014 2015 2016 2012 2013 2014 2015 2016 2012 2013 2014 2015 2016
(*1
,00
0
t)
SLOVENIA
CATTLE PIG POULTRY
0
100
200
300
400
500
600
700
2012 2013 2014 2015 2016 2012 2013 2014 2015 2016 2012 2013 2014 2015 2016
(*1
,00
0
t)
BULGARIA
CATTLE PIG POULTRY
0
200
400
600
800
1000
1200
1400
1600
1800
2000
2012 2013 2014 2015 2016 2012 2013 2014 2015 2016 2012 2013 2014 2015 2016
(*1
,00
0
t)
ROMANIA
CATTLE PIG POULTRY

42
EVOLUTION OF COMPOUND FEED PRODUCTION PER CATEGORY PER COUNTRY
0
30
60
90
120
2012 2013 2014 2015 2016 2012 2013 2014 2015 2016 2012 2013 2014 2015 2016
(*1
,00
0
t)
CYPRUS
CATTLE PIG POULTRY
0
50
100
150
200
250
300
350
2012 2013 2014 2015 2016 2012 2013 2014 2015 2016 2012 2013 2014 2015 2016
(*1
,00
0
t)
CROATIA
CATTLE PIG POULTRY
0
20
40
60
80
100
120
140
160
180
200
2012 2013 2014 2015 2016 2012 2013 2014 2015 2016 2012 2013 2014 2015 2016
(*1
,00
0
t)
LATVIA
CATTLE PIG POULTRY
0
40
80
120
160
200
240
280
320
2012 2013 2014 2015 2016 2012 2013 2014 2015 2016 2012 2013 2014 2015 2016
(*1
,00
0
t)
LITHUANIA
CATTLE PIG POULTRY

43
TAB. 11: INDUSTRIAL COMPOUND FEED PRODUCTION IN SOME
NON-EU EUROPEAN COUNTRIES
1,000 t
Cattle & calf feed Pig feed Poultry feed Other compounds Total
2014 2015 2016 %TAV 2014 2015 2016 %TAV 2014 2015 2016 %TAV 2014 2015 2016 %TAV 2014 2015 2016 %TAV 16/15 16/15 16/15 16/15 16/15
Turkey 9,440 9,197 10,114 10.0 0 0 0 : 7,132 9,109 8,309 -8.8 1,432 1,799 1,979 10.0 18,004 20,105 20,402 1.5
Serbia 153 187 221 18.2 312 335 400 19.4 372 345 378 9.6 42 31 38 22.6 879 898 1,037 15.5
Switzerland 523 515 504 -2.1 638 633 633 -1.3 364 369 370 0.3 44 38 48 26.3 1,569 1,552 1,555 0.0
Norway 997 1,016 1,005 -1.1 481 502 493 -1.8 457 422 447 5.9 1,767 1,767 1,728 -2.2 3,702 3,707 3,673 -0.9
Russia 2,060 1,900 2,000 5.3 7,815 8,500 9,300 9.4 13,044 14,000 14,100 0.7 94 300 400 33.3 23,013 24,800 25,800 4.0
Source: FEFAC

44
EU-28 (incl. EL)
159.5
Russia24.8
Ukraine5.2
Serbia1.0
Turkey20.4
Other non-EU12.6
Switzerland1.6
Norway3.7
Europe non-EU73.5
Compound feed production in Europe
in 2016 (in mio. t)
Source: FEFAC - Alltech
45
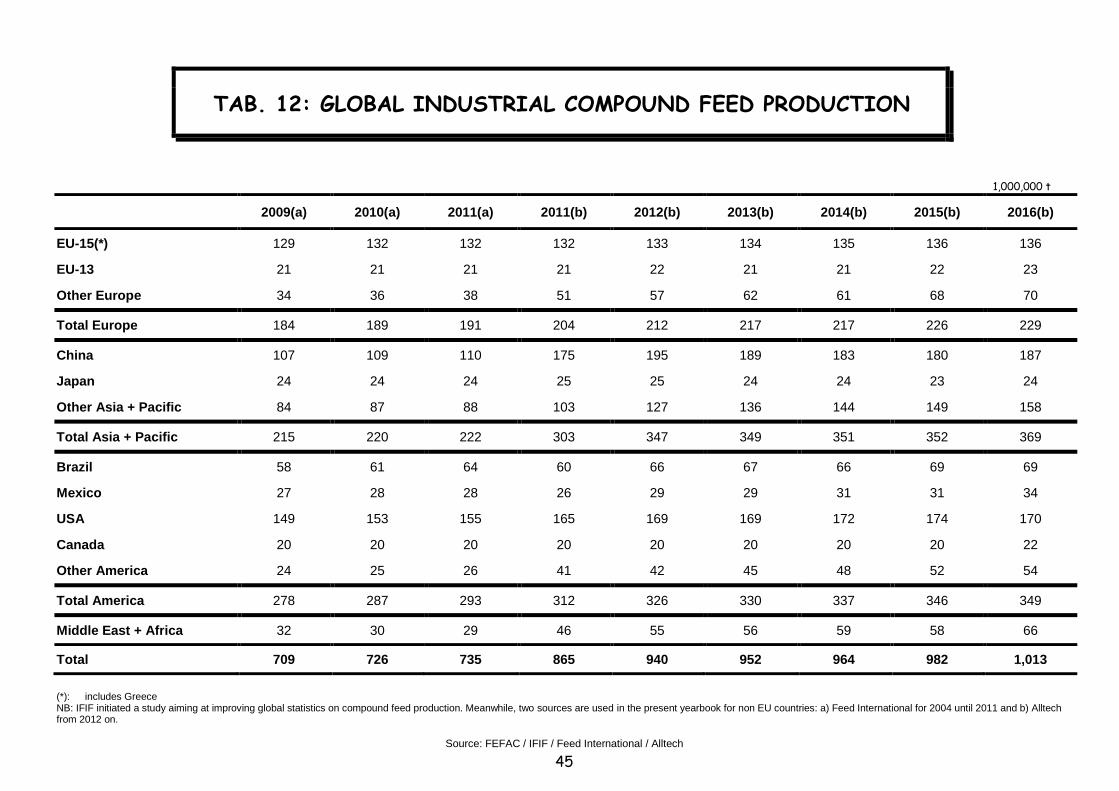
TAB. 12: GLOBAL INDUSTRIAL COMPOUND FEED PRODUCTION
1,000,000 t
2009(a) 2010(a) 2011(a) 2011(b) 2012(b) 2013(b) 2014(b) 2015(b) 2016(b)
EU-15(*) 129 132 132 132 133 134 135 136 136
EU-13 21 21 21 21 22 21 21 22 23
Other Europe 34 36 38 51 57 62 61 68 70
Total Europe 184 189 191 204 212 217 217 226 229
China 107 109 110 175 195 189 183 180 187
Japan 24 24 24 25 25 24 24 23 24
Other Asia + Pacific 84 87 88 103 127 136 144 149 158
Total Asia + Pacific 215 220 222 303 347 349 351 352 369
Brazil 58 61 64 60 66 67 66 69 69
Mexico 27 28 28 26 29 29 31 31 34
USA 149 153 155 165 169 169 172 174 170
Canada 20 20 20 20 20 20 20 20 22
Other America 24 25 26 41 42 45 48 52 54
Total America 278 287 293 312 326 330 337 346 349
Middle East + Africa 32 30 29 46 55 56 59 58 66
Total 709 726 735 865 940 952 964 982 1,013
(*): includes Greece NB: IFIF initiated a study aiming at improving global statistics on compound feed production. Meanwhile, two sources are used in the present yearbook for non EU countries: a) Feed International for 2004 until 2011 and b) Alltech from 2012 on.
Source: FEFAC / IFIF / Feed International / Alltech

46
EU-28 (incl. EL)159
Other Europe70
China187
Japan24Other Asia
158
Brazil69
Mexico34
USA170
Canada22
Other America54
Others66
Global compound feed production in 2016 (1,013 mio. t)
Source: FEFAC - Alltech

47
60
80
100
120
140
160
180
200
220
240
260
1999 2000 2001 2002 2003 2004 2005 2006 2007 2008 2009 2010 2011 2012 2013 2014 2015 2016
Evolution of global compound feed production
(Index 100 = 1999)
EU-28 Other Europe Brazil USA China
Source: FEFAC - Alltech - Feed International
48
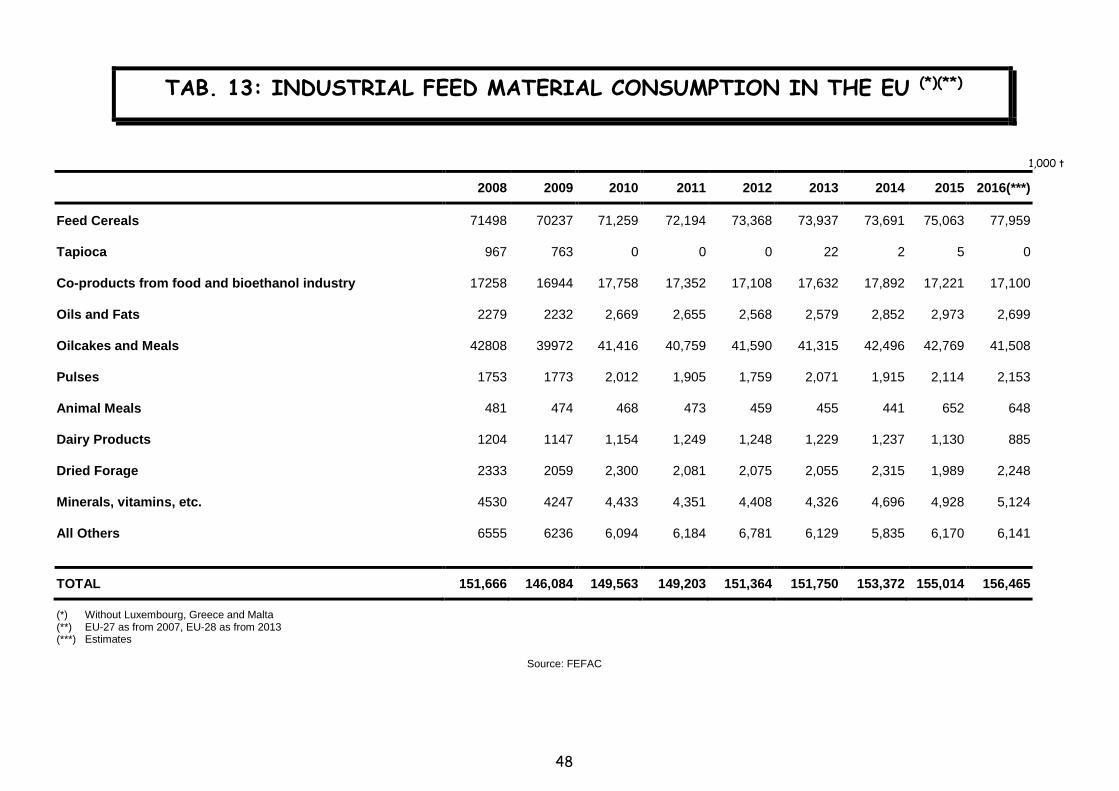
TAB. 13: INDUSTRIAL FEED MATERIAL CONSUMPTION IN THE EU (*)(**)
1,000 t
2008 2009 2010 2011 2012 2013 2014 2015 2016(***)
Feed Cereals 71498 70237 71,259 72,194 73,368 73,937 73,691 75,063 77,959
Tapioca 967 763 0 0 0 22 2 5 0
Co-products from food and bioethanol industry 17258 16944 17,758 17,352 17,108 17,632 17,892 17,221 17,100
Oils and Fats 2279 2232 2,669 2,655 2,568 2,579 2,852 2,973 2,699
Oilcakes and Meals 42808 39972 41,416 40,759 41,590 41,315 42,496 42,769 41,508
Pulses 1753 1773 2,012 1,905 1,759 2,071 1,915 2,114 2,153
Animal Meals 481 474 468 473 459 455 441 652 648
Dairy Products 1204 1147 1,154 1,249 1,248 1,229 1,237 1,130 885
Dried Forage 2333 2059 2,300 2,081 2,075 2,055 2,315 1,989 2,248
Minerals, vitamins, etc. 4530 4247 4,433 4,351 4,408 4,326 4,696 4,928 5,124
All Others 6555 6236 6,094 6,184 6,781 6,129 5,835 6,170 6,141
TOTAL 151,666 146,084 149,563 149,203 151,364 151,750 153,372 155,014 156,465
(*) Without Luxembourg, Greece and Malta (**) EU-27 as from 2007, EU-28 as from 2013 (***) Estimates
Source: FEFAC

49
Minerals, Additives & Vitamins
3%
Dairy Products1%
Feed cereals50%
Co-products from food and bioethanol industry
11%
Oils and Fats2%
Cakes and Meals27%
Pulses1%
Dried Forage1%
All Others4%
FEED MATERIAL CONSUMPTION BY THE EU-28 FEED INDUSTRY
IN 2016 (Excl. GREECE, MALTA AND LUXEMBOURG)

50
TAB. 14: IMPORTS OF FEED MATERIALS IN THE EU (*)
1,000 t
2010 2011 2012 2013 2014 2015 2016
Feed Cereals 6,500 8,350 10,150 12,450 11,500 10,700 11,900
Corn Gluten Feed 593 979 202 439 682 478 592
Maize Germ Meal 0 0 0 0 0 0 0
DDGS 543 714 219 485 644 633 808
Molasses 1,333 1,915 2,157 2,105 1,849 1,516 1,493
Dried Beet Pulp 551 706 770 772 728 996 1,032
Citrus pulp 942 676 621 487 323 339 174
Oilcakes and Meals 25,866 26,101 26,706 23,751 24,802 25,844 24,448
Fishmeal 429 355 466 330 372 279 284
Pulses 300 334 554 234 284 165 200
Tapioca 0 0 0 22 0 0 0
Miscellaneous 1,393 1,568 1,747 1,934 1,924 1,993 2,140
TOTAL 38,450 41,698 43,592 43,009 43,108 42,943 43,071
(*) EU-27 as from 2007, EU-28 as from 2013
Source: TOEPFER / EUROSTAT

51
Feed Cereals11.9
Corn Gluten Feed0.6
DDGS0.8
Molasses1.5
Citrus pellets0.2
Oilmeals24.4
Fishmeal0.3
Pulses0.2
Miscellaneous3.2
IMPORTS OF FEED MATERIALS IN THE EU-28 IN 2016
43 mio.t

52
TAB. 15: EU-28 BALANCE SHEET FOR PROTEIN RICH FEED MATERIALS IN 2016/2017
EU production
(mio. t)
EU total feed use
(mio.t)
EU feed use of EU origin
(mio. t)
Protein content (%)
EU total feed use (mio. t proteins)
EU feed use of EU origin
(mio. t proteins)
Self-sufficiency
(%)
CROPS
Thereof wheat
barley
maize
oilseeds
pulses
329.6
133.7
59.6
60.8
31.0
4.4
177.6
52.4
41.2
52.8
1.8
3.0
154.6
49.1
41.2
40.5
1.8
2.8
11.0
10.0
8.0
15.4-33.0
22.5-35.0
18.30
5.76
4.12
4.22
0.50
0.77
16.60
5.40
4.12
3.24
0.50
0.71
91
94
100
77
100
92
CO-PRODUCTS (***)
Thereof soyabean meal(*)
rapeseed meal
sunflower meal
44.8
1.6 (**)
10.9 (**)
3.9 (**)
84.1
29
13.2
7.7
44.6
1.5
10.4
3.6
43.0-62.5
33.0
28.0-35.0
25.57
13.37
4.36
2.43
9.77
0.67
3.43
1.02
38
5
79
42
OTHER (****) 2.3 2.2 0.92 0.86 93
Thereof fishmeal
skimmed milk powder
0.5
1.6
0.6
0.2
0.5
0.2
65.0
34.0
0.36
0.06
0.31
0.06
86
100
TOTAL 264.0 201.4 44.79 27.21 61
(*): including soy protein concentrate (**): from EU produced seeds (***): excluding on farm uses for co-products other than soy, rapeseed and sunflower meal (****): excluding on farm uses
Source: DG AGRI

53
wheat13%
barley9%
maize3%
other cereals7%
oilseeds1%
pulses2%
soybean meal30%
rapeseed meal10%
sunflower meals5%
other co-products12%
fishmeal1%
others1%
SOURCES OF PROTEINS FOR FEED USE IN EU-28 IN 2016/17
(expressed in "equivalent protein", excl. forages)
Source: DG AGRI

54
60 62 61 64 60 61
0
10
20
30
40
50
60
70
2011/2012 2012/2013 2013/2014 2014/2015 2015/2016 2016/2017
EU PROTEIN SUPPLY SELF SUFFICIENCY
Source: DG AGRI

55
MACRO ECONOMIC DATA ON THE
AGRICULTURAL PRODUCTION IN THE
EU AND ITS DISPOSAL

56
TAB. 16: BREAKDOWN OF AGRICULTURAL PRODUCTION IN THE EU-28
Value of final production at current basic prices and exchange rates
2011 2012 2013 2014 2015 2016
% mio. € % mio. € % mio. € % mio. € % mio. € % mio. €
Total crop production 52.6 213,046 51.5 215,113 51.4 220,062 50.5 213,631 51.7 215,443 51.8 210,480
Livestock 23.4 94,749 24.4 101,955 24.0 102,988 23.7 100,010 24.0 100,045 24.4 99,089
of which
cattle (including calves) 7.7 31,320 8.1 33,979 8.0 34,087 7.8 32,941 8.3 34,703 8.3 33,625
pigs 8.6 34,757 9.1 38,015 93.0 398,299 8.5 36,042 8.0 33,420 8.5 34,546
poultry 4.8 19,614 5.0 20,981 5.1 21,916 5.2 21,829 5.3 22,204 5.3 21,441
Livestock products 15.9 64,451 15.9 66,206 16.3 69,696 17.2 72,853 15.5 64,755 15.0 61,079
of which
milk 13.1 53,229 12.5 52,004 13.5 57,692 14.3 60,640 12.5 52,311 12.2 49,612
eggs 2.0 7,982 2.5 10,627 2.1 9,017 2.1 9,015 2.3 9,507 2.1 8,670
Total animal production 39.3 159,200 40.3 168,161 40.3 172,684 40.9 172,863 39.5 164,800 39.4 160,168
Miscellaneous 8.1 32,980 8.2 34,161 8.3 35,531 8.6 36,239 8.8 36,740 8.8 35,952
Total agricultural production 100.0 405,226 100.0 417,435 100.0 428,277 100.0 422,733 100.0 416,983 100.0 406,600
Source: EUROSTAT

57
Miscellaneous9%
Total crop production52%
Pigs9%
Poultry5%
Cattle (including calves)8%
Milk12%
Eggs2%
Other Animal Products3%
Total livestock production
39%
BREAKDOWN OF THE VALUE OF AGRICULTURAL PRODUCTION
IN THE EU-28 IN 2016
58
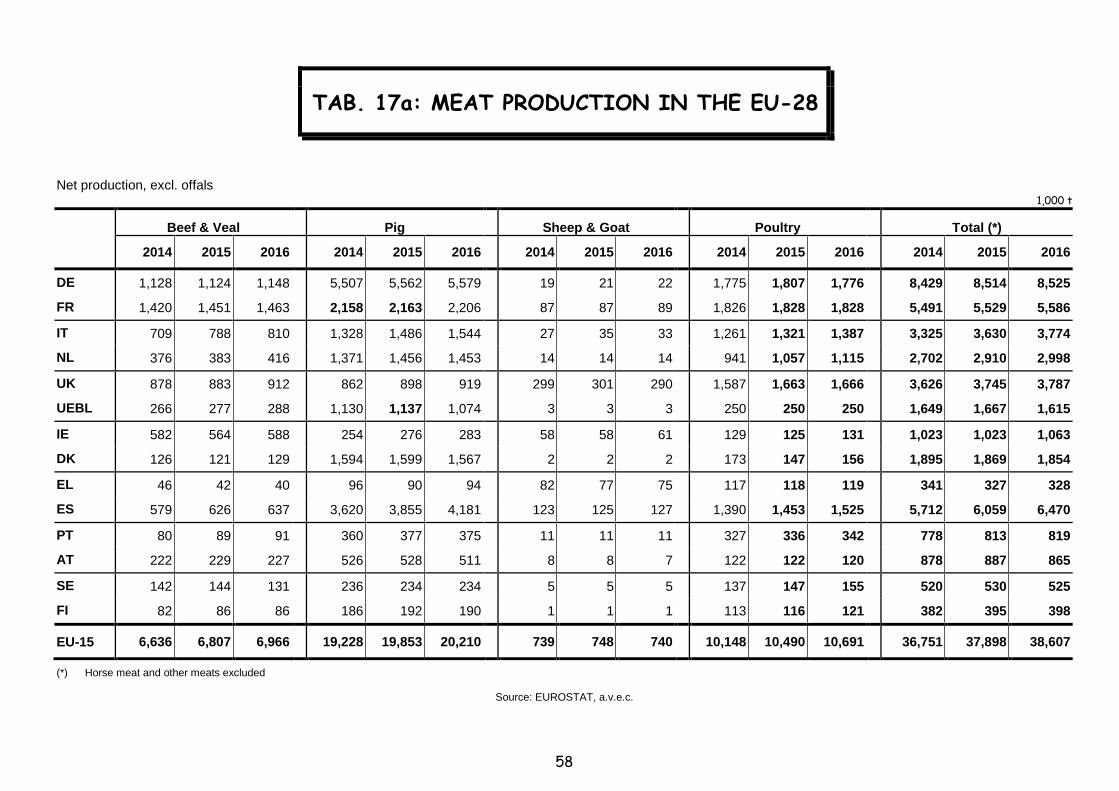
TAB. 17a: MEAT PRODUCTION IN THE EU-28
Net production, excl. offals 1,000 t
Beef & Veal
Pig
Sheep & Goat
Poultry
Total (*)
2014 2015 2016 2014 2015 2016 2014 2015 2016 2014 2015 2016 2014 2015 2016
DE 1,128 1,124 1,148 5,507 5,562 5,579 19 21 22 1,775 1,807 1,776 8,429 8,514 8,525
FR 1,420 1,451 1,463 2,158 2,163 2,206 87 87 89 1,826 1,828 1,828 5,491 5,529 5,586
IT 709 788 810 1,328 1,486 1,544 27 35 33 1,261 1,321 1,387 3,325 3,630 3,774
NL 376 383 416 1,371 1,456 1,453 14 14 14 941 1,057 1,115 2,702 2,910 2,998
UK 878 883 912 862 898 919 299 301 290 1,587 1,663 1,666 3,626 3,745 3,787
UEBL 266 277 288 1,130 1,137 1,074 3 3 3 250 250 250 1,649 1,667 1,615
IE 582 564 588 254 276 283 58 58 61 129 125 131 1,023 1,023 1,063
DK 126 121 129 1,594 1,599 1,567 2 2 2 173 147 156 1,895 1,869 1,854
EL 46 42 40 96 90 94 82 77 75 117 118 119 341 327 328
ES 579 626 637 3,620 3,855 4,181 123 125 127 1,390 1,453 1,525 5,712 6,059 6,470
PT 80 89 91 360 377 375 11 11 11 327 336 342 778 813 819
AT 222 229 227 526 528 511 8 8 7 122 122 120 878 887 865
SE 142 144 131 236 234 234 5 5 5 137 147 155 520 530 525
FI 82 86 86 186 192 190 1 1 1 113 116 121 382 395 398
EU-15 6,636 6,807 6,966 19,228 19,853 20,210 739 748 740 10,148 10,490 10,691 36,751 37,898 38,607
(*) Horse meat and other meats excluded
Source: EUROSTAT, a.v.e.c.

59
TAB. 17b: MEAT PRODUCTION IN THE EU-28
Net production, excl. offals
1,000 t
Beef & Veal
Pig
Sheep & Goat
Poultry
Total (*)
2014 2015 2016 2014 2015 2016 2014 2015 2016 2014 2015 2016 2014 2015 2016
CY 5 5 8 43 43 44 5 5 5 24 23 24 77 76 81
CZ 66 68 72 236 228 220 0 0 0 175 175 175 477 471 467
EE 8 10 9 41 42 43 0 0 0 18 18 16 67 70 68
HU 23 26 28 369 409 432 0 0 1 543 577 616 935 1,012 1,077
LV 17 17 18 28 29 31 0 0 0 27 27 27 72 73 76
LT 39 44 42 67 66 60 0 0 0 89 92 94 195 202 196
MT 1 1 1 6 6 5 0 0 0 4 4 4 11 11 10
PL 413 471 501 1,838 1,906 1,963 1 1 1 2,022 2,173 2,486 4,274 4,551 4,951
SK 9 8 8 34 45 48 1 1 1 77 78 78 121 132 135
SI 32 34 36 20 20 23 0 0 0 50 51 51 102 105 110
BU 5 5 7 54 61 66 6 6 6 100 102 102 165 174 181
RO 29 44 58 325 330 337 5 9 8 382 353 362 741 736 765
HR 44 42 44 69 73 80 1 1 1 68 83 81 182 199 206
EU-13 691 775 832 3,130 3,258 3,352 19 23 23 3,579 3,756 4,116 7,419 7,812 8,323
EU-28 7,327 7,582 7,798 22,358 23,111 23,562 758 771 763 13,727 14,246 14,807 44,170 45,710 46,930
(*) Horse meat and other meats excluded
Source: EUROSTAT, a.v.e.c.
60
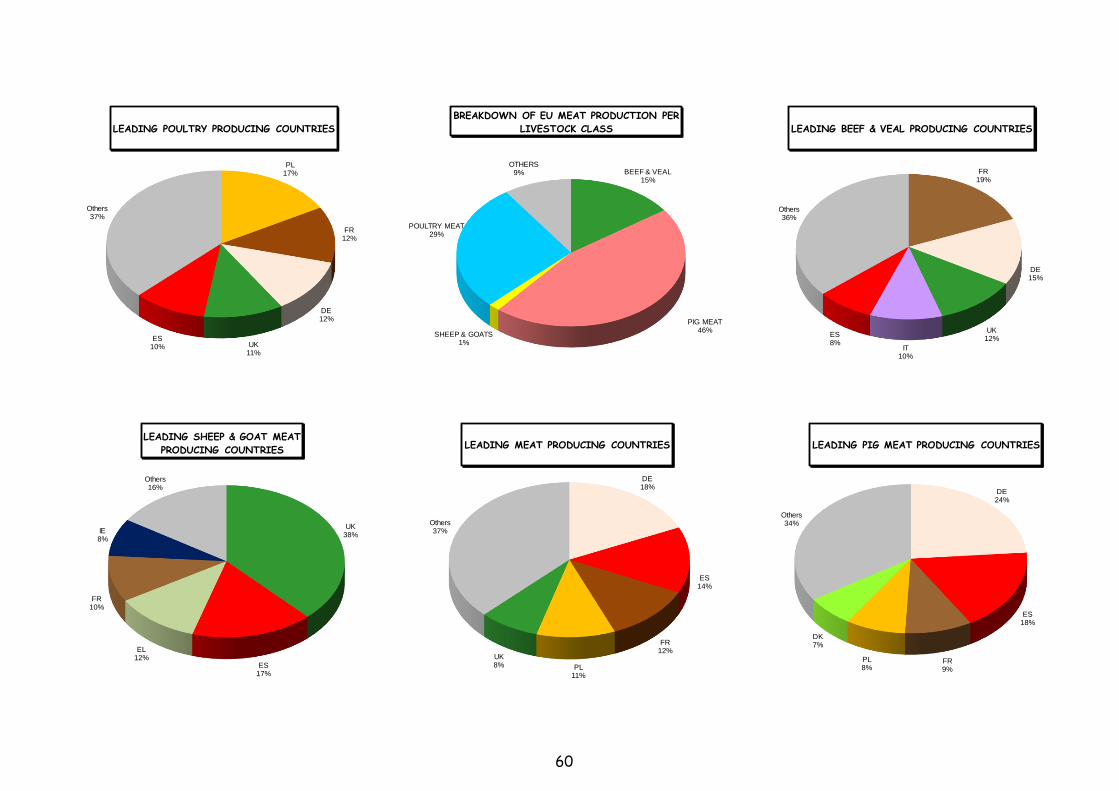
PL17%
FR12%
DE12%
UK11%
ES10%
Others37%
LEADING POULTRY PRODUCING COUNTRIES
BEEF & VEAL15%
PIG MEAT46%
SHEEP & GOATS1%
POULTRY MEAT29%
OTHERS9%
BREAKDOWN OF EU MEAT PRODUCTION PER
LIVESTOCK CLASS
FR19%
DE15%
UK12%
IT10%
ES8%
Others36%
LEADING BEEF & VEAL PRODUCING COUNTRIES
UK38%
ES17%
EL12%
FR10%
IE8%
Others16%
LEADING SHEEP & GOAT MEAT
PRODUCING COUNTRIES
DE18%
ES14%
FR12%
PL11%
UK8%
Others37%
LEADING MEAT PRODUCING COUNTRIES
DE24%
ES18%
FR9%
PL8%
DK7%
Others34%
LEADING PIG MEAT PRODUCING COUNTRIES

61
0
5
10
15
20
25
0
5
10
15
20
25
30
35
40
45
50
01 02 03 04 05 06 07 08 09 10 11 12 13 14 15 16
pe
r c
ate
go
ry,
in m
io.
t
tota
l m
ea
t, i
n m
io.
tGross meat production development
in the EU-28 per category
Total meat Beef & Veal Pig meat Poultry meat
Source: DG AGRI, a.v.e.c.
EU-15 from 1999 to 2003, EU-25 as from 2004 to 2006, EU-27as from 2007 to 2012, EU-28 from 2013

62
TAB. 18a: LIVESTOCK POPULATION IN THE EU-28
(December survey) 1,000 heads
Cattle thereof dairy cows Pigs Sheep and Goats
2014 2015 2016 2014 2015 2016 2014 2015 2016 2014 2015 2016
DE 12,742 12,635 12,467 4,296 4,285 4,218 28,339 27,652 27,376 1,718 1,690 1,713
FR 19,271 19,406 19,004 3,697 3,661 3,630 13,300 13,307 12,793 8,439 8,287 8,361
IT 6,125 6,156 6,160 2,069 2,057 2,060 8,676 8,675 8,478 8,103 8,110 8,311
NL 4,169 4,315 4,294 1,610 1,717 1,794 12,065 12,453 11,881 1,511 1,500 1,544
BE 2,477 2,503 2,501 519 529 531 6,350 6,364 6,177 156 156 137
LU 201 201 202 47 49 52 93 89 95 12 12 12
UK 9,693 9,816 9,806 1,883 1,918 1,898 4,510 4,422 4,538 22,787 23,204 23,923
IE 6,243 6,422 6,613 1,128 1,240 1,295 1,506 1,475 1,528 3,325 3,325 3,438
DK 1,553 1,566 1,554 547 570 565 12,709 12,702 12,281 89 89 89
EL 659 582 554 135 111 106 1,046 877 743 13,326 12,869 12,627
ES 6,079 6,183 6,318 845 844 834 26,568 28,367 29,232 18,136 18,827 19,051
PT 1,549 1,606 1,635 234 243 239 2,127 2,247 2,151 2,415 2,415 2,415
AT 1,961 1,958 1,954 538 534 540 2,868 2,845 2,793 420 430 461
SE 1,436 1,428 1,436 344 337 326 1,458 1,435 1,471 589 595 578
FI 907 903 887 283 282 275 1,223 1,239 1,197 98 98 98
EU-15 75,066 75,681 75,386 18,176 18,377 18,363 122,837 124,149 122,733 81,123 81,608 82,759
Source: EUROSTAT

63
TAB. 18b: LIVESTOCK POPULATION IN THE EU-28
(December survey) 1,000 heads
Cattle thereof dairy cows Pigs Sheep and Goats
2014 2015 2016 2014 2015 2016 2014 2015 2016 2014 2015 2016
CY 60 59 63 25 26 28 342 328 353 562 569 571
CZ 1,373 1,366 1,340 372 369 367 1,607 1,555 1,479 207 207 207
EE 265 256 248 96 91 86 358 305 266 58 58 58
HU 802 821 852 255 251 244 3,136 3,124 2,907 1,255 1,262 1,222
LV 422 419 412 166 162 154 349 334 336 105 115 120
LT 737 723 695 314 301 286 714 688 664 137 161 177
MT 15 15 14 7 6 7 47 44 41 15 16 16
PL 5,660 5,763 5,970 2,248 2,134 2,129 11,266 10,590 11,107 300 300 300
SK 466 457 446 143 139 133 642 633 586 426 418 405
SI 468 484 489 108 113 108 281 271 266 169 169 169
BU 562 561 570 302 283 279 553 600 616 1,628 1,609 1,598
RO 2,069 2,092 2,050 1,188 1,191 1,193 5,042 4,927 4,708 10,935 11,250 11,359
HR 441 455 462 159 152 147 1,156 1,167 1,163 666 670 694
EU-13 13,340 13,471 13,611 5,383 5,218 5,161 25,493 24,566 24,491 16,464 16,803 16,896
EU-28 88,406 89,152 88,997 23,559 23,595 23,524 148,330 148,716 147,225 97,587 98,410 99,654
Source: EUROSTAT

64
20.000
40.000
60.000
80.000
100.000
120.000
140.000
160.000
180.000
2004 2005 2006 2007 2008 2009 2010 2011 2012 2013 2014 2015 2016
(*1 0
00 h
ea
ds)
(*1,0
00 h
ea
ds)
EVOLUTION OF EU LIVESTOCK POPULATION
EU-25 from 2004, EU-27 from 2007, EU-28 from 2013

65
TAB. 19: SELF-SUFFICIENCY
A. VEGETABLE PRODUCTS 2010/11 2011/12 2012/13 2013/14 2014/15 2015/16 2016/17
Soft wheat 112 108 115 127 129 127 116
Barley 98 107 110 124 126 128 113
Maize 89 102 82 87 103 81 88
Cereals total 101 105 103 112 118 111 105
Oilseed meals : 52 56 57 58 57 58
White sugar 79 83 84 80 100 81 91
B. ANIMAL PRODUCTS 2010 2011 2012 2013 2014 2015 2016
Skimmed milk powder 141 159 164 159 202 208 203
Cheese 107 106.9 108 108 108 107 107
Butter 102 106 106 104 107 108 109
Beef and veal 100 102 101 100 100 101 102
Pig meat 109 111 111 111 109 110 113
Poultry 103 104 104 104 104 104 104
Eggs 102 103 103 104 104 105 105
(*) EU-27 as from 2007/08 (2007) / EU-28 from 2012/13 (2013)
Source: EUROSTAT, a.v.e.c.

66
0 50 100 150 200 250
Oilseed meals
Sugar
Beef and veal
Poultry
Eggs
Cereals
Cheese
Butter
Pork
Skimmed milkpowder
EU-28 SELF-SUFFICIENCY
FOR SOME EU AGRICULTURAL PRODUCTS IN 2016
in %