the feed chain in action - fefac
TRANSCRIPT

The Feed Chain in Action
Impressum
FEFAC aisblRue de la Loi, 223 Bte 31040 Bruxelles (Belgique)
Enterprise n° 0408 295 071 European Commission Register of Interest RepresentativesID Number 77105321408-83
LayoutIndigo, St.Vith
PrintPro D&P St.Vith
Fotos© Fotolia © Communautés Européennes 2009
Disclaimer
© 2013 – FEFACThe information contained in this brochure is for general information purposes only. The information is provided by FEFAC and while we endeavour to keep the information up to date and correct, we make no representations or warranties of any kind, express or implied, about the completeness, accuracy, reliability, suitability or availability with respect to the bro-chure or the information, products, services, or related graphics contained in the brochure for any purpose. Any reliance you place on such information is therefore strictly at your own risk.No part of this brochure may be reproduced or transmitted in any form or by any means, electronic or mechanical, includ-ing photo-copying, recording or by any information storage and retrieval system, without securing the written permission of FEFAC, except for the inclusion of brief, clearly cited quotations in a review or article.

3
FEFAC Organisation Chart 4
Foreword 5
National Associations joining FEFAC 6
The market of feed materials & EU framework polices 7
Renewable Energy Directive 9
The non-GMO feed market 11
Catalogue of Feed Materials 13
Vision & the Strategic Research Agenda 15
Feed hygiene and contaminants 17
Statistics 2012 19
Food Waste 23
Responsible Soy 25
EFMC 27
Antimicrobial resistance 29
Medicated feed 31
FEFAC and the European Institutions 33
FEFAC and the other chain partners 35
FEFAC and the International Organisations 37
Praesidium Members, Committee Chairmen and Secretariat 39
Table of contents
Member Association Posters
VFÖ Austria 8APFACA/BEMEFA Belgium 8CFIA Croatia 10CAFM Cyprus 10CMSOZZN Czech Republic 12DAKOFO Denmark 12FFDIF Finland 14SNIA France 14DVT Germany 16SEVIZ Greece 16HGFA Hungary 18IGFA Ireland 18ASSALZOO Italy 24LGPA Lithuania 24NEVEDI Netherlands 26FHL Norway 26IZBA Poland 28IACA Portugal 28RUFM Russia 30SFMA Serbia 30AFPWTC Slovakia 32GZS Slovenia 32CESFAC Spain 34FS Sweden 34LANTMÄNNEN Sweden 36VSF Switzerland 36TÜRKIYEM-BIR Turkey 38AIC United Kingdom 38

4
Praesidium
Council
Secretariat
SpecialisedCommittees• Milk Replacers• Premix & Mineral Feed• Fish Feed
Horizontal Committees• Animal Nutrition• Industrial Compound Feed Production• EFMC
Directors’General College
Ad hocWorking Groups& Issue Teams
FEFAC’s mission is to
represent, defend and promote the interests of the European compound
feed industry to the European Institutions;
lobby for a legislative framework and its implementation, without
discrimination in EU Member States so as to maximise market opportunities for EU compound feed companies;
safeguard conditions of free access to raw materials, the proper functioning
of their markets and the definition of their quality;
develop professional rules and good manufacturing practices that
ensure the quality and the safety of compound feed;
encourage the sustainable development of animal productions responding to the
market requirements, so as to maximise market opportunities for EU compound feed companies.
encourage the development of precompetitive European feed-related Research
& Development projects seeking to enhance the EU feed & livestock sectors competitiveness and capacity to innovate in and/or transfer science and technology based solutions to improve the sustainability of resource efficient livestock production systems.

5
Foreword Towards a sustainable feed industry
I would like to outline in my foreword how we see the way forward for a sustainable feed industry, influenced by the current challenges we are facing in Europe. In order for the global feed industry to continue on the path of increased sustainable production and sustainable competitiveness in the medium and long term, I have identified four pillars which I believe we should build the development of our industry on: i) a safe feed supply, ii) competitive feed and livestock industries, iii) a resource efficient feed industry, iv) a responsible feed chain.A safe supply is the foundation for the feed industry. Feed safety is of course not negotiable and therefore belongs to the pre-competitive area. It is a pre-requisite to consumers, which is absolutely legitimate. One of the common key tasks for FEFAC is to promote safe and innovative processing technologies, and to work to help set stringent and effective international regulatory standards.The feed industry is a vital link within the food chain. We are the clients of arable farmers as well as the suppliers to livestock farmers,
meaning we are the one linking vegetable and animal production. In the chapter on access to feed materials, which you will find on the next page, we outline the challenges and possible solutions for a competitive feed industry in an economic perspective. With its buying capacities, its ability to use risk management instruments, but also with its nutritional and formulation knowledge, the feed industry plays a price-buffer role, to the benefit of livestock farmers. With a growing demand and limited resources, the equation is in theory simple to solve: we have to produce more with less. Fortunately, the feed industry has a history of proven expertise in resource efficiency. Since its beginning, the added value of the feed industry lies in its nutritional know-how, which enables to produce balanced and cost effective diets for animals. It is nutritional knowledge which enables us to valorise surplus food and food losses and if you take into account many other feed ingredients, the feed and livestock industries create great value by turning non-human
edible resources into good quality food.Sustainability is not just limited to environmental impacts, as the obligations of a responsible feed industry should also cover the responsible supply and sourcing of raw materials. FEFAC believes that all the raw materials should be produced responsibly according to internationally agreed principles. It is the role of the feed industry, to contribute to the development of guiding principles for sustainable raw materials in a multistakeholder co-operation. Examples are FEFAC’s participation in the cultivation of responsible soy and the establishment of global LCA feed guidelines, both included in this report.FEFAC considers that the best way towards a sustainable feed industry is to support the continuous advances in improving livestock production, from a safety, environmental and economic point of view. I believe this can only be achieved via a sustainable competitiveness of our industry and a sustainable increase in production. The concept of intensive livestock
farming and intensive agriculture is evolving towards support for an ecologically intensive approach delivering healthy, safe and affordable products which reduces and mitigates environmental impacts. I am confident, as far as sustainability is concerned, that our FEFAC action plan will stay its course and will meet the needs of our future generations of consumers for responsibly produced products of animal origin and societal demands laid down in the new EU policy framework on sustainable production and consumption, the single market for green products and the CAP reform.
Patrick Vanden AvenneFEFAC President

6
National Associations joining FEFAC
Serbia
(observer as from ...)
Active Members
VFÖ Austria 1995 (1964)APFACA/BEMEFA Belgium 1959CFA Cyprus 2004 (2003)CMSOZZN Czech Republic 2004 (2000)DAKOFO Denmark 1973FFDIF Finland 1995 (1993)SNIA France 1959DVT Germany 1959SEVIZ Greece 1989HGFA Hungary 2012ASSALZOO Italy 1959IGFA Ireland 1973LGPA Lithuania 2005NEVEDI The Netherlands 1959IZP Poland 2004 (2001)IACA Portugal 1986 (1976)AFPWTC Slovakia 2004 (2003)GZS Slovenia 2004CESFAC Spain 1986FS Sweden 1995LANTMÄNNEN Sweden 1995AIC United Kingdom 1973
Potential Active Members
BulgariaEstonia LatviaMaltaRomania
Observer Members
CFIA Croatia 2008RUFM Russia 2010SFMA Serbia 2009TURKIYEM Turkey 2005
Associate Members
EMFEMA 2003FHL Norway 2003VSF Switzerland 1966
Andorra
Luxembourg
Latvia
Serbia
France
Spain
Turkey
Austria
Bel.
Norway
Sweden Finland
Poland
CzechRepublic
Germany
Romania
Lithuania
Estonia
Russia
Russia
Portugal
Dk.
Greece
Bulgaria
SloveniaCroatia
Italy
Ireland
Slovakia
Hungary
Malta
UnitedKingdom
Nl.
Switz.
Cyprus
Situation on 1 January 2013
7
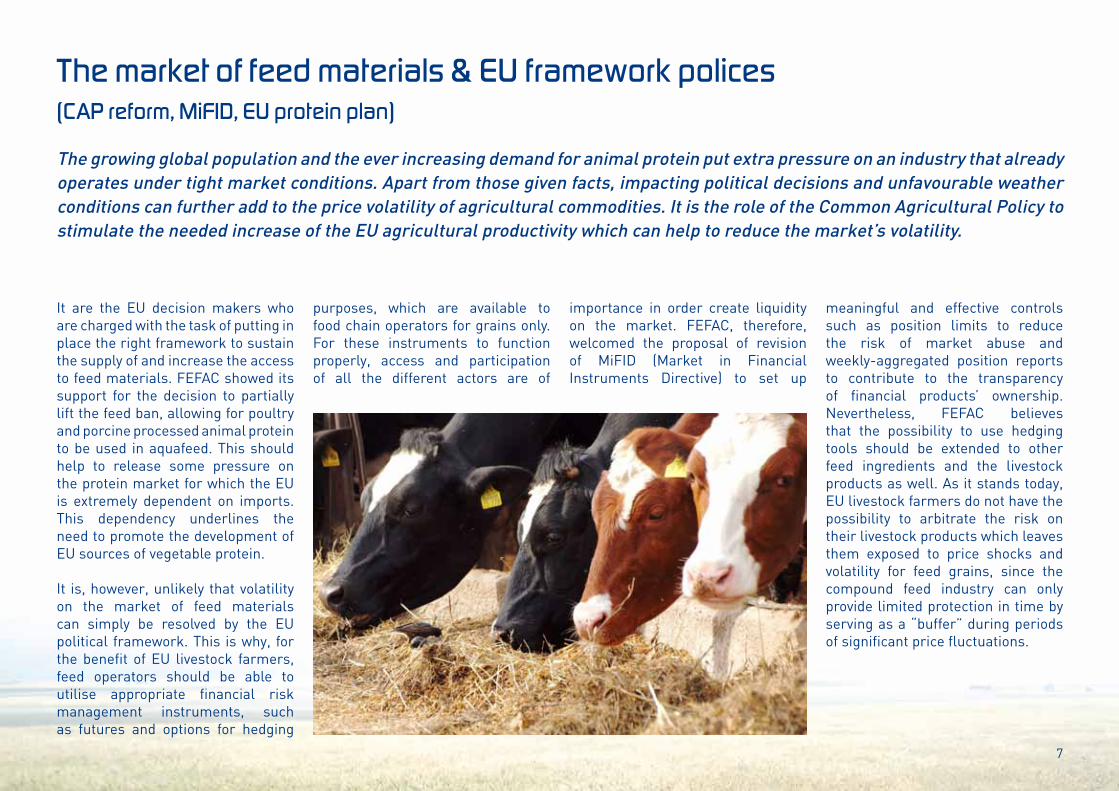
The market of feed materials & EU framework polices (CAP reform, MiFID, EU protein plan)
It are the EU decision makers who are charged with the task of putting in place the right framework to sustain the supply of and increase the access to feed materials. FEFAC showed its support for the decision to partially lift the feed ban, allowing for poultry and porcine processed animal protein to be used in aquafeed. This should help to release some pressure on the protein market for which the EU is extremely dependent on imports. This dependency underlines the need to promote the development of EU sources of vegetable protein.
It is, however, unlikely that volatility on the market of feed materials can simply be resolved by the EU political framework. This is why, for the benefit of EU livestock farmers, feed operators should be able to utilise appropriate financial risk management instruments, such as futures and options for hedging
purposes, which are available to food chain operators for grains only. For these instruments to function properly, access and participation of all the different actors are of
importance in order create liquidity on the market. FEFAC, therefore, welcomed the proposal of revision of MiFID (Market in Financial Instruments Directive) to set up
meaningful and effective controls such as position limits to reduce the risk of market abuse and weekly-aggregated position reports to contribute to the transparency of financial products’ ownership. Nevertheless, FEFAC believes that the possibility to use hedging tools should be extended to other feed ingredients and the livestock products as well. As it stands today, EU livestock farmers do not have the possibility to arbitrate the risk on their livestock products which leaves them exposed to price shocks and volatility for feed grains, since the compound feed industry can only provide limited protection in time by serving as a “buffer” during periods of significant price fluctuations.
The growing global population and the ever increasing demand for animal protein put extra pressure on an industry that already operates under tight market conditions. Apart from those given facts, impacting political decisions and unfavourable weather conditions can further add to the price volatility of agricultural commodities. It is the role of the Common Agricultural Policy to stimulate the needed increase of the EU agricultural productivity which can help to reduce the market’s volatility.

88
National industrial compound feed production by categories
Evolution of national industrial compound feed production
2012
Year of foundation: 1995
Affiliated feed production 2012: 769 000 t
450 000 t280 000 t495 000 t225 000 t
1 450 000 t
1 956 000 523 000
2 983 000 438 000
Members Total: 97
VFÖ
AU
STRI
A
VERBAND DER FUTTERMITTELINDUSTRIEÖSTERREICHS
ÖSTERREICH
National compound feed production
Livestock population (heads)
CattlePigsPoultryOthersTotal
CattleThereof dairy cowsPigsSheep & goats
925 000 t*2 896 000 t*
66.3 kg/capita*
Livestock production
Meat consumption
MeatCow milk collected
* data of 2011
Others
Poultry
Pigs
Cattle
(*1.
000t
)
0
200
400
600
1.000
800
1.200
1.400
1.600
1992 1994 1996 1998 2000 2002 2004 2006 2008 2010 2012
Cattle32%
Others14%
Pigs19%
Poultry35%
National industrial compound feed production by categories
Evolution of national industrial compound feed production
2012
Year of foundation: 1944
Affiliated feed production 2012:6 547 000 t
Members Total: 161thereofPremix: 7Compound feed: 154
BELGIQUE/BELGIË/BELGIEN BE
LGIU
M
ASSOCIATION PROFESSIONELLE DES FABRICANTSD’ALIMENTS COMPOSÉS POUR ANIMAUX A.S.B.L.
1 253 000 t3 683 000 t1 391 000 t
220 000 t6 547 000 t
2 438 000504 000
6 448 000120 000
85.3 kg/capita*
National compound feed production
Livestock population (heads)
Livestock production
Meat consumption
CattlePigsPoultryOthersTotal
CattleThereof dairy cowsPigsSheep & goats
APFACA
1 545 000 t*3 101 000 t*
MeatCow milk collected
Others
Poultry
Pigs
Cattle
(*1.
000t
)
0
1.000
2.000
3.000
4.000
5.000
6.000
7.000
1989 1991 1993 1995 1997 1999 2001 2003 2005 2007 2009 2011
* data of 2011
Cattle19%
Others4%
Pigs56%
Poultry21%
9
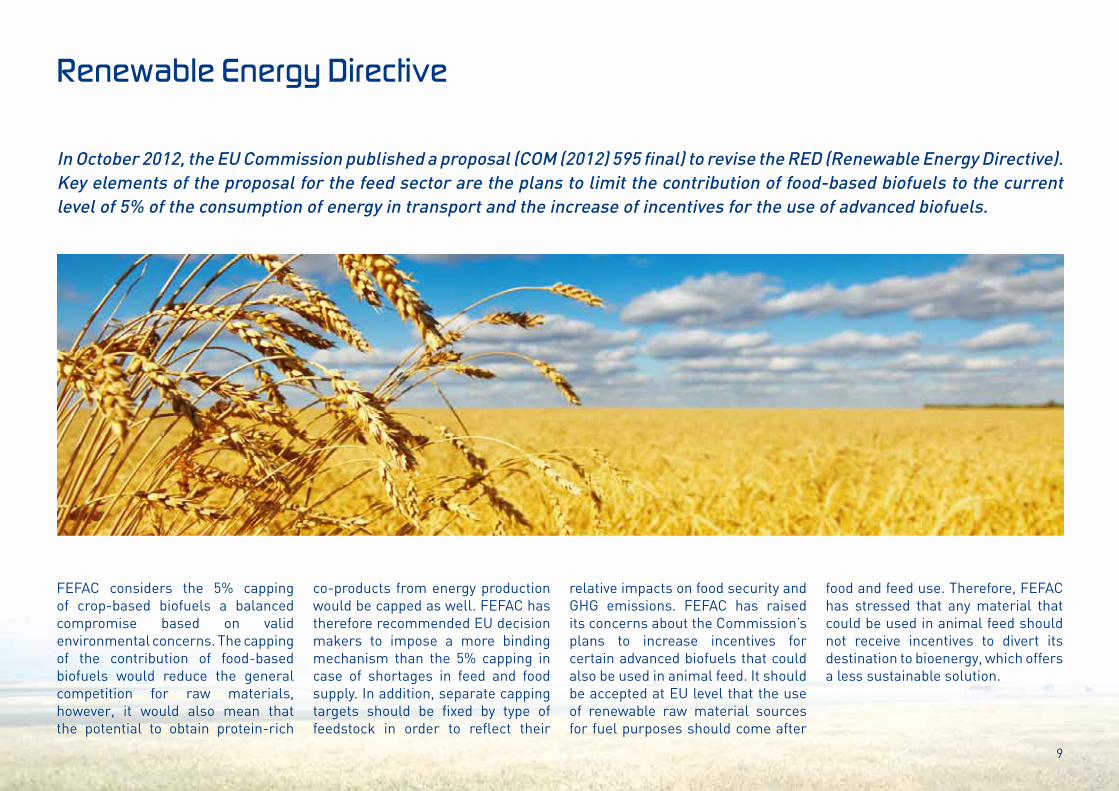
Renewable Energy Directive
FEFAC considers the 5% capping of crop-based biofuels a balanced compromise based on valid environmental concerns. The capping of the contribution of food-based biofuels would reduce the general competition for raw materials, however, it would also mean that the potential to obtain protein-rich
co-products from energy production would be capped as well. FEFAC has therefore recommended EU decision makers to impose a more binding mechanism than the 5% capping in case of shortages in feed and food supply. In addition, separate capping targets should be fixed by type of feedstock in order to reflect their
relative impacts on food security and GHG emissions. FEFAC has raised its concerns about the Commission’s plans to increase incentives for certain advanced biofuels that could also be used in animal feed. It should be accepted at EU level that the use of renewable raw material sources for fuel purposes should come after
food and feed use. Therefore, FEFAC has stressed that any material that could be used in animal feed should not receive incentives to divert its destination to bioenergy, which offers a less sustainable solution.
In October 2012, the EU Commission published a proposal (COM (2012) 595 final) to revise the RED (Renewable Energy Directive). Key elements of the proposal for the feed sector are the plans to limit the contribution of food-based biofuels to the current level of 5% of the consumption of energy in transport and the increase of incentives for the use of advanced biofuels.

10
National industrial compound feed production by categories
Evolution of national industrial compound feed production
2012
Year of foundation: 1994
Affiliated feed production 2012:642 000 t
Members Total: 124thereofPremix: 12Compound feed: 66Feed additives: 4Other (incl. non feed): 15
CROA
TIA
GRUPACIJA INDUSTRIJE STOCNE HRANE
HRVATSKA
120 000 t229 000 t276 000 t
10 000 t635 000 t
452 000180 000
1 100 000751 000
386 000 t*785 000 t*
64.1 kg/capita*
National compound feed production
Livestock population (heads)
Livestock production
Meat consumption
CattlePigsPoultryOthersTotal
CattleThereof dairy cowsPigsSheep & goats
MeatCow milk collected
CFIA
Others2% Cattle
19%
Pigs36%
Poultry43%
Others
Poultry
Pigs
Cattle
(*1.
000t
)
0
100
300
200
400
500
700
600
2003 2004 2005 2006 2007 2008 2008 2010 2011 2012
* data of 2011
National industrial compound feed production by categories
Evolution of national industrial compound feed production
2012
Year of foundation: 1998
Affiliated feed production 2012:185 000 t
Members Total: 27thereofPremix: 3Compound feed: 22Other (incl. non feed): 4
CYPR
US
CYPRUS ASSOCIATION OF FEED MANUFACTURERS
CYPRUS
117 000 t37 000 t50 000 t
104 000 t308 000 t
57 00024 000
394 000470 000
90 000 t150 000 t
National compound feed production
Livestock population (heads)
Livestock production
CattlePigsPoultryOthersTotal
CattleThereof dairy cowsPigsSheep & goats
MeatCow milk collected
CAFM
Cattle38%
Others34%
Pigs12%
Poultry16%
Others
Poultry
Pigs
Cattle
(*1.
000t
)
0
150
100
50
200
250
300
350
1999 2000 2001 2002 2003 2004 2005 2006 2009 2010 20112007 2008 2012

11
The non-GMO feed market
FEFAC members have always offered choice to customers and consumers by producing non-GMO compound feed, responding to market demands. However, the ever increasing embracement of GMO production outside the EU due to scientific and economic developments will inevitably have consequences for the competitiveness of the EU livestock industry using non-GMO. For its protein supply in animal feed, the EU is highly dependent on imports. Soya, the main source of this protein supply, is estimated to be produced as GMO in approximately 90% of the global production. Consequently, supplying non-GMO compound feed becomes more complex and above all more expensive due to the extra costs of analysis and dedicated supply chain facilities such as silos and transport equipment.FEFAC calls on EU decision makers to take a realistic standpoint. Independent
risk assessment bodies including EFSA, the European Food Safety Authority, have declared the overall use of tested GMO plants safe for food and feed use. In addition, due to growing global acreage of GM crops, a “zero percent” requirement for absence of traces in non-GM crops simply does not exist because of technically unavoidable carry-over effects in the production and trade of these crops. The time lag in approvals of newly developed GMO crops negatively affects the general EU livestock competitiveness, as it reduces the accessibility to the market of protein-rich feed materials, to which the EU livestock sector is dependent on imports for more than 70% of its requirements. Furthermore, the increased resistance of GM crops against viruses and pests offers indirect benefits for animal health, as can be seen with the current aflatoxin contamination of non-GMO feed maize in South and South-eastern Europe.
The non-GMO compound feed market in the EU represents less than 15% of the total compound feed market, with great variations between countries. Looking at the market shares of livestock specifically, the main driver for non-GMO compound feed is the poultry sector (17%), followed by the cattle sector (9%) and the pig sector (2%). Supplying this niche market with limited growth potential comes with rising costs and challenges, which calls for a realistic market assessment.
Market share of livestock specific percentages of non-gmo in compound feed (Source: FEFAC)
poultry pigs cattle
restnon-GM
0 %
10 %
20 %
30 %
40 %
50 %
60 %
70 %
80 %
90 %
100 %

12
National industrial compound feed production by categories
Evolution of national industrial compound feed production
2012
Year of foundation: 1991
Affiliated feed production 2012:1 583 000 t
Members Total: 43thereofPremix: 6Compound feed: 17Other (incl. non feed): 20 CZ
ECH
REP
UB
LIC
BOHEMIAN - MORAVIAN CONFEDERATION OFAGRICULTURAL SUPPLY & PURCHASE ORGANIZATIONS
ÈESKÁ REPUBLIKA
427 000 t735 000 t853 000 t285 000 t
2 300 000 t
1 354 000551 000
1 579 000221 000
458 000 t2 382 000 t
78.6 kg/capita
National compound feed production
Livestock population (heads)
Livestock production
Meat consumption
CattlePigsPoultryOthersTotal
CattleThereof dairy cowsPigsSheep & goats
MeatCow milk collected
CMSOZZN/BMCASPO
Cattle19%
Others12%
Pigs32%
Poultry37%
Others
Poultry
Pigs
Cattle
(*1.
000t
)
0
1.000
500
1.500
2.000
2.500
3.000
3.500
4.000
1997 1999 2001 2003 2005 2007 2009 2011
National industrial compound feed production by categories
Evolution of national industrial compound feed production
2012
Year of foundation: 1974
Affiliated feed production 2011:3 790 000 t
Members Total: 39thereofPremix: 2Compound feed: 16Other (incl. non feed): 21
DEN
MA
RKTHE DANISH GRAIN AND FEEDTRADE ASSOCIATION
KONGERIGETDANMARK
918 000 t2 649 000 t
548 000 t170 000 t
4 285 000 t
1 607 000579 000
12 310 000230 000
2 338 000 t*4 800 000 t*
83.6 kg/capita*
National compound feed production
Livestock population (heads)
Livestock production
Meat consumption
CattlePigsPoultryOthersTotal
CattleThereof dairy cowsPigsSheep & goats
MeatCow milk collected
DAKOFO
Cattle21%
Others4%
Pigs62%
Poultry13%
Others
Poultry
Pigs
Cattle
(*1.
000t
)
0
1.000
3.000
2.000
4.000
6.000
5.000
7.000
1989 1991 1993 1995 1997 1999 2001 2003 2005 2007 2009 2011
* data of 2011
dakofo

13
Catalogue of Feed Materials
FEFAC has taken a lead role since 2008 with the upgrade of the EU Catalogue of feed materials and is determined to maintain the proactive attitude to ensure updates are carried out on a regular basis. FEFAC, together with 39 other EU organisations that represent various
parts of the feed industry such as farmers, feed manufacturers and feed material suppliers, invested time and resources to submit a proposal for an update of the Catalogue. The content of the Catalogue was intensively debated with the EU authorities, who have the final say on the publication.
In January 2013, the EU Commission published the second update of the EU Catalogue of feed materials (Regulation (EU) No 68/2013), containing over 600 feed materials and 69 processing aids descriptions and definitions. This was the result of the ‘co-regulation’ exercise by EU organisations of the feed chain and EU policy makers, proving that the combined effort of industry and authorities can lead to more transparency in the market place.
The most significant change in the last update is the establishment of a maximum content for certain chemical impurities, laying down standards that have to be respected for the benefit of fair trade for all feed chain partners. Besides being a professional tool, the catalogue
also gives consumers, citizens, policy makers and basically anyone interested the chance to view detailed descriptions of feed materials and manufacturing processes that are used in livestock farming, thereby adding to the overall market transparency.

14
National industrial compound feed production by categories
Evolution of national industrial compound feed production
2012
Year of foundation: 1968
Affiliated feed production 2012:1 061 000 t
FIN
LAN
D
FINNISH FOOD & DRINK INDUSTRIES’ FEDERATION
SUOMEN TASAVALTA
662 000 t309 000 t317 000 t106 000 t
1 394 000 t
901 000280 000
1 271 000100 000
379 000 t*2 255 000 t*
National compound feed production
Livestock population (heads)
Livestock production
CattlePigsPoultryOthersTotal
CattleThereof dairy cowsPigsSheep & goats
MeatCow milk collected
FFDIF
Cattle47%
Others8%
Pigs22%
Poultry23%
Others
Poultry
Pigs
Cattle
(*1.
000t
)
0
200
400
600
1.000
800
1.200
1.400
1.600
1992 1994 1996 1998 2000 2002 2004 2006 2008 2010 2012
* data of 2011
National industrial compound feed production by categories
Evolution of national industrial compound feed production
2012
Year of foundation: 1971
Affi liated feed production 2012:7 800 000 t
Members Total: 156thereofPremix: 4Compound feed: 131Feed additives: 6Other (incl. non feed): 15
FRA
NCE
SYNDICAT NATIONAL DE L‘INDUSTRIEDE LA NUTRITION ANIMALE
FRANCE
1989 1991 1993 1995 1997 1999 2001 2003 2005 2007 2009 20110
5.000
10.000
15.000
20.000
25.000
Others
Poultry
Pigs
Cattle
(*1.
000t
)
5 211 000 t5 514 000 t8 572 000 t1 845 000 t
21 146 000 t
19 052 0003 536 000
13 778 0008 900 000
5 817 000 t24 452 000 t
88 kg/capita
National compound feed production
Livestock population (heads)
Livestock production
Meat consumption
CattlePigsPoultryOthersTotal
CattleThereof dairy cowsPigsSheep & goats
MeatCow milk collected
SNIA
Cattle25%
Others9%
Pigs26%
Poultry40%
SNIA is a founding member of OQUALIM, the global safety system for the Feed industry in France

15
Strategic Research & Innovation Agenda
In February 2013, EUFETEC, on the initiative of FEFAC, published its Vision and Strategic Research & Innovation Agenda. The main objective of this project is to convince policy makers that research and innovation in livestock sciences, and in particular animal nutrition, is fundamental for the sustainability of EU livestock farming, as well as a good investment for the future. Holding the growing global demand
of food in mind, the future of livestock farming will depend on producing more with less input; in other words, improve the resource efficiency, while maintaining a high level of safety and quality. Through innovative nutrition strategies, animal health can be further optimised, contributing to a better resistance to diseases and reducing the need for antibiotics. To minimise the negative impact on the environment, farmers
could take further steps in socially responsible livestock farming. This involves precision feeding and green house gas reduction strategies, while strengthening other social aspects and benefits linked to livestock farming. All combined methods to transfer innovative knowledge into practical solutions for livestock farmers should lead to a more productive, competitive and sustainable EU livestock industry.
To meet the growing global demand for food of animal origin, the development of livestock production will increase rapidly at global level. The EU livestock sector, therefore, must innovate and develop the right tools to improve its resource efficiency, to feed nutrients to animals for optimal health and to answer societal demands. EUFETEC, a close collaboration between the feed industry and the academic world and research institutes, analysed these challenges and identified Research and Innovation solutions to tackle them sustainably.
16
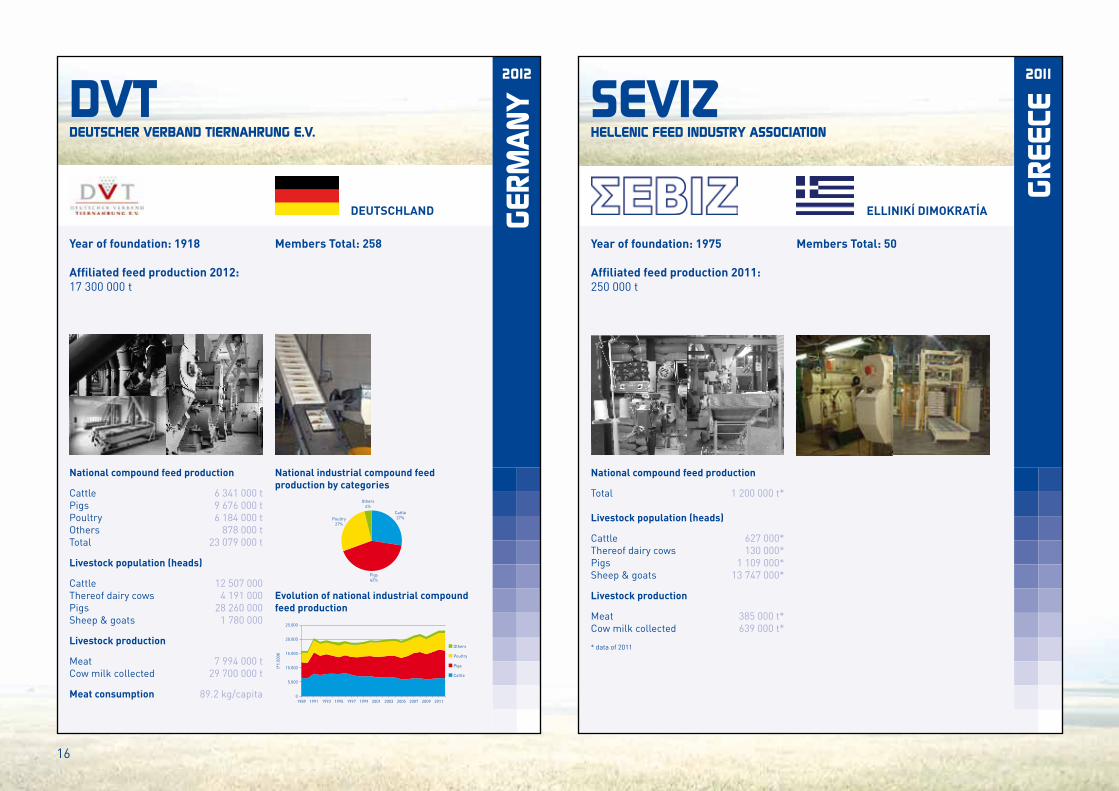
National industrial compound feed production by categories
Evolution of national industrial compound feed production
2012
Year of foundation: 1918
Affiliated feed production 2012:17 300 000 t
Members Total: 258
GERM
AN
Y
DEUTSCHER VERBAND TIERNAHRUNG E.V.
DEUTSCHLAND
6 341 000 t9 676 000 t6 184 000 t
878 000 t23 079 000 t
12 507 0004 191 000
28 260 0001 780 000
7 994 000 t29 700 000 t
89.2 kg/capita
National compound feed production
Livestock population (heads)
Livestock production
Meat consumption
CattlePigsPoultryOthersTotal
CattleThereof dairy cowsPigsSheep & goats
MeatCow milk collected
DVT
Cattle27%
Others4%
Pigs42%
Poultry27%
Others
Poultry
Pigs
Cattle
(*1.
000t
)
0
5.000
10.000
15.000
20.000
25.000
1989 1991 1993 1995 1997 1999 2001 2003 2005 2007 2009 2011
2011
Year of foundation: 1975
Affiliated feed production 2011:250 000 t
Members Total: 50
GREE
CE
HELLENIC FEED INDUSTRY ASSOCIATION
ELLINIKÍ DIMOKRATÍA
1 200 000 t*
627 000*130 000*
1 109 000*13 747 000*
385 000 t*639 000 t*
National compound feed production
Livestock population (heads)
Livestock production
Total
CattleThereof dairy cowsPigsSheep & goats
MeatCow milk collected
SEVIZ
* data of 2011

17
Environmental Foot Print – LCA – FAO
The Feed LCA (life cycle assessment) guidelines will build further on existing general guidance and standards such as the “Product Environmental Footprint guide” from the European Commission and the “ENVIFOOD protocol” from the EU Food Sustainable Consumption and Production Round Table. FEFAC’s contribution to the development of reliable measurement methods will, however, be more focused on the feed sector. Specific standards for feed will increase the consistency, reproducibility, applicability and comparability of life cycle assessments. The goal of the Feed LCA Guide is to encourage feed producers to quantify, report, better understand and reduce the environmental impacts of feed production and feed use. The development of the Feed LCA guidelines started in 2011 out of the principle of environmental
footprinting and will be the result of an intense collaboration with AFIA, FEFAC’s American counterpart, and other feed and food chain partners. Apart from climate change, all other relevant environmental impacts will be addressed as well. The target audience will be the feed and livestock industry, as well as other operators of the feed and food chain (such as raw material suppliers and livestock processors), researchers and decision makers. FEFAC hopes that the Feed LCA guidelines and the FEFAC contribution to the FAO’s Livestock Environmental Assessment and Performance Partnership (LEAP), will deliver valuable tools as a first step towards an internationally accepted common LCA framework methodology for feed.
Feed ingredients represent a significant share of the environmental footprint of feed products. The feed industry is aware of the consequences of its activities and takes its environmental responsibility by measuring its impact and developing continuous improvement programmes. In order to encourage feed producers to quantify, report, better understand and reduce the environmental impacts, FEFAC will develop and publish, jointly with the American Feed Industry Association, feed specific LCA guidelines in 2013.
LCA-Diagram (Source: FEFAC)
Processing
Agricultural production and fishing
Feed compounding
Supply to agricultural production
Feed consumption
on farm
Transport Transport
Transport Transport
Transport

18
National industrial compound feed production by categories
Evolution of national industrial compound feed production
2012
Year of foundation: 1991
Affiliated feed production 2012:1 900 000 t
Members Total: 117thereofPremix: 12Compound feed: 24Feed additives: 3Other (incl. non feed): 78
HU
NGA
RYHUNGARIAN GRAIN AND FEED ASSOCIATION
MAGYARORSZÁG
530 000 t1 380 000 t1 640 000 t
620 000 t4 170 000 t
753 000253 000
2 956 0001 235 000
1 882 000 t*1 308 000 t*
64 kg/capita*
National compound feed production
Livestock population (heads)
Livestock production
Meat consumption
CattlePigsPoultryOthersTotal
CattleThereof dairy cowsPigsSheep & goats
MeatCow milk collected
HGFA
Others15%
Cattle13%
Pigs33%
Poultry39%
Others
Poultry
Pigs
Cattle
(*1.
000t
)
0
3.000
2.000
1.000
4.000
5.000
6.000
7.000
1997 1999 2001 2003 2005 2007 2009 2011
* data of 2011
National industrial compound feed production by categories
Evolution of national industrial compound feed production
2012
Year of foundation: 1988
Affiliated feed production 2012:2 282 000 t
IREL
AN
D
THE IRISH GRAIN AND FEED ASSOCIATION
IRELAND
2 555 000 t701 000 t501 000 t455 000 t
4 212 000 t
6 253 0001 060 0001 493 0003 430 000
903 000 t*5 536 000 t*
79.8 kg/capita*
National compound feed production
Livestock population (heads)
Livestock production
Meat consumption
CattlePigsPoultryOthersTotal
CattleThereof dairy cowsPigsSheep & goats
MeatCow milk collected
IGFA
Others
Poultry
Pigs
Cattle
(*1.
000t
)
0
500
1.000
1.500
2.000
2.500
3.500
3.000
4.000
4.500
1989 1991 1993 1995 1997 1999 2001 2003 2005 2007 2009 2011
* data of 2011
Cattle61%
Others11%
Pigs16%
Poultry12%

19
FEFAC Statistics 2012
Value of purchased compound feed in total animal output value in 2012 (Source: FEFAC)
Feeding EU LivestockMeat and other animal products in the EU-27 represented app. 165.5 bio. € in 2012, i.e. 42% of the total value of farm production and 5% more than in 2011. However, this increase should not be seen as a sign of recovery from the 2009 crisis, since feed costs increased by 7 to 10% in 2012, thus further pressuring farmers’ income. Animal feed is indeed the most important livestock production cost factor and represented in 2012 up to 79% of the farm gate value of poultry. The EU-27 farm animals are fed with app. 470 mio. t of feedstuffs, thereof app. half are roughages produced on farm, 10% are grains produced on farm, 10% are purchased feed materials and 30% are industrial compound feed.
Livestock sourcing in feed in the EU-27 (472 mio. t in 2012) (Source: FEFAC - DG Agriculture)
Value of farm production in 2012 in the EU-27 (Source: Eurostat)
Other farm products228.5 bio. € / 58%
Other animal products12 bio. € / 3%
Poultry & eggs30.5 bio. € / 8%
Pigs38 bio. € / 9.5%
Beef, Veal & Milk85 bio. € / 21.5%

20
Industrial compound feed production
Industrial compound feed production per category in 2012 (Source: FEFAC)
Development of compound feed production in the EU (per category, excl. EL, LU and MT) (Source: FEFAC)
The compound feed production in the EU-27 slightly increased by 0.7% in 2012 to 152.7 mio. t. Pig feed has seen its production fall by 1.4% for the second year, whereas poultry & layer feed continued increasing by 1.5%, thereby confirming their position as leading compound feed segment slightly above pig feed. Cattle feed production increased also by 2.3%.The most important factors which have weighed in on the EU feed demand in 2012 were the still fragile economic situation of the pig sector and the soaring feed material costs.Most EU Member countries saw their production change within a range of -2/+2%, with the noticeable exception of Ireland (+17%) due to the higher demand for cattle feed, or Poland (+4%) boosted by the demand for poultry feed. UK also experienced a +2.9% increase, which is noticeable for a country whose level of production has been remarkably stable over the last 20 years. Denmark and Slovakia managed to reverse the negative trend recorded for the last 5 years.Germany’s position as leading EU country in terms of total compound feed was strengthened, ahead of Spain shoulder to shoulder with France for the second position.Germany is the leading cattle feed producer, Spain is the leader for pig feed and France maintains the leading position as poultry feed producer. The compound feed production in the EU is on a similar level as the production in the USA and represents 16% of the global production that is estimated at around 945 mio. t.
Global compound feed production in 2012 (945 mio. t) (Source: FEFAC - Alltech)
EU-27 compound feed production in 2012 (152.7 mio. t / +0.7%) (Source: FEFAC)
Japan
Canada
21
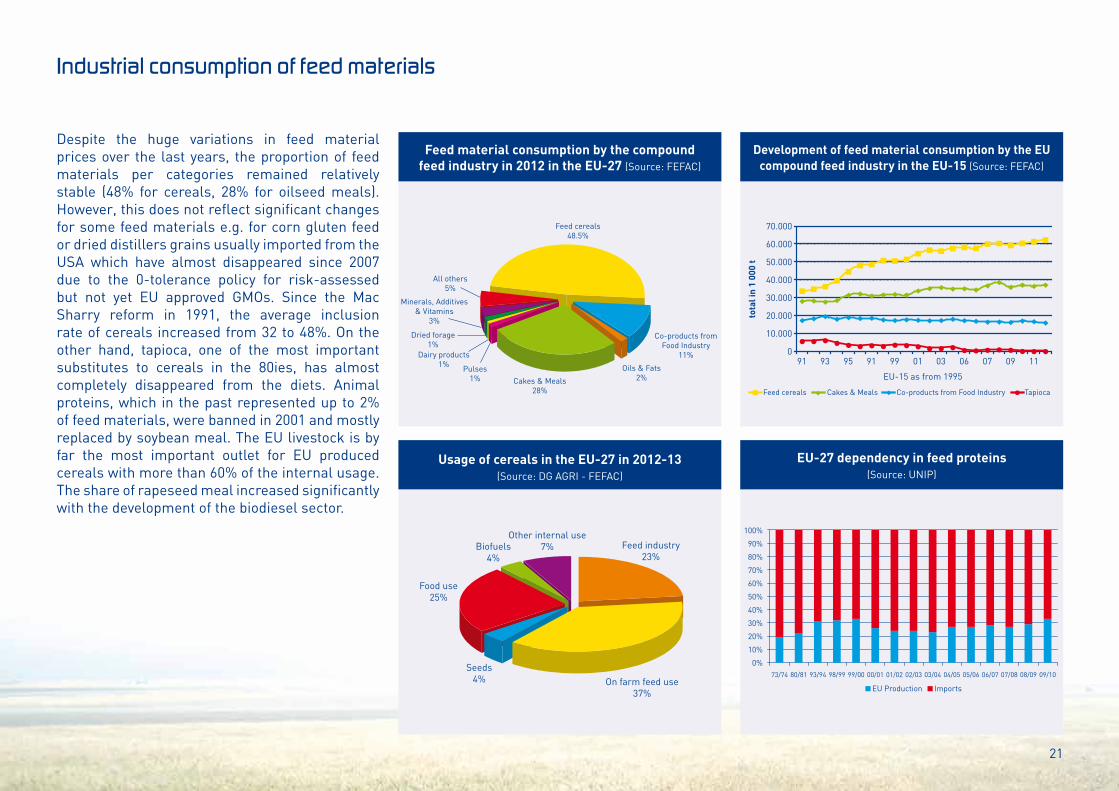
Industrial consumption of feed materials
Despite the huge variations in feed material prices over the last years, the proportion of feed materials per categories remained relatively stable (48% for cereals, 28% for oilseed meals). However, this does not reflect significant changes for some feed materials e.g. for corn gluten feed or dried distillers grains usually imported from the USA which have almost disappeared since 2007 due to the 0-tolerance policy for risk-assessed but not yet EU approved GMOs. Since the Mac Sharry reform in 1991, the average inclusion rate of cereals increased from 32 to 48%. On the other hand, tapioca, one of the most important substitutes to cereals in the 80ies, has almost completely disappeared from the diets. Animal proteins, which in the past represented up to 2% of feed materials, were banned in 2001 and mostly replaced by soybean meal. The EU livestock is by far the most important outlet for EU produced cereals with more than 60% of the internal usage. The share of rapeseed meal increased significantly with the development of the biodiesel sector.
Development of feed material consumption by the EU compound feed industry in the EU-15 (Source: FEFAC)
EU-27 dependency in feed proteins (Source: UNIP)
Usage of cereals in the EU-27 in 2012-13 (Source: DG AGRI - FEFAC)
Feed material consumption by the compound feed industry in 2012 in the EU-27 (Source: FEFAC)

22
The EU meat market in a nutshell
The production of meat in the EU-27 decreased by 1.4% between 2011 and 2012, meaning relative stabilisation for the 6th year if we except the dramatic contraction of production in 2009. Beef production dropped by 4%, i.e. slightly more than the trend over the last 6 years. Pig production went down by 1.8%, a trend that should continue in 2013 with the entry into force of the new welfare rules for sows. On the other hand, poultry meat production continued increasing by 0.8% in 2012. The meat consumption in the EU-27 is estimated around 87 kg/capita/year, 1.1% less than in 2011 and continued the downward trend that started in the mid-2000s. Poultry meat is the second most consumed meat in the EU-27 with 23 kg/capita/year in 2012, far behind pig meat (40 kg/capita/year).
The EU livestock sector contributes positively to the commercial balance, in particular pork and cheese, with self sufficiency ratio of resp. 107 and 106.
Meat consumption development in the EU-27 per category (Source: DG AGRI)
EU-27 self-sufficiency for some EU agricultural products in 2011 (Source: DG AGRI)
Meat consumption in the EU-27 in 2012 per category (kg/capita) (Source: DG AGRI)
Gross meat production development in the EU-27 per category (Source: DG AGRI)

23
Apart from providing an outlet for 90 million tonnes of co-products that derive from the production of food and biofuels, like oilseeds, sugar beet pulp, cornglutenfeed and DDGS, the feed sector also offers a sustainable solution for reducing waste further down the production process. Broken biscuits, passed the sell-by-date bread, over-flavoured crisp and surplus sweets are just a few examples of “former foodstuffs”, which, as the name indicates, were initially produced for human consumption but for various reasons are not suitable anymore. However, these products still have a high nutritional value for feeding animals because they often contain a lot of energy, protein and fats. Instead of food producers simply discarding these former foodstuffs as waste, these unfinished or imperfect products can flow back into the food chain by using them as animal
feed. As of today, former foodstuff processors in the EU convert approximately 3 million tonnes of former foodstuffs into animal feed. Feed use of former foodstuffs is recognised as the most sustainable option after it is no longer suited for human consumption. FEFAC has communicated this message to EU decision makers as well as food chain partners, inviting all actors involved to secure the “non-waste” legal status of former foodstuffs destined to feed. FEFAC underlines that in order to reduce waste, the principles of the Food Waste Hierarchy (University of Wageningen) should be followed and traceability and safety of former foodstuffs always have to be ensured.
Food waste hierarchy (Source: University of Wageningen)
Food Waste
The European Parliament called on the European Commission to take practical measures in halving by 2020 the 90 million tonnes of food that is wasted each year throughout the entire EU food chain. As a vital element of the food chain and an expert in resource efficiency, the feed industry can help in offering a sustainable solution.
Prevention
Human consumption (food banks, charities)
Convert for human consumption
Animal feeding
Industrial biobased resources
Bio Fermentation + digestate
Composting
Green energy
WasteWaste
Land-fill
Incineration (waste)
24
National industrial compound feed production by categories
Evolution of national industrial compound feed production
2012
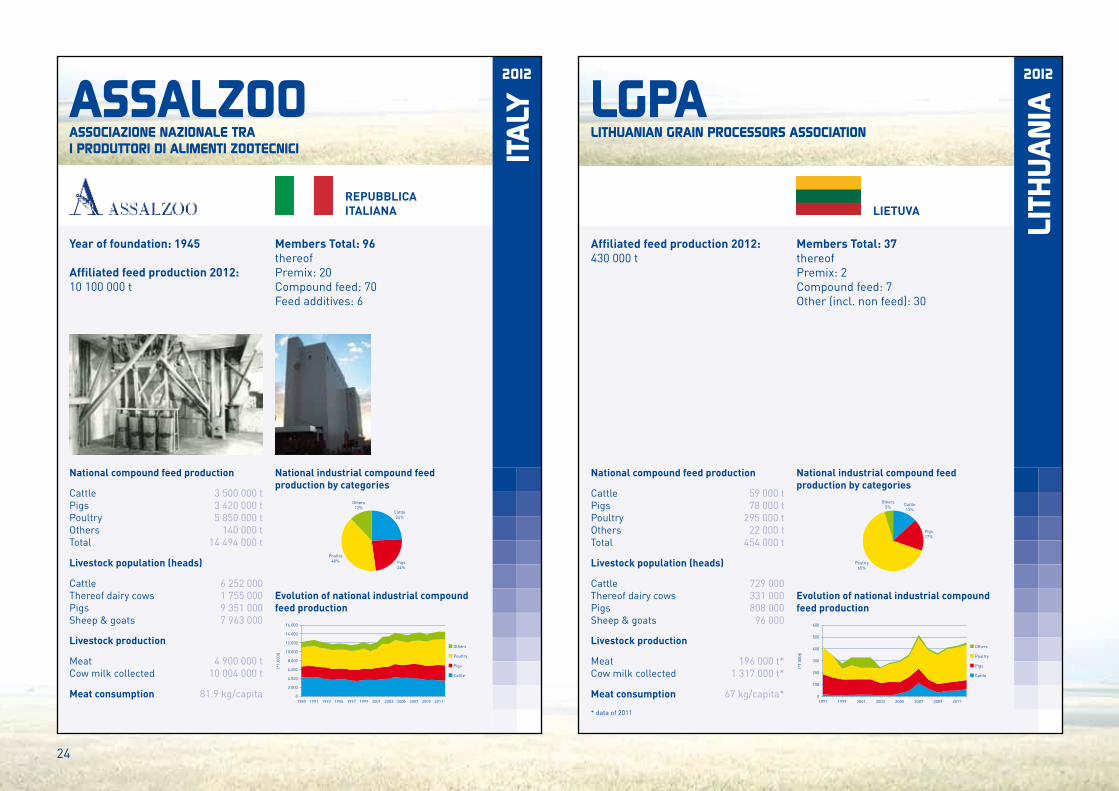
Year of foundation: 1945
Affi liated feed production 2012:10 100 000 t
Members Total: 96thereofPremix: 20Compound feed: 70Feed additives: 6
ITA
LY
ASSOCIAZIONE NAZIONALE TRAI PRODUTTORI DI ALIMENTI ZOOTECNICI
REPUBBLICAITALIANA
3 500 000 t3 420 000 t5 850 000 t
140 000 t14 494 000 t
6 252 0001 755 0009 351 0007 963 000
4 900 000 t10 004 000 t
81.9 kg/capita
National compound feed production
Livestock population (heads)
Livestock production
Meat consumption
CattlePigsPoultryOthersTotal
CattleThereof dairy cowsPigsSheep & goats
MeatCow milk collected
ASSALZOO
Cattle24%
Others12%
Pigs24%
Poultry40%
Others
Poultry
Pigs
Cattle
(*1.
000t
)
0
2.000
4.000
6.000
8.000
12.000
10.000
14.000
16.000
1989 1991 1993 1995 1997 1999 2001 2003 2005 2007 2009 2011
National industrial compound feed production by categories
Evolution of national industrial compound feed production
2012
Affiliated feed production 2012:430 000 t
Members Total: 37thereofPremix: 2Compound feed: 7Other (incl. non feed): 30
LITH
UA
NIA
LITHUANIAN GRAIN PROCESSORS ASSOCIATION
LIETUVA
59 000 t78 000 t
295 000 t22 000 t
454 000 t
729 000331 000808 000
96 000
196 000 t*1 317 000 t*
67 kg/capita*
National compound feed production
Livestock population (heads)
Livestock production
Meat consumption
CattlePigsPoultryOthersTotal
CattleThereof dairy cowsPigsSheep & goats
MeatCow milk collected
LGPA
Others5%
Cattle13%
Pigs17%
Poultry65%
Others
Poultry
Pigs
Cattle
(*1.
000t
)
0
200
100
300
400
500
600
1997 1999 2001 2003 2005 2007 2009 2011
* data of 2011

25
Responsible Soy
The rapid expansion of soybean cultivation in certain South American countries in the last decade raised concerns about its environmental and social impact. The EU feed industry, therefore, took a leadership role to meet societal demands for soy production which is its main protein supply. “Responsible soy” has to comply with multiple sustainability criteria that demand a positive corporate social responsibility of the soybean farmer.
Since 2005, FEFAC has been a member of the global multi stakeholder Round Table on Responsible Soy (RTRS), which, in 2010, adopted its first RTRS standard that contains criteria for soy to qualify as being produced in a responsible manner. To meet the RTRS standard, a soybean farmer
has to respect several principles, most importantly environmental responsibility, good agricultural practices, legal compliance and responsible labour conditions. In 2012, approximately 1 million tonnes of soy were produced under the RTRS certification scheme and the projected volumes for 2013 are
estimated between 3 and 5 million tonnes. The objective is to further increase the supply volumes of responsible soy, in the long term making it a sustainable mainstream supply. With its participation to RTRS and equivalent certification programmes, FEFAC
wishes to contribute to sustainable growth and production of the feed and livestock sector
in Europe while simultaneously addressing societal concerns linked to soybean cultivation and other raw material sources in the next step.

26
National industrial compound feed production by categories
Evolution of national industrial compound feed production
2012
Year of foundation: 2000
Affiliated feed production 2012:13 482 000 t
Members Total: 110thereofPremix: 8Compound feed: 72Other (incl. non feed): 30
THE
NET
HER
LAN
DS
NEDERLANDSE VERENIGINGDIERVOEDERINDUSTRIE
NEDERLAND
3 523 000 t5 244 000 t3 943 000 t1 130 000 t
13 840 000 t
3 985 0001 541 000
12 104 0001 496 000
1 775 000 t*11 642 000 t*
86.3 kg/capita*
National compound feed production
Livestock population (heads)
Livestock production
Meat consumption
CattlePigsPoultryOthersTotal
CattleThereof dairy cowsPigsSheep & goats
MeatCow milk collected
NEVEDI
Others
Poultry
Pigs
Cattle
(*1.
000t
)
0
2.000
4.000
6.000
8.000
12.000
10.000
14.000
16.000
1989 1991 1993 1995 1997 1999 2001 2003 2005 2007 2009 2011
* data of 2011
Cattle25%
Others8%
Pigs38%
Poultry29%
National industrial compound feed production by categories
Evolution of national industrial compound feed production
2012
Year of foundation: 1991
Affiliated feed production 2012:1 487 000 t
Members Total: 503thereofCompound feed: 4Other (incl. non feed): 499
NOR
WAY
Norwegian Seafood Federation
NORGE
985 000 t491 000 t418 000 t
1 723 000 t3 617 000 t
National compound feed production
CattlePigsPoultryOthersTotal
FHL
(*1.
000t
)
0
3.500
1.000
500
2.000
1.500
3.000
2.500
4.000
1997 1999 2001 2003 2005 2007 2009 2011
Others
Fish
Poultry
Pigs
Cattle
Others1%
Cattle27%
Pigs14%
Poultry11%
Fish47%

27
EFMC
FEFAC was the first partner in the whole EU feed chain sector to develop a tool in the spirit of co-regulation as to facilitate the implementation of the feed legislation. An example of the value put on the EFMC is the major upgrade FEFAC and other chain partners accomplished in 2012 in order to propose principles for the management of the risk of Salmonella in the feed chain. Feed is indeed recognised as one potential vector of livestock contamination with Salmonella, which could eventually trigger Salmonellosis in humans. Although the number of human cases has been significantly reduced over time, particularly thanks to better control of Salmonella in the EU livestock value chain including the feed sector, FEFAC considered that further progress could be achieved if good practices were implemented along the entire feed supply chain. The underlying principle of the
EFMC is to provide operators with a set of tools that contain different risk management strategies, while taking into account the company’s risk profile and the different feed safety objectives established by national authorities, as this area is not fully harmonised at EU level. The control of the manufacturing process is highly emphasised in the EFMC for the benefit of an overall improvement of the hygienic status of the installations. The EU and national authorities welcomed the initiatives undertaken by FEFAC and appreciated the industrial sector’s commitment to contribute to the overall EU policy objective of reducing human Salmonellosis cases.
The maintenance of feed safety requires the permanent attention of feed producers. To help premixtures and compound feed manufacturers to implement the legal feed safety requirements, FEFAC developed the EFMC, a European guide to good hygiene practice for feed manufacturing. This guide was officially assessed by the EU authorities in 2007 and has since been upgraded several times in order to adapt to arising feed and food safety challenges.

28
National industrial compound feed production by categories
Evolution of national industrial compound feed production
2012
Year of foundation: 1997
Affi liated feed production 2012:3 630 000 t
Members Total: 57thereofPremix: 1Compound feed: 11Feed additives: 5Other (incl. non feed): 40
POLA
ND
Izba Zbozowo-Paszowa
RZECZPOSPOLITA POLSKA
905 000 t1 750 000 t5 115 000 t
330 000 t8 100 000 t
5 762 0002 626 000
13 509 000363 000
3 715 000 t9 860 000 t
70.1 kg/capita
National compound feed production
Livestock population (heads)
Livestock production
Meat consumption
CattlePigsPoultryOthersTotal
CattleThereof dairy cowsPigsSheep & goats
MeatCow milk collected
IZP
Others4%
Cattle11%
Pigs22%
Poultry63%
Others
Poultry
Pigs
Cattle
(*1.
000t
)
0
1.000
3.000
2.000
5.000
4.000
7.000
6.000
8.000
9.000
1997 1999 2001 2003 2005 2007 2009 2011
National industrial compound feed production by categories
Evolution of national industrial compound feed production
2012
Year of foundation: 1969
Affiliated feed production 2012:3 037 000 t
Members Total: 52thereofPremix: 10Compound feed: 42
PORT
UGA
L
ASSOCIAÇÃO PORTUGUESA DOS INDUSTRIAISDE ALIMENTOS COMPOSTOS PARA ANIMAIS
REPÚBLICAPORTUGUESA
710 000 t860 000 t
1 400 000 t255 000 t
3 225 000 t
1 519 000242 000
1 985 0002 583 000
878 000 t1 855 000 t
107.2 kg/capita
National compound feed production
Livestock population (heads)
Livestock production
Meat consumption
CattlePigsPoultryOthersTotal
CattleThereof dairy cowsPigsSheep & goats
MeatCow milk collected
IACA
Cattle22%
Others8%
Pigs27%
Poultry43%
Others
Poultry
Pigs
Cattle
(*1.
000t
)
0
500
1.000
1.500
2.000
2.500
3.500
3.000
4.000
4.500
1989 1991 1993 1995 1997 1999 2001 2003 2005 2007 2009 2011

29
Antimicrobial resistance
First of all, it shouldn’t be forgotten that ever since the EU ban of the use of antibiotics for growth promoting purposes in 2006 it has consequently been prohibited for standard feed to contain any antibiotic growth promoters. Nevertheless, bringing down further the need for antibiotics for animal health purposes must be a key objective for the EU livestock chain. Adequate nutrition that meets the demands for the maintenance of optimal animal health, together with controlled farm housing conditions, could already contribute to this minimization. For example, research has been able to identify certain feed components that would have a positive impact on animal gut health, a vital element for resistance to infections and diseases. Encouraging the implementation of these types of good animal husbandry management practices by farmers and veterinarians regarding the
proper use of antibiotics is the main objective of EPRUMA (European Platform for the Responsible Use of Medicines in Animals), for which
FEFAC renewed its active support in 2012. FEFAC is very much supportive of the EU Commission review of the veterinary legislation which is going
on for several years now, aiming to improve the legal framework regarding animal health and antimicrobial resistance.
Antimicrobial resistance has gradually become a serious threat for the future of mankind. Global action is needed to enforce better control on the misuse and overuse of antibiotics in both human medicines and livestock production. To reduce the medicine use at farm level, animal feeding can play a positive role.
30
2011
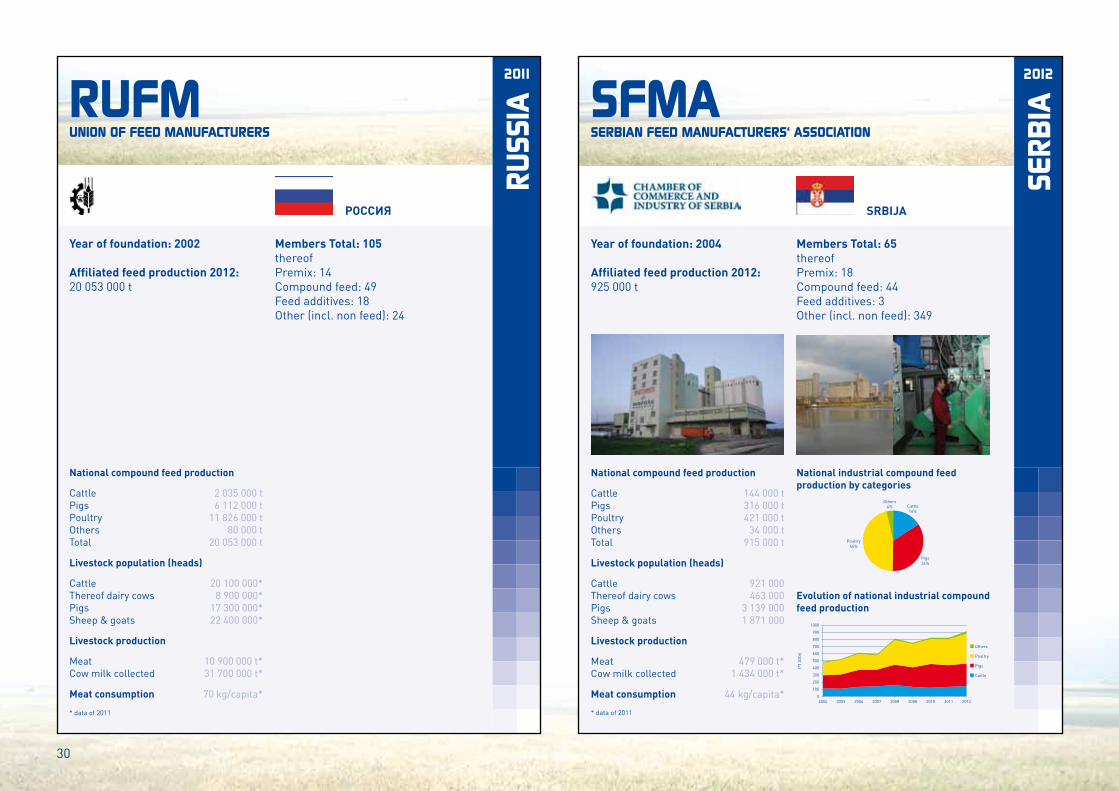
Year of foundation: 2002
Affiliated feed production 2012:20 053 000 t
Members Total: 105thereofPremix: 14Compound feed: 49Feed additives: 18Other (incl. non feed): 24
RUSS
IA
UNION OF FEED MANUFACTURERS
POCC RN
2 035 000 t6 112 000 t
11 826 000 t80 000 t
20 053 000 t
National compound feed production
CattlePigsPoultryOthersTotal
20 100 000*8 900 000*
17 300 000*22 400 000*
10 900 000 t*31 700 000 t*
70 kg/capita*
Livestock population (heads)
Livestock production
Meat consumption
CattleThereof dairy cowsPigsSheep & goats
MeatCow milk collected
RUFM
* data of 2011
National industrial compound feed production by categories
Evolution of national industrial compound feed production
2012
Year of foundation: 2004
Affiliated feed production 2012:925 000 t
Members Total: 65thereofPremix: 18Compound feed: 44Feed additives: 3Other (incl. non feed): 349
SERB
IA
SERBIAN FEED MANUFACTURERS‘ ASSOCIATION
SRBIJA
144 000 t316 000 t421 000 t
34 000 t915 000 t
921 000463 000
3 139 0001 871 000
479 000 t*1 434 000 t*
44 kg/capita*
National compound feed production
Livestock population (heads)
Livestock production
Meat consumption
CattlePigsPoultryOthersTotal
CattleThereof dairy cowsPigsSheep & goats
MeatCow milk collected
SFMA
Others
Poultry
Pigs
Cattle
(*1.
000t
)
0
100
900
300
200
500
400
700
600
800
1000
2004 2005 2006 2007 2008 2008 2010 2011 2012
* data of 2011
Others4% Cattle
16%
Pigs34%
Poultry46%

31
Medicated feed
The primary business of compound feed manufacturers is to produce standard compound feed for healthy animals meeting their nutritional requirements. However, upon prescription of veterinarians, they may be requested to blend in veterinary medicinal products into the feed, because medicated feed may in some cases offer the most efficient and controlled distribution channel for treating sick animals. Compound feed manufacturers that provide this service to farmers are subject to careful scrutiny of control authorities. It is indeed important that the whole chain applies strict precautionary measures to preserving the safety of the manufacturing, handling, transport and delivery of medicated feed. This is particularly the case for worker safety and the control of the risk of carry-over, meaning the technically unavoidable presence of very small traces of veterinary
medicinal products in a subsequent batch of feed for non-target animals. Currently available new innovative technologies which would contribute to a higher level of security cannot be implemented because the present legal framework does not facilitate fully harmonised legal requirements for medicated feed. In 2012, FEFAC provided data to the EU Commission for an impact assessment of different legislative options for the future legal framework, showing the benefits for farmers, veterinarians and the feed industry of a more harmonised legal framework for medicated feed.
The correct delivery of veterinary medicinal products to animals can be achieved through different pathways, for example injection, direct oral administration or via “medicated feed”. The legal framework for the prescription, manufacturing, delivery and use of medicated feed is however more than 20 years old, making modernization and harmonization of the legislation urgent for farmers and operators to maintain and further improve a high level of animal health while ensuring a level playing field in the common market.
32
National industrial compound feed production by categories
Evolution of national industrial compound feed production
2012
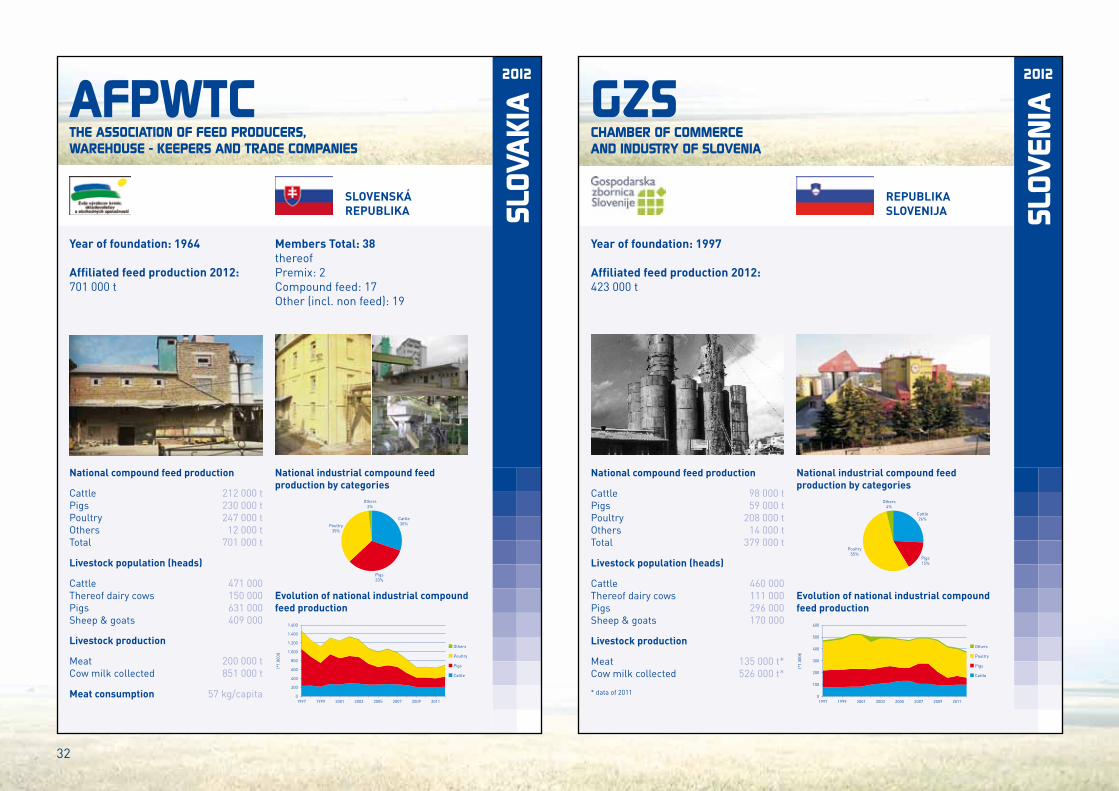
Year of foundation: 1964
Affiliated feed production 2012:701 000 t
Members Total: 38thereofPremix: 2Compound feed: 17Other (incl. non feed): 19
SLOV
AKI
A
THE ASSOCIATION OF FEED PRODUCERS,WAREHOUSE - KEEPERS AND TRADE COMPANIES
SLOVENSKÁREPUBLIKA
212 000 t230 000 t247 000 t
12 000 t701 000 t
471 000150 000631 000409 000
200 000 t851 000 t
57 kg/capita
National compound feed production
Livestock population (heads)
Livestock production
Meat consumption
CattlePigsPoultryOthersTotal
CattleThereof dairy cowsPigsSheep & goats
MeatCow milk collected
AFPWTC
Others2%
Cattle30%
Pigs33%
Poultry35%
Others
Poultry
Pigs
Cattle
(*1.
000t
)
0
800
600
400
200
1.000
1.200
1.400
1.600
1997 1999 2001 2003 2005 2007 2009 2011
National industrial compound feed production by categories
Evolution of national industrial compound feed production
2012
Year of foundation: 1997
Affiliated feed production 2012:423 000 t
SLOV
ENIA
CHAMBER OF COMMERCEAND INDUSTRY OF SLOVENIA
REPUBLIKASLOVENIJA
98 000 t59 000 t
208 000 t14 000 t
379 000 t
460 000111 000296 000170 000
135 000 t*526 000 t*
National compound feed production
Livestock population (heads)
Livestock production
CattlePigsPoultryOthersTotal
CattleThereof dairy cowsPigsSheep & goats
MeatCow milk collected
GZS
Others
Poultry
Pigs
Cattle
(*1.
000t
)
0
100
300
200
400
500
600
1997 1999 2001 2003 2005 2007 2009 2011
* data of 2011
Others4%
Cattle26%
Pigs15%
Poultry55%

33
FEFAC officially entered the European Commission Register of Interest Representatives in January 2009.
FEFAC experts take part in the following EU Advisory Groups
• Directorate General for Health and Consumers – DG SANCO
– Advisory Group on the Food Chain, Animal and Plant Health
– Animal Health Advisory Committee
• Directorate General for Agriculture and Rural Development – DG AGRI
– Common Agricultural Policy – Cereals, Oilseeds and
Proteins – Milk – Organic Farming – Dried Fodder
FEFAC provides feed expertise and data to the official, public inquiries conducted by the EU Commission preceding the launch and adoption of new legislative acts affecting the feed industry.
As member of EUFETEC, FEFAC provided the vision of the feed sector as regards the future of the animal nutrition science by 2030 and the priority research agenda needed.
In cooperation with DG SANCO, FEFAC has organised a series of major EU feed safety workshops on emerging feed safety incidents including the Dioxin contamination of breadmeal in Ireland in 2009 and in feed fats in Germany in 2011. With the support of DG SANCO, FEFAC organised a feed and food chain meeting for the launch of the European Feed Manufacturers Guide (EFMC) in 2007.
FEFAC takes an active part in the EFSA Stakeholders Platform. The European Food Safety Authority (EFSA) is responsible for the EU-wide risk assessment regarding food and feed safety. FEFAC experts have provided data and industry studies in a series of EFSA feed safety risk assessments mainly conducted by the Scientific Panels on Biological Hazards, Contaminants, Feed Additives and Animal Health/Animal Welfare. FEFAC experts provide also their input in the Stakeholders
Advisory Group on Emerging Risks. In cooperation with EFSA, FEFAC organised a workshop on the reauthorisation of feed additives in 2008.
FEFAC has been co-organising 16 workshops (between 1999 and 2012 in Italy, Czech Republic, Cyprus, Slovakia, Slovenia, Poland, Estonia, Latvia, Turkey, Romania, Croatia, Hungary, Serbia, Bulgaria and Russia) on HACCP-based Feed Safety Assurance Systems in animal feed production in cooperation with TAIEX, the Technical Assistance Information Exchange Office of DG Enlargement.
In cooperation with the EU Food and Veterinary Office (FVO) and DG SANCO, FEFAC experts contributed to the training seminars for new FVO feed inspectors in 2003 and 2006. FEFAC will also contribute to a new FVO workshop on feed hygiene implementation in May 2013 with national competent control authorities and feed safety assurance partners. FEFAC experts also participated in the first series of DG SANCO feed safety training seminars for national feed control experts in 2010 and 2012.
FEFAC experts participated in Public Hearings of the European Parliament Environment and Agriculture Committees on animal feed safety and GM food and feed labelling legislation.
FEFAC and the European Institutions

34
National industrial compound feed production by categories
Evolution of national industrial compound feed production
2012
Year of foundation: 1978
Affiliated feed production 2012:5 540 000 t
Members Total: 234thereofPremix: 10Compound feed: 217Feed additives: 6Other (incl. non feed): 1
SPA
IN
CONFEDERACIÓN ESPAÑOLA DE FABRICANTESDE ALIMENTOS COMPUESTOS PARA ANIMALES
ESPAÑA
6 925 000 t8 996 000 t4 260 000 t
946 000 t21 127 000 t
5 813 000827 000
25 161 00019 506 000
5 813 000 t5 997 000 t
National compound feed production
Livestock population (heads)
Livestock production
CattlePigsPoultryOthersTotal
CattleThereof dairy cowsPigsSheep & goats
MeatCow milk collected
CESFAC
Cattle33%
Others4%
Pigs43%
Poultry20%
Others
Poultry
Pigs
Cattle
(*1.
000t
)
0
5.000
10.000
15.000
20.000
25.000
1989 1991 1993 1995 1997 1999 2001 2003 2005 2007 2009 2011
2011
Year of foundation: 1981
Affiliated feed production 2012:300 000 t
Föreningen Foder och Spannmål (Feed and Grain Association) is a Swedish organisation of companies producing and selling agricultural supplies such as grain, feed, seeds, fertilisers and plant protectants. The association in its modern form was founded in 1981 by a merge of Swedish Grain Merchants (founded in 1911) and Swedish Feed Manufacturers (founded in 1905).
The main purpose is to represent and promote views and interests of the members in Swedish and EU institutions and to support members with relevant information. The association has about60 member companies with a total turnover of approx 2.8 billion SEK.
Members Total: 60thereofPremix: 2Compound feed: 6Other (incl. non feed): 55
SWED
ENFODER & SPANNMAL
KONUNGARIKETSVERIGE
F&S

35
FEFAC and the other chain partnersTogether, we get stronger! FEFAC has for long granted priority to collaboration with other stakeholders of the feed and food chain to tackle feed and food chain issues of common interest. FEFAC participated in the establishment and/or is member of: EATIP (European Aquaculture
Technology & Innovation Platform), one of the European Technology Platforms endorsed by DG RESEARCH. It was set up by the European fish farmers (FEAP) with the support of the whole aquaculture supply industries, including leading fish feed producers and FEFAC’s Fish Feed Committee. EATiP developed a vision document on the research needs of the Aquaculture sector until 2020 including a strategic research and innovation agenda containing key projects which could facilitate the development of a more sustainable and competitive EU Aquaculture sector in line with CFP reform policy objective for Aquaculture.
EISA (European Initiative for Sustainable Development in Agriculture), set up by national farmer initiatives supported by agro-supply industries promoting the development of integrated farming practices through the development and continuous update of the EISA Integrated farming framework containing a European definition and characterization of Integrated farming as guideline for sustainable development of Agriculture.
EUFETEC, a European feed technology research platform composed of several feed-related bodies representing the feed industry and research institutes which decided to join their efforts with a view to streamline the EU research via the development of a Strategic Research and Innovation Agenda for the animal nutrition science. EUFETEC is member of the Animal Task Force which is a gathering of knowledge providers and technology platforms active in the various animal sciences (animal health, genetic, nutrition, etc.).
Food SCP Roundtable (EU Food chain Roundtable on Sustainable Consumption & Production), composed of representative organisations from the entire food chain from the agro-supply sector to retailers with the main objective to develop a harmonised environmental impact assessment methodology, to develop tools for consumer communication and to identify actions for further improvement of the environmental performance of the food chain. The Roundtable is co-chaired by the European Commission.
EPRUMA (European Platform for the Responsible Use of Medicines in Animals), established in 2005 and composed of various EU organisations of the livestock and pet sectors, with the mission of promoting the responsible use of medicines in animals in the EU. EPRUMA issued in 2008 “Best-practice framework for the use of antimicrobials in food-producing animals”.
FFC (EU Feed and Food Chain platform on the use of green biotechnology), composed of partner organizations of the whole feed and food chain dealing with the impact of EU and international regulations and market developments for the use of modern biotechnology in agriculture and food production on EU feed and food markets.
Food Safety Platform, grouping key European stakeholder federations concerned with feed & food safety, aiming at improving communication between the feed & food chain partners on emerging feed and food safety issues and related topics.
EU FCTF (EU Feed Chain Task Force on the Catalogue of Feed Materials), a gathering of 39 EU organizations of the different sectors of the feed chain (feed material producers, traders, compound feed manufacturers and farmers) whose mission is to maintain and upgrade the EU Catalogue of Feed Materials. FEFAC holds the role of coordinator of the EU FCTF.

36
National industrial compound feed production by categories
Evolution of national industrial compound feed production
2012
Year of foundation: 1950
Affiliated feed production 2012:1 030 000 t
SWED
EN
KONUNGARIKETSVERIGE
825 000 t315 000 t550 000 t146 000 t
1 836 000 t
1 444 000346 000
1 363 000611 000
380 000 t2 861 000 t
46.5 kg/capita
National compound feed production
Livestock population (heads)
Livestock production
Meat consumption
CattlePigsPoultryOthersTotal
CattleThereof dairy cowsPigsSheep & goats
MeatCow milk collected
LANTMÄNNEN
Others
Poultry
Pigs
Cattle
(*1.
000t
)
0
500
1.000
1.500
2.000
2.500
3.000
1992 1994 1996 1998 2000 2002 2004 2006 2008 2010 2012
Cattle45%
Others8%
Pigs17%
Poultry30%
National industrial compound feed production by categories
Evolution of national industrial compound feed production
2012
Year of foundation: 1933
Affiliated feed production 2012:679 000 t
Members Total: 83thereofPremix: 6Compound feed: 44Feed additives: 3Other (incl. non feed): 30
SWIT
ZERL
AN
D
FEDERATION OF THE SWISSCOMPOUND FEED MANUFACTURERS
SCHWEIZ
490 000 t620 000 t345 000 t
62 000 t1 517 000 t
1 590 000*700 000*
1 590 000*520 000*
479 000 t*4 079 000 t*
62.6 kg/capita*
National compound feed production
Livestock population (heads)
Livestock production
Meat consumption
CattlePigsPoultryOthersTotal
CattleThereof dairy cowsPigsSheep & goats
MeatCow milk collected
VSF
Others4%
Cattle32%
Pigs41%
Poultry23%
Others
Poultry
Pigs
Cattle
(*1.
000t
)
0
800
600
400
200
1.000
1.200
1.400
1.600
1997 1999 2001 2003 2005 2007 2009 2011
* data of 2011

37
FEFAC holds observer status in the CODEX Alimentarius Commission since 1999. The Codex Alimentarius Commission was created in 1963 by FAO and WHO to develop food and feed standards, guidelines and related texts such as codes of practice under the Joint FAO/WHO Food Standards Programme. The main purposes of this Programme are protecting the health of consumers and ensuring fair trade practices for food products, as well as promoting coordination of all food standards work undertaken by International Governmental and Non-Governmental Organisations. After the adoption of a Code on good animal feeding in 2005, the CODEX Alimentarius Commission set up a new “ad-hoc“ Task Force on animal feed safety whose main mandate consisted in developing guidance on feed safety risk assessment and prioritisation of feed safety hazards. FEFAC and IFIF actively contributed to the work of the new CODEX Task Force which adopted its final draft guidance documents in 2013 to be approved by the CODEX Alimentarius Commission.
FEFAC assisted OIE, the World Organisation for Animal Health, during the review of the OIE Terrestrial Animal Health Code with regard to feed-related references in the OIE standards.
FEFAC participated in a number of conferences on antimicrobial resistance, in particular those organised jointly by WHO/FAO and OIE by providing key information & data regarding the in-feed use of antibiotics (medicated feed, coccidiostats).
FEFAC holds regular contacts with WTO on issues related to the SPS agreement which may affect global trade in feedingstuffs and products of animal origin.
FEFAC is a member of IFIF, the International Feed Industry Association, which was founded in 1987 by FEFAC and AFIA, the American Feed Industry Association.
IFIF h o l d s
membership f r o m national and regional trade associations, a.o. FEEDLATINA, regrouping South American feed industry associations, the American Feed Industry Association, AFIA, the Brazilian (Sindiraçoes), Chinese (CFIA), Canadian and Japanese Feed Industry Associations as well as global corporate feed companies, accounting for more than 80% of the
estimated global commercial feed production of almost 1 bio. t in 2012.
IFIF has organised its 4th Global Food and Feed Congress in Sun
City, South Africa, in April 2013. IFIF and FAO have jointly organized 6 International Feed
Regulators meetings since 2008 to deal with emerging
feed safety issues and developed jointly with global feed
regulators a comparison project of
key legal requirements for the authorisation of
feed additives in order to foster convergence of feed legislation at
global level.
IFIF has produced a manual on good practices for the feed industry in cooperation with FAO which was first published in 2010 containing a series of additional information material designed to assist industry and government bodies with the implementation of the CODEX Code on good animal feeding.
FEFAC and the International Organisations

38
National industrial compound feed production by categories
Evolution of national industrial compound feed production
2012
Year of foundation: 1974
Affiliated feed production 2012:11 110 000 t
Members Total: 163thereofCompound feed: 163
TURK
EYTURKISH FEED MANUFACTURERS‘ ASSOCIATION
TÜRKIYECUMHURIYETI
7 458 000 t5 954 000 t1 077 000 t
14 489 000 t
National compound feed production
CattlePoultryOthersTotal
11 455 000*4 397 000*
29 383 000*
2 692 000 t*13 544 000 t*
40 kg/capita*
Livestock population (heads)
Livestock production
Meat consumption
CattleThereof dairy cowsSheep & goats
MeatCow milk collected
TÜRKIYEM-BIR
Others7%
Cattle52%
Poultry41%
Others
Poultry
Cattle
(*1.
000t
)
0
5.000
10.000
15.000
20.000
25.000
1997 1999 2001 2003 2005 2007 2009 2011
* data of 2011
National industrial compound feed production by categories
Evolution of national industrial compound feed production
2012
UN
ITED
KIN
GDOMAGRICULTURAL INDUSTRIES CONFEDERATION
UNITED KINGDOM
Members Total: 116AIC represents the majority of UK compound feed manufacturers, but its membership extends far wider and includes feed merchants, grain merchants, fertiliser manufacturers and distributors of crop protection products.AIC helps ensure food and feed safety by owning the assurance schemes UFAS, FEMAS and TASCC.
Year of foundation: 1977
Affiliated feed production 2011:10 180 000 t
5 152 000 t1 682 000 t6 532 000 t1 471 000 t
14 837 000 t
9 900 0001 686 0004 481 000
32 215 000
3 621 000 t13 591 000 t
79.1 kg/capita
National compound feed production
Livestock population (heads)
Livestock production
Meat consumption
CattlePigsPoultryOthersTotal
CattleThereof dairy cowsPigsSheep & goats
MeatCow milk collected
AIC
Cattle35%
Others10%
Pigs11%
Poultry44%
Others
Poultry
Pigs
Cattle
(*1.
000t
)
0
2.000
4.000
6.000
8.000
12.000
10.000
14.000
16.000
1999 2000 2001 2002 2003 2004 2005 2006 2007 2008 2009 2010 2011 2012

39
Praesidium Members Committee Chairmen
Secretariat
SEBASTIA AGUILAR Aurelio Deputy President
CESFAC (Spain)
VANDEN AVENNE Patrick President
Vanden Avenne Ooigem APFACA (Belgium)
KUMPRECHT Marek
CMSOZZN (Czech Republic)
RAINE Helen
AB AgriAIC (United Kingdom)
HECTORS Ad
NEVEDI (The Netherlands)
GUILLAUME Alain
SNIA (France)
VERONESIGiordano
Veronesi Verona S.P.A.ASSALZOO (Italy)
BOUXIN Arnaud
Deputy Secretary General
MARTIN Nicolas
Policy Advisor
DÖRING Alexander
Secretary General
LIBER Françoise
Executive Secretary
PETERS Anne
Translator & webmaster
DEIANA Roseline
Receptionist & documentation
CHAO Susana
Administrative Secretary
ANIMAL NUTRITION
JENSEN Erik Dam
Peder P. Hedegaard A/SDAKOFO (Denmark)
INDUSTRIAL COMPOUND FEED PRODUCTION
LEMOINE Pierre
InVivo-NSASNIA (France)
MILK REPLACERS
KLEINHOUT Geert
Denkavit FranceSNIA (France)
PREMIX AND MINERAL FEED
SIJTSMA Reinder
NutrecoNEVEDI (The Netherlands)
FISH FEED
ALLODI Alberto
Skretting Italia S.p.A.ASSALZOO (Italy)
EFMC
FERRARI Silvio
Cargill srl.ASSALZOO (Italy)
Situation on 31 December 2012

FEFAC aisblRue de la Loi, 223 Bte 3 - 1040 Bruxelles
www.fefac.eu