fema’s flood risk review meeting: building confidence in risk map products 2012 asfpm national...
TRANSCRIPT
FEMA’s Flood Risk Review Meeting: Building Confidence in Risk MAP Products
2012 ASFPM National ConferenceSan Antonio, Texas
May 24, 2012 2:00 pm
2
Presentation Outline Risk MAP Overview
Risk MAP and Flood Risk Review
Case Study: Butler County, Ohio Flood Risk Review Meeting
Conclusions & Recommendations

3
Risk MAP Overview Risk Mapping Assessment & Planning (MAP)
• Mapping – Flood Hazard and Risk Identification• Assessment – HAZUS and other Risk Assessment tools• Planning – Hazard Mitigation Plans
Risk MAP Mission• Conducted at watershed level• Deliver quality data• Communicate more effectively about flood risk to citizens• Inspire mitigation actions that reduce risk

4
The Risk MAP Overview
Risk MAP Program Objectives
Through collaboration with State, Local, and Tribal entities, Risk MAP will
deliver quality data that increases public awareness and leads to action
that reduces risk to life and property.
5
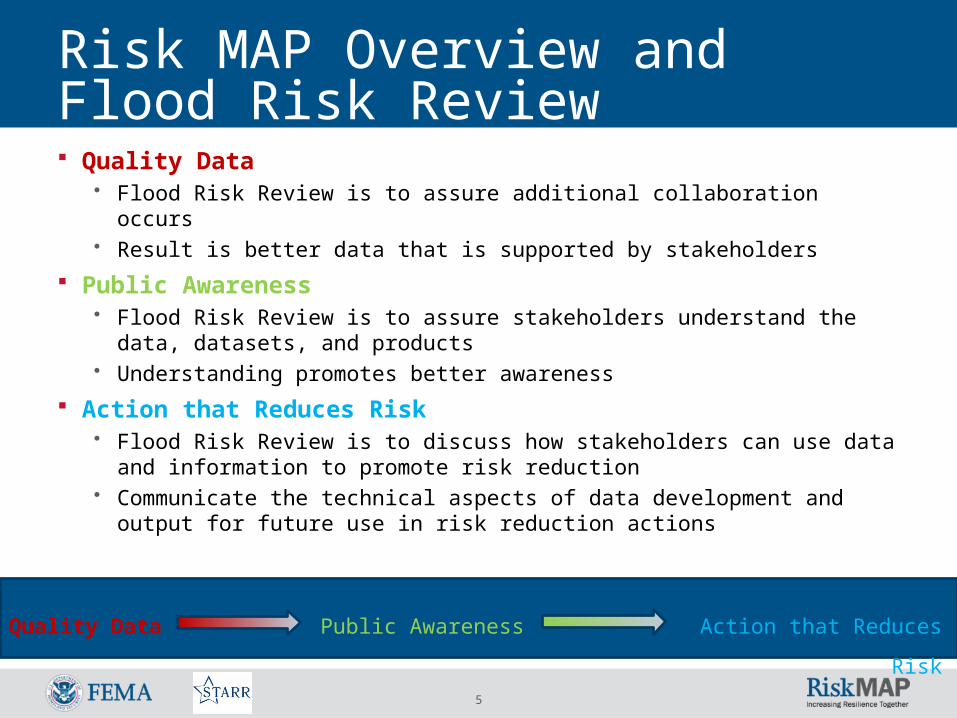
Risk MAP Overview and Flood Risk Review Quality Data
• Flood Risk Review is to assure additional collaboration occurs• Result is better data that is supported by stakeholders
Public Awareness • Flood Risk Review is to assure stakeholders understand the data, datasets, and
products• Understanding promotes better awareness
Action that Reduces Risk• Flood Risk Review is to discuss how stakeholders can use data and information to
promote risk reduction• Communicate the technical aspects of data development and output for future use
in risk reduction actions
Quality Data Public Awareness Action that Reduces Risk
6
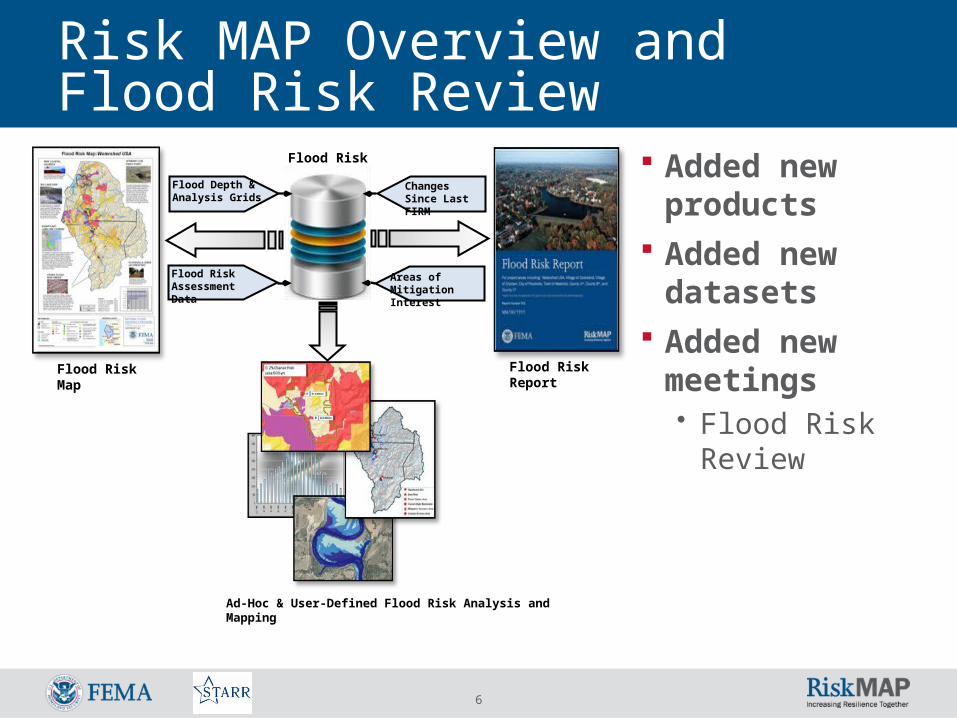
Risk MAP Overview and Flood Risk Review
Added new products
Added new datasets
Added new meetings • Flood Risk
Review
Flood Risk Database
Flood Risk Map Flood Risk Report
Ad-Hoc & User-Defined Flood Risk Analysis and Mapping
Flood Depth & Analysis Grids
Flood Risk Assessment Data
Areas of Mitigation Interest
Changes Since Last FIRM

7
Risk MAP Timeline R
isk
MA
P3
- 5
years
GD E• FBA
Resilience Meeting Review
Potential actions to incorporate into mitigation plans
Preliminary FIRM Issuance
FIRM Effective
Consultation Coordination Officer (CCO) Meeting/ Open House
Items Presented: FIRM (Regulatory) Final Risk MAP Products
(Flood Risk Map, Report, & Data Sets)
Optional Flood Risk Review Meeting
Items Presented: Risk MAP Products (Flood Risk
Map, Report, & Data Sets)
Discovery Meeting
Items Presented: Updated
Discovery Map Draft Project
Plan Draft Project
Charter
C F
Changes Since Last Map & Impacts
Planning Execution
A. Planning & Budgeting (3 Mos.)
B. Discovery (2-4 Mos.)
C. Data Development & Sharing (9-15
Mos.)
D. Risk Awareness & Mitigation Outreach (1-3 Mos.)
E. Proposed NFIP Map Changes & Impacts (1-3 Mos.)
F. Preliminary NFIP Map Release & Mitigation Planning (1-3 Mos.)
G. Due Process & Path Forward (9-15 Mos.)

8
Flood Risk Review Meeting Meeting Objectives
• Quality Data• Public Awareness• Action that Reduces Risk
Quality Data Public Awareness Action that Reduces Risk

9
Flood Risk Review Meeting – Quality Data History of floodplain mapping and previous
projects Present Risk MAP products to technical
stakeholders• Discuss input and output engineering data• Illustrate best available and most recent data• Confirm whether information is accurate• Obtain additional information about new study areas
Quality Data Public Awareness Action that Reduces Risk

10
Flood Risk Review Meeting – Public Awareness Non-regulatory products and datasets Review and discuss the mapping project data
development methods and workmaps• Engineering assumptions
Involve stakeholders to spread message• State NFIP Coordinator and SHMO• Federal and State Agencies• Local Community Officials, FPAs, Planners, EMA Officials, etc
Additional Collaboration
Quality Data Public Awareness Action that Reduces Risk
11
Flood Risk Review Meeting – Action that Reduces Risk Communicating non-regulatory products and
datasets Using non-regulatory products and datasets
• Using Risk MAP provided information to enhance local data and vice versa
Products used for making decisions to reduce flood risk
Benefits of and resources for local communication about risk to residents
Quality Data Public Awareness Action that Reduces Risk

12
Butler County, OH Meeting Topics History of floodplain mapping in area
Physical Map Revisions (PMRs) and levees
Data development
Non-regulatory products and datasets
Use of non-regulatory products

13
Butler County – Quality Data History of Flood Studies
• Original studies performed in 1980’s and early 1990’s• Map Modernization project created digital countywide product and
incorporated new studies and LOMR’s for several streams Effective in 2010
• “Natural Hazard Mitigation Plan” developed in 2011 by County EMA
• Several communities had long-standing concerns about the accuracy of the floodplain mapping
Quality Data Public Awareness Action that Reduces Risk

14
Butler County – Quality Data Physical Map Revision Project (PMR) developed data for a
mapping update:• Scoping Meeting held on December 21, 2009• 100 miles of updated detailed studies • 11 miles of new limited detailed studies• 31 miles of updated approximate studies – replaces all effective Zone A’s• FIS report and 93 FIRM panel revisions
Levee Mapping in Hamilton and Middletown• Levee accreditation process is pending
Quality Data Public Awareness Action that Reduces Risk

15
Butler County – Quality Data Hydrology - Previous studies
• Mostly ODNR regression equations (Bulletins No. 32, 43 and 45)• HEC-1 Rainfall/Runoff Model
East Fork Mill Creek, Gregory Creek, Millers Creek, Shaker Creek
• Gage Analysis Great Miami River – 67 years of record
Hydrology - New studies• USGS Regression equations from 2006• HEC-HMS Rainfall/Runoff Model
Considers land use and regional detention facilities in analysis Bull Run/Collins Creek, East Branch Pleasant Run, East Fork Mill Creek, Four Mile Creek, Gregory Creek,
High School Tributary, Mill Creek, Millers Creek, Shaker Creek, Tributary to East Fork Mill Creek, Tributary to Pleasant Run Branch No. 4, Two Mile Creek
• Gage Analysis Great Miami River – 86 years of record
Quality Data Public Awareness Action that Reduces Risk
16
Butler County – Quality Data Hydraulics - Previous studies
• Mostly HEC-2 hydraulic model software• Field survey data from the time of study
Hydraulics - New studies• All studies used HEC-RAS hydraulic model software
Unsteady Flow modeling for Millers and Shaker Creek
• Stream channel and floodplain geometry from field survey data and 2008 OGRIP data – 2.5 foot DEM (4-foot contours)
• New Water Surface Elevation profiles calculated Detailed and Limited Detailed Studies published in FIS Approximate studies profiles viewable in HEC-RAS format
• New Floodway Analyses - Detailed Studies only• Incorporated existing bridges and culverts• Floodplains delineated using up-to-date topographic data – 2008 OGRIP
Quality Data Public Awareness Action that Reduces Risk

17
Butler County – Public Awareness Review of the Flood Risk Dataset and Products
Flood Risk Datasets• Changes Since Last FIRM (CSLF)• Depth Grids• Study Data
Flood Risk Products• Flood Risk Database• Flood Risk Report• Flood Risk Map
Flood Risk MapFlood RiskDatabase
Flood Risk Report
CSLF Depth Grid
Quality Data Public Awareness Action that Reduces Risk

18
Depth Grids
Butler County – Public Awareness
Quality Data Public Awareness Action that Reduces Risk
Show flood inundation as a function of an event’s magnitude or severity
Show that flood risk varies within the floodplain
Demonstrate the risks associated with different flood depths.

19
Changes Since Last FIRM
Butler County – Public Awareness
Identify areas and types of flood zone change:
• Compares current effective (previous) with proposed (new) flood hazard mapping. (all inputs must be digital)
• Flood zone changes are categorized and quantified
Offers transparency and answers to:• Where have my flood hazards increased
or decreased?• Why have my flood hazards increased or
decreased?• Which communities are subject to new
base flood elevations (BFEs) or ordinance adjustments?
Provide study/reach level rationale for changes including:
• Methodology and assumptions• Changes of model inputs or parameters

20
Contributing Engineering Factors (CEF)
Butler County – Public Awareness
Quality Data Public Awareness Action that Reduces Risk

21
Butler County – Action that Reduces Risk Discussion of
Communicating Risk• Benefits of sharing flood risk
information• Other Resources• Emphasized using the data
to communicate risk and impact mitigation, not just evaluate insurance
Community Awareness
CSLF
New Study Data
Flood Risk
Products
Citizen engagement, community
commitment, and mitigation action
22
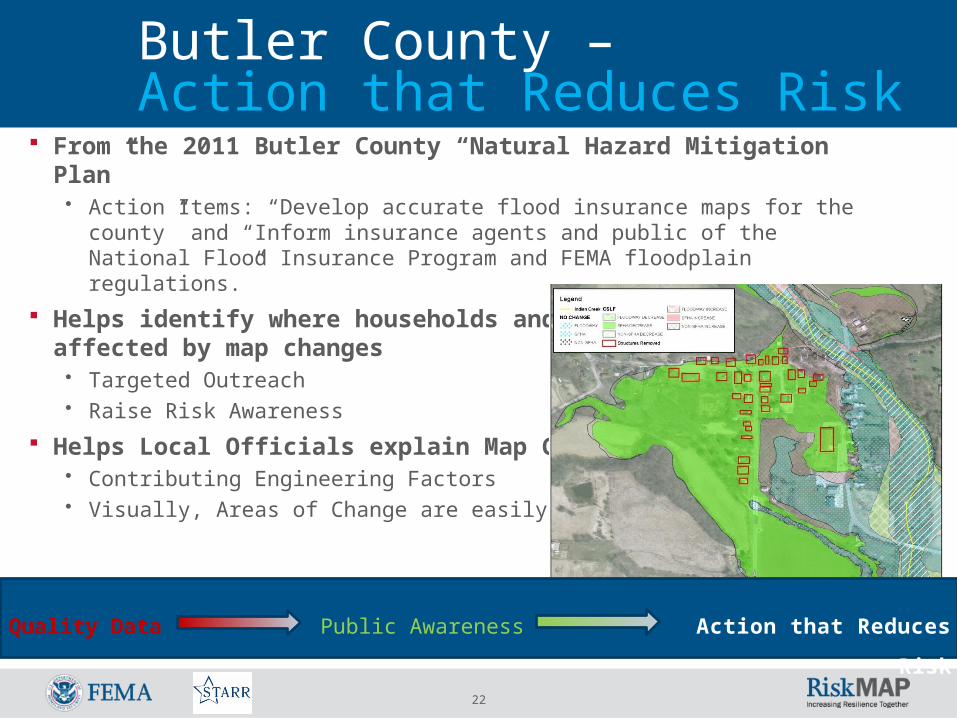
Butler County – Action that Reduces Risk
From the 2011 Butler County “Natural Hazard Mitigation Plan”• Action Items: “Develop accurate flood insurance maps for the county” and “Inform
insurance agents and public of the National Flood Insurance Program and FEMA floodplain regulations.”
Helps identify where households and businesses are affected by map changes• Targeted Outreach• Raise Risk Awareness
Helps Local Officials explain Map Changes• Contributing Engineering Factors• Visually, Areas of Change are easily recognized
Quality Data Public Awareness Action that Reduces Risk
23
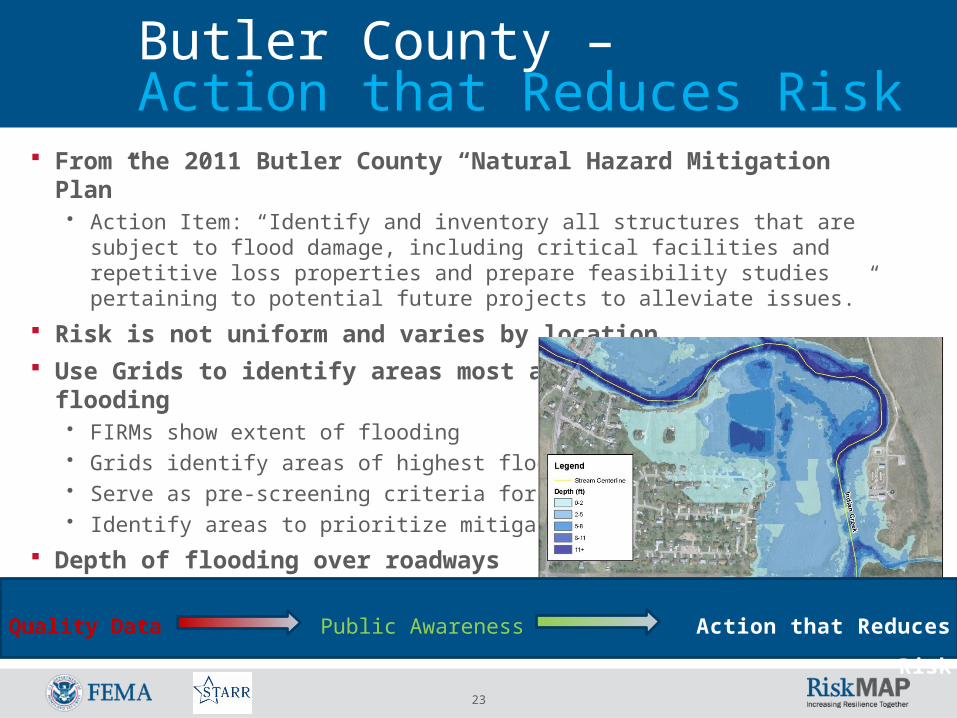
Butler County – Action that Reduces Risk
From the 2011 Butler County “Natural Hazard Mitigation Plan”• Action Item: “Identify and inventory all structures that are subject to flood damage,
including critical facilities and repetitive loss properties and prepare feasibility studies pertaining to potential future projects to alleviate issues.”
Risk is not uniform and varies by location Use Grids to identify areas most at risk from severe flooding
• FIRMs show extent of flooding• Grids identify areas of highest flood risk• Serve as pre-screening criteria for mitigation• Identify areas to prioritize mitigation projects
Depth of flooding over roadways
Quality Data Public Awareness Action that Reduces Risk

24
Opportunities for Future Meetings Encourage Active Participation by
Stakeholders Multiple Breakout Sessions instead of 1 at the
end Survey Forms or Worksheets
Maintain Focus on Risk – not just Flood Insurance implications of the new technical data

25
Successes Stakeholders were interested in the
technical / engineering focus
Tying the Flood Risk Products to the County Mitigation Plan was well-received
Flood Risk Products for use in Emergency Mgmt was well-received

26
Mike Hanke – FEMA Region [email protected]
Nathan Beach, PE, CFM – [email protected]
questions and answers